The driving force of the refractory industry · Building a global refractory leader with a...
29
RHI Magnesita H1 2018 The driving force of the refractory industry H1 2018 Half Year Results August 2018
Transcript of The driving force of the refractory industry · Building a global refractory leader with a...

RHI Magnesita H1 2018
The driving force of the refractory industry
H1 2018 Half Year Results August 2018

RHI Magnesita H1 2018 2
Disclaimer
Financial information contained herein, as
well as other operational information, were
not audited by independent auditors and
may include forward-looking statements and
reflects the current views and perspectives
of the management on the evolution of
macro-economic environment, conditions of
the mining and refractories industries,
company performance and financial results.
Any statements, projections, expectations,
estimates and plans contained in this
document that do not describe historical
facts, and the factors or trends affecting
financial condition, liquidity or results of
operations, are forward-looking statements
and involve several risks and uncertainties.
This presentation should not be construed
as legal, tax, investment or other advice.
This presentation does not constitute an
offer, or invitation, or solicitation of an offer,
to subscribe for or purchase any securities,
and neither any part of this presentation nor
any information or statement contained
herein shall form the basis of or be relied
upon in connection with any contract or
commitment whatsoever. Under no
circumstances, neither the Company nor its
subsidiaries, directors, officers, agents or
employees be liable to third parties
(including investors) for any investment
decision based on information and
statements in this presentation, or for any
damages resulting therefrom, corresponding
or specific.
The information presented or contained in
this presentation is current as of the date
hereof and is subject to change without
notice. RHI Magnesita has no obligation to
update it or revise it in light of new
information and / or in face of future events,
safeguard the current regulations which we
are submitted to. This presentation and its
contents are proprietary information of the
Company and may not be reproduced or
circulated, partially or completely, without the
prior written consent of the Company.

RHI Magnesita H1 2018 3
Highlights
Strategy and operational review
Financial review
Summary and outlook
Q&A
1
2
3
4
5
Agenda

RHI Magnesita H1 2018
Highlights

RHI Magnesita H1 2018 5
H1 2018 financial highlights
Highlights
14.5% 490bps1
H1 2018 adjusted EBITA margin2
c.€1.5bn 25%1
H1 2018 revenue
€218m 88%1
H1 2018 adjusted EBITA
1.6x 0.3x3
Net Debt / EBITDA
21.4% 80bps Working capital intensity
1 Represents the change between H1 2017 pro forma, at constant currency and H1 2018. The H1 2017 figures are adjusted pro forma results prepared on a constant currency basis, as if the
combined Group had already existed since 1 January 2017 and before the impact of items such as: divestments, restructuring expenses, merger-related adjustments and non-merger related
other income and expenses, which are generally non-recurring. H1 2018 figures are on an adjusted basis and exclude other income and expenses 2 Includes update of the PPA in Q2 as per Note 5 of the financial statements 3 Represents the change in net debt to LTM EBITDA between 31 December 2017 and 30 June 2018
RHI Magnesita H1 2018 6
Highlights
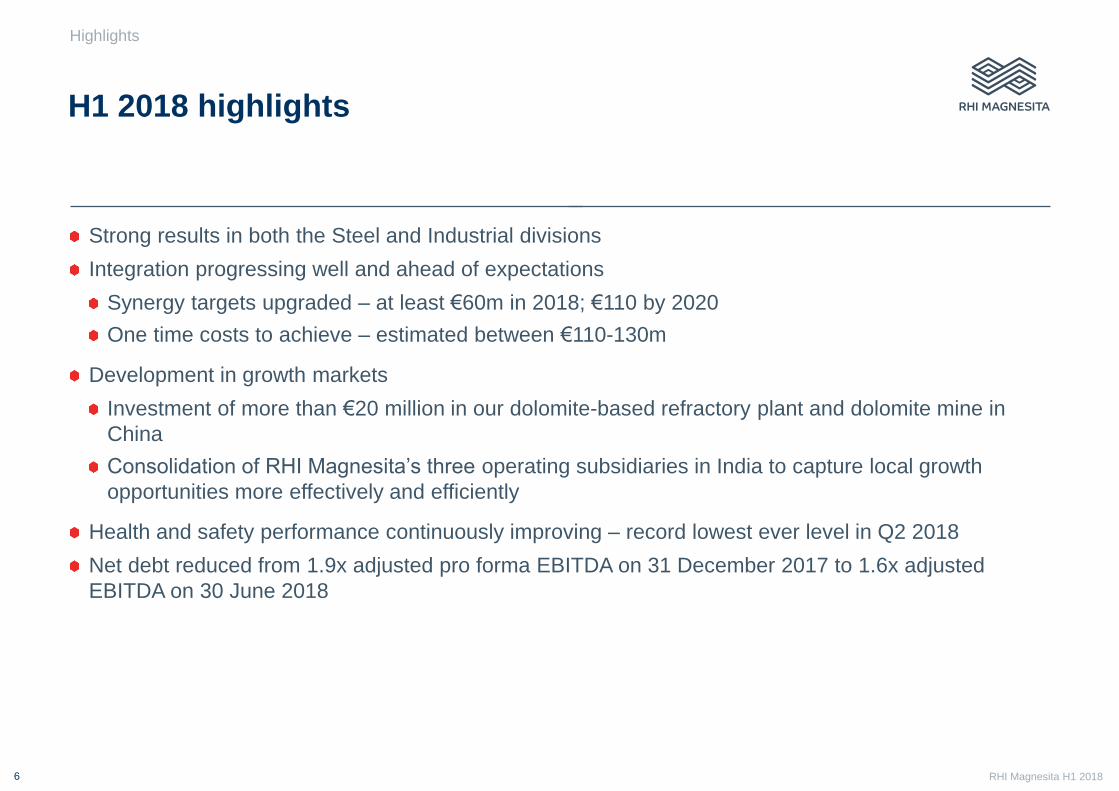
H1 2018 highlights
Strong results in both the Steel and Industrial divisions
Integration progressing well and ahead of expectations
Synergy targets upgraded – at least €60m in 2018; €110 by 2020
One time costs to achieve – estimated between €110-130m
Development in growth markets
Investment of more than €20 million in our dolomite-based refractory plant and dolomite mine in
China
Consolidation of RHI Magnesita’s three operating subsidiaries in India to capture local growth
opportunities more effectively and efficiently
Health and safety performance continuously improving – record lowest ever level in Q2 2018
Net debt reduced from 1.9x adjusted pro forma EBITDA on 31 December 2017 to 1.6x adjusted
EBITDA on 30 June 2018

RHI Magnesita H1 2018
Strategy and operational review

RHI Magnesita H1 2018 8
Increased synergy potential to be realised by 2020
€110m
Other
Procurement
SG&A
2018
Production
network & SCM
Cash restructuring costs of €110-130m
€60m+
⬢ At least €60m synergies in the 2018 P&L
and €110m in synergies to be achieved
by 2020
⬢ Expected total cash restructuring costs
are projected to be €110-130m, with
€75m of cash outflows disbursed
during 2018
⬢ Interest expenses reduced by at least
€10m in 2018 and €20m in 2019 after
re-financing completed in August 2018
⬢ High volatility in global raw material
markets pose additional risks and
uncertainty, but also further upsides
⬢ Integration team is working on additional
fronts, especially in G&A and the
production network, which may lead to
additional savings
Strategy and operational review
2020
RHI Magnesita H1 2018 9
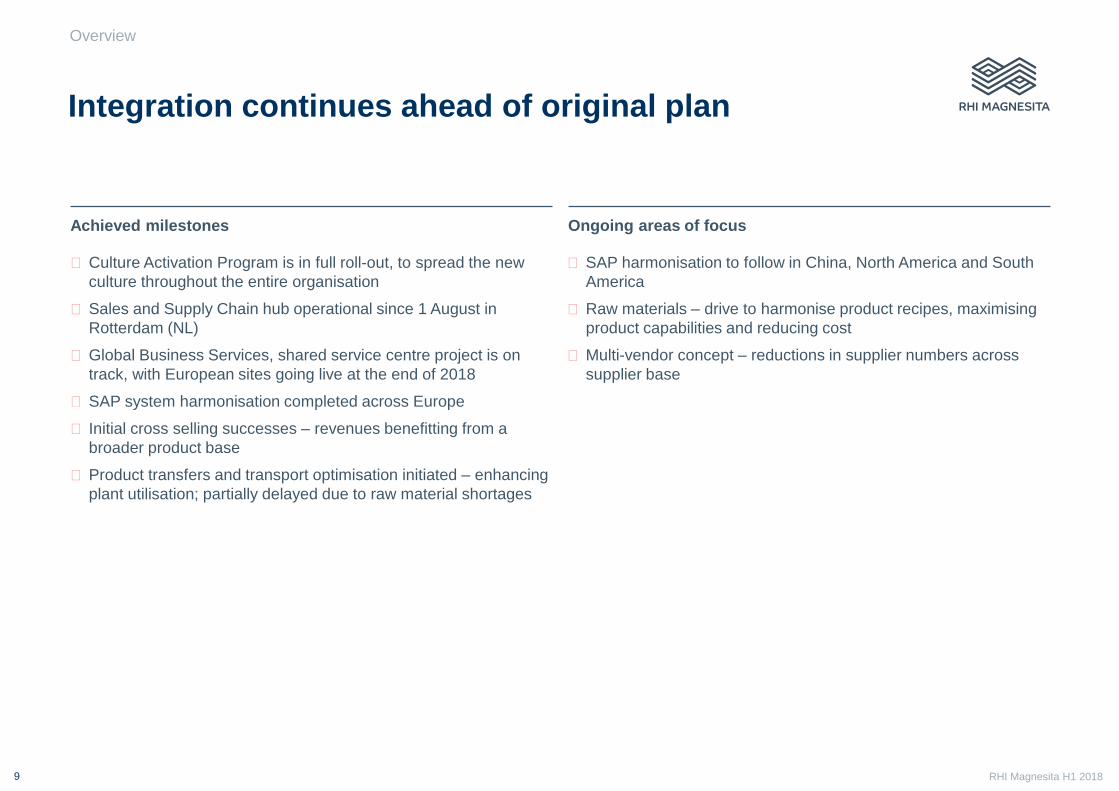
Overview
Achieved milestones
Integration continues ahead of original plan
Ongoing areas of focus
⬢ Culture Activation Program is in full roll-out, to spread the new
culture throughout the entire organisation
⬢ Sales and Supply Chain hub operational since 1 August in
Rotterdam (NL)
⬢ Global Business Services, shared service centre project is on
track, with European sites going live at the end of 2018
⬢ SAP system harmonisation completed across Europe
⬢ Initial cross selling successes – revenues benefitting from a
broader product base
⬢ Product transfers and transport optimisation initiated – enhancing
plant utilisation; partially delayed due to raw material shortages
⬢ SAP harmonisation to follow in China, North America and South
America
⬢ Raw materials – drive to harmonise product recipes, maximising
product capabilities and reducing cost
⬢ Multi-vendor concept – reductions in supplier numbers across
supplier base

RHI Magnesita H1 2018 10
Building a global refractory leader with a differentiated customer proposition based on technology and cost competitiveness
Strategy and operational review
Markets Worldwide presence with strong
local organisations and solid market
positions in all major markets
Portfolio Comprehensive refractory product
portfolio including basic, non-basic,
functional products and services in
high performance segments
Technology Top solution provider in the
refractory industry with an extensive
portfolio based on innovative
technologies and digitalisation
Competitiveness Cost competitive and safe
production network supported
by lowest cost G&A services
People Hire, retain and motivate talent and
nurture a meritocratic, performance-
driven, client-focused friendly
culture

RHI Magnesita H1 2018 11
High market share in Europe and Americas with opportunities to occupy ‘white spaces’ in India, China and CIS
€1,000m €0m
China
RHI Magnesita adjusted pro forma revenue 2017 (€m)
RHI Magnesita
Market Share
HIGH
LOW
Bubble size equivalent
to 60M tonnes of steel
RHI Magnesita revenue by region vs market size
CIS Other
Asia
MEA
India
South America
North
America
Europe
40m tonnes
100m tonnes
800m tonnes
Steel
Production
Strategy and operational review
RHI Magnesita H1 2018
Future growth markets: China Investment to increase raw materials and production
Strategy and operational review
12
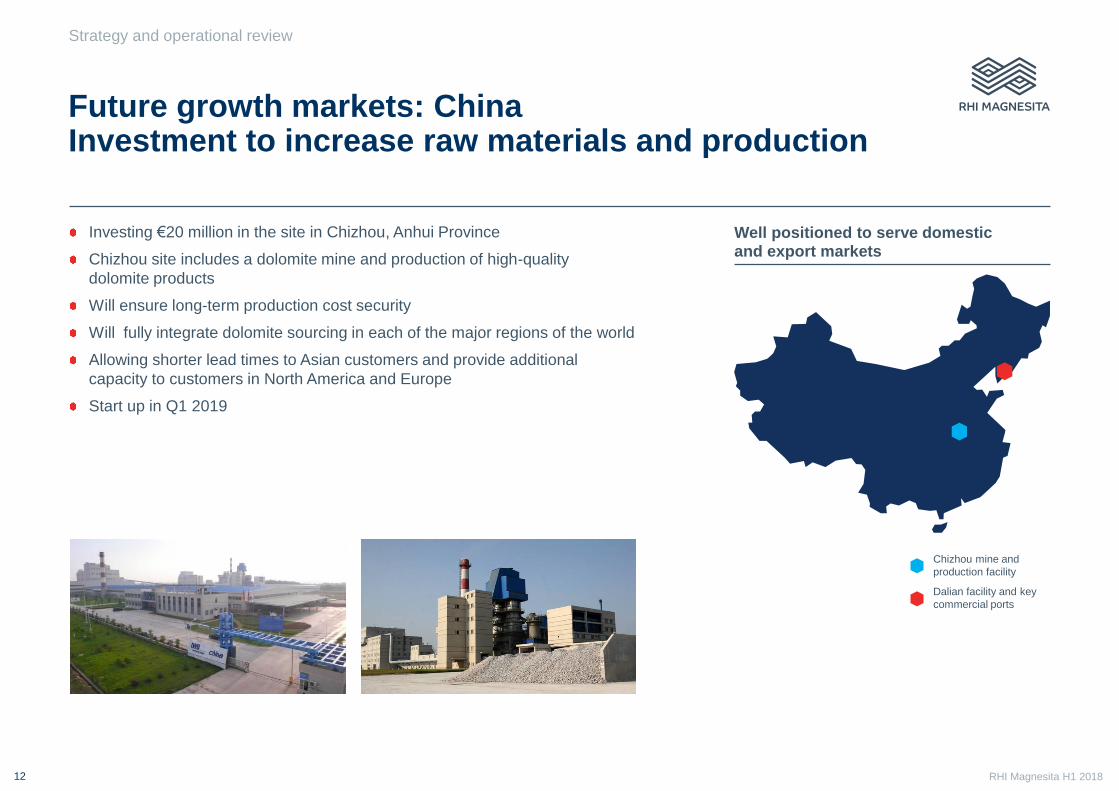
Investing €20 million in the site in Chizhou, Anhui Province
Chizhou site includes a dolomite mine and production of high-quality
dolomite products
Will ensure long-term production cost security
Will fully integrate dolomite sourcing in each of the major regions of the world
Allowing shorter lead times to Asian customers and provide additional
capacity to customers in North America and Europe
Start up in Q1 2019
Chizhou mine and
production facility
Dalian facility and key
commercial ports
Well positioned to serve domestic and export markets
RHI Magnesita H1 2018 13
Strategy and operational review
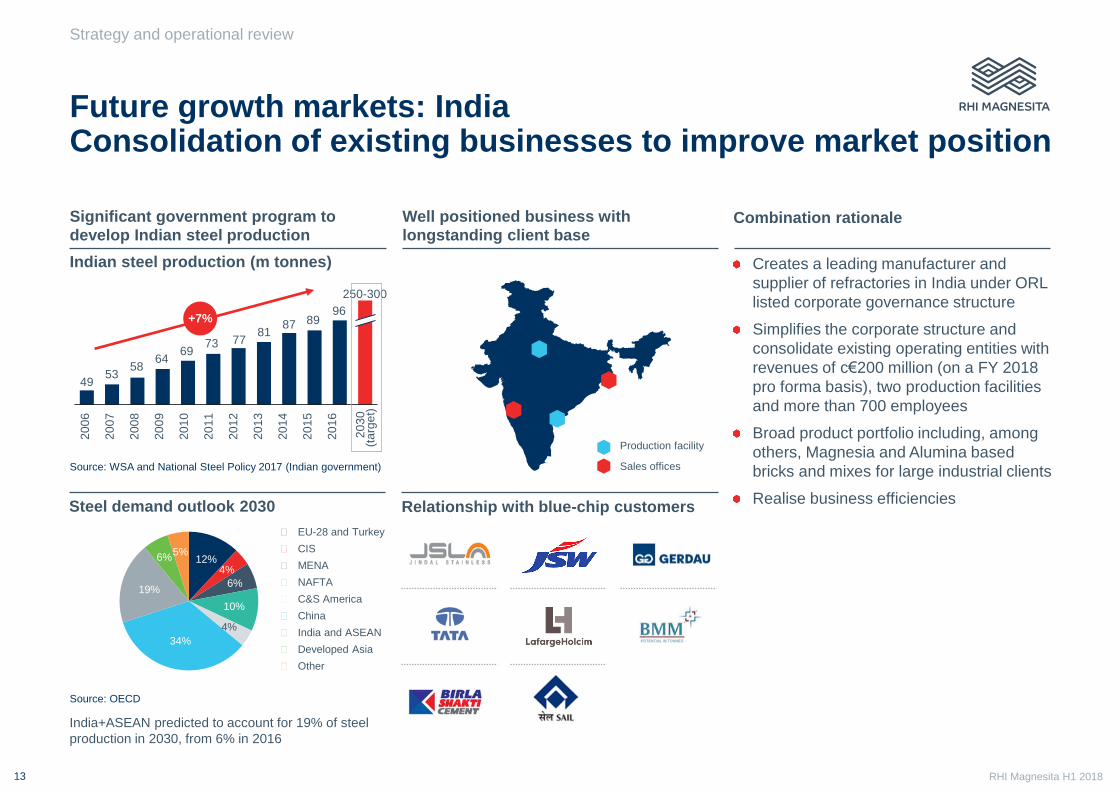
Indian steel production (m tonnes)
Steel demand outlook 2030
58
20
07
53
20
06
49
20
09
73
20
14
+7%
20
13
20
15
81 2
01
6
20
08
20
11
64
250-300
77
20
30
(t
arg
et)
89 87 96
20
12
20
10
69
5%
4% 6% 12%
10%
34%
4%
19% 6%
Source: OECD
Source: WSA and National Steel Policy 2017 (Indian government)
India+ASEAN predicted to account for 19% of steel
production in 2030, from 6% in 2016
⬢ EU-28 and Turkey
⬢ CIS
⬢ MENA
⬢ NAFTA
⬢ C&S America
⬢ China
⬢ India and ASEAN
⬢ Developed Asia
⬢ Other
Future growth markets: India Consolidation of existing businesses to improve market position
Significant government program to develop Indian steel production
Production facility
Sales offices
Relationship with blue-chip customers
Well positioned business with longstanding client base
Creates a leading manufacturer and
supplier of refractories in India under ORL
listed corporate governance structure
Simplifies the corporate structure and
consolidate existing operating entities with
revenues of c€200 million (on a FY 2018
pro forma basis), two production facilities
and more than 700 employees
Broad product portfolio including, among
others, Magnesia and Alumina based
bricks and mixes for large industrial clients
Realise business efficiencies
Combination rationale

RHI Magnesita H1 2018
Financial results

RHI Magnesita H1 2018 15
H1 2018 results
Financial results
Revenue (€m)1
EBITA (€m)1
1,259 1,369
Strong revenue performance driven primarily by
price increases and robust customer demand
Price increases more than offsetting higher raw
material costs
Margins continued to benefit from:
High level of raw material vertical integration
Integration synergies
248 51
H1 2017 Steel division Industrial
division
H1 2018
1,210
1,508
+25%
92 18
116
EBITA H1
2017
Industrial
division gross
profit
218
Steel division
gross profit
-8
SG&A EBITA H1
2018
+88%
1 Represents the change between H1 2017 pro forma, at constant currency and H1 2018. The H1 2017 figures are adjusted pro forma results prepared on a constant currency basis, as if the
combined Group had already existed since 1 January 2017 and before the impact of items such as: divestments, restructuring expenses, merger-related adjustments and non-merger related
other income and expenses, which are generally non-recurring. H1 2018 figures are on an adjusted basis and exclude other income and expenses
RHI Magnesita H1 2018
Steel division
Financial results
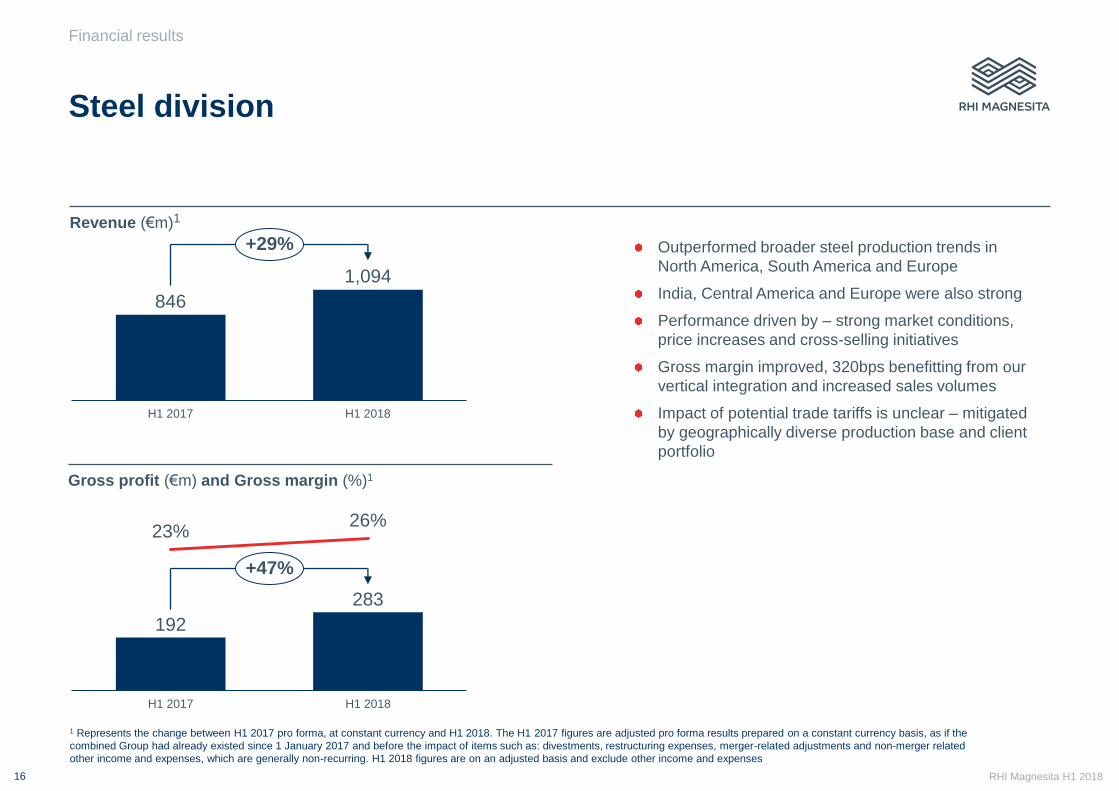
Outperformed broader steel production trends in
North America, South America and Europe
India, Central America and Europe were also strong
Performance driven by – strong market conditions,
price increases and cross-selling initiatives
Gross margin improved, 320bps benefitting from our
vertical integration and increased sales volumes
Impact of potential trade tariffs is unclear – mitigated
by geographically diverse production base and client
portfolio
Revenue (€m)1
16
846
1,094
H1 2017 H1 2018
+29%
192
283
23% 26%
H1 2017 H1 2018
+47%
Gross profit (€m) and Gross margin (%)1
1 Represents the change between H1 2017 pro forma, at constant currency and H1 2018. The H1 2017 figures are adjusted pro forma results prepared on a constant currency basis, as if the
combined Group had already existed since 1 January 2017 and before the impact of items such as: divestments, restructuring expenses, merger-related adjustments and non-merger related
other income and expenses, which are generally non-recurring. H1 2018 figures are on an adjusted basis and exclude other income and expenses
RHI Magnesita H1 2018
Industrials division
Financial results
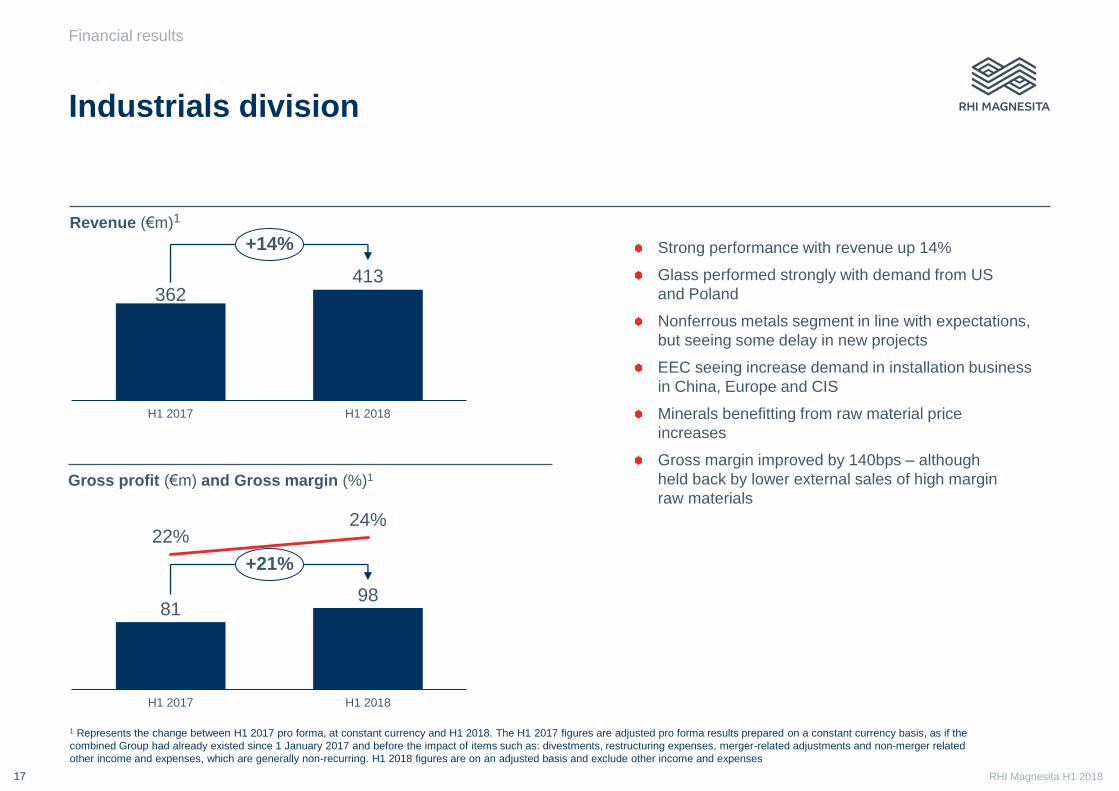
Strong performance with revenue up 14%
Glass performed strongly with demand from US
and Poland
Nonferrous metals segment in line with expectations,
but seeing some delay in new projects
EEC seeing increase demand in installation business
in China, Europe and CIS
Minerals benefitting from raw material price
increases
Gross margin improved by 140bps – although
held back by lower external sales of high margin
raw materials
17
362 413
H1 2017 H1 2018
+14%
81 98
22%
H1 2017
24%
H1 2018
+21%
Revenue (€m)1
Gross profit (€m) and Gross margin (%)1
1 Represents the change between H1 2017 pro forma, at constant currency and H1 2018. The H1 2017 figures are adjusted pro forma results prepared on a constant currency basis, as if the
combined Group had already existed since 1 January 2017 and before the impact of items such as: divestments, restructuring expenses, merger-related adjustments and non-merger related
other income and expenses, which are generally non-recurring. H1 2018 figures are on an adjusted basis and exclude other income and expenses

RHI Magnesita H1 2018
Cash flow overview
Financial results
Operating cash flow driven by increase in adjusted EBITA, offset by an additional €85 million working capital
Whilst working capital requirements increased in absolute amounts, intensity improved to 21.4% (from 22.2%)
Net interest costs of €35 million will decrease considerably in H2 2018, after the redemption of the Perpetual Bond
Restructuring and transaction cash costs amounted to €49 million in H1 2018
18
218
136
17
53
-85
Adjusted
EBITA
Changes in
other assets
and liabilities
Working
capital
Capex
-15
-35
Depreciation Operating
cash flow
-35
Income tax
-35
Net interest
expense
-49
Restructuring
and transaction
cash costs
Free cash
flow

RHI Magnesita H1 2018
Net debt reduced further in H1 2018
Financial results
Our financial position continues to strengthen, and our deleveraging profile is reinforced by the improving profit,
synergies and interest expense reduction
Net debt reduced from 1.9x adjusted pro forma EBITDA on 31 December 2017 to 1.6x adjusted EBITDA on 30 June 2018
Despite one-off demand on working capital and FX effects on USD liabilities
19
H1 2018 H2 2017
Leverage ratio Net debt LTM adjusted EBITDA
17
11 19
Net debt at
December 17
Free cash flow Dividends
received
FX and
others
Net debt at
June 2018
751 741
Net debt reconciliation (€m)
1.6x
1.9x
Net debt to LTM adjusted EBITDA
751 741
389 458

RHI Magnesita H1 2018
Capital structure
Financial Results
On 3 August 2018 the Company successfully raised a new
unsecured US$600 million 5-year term loan and multicurrency
revolving
credit facility
Proceeds of the new facility will be used to redeem the entire
amount of the outstanding Magnesita Perpetual Bonds on
20 August 2018 and prepay other short-term facilities
Solid credit profile and commitment to de-leveraging the current business
20
409
215
115 121 73
499
128
Cash 2018 2019 2020 2021 2022+ Perpetual
Capitalisation Table € millions
Schuldscheindarlehen 221
OeKB term loan 306
Perpetual bond 128
Other loans & facilities 496
Total gross indebtedness 1,151
Cash, equivalents & marketable securities 409
Net Debt 741
Amortisation schedule (€ millions, as of 30 June 2018)

RHI Magnesita H1 2018
Summary and outlook
RHI Magnesita H1 2018
Summary and outlook
Summary and outlook
Strong results in H1 2018, driven by continued strong demand from our end markets and price
increases
Our integration plans continue to progress ahead of original expectations and will deliver €110 million
synergies in 2020 and beyond
Growth rates achieved in H1 2018 were higher than we anticipate for the full year, given the strong
business performance in H2 2017
In H2 2018, we expect to continue to benefit from strong pricing, additional merger synergies and
network optimisation
Management believes raw material prices will remain at current elevated levels during H2 2018
Expectations for the full year operating results remain unchanged
22
RHI Magnesita H1 2018
Compelling investment case
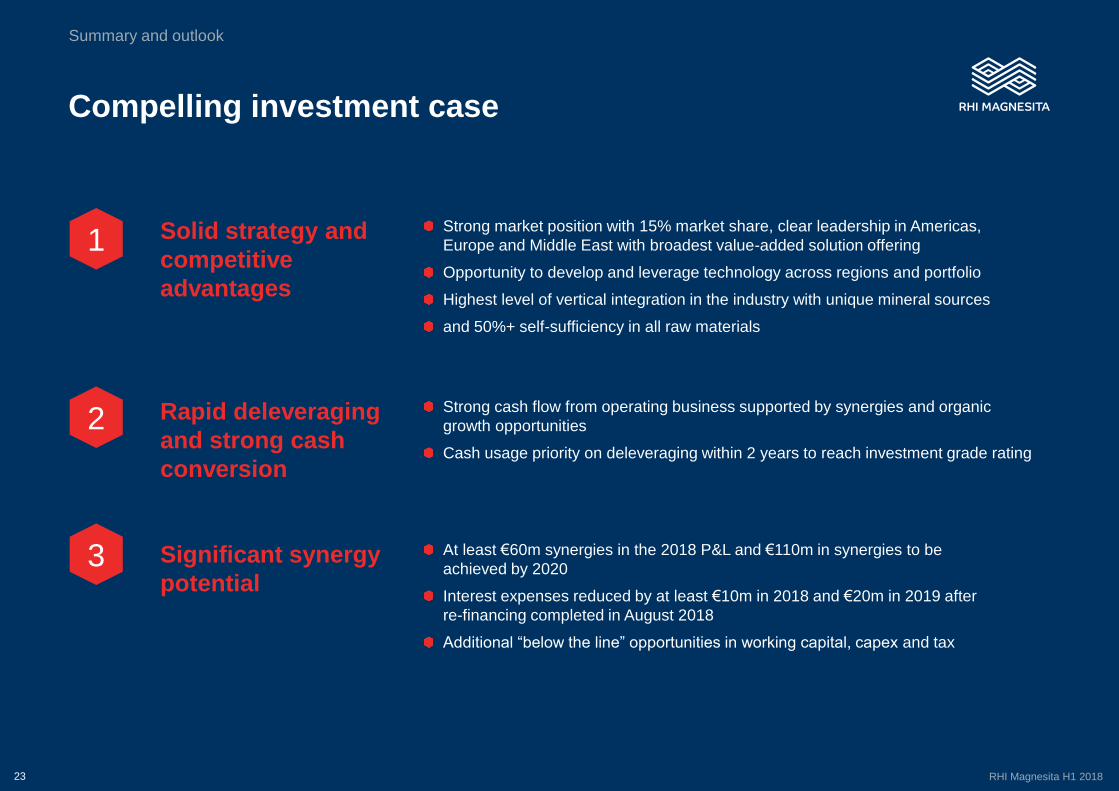
Solid strategy and
competitive
advantages
Strong market position with 15% market share, clear leadership in Americas,
Europe and Middle East with broadest value-added solution offering
Opportunity to develop and leverage technology across regions and portfolio
Highest level of vertical integration in the industry with unique mineral sources
and 50%+ self-sufficiency in all raw materials
Rapid deleveraging
and strong cash
conversion
Strong cash flow from operating business supported by synergies and organic
growth opportunities
Cash usage priority on deleveraging within 2 years to reach investment grade rating
Significant synergy
potential
At least €60m synergies in the 2018 P&L and €110m in synergies to be
achieved by 2020
Interest expenses reduced by at least €10m in 2018 and €20m in 2019 after
re-financing completed in August 2018
Additional “below the line” opportunities in working capital, capex and tax
1
2
3
Summary and outlook
23

RHI Magnesita H1 2018 24
Q&A

RHI Magnesita H1 2018
Appendix
RHI Magnesita H1 2018 26
Integrated offer overview
Appendix
⬢ RHIM launched a tag-along offer to Magnesita’s minority
shareholders on the same terms and conditions as that made to
the Control Group:
⬢ Cash + shares: R$445.6m1 + 5 million shares
⬢ Cash only: (i) R$31.091 or (ii) R$35.56 per Magnesita share
whichever is higher (amounting to a minimum of R$205m)
⬢ RHI Magnesita combined the Mandatory Tag-along Offer with a
delisting tender offer. In these situations, to succeed, at least 2/3
of the remaining shareholders need to agree with the delisting
⬢ Since the cash plus shares option was equivalent to R$66.58 on
31 July 2018, based on RHI Magnesita’s share price and the
exchange rate prevailing on that date, and if conditions remain
the same, RHI Magnesita expects that substantially all of
Magnesita’s minority shareholders will tender their shares and opt
for the cash plus shares consideration.
⬢ The ITO is expected to settle during 2018
1: adjusted by the SELIC (the Brazilian benchmark interest rate) rate as from October 26th, 2017 until the date of the settlement of the auction of the Integrated Tender Offer

RHI Magnesita H1 2018 27
Alternative performance measures
Appendix
In general, APMs are presented externally to meet investors' requirements for further clarity and transparency of the Group's underlying financial performance. The APMs are also used
internally in the management of our business performance, budgeting and forecasting.
APMs are non‐IFRS measures. As a result, APMs allow investors and other readers to review different kinds of revenue, profits and costs and should not be used in isolation. Other
commentary within the preliminary announcement, including the other sections of this Finance Review, as well as the Condensed Consolidated Financial Statements and the
accompanying notes, should be referred to in order to fully appreciate all the factors that affect our business. We strongly encourage readers not to rely on any single financial measure,
but to carefully review our reporting in its entirety.
Adjusted Pro‐forma Results at a Constant Currency (unaudited)
Adjusted pro‐forma results were prepared as if the combined Group had existed since 1 January 2016 and before the impact of items such as: divestments, restructuring expenses,
merger‐related adjustments and other non‐merger related other income and expenses, which are generally non‐recurring. Pro forma results have also been adjusted to reflect the
preliminary purchase price allocation (PPA) related to the acquisition of Magnesita. Given the changes in capital structure arising from the acquisition of Magnesita, the historical interest,
tax and dividend charges are not deemed to be meaningful. As a result, adjusted pro‐forma results have only been provided down to EBITA.
Adjusted EBITDA and EBITA
To provide further transparency and clarity to the ongoing, underlying financial performance of the Group, adjusted EBITDA and EBITA are used. Both measures exclude other income
and expenses, which contains divestments, restructuring expenses, merger‐related adjustments and other non‐merger related other income and expenses, which are generally
non‐recurring.
Operating Cash Flow and Free Cash Flow
We present alternative measures for cash flow to reflect net cash inflow from operating activities before exceptional items. Free cash flow is considered relevant to reflect the cash
performance of business operations after meeting usual obligations of financing and tax. It is therefore a measure that is before all other remaining cash flows, being those related to
exceptional items, acquisitions and disposals, other equity‐related and debt-related funding movements, and foreign exchange impacts on financing and investing activities.
Net Debt
We present an alternative measure to bring together the various funding sources that are included on the Group's Condensed Consolidated Balance Sheet and the accompanying notes.
Net debt is a measure to reflect the net indebtedness of the Group and includes all cash, cash equivalents and marketable securities; and any debt or debt like items, including any
derivatives entered into in order to manage risk exposures on these items.
RHI Magnesita H1 2018
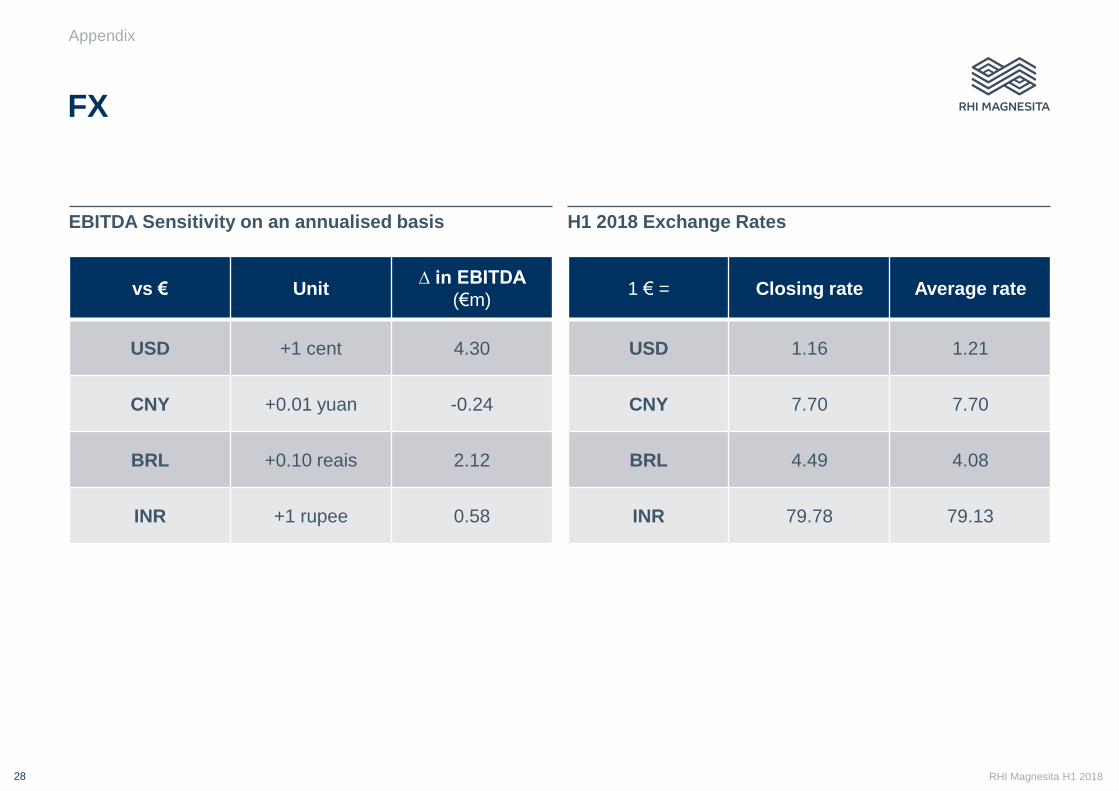
EBITDA Sensitivity on an annualised basis
28
FX
vs € Unit ∆ in EBITDA
(€m)
USD +1 cent 4.30
CNY +0.01 yuan -0.24
BRL +0.10 reais 2.12
INR +1 rupee 0.58
H1 2018 Exchange Rates
1 € = Closing rate Average rate
USD 1.16 1.21
CNY 7.70 7.70
BRL 4.49 4.08
INR 79.78 79.13
Appendix

RHI Magnesita H1 2018
Find out more at rhimagnesita.com