The diurnal cycle of rainfall over New Guinea in ...
15
Atmos. Chem. Phys., 16, 161–175, 2016 www.atmos-chem-phys.net/16/161/2016/ doi:10.5194/acp-16-161-2016 © Author(s) 2016. CC Attribution 3.0 License. The diurnal cycle of rainfall over New Guinea in convection-permitting WRF simulations M. E. E. Hassim 1,a , T. P. Lane 1 , and W. W. Grabowski 2 1 School of Earth Sciences and ARC Centre of Excellence for Climate System Science, The University of Melbourne, Melbourne, Victoria, 3010, Australia 2 National Center for Atmospheric Research, Boulder, Colorado, USA a now at: Centre for Climate Research Singapore, Meteorological Service Singapore, Singapore Correspondence to: M. E. E. Hassim ([email protected]) Received: 25 March 2015 – Published in Atmos. Chem. Phys. Discuss.: 7 July 2015 Revised: 30 October 2015 – Accepted: 7 December 2015 – Published: 18 January 2016 Abstract. In this study, we examine the diurnal cycle of rain- fall over New Guinea using a series of convection-permitting numerical simulations with the Weather Research and Fore- casting (WRF) model. We focus our simulations on a period of suppressed regional-scale conditions (February 2010) dur- ing which local diurnal forcings are maximised. Addition- ally, we focus our study on the occurrence and dynamics of offshore-propagating convective systems that contribute to the observed early-morning rainfall maximum north-east of New Guinea. In general, modelled diurnal precipitation shows good agreement with satellite-observed rainfall, albeit with some timing and intensity differences. The simulations also re- produce the occurrence and variability of overnight convec- tion that propagate offshore as organised squall lines north- east of New Guinea. The occurrence of these offshore sys- tems is largely controlled by background conditions. Days with offshore-propagating convection have more middle tro- pospheric moisture, larger convective available potential en- ergy, and greater low-level moisture convergence. Convec- tion has similar characteristics over the terrain on days with and without offshore propagation. The offshore-propagating convection manifests via a multi-stage evolutionary process. First, scattered convec- tion over land, which is remnant of the daytime maximum, moves towards the coast and becomes reorganised near the region of coastal convergence associated with the land breeze. The convection then moves offshore in the form of a squall line at ∼ 5ms -1 . In addition, cool anomalies associated with gravity waves generated by precipitating land convection propagate offshore at a dry hydrostatic gravity wave speed (of ∼ 15ms -1 ) and act to destabilise the coastal/offshore environment prior to the arrival of the squall line. Although the gravity wave does not appear to initiate the convection or control its propagation, it should contribute to its longevity and maintenance. The results highlight the importance of terrain and coastal effects along with gravity waves in contributing to the diurnal cycle over the Maritime Continent, especially the offshore precipitation maxima adjacent to quasi-linear coastlines. 1 Introduction The diurnal cycle of rainfall is the most fundamental mode of tropical internal variability. Across the Maritime Continent (MC), convective activity is widespread, exhibiting distinct spatial patterns and strong daily contrasts between land and the surrounding seas. Precipitation over land peaks in the af- ternoon to early evening. Conversely, while there is relatively little amplitude in the diurnal cycle of rainfall over the open ocean, secondary rainfall maxima are seen near the coasts of many MC islands (e.g, Kikuchi and Wang, 2008). These offshore rainfall concentrations are most prominent near the land–sea boundaries of Sumatra, Borneo, Java, and New Guinea during pre-dawn hours, where sharp gradients in coastal precipitation frequencies are seen in very high- resolution data derived from the Tropical Rainfall Measur- ing Mission (TRMM) precipitation radar (PR) data set (Bia- sutti et al., 2012). Using high-resolution brightness temper- Published by Copernicus Publications on behalf of the European Geosciences Union.
Transcript of The diurnal cycle of rainfall over New Guinea in ...

Atmos. Chem. Phys., 16, 161–175, 2016
www.atmos-chem-phys.net/16/161/2016/
doi:10.5194/acp-16-161-2016
© Author(s) 2016. CC Attribution 3.0 License.
The diurnal cycle of rainfall over New Guinea in
convection-permitting WRF simulations
M. E. E. Hassim1,a, T. P. Lane1, and W. W. Grabowski2
1School of Earth Sciences and ARC Centre of Excellence for Climate System Science,
The University of Melbourne, Melbourne, Victoria, 3010, Australia2National Center for Atmospheric Research, Boulder, Colorado, USAanow at: Centre for Climate Research Singapore, Meteorological Service Singapore, Singapore
Correspondence to: M. E. E. Hassim ([email protected])
Received: 25 March 2015 – Published in Atmos. Chem. Phys. Discuss.: 7 July 2015
Revised: 30 October 2015 – Accepted: 7 December 2015 – Published: 18 January 2016
Abstract. In this study, we examine the diurnal cycle of rain-
fall over New Guinea using a series of convection-permitting
numerical simulations with the Weather Research and Fore-
casting (WRF) model. We focus our simulations on a period
of suppressed regional-scale conditions (February 2010) dur-
ing which local diurnal forcings are maximised. Addition-
ally, we focus our study on the occurrence and dynamics
of offshore-propagating convective systems that contribute to
the observed early-morning rainfall maximum north-east of
New Guinea.
In general, modelled diurnal precipitation shows good
agreement with satellite-observed rainfall, albeit with some
timing and intensity differences. The simulations also re-
produce the occurrence and variability of overnight convec-
tion that propagate offshore as organised squall lines north-
east of New Guinea. The occurrence of these offshore sys-
tems is largely controlled by background conditions. Days
with offshore-propagating convection have more middle tro-
pospheric moisture, larger convective available potential en-
ergy, and greater low-level moisture convergence. Convec-
tion has similar characteristics over the terrain on days with
and without offshore propagation.
The offshore-propagating convection manifests via
a multi-stage evolutionary process. First, scattered convec-
tion over land, which is remnant of the daytime maximum,
moves towards the coast and becomes reorganised near
the region of coastal convergence associated with the land
breeze. The convection then moves offshore in the form
of a squall line at ∼ 5 ms−1. In addition, cool anomalies
associated with gravity waves generated by precipitating
land convection propagate offshore at a dry hydrostatic
gravity wave speed (of ∼ 15 ms−1) and act to destabilise
the coastal/offshore environment prior to the arrival of the
squall line. Although the gravity wave does not appear to
initiate the convection or control its propagation, it should
contribute to its longevity and maintenance. The results
highlight the importance of terrain and coastal effects along
with gravity waves in contributing to the diurnal cycle over
the Maritime Continent, especially the offshore precipitation
maxima adjacent to quasi-linear coastlines.
1 Introduction
The diurnal cycle of rainfall is the most fundamental mode of
tropical internal variability. Across the Maritime Continent
(MC), convective activity is widespread, exhibiting distinct
spatial patterns and strong daily contrasts between land and
the surrounding seas. Precipitation over land peaks in the af-
ternoon to early evening. Conversely, while there is relatively
little amplitude in the diurnal cycle of rainfall over the open
ocean, secondary rainfall maxima are seen near the coasts of
many MC islands (e.g, Kikuchi and Wang, 2008).
These offshore rainfall concentrations are most prominent
near the land–sea boundaries of Sumatra, Borneo, Java, and
New Guinea during pre-dawn hours, where sharp gradients
in coastal precipitation frequencies are seen in very high-
resolution data derived from the Tropical Rainfall Measur-
ing Mission (TRMM) precipitation radar (PR) data set (Bia-
sutti et al., 2012). Using high-resolution brightness temper-
Published by Copernicus Publications on behalf of the European Geosciences Union.

162 M. E. E. Hassim et al.: Diurnal rainfall in convection-permitting WRF simulations
ature data, Yang and Slingo (2001) noted that diurnal con-
vective variations over the major islands (viz. New Guinea
and Sumatra) spread out coherently into adjacent coastal seas
over a few hundred kilometres. They speculated that sea-
ward propagating disturbances (viz. gravity waves of varying
depths) could be responsible for the signal spreading. How-
ever, the details of processes leading to offshore rainfall were
not explored. More recent studies have since confirmed not
only the night time offshore propagation signal but also an
afternoon inland migration from the coastline due to systems
initiated along the sea breeze front (Mori et al., 2004; Zhou
and Wang, 2006; Kikuchi and Wang, 2008). Both onshore
and offshore rainfall features do vary with large-scale con-
ditions, such as through variations in phase of the Madden–
Julian Oscillation (e.g. see Peatman et al., 2014). However,
they are persistent features nonetheless.
Notably, all the major islands in the Maritime Continent
have significant topography located near the coast. The pres-
ence of steep terrain generates localised circulations in re-
sponse to solar heating – in particular, upslope winds – that,
in turn, initiate convection over the mountains in the early
afternoon (Qian, 2008). As the sea breeze develops and pen-
etrates inland during the afternoon, superposition of the sea
breeze front with upslope flows helps to feed the existing
convection, promoting further development over the moun-
tain slopes (e.g. Zhou and Wang, 2006; Wu et al., 2008;
Barthlott and Kirshbaum, 2013).
However, the processes that lead to nocturnal precipitating
systems over adjacent coastal seas appear to be less straight-
forward. For example, converging land breezes from neigh-
bouring landmasses are proposed for cases of early-morning
convection seen in Van Diemen Gulf north-east of Darwin
(Wapler and Lane, 2012) and over the Java sea (Qian, 2008).
Meanwhile, Fujita et al. (2010) concluded that the night time
rainfall maximum seen in the Strait of Malacca is due to the
interaction between the land breeze and downslope winds
from the mountainous areas of Sumatra and the Malay Penin-
sula. In addition, the regular appearance of nocturnal coastal
convection north-west of Borneo is attributed to surface con-
vergence between the land breeze and the winter monsoonal
flow (Houze et al., 1981) and, more recently, to intense off-
shore surface flows due to convectively induced boundary
layer thermal gradients (Wu et al., 2008). The latter mech-
anism is also invoked to explain the abundance of rainfall
offshore near western Sumatra (Wu et al., 2009). Finally,
Love et al. (2011) demonstrate the importance of offshore-
propagating gravity waves in contributing to the formation
of precipitation offshore. They invoke a combination of the
diurnally forced gravity waves described by Mapes et al.
(2003) and convectively generated (stratiform) cooling as the
source of these waves. Given the variations in spacing and the
complex orientation and topography of the MC islands, it is
plausible that different mechanisms may operate to produce
nocturnal offshore rainfall at different coastal locations in the
Maritime Continent region.
New Guinea is the largest island within the Maritime Con-
tinent. It also has the steepest and highest orography of all the
major MC islands, with peaks exceeding 3000 m (Fig. 1a).
The primary mountain chain forms the island’s “spine” and
runs parallel to the northern coastline, which is quasi-linear
and aligned in a north-west–south-east direction much like
the coast of western Sumatra. A much lower ridge is situ-
ated next to the northern coast, with peaks largely between
250 and 750 m. The topography of New Guinea is therefore
analogous to that of Sumatra in the western MC, except that
Sumatra has higher mountains (≥ 1000 m) next to its western
coast.
In this paper, we examine the diurnal cycle of rainfall
over New Guinea using convection-permitting simulations
with the Weather Research and Forecasting (WRF) model.
One aim of the paper is to examine the dynamics and oc-
currence of propagating convective signals that lead to the
early-morning offshore precipitation maxima. Our focus is
on a 1-month period (February 2010) during the “year of
tropical convection” (YOTC; Moncrieff et al., 2012), which
has suppressed large-scale convective conditions; this period
is chosen in an attempt to isolate the localised island forcing.
The remainder of the paper is organised as follows. The
next section (Sect. 2) describes the model set-up and nu-
merical experiments. Section 3 reports on the convection-
permitting simulations. Analysis between occurrences of off-
shore rainfall propagation and times when it is lacking is dis-
cussed in Sect. 3.2, including the dynamical mechanisms as-
sociated with the convective systems over the sea. Finally,
Sect. 4 provides a summary and concluding remarks.
2 WRF simulations
2.1 Model set-up
Simulations are conducted using version 3.3 of the WRF
Advanced Research Core (WRF-ARW) (Skamarock et al.,
2008) with a one-way nested configuration (Fig. 1). Most
of this study focuses on a two-domain set-up with an outer
domain (d01) that has 540× 420 grid points with a 12 km
grid spacing and a second domain (d02) consisting of 840×
990 grid points and a 4 km grid spacing. The second domain
is centred on the southern parts of New Guinea and covers
a large portion of northern Australia; the domain includes
Darwin, which is used for additional evaluation considered
later. Additional simulations are also conducted with a third
domain (d03) with 1.33 km grid spacing (1830× 2190 grid
points, dashed box in Fig. 1a) that is nested within d02.
All model domains have 80 vertical levels with a model
top of 10 hPa (∼ 30 km in altitude). A 10 km deep Rayleigh-
friction sponge layer is used to minimise the reflection of
upward-propagating gravity waves generated by convection.
A stretched vertical grid is used, with grid spacing between
50 and 300 m in the lowest 4 km, then averaging ∼ 300 m
Atmos. Chem. Phys., 16, 161–175, 2016 www.atmos-chem-phys.net/16/161/2016/

M. E. E. Hassim et al.: Diurnal rainfall in convection-permitting WRF simulations 163
Figure 1. (a) Model domains and orography. The profile shown in
panel (b) represents the mean terrain height (m), as averaged across
the line sections shown in panel (a).
between 4 and 14 km before varying exponentially to 600 m
by 20 km. This set-up ensures reasonably high resolution in
the vertical, although many unresolved turbulent processes
remain. The vertical velocity damping option is also used to
prevent the model from becoming unstable with large ver-
tical velocities over steep terrain. Initial conditions are pro-
vided by the European Centre for Medium-Range Weather
Forecasts interim (ERA-Interim) reanalysis data (Dee et al.,
2011) at 0.75◦× 0.75◦ resolution. Lateral boundary condi-
tions for the outer 12 km domain and sea-surface temper-
atures for all domains are prescribed every 6 h from ERA-
Interim data. The model time steps are 30 s for d01, 10 s for
d02, and 3.3 s for d03.
The simulations utilise various physical parameterisations.
These include the Noah land surface model, the Goddard
scheme for shortwave radiation, the Rapid Radiative Trans-
fer Model for longwave radiation, and the Mellor–Yamada–
Janjic (MYJ) 2.5 level planetary boundary layer (PBL)
scheme. The MYJ PBL scheme is used in conjunction with
the Janjic Eta Monin–Obukhov surface layer scheme. Ra-
diation calls are made every 10 min on both domains. Sub-
grid-scale convection in the 12 km outer domain is parame-
terised by the Kain–Fritsch cumulus scheme. The inner do-
mains (d02 and d03) are considered convection permitting
and moist processes are treated explicitly. Cloud microphys-
ical processes are represented with the WRF Single-Moment
6-Class (WSM6) scheme.
2.2 Description of experiments and data
Unless otherwise noted, the results reported herein are from
five overlapping simulations that are conducted in sequence
to cover the period between 12:00 UTC, 1 February 2010,
and 12:00 UTC, 28 February 2010. These overlapping simu-
lations use d01 and d02 only. Each simulation is performed
separately and then concatenated to constitute the month.
This period was chosen because the eastern MC region expe-
rienced suppressed regional-scale conditions coinciding with
an active Madden–Julian Oscillation (MJO) phase in the Pa-
cific Ocean in early February transitioning to an inactive
MJO in late February (M. Wheeler, personal communica-
tion, 2013); thus local diurnal forcings are maximised and
sub-monthly variability can be seen.
The five simulations span the following time slices:
(1) 12:00 UTC, 1 February–23:00 UTC, 6 February (T1);
(2) 12:00 UTC, 6 February–23:00 UTC, 11 February (T2);
(3) 12:00 UTC, 11 February–23:00 UTC, 16 February (T3);
(4) 12:00 UTC, 16 February–23:00 UTC, 21 February (T4);
and (5) 12:00 UTC, 21 February–12:00 UTC, 28 February
(T5).
Model output is saved hourly but the first 12 h of each
simulation are regarded as spin-up and not used. Results are
analysed for the period 00:00 UTC, 2 February–23:00 UTC,
27 February, and only for the inner 4 km domain. A smooth
contiguous span of model data for the analysis is ensured by
appending consecutive time slices such that the 23:00 UTC,
6 February, data of T1 is followed by 00:00 UTC, 7 Febru-
ary, data of T2, and 23:00 UTC, 11 February, data of T2 is
followed by 00:00 UTC, 12 February, data of T3, etc. Note
the overlap addresses the precipitation spin-up problem that
models generally suffer from and allows model flow fields to
properly adjust to imposed boundary conditions.
The rationale of running separate time slices with re-
initialised conditions as opposed to a single, continuous run
(i.e, “free-running”) for the chosen period is because previ-
ous studies show that the representation of observed events is
sensitive to the initialisation time as simulations with longer
lead times perform poorly (e.g. Wapler et al., 2010, and
Wapler and Lane, 2012). A continuous run is known to pro-
duce the lowest skill (e.g. Lo et al., 2008).
In addition to the above-described overlapping simula-
tions, another simulation is completed with the three (one-
way nested) domains for the purposes of assessing the res-
olution sensitivities. Because of the much higher computa-
tional cost, this set-up was only run for 14 consecutive days
(12:00 UTC, 1 February–12:00 UTC, 15 February), with the
first 12 h excluded from the analysis due to spin-up issues.
This is hereafter referred to as the “free-running” simulation.
A compositing technique is used to evaluate the simulated
diurnal cycle, following the example of May et al. (2012).
Specifically, the mean diurnal cycle is constructed by aver-
aging all values at a particular time of day and the mean day
www.atmos-chem-phys.net/16/161/2016/ Atmos. Chem. Phys., 16, 161–175, 2016

164 M. E. E. Hassim et al.: Diurnal rainfall in convection-permitting WRF simulations
(a) (b)Accumulated [mm] Accumulated [mm]
Figure 2. Accumulated rainfall (mm) for the New Guinea region between 2 and 28 February 2010 from TRMM (a) and the 4 km WRF
simulation (b). Data from WRF have been coarse-grained to match the data resolution of the TRMM 3B42 gridded product.
is constructed by a series of such averages. Such an approach
is also used to analyse the observational data.
Modelled precipitation patterns for New Guinea are as-
sessed with the TRMM 3B42 version 7 gridded rainfall data
set (Huffman et al., 2010). 3B42 data are a blended rainfall
product, derived from a complex combination of TRMM PR
estimates and satellite data obtained from other passive sen-
sors (microwave and infrared). Final estimates are scaled to
match monthly rain gauge values. The merged data product
consists of 3-hourly centred averages and has a spatial res-
olution of 0.25◦× 0.25◦, which makes it suitable to study
diurnal spatial patterns of tropical rainfall. Modelled rainfall
is coarse-grained to the same temporal and spatial resolution
whenever it is compared to TRMM.
Rainfall observations inferred from the Darwin (Gunn
Point) C-band polarimetric radar (CPOL) are also used to
evaluate the model. The rainfall rates are derived from radar
reflectivities using the algorithm described by Bringi et al.
(2001) and calibrated against gauge measurements. The data
are at 2.5 km horizontal resolution within a 150 km radius of
the radar location.
3 Results
3.1 Observed and simulated diurnal features
3.1.1 Spatial distribution
The observed total rainfall over New Guinea for the period
2–28 February is presented in Fig. 2a. Most of the precipita-
tion falls over high terrain with maxima concentrated along
the slopes. Large amounts of rainfall also occur along con-
cave coastal bights. The occurrence of these offshore max-
ima are attributed to the enhanced convergence effect due to
the inward curvature of coastlines (Biasutti et al., 2012). Sub-
stantial rainfall accumulations are also seen near the northern
coast between 139 and 144◦, extending about 200 km off-
shore in the Bismarck Sea. Daily mean rates range from 8 to
12 mmday−1 in that region. These high rainfall rates are con-
centrated along a relatively linear stretch of coastline where
there is no enhanced localised convergence from colliding
land breezes. Interestingly, the location of these rainfall rates
coincides well with the offshore maximum in diurnal bright-
ness temperature difference reported by Liberti et al. (2001)
(their Fig. 4), who documented the life cycle of convective
cloudiness for New Guinea using infrared satellite data. The
physical mechanism responsible for that coastal rainfall max-
imum is discussed in Sect. 3.2.2.
The corresponding accumulated rainfall amounts simu-
lated by WRF at 4 km is shown in Fig. 2b. These have been
coarse-grained both spatially and temporally to match the
TRMM 3B42 data (i.e. a 3-hourly centred average) to facil-
itate proper comparison. WRF captures the observed spatial
distribution of rainfall, albeit with higher modelled intensity
over much of the region. This is most evident over the moun-
tain slopes, where total rainfall amounts and mean daily rates
are more than double those observed by TRMM at some lo-
cations. Less bias is seen for the coastal regions, especially
for our area of interest along the northern coast.
The excessive rainfall over the slopes is partly due to the
horizontal grid spacing, which at 4 km is still too coarse to
resolve individual convective updrafts and gives a smoothed
topography. This results in wide clouds in the simulations
that do not entrain as much. Nonetheless, measurements by
TRMM over steep topography should also be treated with
caution, when considering the model rainfall biases over el-
evated terrain. Recently, Matthews et al. (2013) reported that
TRMM underpredicted rainfall over high-terrain by as much
as 50 % when compared to long-term rain-gauge station data
in the New Guinea highlands. Additional results by Chen
et al. (2013) show similar underestimates of intense rainfall
over high terrain (Hawaii). These studies therefore suggest
that disparity between actual and simulated amounts (at least
over elevated land) may be less than is apparent from Fig. 2.
To evaluate the simulated rainfall further, comparisons are
made between diurnal composites derived from the WRF
free-running simulation, the CPOL radar-derived rainfall,
and TRMM over the 150 km radius area surrounding the
Darwin CPOL radar (Fig. 3). Note these composites are
over a limited number of days due to missing data. The
figure shows that at 4 km resolution (d02) the daily max-
imum rainfall rate from WRF is in good agreement with
Atmos. Chem. Phys., 16, 161–175, 2016 www.atmos-chem-phys.net/16/161/2016/

M. E. E. Hassim et al.: Diurnal rainfall in convection-permitting WRF simulations 165
Local time (h)
Prec
ipita
tion
rate
(mm
/h)
Local time (h)
Prec
ipita
tion
rate
(mm
/h)
Local time (h)
Prec
ipita
tion
rate
(mm
/h)
Figure 3. Comparison of simulated diurnal rainfall at 4 and 1.33 km
resolutions with TRMM and radar-derived precipitation (CPOL)
around Darwin, Australia, area averaged over the entire horizon-
tal coverage (top), over land (middle), and over sea points (bot-
tom) within the radar domain respectively. The mean diurnal cycle
is composited using days 2–9 and 11–12 February.
TRMM over Darwin, except the model leads TRMM by
a few hours. The model shows better agreement with regards
to the timing of rainfall when compared to CPOL but has
larger rainfall amounts than CPOL. The CPOL underesti-
mation is likely due to temporal sampling issues that miss
the most intense rainfall events, and TRMM 3B42 is known
to have issues regarding a delayed timing of rainfall com-
pared to other rainfall products (S. Rauniyar, personal com-
munication, 2014). This comparison provides additional con-
fidence in the simulation results and suggests that the issues
over New Guinea are related to the terrain. The differences
may derive from model overproduction of rain on the moun-
tain slopes, TRMM underestimates of rainfall over terrain,
or a combination of the two. In addition, WRF has a slight
tendency to overproduce the early-morning convection near
Darwin (similar to what Wapler et al., 2010 found). This may
explain why offshore precipitation to the north-east of New
Guinea is slightly larger than observed as shown in Fig. 2.
3.1.2 Diurnal features
The behaviour of diurnal rainfall over New Guinea is shown
by Fig. 4. This figure shows time–distance (Hovmöller) plots
of 3-hourly surface rainfall, averaged across the line sections
seen in Fig. 1a. Month-long diagrams from TRMM and WRF
are depicted in coordinated universal time (UTC) (Fig. 4a
and b), while the average diurnal cycle for each are shown in
local time (Fig. 4c and d). The heaviest observed daily rain-
fall is over land and occurs along the mountain slopes rather
than directly over the peaks (in both simulations and obser-
vations). On some days (e.g. 3 and 23–26 February), off-
shore propagation of rainfall from the northern coast is very
prominent. The precipitation signal over water is largest (≥
2.5 mm) when it appears to originate from land (Fig. 4a). The
regular signal suggests that most of the accumulated rainfall
offshore near the northern coast during February 2010 comes
mainly from organised propagating convective systems that
developed over land rather than from cells which initiate over
water. Nonetheless, there are also consecutive days when lit-
tle or no offshore propagation is seen, despite there being
inland convection in the afternoon (e.g. 11–15 February).
The behaviour of these offshore-propagating convective sys-
tems and the roles of gravity waves initiating or modulating
them are presumably sensitive to the large-scale state (e.g.
the MJO phase). This will be considered in a future publica-
tion.
The mean diurnal cycle from TRMM (Fig. 4c) shows daily
rainfall being initiated in the early afternoon over the moun-
tain ridge before intensifying and migrating downslope to-
wards the coast by early evening local time (LT). One sig-
nal moves south-westwards while the other signal moves to-
wards the northern coast. The northern signal maximises at
midnight over the gentler slopes around 140 km inland from
the coast. The signal then continues to propagate offshore
from early- to mid-morning LT the next day, maximising be-
www.atmos-chem-phys.net/16/161/2016/ Atmos. Chem. Phys., 16, 161–175, 2016

166 M. E. E. Hassim et al.: Diurnal rainfall in convection-permitting WRF simulations
4.3 m/s
4.0
m/s
5.5 m/s
5.5 m/s
9.8 m/s 4.6 m/s
4.0
m/s
8.3 m/s
8.3 m/s
8.3 m/s
3.7
m/s
3.3
m/s
Figure 4. Time–distance plots of 3-hourly mean rainfall, averaged
across the line sections in Fig. 1a, from (a) TRMM and (b) 4 km
WRF for the period 2–28 February 2010. The mean diurnal cycle
in local time, composited using 3-hourly data, is also shown for
(c) TRMM, (d) 4 km (re-initialised runs), (e) 1.33 km, and (f) 4 km
2-week free-running WRF runs. Vertical dashed lines represent the
positions of the averaged mountain peak (about 170 km) and north-
ern coastline (about 420 km) respectively. Coloured lines show the
estimated phase speeds for the peak rain signals over land (black),
over water (yellow), and for the broader rain envelope (red).
tween 60 and 80 km from the coast (Fig. 4c). There is also a
rainfall disturbance propagating from the coast to the moun-
tains in the late morning and early afternoon. This refers to
onshore convection that develops and slowly migrates inland
following the penetration of the sea breeze. This diurnal fea-
ture is characteristic of coastal environments around the is-
lands of the Maritime Continent and has been documented
for New Guinea in previous studies (e.g. Zhou and Wang,
2006).
Overall, there are some notable similarities between the
model and observations as WRF captures the gross space–
time structure of the observed diurnal patterns reasonably
well. This includes the sub-monthly variability of offshore
rainfall (Fig. 4b), the inland migration of late-morning/early-
afternoon rainfall from the coast, and the location of peak
rainfall over land; i.e. the rainfall maximum is first seen near
the mountain tops before moving down the slopes (cf. Fig. 4c
and d). The timing and location of the simulated early-
morning rainfall maximum offshore compare favourably to
TRMM. However, precipitation development and timing of
peak rainfall over land occurs by about 3 h too early in the
model and modelled signals are considerably more intense
over the slopes, with offshore rainfall also being too heavy.
Some of these differences can be explained in the context
of the comparisons over Darwin presented earlier. Moreover,
with the exception of the timing of the absolute rainfall max-
imum, most of the apparent differences between the model
and TRMM in Fig. 4 are related to a difference in the rainfall
intensity.
In our assessment, estimated phase speeds of the peak rain
signal and for the broader envelope do not differ much be-
tween TRMM and WRF in the diurnal mean (Fig. 4c–f). Fur-
thermore, drawing a line between the peak over land and the
peak over the ocean does not properly represent the propa-
gation speed of the systems – convection over land and over
water are part of different morphologies. Due to likely tim-
ing/intensity bias over terrain, the peak rainfall signal from
TRMM (3.3 ms−1) moves slightly slower over land than in
WRF (4.6 ms−1). The faster peak signal seen offshore from
WRF (5.5 ms−1 compared to TRMM at 3.7 ms−1) is pos-
sibly due to there being more simulated squalls in the later
part of the month. Arguably, compositing the much coarser-
resolution TRMM product could also imply a slightly faster
propagation speed for the broader convective envelope. We
acknowledge that propagation speed differences between
TRMM and WRF could be the result of simulation bias,
perhaps related to errors in the convection characteristics.
However, it is more likely a combination of timing/intensity
bias from the observations, simulation bias, and the effect of
coarse-graining the model output. However, despite these bi-
ases, the timing and occurrence of the offshore-propagating
rainfall is well-represented and therefore this model experi-
ment is well-suited to study the dynamics of the processes at
play governing the offshore precipitation.
3.1.3 Sensitivity to model resolution
Admittedly, the 4 km horizontal grid spacing of d02 is rela-
tively coarse and some of the differences between the simula-
tion and the observations could be explained by these numer-
ical issues. For example, 4 km resolution does not properly
resolve the boundary layer thermals and shallow moist con-
vection and necessitates parameterisation of these processes.
Moreover, although deep convection is treated explicitly in
these simulations the convective processes are not properly
resolved (they are “permitted”). This should lead to convec-
tive updrafts that are too wide and intense, in part because of
the lack of explicit entrainment and the smoothed topogra-
phy, which might explain the rainfall intensity bias. To con-
sider these issues regarding model resolution, we compare
the results from the 4 km (d02) and 1.33 km (d03) simulation
domains from the free-running simulation. These domains
Atmos. Chem. Phys., 16, 161–175, 2016 www.atmos-chem-phys.net/16/161/2016/

M. E. E. Hassim et al.: Diurnal rainfall in convection-permitting WRF simulations 167
Figure 5. Two-week rainfall accumulations from the (a) 1.33 km and (b) 4 km free-running model simulations in domain 3 (d03) at their
native grid resolutions.
can be compared directly because of the one-way nesting
configuration, which uses d02 to force only the lateral bound-
ary conditions of d03. Of course, even at 1.33 km grid spac-
ing many of the important processes like shallow convection
remain poorly resolved.
Comparison of the 2-week rainfall accumulations over the
area of d03, on each model’s native grid, demonstrates no-
table similarity between the two resolutions (Fig. 5). Both
model resolutions show similar rainfall accumulations over
the slopes of New Guinea, both in terms of intensity and area.
Perhaps the largest difference is that the higher-resolution
d03 produces slightly more rainfall immediately offshore of
the northern coast.
Comparisons of the mean diurnal cycle and its spatial
distribution over New Guinea from d02 and d03 (Fig. 4e
and f) shows that there is limited sensitivity to the resolu-
tions considered here. The rainfall intensity is slightly larger,
for both the diurnal peak and offshore maximum, in the
higher-resolution model. Thus, reducing the grid spacing to
1.33 km does not improve the biases compared to TRMM.
In terms of the individual convective systems, inspection of
the modelled clouds and rainfall that propagate offshore (not
shown) demonstrate increased organization at higher resolu-
tion. Over Darwin (Fig. 3) there is a similar change in pre-
cipitation intensity over land, with the increased resolution
leading to a slightly larger rainfall maximum. However, be-
cause of the relatively short record used in the comparisons
here, many of these differences may not be representative of
the actual sensitivities. For this reason, and the apparent lack
of systematic improvement with higher resolution, we focus
the remaining analysis on the longer simulation data set pro-
vided by the 4 km WRF (overlapping) simulation.
3.2 Emergence of the offshore rainfall maximum
3.2.1 Offshore vs. no-offshore days
The contrast between modelled days of significant offshore
rainfall and days when it is lacking warrants further attention.
Here, we examine the various conditions that may explain the
offshore rainfall maximum near the northern coast as seen in
Fig. 2a and b. With guidance from Fig. 4a and b and inspec-
tion of hourly simulated rainfall maps (not shown), we have
selected days 3 and 23–26 February to form the composite of
offshore rainfall propagation days (designated simply as off-
shore). Likewise, days 11–15 February are chosen to form
the composite of days when offshore propagation is absent
(denoted no-offshore). The selected offshore and no-offshore
days in the model simulation are chosen for their general
agreement with TRMM data as seen in the Hovmöller dia-
gram in Fig. 4. The mean diurnal cycle of rainfall in LT for
each these composites is depicted in Fig. 6, constructed using
the compositing technique described in Sect. 2.2.
The offshore diurnal cycle is similar to the mean diur-
nal cycle for February (Fig. 6a), indicating that large-scale
conditions favourable for the occurrence and propagation of
offshore rainfall are the norm in day-to-day variability for
the period studied. The most intense rainfall signal near the
coast has a coherent propagation that begins about 50 km
inland and extends about 120 km offshore. The speed of
the strongest signal (marked on Fig. 6a) is about 4.7 ms−1,
while the speed corresponding to the rainfall onset is around
8 ms−1 (see Fig. 12b also). This value corresponds to the
propagation speed of the “gust-font” mode identified by
Tulich and Mapes (2008) in their two-dimensional cloud-
resolving study. We discuss the significance of this mode in
Sect. 3.2.3.
The rainfall patterns closer to the terrain peak move
slower, but they have less coherent propagation characteris-
tics. During no-offshore days (Fig. 6b) the rainfall near the
terrain peak shows similar characteristics to offshore days,
albeit with slightly slower propagation speeds, but terminates
within about 100 km of the coast. While some rain can be
seen more than 120 km offshore between 03:00 and 09:00 LT,
the signal does not appear to follow coherent propagation
from land as it does in the offshore days. This may be a sig-
nal of the open ocean diurnal cycle and not related to offshore
propagation per se.
www.atmos-chem-phys.net/16/161/2016/ Atmos. Chem. Phys., 16, 161–175, 2016

168 M. E. E. Hassim et al.: Diurnal rainfall in convection-permitting WRF simulations
Rainfall [mm] Rainfall [mm]
Figure 6. Composite diurnal cycle in local time (LT) in simulated (a) offshore and (b) no-offshore days, as averaged across the line sections
seen in Fig. 1a. The black line represents the estimated phase speed of the peak rain signal across the northern coast, while the red line
denotes the estimated phase speed of the broader rain envelope (∼ 8 ms−1). Vertical dashed lines mark the terrain peak and the coast as in
Fig. 4.
Temperature (black) Dewpoint (blue) Parcel (red) Offshore = solid lines NO-Offshore = dashed
(a)!
Figure 7. Mean profiles averaged within the region denoted by the red box in the inset. (a) Simulated temperature (black), dew point (blue)
and parcel temperature (red) averaged for offshore (solid) and no-offshore (dashed) days. (b) Vector wind in the direction normal (solid) and
parallel (dashed) to the coast on offshore (black) and no-offshore (blue) days. Positive values of normal velocity flow towards the north-north-
east and parallel velocity flow towards the west-north-west. (c) Water vapour mixing ratio (gkg−1) and (d) equivalent potential temperature
(K) for offshore and no-offshore days compared to the February mean.
Inspection of the environmental conditions averaged for a
box region around the northern coast provides us with an ex-
planation for the difference in convective behaviour during
offshore days compared to no-offshore. Figure 7a shows the
mean profiles of simulated temperature and dew point, along
with parcel temperatures for offshore and no-offshore days
for the area within the denoted red box. The wind compo-
nents normal and parallel to the terrain, water vapour, and
Atmos. Chem. Phys., 16, 161–175, 2016 www.atmos-chem-phys.net/16/161/2016/

M. E. E. Hassim et al.: Diurnal rainfall in convection-permitting WRF simulations 169
equivalent potential temperature are also shown (Fig. 7b–d).
The plot shows that both offshore and no-offshore days pos-
sess minor differences in their temperature profiles, but no-
offshore days are much drier especially above 700 hPa (∼
3 km) as shown by the large dew point depression (Fig. 7a),
and large differences in water vapour and equivalent poten-
tial temperature at around 6 km (Fig. 7c and d). In fact, the
middle troposphere on no-offshore days has a lower water
vapour content than the monthly mean, compared to off-
shore days when it is anomalously moister (Fig. 7c). The
coastal/offshore environment on no-offshore days is there-
fore less likely to support deep convection at night de-
spite having moderate convective available potential energy
(CAPE, ∼ 1400 Jkg−1). This is evident in the much shal-
lower cloud layer for the region near the northern coast on
no-offshore days (see Fig. 11 later). In contrast, considerably
larger CAPE exists on offshore days (∼ 2100 Jkg−1).
The mean wind profiles normal to the coast show lit-
tle variation in low-level wind speed below 500 m, which
is directed onshore, or shear below 3 km, which is directed
offshore. Shear values between 1 and 3 km are 0.0025 and
0.00235 s−1 on no-offshore and offshore days respectively.
There is stronger shear above 6 km in offshore cases. No-
tably, there are speed and directional differences at low lev-
els for wind parallel to the northern coast. These could have
an important effect on the moisture flux convergence in the
boundary layer along the coast.
To examine the evolution of low-level moisture supply
over the northern coast on both offshore and no-offshore
days, we calculate the total horizontal moisture flux conver-
gence (or simply moisture convergence) by summing all grid
points between the surface and a height of about 1 km (first
11 models levels) in the region denoted by the red box (see
inset in Fig. 7a). We define this vertically integrated moisture
convergence (VIMFC) using
VIMFC=−
z=1 km∫z=sfc
[∇ · (qV )], (1)
where q = specific humidity (gkg−1) and V = vector wind
(ms−1). The divergence at each grid point is approxi-
mated using centred finite differences. Both offshore and no-
offshore days feature a significant diurnal cycle in moisture
convergence, with maximum in the evening/early morning
(Fig. 8). The VIMFC on offshore days is substantially larger
than on no-offshore days and precedes the rainfall maximum
by a few hours. Most of this VIMFC difference can be at-
tributed to the difference in boundary layer mass convergence
since mean moisture content in the first 1 km is similar on no-
offshore and offshore days (Fig. 7a). Of course, some of the
VIMFC differences, especially in the hours that correspond
to the coastal rainfall, may be convectively induced. How-
ever, it is important to note that during the mid-afternoon
(around 15:00 LT) when both the offshore and no-offshore
Total Box
Figure 8. Total moisture convergence (VIMFC, mgkg−1 s−1), ver-
tically integrated between surface and 1 km height (first 11 model
levels), for the red box region shown in Fig. 7a (black lines). Area
of the box is 290 048 km2 (88× 206 grid points). The diurnal area-
averaged rainfall for offshore and no-offshore days are shown by
the solid and dotted blue lines respectively.
days have active convection, the offshore days have almost
zero convergence whereas the no-offshore case is divergent.
This suggests that regional-scale conditions, whether they be
boundary layer convergence or mid-level moisture (as dis-
cussed above), are playing an important role in delineating
offshore from no-offshore days. Arguably, the substantially
larger CAPE on offshore days is due to the increased bound-
ary layer moisture convergence between 15:00 LT and mid-
night (Fig. 8).
In order to isolate the convectively generated perturbations
(gravity wave) response from that solely due to the diurnal
heating and cooling of the elevated land, we performed an
additional sensitivity experiment in which temperature ten-
dencies from cloud microphysical processes were disabled
(i.e. a dry simulation with no latent heating) to isolate the
role of the heated terrain. This “dry simulation” was con-
ducted for the period spanning 12:00 UTC, 1 February, to
23:00 UTC, 4 February 2010. The same input and boundary
conditions are used as before. Again, the first 12 h are dis-
carded and hourly data for days 2–4 February are compos-
ited for analysis. Results from this dry simulation are also
shown in Fig. 8 and demonstrate a significantly reduced di-
urnal cycle compared to the results from offshore and no-
offshore days. This suggests that much of the diurnal cycle in
moisture convergence seen in the full physics simulations is
convectively induced. Nonetheless, the differences in back-
ground environmental conditions around the northern coast
between offshore and no-offshore days are highly suggestive
of large-scale controls on the occurrence of these offshore-
propagating systems.
www.atmos-chem-phys.net/16/161/2016/ Atmos. Chem. Phys., 16, 161–175, 2016

170 M. E. E. Hassim et al.: Diurnal rainfall in convection-permitting WRF simulations
Figure 9. Multi-stage evolution of offshore squall-line propagation for a modelled storm on 3 February 2010, as shown by total column
cloud (grey shade) and rainfall (green-blue contours) during the early evening (left panels) and early morning (right panels). The red arrows
indicate the approximate direction of storm motion over land and water.
3.2.2 Propagating squall-line
As exemplified by Fig. 4a the temporal evolution of the
offshore-propagating convective system manifests through
a multi-stage process. First, convective systems form over
the peaks and move slowly downslope in the early evening.
Around this time the intensity of the rainfall increases as sys-
tems become more organised. Just after midnight, the con-
vective systems reform near the coast and begin to propagate
offshore at around 5 ms−1. This process of system reorgani-
sation, coastal orientation, and propagation offshore is illus-
trated by Fig. 9 for a representative event (3 February 2010).
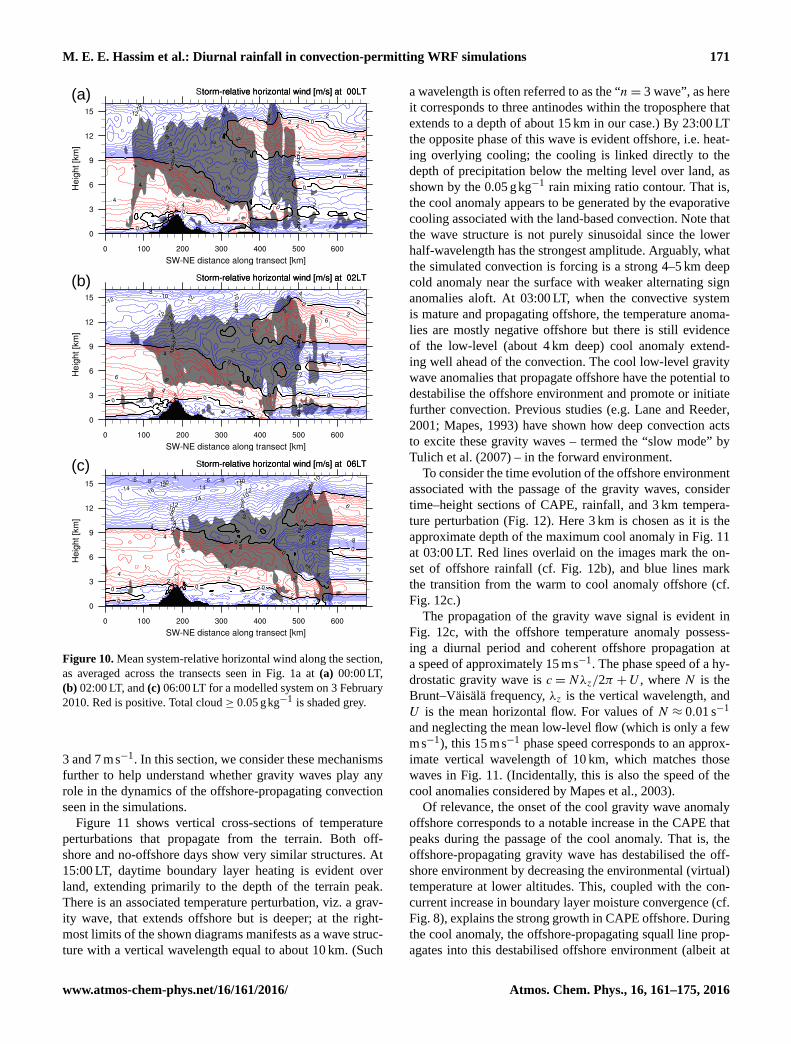
The vertical structure and system-relative flow for the
same event post-midnight is shown in Fig. 10. There is a large
cloud mass over land as well as an isolated convective sys-
tem near the coast. These systems merge by 02:00 LT. At
06:00 LT the convective system has evolved into a large
squall line. The squall line approximately corresponds to
the standard leading-line trailing stratiform archetype (e.g.
Houze, 2004). The system relative wind features a stagnation
point at the surface – identifying the leading edge of a prop-
agating surface cold pool, middle-level inflow that is linked
with rearward directed upper-level outflow, and rear-to-front
flow below the anvil characteristic of a mesoscale downdraft.
3.2.3 Gravity waves
Previous studies (e.g. Mapes et al., 2003; Love et al., 2011)
have explained cases of offshore-propagating convective sys-
tems in the tropics as a result of gravity wave processes.
This is because in those cases, the systems extended fur-
ther and/or faster than would be expected for land breezes or
katabatic winds generated by the terrain. Mapes et al. (2003)
described a mechanism for the formation of offshore con-
vection as a result of diurnally forced gravity waves that are
generated primarily by the boundary layer heating and cool-
ing over the elevated terrain. The nocturnal phase of these
waves was shown to propagate offshore at about 15 ms−1
and destabilise the environment, which promoted convective
development. Love et al. (2011) considered this further and
argued that stratiform cooling from convective systems over
land was an important contributor to the generation of these
waves. However, as shown previously, the most intense rain-
fall signal from offshore convective systems herein propa-
gates at about 5 ms−1, which is considerably slower than
the gravity waves considered by previous studies; instead the
offshore-propagating systems appear as squall lines main-
tained by a surface cold pool. Indeed, Tulich and Mapes
(2008) showed that surface-based cold pools move between
Atmos. Chem. Phys., 16, 161–175, 2016 www.atmos-chem-phys.net/16/161/2016/
M. E. E. Hassim et al.: Diurnal rainfall in convection-permitting WRF simulations 171
(a)
(b)
(c)
Figure 10. Mean system-relative horizontal wind along the section,
as averaged across the transects seen in Fig. 1a at (a) 00:00 LT,
(b) 02:00 LT, and (c) 06:00 LT for a modelled system on 3 February
2010. Red is positive. Total cloud ≥ 0.05 gkg−1 is shaded grey.
3 and 7 ms−1. In this section, we consider these mechanisms
further to help understand whether gravity waves play any
role in the dynamics of the offshore-propagating convection
seen in the simulations.
Figure 11 shows vertical cross-sections of temperature
perturbations that propagate from the terrain. Both off-
shore and no-offshore days show very similar structures. At
15:00 LT, daytime boundary layer heating is evident over
land, extending primarily to the depth of the terrain peak.
There is an associated temperature perturbation, viz. a grav-
ity wave, that extends offshore but is deeper; at the right-
most limits of the shown diagrams manifests as a wave struc-
ture with a vertical wavelength equal to about 10 km. (Such
a wavelength is often referred to as the “n= 3 wave”, as here
it corresponds to three antinodes within the troposphere that
extends to a depth of about 15 km in our case.) By 23:00 LT
the opposite phase of this wave is evident offshore, i.e. heat-
ing overlying cooling; the cooling is linked directly to the
depth of precipitation below the melting level over land, as
shown by the 0.05 gkg−1 rain mixing ratio contour. That is,
the cool anomaly appears to be generated by the evaporative
cooling associated with the land-based convection. Note that
the wave structure is not purely sinusoidal since the lower
half-wavelength has the strongest amplitude. Arguably, what
the simulated convection is forcing is a strong 4–5 km deep
cold anomaly near the surface with weaker alternating sign
anomalies aloft. At 03:00 LT, when the convective system
is mature and propagating offshore, the temperature anoma-
lies are mostly negative offshore but there is still evidence
of the low-level (about 4 km deep) cool anomaly extend-
ing well ahead of the convection. The cool low-level gravity
wave anomalies that propagate offshore have the potential to
destabilise the offshore environment and promote or initiate
further convection. Previous studies (e.g. Lane and Reeder,
2001; Mapes, 1993) have shown how deep convection acts
to excite these gravity waves – termed the “slow mode” by
Tulich et al. (2007) – in the forward environment.
To consider the time evolution of the offshore environment
associated with the passage of the gravity waves, consider
time–height sections of CAPE, rainfall, and 3 km tempera-
ture perturbation (Fig. 12). Here 3 km is chosen as it is the
approximate depth of the maximum cool anomaly in Fig. 11
at 03:00 LT. Red lines overlaid on the images mark the on-
set of offshore rainfall (cf. Fig. 12b), and blue lines mark
the transition from the warm to cool anomaly offshore (cf.
Fig. 12c.)
The propagation of the gravity wave signal is evident in
Fig. 12c, with the offshore temperature anomaly possess-
ing a diurnal period and coherent offshore propagation at
a speed of approximately 15 ms−1. The phase speed of a hy-
drostatic gravity wave is c =Nλz/2π +U , where N is the
Brunt–Väisälä frequency, λz is the vertical wavelength, and
U is the mean horizontal flow. For values of N ≈ 0.01 s−1
and neglecting the mean low-level flow (which is only a few
ms−1), this 15 ms−1 phase speed corresponds to an approx-
imate vertical wavelength of 10 km, which matches those
waves in Fig. 11. (Incidentally, this is also the speed of the
cool anomalies considered by Mapes et al., 2003).
Of relevance, the onset of the cool gravity wave anomaly
offshore corresponds to a notable increase in the CAPE that
peaks during the passage of the cool anomaly. That is, the
offshore-propagating gravity wave has destabilised the off-
shore environment by decreasing the environmental (virtual)
temperature at lower altitudes. This, coupled with the con-
current increase in boundary layer moisture convergence (cf.
Fig. 8), explains the strong growth in CAPE offshore. During
the cool anomaly, the offshore-propagating squall line prop-
agates into this destabilised offshore environment (albeit at
www.atmos-chem-phys.net/16/161/2016/ Atmos. Chem. Phys., 16, 161–175, 2016

172 M. E. E. Hassim et al.: Diurnal rainfall in convection-permitting WRF simulations
Figure 11. Temperature perturbations from daily mean (colours) for offshore (left panels), no-offshore (middle panels), and dry simulation
(right panels) at 15:00, 23:00, and 03:00 LT. Total condensate greater 0.05 gkg−1 is shaded grey; rain areas are contoured every 0.05 gkg−1
in black with regions greater than 0.15 gkg−1 shaded dark grey. The averaged terrain profile is shaded black.
__
__ __
__
____
Figure 12. Mean diurnal cycles of (a) CAPE, (b) rainfall, and (c) temperature perturbations from daily mean for offshore days. (d) As in
panel (c) but for the dry simulation. Dashed vertical lines indicate the position of the ridge and northern coastline respectively. The phase
speed of the red line (denoting rainfall onset) is ∼ 8 ms−1 while the phase speed of the blue line (denoting cooling onset) is ∼ 15 ms−1.
a speed slower than the gravity wave); the onset of rainfall
occurs within the cold wave anomaly where that CAPE is
increased. Thus, from these and results presented earlier it
appears that the convective system (maintained by the sur-
face cold pool) is not initiated by the gravity wave mode but
instead the system moves into an environment that has been
destabilised by the cool phase of the gravity wave shortly
before its arrival. Thus, the wave may play a role in en-
hancing the squall line and promoting its longevity, but ulti-
mately the squall line appears to originally form independent
of the wave. Nevertheless, the phase speed corresponding to
the rainfall onset (8 ms−1) suggests preferential triggering
of convection ahead of the main squall line. Such a phase
speed is reminiscent of the “gust-front mode” identified by
Tulich and Mapes (2008), who demonstrated the efficacy of
this shallow gravity wave mode in initiating subsequent con-
vection ahead. Inspection of Fig. 10 does indicate vertical
wavelength structures of about 4–5 km both within and ahead
Atmos. Chem. Phys., 16, 161–175, 2016 www.atmos-chem-phys.net/16/161/2016/

M. E. E. Hassim et al.: Diurnal rainfall in convection-permitting WRF simulations 173
of the main convective line. This is consistent with the short
vertical wavelength of the “gust-front” mode (∼ 5 km). Fur-
thermore, the cool temperature anomalies in the lower free
troposphere ahead of the system depict a local minimum at
∼ 1 km (Fig. 11, leftmost bottom two panels). Again, this is
consistent with the temperature structures shown by Tulich
and Mapes (2008) for the “gust-front” mode (their Fig. 3b),
suggesting the potential importance of this mode for trigger-
ing convection.
To consider the relative roles of the topographic and
boundary layer heating/cooling vs. the diabatic forcing from
convection in generating the gravity waves, results from the
dry simulation are considered here. For the dry simulation
(Fig. 12d) the cooling over land is larger than the full physics
simulation, presumably due to increased nocturnal radiative
cooling in the absence of clouds. Also, because boundary
layer heating and cooling extends all the way to the coast, the
anomalies over land appear stationary, fluctuating in phase
with the diurnal cycle. In contrast, the offshore-propagating
gravity wave signal is substantially weaker in amplitude with
a slower propagation speed. This slower speed is consistent
with the shallower cold anomaly (shorter gravity wave verti-
cal wavelength) seen in Fig. 11. These results strongly sug-
gest the importance of the convective diabatic forcing, in this
case “stratiform cooling”, in contributing to the generation
of the offshore-propagating gravity waves that further desta-
bilise the environment (consistent with the conclusions of
Love et al., 2011). Nonetheless, boundary layer cooling (cf.
Mapes et al., 2003) does force offshore-propagating waves
that work in concert with the convectively generated waves.
As suggested by Fig. 11, the strength and depth of the off-
shore cool anomalies are very similar for offshore and no-
offshore days. Similar time–distance analysis to Fig. 12 for
no-offshore (not shown) demonstrates much similarity to off-
shore, including an increase in CAPE with the passage of the
wave of similar magnitude. Though recall in the no-offshore
case, the background CAPE is substantially smaller than in
offshore due to less boundary layer convergence. This result
suggests that the convection over land, which occurs in both
cases, plays a key role in the wave generation.
4 Conclusions
This study has examined the diurnal cycle of rainfall over
New Guinea using a series of convection-permitting model
simulations using the WRF model. The simulations focus
on February 2010, which is a period of suppressed regional-
scale conditions chosen to maximise the local influence on
the diurnal cycle. The primary focus of the study and anal-
ysis was on the occurrence and dynamics of the offshore-
propagating convective systems that contribute to the early-
morning precipitation maximum to the north-east of New
Guinea.
The model simulations are configured with one-way
nested domains, with the primary focus on results from
a 4 km horizontal grid spacing domain. The modelled pre-
cipitation shows good spatial agreement with observed rain-
fall from the TRMM 3B42 product. However, the intensity
of the modelled precipitation is larger than TRMM over the
steep terrain. Better agreement between the model and the
observations is found over Darwin, which has substantially
lower topography than New Guinea. Additional simulations,
over a 2-week period, using 1.33 km grid spacing show simi-
lar results and biases to the 4 km domain and lend support to
using the 4 km domain over the month-long period.
The model simulations reproduce the occurrence and vari-
ability of convective systems that propagate offshore, to the
north-east, of New Guinea during the night and early morn-
ing. These systems are linked to daytime convective sys-
tems over land, which reform near the coast around mid-
night and then propagate at about 5 ms−1 offshore as or-
ganised squall lines. The occurrence of the offshore systems
is largely related to the background conditions. Days with
offshore-propagating convection have more middle tropo-
spheric moisture, larger CAPE, and greater low-level mois-
ture convergence than days without offshore-propagating
convection. Convection has similar characteristics over the
terrain on both days with and without offshore propagation.
Gravity waves are also generated as part of the diurnal cy-
cle and propagate offshore at about 15 ms−1. The cool phase
of these waves (with negative low-level temperature anoma-
lies) propagates offshore during the evening and early morn-
ing, which destabilises the offshore environment (increases
the CAPE) immediately prior to the arrival of the organ-
ised convective systems. The forcing of the gravity waves
is linked to precipitating convection over land because an ad-
ditional experiment with no convection (viz. a dry simula-
tion) shows weaker and slower gravity waves. The 15 ms−1
gravity wave does not initiate convection per se and it propa-
gates faster than the squall lines, but by increasing the CAPE
the wave makes the nocturnal offshore environment more
conducive to deep convection and likely contributes to the
longevity of the offshore-propagating squall line. However,
it is possible that convection may be triggered by a “gust-
front” mode moving slower at 8 ms−1 and corresponds to the
offshore rainfall onset. Clearly, our understanding of these
propagating systems would benefit from increased observa-
tions. For example, radiosonde launch sites located about
150 km offshore would be highly useful. In addition, radars
at coastal sites and/or on ships could also observe the pas-
sage and structure of convective systems from land through
to ocean. Such observations should form part of future field
campaigns like the YMC (Years of the Maritime Continent).
These results highlight the importance of terrain and
coastal effects and gravity waves in controlling the diurnal
cycle over the Maritime Continent, especially the offshore
precipitation maxima. However, these results have been lim-
ited in their scope as they only focus on one period of sup-
www.atmos-chem-phys.net/16/161/2016/ Atmos. Chem. Phys., 16, 161–175, 2016

174 M. E. E. Hassim et al.: Diurnal rainfall in convection-permitting WRF simulations
pressed regional-scale activity due to an active MJO phase in
the eastern Pacific/western hemisphere. The simulations are
also only “convection permitting” and therefore do not nec-
essarily resolve all the processes at play. Indeed, the structure
of the diurnal cycle in the Maritime Continent and its varia-
tion with the passage of the MJO has been the focus of recent
work (Peatman et al., 2014). In the context of offshore propa-
gation and its sensitivity to MJO phase, our future work will
focus on cases with different regional-scale conditions and
higher model resolution.
Acknowledgements. The authors would like to acknowledge
David Lee (formerly of the University of Melbourne, now at Los
Alamos National Laboratory) for providing Fig. 3. The authors
would also like to thank Tim Dunkerton (editor), Stefan Tulich,
Mitchell Moncrieff, and an anonymous reviewer for helpful com-
ments which improved the quality of the manuscript. This research
was supported by the ARC Centre of Excellence for Climate
System Science (CE1100010128). High-performance computing
was provided by the National Computational Infrastructure (NCI)
facility. Data analysis and visualisation were conducted with the
NCAR Command Language (Version 6.2.1), Software, Boulder,
Colorado: UCAR/NCAR/CISL/VETS, doi:10.5065/D6WD3XH5,
2014.
Edited by: T. J. Dunkerton
References
Barthlott, C. and Kirshbaum, D. J.: Sensitivity of deep convection
to terrain forcing over mediterranean islands, Q. J. Roy. Meteor.
Soc., 139, 1762–1779, doi:10.1002/qj.2089, 2013.
Biasutti, M., Yuter, S. E., Burleyson, C. D., and Sobel, A. H.: Very
high resolution rainfall patterns measured by TRMM precipita-
tion radar: seasonal and diurnal cycles, Clim. Dynam., 39, 239–
258, doi:10.1007/s00382-011-1146-6, 2012.
Bringi, V. N., Huang, G. J., Chandrasekar, V., and Keenan, T. D.:
An areal rainfall estimator using differential propagation
phase: Evaluation using a C-band radar and a dense gauge
network in the tropics, J. Atmos. Ocean. Tech., 18, 1810–1818,
doi:10.1175/1520-0426(2001)018<1810:AAREUD>2.0.CO;2,
2001.
Chen, Y., Ebert, E. E., Walsh, K. J. E., and Davidson, N. E.: Eval-
uation of TRMM 3B42 precipitation estimates of tropical cy-
clone rainfall using PACRAIN data, J. Geophys. Res.-Atmos.,
118, 2184–2196, doi:10.1002/jgrd.50250, 2013.
Dee, D. P., Uppala, S. M., Simmons, A. J., Berrisford, P., Poli, P.,
Kobayashi, S., Andrae, U., Balmaseda, M. A., Balsamo, G.,
Bauer, P., Bechtold, P., Beljaars, A. C. M., van de Berg, L.,
Bidlot, J., Bormann, N., Delsol, C., Dragani, R., Fuentes, M.,
Geer, A. J., Haimberger, L., Healy, S. B., Hersbach, H.,
Hólm, E. V., Isaksen, L., Kållberg, P., Köhler, M., Matricardi, M.,
McNally, A. P., Monge-Sanz, B. M., Morcrette, J.-J., Park, B.-
K., Peubey, C., de Rosnay, P., Tavolato, C., Thépaut, J.-N., and
Vitart, F.: The ERA-Interim reanalysis: configuration and perfor-
mance of the data assimilation system, Q. J. Roy. Meteor. Soc.,
137, 553–597, doi:10.1002/qj.828, 2011.
Fujita, M., Kimura, F., and Yoshizaki, M.: Morning precipitation
peak over the Strait of Malacca under a calm condition, Mon.
Weather Rev., 138, 1474–1486, doi:10.1175/2009MWR3068.1,
2010.
Houze, R. A.: Mesoscale convective systems, Rev. Geophys., 42,
RG4003, doi:10.1029/2004RG000150, 2004.
Houze, R. A., Geotis, S. G., Marks, F. D., and West, A. K.:
Winter monsoon convection in the vicinity of North Borneo.
Part I: Structure and time variation of the clouds and precipi-
tation, Mon. Weather Rev., 109, 1595–1614, doi:10.1175/1520-
0493(1981)109<1595:WMCITV>2.0.CO;2, 1981.
Huffman, G. J., Adler, R. F., Bolvin, D. T., and Nelkin, E. J.:
The TRMM Multi-satellite Precipitation Analysis (TMPA), in:
Satellite Rainfall Applications for Surface Hydrology, chap. 1,
edited by: Hossain, F. and Gebremichael, M., Springer Verlag,
the Netherlands, 3–22, doi:10.1007/978-90-481-2915-7_1, 2010.
Kikuchi, K. and Wang, B.: Diurnal precipitation regimes
in the global tropics, J. Climate, 21, 2680–2696,
doi:10.1175/2007JCLI2051.1, 2008.
Lane, T. P. and Reeder, M. J.: Convectively generated
gravity waves and their effect on the cloud environ-
ment, J. Atmos. Sci., 58, 2427–2440, doi:10.1175/1520-
0469(2001)058<2427:CGGWAT>2.0.CO;2, 2001.
Liberti, G. L., Chéruy, F., and Desbois, M.: Land effect on the
diurnal cycle of clouds over the TOGA COARE area, as ob-
served from GMS IR data, Mon. Weather Rev., 129, 1500–1517,
doi:10.1175/1520-0493(2001)129<1500:LEOTDC>2.0.CO;2,
2001.
Lo, J. C.-F., Yang, Z.-L., and Pielke Sr., R. A.: Assessment of three
dynamical climate downscaling methods using the Weather Re-
search and Forecasting (WRF) model, J. Geophys. Res., 113,
D09112, doi:10.1029/2007JD009216, 2008.
Love, B. S., Matthews, A. J., and Lister, G. M. S.: The diurnal
cycle of precipitation over the Maritime Continent in a high-
resolution atmospheric model, Q. J. Roy. Meteor. Soc., 137, 934–
947, doi:10.1002/qj.809, 2011.
Mapes, B. E.: Gregarious tropical convection, J.
Atmos. Sci., 50, 2026–2037, doi:10.1175/1520-
0469(1993)050<2026:GTC>2.0.CO;2, 1993.
Mapes, B. E., Warner, T. T., and Xu, M.: Diurnal pat-
terns of rainfall in Northwestern South America. Part
III: Diurnal gravity waves and nocturnal convection off-
shore, Mon. Weather Rev., 131, 830–844 , doi:10.1175/1520-
0493(2003)131<0830:DPORIN>2.0.CO;2, 2003.
Matthews, A. J., Pickup, G., Peatman, S. C., Clews, P., and Mar-
tin, J.: The effect of the Madden–Julian oscillation on sta-
tion rainfall and river level in the Fly River system, Papua
New Guinea, J. Geophys. Res.-Atmos., 118, 10926–10935,
doi:10.1002/jgrd.50865, 2013.
May, P. T., Long, C. N., and Protat, A.: The diurnal cycle of
the boundary layer, convection, clouds, and surface radiation in
a coastal monsoon environment (Darwin, Australia), J. Climate,
25, 5309–5326, doi:10.1175/JCLI-D-11-00538.1, 2012.
Moncrieff, M. W., Waliser, D. E., Miller, M. J., Shapiro, M. A.,
Asrar, G. R., and Caughey, J.: Multiscale convective organization
and the YOTC virtual global field campaign, B. Am. Meteorol.
Soc., 93, 1171–1187, doi:10.1175/BAMS-D-11-00233.1, 2012.
Mori, S., June-Ichi, H., Tauhid, Y. I., Yamanaka, M. D.,
Okamoto, N., Murata, F., Sakurai, N., Hashiguchi, H., and
Atmos. Chem. Phys., 16, 161–175, 2016 www.atmos-chem-phys.net/16/161/2016/
M. E. E. Hassim et al.: Diurnal rainfall in convection-permitting WRF simulations 175
Sribimawati, T.: Diurnal land–sea rainfall peak migration
over Sumatera Island, Indonesian Maritime Continent, ob-
served by TRMM satellite and intensive rawinsonde sound-
ings, Mon. Weather Rev., 132, 2021–2039, doi:10.1175/1520-
0493(2004)132<2021:DLRPMO>2.0.CO;2, 2004.
Peatman, S. C., Matthews, A. J., and Stevens, D. P.: Propagation of
the Madden–Julian oscillation through the Maritime Continent
and scale interaction with the diurnal cycle of precipitation, Q. J.
Roy. Meteor. Soc., 140, 814–825, doi:10.1002/qj.2161, 2014.
Qian, J.-H.: Why precipitation is mostly concentrated over is-
lands in the Maritime Continent, J. Atmos. Sci., 65, 1428–1441,
doi:10.1175/2007JAS2422.1, 2008.
Skamarock, W. C., Klemp, J. B., Dudhia, J., Gill, D. O.,
Baker, D. M., Duda, M. G., Huang, X.-Y., Wang, W., and Pow-
ers, J. G.: A Description of the Advanced Research WRF Version
3, NCAR/TN-47, NCAR, Boulder, CO, USA, 113 pp., 2008.
Tulich, S. N. and Mapes, B. E.: Multiscale convective wave dis-
turbances in the tropics: insights from a two-dimensional
cloud-resolving model, J. Atmos. Sci., 65, 140–155,
doi:10.1175/2007JAS2353.1, 2008.
Tulich, S. N., Randall, D. A., and Mapes, B. E.: Vertical-mode and
cloud decomposition of large-scale convectively coupled gravity
waves in a two-dimensional cloud-resolving model, J. Atmos.
Sci., 64, 1210–1229, doi:10.1175/JAS3884.1, 2007.
Wapler, K. and Lane, T. P.: A case of offshore convective initia-
tion by interacting land breezes near Darwin, Australia, Meteo-
rol. Atmos. Phys., 115, 123–137, doi:10.1007/s00703-011-0180-
6, 2012.
Wapler, K., Lane, T. P., May, P. T., Jakob, C., Manton, M. J., and
Siems, S. T.: Cloud-system-resolving model simulations of trop-
ical cloud systems observed during the Tropical Warm Pool-
International Cloud Experiment, Mon. Weather Rev., 138, 55–
73, doi:10.1175/2009MWR2993.1, 2010.
Wu, P., Manabu, D., and Matsumoto, J.: The formation of noc-
turnal rainfall offshore from convection over western Kaliman-
tan (Borneo) Island, J. Meteorol. Soc. Jpn., 86A, 187–203,
doi:10.2151/jmsj.86A.187, 2008.
Wu, P., Hara, M., Hamada, J.-I., Yamanaka, M. D., and Kimura, F.:
Why a large amount of rain falls over the sea in the vicinity
of Western Sumatra Island during nighttime, J. Appl. Meteorol.
Clim., 48, 1345–1361, doi:10.1175/2009JAMC2052.1, 2009.
Yang, G.-Y. and Slingo, J.: The diurnal cycle in the trop-
ics, Mon. Weather Rev., 129, 784–801, doi:10.1175/1520-
0493(2001)129<0784:TDCITT>2.0.CO;2, 2001.
Zhou, L. and Wang, Y.: Tropical Rainfall Measuring Mission ob-
servation and regional model study of precipitation diurnal cy-
cle in the New Guinean region, J. Geophys. Res., 111, 1–18,
doi:10.1029/2006JD007243, 2006.
www.atmos-chem-phys.net/16/161/2016/ Atmos. Chem. Phys., 16, 161–175, 2016