The Distribution of Muscle and Bone Weight in Swamp...
8
PertanikaJ. Trap. Agric. Sci. 25(1): 19 - 26 (2002) ISSN: 1511-3701 © Universiti Putra Malaysia Press The Distribution of Muscle and Bone Weight in Swamp Buffalo (Bubalus bubalis), Bos indicus and Bos taurus Steers E.R. JOHNSONl, D.D. CHARLES2, & D.A. BAKER 1School of Veterinary Science, The University of Queensland, St Lucia 4072, Australia 278 Cairns Street, Kangaroo Point, Queensland 4169 Keywords: Distribution, carcass components, Bubalus bubalis ABSTRAK Penyebaran berat otot dan tulang 15 ekor kerbau (Bubalus bubalis) jantan dibandingkan dengan 15 ekor lembu jantan masing-masingnya daripada baka Angus, Hereford dan Brahman. Penyebaran berat otot dan tulang kerbau menunjukkan peralihan ke arah bahagian hadapan badan. Bahagian yang terlibat ialah servital, toraks dan tulang kaki hadapan dan ''piawia tumpulais otot" 5, 7 dan 9. Brahmans menunjukkan penyebaran otot yang sama tetapi tidak setanding dengan kerbau. Skapula di bahagian belakang kerbau juga berlainan. Ianya hipotrofi dibandingkan dengan baka yang lain dengan pembesaran otot supraspinatus dan otot infraspinatus tetapi otot subscapularis yang ringan. Adalah dicadangkan bahawa perbezaan penyebaran itu mencerminkan "traction" masa lampau kerbau dan Brahmans. ABSTRACT The muscle weight distribution and bone weight distribution of 15 buffalo (Bubalus bubalis) steers were compared with that of 15 steers from each of three breeds of cattle, Angus, Hereford and Brahman. For both muscle weight distribution and bone weight distribution, buffaloes showed a "shift" towards the forequarter. This involved the cervical, thoracic and forelimb bones and standard muscle groups 5, 7 and 9. Brahmans showed a similar but less pronounced distribution to that of the buffaloes. The scapula was an exception in the forequarter of the buffaloes. It was lighter relative to the other breeds with clearly enlarged mm. supraspinatus and infraspinatus but a lighter m. subscapularis. It is suggested that these distribution differences reflect the traction history of buffaloes and Brahmans. INTRODUCTION Cattle were domesticated about 4000 to 6000 years B.C. (Zeuner 1963) although carbon-dated Jericho discoveries suggest that domestication may have occurred as early as 10,000 years B.C. (Boston 1963). The earliest domestication was in Mesopotamia and North West India. Ploughing and the haulage of two-wheeled carts were practiced in the Mohenjodaro area about 3000 years B.C. and Banjaras carried mer- chandise on pack bullocks (Von Fiirer- Haimendorf 1963). Rouse (1972) and Porter (1991) noted that the muscular power of cattle, particularly zebus, was used for transport and ploughing on most of the Indian sub-continent. Zeuner (1963) produced evidence that Bos primigenius namadicus had been in India before early Man and it showed several features in common with the zebu. The muscle power of cattle, particularly zebus, has been used for rais- ing water, draft, cultivation, transport and haul- age. Innumerable descendants of zebu native stock have found their way to Africa and South East Asia where they have been used as beasts of burden (Wheaton-Smith 1963). The Buffalo has a 5000 year history, authen- ticated on seals struck in the Indus Valley, sug- gesting that by then, it had already been domes- ticated (Anon 1981). It was in use, in China, 4000 years ago where its legendary strength was used to supply farm power. It is now used as a "living tractor" in South China, Thailand, Indo- nesia, Philippines, India and Pakistan. In Egypt, it is the most important domestic animal (Anon 1981).
Transcript of The Distribution of Muscle and Bone Weight in Swamp...

PertanikaJ. Trap. Agric. Sci. 25(1): 19 - 26 (2002) ISSN: 1511-3701© Universiti Putra Malaysia Press
The Distribution of Muscle and Bone Weight in Swamp Buffalo(Bubalus bubalis), Bos indicus and Bos taurus Steers
E.R. JOHNSONl, D.D. CHARLES2, & D.A. BAKER1School of Veterinary Science,
The University of Queensland, St Lucia 4072, Australia278 Cairns Street, Kangaroo Point, Queensland 4169
Keywords: Distribution, carcass components, Bubalus bubalis
ABSTRAK
Penyebaran berat otot dan tulang 15 ekor kerbau (Bubalus bubalis) jantan dibandingkan dengan 15 ekorlembu jantan masing-masingnya daripada baka Angus, Hereford dan Brahman. Penyebaran berat otot dantulang kerbau menunjukkan peralihan ke arah bahagian hadapan badan. Bahagian yang terlibat ialah servital,toraks dan tulang kaki hadapan dan ''piawia tumpulais otot" 5, 7 dan 9. Brahmans menunjukkan penyebaranotot yang sama tetapi tidak setanding dengan kerbau. Skapula di bahagian belakang kerbau juga berlainan.Ianya hipotrofi dibandingkan dengan baka yang lain dengan pembesaran otot supraspinatus dan ototinfraspinatus tetapi otot subscapularis yang ringan. Adalah dicadangkan bahawa perbezaan penyebaran itumencerminkan "traction" masa lampau kerbau dan Brahmans.
ABSTRACT
The muscle weight distribution and bone weight distribution of 15 buffalo (Bubalus bubalis) steers werecompared with that of15 steers from each of three breeds ofcattle, Angus, Hereford and Brahman. For both muscleweight distribution and bone weight distribution, buffaloes showed a "shift" towards the forequarter. This involvedthe cervical, thoracic and forelimb bones and standard muscle groups 5, 7 and 9. Brahmans showed a similarbut less pronounced distribution to that of the buffaloes. The scapula was an exception in the forequarter of thebuffaloes. It was lighter relative to the other breeds with clearly enlarged mm. supraspinatus and infraspinatusbut a lighter m. subscapularis. It is suggested that these distribution differences reflect the traction history ofbuffaloes and Brahmans.
INTRODUCTION
Cattle were domesticated about 4000 to 6000years B.C. (Zeuner 1963) although carbon-datedJericho discoveries suggest that domesticationmay have occurred as early as 10,000 years B.C.(Boston 1963). The earliest domestication wasin Mesopotamia and North West India.
Ploughing and the haulage of two-wheeledcarts were practiced in the Mohenjodaro areaabout 3000 years B.C. and Banjaras carried merchandise on pack bullocks (Von FiirerHaimendorf 1963). Rouse (1972) and Porter(1991) noted that the muscular power of cattle,particularly zebus, was used for transport andploughing on most of the Indian sub-continent.Zeuner (1963) produced evidence that Bosprimigenius namadicus had been in India beforeearly Man and it showed several features in
common with the zebu. The muscle power ofcattle, particularly zebus, has been used for raising water, draft, cultivation, transport and haulage. Innumerable descendants of zebu nativestock have found their way to Africa and SouthEast Asia where they have been used as beasts ofburden (Wheaton-Smith 1963).
The Buffalo has a 5000 year history, authenticated on seals struck in the Indus Valley, suggesting that by then, it had already been domesticated (Anon 1981). It was in use, in China,4000 years ago where its legendary strength wasused to supply farm power. It is now used as a"living tractor" in South China, Thailand, Indonesia, Philippines, India and Pakistan. In Egypt,it is the most important domestic animal (Anon1981).

E.R. JOHNSON, D.D. CHARLES & DA. BAKER
*Johnson, Charles and Baker, from 100 totalanatomical dissections
Ossa coxa 11Patella 0.7Femur 11Tibia + tarsus 10Lumbar vertebrae and 3 ribs 10Scapula 5.3Humerus 9Radius/ulna + carpus 8Sternum + costal cartilages 7Cervical vertebrae 7Thoracic vertebrae + 10 ribs 21
In the rice fields, the swamp buffalo (Bubalusbubalis) is generally preferred to cattle (oxen) asa draft animal because of its slow, steady capacityfor work (Rouse 1972). The animal is used forploughing, harrowing and hauling loaded carts.
The yoke on the working buffalo in Asia haschanged very little in the last 1500 years (Anon1981) . This hard, wooden yoke presses on avery small area, about 200 square centimetres,on top of the animal's neck, which probably hasnot enabled it to exert its full pulling power.
In the current study, the muscle weightdistribution and bone weight distribution of thecarcass are examined in castrated male swampbuffaloes (Bubalus bubalis) and compared withthe distributions in Bos indicus and Bos Taurussteers.
Bone or bone groups
TABLE 2
Approximate proportionof total bone weight (%)*
MATERIALS AND METHODS
Fifteen swamp buffalo (Bubalus bubalis) steersand fifteen steers each of Angus, Hereford andBrahman breeds were slaughtered, dressed andchilled at 3°C. A side from each carcass wasdissected into individual muscles, bones or bonegroups, fat and connective tissue using the technique described by Butterfield (1963). Individualmuscles were combined into nine "standard"muscle groups (SMG's) and the bones into 11bones or bone groups as shown in Tables 1 and2.
Some details of the carcasses are shown inTable 3.
Tests of significance were conducted for thedistribution of muscle and bone among the fourgroups of steers.
RESULTS
The differences in muscle weight distribution ofeach Standard Muscle Group (SMG) are shownin Table 4. Buffalo and Brahman steers had lessmuscle in the spinal (SMG 3) and abdominal(SMG4) groups than Angus and Hereford steers.Buffaloes generally, had a greater weight ofmuscle concentrated in the forequarters, particularly the shoulder (SMG 5), thorax to shoulder (SMG 7) and intrinsic muscles of the neck(SMG 9). Brahman steers generally, had moremuscle concentrated in the proximal hind limb(SMG 1), neck to shoulder (SMG 8) and intrinsic muscles of the neck (SMG 9). Relative to theHerefords, Angus steers showed a lower proportion of hind leg muscles (SMG 1 and SMG 2)
Standard muscle group(Butterfield 1963)
123
456789
TABLE 1
Description Approximate proportion oftotal muscle weight (%)*
Muscles of the proximal pelvic limb 32Muscles of the distal pelvic limb 4.5Surrounding spinal column in thorax 12and lumbar regionsAbdominal muscles 10Muscles of proximal forelimb 11Muscles of distal forelimb 2.5Muscles of thorax attaching to forelimb 10Muscles of neck attaching to forelimb 7Intrinsic muscles of neck and thorax 10
* Johnson, Charles and Baker, from 100 total anatomical dissections
20 PERTANIKAJ. TROP. ACRIC. SCI. VOL. 25 NO.1, 2002

DISTRIBUTION OF MUSCLE & BONE WEIGHT IN BUBALUS BUBAllS, BOS INDICUS & BOS TAURUS STEERS
TABLE 3Details* of Bubalus bubalis, Bos taurus and Bos indicus carcasses
Description Buffalo Angus Hereford Brahman
Chilled carcass 169 - 260 176 - 390 95 - 273 46 - 347weight (kg) 208.6 271.2 163.7 266.5
(27.4) (68.3) (49.7) (53.1)Age (months) 24 - 46 16 - 42 15 - 22 12 - 38
29.4 25.9 18.7 23.7(5.0) (9.8) (2.5) (10.6)
Carcass CompositionMuscle 58.3 - 69.7 51.4 - 63.3 50.2 - 65.5 55.3 - 65.5
64.8 57.1 61.5 60.8(3.6) (3.6) (4.5) (3.1)
Bone 13.3 - 18.0 10.6 - 17.1 12.6 - 22.0 12.1 - 23.115.3 12.8 16.1 15.4(1.4) (1.7) (2.8) (3.2)
Fat 8.6 - 25.5 20.1 - 36.4 9.1 - 35.3 13.4 - 30.317.0 28.1 19.7 21.7(5.1) (5.0) (7.3) (5.1)
* Range and mean with standard deviation shown in parenthesis
TABLE 4Muscle weight distribution of the standard muscle groups
Standard Muscle weight distribution (%)muscle group
Angus Hereford Brahman Buffalo
1 31.6a 32P 33.3 31.7a
2 4.4b 4.8a 4.5bc 4.7ac
3 12.5a 12.6a 12.1 10.54 10.5 9.4b 8.7a 9.Pb5 l1.2b l1.5a l1.2ab 12.46 2.5b 2.7a 2.6ab 2.7a
7 10.Pb 9.8b 9.1 10.P8 7.0b 6.9b 7.6a 7.3ab
9 9.5b 9.3b 10.P 10.2a
Means with the same superscript are not significantly different (P<0.05)
and forelimb muscles (SMG 5 and SMG 6), buta greater proportion of abdominal (SMG 4) andthorax to shoulder (SMG 7) muscles.
Buffaloes showed a shift in their musculature towards the shoulder, thorax and cervicalregions. Brahman steers showed a similar, butless spectacular shift, towards the neck and shoulder region. They also showed an increase ofabout 1.5% in the muscles of the proximalpelvic limb where some of the carcass's mostexpensive cuts are located.
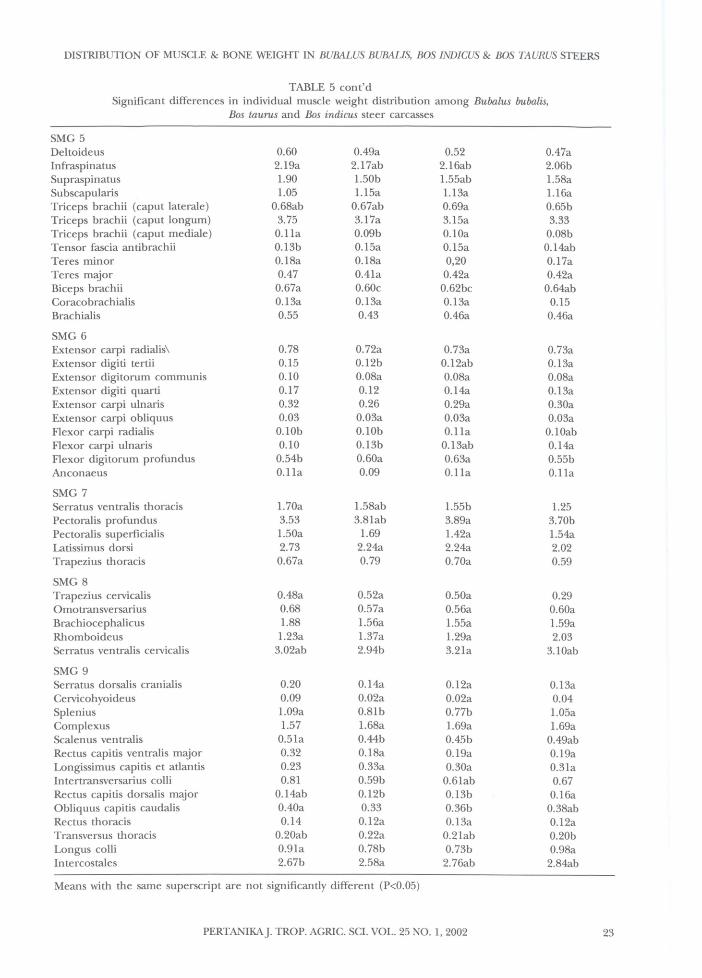
Table 5 shows the significantly different individual muscle weight distributions among thefour steer groups, listed according to the SMG.
The lowered distribution of SMG 3 andSMG 4 in the buffaloes and Brahmans was supported by the individual muscle weight distribution study. Buffaloes had much less m. longissimus thoraas et lumborum (1.3% to 1.7%). psoasmuscles and mm. scalenus dorsalis, multifidus dorsiand quadratus lumborum. Brahmans had less m.longissimus thoraas et lumborum and less mm. scalenus dorsalis, iliocostalis and spinalis dorsi.
In SMG 4, buffaloes had generally less offour major muscles (mm. obliquus internusabdominis, obliquus externus abdominis, transversusabdominis and rectus abdominis). The Brahmansteers, like the buffaloes, had less mm. obliquus
PERTANIKAJ. TRap. AGRIC. SCI. VOL. 25 NO.1, 2002 21
E.R. JOHNSON, D.D. CHARLES & DA. BAKER
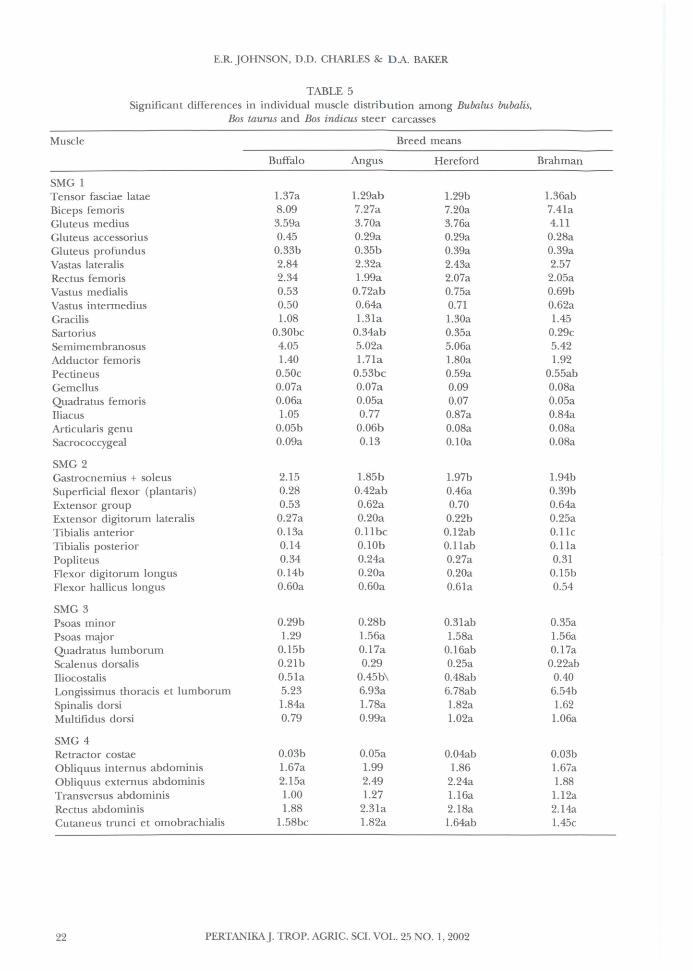
TABLE 5Significant differences in individual muscle distribution among Bubalus bubalis,
Bos taurus and Bos indicus steer carcasses
Muscle Breed means
Buffalo Angus Hereford Brahman
SMG 1Tensor fasciae latae 1.37a 1.29ab 1.29b 1.36abBiceps femoris 8.09 7.27a 7.20a 7.41aGluteus medius 3.59a 3.70a 3.76a 4.11Gluteus accessorius 0.45 0.29a 0.29a 0.28aGluteus profundus 0.33b 0.35b 0.39a 0.39aVastas lateralis 2.84 2.32a 2.43a 2.57Rectus femoris 2.34 1.99a 2.07a 2.05aVastus medialis 0.53 0.72ab 0.75a 0.69bVastus intermedius 0.50 0.64a 0.71 0.62aGracilis 1.08 1.31a 1.30a 1.45Sartorius 0.30bc 0.34ab 0.35a 0.29cSerrtiInembranosus 4.05 5.02a 5.06a 5.42Adductor femoris 1.40 1.71a 1.80a 1.92Pectineus 0.50c 0.53bc 0.59a 0.55abGemellus 0.07a 0.07a 0.09 0.08aQuadratus femoris 0.06a 0.05a 0.07 0.05aIliacus 1.05 0.77 0.87a 0.84aArticularis genu 0.05b 0.06b 0.08a 0.08aSacrococcygeal 0.09a 0.13 O.lOa 0.08a
SMG 2Gastrocnemius + soleus 2.15 1.85b 1.97b 1.94bSuperficial flexor (plantaris) 0.28 0.42ab 0.46a 0.39bExtensor group 0.53 0.62a 0.70 0.64aExtensor digitorum lateralis 0.27a 0.20a 0.22b 0.25aTibialis anterior 0.13a O.llbc 0.12ab O.llcTibialis posterior 0.14 O.lOb O.llab O.llaPopliteus 0.34 0.24a 0.27a 0.31Flexor digitorum longus O.14b 0.20a 0.20a 0.15bFlexor hallicus longus 0.60a 0.60a 0.61a 0.54
SMG 3Psoas minor 0.29b 0.28b 0.31ab 0.35aPsoas major 1.29 1.56a 1.58a 1.56aQuadratus lumborum 0.15b 0.17a 0.16ab 0.17aScalenus dorsalis 0.21b 0.29 0.25a 0.22abIliocostalis 0.51a 0.45b\ 0.48ab 0.40Longissimus thoracis et lumborum 5.23 6.93a 6.78ab 6.54bSpinalis dorsi 1.84a 1.78a 1.82a 1.62Multifidus dorsi 0.79 0.99a 1.02a 1.06a
SMG 4Retractor costae 0.03b 0.05a 0.04ab 0.03bObliquus internus abdominis 1.67a 1.99 1.86 1.67aObliquus externus abdominis 2.15a 2.49 2.24a 1.88Transversus abdominis 1.00 1.27 1.16a 1.12aRectus abdominis 1.88 2.31a 2.18a 2.14aCutaneus trunci et omobrachialis 1.58bc 1.82a 1.64ab 1.45c
22 PERTANlKAJ. TROP. ACRIC. SCI. VOL. 25 NO.1, 2002
DISTRIBUTION OF MUSCLE & BONE WEIGHT IN BUBALUS BUBALIS, BOS INDICUS & BOS TAURUS STEERS
TABLE 5 cont'dSignificant differences in individual muscle weight distribution among Bubalus bubalis,
Bos taurus and Bos indicus steer carcasses
SMG 5Deltoideus 0.60 Oo49a 0.52 Oo47aInfraspinatus 2.19a 2.17ab 2.16ab 2.06bSupraspinatus 1.90 1.50b 1.55ab 1.58aSubscapularis 1.05 1.15a 1.13a 1.16aTriceps brachii (caput laterale) 0.68ab 0.67ab 0.69a 0.65bTriceps brachii (caput longum) 3.75 3.17a 3.15a 3.33Triceps brachii (caput mediale) O.l1a 0.09b 0.10a 0.08bTensor fascia antibrachii 0.13b 0.15a 0.15a 0.14abTeres minor 0.18a 0.18a 0,20 0.17aTeres major 0047 Oo41a Oo42a Oo42aBiceps brachii 0.67a 0.60c 0.62bc 0.64abCoracobrachialis 0.13a 0.13a 0.13a 0.15Brachialis 0.55 0043 Oo46a Oo46a
SMG 6Extensor carpi radialis\ 0.78 0.72a 0.73a 0.73aExtensor digiti tertii 0.15 0.12b 0.12ab 0.13aExtensor digitorum communis 0.10 0.08a 0.08a 0.08aExtensor digiti quarti 0.17 0.12 0.14a 0.13aExtensor carpi ulnaris 0.32 0.26 0.29a 0.30aExtensor carpi obliquus 0.03 0.03a 0.03a 0.03aFlexor carpi radialis O.lOb O.lOb O.l1a 0.10abFlexor carpi ulnaris 0.10 0.13b 0.13ab 0.14aFlexor digitorum profundus 0.54b 0.60a 0.63a 0.55bAnconaeus O.l1a 0.09 O.lla O.l1a
SMG 7Serratus ventralis thoracis 1.70a 1.58ab 1.55b 1.25Pectoralis profundus 3.53 3.81ab 3.89a 3.70bPectoralis superficialis 1.50a 1.69 1.42a 1.54aLatissimus dorsi 2.73 2.24a 2.24a 2.02Trapezius thoracis 0.67a 0.79 0.70a 0.59
SMG 8Trapezius cervicalis Oo48a 0.52a 0.50a 0.29Omotransversarius 0.68 0.57a 0.56a 0.60aBrachiocephalicus 1.88 1.56a 1.55a 1.59aRhomboideus 1.23a 1.37a 1.29a 2.03Serratus ventralis cervicalis 3.02ab 2.94b 3.21a 3.10ab
SMG9Serratus dorsalis cranialis 0.20 0.14a 0.12a 0.13aCervicohyoideus 0.09 0.02a 0.02a 0.04Splenius 1.09a 0.81b 0.77b 1.05aComplexus 1.57 1.68a 1.69a 1.69aScalenus ventralis 0.51a Oo44b Oo45b Oo49abRectus capitis ventralis major 0.32 0.18a 0.19a 0.19aLongissimus capitis et atlantis 0.23 0.33a 0.30a 0.3laIntertransversarius colli 0.81 0.59b 0.61ab 0.67Rectus capitis dorsalis major 0.14ab 0.12b 0.13b 0.16aObliquus capitis caudalis Oo4Oa 0.33 0.36b 0.38abRectus thoracis 0.14 0.12a 0.13a 0.12aTransversus thoracis 0.20ab 0.22a 0.21ab 0.20bLongus colli 0.91a 0.78b 0.73b 0.98aIntercostales 2.67b 2.58a 2.76ab 2.84ab
Means with the same superscript are not significantly different (P<0.05)
PERTANIKAJ. TROP. AGRIC. SCI. VOL. 25 0.1,2002 23
E.R. JOHNSON, D.D. CHARLES & DA. BAKER
internus abdominis, obliquus externus abdominis andcutaneous trunci et omobrachialis.
The greater muscle weight distribution inthe buffalo forequarter occurred in SMGs 5, 7and 9. In the latter group, the buffaloes andBrahmans had a similar distribution. In SMG 5,eight muscles were hypertrophied (mm. deltoideus, infraspinatus, supraspinatus, teres major,brachialis and all three heads of the tricepsgroup). It should be noted that, concurrent withthe relatively lighter scapula, although mm. infraspinatus and supraspinatus were enlarged, m. subscapularis was relatively lighter. In SMG 6, thebuffaloes showed a relative enlargement of allsix extensor muscles. In SMG 7, the enlargedmuscles were mm. serratus ventralis thoricis andlatissimus dorsi. In SMG 9, the buffaloes showedan enlargement of nine muscles, particularlymm. splenius and intertransversarii cervicis. Buffaloes and Brahmans, generally, had less of all themajor muscles in SMG 4.
The Brahman steers showed a relative enlargement of muscles in SMGs 1, 8 and 9. InSMG 1, they showed increased distribution inmm. tensor fasciae latae, gluteus medius, gluteusprofundus, vastus lateralis and rectus femoris. Mostof these are large muscles and clearly explainthe superior distribution of the Brahman's proximal hindlimb musculature. In SMG 8, the Brahmans showed an increased distribution in mm.rhomboideus and serratus ventralis cervicis. In SMG9, the Brahmans were relatively hypertrophiedin six large muscles, mm. scalenus ventralis, splenius, complexus, longus colli, longissimus capitis etatlantis and intercostales.
Relative to Herefords and Brahmans, Angusshowed less muscle in the large muscles of SMG1 (mm. biceps femoris, gluteus medius, gluteus profundus, vastus lateralis, rectus femoris, semimembranosus and adductor femoris); SMG 2 (m. gastrocnemiuset soleus, the extensor group, extensor digitorum lateralis, papliteus and both tibial muscles); SMG 5 (mm.deltoideus, supraspinatus, biceps brachii, brachialisand the long and medial heads of the tricepsgroup); SMG 6 (mm. flexor carpi radialis, flexorcarpi ulnaris and a number of small extensors).Relative to the Herefords and Brahmans, theAngus steers showed a greater proportion ofmuscle in SMG 4 (mm. obliquus internus abdominis,obliquus externus abdominis, and transversusabdominis) and SMG 7 (mm. serratus ventralisthoricis, trapezius thoracis and both pectoral muscles) .
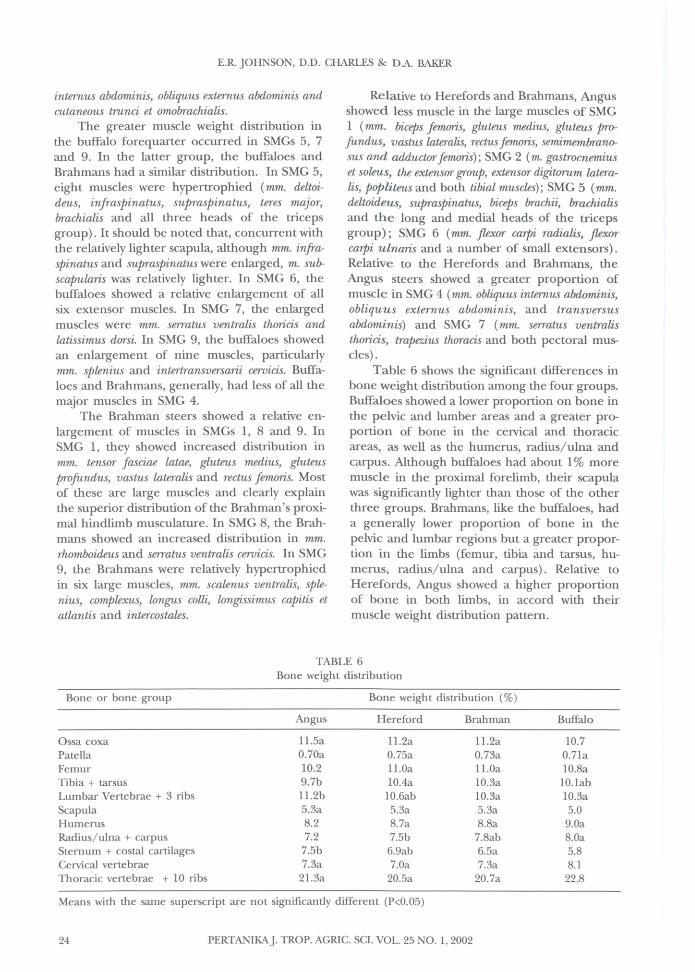
Table 6 shows the significant differences inbone weight distribution among the four groups.Buffaloes showed a lower proportion on bone inthe pelvic and lumber areas and a greater proportion of bone in the cervical and thoracicareas, as well as the humerus, radius/ulna andcarpus. Although buffaloes had about 1% moremuscle in the proximal forelimb, their scapulawas significantly lighter than those of the otherthree groups. Brahmans, like the buffaloes, hada generally lower proportion of bone in thepelvic and lumbar regions but a greater proportion in the limbs (femur, tibia and tarsus, humerus, radius/ulna and carpus). Relative toHerefords, Angus showed a higher proportionof bone in both limbs, in accord with theirmuscle weight distribution pattern.
TABLE 6Bone weight distribution
Bone or bone group Bone weight distribution (%)
Angus Hereford Brahman Buffalo
Ossa coxa 1l.5a 1l.2a 1l.2a 10.7Patella 0.70a 0.75a 0.73a 0.7laFemur 10.2 ll.Oa ll.Oa 10.8aTibia + tarsus 9.7b 10.4a 10.3a 10.labLumbar Vertebrae + 3 ribs 11.2b 10.6ab 10.3a 10.3aScapula 5.3a 5.3a 5.3a 5.0Humerus 8.2 8.7a 8.8a 9.0aRadius/ulna + carpus 7.2 7.5b 7.8ab 8.0aSternum + costal cartilages 7.5b 6.9ab 6.5a 5.8Cervical vertebrae 7.3a 7.0a 7.3a 8.1Thoracic vertebrae + 10 ribs 2l.3a 20.5a 20.7a 22.8
Means with the same superscript are not significantly different (P<0.05)
24 PERTANIKAJ. TROP. ACRIC. SCI. VOL. 25 NO.1, 2002

DISTRIBUTION OF MUSCLE & BONE WEIGHT IN BUBALUS BUBAllS, BOS INDICUS & BOS TAURUS STEERS
DISCUSSION
The Australian water buffalo was introducedfrom Timor in 1825 (Letts 1972). In South EastAsia, the buffalo has long been preferred tocattle as the primary beast of burden. In Australia, over the last 170 years, it has not beenused for traction.
Relative to cattle, the buffalo has concentrated more muscle in the forequarter, particularly muscles of the proximal and distal forelimb, thorax to forelimb, and muscles of theneck. This is supported by the bone weightdistribution, which shows heavier bone in thecervical and thoracic areas, humerus, radius/ulna and carpus. A notable exception was thescapula, which was lighter in the buffalo than inthe three breeds of cattle.
The individual muscle weight distributionstudy supported the fmdings of the SMGs, withrelatively hypertrophied muscles in the shoulder(eight in SMG 5), distal forelimb (seven in SMG6), thorax to shoulder (two large muscles inSMG 7) and the intrinsic muscles of the neck(nine in SMG 9). The buffalo showed a reduction in muscle weight distribution in the spinalmuscles (four in SMG 3, including a great reduction in m. longissimus et lumborum) andthe abdominal muscle group (five expansivemuscles in SMG 4). The Brahman steers showeda similar decrease in distribution in these twomuscle groups, but an increase in 15 muscles ofthe three groups, proximal hindlimb (SMG 1),neck to shoulder (SMG 8) and the intrinsicmuscles of the neck (SMG 9).
Relative to Herefords and Brahmans, theAngus showed a reduction in muscle weightdistribution in 21 muscles of the proximal anddistal hindlimb, shoulder and distal forelimb.This group of steers had a markedly increaseddistribution in the abdominal and thorax toshoulder groups of muscles.
In relation to the shoulder area (SMGs 5and 7), the buffaloes showed an increased weightdistribution in nine muscles including mm. supraspinatus, infraspinatus, deltoideus, serratus ventralis thancis, latissimus dorsi and the two heads ofthe triceps group, however, m. subscapularis waslighter.
Relative to Angus and Hereford steers, Brahmans showed evidence of a shift in muscle andbone weight distribution to the forequarter, although not as pronounced as in the buffalo.
The Brahmans had an increased weight of neckto forelimb muscles and intrinsic muscles of theneck. The limb bones of Brahman steers, femur,tibia/tarsus, humerus, radius/ulna and carpuswere generally heavier than in the other cattle,particularly the Angus. Brahmans had significantly more muscle (1.2% to 1.7%) in the proximal hind limb than in the other three groups.This is the site of some relatively expensive cutsof meat, thick flank, topside and silverside whichconfers on this breed a meat production advantage which has been recognized from detailedanatomical studies (Priyanto 1993; Priyanto,Johnson and Taylor unpublished).
Herefords differed from Angus, showingmore muscle in the limbs (SMGs 1, 2, 5 and 6)and less in the abdominal group (SMG 4). Angushad heavier bone in the sternum and costalcartilages and in the lumbar vertebrae and lastthree ribs.
The significantly lighter scapula and m. subscapularis in buffaloes may be related to thewooden yoke, which has not changed for at least1500 years, and this probably prevents the animal from exerting its full pulling power (Anon1981). It has been estimated that the use of apadded horse collar would allow the buffalo topull 24% heavier weights. An impeded scapulamay have become more compact and lighterwhile increasing the weight of the muscles clothing the outside of it.
The higher proportion of the weight ofmuscle in the buffaloes and Brahmans relativeto that in Herefords and Angus is possibly aresult of their draft animal ancestry. The difference was more pronounced in the buffalo, whichhas been the preferred beast of burden in Chinaand South East Asia for 4000 years.
ACKNOWLEDGEMENT
We are indebted to Mr. Mal Fisher and Miss LynKnott for technical assistance.
REFERENCES
ANON. 1981. The Water Buffalo: New Prospects of anUnderutilized Animal. Washington: NationalAcademy Press.
BOSTON, EJ. 1963. Cattle breeds in Europe andMrica. In Man and Cattle ed. AE. Mourantand F.E. Zeuner. London: Royal Anthropological Institute.
PERTANIKAJ. TRap. AGRIC. SCI. VOL. 25 NO.1, 2002 25
E.R. JOHNSON, D.D. CHARLES & DA. BAKER
BUTIERFIELD, R.M. 1963. Estimation of carcase composition: The anatomical approach. In Symposium of Carcase Composition and Appraisal ofMeatAnimals, ed. D.E. Tribe, Pap. No 4 (CSIROAust: Melbourne).
LETTS, G.A 1972. Water Buffalo in Australia. Acollection of papers related to the NorthernTerritory Buffalo Industry. In Ninth BiennialConference of the Australian Society of Animal Production, Canberra.
PRIYANTO, R. 1993. A study of the growth and distribution of beef carcass tissues including theirprediction, optimum beef productivity andmarketing. Ph.D. Thesis, The University ofQueensland, Brisbane.
PORTER, V. 1991. Cattle. A Handbook to the Breeds ofthe World. Facts on File. New York.
ROUSE, J.E. 1972. World Cattle II. Cattle of Africa andAsia. Norman: University of Oklahoma Press.
VON FURER-HArMENDORF, C. 1963. The Social Background of Cattle - Domestication in India. InMan and Cattle ed. AE. Mourant and F.E.Zeuner. London: Royal Anthropological Institute.
WHEATON-SMITH, C. 1963. Study in Progressive Hybridization. In Man and Cattle ed. AE. Mourantand F.E. Zeuner. London: Royal Anthropological Institute.
ZEUNER, F.E. 1963. The History of Domestication ofCattle. In Man and Cattle ed. AE. Mourant andF.E. Zeuner. London: Royal AnthropologicalInstitute.
(Received: 3 September 1998)(Accepted: 14 January 2002)
26 PERTANlKAJ. TROP. AGRIC. SCI. VOL. 25 NO.1, 2002