
THE DIMENSIONAL BETWEERI THE CRANIAL BASE, BODY … · The Dimcnsional Rettionships Between th -1...
95
THE DIMENSIONAL RELATIONSHIPS BETWEERI THE CRANIAL BASE, BODY HEIGHT, AND THE FACIAL COMPLEX. A thesis submitted in conformity with the requirements for the degree of Master of Science Faculty of Dentistry Discipline of Orthodontics University of Toronto Wopyright by Rana Targownik, 2001
Transcript of THE DIMENSIONAL BETWEERI THE CRANIAL BASE, BODY … · The Dimcnsional Rettionships Between th -1...

THE DIMENSIONAL RELATIONSHIPS BETWEERI THE CRANIAL BASE, BODY HEIGHT, AND THE FACIAL COMPLEX.
A thesis submitted in conformity with the requirements for the degree of Master of Science
Faculty of Dentistry Discipline of Orthodontics
University of Toronto
Wopyright by Rana Targownik, 2001

National Cibrary Bibliothèque nationale du Canada
Acquisitions and Acquisitions et Bibliographie Services services bibliographiques 395 WeIiington Street 395. rue Wellington OctawaON K l A W U OtiawaON K1A ON4 canada Canada
The author has granted a non- exclusive licence allowing the National Library of Canada to reproduce, loan, distribute or seil copies of this thesis in microfom, paper or electronic formats.
The author retains ownership of the copyright in this thesis. Neither the thesis nor substantial extracts £rom it may be printed or otherwise reproduced without the author's permission.
L'auteur a accordé une licence non exclusive permettant à la Bibliothèque nationale du Canada de reproduire, prêter, distribuer ou vendre des copies de cette thèse sous la fome de microfiche/fi~m, de reproduction sur papier ou sur format électronique.
L'auteur conserve la propriété du droit d'auteur qui protège cette thèse. Ni la thèse ni des extraits substantiels de celle-ci ne doivent être imprimés ou autrement reproduits sans son autorisation.

The Dimcnsional Rettionships Between t h -1 Base, Body Height, and the Facial Cornplex. R Taxgowdc, B Tompson, RB ROSS, DG Woodside. Master of Science (2001), Discipline of Ortbodontics, University of Toronto
ABSTRACX
The a- of this snidy were to investigate the dimensional rektionships between the
cranial base, body heght, and the facial complex and to establish a method of size
adjusting hear masuremenu d e n cornpuhg groups with overall size differences. Data
were obtained from lateral cephalomeuic radiographs, uacings, and history profiles of 117
onhodonticdy unneated males (ages 12 and 18 +) from the University of Toronto's
Burlington G m d Srudy.
'Zhe total cania base length (either NBa or {S-N + S-Ba)) and body height dispiayed
the snongest cornlaions to the linear facial dimensions. At age 12, smng comlations
(rs.4) existed between {S-N + S-Ba} and m&bular length, upper face height, and body
height N B a smngiy correlated to niaiollary iengrh At age 18+, the comlations to
mandibular length and upper face height weakened. Body height comlated suongly to
rnandi'bular length and upper face height at both ages.
Independent t-tests demonsmted that children who were short, or who had small total
c d base lengths exhibited smaller linear facial dimensions than children who were d e r
or had longer total cranial base lengthr; t h e ~ b ~ validating the need for linear size adjusùng
among diveae populations. Equations were generated that p~dic ted the adjusted hear
facial dimensions based on known total c d base length and body height.
The evidence suggested that size adjusting was statistically valid when studying
populations that differed in overall body, cranial base, and face size, where cornparisons
of absolute measurements would otherwise be invalid. This is especially important when
comparing groups with craniofacial anomalies.

ACKNOWLEDGEMENTS
I wodd like to thank the following people for their invahiable assistance with this ~ s e a r c h
endeavor:
Dr. Bruce Ross for the direction to begin this thesis and for his ongoing fascination wirh
the c d base
Dr. Bi)an Tompson and Dr. Don Woodside for their suggestions and supervision as
rnembea of my cornmittee
Dr. Hexenia Lawrence who provided me with inc~dibly helpfd statistical guidance
Joanne Hoffmekter and Gemude Jorgensen d o assisted with organUation of the
dographic records
My parents for instilling in me a smng wotk ethic and the confidence to
realue my dreams.
My brother and sister for king unique individuals d o taught and challenged me with
their differiences.
And to Morris: my fiancé, my best friend and my one mie love, 1 thank p u for the
unwavering support.

TABLE OF GONTENTS . .
ABSTRACT' ................................................................................................ u . . . ACKNOWLEDGEMENCLS .................................................................... UI
TABLE OF CONTENT5 ....................................................................... iv . . LIST OF TABLES .................................................................................... vii
LIST OF FIGURES .................................................................................. k
1 STATEMENT OF THE PROBLEM ...................................................... 1
II SIGNIFICANCE OF ï H E PROBLEM ................................................ 3
CHAPTER 2
GENETiC AND ENVIRONMENTAL CDNTRIBUI'iON!5 TO DEVELOPMENT OF THE CRANIAL BASE ............................................................................. 4
EMBRYOLOGICAL ORIGIN OF THE CRANIAL BASE AND FACIAL STRlKfIZlRES ................................................... 6 A TheGandBase ................................................................................. 6 B . CianialBase Anghion .................................................................... 9
................................................................................. C Facial Svuctu~es 9
POST-NATAL GROWTH AND DEVELOPMENT OF THE CRANIAL BASE ................................................................... 10
................................................................... A D e f i i the G a n d Base 11 i) Anterior Ganial Base ............................................................. 12 ii) Posterior Cranial Base .......................................................... 13
................................................................. h) Total Ganial Base 14 B . Gmwth Pattern of the Gania Base .................................................. 14 C Cessation of Growth of the Gand Base .......................................... 16
i) Anteior C d Base .............................................................. 16 ............................................................ ii) Posterior Ganial Base 18
hi Total Ganiai Base .................................................................. 20
VARIATIONS OF CRANIAL BASE REFERENCE LINES ............................................ FOR SUPERIMPOSITION PURPOSES 20
.......................................................................... A Antenor Cranial Base 20 . . . .......................................................................... 3 Reprodwbhty 20 . ......................................................................... B Posterior G d a l Base 22
............................................................................... C Total Ganial Base 22

V RELATiONSHIPS BETWEEN THE . BASE AND FAClAL AND SKELETAL DEVELOPMENT ..................... 23 A The Relationship of Cranial Base Length to l h x i h y
and Mandibuiar Lengths ............................................................. 26 B . The Reiarionship of Ganial Base Length to Body Hkight ........... 28 C The Reiarionship of ....... Base Length to G a d
Base F k m ....................................................... 28 D . The Relationship of Ganial Base Length to N a d Length .......... 30 E . ï h e Relationship of G.anial Base Le& to Face He&ts .......... 30 F . Defects involving the Gand Base and the Influence on
Facial Development ............................................... 31
VI CRANIAL BASE LENGTH IN ADULTS WITH VARIOUS MORMONAL DISORDERS ................................................ 32 A Childmn wah and Ylperthyroidisrn ............................ 33
.......... . B Children with Defiient and Excessive Gmwth Hormone 33 .............................. C Qddren Born S d for Gestational Age 34
. ............................................. D Boys with Delayed Puberty 35 E . Ad& with Achondroplasia ............................................ 35
METkiODS AND MATE RIALS ............................................... 37
II SAMPLE ............................................................................... 37 A Chamteristics of the Popuiation Selected from the
................................................... Burikgton Study 37 B . Ages of the Sample Pupularion ........................................... 38
III ANALYSIS OF THE RECORDS ...................................... 38 A Tmcing the Records ..................................................... 38
................................................. . B Cephalomeuic A n a i ~ i s 39 C Statisticai Methodology .................................................. 41
........................................................................... RESULTS 43
1 DESCRIPTIVE ANALYSES ............................................. 43 II CORRELATIONS BETWEEN THE CRANIAL BASE.
BODY HEIGHT. AM> THE FACIAL CDMPLEX ................. 45
III BIVARIATE ANALYSES ................................................ 49
......................................... IV ANALBIS OF COVARIANCE 52
V WNE AR REGRESSION .................................................. 57

DISCUSSION ....................................................................................... 58
..................................................................................... II CORRELAnONS 58 ............................................................................ A. Anterior G a n d Base 58
. ........................................................................ B Postenor Ganial Base 60 .................................................................................. C T o d Cianial Base 61
........................................................................................... D . Body Wight 62
III BIVARIATE ANALYSES ..................................................................... 64
V LINEAR REGRESSION ........................................................................ 68
CONCLUSIONS ................................................................................... 70
...................... ...... SUGGE STIONS FOR FUTURE RE SE ARCH ... 72
REFERENCES .................................................................................................. 73
APPENDIX A: Definitions of Gdofacial L a n u .................................................................. 81
APPENDIX B: ........................................... The Cianial Base in Relation to the Facd Cornplex 82
APPENDIX C; Examples of Comlationr B m e n the Ganial Base and the Facial Dimensions ................................................................................................... 83
APPENDIX D: Exampies of Differing Definitions of the Ganial Base ...................................... 84
APPENDXX E: List of Abbreviations ................................................................................................. 85
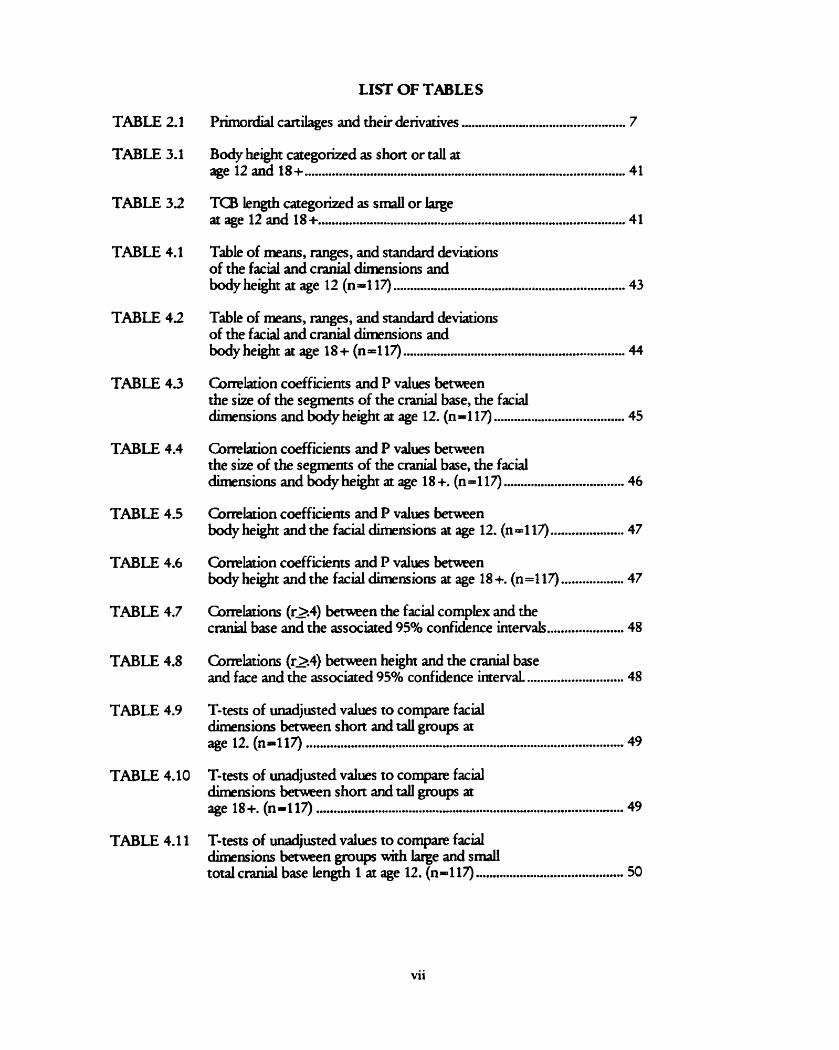
LI= OF TABLES
TABLE 2.1
TABLE 3.1
TABLE 32
TABLE 4.1
TABLE 4 2
TABLE 4.3
TABLE 4.4
TABLE 4.5
TABLE 4.6
TABLE 4.7
TABLE 4.8
TABLE 4.9
TABLE 4.1 1
Primordial cardages and their derivatives ................................................ 7
Body height categorized as short or ta11 at age 12 and 18+ .............................................................................................. 41 TCB length categorized as small or l q e
.......................................................................................... at age 12 and 18+ 41
Tabie of means, q e s , and standard devkions of the facd and c r d dimensions and
.................................................................... body height at age 12 (n4 17) 43
Table of means, ranges, and standard deviations of the facial and c d dimensions and
................................................................. body height a age 18 + (n -1 17) 44
Cornlarion coefficients and P values k e n the size of the segments of the c d base, the faciai
...................................... dimensions and body heght at age 12. (n- 1 17) 45
Comiation coefficients and P values between the size of the segments of the c r d base, the facial
................................... dLnensions and body height at age 18 +. (n-117) 46
Correlation coefficients and P values k e n body height and the facial dimensions ar age 12. (no1 il) ..................... 47 Comlation coefficients and P values b n body height and the facial dimmiom at age 18 +. (n -1 17) .................. 47 Correlations (r2.4) benmen the facial compLx and the
...................... c d base and the associated 95% confidence intervals 48
Correlations (-4) betwieen height and the c d base ............................ and face and the associated 950h confidence intervaL 48
T-tests of unadjusted values to compare faciai k n s i o m -en short and taIl groups at
............................................................................................. age 12. (n1117) 49
T-tests of unadjusted values to cornparie facial dimensions benmen short and call groups at age 18+. (n=117) ........................................................................................ 49
T-tests of unadjusted values to compare facial dimensions benmen gmup with krge and s m a l l
........................................... total craniai base length 1 at age 12. (n-117) 50
vii

TABLE 4.12
TABLE 4.13
TABLE 4.14
TABZ 4.15
TABLE 4.16
TABLE 4.17
TABLE 4.18
TABLE 4.19
TABLE 4.20
TABLE 421
TABLE 4.22
TABLE 423
TABLE 424
T-tests of d j u s t e d vaiues to compare fariai dimnsions becween groups with iarge and small
.......................................... t o d c d base kngth 2 ar age 12. (n=-117) 50
T-tem of unadjusted vaiues to compare faciai dimensions h n groups with iarge and small
........................................ totai c d base length 1 at age 18 +. (n- 1 17) 5 1
T-tem of unadjusted vaiues to compare facial dimensions bemmn groups wirh iarge and s d
........................................ total c d base length 2 at age 18 +. (n-117) 51
Adjusted R squared and sigdicance of the effects of body height and TCB on the facial dunensions at age 12 from ANOOVA &is. (n=117) ................................................. 52
Adjusted R squared and sigdicance of the effects of body height and TCB on the facial dimensions at age 18+ from ANOOVA modek. (n-117) .............................................. 53
Adjusted means and 95% confidence intervais of the facial dimensions for short and taIl groups conuollmg
................................................. for the covanate T a at age 12. (n- 1 17) 54
Adjusted means and 95% confidence internais of the facial dùnensions for short and tail groups conu~lluig for the c o v k e Ta3 at age 18 +. (n-117) ........................................ 54
Gmparison of adjurted and d j u s t e d means of facial dimensions ar age 12 where TCi3 is adjusted
....................................................................... to the gnnd mean. (N=li7) 55
Cornparison of adjusted and unadjusted mans of facial dimensions at age 18 + w h e ~ TCB is adjusted
..................................................... to the grand mean. (N-117). (n-117) 55
hkgmmde of difference in rneam k e n short and taii groups before and after adjusting for the c o v h e TCB at age 12. (n-117) ............................................................. 56
Magnitude of difference in maris b n short and t d groups befom and after adjusting for the
........................................................... covariate TCB at age 18 +. (n = 1 17) 56
Fomuiae for predrung means of the facial dimensions ushg height and mean total
....................................................... c r d base length ar age 12. (n-117) 57
Fonnulae for predming means of the facial dimensions using height and rnean total
.................................................... c d base length at age 18+. (n-117) 57

LIST OF FIGURES
FIGURE 2.1 Primordial Carulages of the Skuii Bare and their De rivarives ............... 7 FIGURE 2 2 Mi& Ganial Base .................................................................................. 14
FIGURE 2.3 Length of the Intemai ACB ........................................................................ 17 FIGURE2.4 N-SLength ................................................................................................... 17
FIGURE 2.5 Thickness of the Frontal Bone ................................................................... 18
FIGURE 2.6 S-Ba Length ............................................................................................. 19

INTRODUCTION
I STATEMENT OF THE PROBLEM
Cephalorneuic studies on facial growth or morphology employ linear, &, and
proportional measurements to compare groups of people. In doing so, many assume rhat the
groups are identical in terms of body size. Any significant differences in h e a r dimensions
are considered to be secondary to treatment or some other extianeous variable, but this is
not always the case. Overail size differences becween groups can arise a number of ways.
Diffemnces in age, gender or ethnic background can cause large variations in the size of the
body and craniofaciai suuctures arnong groups. A b n o d u e s in homonal, nutritional or
developmental statu may create a gene&d increase or decrease in o v e d size. If the
sample was randomly chosen, it may be that the individuais in one group are on avenge
smaller than the individuah in the other p w l y by chance. Radiographie technique is yet
another possible explanation for size differences. If f i were not taken in a standardized
rnanner, they can not be accurately compared.
The problems associated with linear measurements m u t be overcome. One way is to
develop a mechanisrn which would recognize the size differences berween diveise groups
and adjust the linear measurements to facilitate more accurate comparisons.
The major problem with rnany orthodontie studies is that the groups compared are
not simiiar in generai size and the differences in the absolute linear measurements are
misinterpreted In these cases, researchen and readen may faîsely conclude that differences
in a study were due to treatment insread of ~ a i u n g that the differences were due to inherent
problems of an unmatched sample. A method of size adjusting linear measurements would
addRss the problemr associated with faulty sample design.

The cranial base is the complex of bones that form the flwr of the canial cavity and
the roof of the face. Because of this location, gmwth of the c d base is often linked to
p w t h of the facial complex and it is genedy agreed that the c d base has considerable
influence on the developing facial morphology. In fact, the c d base may be the h e a r
s m i c n u e that serves as the foundation for size adjusting. Manystudies have related cranial
base form and flewre to degree of prognathism of the jaw bases. Hcwever, there is very
linle in the liteature mlatiug the size of the c d base to the absolute size of other facial
stmctwes and to the size of the body as a whole. If the cranial base size is strongly linked to
the facial skeleton and body height then it could feasibly serve as the basis for size adjusting
linear rneasurements.
SiLe adjusting all the facial dimensions would not be valid in cases where a
disturbance affecting the skeled suucnires is localized n i e presence of pathology,
ueatxnent, suigery or environmentai factors rnay affect some craniofacial suucnires and not
othen. In these instances, the c r d base may not be affected d e some of the iinear facd
svucnues are affeaed. For these cases, the influence of the disturbance should be
recognized locally and size adjusting performed only on the unaffected structures.
SIGNIFICANCE OF THE PROBLEM
It would be useful to demonstrate whether the size of the c r a d base is a direct
comlate to the size of other facial suurrures and to the o v e d body size of the population
as well. If this were proven to be true, then a group of chiidten srnall in stature and cranial
base wuld possess lesser facial dimensions than a group of larger children. This discovery
wouid highlght the need for "rnatched" samples in human research efforts. Body height and
o v e d size would become important parameten in study design. In cases where the study
had pcmrly matched samples, this mseamh is significant as it would yield a mechanism to size
adjust the groups and allow for more accuate evaluation of the findqs.
Of special interest are children with developrnental anomalies. These children tend
to be srnaller than the noms for their age. Often, when they are compared to their "nomial"
peers in snidies on facial morphology, the basic suucniral diffemnces between these IWO
groups are not considered and any absolute h e u resulu leave a fahe impression. For more
accuate and valid fidings, size adjusting is necessq to precisely relate the cranial base size
to body height and to the absolute sùe of suucnires in the facd cornplex.
Knodedge of these relationships would serve as an indispensable ~ference for
future scientific studies inves tigating c raniof a c d p w t h and morphology in dissimilar
populations.

LITERATURE REVIE W
1 GENETIC AND ENWRONMENTAL CONTRIBUTIONS TO DEVELOPMENT OF THE CRANIAL BASE
The field of orthdontics has k e n concemed with identifymg the relative contributions
of genetic and environmentai faon to craniofacial growth. Most of the hteratwr on
cranfofacial growth has focused on bonychanges. At first, it was thought thar bones were
geneticaily progammed to grow and were not influenced by outside factors. %=ver, over
time, the role of environmental factors was given credence and is now recognizd as a
crucial part of morphogenesis.
Sicher (1944) felt that growth of the bones was inherent and that the sutures acted as
growth centers to primarily direct growth. Gnveaely, othen believed that the function of
tissues and spaces determined the arnount and direction of growth. This concept was
induced by Van der Klaaw (1946) and emphasizeci later by Moss (1960). Thus, in their
opinions, the growing brain provided the impetus for growth of the cranium Bjork (1955)
suggested that antenor crand base (ACB) incmased in length because of s d gmwth but
that it did so to keep in step with the growing brain. He feh that posterior c r d base ( P a )
increased in length d y because of growth at the spheno-occipital synchondrosis.
Therefore, Bjork recognized both geneuc and environmental influences.
To discover the effect of heredity on the facial s keleton, Lundsmm (1954) snuied
fatemal and identicai twLis while Kraus (1959) lwked at fraternal and identical triplets.
Lundsmm found the genetic factors to be more significant than the non-genetic facto=
with respect to the dissimil~ties between fratemai twins. Regardmg identical rwins,
cephdornetric andysis revealed differences in facial suucnue. The non-genetic factors

responsible are probably the intemai environmenta facton that are active mainly early in
embryonic life. One example is that the genes thernselves rnay not express themselves
precisely, leading to stnrcwal alteratiom. Lundsnom quotes Dahlberg (1948) who said rhat
"giwn the ermernely complicated developrnent of the body one can hardly expect that, even
if we codd give two geneticaily identicd individuals the same extemal environments, they
would develop edyal ike". Kraus divided the head Mo tum parts, the facial complex and
the cranial complex, and uied to determine the influence of genetic and environmentai
factors. When the individuai parts of the calvarial bones and the c r a d base were ex;unined
it was impossible to discriminate between predominance of heredity or environment.
SLnilarly in the facial complex, Kraus recognized that aah so many complex interactions
o c c e simuitaneously the specific role of heredity (or environment) was difficult to
discem. K m then snidied bones in temis of their "profile linesn as seen in a cephalometxic
radograph. Me found that the profides superirnposed almost perfectly in identicd tiplets,
and very poorly in fiatemal triplets. Hk felt that this demonstrated that the morphologie
configuration of the skeietal units of the craniofacial complex were subject predominantly to
the influence of heredity. n i e strong presence that environmentai factors have is apparent in
the differiog soft tissue profides. Kaus felt that the bones have a multitude of inter- and
intra-relationships (non-genetically conuoled) f i c h combine to foxm the face and head
Enlow (1962) felt growth was a highly controiled process, modulated by remodehg
which conUnuously maintains the shape, proportions, and relationships of the various
~ g i o n s of bone. Van Limborgh (1983) thought gmwth of the c d base was largely due to
inuinsic factors that were genetic and inheritabie. In his view, environmental facton played
only a minor d e .

The philosophy to which most subscribe is that the facial bones aie geneticdy
prognmmed to grow in size, but through function are innuenced in form and
interrelationship, and then furrher modified by many external factors dong the way. As
Baume said, "Dunng the time of gmwth, heredity and function overlap in their rash as bone
pducing and bone forming elernents" (WatNk, 1972).
s-ry..
No definitive conclusions have been ~ a c h e d as to which factors predominate in
detennining the size and shape of the cranial base. An investigation into the p w t h
processes of the parts of cranial base gives some insight into the morphogenetic
pathways involved.
II EMBRYOLOGICAL ORIGIN OF THE CRANIAL BASE AND FACIAL STRUCI'URES
A. The Ganial Base:
Pre-natally, the entire cranial skeleton is a comective tissue framewok The eariiest
evidence of s M formation is in the fourth week intmuterine (Lu.). This is compaatively
iate considering that the brain, c d nerves, eps, and blooci vessels have akady begun
their development. In the late somite period, the occipital sclerotomai mesenchyme
concentrares arowid the notochord underiying the developing hindbrain. From this region,
the mesenchymal concentmion extends cephaiically and forms the floor of the brain
Conversion of the c d base mesenchyme into carulage starts at day 40 i.u.
Around the 8& week i.u., bone starrs CO form in the cantkge of the cranial base via
endochoncirai ossification. The formation of carulage is Liitially dependent on the pmsence
of the growing brain, and it requires an epithelial-mesenchyme interaction to have d e n
place.
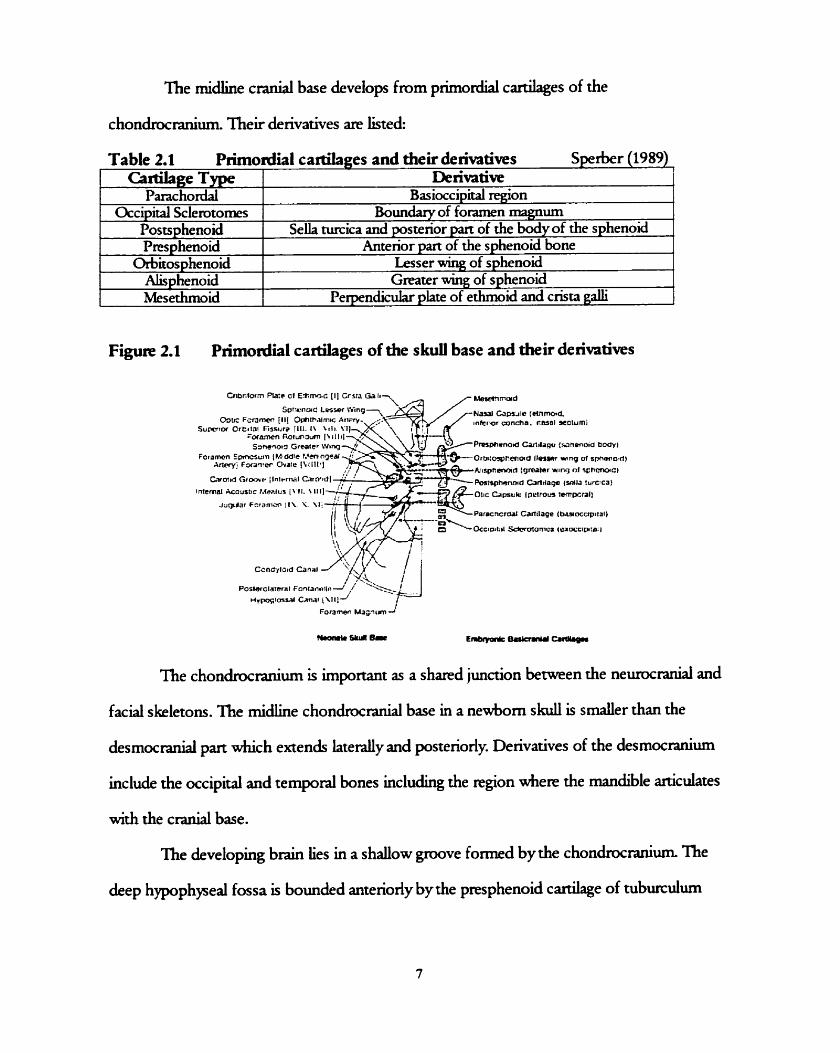
The midline c d base develops from piimordial cardages of the
chondrocranium. Their derivatives are listed:
F i g u ~ 2.1 Primordial cartilages of the s k d base and their deiivatives
Table 2.1 PNnordial cartilages and their deht ives S p e k r (1989)
The chondrocranium is important as a shared junction between the nemranial and
Cimkge Type Parachorda
Occipital Sclemtomes Postsphenoid Pres phenoid
Orbitosphenoid Alisphenoid Mesethmoici
faciai s keletons. The rnidline chonchranial base in a newborn skull is s d e r than the
Denvative Basioccipid region
Boundary of foramen magnum SeUa m i c a and posterior part of the body of the sphenoid
Anterior part of the sphenoid bone Lesser wing of sphenoid Greater wing of sphenoid
Perpendicular phte of ethmoid and crisu galli
desmocranial part which extends l a tedy and posteriorly. Derivatives of the desmocranium
include the occipital and temporal bones including the region where the mandible articulates
with the cranial base.
The developing brain lies in a shallow p v e f o m d by the chondrocmniwn. The
deep hypophyseal fossa is bounded antenody by the presphenoid cardage of tubu~icuiwn

seiiae and posteriorly by the postsphenoid canilage of the donurn seiiae. These canilages
foxm the seiia nircica and anterior and posterior parts of the sphenoid bone.
Some camlagiaous mmnants peaist between adjacent bones in the c d base.
These mas are known as synchondroses and are the areas where gmwth occurs. As with
most gmwth centers, a synchondrosis is believed to represent a pressure adapted mechanism
that allows for the lengthening of bone in a field of direct compression (Enlow, 1976).
Intra-uterine growth of the cranial base is highly uneven. It develops an irregular
shape to accommodate the undulating surface of the growing brain. The antexior and
postenor parts of the midline cranial base, divided at seiia m i c a , are known to grow at
different rates. Between the IO" to 40" weeks i.u, the A(B increases in length and width
sevenfold while the PCB increases only fivefold (Sperber, 1989). Pre-nady, the spheno-
occipital synchondrosis (SOS) does not conuibute to growth as much as it does post-nataliy.
Growth of the c d base initiallytakes place as a result of p w t h at the synchondroses,
and expansive forces originating from the p w i n g brain that displace the bones at the su-
lines. Specificaiiy, the sutures involved in antenor- postenor growth of the ACB are the
sphenefrontal, fmntczethmoida, and the spheno-ethmoidai. Many sutures fuse at the &ne
of birth or slightly thereafter, but the latter two continue to grow dter birth. Although the
s pheneethmoidal su- is known to persist und adolescence, desmolytic degene ration of
the cardage produces a suture that is of rninMal significance in postnatal growth (Sperber,
1989).

B. Crrnial Base Anguiatiorx
The c e n d region of the cranial base is composed of prpchordal and chordal pans
*ch meet at an angle at the sella m ica . In the sagittai plane, these pans form an angle
which is often ~ f e n e d to as the ''canial base angle" or NS-Ba In the 4 week old ernbqm,
this angle is initially obtuse (150 degrees). The angle flexes to about 130 degrees in the 7-8
week old embryo, and becomes even more acute at 10 weeks (120 degrees). As the head
staxts to raise, and the c d base begins to ossdjr, there is sLght opening of the angle back
up to 130 degrees. Thk angle is fairlystable pst-natdy. Flattening of the c r a d base angle
is thought to be caused by rapid brain p w t h in the fetai p e n d as the chondrocanium
mains its onginal obtuse angle in cases of anencephaiy (Sperber, 1989).
Facial S t n t c t u ~ ~ ~ :
The facial prirnordia begin to appear early in the 4& week, as pmminences around the
iarge stomodeum, or primitive mouth. nie facial pmminences are the single rnedian
fmntonasai prominence, and the paired d a r y and mandibular prominences. The p a k d
mandibular prominences are derived from the fkt branchial arch. niey jre produced as
neural crest cells migrate into the arches and proliferate. These cells are a major source of
connective Ussue components including cartilage, bone, and iigaments from the orefacial
regions (Sperber, 1989). Development of the face occurs prirndy between the 4& and 8&
weeks. Facial development occun slowly and ES& from changes in the proportions and
positions of the facd components (Moore, 1993).
1) Mandible:
The mandible is the first pair of the face to form. It results from merging of the media
ends of the rwo mandibular prominences in the median plane in the 4" week

2) Nose and nasal cavities:
Bythe end of the 4 week, thiclcenings of the surface ectoderm have developed
Mesenchyme proMerates in these thickenings and forms honeshoe shaped elevations
known as the medial and lateal nasal prominences. The centea, or "pitsn of these
elevations are the prirnordia of the nosuils and nasa cavities.
3) Maxilh
The maidkiy prominences pmliferate and grow medidy towards each other and the
nasal prominences. Bythe end of the 6& week, each maiallary prominence has begun to
merge with the lateral nasal prominence. Between the 7'' and 1 0 ~ weeks, the media1 nasal
prominences merge with each other and the maxhîy and laterai nasai prominences,
resulting in continuity of the upper jaw and lip.
III POST-NATAL GROWH AND DEVELOPMENT OF THE CRANIAL BASE
The bones of the c d base are LiiUallyformed in cardage and are uansfomied
into bone through the process of endochondral ossification. In terms of p s t -nad pwth ,
the most important synchondroses to persist are the sphen*ethmoidal sync hondrosis (SES)
and the spheneoccipital synchondrosis (SOS). Growth at the SES is said to be responsible
for ACB growth. IniUally, the SES gmwth ~roceeds at a faster rate than the SOS, but there is
negligible activiqr afier age seven. The SOS however, does not fuse und adolescence and is
the main contributor to PCB g m d . This prolonged gmwth provides space for the growing
nasopharynx and for continued rnaiallary lengthening to d o w for the molan to empt
(Sperber, 1989). Gben (1998) holds the opinion that the SOS is the "missing link" in
caniofacial growth. He maintains that gmwth at the SOS translates the ACB and its
attached upper face u p d and fornards, away from the foramen rmgnum and the

vertebral column. In adàition to proliferative synchondmsal gmwth, the c d base
undergoes selective remodehg by resorption and deposition. By this merhod, growth
continues even after the synchondroses fuse.
The lateml c r d base increases in size by suturai gmwth which translates the
temporal bone, and hence the glenoid fossa, in a down and back direction. n i e lateral c d
base is active even in cases of achondroplasia where the SOS does not conuibute to p w t h .
This iliustrates the concept of differend development arnong the parts of the c d base
(Bjork, 1955).
Summary:
The cmnial base demonstntes an extremely complicated and higldy controveaial
pattern of p w t b Many mechanisms are involved including deposition and
resorption, displacement, flexing, and inteatitial gmwth at the synchondroses.
A Defining the Cranial Base
Different authoa have wide and v+g opinions on what the exact landmarks are
which define the c r a d base and its constituent parts. Anatomicdy, the cranial base is the
stnicture that serves as the floor of the brain and the roof of the face. Because of this
location, facial and neural landmarks are often included as points in the cranial base. Sorne
authors even differenüate bemen the "extemaln c d base &ch ends on the facial point
nasion, and the "intemal" cranial base &ch ends neurally, before the frontal sinus
(Stmmrud 1959). The rnidline c d base includes the basioccipital, the body of the
sphenoid, and the mesethmoid bones. If taken ro extend ro nasion, it will also include pan of
the f m n d bone. The following is an effort to accumulare and present the many definitions
of c d base.

Anterior Ganial Base:
The most cornmon way of i d e n h the ACB is by the line seila-nasion (S-N).
However, nasion is not technicaiiy part of the cranial base. This notation most likely came
about due to the relative ease of locajwig points N and S on a lateral cephalognm Other
extemai points such as glabella have &O been chosen as the anterior limit of the A(31
(woowaia, 1998). Noreworthy is the fact that if glabella is chosen as the antenor limR in a
growth study, then the influence of the frontal bone a d sinus are excessive. On the basis of
pure logic, choosing internai points to defie ACB should yield more accuncy as the effects
of facd stnicnues wdi be eliminated. Unfortunately, the reality is that Liternal structues are
often more difficult to locate on a radiograph.
DeCoster (1951) used foramen cecum as the antenor limit of ACEL Bjork chose
ethmoidak, the lowest median point of the contour of the anterior c d fossa,
correspondhg to the cnbifoxm plate of the ethmoid bone. Stramrud (1959) defied the
length of ACi3 as the N S distance minus the thickness of the frontal bone, thereby staying
"intemal". The inner surface of the frontal sinus is probably easier than foramen cecum to
locate radographically. In this investigation, another internal point was used and named
"Intersection point", or "1" point. This is the point d e r e the roof of the orbit (bûected)
interseas with the midplaned surface of the internal contour of the frontal bone. This point
proved to be easy to find and reproducible. Sirianni (1979) chose a similar point in a study
on nonhuman primates but he used the innexmost wall of frontal bone and not the
rnidpianed surface.
Nasion is located on an anatomic edge and the~fore easy to identify. Baumrind and
Fmtz (1971) found that estimates of this point were quite good, but that the presence of
outliea p d u c e d an unexpectedy large standard deviation. Because these outlien wen so

inaccu~clte, they were assumed to be the result of idenufications of entirely different
anatomic suuctures. Nasion stands as the most diable and repmducible point to define
ACB.
The postenor limit of the ACB is most commonly designated by sella, the midpoint
of the pituitary fossa However, Ford (1958) preferred the pituitary point, which is the
rnidline point on the anterior rnargin of the pituitary fossa In other analyses, the posterior
miq in of the piniiraiy fossa is used. The antenor waU is thought to be stable after age six,
but the postenor wail is known to resorb und age 16- 17 (Sperber, 1989). BaumMd and
Frantz (1971) found that midpoint seila was easily reproducible, and quite accurate, since it
involves visual estimation of the center of a suucwe. This type of mental averaging system
is known to yield low dispersion. In spite of some people's preference for the pituitary point,
or matguial landma& s e h has proven to be a popular and biologically valid ieference point
(woowah, 1998).
ii) Postenor Canial Base
Most authon defiie the PCB as sella-basion (S-Ba). G e n e d y s e h is agreed on as
the origin of P a , but there is controvenyover the terminus. In the early days of
cephalomeuy, the large metallic ear rods used to orient the patient often obscured basion, so
using this point was questionable. Bolton (Bo) point has &O been considered, but is usudy
negated due to the difficulty in reproducing it on a d i o p p h . For these reasons, Bjork
(1947) i n d u c e d articulare (Ar) as a fundamental reference point clauiiuig that it 'always
shows up clearlf . Interesringly, articulare is an d ic ia l ly consuucted point formed by the
intenecring shadows of the occipital bone and the mandible. As f i technique improved,
the ability to locate basion &O impmved and its ppulanty soared (Seward, 198 1).

iii) Total Cranial Base
The most cornmon terminai points of AQ3 and PCB are N and Ba respectively.
These points ate logicaliy used to amive at the prevaiiing definition for total cranial base
va). Those authors thar consider the terminal points of PCg to be Bo (Anderson, 1983)
or Ar (B jork, 1955) define TCE3 as N B o and N- Ar. Other authors consider TCi3 to be the
sum of its collective pans: S-N + S-Ba
Figure 2.2: Midline cranial base
B. GrPwth Patterns of the &nial Base
The cranial base is a panicddy interesting complex as it is closely related to both c d
and facial structuxzs. Many studies have examlied the growth patterns of the cranial base in
attempts to identify whether its gmwth is more closely associated with the b& or the face.
Ganial growth largely depends on growth of the brain and therefore follows the neural
pattern of growth in the fit two to three years, fallmg off rapidiy and completed by age
seven or eight. Facial gmwth is independent of brain gmwth and fo11ows the general skektal
pattem of most bones and muscles. This pattern is fairlyeven from birth to adulthood with
characteristic spurts at and around pubeq. A knowiedge of which pattern the c d base
foiiows gives insight inro its c h ~ e r i s ü c behavior.

Bjork (1955) feit that the cranial base followed both the facial and the neural p w t h
partem. De Coster (1951) referred to the ACB as the "Radiographic Basai Line". This
consvucted line extended from the anterior lip of seUa across the sphenoidai sinus to
foramen cecum and then up verticaliy behind crista fmntalis. Hé found that this line was
stable after age seven and therefo~ must foilow a neural pattern of growth and be under
"ahost purely hereditary control". Nanda (1955) agreed rhat the curve of ACB (S-N) had
steady growth und around age six and therefom folowed neural growth. However, he also
noted a srnall circurnpubertal spuir which suggested a component of skeletal growth (most
likely due to nasion). Therefore, Nanda concluded that the ACB foliowed both the ne&
and the skeletaî gmwth cuves. Ford (1958) showed that rwo paru of the cranid base had
n e d growth rates, and two other parts followed the skeletal curve. H e was convinced that
the pans must grow in one pattem or the other and not by an intermediate pathway From
nasion to foamen cecum, and from pituitary point to basion, the c r d base folowed a
skeletai growth rate. A neural growth pattern was seen fmm foramen cecum to the pituitary
point, and from basion to opisthion. Ford wamed that when several of the c d base p m
are involved in one measurement, it gives the emneous impression of an average growth
pathway when redy the paths are separate and distinct. Barnbha (1961) disagreed, and
showed that the growth of S-N was a composite of skeletai and n e 4 growth, and followed
an intexmediate path. Mitani's studies (1973) found that the growth rate of c d base
seerned to Vary with the neural growth cuve early in life, and the general skeletal gmwth
cuwe at pubelty.
Lewis and Roche (1972,1974) discovered that sorne c d base lengths (SN, Ba-N) of
girls and boys were about 9597% of their adult size at the mean age d e n peak height
velocity is reached Pubertal spuns can not occur in bones that reach adult size

before puberty begins. Therefore, only very small p u b e d spuns are possible in c d base
le@ d e s s they occur befom peak height velociry. AccorduigIy, they found only small
increments in le& of S-Ba after PHV. ï h i s data questions whether the developing c d
base can foilow a facial curve of growth. Later, Hiiioowaia (1998) ais0 found that the gmwth
of the P a is complete before puberty. Since the growth spun of mandibular length and
height is after puberty, facial growth cannot be responsible for development of cranial base.
Perhaps it is the contrary, and the facial complex follom the growth pattern of the cranial
base instead!
Sunirnary:
The general consensus is that the constituent parts of the cranial base foliow
either a neural or a skeletal pathway. The total pattern of cnniofacial matuxity
oscilktes between these two patterns.
C Cessation of Gn,wth of the Ctanial Base
Thele are different opinions as to &en the cranial base stops growing.
i) Anterior Cranial Base:
De Coster (1% 1) defined the anterior limit of the ACB as the h e r contour of the
frontal bone. H e felt that afrer age 7 there is no more gr& of the AQ3 because the brain
has ceased to grow. Scott (1958) and Ford (1958) agme with this age and state that change in
the cnbiform plate is imrnutable after eruption of the first permanent molars. Growth at the
spheneethmoidal and fmnteethmoidal s u m were found to be complete at age seven,
thereby ending active growth of the "intemal" antenor cranial base.

F i g w 2.3: Length of the intemal ACB (sella to the b e r contour of frontal bone) (Sudmnid, 1959)
However, most of the tirne, the anterior limit of the cranial base is designated by
nasion. Facial growth, anterior to foramen cecum, occun by a different method: remodehg
of the frontal and ethmoid bones. What results is an increase in the frontal sinus and the
development of glabelia. Melsen (1974) confimed that the funher inc~ase in bone thickness
was due to ectocanial surface remodeling. Behrents (1985) showed that the length S N
continued to remode1 weli beyond the age of 25. Bondevik (1995) aiso found a significant
increase in length of the ACB (SN) in a f e d e population aged 22-33. SLnilariy, Bishara
(1994) reported that the cranial base length increased in fernales and males from age 25-45.
F i g u ~ 2.4: N-S length (Stramrud,l959)

Bjork (1955) recognized that at glabella, growth of the frontal bone continues
beyond puberty. Some authon like Isael(1973) and W o o d (1998) chose to define die
antenor lirnit of c d base to be glabeiia instead of nasion. Using this landmark, the length
of ACE3 would continue to remodel, and reach a maximum at mund thirtyfive pars of age
(Israel1973; Behrents, 1985).
Figure 2.5: Thickness of the frontal bone (S- 1959)
Because the distance from S to foramen cecum changes littie after 7 pan, it is clear
that the posterior movement of S due to resorption on the postenor wall of the pituitary
fossa contributes o d y very slightly to the elongation of S-N. Although posterior p location is
agreed upon @tham, 1972; Melsen, 1974), the exact amount has not been detennined
accuately. a b e n (196 1) indicated that the movement would be less than 0.5 mm from ages
8- 16. Therefore, there is no doubt that the major increase in S-N after age 7 is due to
apposition at nasion (Roche and Lewis, 1976).
ii) Posterior Canial Base:
The posterior movement of S just considered would tend to slightly shorten the
distance S-Ba Elongation occurs two possible ways.

1) The svhenwxci~ital sychondmsis:
Larham (1972) iliusuated that in pximates the distance berween sella and the SOS did not
increase much after six month of age. niese msults wexr similar to human findmgs. His
theory was that the gmwth of the Pcl) is secondary to gmwth of the SOS and is esponsible
for the lengthening of the clivus. The age d e n the PCB ceases to gmw varies dependmg on
the different thoughts on when the SOS closes. Sicher (1944) felt that the SOS penists und
skteen to twenty pars 016 d e Powel and Brodie (1963) suggested that closure was as
early as pubenai onset (eleven to fourteen for girls, and thineen to sixteen for boys).
Generally it is agreed that the SOS is invariably closed by age twenty.
2) Basion:
Snidies show increases in S-Ba after fusion of the SOS. Any further gmwth in length
of PCB is pmbably due to shght postenor migation of the foramen magnum (Enlow, 1968).
Ueisen proposed that resorption in this area is not completed before age nineteen in males
and seventeen in femaies. Meken (1974) ais0 showed that apposition occurs at B a This
conttadicts the weii documented findmgs thar Ba is stable and that ail MB elongation is
secondasyto growth at the SOS (Roche and Lewis, 1976). Interestingly, Behrents (1991)
documented that S-Ba continues to remodel after 25 pars of age.
Figure 2.6: SBa length (Suamruci, 1959)

iii) Total Crrnial Base:
Essentialiy, elongation depends on the curnuiative changes that occur at N, the SES,
SOS, and Ba In addition, remodeling cm result in a repositionuig of N d o r Ba (Meken,
1974).
N VARIATIONS OF CRANIAL BASE REFERENCE LINES FOR SUPERIMPOSITION PURPOSES
Artificial constructs like reference planes are necessary to ~ f o m facial
morphology imo numericd measurements that can be easily interpreted Refe~nce planes
must be clearly defined and stan-d, accwately and consistently located, valid, and
stable (Ghafari, 1987). For purposes of evaluating facial changes from p w t h , the most
fundamental requkrnent is stability of the reference points and chosen superimposition
plane. Such a plane is usually consvucted in the ACB area as it is considerrd constant by the
end of the f i t decade (Ross, 1959). Hbwever, just as there exist different points d e f i i
constituent parts of the c d base, so are there different planes of fere en ce. Som authon
advocate using reference planes in the PCB (Gben, 1986), and some recornmend using the
total length of the c d base. (Broadbent, 1937 and Seward, 198 1).
A. Anterior Crânial Base:
DeCoster proposed using a h e that started at the anterior lip of sella mica ,
conrinued over the sphenoidal sinuses to foramen cecum, and then ran vertically on the
inner contour of frontal bone. He felt that this iine was almost purely hereditary and
undisturbed by facial p w t h or mechanical influences (unlike nasion). This line proved to be
constant after age seven. Melsen (1974) agreed that rhe interna1 surface of the frontai bone
and ctibiform plate were stable by about age seven in both the sagittal and vertical planes.

The sella-nasion line, pioneered by Brodie (1941), is used frequently as a reference
for superimposition. Both S and N are easily identified points and the superimpositions
p d u c e consistent and diable patterns. Bjork (1955) initially advocated the use of S-N
because of the high me of constancy berween S, N and the deepest median contour of the
anterior craniai fossa Later however, Bjork (1960) questioned whether S N was as stable as
he had once thought. He and Scott (1958) both stated that an upward or d o w n d
displacement of nasion rnay occur with growth at the fronto-nasal suture. Likewise, a
posterior displacement of seUa rnay be induced by the remodeiing of donum s e k
conneaed with growth of the pituitaxy gland Ford (1958) &O pointed out that these two
points (S and N) are hown to a a independently. As sella moves upward, nasion moves
forward and upward, malong their relations hip somewhat unstable. nirs new position of
nasion places it above the cnbiform plate and therefore above the face as a whole during
growth. Bjork ultknately chose ethmoidaie as a point and formed the re fe~nce line ESL
(edunoidale-sella iine). As opposed to abandoning S-N, othen argue that the amount of
upward movement is e q d for both seiia and nasion and therefore a satisfactory result can
s d be obtained d e n using this line, parriciilarlywhen the observation time is short.
Seward (1981) proposed that if the saddle angle (Ba-SN) changes then superimposition on
S-N plane can produce an apparent progressive provusion of the lower face that is not
observed clinicdy.
Studies have compared the S-N plane to DeGsrer's ''Basai Linen. BaumrLid et al.
(1976) concluded that in De Coster's methoci, registdon errors weR unexpectedly s d e r
than those for S-N and that emrs of interpretation of ma* or mandibular lan-
were remarkably simiiar. Panchen and W e n (1984) found the opposite to be tnae: that
~gistmion ermr was kss using S-N.

S d (1959) c o m p a ~ d SN plane with Bjork's ESL and found ESL to be
prefemd in studies that cornlate the c d base to the rotation of the facial skeleton.
i) Repducibility
Mitgard et al. (1974) stated that some cephalometic landmarks are located on the
outlines of the canium and are compa~~~tively easy to idenufy due to the sharpness in
convasf on the radiograph. For this reason, S-N is the preferred plane. The stnrtures on the
inner ctanium are often indistinct because of superimposition of other anatomic suuctures.
This is substantiated by Richardson (1966) d o said that De Gster's cribiform plane was
only moderately successfd as far as reproducibility was concemed.
B. Posterior Ganial Base:
Coben (1986) described basion-articulare (Ba-Ar) as his ideai reference line to
evaiuate growch, and found it to be ''essentidif stable pst-natally over tirne. He found the
mandibular to menton distance to exhibit a constant s a g d spatial relationship to foramen
magnum as the mandible uaveled down and f o d away from the ci.anial base. It could be
argued that basion-articulaxr is not at all stable, and not well accepted by orthodontie peen.
Basion is difficult to locate, and the small distance berween Ba and Ar make t h region
susceptible to e m n of orientation ( B u s c h , 1998).
Another plane cornes from Baer and Nanda (1976) who recomrnend superimposing
on the doaum of the cliws, re@tered on basion, in situations where the c d base is
affected bytrauma or a congenital defect.
C Total Cranial Base:
There are many advocates of using the TCB for superimposition. While mort agree
that nasion is the anterior terminus, difierences arise over the posterior tenninus of this

mference plane. Seward (1981) used Ar posteriorly due to its relative ease of location
compared to basion. However, most authors freely use Ba without hesitation.
A study by Ghafaxi et al. (1987) compared four planes of c d supeximpositions
and found that there was no preference arnong the methods. What is important to recognize
is that no one supelimposition plane can be used to perfe~tl~depict growth patterns. Moyrn
and B o o k i n (1979) iament the inappropriateness of conventional cephaiomeuic
l a n a . They propose highly technicd methods involving the-dimensional cornputer
geometry to overcome the current limitations of cephaiomeuics.
Summary:
Because of their supposed stability, many diffe~nt clanial base reference
planes have been used for the piupose of superimposition. Howewr, none of the
cnnial structures will be perfecdy constant in times whem growth is active. The S N
line is the most popuhr refe~nce plane for supetimposition and has ~rnained in
favor for so long because of its dative stability, practicality, and ease of location of
its anatomic points.
V RELATIONSHIPS BETWEEN THE CRANIAL BASE AND FACIAL AND SKELETAL DEVELOPMENT
The si=, shape and position of the individual cranial parts are inter-related in varying
degrees. These relationships are determined by cenain geneal p ~ c i p l e s conditioned by
growth rate and proportion, and by the compensatory and adapUve mechanisms within the
SU (Smahel, 1988). The f i t anthropological comktion study between the lengths and
widths of slaiUs of varied xacial backgrounds was first published by Pearson in 1896, and a
number of sLniLr s d e s have followed suit. Broadbent (1% 1) had influence on these
studies as he inuoduced the x-ny cephalomeuic technique. Because of this, detailed

longitudina data on facd development could be coliected and interpmted. Over the yem,
Solow (1966) and othen have cautioned against over-interpreting the correlations between
various cephalometxic variables. When rwo lines share a common reference point, these two
lines will show more comlation than two other Lines wirh no cornmon point, and this must
be rernembered d e n reviewing the literature.
While the importance of c r d base morphology as a contributory factor to o v e d
facial pattern has been svessed by Bjork (1955), &ben (1955), and Hopkin (1958), other
researchen (Stevens and Freer, 1979) have demonstrated the unpredictability and variability
of this contribution. Hopkin believed that the cranial base area has considerable influence on
both facial prognathism and in establishq the antenor-posterior ielationship of upper jaw
to lower jaw. Bjork (1955) and Coben (1955) felt that in developrnent, a dec~ase in c d
base angle would dis place the glenoid fossa f o d relative to ACB and there by contribute
to rnandibular pmtrusion, whde an increased angle would lead to mandibular retrusion.
Stevens and Freer thought that any generalizations in associating a given c d base angle
with a p k c u k r skeletal or dental pattern is unreasonable considering that there are so rnany
other factors that corne imo play. Nanda (1955) found genedythat in development, the
subjects he studied retained their relative positions in all rneasurements. That is, a boy who
matuns early with respect to sella-nasion was probably early for all other masures as well. If
he was small faced to begbi with, then he would still be s d faced at the end of
development.
Most of the previously mentioned s d e s focus on cranid base angulation and its
influence on the relative position of facial components. However, not much literam is
available on how the length of the cx-aniai base influences the absolute size of other facial
dimensions. In one such study, Smahel and Shadova (1988) report that the characteristics

of shape and position of individuai smrnues were more closely related than the
characteristics of size. The Burkngton cephalometric analysis (Popovich, 1977) considers the
length of the ACa (SN) in relation to the lengths of facial measurernents. This analysis was
cteated to evaiuate the face in duee planes of space (anteroposterior, width, and height) plus
age to better analyre cases and anticipate their changes. Tempiates were developed to
gxaphically illusuate facial growth and its variation arnong children. The lateral projection
template is oriented on the S-N plane and registered on the center of seiia. AU other facial
landmarks are plotted and compaied relative to the patient's measure of SN. This method
dows for evaluation of a penon's degree of ske1eta.I baiance or imbalance. For example, if
N, ANS, A point, B point, and menton were ali close ro the 12 yvar old standard, it would be
an average size face. But, if the same dimensions were all larger, the face would be
considered iarger than average.
Ross (1959) svongly felt that linear rneasurements were more vaiuable in assessing
actual growth and development than angular analyses, as the angukr snidies could only
concentrate on changes in proportions. Linear measuements though, were more awkward 4
to use. Populations of different sizes or ages can not be compared directly unless the linear
dimensions were reduced to a proportion, or unless the vaiues were adjwted to correct for
the overall s k differences. In Ross's 1987 study, he introduced the notion of size adjusting
linear measurements to s t m e cephalomeuic records that came from many different
centers. He proposed that the hea r values had to be adjusted to an internai standard such as
the c d base. Furchermore, size adjuthg these dimensions would ovenrorne any
morphological differences caused by variation in age. Ross arbRrariy set the totai cranid
base line N B a at 1 10 mm for al plots and superimposed them to evaluate the profiles. He
discovered that manipulation of the plots provided a clearer presentation of the facial
reiatioaships than would show if the TCB lengths were unequal.
Ross also developed proportions bywhich to compare the measurements in his sdy.
The raw linear measurements were adjusted b y dividtng by the actual TCB length and
multiplying by IOO. For example, if the mean maodbular length was 128 mm and the mean
N B a length was 116 mm, the adjusted mandibular length would be {(128/116) x 100) or
110% of the total cranial base. Ross strongly believed that adjusment of ail the linear
dimensions into proportions of TCB was mquired for comparisons. No other attempts at
size adjusting have been reported It would be highly beneficial to criticdy review the
lirerantre on how the absolute size of the c d base segments correlate to facial and
skeletai development. This would enable us to identify the significant associations t h exist,
examine how they idluence morphogenesis, and investigate the concept of size adjusting.
k The Relationship of Ganial Base Length to Maxiliay and Mandibular Lengths
The d and mandible each attach to a different part of the cranial base. Therefore,
it would seem logical that the le& of the cranial base would have an influence on jaw
~lationships. It would also be presumed that the maxilla wodd be more closely related to
the antenor c d base, and the mandible would be more closely associated with the
rniddle, lateral and postenor regions.
Enlow (1976) believed that the dimensions and orientation of the nasomaiollary complex
relate directly to the corresponding site uid alignment of certain parts of the c d base.
The midface s pecifically relates to the flmr of the antenor cranial fossa d e the posterior
border of the antenor c d fossa corresponds to the postenor margin of the maxdhy
tubemsity. Enlow felt that there is less communality arnong the gr& fields of the

mandible and the c d base. Therefore, more variation exists in mandibular dimensions
and placement ~lat ive to the c d floor rhan nasomamlky dimensions and positions.
&ben (1998) conuadicts this logicd principle. Hi cl& that the P a , via the SOS, is
intimately related to the upper face and maxdh In growth, the SOS vanslates the ACB and
its attached mamUa forward up and away from the foramen magnum. At the same tirne, the
mandible moves down and f o d away from the cranial base. Bemen these two general
vectoa, space is created for vertical Qvelopment of the face and the eruption of the
dentition.
Scott (1953) felt that gruwth of the cranid base is important in fornrard growth of the
face. Fmm a sample of "remarkable unifo~mitf' , he found that a reduction in TCa length
(NBa) is associated with a reduction in the size of the face and its projection forward fmm
the vertebral column. Hopkin et al. (1968) conducted an age rnatched s d y and reponed
that the c d base has an important role in determining antenor- postenor jaw relationships
and occlusion of the teeth. This is based on their findings that the mean linear dimensions of
the c r d base (SN, S-Ar, NAr))y as weli as the c d base angle, are ali smaiiest in the
a s III groups and largest in the Class II groups. Unfonunately, in this studythe jaws were
not looked at in ternis of absolute size. More recently, Kerr and Adams (1988) made an
effort to establish the relationslip between c d base size and shape, and jaw patterns.
Their sample was matched accordmg ro age and incûor relationship. Like Hopkin, they
found that c d base length (SN, SBa, N-Ba) increased as the jaws became more (lass II.
Regardmg absolute size of the TC23 @Ba), Kerr and Adams dkcovered a suong comlation
with maxdhy length, and a weak comktion with mandibular length (Co-Gn). Inte~stingiy,
even wnh this stmng correlation to the maxilla, they did not find a significantly prouusive
maxiüa in malocclusions 4th longer craniai bases. This suggests that some form of

compensation k at work In a study by Kasaï (l995), cranial base length WBa) was more
highly comlated to the mandible than the maxih The dircrepancy between this finding and
that by Ken and AdaM (1988) is likely due to the differences in their respective
populations. The latter sample consisted of 10 year old Scottish boys and Kasaï's was
Japanese males ages 16-60. Anterior and posterior c d base lengths, as well as total c r d
base length all showed positive correlations 4th mandibular length, mandibukr body length,
and symphysis height in Kasai's study. The result of their principai component analysis
provided good evidence that the antenor and posterior cranial base were associated in
different ways with different aspects of facial morphology. This has been substantiated by
the different p w t h patterns and anatomic relationships between the structm~s. Their study
was not age matched, but was tested for the effect of age. They found that there were no
"important biological relationships berween age and the variables considered" . In 1998,
Woowala et al. looked at the intemlationships of brain, c d base and mandible in a
sample with si& occlusion and developmental state. They chose glabella instead of nasion
to delineate the most anterior point of cranial base, and they split the antenor cranial base
into two parts: sella-foramen cecum (S-Fc) and foramen cecum-glabelia (Fc-Go. They found
a higher correlation factor d e n mandibuiar height and length were related to Fc-Gl as
opposed to Fc-Nasion. Lkly, this is due to fan that frontal bone growth is increased at
glabeUa and therefore more s& to the type of growth that the mandible displays.
B. The Rehtionship of Cranial Base Length to Body Height
B u s h (1949) conducted a comparative analysis on breadth, length, and height of the
cranium in relation to stature and uwik length. nie large group represented a wide cross-
sehon of ages and racial backgrounds. I-k found that the highest conelations wem to vunk
length. Thus, it appears that the increase in size of the cmnium tends to keep pace in a

verricd direction with body height. Barnbha (196 1) &O found a correlation berween cranial
measurements and body stature in hir age/sex rnatched sample. In addition, he noticed that
faciai and craniai measurements in individuah who were relatively late maturing in body
height tended to show similar delayed maturation in the face and cranium, wtllle early
developen tenàed to manire early in facial and c d measures and in body height too.
This suppom the theory that the cranid base does to some extent foliow a skeletai pattern
of growth. Solow (1966) showed that the= exists a general association between the s k of
the head and that of the body in young male ad&. This was ~presented by a set of low
positive associations b e ~ e n most of the body measurements, including height, and most of
the lïnear cepMometric measurements.
C The Relations hip of Cranial Base Length to Cranial Base Flexm:
Manysnidies report correlations between canial base length and flexure. Anderson and
Popovich (1983) used the Burluigron study to look at the cranial base segments individually
as well as the TC33 length. They found that PCB (S-Bo) was larger in boys with the smallest
c d base angle at ages rwelve and skeen. Smahei and Skvariiova (1988) also found that
PCB increased in length as cranial base angle decreased Conversely, Bjork (1955) using S
Ba, found that PCB was longest where the flexure was greatest in tweive year old boys.
Andenon and Popovich found that TCB @Bo) was smaliest in girls who had the
smallest cranial base angle. B jork agreed with these fiiduigs, using the lïne N- B a Weidenrich
(1941) &O agreed that closure of the c d base shonened the NBa line.
Andenon and Popovich found that ACES lengrh (NS) did not &fer significdy
benmen groups of children who had large flexures and those who had small flexures.
Srnahe1 and Skvarilova &O discovered that AC6 could not be correlated to f l e m . in fact,

in their sndy on Gech males, A m showed no correlations to m y of the Livestigated faciai
c haracteristics . D. The Relationship of Canial Base Length to Head Length
Ross (1961) studied the c d base in cleft and non-cleft populations. He found tbat the
cranial base was smaller in size in the cleft gmup compared to the conuol group. Hk
posntlated that the observed difference in cranial base size wu merely a reflection of a
generalized difference in body SM, as cleft chiidren are genedy smaller rhan unaffected
children. To prove this theory, Ross measured TCB length as a proportion of greatest head
length. Ganial base length was de f i id as ACE5 (NS) plus PCB (S-Ba). E dixovexed that
the c d base length was equally proportioned ro the cIanium length in both groups.
Overail, no significant differences were found.
E. The ReLtionship of Ganial Base Length to Face Heights
In 1953, Scott wrote that it was difficult to find associations in the craniofacial skeleton
because of the wide variation of the paru. In his investigations, he found no comlations
between c r d base le& (N-Ba) and face height. Smahel and Skvaxilova (1988) looked at
multiple comlations in the facial complex and found an association between PCE3 length (S-
Ba) and posterior upper face height (PM- S-N he) . ï h e other important parameten
contributing ro the postenor upper face height CUFI-q included craniai base angle and
mandibular dimensions. Kasai (1995) showed th the le+ of ACB, PCE3 and TCB ali
were sigruficantly correlated to UFH, while only ACB and TC33 (but not PCB) were
comlated to lower face height 0. Koski (1960) stated that the growth of the upper face
and the clivus seem to be of equal magnitude in the vertical direction. The significaace of
this fin& was in showing how SOS gmwth rnay be adaptive, secondary to enlargement of
the brain.

In Smahel and Skvarilova's 1988 multiple correlation study, they attempted to use
correlations as a method of predicting development of the craniofacial region. They
discovered that it was not possible to disclose any combinations of parameters adequate for
the estimation of the lengths of the pans of the c d base. In their opinion, cranial base
lengrhs, especially Am, had very low comlation coeffecients, &ch showed the marked
degree of developmend independence of the c d base. However, other studies have
displayed moderate to high cornlarions between length of the c d base and facial
dtnensions. For this reason, the canial base length should be considered in the diagnostic
assessment of the craniofacial complex and general characteristics of the individual.
F. Defects invohing the Ganial Base and the Influence on Facial Dewloprnent
In a case study by Evans and Christiansen (1979), the role of the c d base in facial
development was illuminated as a result of a PCB defect. A geomeuic model of a n o d
SU was constructed and the identicai defect was re-created within the skull. This alteration
caused the face to rotate cIockwise in the model. In the uue s h i l however, this did not
occur, and the anterior suuctures maintained neariy nomial anterqmsterior directionai
gmwth. This proves that some compensation system exists to prevent the undeslable
cloc kwise rotation of facial components.
Studies on syndromes kivolving craniosynostosis reponed a marked effect on the
cranial base (Moss 1959, Kreiborg and Bjork 1982). Moss even suggested that the
derangements in size and s hape of the c h o n d r o c ~ u m were not necessarily secondary to
the premanue ossification of the cdvark sums . Stewait et d. (1977) presented a case
report on a stiilbom fetus that had all the chaacreristic features of Apen's syndrome.
However, they found no evidence of premature fusion in any sunires or synchondroses. 'This
led them to believe that Apen's syndrome was pnmarilycaused by a malformation of the

skull base, with the secondary effect of premature craniosynostosis. 'Ibis philosophy is not
genedy accepted Public opinion is that the primary event is the fusion &ch in tum leads
to the c d base a b n o d t y . Regarding c d base, Bachmaytr (1985) stated that most
studies found anterior and posterior c d base lengths to be shoner in Apen's patients
compared to n o d . The maicillae were hypoplastic and the mandibles normal, thereby
creating the false illusion of mandibular pmgnathism. In Fedun's 1971 thesis on the
craniofacial characteristics of Crouron and Apen's syndromes, he confinned these findmgs
and even suggested that the rnandible was short. Fedun stated that aithough no
measmrnents were d e n for height and size in the sample, Crouzon and Apert's subjects
appeared to have normal development in stature. Kreiborg (198 1) conducted a cluiicai and
radiographc study on 61 patients with Gowon's syndrome. L k Fedun, he also found the
mandible to be d e c ~ a s e d in length and ramal height. However, contraryto Fedm,
Kmiborg's evaluation of somatic measurements discovered that body height and d u s
length were significandy shoner in the Crouzon sample compared to conmis. Srnalier than
average rnan l l a ry l ee and face heghts dong with the previous fmduigs suggest that
Gouzon chilhn am generally smaller in ali aspects of craniofacial and sornatic
development .
VI CRANIAL BASE LENGTH IN CHILDREN AND ADULTS WITH VARIOUS HORMONAL DISORDERS
An investigation into these conditions gives insight into gmwth patterns and correlations
in the craniofacial cornplex. They can be viewed as experimental models for studying the
effecu of abnormal development on the SM and its vaxious pans.

A Children with Hypo- and Hyperthpidism
Spiegel et al. (1971) researched a sxnall sample of patients with various
endocrinopathies . Those patients with hypothyroidism dis played letardation of vertical facial
gmwth and PU3 kngth (S-Ba). Gntraryto what would be expected, the ACB was advanced
in the rnajority of patients. niis can be explained by the fact that hypothyroidism has a late
onset and therefore the ACB development would have h a d y been complete and ntn&red
unaffected by the disease. Patients with hyperthyroidism exhibited advanced growth in al
dimensions. Antenor and postenor c d base were both advanced, more due to PCB and
the longer period of endochondral gmwth. Intetestingly, TCB length (NBa) was not
increased as it was compensated for by increased flexure of the c d base angle.
B. Chiidren with Deficient and Excessive h w t h Hotmone
childhood growth is mainly regulated by the secretion of growth hormone, provided
that the nutritional s t a t u and other homeostatic maintenance factors are normal. Piinen et
al. (1994) looked at patients with either deficient or excessive growth hormone (GH) to
elucidate the role of GH in craniofacial growch. Two control groups were used: one matched
for age and sex, and another matched for height and weight. In a previous study by Poole
(1982), comaion for skeletal age helped to eliminate a lot of craniofacial differences.
Qiildren deficient in growth hormone had linear c d base dimensions s d e r
than those of the age/sex matched and ais0 than those of the heighdweight matched
conuols. This suggests that GH deficiency ovemdes the known correlations between body
height and c d dimensions. The main caniofacial feanues of deficient GH were short
PCB, s d maxilia and mandible, and a short face. The sigdicant variables in patients with
excessive GH were increased P a length and increased mandibular gmwth. GH has
profound effects on cadage gmwth. Therefore, cranioffacial changes with deficient or
excessive GH w e ~ most conspicuous in the clivus and the mandible, the c a d a p o u s SOS,
and the condylar carulage. These results are in line with those of Spiegel et al. (1971) d o
found that patients with pituitary insufficiency s howed severe gm& retardation in hear
facial measurements, particuiariy with small antenor and posterior cranial base lengths, and
small mandibular sizes.
Jensen et ai. (1997) conducted a study on cmniofacial development after surgical
resection of craniopharytigioma. These tumors are the most cornmon supraîellar neoplasms
in children, and they arise from embpnic squamous ce1 rests in Rathke's pouch. After they
are removed, the patients experience endocrinologie deficiencies including reduced GH. Like
previous shidies, these subjects showed smaller d b l e s and a shorter PCB (S-Ba). ACB
(NS) showed normal dimensions as these patients probably had a more n o d production
of GH in eariy childhood d e the A(33 was formhg. The authoa point out that the role of
ugeneral growth potenthln may be important in these patients, where nearly ail caniofacial
measurernenu were sigruficantiylarger in the tallest patients than in the srnallest. This
illustrates the strong relationship between stature and craniofacial measures.
C Chüdren Born Srnaii for Gestational Age
Van Erum and CO-worken (1997,1998) published studies on children bom small for
gestational age (SGA). In many of these children, no underiying cause is ever found. These
children d s howed an o v e d delay of craniofacial growth, es pecialiy in the rnandible and
cranial base. Angular facial proportions were not affected, but the linear dimensions weR
much smaller compared to age matched conmls. In fact, aii the linear craniofacial sizes in
the entire group were extremely short relative to their Bolton standards. These SGA children
s howed a marked similarity to children with piniitary deficienc y even though the y themselves

w e ~ not GH deficient. The latgest difference between these two groups was that the SGA
children had small mknllas and the GH deficient children exhibited nonnal mamllaty
le+. Treatrnent in some cases involved adminicvation of G H Here, the success
depended on the age treaunent was starteci, with the earliest adminisuaùon being most
swcessful. n i e Van Enun study (1997) showed that even with treatrnent, some children
failed to have catch-up growrh. In these children, not onlywas their stature retardecl, but
their cnniofacial development as weU This clearly strengthens the cornlarion berween
somatic and caniofacial development.
D. Boys with Delayed Puberty
Delayed puberty is a variant of n o d development. These boys have a srnail stature
for their chr~nolo~ical age, but are u s d y appropriate for their skeletd age. Verdonck et aL
(1999) studied these teenaged males and found that in addition to the srnall stature, the
mandibular rarnus length, and T a length @Ba) were significantly shoner than in the
conuols. Verdonck explained this by conelating stature to nmus and T a lengths. He felt
that there is a generalized Qlay of these parameten because the pubertal gmwth spurt is
delayvd. No signtficant differences were found in total mandibular length, ACE! le& or
PU3 length. This studyagain shom the reiationship between somatic g r o d patterns and
the craniofacial cornplex.
E . Adults with Ac hondmplas ia
Achondruplasia is the most coxnmon foxm of short limbed d d i m This disorder
can be used to studythe effects of a b n o d endochondral bone formation on the
development of the skidi. Cohen et al. (1985) conducted a morphometric d y s i s of the
craniofacial c o n f i i t i o n in achondroplasia. They believed that if one part of the s k d was
affected adversely, inevitably other pans would suffer. Their investigation reveaied srnlang

ciifferences between achondroplastic and normal subjects. The achondroplastic subjects had
eniarged caivaria, shortened PCB, short UFH, shon maallary length, and short nasai bones.
These findings were consistent with those of Mitchell (1966). The mandible was of normal
size but of variable position. The most Lueresting discovery was that the ACI3 was found to
be normal. This was surprising as c d base is preformed in cartilage and endochondd
bone foxmation is known to be affected by achondroplasia. Therefore, one would expect to
find rnarked ~duction in ACi3 length. Cohen et al. explain rhis fmduig by referring to Moss's
Functiod Maviv Hypothesis. They state that since the brain is enlarging, the ACB is able to
respond to this increase in size and foliow the neural pattern of gmwth wirhout its
endochondml bone being affected Fuxthermore, they hypothesizd that since ACB contains
frontai bone, and frontal bone grows by membranous rather than endochondral gmwth, it
should not be affected by a pathologie endochondal process. The reduction in length of the
PCB is easier to understand as most of the deficiency is due to lack of gmwth at the SOS.
Smdies of achondroplastic children show that closure of the SOS happens fairiy eariy
pmbably pnor to age eight or nine. This serves to illustrate the concepts of diffemnd
developrnent of the various p m of the c d base. N o d growth and development of
SOS is essend for harmonious development of the c d base (Bjork, 1955). Short
mkuillary length and UFH are probably related to the hypoplastic gmwth of the nasal
capsule. This follows Scott's ideas that nasa cardage is integral to the development of the
face. The fact that mandibular size was not affected also &s sense as rnost of the
mandible &velops from membanous bone and therefore d d not be affected (Cohen et
al., 1985). Furthemore, the condylar cardage of the mandible is said to develop with a
different histology and biochemical composition than growth type carùlage, rendering no
effect from the achondroplasia gene (Weinmann and Sicher, 1955).
(3IAPTER3:
METHODS AND lMATERlALS
1 INTRODUCTION
It was the intention of this study to demonstrate the need for size adjusunent of
linear measurements in populations of diverse backgrounds and to develop a size adjusting
mechanism based on the c d base le&. A gmup of "ncrmal" children were used to
illustrate this principle. Groups of children such as those in the Buriington Gmwth Study
(BGS) show nomial disuibutions and variance for craniofaciai chammeristics and are useful
for study of craniofacd growth and developrnent. Tnditional cephalometric analyses were
performed on the radiogmphic records from the BGS, and the dimensions pertinent to this
study were recoded from cephalometric uacings. Heights were recorded from the patient
history profiles. The data were then analpd to idenufy comlations between the canial
base, body height and the dimensions of the face. A prediction mode1 for size adjusting the
iinear facial measurements based on the cranial base length was then attempted
II SAMPLE
A. Characteristics of the Population Selected from the Butlington Study
The Burimgton Growth Studysample was established in 1952 to evaluate the efficacy
and cost effectiveness of interceptive and preventive orthdontic marnent. Growth data
consisting of physical anthropomeuic measurernents and dentofacial recorb x r e
accumulated and used as a control sample for research purposes. The predominant racial
group compRsing the BurLngton population in the 1950's was Caucasian and mostly Anglo-
Saxon. 'Ihrough chance, no other ethnic populations were represented, yielduig a
homogeneous sampk. The local population in Burimgton at this time was of siightly higher

income rhan the national average. The birth yem of the sample used in this study ranged
from 1942 to 1952. The BurLngton sample is ideal to use in this project as the records were
d e n with a standardized technique. The magdication factor for the Burlington
cephdorneuic radiographs has been calculated as 9.84%
B. Ages of the Sample Populations
Lateral cephdograms and tmcings of the same onhodonticaUy untreated male individuah
(11-117) were snidied at two chronological ages: 12 and 18 +. At age 18, future growth of the
c d base and facial stnrctures is considered to be minimal and could therefore serve as a
reference that is relativeiy free of confounding variables.
It is useful to evaluate the need for size adjusting at age 12 as this is the age when most
orrhodontists will be taking iateral cephalogra~ for treatrnent pliammg puiposes.
Therefore, this is ais0 the age &ch serves as a &tabase for many research endeavors that
muid potentialy benefit from size adjusting. Confounduig variables at this age include
variation in the onset of puberty and the fact that growth is hghly inconsistent; either ahead
o r behind average values. 'Ihis serves to make cornparisons more difficult.
III ANALYSIS OF THE RECORDS
Hkights of the 117 individuals were obtained from the history profiles in the BGS.
Cephalometric data was obtained from iadiographs of the Burluigron sample.
k Tiacing of the radiographs
The cephalograms utilized in th& study have ali been traced by a skilled technician
(G.J.). Most of the luidmarks pertinent to thk investigation were plotted directlyoff the
uacings except for a few landmarks 0: intexsection point, ANS': antenor nasal spine', Gl:
glabelia) &ch had to be uaced from the original cephalogran See Appendix B page 82 for
an illustration of the kndrnarkr of the c r d base and facial complex.

Each of the r adopphs was secured to a light box in a darkened room and the
acetate m i n g was overiaid ont0 the cephalogram. A second piece of acetate was secured on
top and conventionai cephaiomeaic svucnues and points were ploned ont0 this sheet.
Important landmarks represented on the uacings were copied ont0 the second acetate, and
those that were not on the vacing n m ploned directly from the cephalomevic dog raph .
B. Cephalometric analysis
Once ploned on a traflsparency, the t h e e n landmarks were digitized u s h g the Dente
Facial Planner (Waker, 1995) and a custom made cephalometric analysis. ?bis custom
analysis consisted of seventeen measurernents from the c d base and the face. As noted,
the litemture reveded seved ways of defining the anterior and posterior iimits of each
parameter. niis study included a few different defiinitions of antenor and totai cranial base as
weJl as a few definitions for mandibular and nmdaty length and upper and lower face
height. Several definitions were used for each pamneter with the goal of idenufyuig those
craniai and facial segments that yield the most significant correlations. Onlythose paameteis
with the htghest level of correlations were carried further with statistical analyses. See
Appendix A (pg. 81) for definitions of the craniofacial landmarks in this study.
The cranial base measurements were as follows:
Antenor Ganial Base- 1 (S-N) mm Antenor G a n d Base-2 (S-1 point) mm Anterior G a n d Base-3 (S-Gr) mm Posterior Base (S-Ba) mm Total Oanial Base-1 WBa) mm Total Cranial Base-2 (SON + SBa) mm Total Ganiai Base-3 (I point-Ba) mm Ganial Base FIewre (N-SBa) degrees

The facial measurements were as foliows:
Mandibular Length- 1 (Con- Gn) mm Mandibular Length-2 (Ar-Gn) mm ltlhdhy Iangth-1 (Pm-ANS) mm Mamllary Length-2 (PNSSn) mm Ma2ahykngth-3 -ANS? mm Upper Face Ekight- 1 (N-ANS) mm Upper Face Fkight-2 (NAN!S? mm Lower Face IlkJeight- 1 (ANS-&) mm Lower Face Height-2 (ANS9-Me) nun
The sornatic dimension studied w:
Statclre (inches)
C Statistical mediodology
Descriptive statistics (means, ranges, standard deviations) of ali parameten were
calculated for the sample of 117 males at both age groups. No data were missing.
AU cranial base parameten for each iadividual were related to all facial, somatic, and
angular parameters by means of Peatsons correlation coefficients. Comlations were also
calculated berween body height and both the craniai and facial dimensions. The statistics
program MINITEMP was used to calculate these data. Based on an interpretation of Kappa
statistic, an r factor e q d to or above 0.4 was recognized as a good correlation. For each part
of the face and the cranial base, odythe segments with the smngest correlation coefficients
were carried further with statisrical analyses.
The worlaag hypothesis was that a group of children srnall in stature and cranial base
length should possess facial dimensions that are significantly less then those of a group of
larger children. To test rhis hypothesis, two different sets of t-tests were perfotmed using
SPSS. The nuii hypothesis assumed no differences in the linear facial dimensions.

Fint, the sample was divided into rwo groups bared on height (shodtall). The shon
group (O) consisted of the shortest individuai up to and including the mean height. The tall
group (1) was comprised of those individuals with heiphts above the mean. Ihe rnean was
chosen as a cutoff point as the sample displwd normal disnibution for height.
Table 3.1: Body height categotized as short or taii at age U and 18+
Ar both ages all 117 records were accounted for. The standard emr was reponed
A S Short (O)
instead of the standard deviation because the sizes of the groups were slightly different.
The second set of t-tests was camied out dividuig the sample into two groups based
on the length of the TCB to see if clifferences in facial dimensions existed berween those
n at 18+ 62
l2 54.0 - 59.1 1 inches
with srnail and large TCB lengths. The small group (O) consisted of the individual with the
n a t u 1 18 + 60 1 64.3 - 69.73 inches
shortest TCB length to the mean length. The mean was chosen as the cutoff point since the
disuibutions for T a were n o d n i e large group was coded as (1) and was comprised of
ail individuals above the mean.
Table 3.2: TCB length categotized as smaii or large at age 12 and 18+
n at 18+ 60
Age Srnail N-Ba (O) Large N B a (î) Mean TU3 1
12 97.7 - 108.82 mm 108.83 - 118.7 mm
108.82 mm
n at U 61 56
18 + 105.1 - 117.17 mm
1
117.18 - 127.2 mm 117.17 mm
57

From the correlation studies, both TCBl and T a 2 were found to have svong
relationships to the facd cornplex, and both wem used in funher analyses. At both ages all
117 record were accounted for. The t-tests were pexfonned pauing that paiticu1a.r TCE5
length and facial dimension diar had the strongest correlation. Because of the inequaiity in
sample six, standard erron were again dispiayzd instead of standard deviations. Note that
d mesuremenu were in rnillimetea except for the cranial base angle, which was in degrtes
and the height , wtiich aas in inches.
A N a V A (analysis of covariance) models were run to establish the iektionships
between body height and the facial dimensions while adjusting for TQ3 as a covariate. AU
adjustrnents were perfomd to the grand mean of the covariate TCB. ANCOVA modek
assumed the existence of a paralle1 rehtionship berween the short and tall groups. Height
was coded as (0) for short and (1) for tail, and the covariate TCü war continuous. The
significance of each of these factors and their contxibution to the variance of the facial
parametea were tabulated.
ANGOVA models were &O used to predict, within a 95% confidence interval, the
adjusted means of the facial dimensions for shon and tail groups while c o n m h g for the
covariate TCB. Adjusted means were compared to the unadjusted means to evaluate the
clinicai significance of t h pmess.
Lastly, a linear regression mode1 was developed. The anempt was to develop
fomulae rhat could be used to p~dict the adjusted means of the hear facial dimensions in
groups of people of hown height (short or di) using the mean TC8 base length as a guide.
ANGOVA models used for t h purpose would have yielded the same resulu.
Ail anaiyses were carried out at age 12 and again at age 18 +. AU tests were m t a i l e d
with the significance set at p < .OS.

DESCRIPTIVE ANALYSES
Linear measuremenrs were recorded for the facial and cruiial paameten from the
cephaiomeuic radiographs and for the heights of the individuah. No data sets were missuig
and d tables are based on a sample size of 117. nie means, anges, and standard deviations
were tabuiated for each parameter at age 12 and also ar age 18 and over.
Table 4.1: Table of means, ranges and standard deviations of the facial and cnnial dimensions and body height at age îî. (n=lll)
Dimension
Height ACB1
KEY: &ight Aa3I A m 2 AC83 PCB T C 8 1 TC82 TC83 MdLl
Range Mean
4
I MdLl I 1 14.05 1 104.9-123.0 [ 3.9 I
Standard Deviation
PCB 46.37 39.9 - 52.6
- Body height (iches) - Anterior cranial base 1, S-N (mm) - Antenor cranial base 2, S-1 point (mm) - Anterior cranial base 3, S-Gl (mm) - Posterior c d base, S-Ba (mm) - Total craniai base 1, N Ba (mm) - Total cranial base 2, S-N + S-Ba (mm) - Total c d base 3,1 point-Ba (mm) - Mandibuiar length 1, Con-Gn (mm)
2.6 3 .O
59.1 1 72.52
2.9
= Mandibubr kngth 2, Ar-Gn (mm) - Maxihy iength 1, PNS-ANS (mm) - Maxillary length 2, PNS-Sn (mm) - Maralkry length 3, PNS-ANS' (mm) - Upper face height 1, NAM (mm) - Upper face height 2, N'-ANS' (mm) - Lowier face he&t 1, ANS-Me (mm) - Lowr face height 2, ANS'-= (mm) - Ganial base flexure, NS-Ba ( Q g ~ s )
3.5
54.0-64.5 66.9 - 81.0 58.4 - 73.9 AU32
TCBl 108.82 a
65.36
TCB2 TCB3
118.9 105.42
110.5 - 128.5 1 4.3 94.9-115.6 1 4.1

Table 4.2: Table of rneans, ranges and standard deviations of the facial
KEY: He1ght ACB1 AC82 A m 3 PCB Ta31 Ta2 TC83 ml
and canial d 0 i n s & s and body height at age 18+. (n=117)
- Body height (inches) - Anterior cranial base 1, SN (mm) - Antenor c d base 2, S-1 point (mm) - Anterior c d base 3, SGl (mm) - Posterior cranial base, S-Ba (mm) - Total crand base 1, N-Ba (mm) - Tata c d base 2, SN + S-Ba (mm) - T d c d base 3,1 point-Ba (mm) - Mandibular length 1, Con-Gn (mm)
- Mandibuiar length 2, Ar-Gn (mm) - M;urillary iength 1, PNS-ANS (mm) - Maxilliuy iength 2, PNS-Sn (mm) - MaxiUary kngth 3, PNS- ANS' (mm) - Upper face height 1, IV-ANS (mm) - Upper face height 2, NAM' (mm) - Lower face height 1, ANS-Me (mm) = Lower face height 2, ANS-Me (mm) - Ganiai base flexure, NS-Ba (degrees)
Standard Deviation
2.6 3 -4 3.7
Dimension
Height ACB1 A-2
Mean
69.73 77.8 1 65.90
Range
64.3 - 76.4 69.9 - 87.2 58.4 - 74.1

II CORRELATIONS BETW'EEN THE CRANIAL BASE. BODY HEIGHT. AND THE FACIAL COMPLEX
Correlation coefficients and P values were tabulated to identdy the degree of
inter-~lationships berween the cranial base, body height, and the facial complex at age 12
and again at 18 +.
Table 4.k Cordation coefficients and P values between the size of the segments of the cnnial base, the facial dimensions and body height at age U. (n =IV)
KEY: Hr AU31 A m 2 A m 3 P m Tm1 TU32 TC83 MdLl
M d 3 .385 .123 .362 .187 .459* .394 .315 P= .O0 .185 .O0 .O43 .O0 .O0 .O0 1
- Body height (iches) - Antenor c d base 1, SN (mm) - Anterior c d base 2, S I point (mm) - Antenor cranid base 3, S-Gl (mm) - Posterior cranial base, S-Ba (mm) - Total c r a d base 1, N B a (mm) - Totai c d base 2, S N + SBa (mm) - Totai c d base 3,1 point-Ba (mm) - Mandibubr kngth 1, Con-Gn (mm)
,
MdL2 ml MxL2 MYCL3 UFHl W H 2 LFHl LFH2 CB<
- Mandibular length 2, Ar-Gn (mm) - M d l a r y Iength 1, PNS-ANS (mm) - M;uàllary hngth 2, PNS-Sn (mm) - Maxillary kngth 3, PNS- ANS' (mm) - Upper face height 1, NANS (mm) - Upper face height 2, N-ANS' (mm) = Lower face height 1, ANS-Me (mm) = Lower face height 2, ANS'-Me (mm) - Cranial base flexure, N S B a (degrees)
UFHI P=
UFHZ P=
LFHf ,
.182 -05
-200 .O3 .168 ,
-.O55 .558 -.O04 .965 .O69 ,
.191
.O39
.180
.O53
.140 ,
.416* .O0
.403* .O0 .158 ,
,386 .O0
,399 .O0
.272 ,
.406* .O0
.410* .O0
.225 ,
.266
.O04 (
.299
.O0 1
.206 ,

Table 4.4: Comiation coefficients and P values between the size of the segments of the cranial base, the facial dimensions and body height at age la+. (n=117)
KEY: Kr A m 1 Am2 AC83 P m Ta31 T a 2 TC83 MdLl
- Body height (inches) = Antenor c d base 1, S N (mm) - Anterior cranial base 2, S-1 point (mm) - Antenor cxaniai base 3, SGI (mm) - Posterior cranial base, S B a (mm) - Tod c d base 1, N-Ba (mm) - Total c d base 2, S-N + S-Ba (mm) = Total c d base 3,1 point-Ba (mm) - Mandibular length 1, Con-Gn (mm)
- Mandibular length 2, Ar-Gn (mm) - Maxhyiength 1, PNS-ANS (mm) - Maxdhy iength 2, PNS-Sn (mm) - Maxdary kngth 3, PNS- ANS' (mm) - Upper face height 1, N ANS (mm) = Upper face height 2, N-ANS' (mm) - Lower face height 1, ANS-Me (mm) - Lower face height 2, ANS'-Me (mm) - Ganial base fiexure, NS-Ba (âegnxs)

Conelation coefficients and P values were also tabulated to identify the relationships
berween body height and the facial parameten.
Table 4.5 Comelation coefficients and P values between body height and the facial dimensions at age 12. (n=ll7)
= good conelation exists (r24)
Table 4.6: Conelation coefficients and P values between body height and the facial dimensions at age 18+. (n=117)
CB< - .121 .194
L F M 258 .O05
* = good correlation exists (ra4)
LFHl 243 .O08
KEY: Ht Ta31 TC82 TG33 MdLl MdL2 MxL1 MxL2 MxL3 UFHl uFH2 LFHl LFH2 CB<
- CB < -.192 ,038
- Body height (iiches) - Total cranial base 1, N-Ba (mm) - T o d c r a d base 2, S-N + S- Ba (mm) - Tod c r a d base 3,1 point-Ba (mm) - Mandibular length 1, Con-Gn (mm) - Mandibular length 2, Ar-Gn (mm) - Mwlkry length 1, PNSANS (mm) - Mvallary length 2, PNSSn (mm) -; MaiciUary hngth 3, PNS ANS' (mm) - Upper face height 1, N-ANS (Mn) = Upper face height 2, N-ANS' (mm) = Lower face height 1, ANS-Me (mm) - Lower face height 2, ANSs-Me (mm) - Cranial base flexure, NS-Ba (degrees)
UFHl .506 * .O00
Ht UFHZ ,481 * .OW
, MxL2 234
LFH1 .160 .O85
MxU .259
MdLl -583 *
LFH2 .183 .O49
MxL3 .O73 .435
MxL2 .O78 .401
.O05 P
MxL1 .O28 .767
MdL2 -582 *
UFHl .398 .O00
MdL2 ,414 * .O00
Ht P
.O00
, MxLl .304
UFH2 .380 .O00
MdLl .470 " .O00
,000 .O01 1 .O1 1

The svongest comlatiom between al1 segments of the c d base, body height and facial
complex were as follows at age 12 and 18 +:
Table 4.7: Comelations ( r 2.4) between the facial complex and the c ranial base and the associated 95% confidence interrals.
Table 4.8: Coneiations (r 2.4) between height and the cranial base and face and the
Facial Parameter
associated 95% confidence inte&&.
Cranial Parameter
r at age 12 L
.303 -.592
.303 -.592
.250 -.552
.236 -.542
Con-Gn PM-ANS' N- ANS' CB angle
CI
Height
At both ages, body height dispiayed the strongest conelations to rnandibular length, upper face
height and totai c d base length. The weakest comlation was to m+ length.
Of all aspects of the c d base, total craniai base length pmved to be the smngest correlate
to the face and body height.
For both age groups, total cranial base length (N-Ba) correlated the smngest with maxillary
length and c d base angle. N-Ba to lowr face height was weakly correlated.
At age 12, total c r d base length (SN + S-Ba) displayed the smngest comlations to
rnandibular length and upper face heght. At age 18 + the relationships weakened
Al1 further statistical analyses were perfomed using only the panmeters in the tables
above whic h demonstrated the stmngest conelations. Furdier discussion includes
only those conelations stmnger than r 20.4
-37 .48 .23 .39
S-N +S-Ba N-Ba
S-N + S-Ba N-Ba
r at age 18 +
.201 -.SI7
.327 -.609
.O50 - 395
.225 -.534
.46
.46
.4 1
.40
GaniaVFacial Panameter
L
95% U
Fkight Height Ekkht
r at age 12
S-N 4-Ba Con- Gn NANS'
.5 1
.58
.5 1
.362 - .633
.445 - .689 ,362 -.633
.39 -47 .39
9S0h Ci ' r at age 18 +
.225 - .534
.315 - .6W 225 - .534
9S0/0 CI

III BIVARIATE ANALYSES
T-tests perfoxmed with the sample categorizd by height found significant
differences between the short and d groups for aU linear dimensions at age 12 and ail but
maxdhylength at age 18+.
Table 4.9: T-tests of unadjusted values to cornpart facial dimensions between short and ta1 groups at age 12. (n =IV)
P value (2 taiied) .O00 *
Facial dimension Mandibular length
Con-Gn Maxillary length
PNS-ANS' Upper face height
N-ANS' Lower face height
ANS'-Me
: P value under .OS; t-test for 2 independent samples
Short TaIl Short
Cranial base angle
Table 4.10: T-tests of unadjusted values to compare facial dimensions between short and tall gmups at age 18 +. (n =IV)
Stanlrd emr -4 t -43
Height' Short Ta11
Short Ta11
Mean 11 1.9 1 16.3
Tail 55.8 -3 5
50.4 51.6 53.5
1: Short - 54.0 - 59.1 1" with a mean of 57.1n, TaU = 59.12 - 64.5" with a mean of 61.3"
Short Ta11
1: Short - 64.3 - 69.75" with a rnean of 67.7", Tall = 69.76 - 76.4" with a mean of 72.0"
62.9 65.1
Facial dimension Mandibular length
Con-Gn Maxillary length
PNS-ANS' Upper face height
N-ANS' Lower face height
*: P value under .OS; t-test for 2 independent s-amples
.3 1
.43 -36
L - -
132.0 130.9
.O29 *
.O00 *
.5 1 -63
ANS'-Me 'I
Ta11 74.2 .64 Cranial base angle Short 132.2 .57 .O73
I Ta11 130.4 .80
Heightl Short Ta11
.O07 * I
-59 .74
Mean 129.0 133.2
.257
Standard e m r .54 .59
Short Ta11 Short Ta11 Short
P value (2 taiied) .O00 *
.35 -46 .37 .46 .72
55.9 56.5 58.6 60.7 7 1.7
.3 16
.O00 *
.O12 *

T-tests performed with the sample categorized by T a length found signifiant
clifferences berween the small and large TCB groups for al1 linear dimensions at age 12 and
al but LFW at age 18+.
Table 4.11: T-tests of wiadjusted values to compare facial dimensions between p u p s with large and small total cranial base length 1 at age 12. (n=117)
1: N-Ba length is defined as Sm&= 97.7 - 108.82 mm with a mean of 105.5 mm, Large - 108.83 - 118.7 mmwith a mean of 112.5 mm
*: P value under .OS; t-test for 2 independent samples
P value (2 taiied) .OOO *
.O25 * Q
M ' - M e Ganiai base angle
Table 4.12. T-tests of unadjusted values to compare facial dimensions between p u p s with large and small total cnnial base length 2 at age 12. (n=117)
Facial dimension Maiullary lengrh
PNS-ANS' Lower face heieht
Facial dimension 1 S N + SBa 1 Mean 1 Standard error 1 P value (2 taiied)
Mean 49.7 52.3 63.1
N-Ba le@ 1
SmaU Laqe Srnall
e Smali Large
Standad e m r .3 1 .38 .54
1: SN + S B a le& is defined as Small - 110.5 - 118.9 mm with a mean of 115.4 mm, Large = 118.91 - 128.5 rnmwith a mean of 122.6 mm
*: P value under .05; t-test for 2 independent samples
Mandibuiar length Con-Gn
Upper face height N- ANS'
.O00 * 65.0 129.8 133.3
-62 .62 -64
le* 1
Srnall Large Srnall
e
112.7 115.4 53.7 55.6
-49 -46 .40 .34
.O00 *
.O01 *

Table 4.13: T-tests of uiiadjusted values to compare facial dimensions between p u p s with large and srnall total cnnial base length 1 at age 18 +. (n =IV)
1: N-Ba length t defined as Srnail - 105.1 - 117.17 mm with a mean of 113.5 mm, Large - 117.18 - 127.2 mm with a mean of 121.1 mm.
: P value under .05; t-test for 2 independent samples
P value (2 taiied) .O00 *
.945
Facial dimension m
PNS-ANS' Lower face height
M ' - M e Gluiia base -le
Table 4.14: T-tests of unadjus ted values to compare facial dimensions between gmups with large and small total cnnial base length 2 at age 18 +. (n =IV)
[ Facial dimension 1 S N + SBa 1 Mean 1 Standard e m r 1 P value (2 tded)
N-Ba le*' S d Large Srnall L q e S mal1
Mean 55.0 57.5 72.9 72.9 129.5
length t Mandibuk le& 1 Small
1: S-N + S-Ba length is defined as Small = 116.9 - 128.08 mm with a mean of 124.6 mm, Large = 128.09 - 138.1 mmwith a rnean of 132.4 mm
*: P value under .05; t-test for 2 inde pendent samples
Standard e m r .36 .37 .74
V
Con-Gn Upper face height
N- ANS'
KEY: TCB 1 - Total cranial base 1, N- Ba (mm) TCB2 - Total c m d base 2, S-N + S-Ba (mm) MdLl - Mandibular length 1, Con-Gn (mm) MxW - Maxiliary length 3, PNS- ANS' (mm) UFHZ - Upper face height 2, N-ANS' (mm) L.FHî -Lowerface height2,ANS'-Me (mm) CB < - Ganial base flexure, N-S-Ba (degrees)
-67 .6 1
130.0
.O00 *
.56
.O03 * Large Small Lame
.O12 * 132.2 58.8 60.6
$67 -40 .44
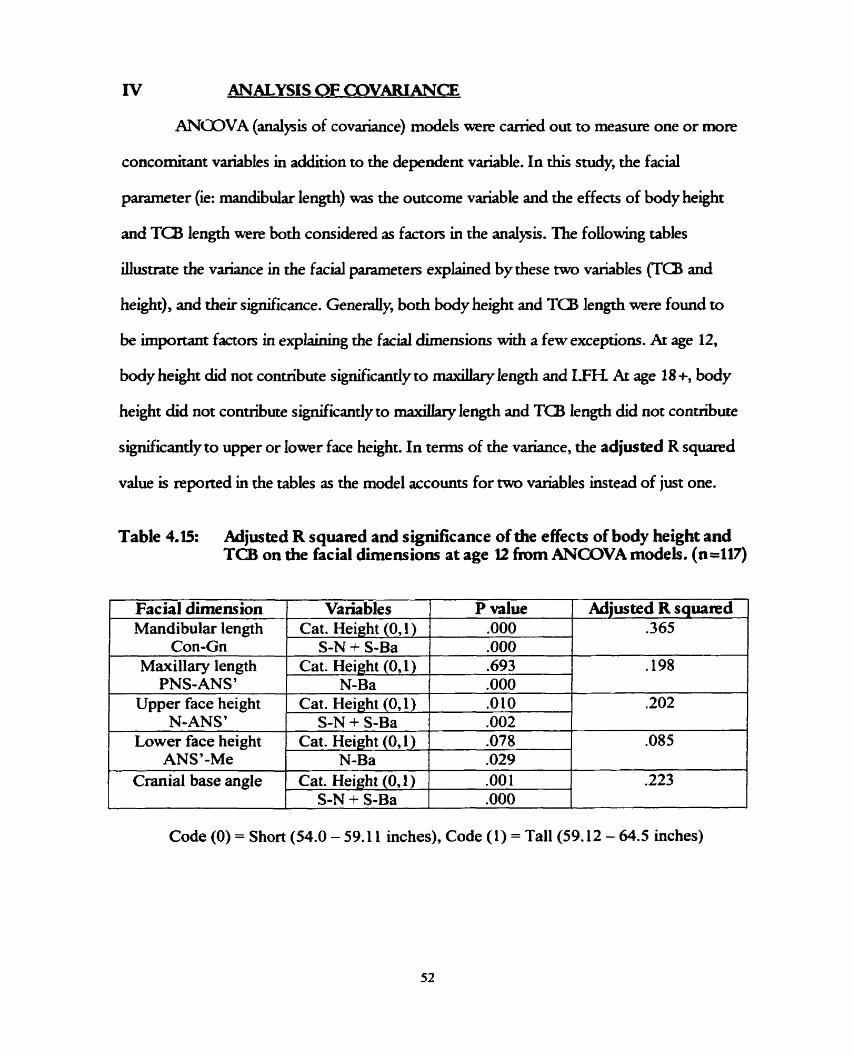
ANALYS1 S OF COVARIANCE
ANCDVA (analysis of covariance) models wete canïed out to mesure one or more
concomitant variables in addition to the dependent variable. In this study, the farial
parameter (ie: xnandibular length) war the outcome variable and the effects of body height
and T a length were both considered as factors in the analysis. The folowing tables
illusvate the variance in the facial parameten explained by these rwo variables (Ta and
height), and their signrficance. Genedy, both body height and TCB length were found to
be important factors in explainhg the facial dimensions with a few exceptions. Ar age 12,
body height did not contribute significandy to maiollary length and LFTL At age 18 +, body
height did not contribute significantiyto m;uallary length and TCB length did not contribute
sisnificantly to upper or lower face height. In ternis of the variance, the adjusted R s q m d
value is reponed in the tables as the mode1 accounts for two variables instead of just one.
Table 4.15: Adjusted R s q u a ~ d and significance of the effects of body height and TCB on the facial dimensions at age It h m ANGOVA models. (n=117)
- -
Code (O) = Short (54.0 - 59.1 1 inches), Code (1) = Ta11 (59.12 - 64.5 inches)
Adjusted R squared .365
.198
.202
.O85
.223
P value .O00
Facial dimension Mandibular length
Variables Cat. Height (0,1)
Con-Gn Maxillary length
PNS-ANS' Upper face height
N-ANS' Lower face height
ANS7-Me Cranial base angle
S-N + S-Ba Cat. Height (O, 1)
N-Ba
.O00
.693
.O00 Cat. Height (O, 1) 1 .O10
S-N + S-Ba 1 .O02 Cat. Height (O, 1) ] .O78
N-Ba Cat. Height (O, 1)
S-N + S-Ba
.O29
.O01
.O00

Table 4.16: Adjusted R s q u a ~ d and significance of the effects of body height and TU3 on the facial dimens ions at age II) + h m ANGOVA rnodels. (n =IV)
Code (O) - Short (64.3 - 69.75 inches), G x i e (1) = TaU (69.76 - 76.4 inches)
Adjusted R s q u a ~ d .22S
.213
Fac h l dimension Mandibular length
Con-Gn Maxillary length
PNS-ANS'
Cranial base angle
KEY: Height - Body height (inches) Ta1 = Total c r d base 1, N-Ba (mm) TCB2 - Total cranial base 2, S-N + S-Ba (mm) MdL 1 - Mandibular length 1, Con- Gn (mm) MxL3 - Maxillary length 3, PNS ANS' (mm) U F W = Upper face height 2, N- A N S (mm) W H 2 = Lower face height 2, ANS'-Me (mm) CB < - Ganial base flexure, N-S-Ba (degrees)
Upper face height N-ANS'
Lower face height ANS'-Me
Variables Cat. Height (0,l)
S-N + S-Ba Cat. Height (0,l)
N-Ba
Cat. Height (O, 1) S-N + S-Ba
P value ,, .O00
.O09 ,726 .O00
Cat. Height (O, 1) S-N + S-Ba
Cat. Height (O, 1) N-Ba
.O0 1
.O00 .2 14
.O05 -102
.204
.O25
.4 12 .O43

ANOOVA was also used to p d c t , with a 95% confidence intend, the adjusted
means of the facial dimensions in shorc and ta11 groups while convoiling for the covariate
Table 4.17: Adjusted means and 95% confidence intenals of the facial dimensions for shori and taii gmups conttouing for the covanate T a at age 12. (n=ll7)
Facial dimension
Mandibular length Con-Gn
Maxillary length PNS-ANS'
Upper face height N-ANS'
Lower face height ANS'-Me
Table 4.18: Adjusted means and 95% confidence intemis of the facial dimensions for shoir and tau gmups conttolüng for the covanate TCB at age 18 +. (n=117)
Cranial base angle
Height
Short Tall
Short Ta11
Short Ta11 Short Ta11 Short 132.9 131.7 1 134.1 1
Adjusted means 1 12.3 1 15.9 50.9 51.0 53.9 55.4 63.3 64.8
Facial dimens ion
Mandibular length Con-Gn
Maxillary length PNS-ANS' ( Upper face height
N-ANS'
95% Confidence interval
KEY: Height -Bodyheight (inches) MxW - Maxilky length 3, PNS-ANS' (mm) Ta1 - Total c r d base 1, N B a (mm) UFH2 - Upper face height 2, NANS' (mm) TC82 - Total cranial base 2, S-N + S-Ba (mm) LFH2 - Lowier face height 2, m ' - M e (mm) MdLl - Mandibubr length 1, Con-Gn (mm) Cl3 < - G.anial base flemire, N S B a (degrees)
95% Confidence intewal .
Height
Short Tall
Short Ta11
Lower bound 128.3 131.5 55.6 55.3
Short Ta11 1 Lower face height
ANS'-Me Cranial base angle
Lower bound 11 1.5 115.0 50.2 50.4 53.2 54.6 62.1 63.6
Adj us te d means 129.4 132.7 56.3 56.1
Upper bound 130.5 133.9 56.9 56.8
71.8 74.1
- --
short Tall
Upper bound 113.2 1 16.8 5 1.6 5 1.8 54.6 56.1 64.4 65.9
58.8 60.6
- ----
Short Ta11
70.5 72.7
57.9 59.7
73.2 75.5
1
59.6 61.5
134.0 131.0
132.8 129.8
13 1.6 128.5

Table 4.19: Cornpanson of adjusted and unadjusted rneans of facial dimensions at age 12 where TCB is adjusted to the grrnd mean (n=117)
Table 4.20: Cornpanson of adjusted and unadjusted means of facial dimensions at age 18+ when: TCB is adjusted to the gnnd mean. (n=117)
Facial dimens ion Height Unadjusted 1 Adjusted 1 Diffe R nce 1
Diffe~ience
0.4 -0.4 0.5 -0.5 0.4 -0.4 0.4 -0.3 0.9 -1.0
Facial dimension -
Mandibular length Con-Gn
Maxillary length PNS-ANS'
Upper face height N-ANS '
Lower face height ANS7-Me
Cranial base angle
Height
Short Ta11
Short Ta1 1
Short Ta1 1
Short Ta11
Short Ta11
~andibul&-lëngth Con-Gn
Maxillary length 1 PNS-ANS'
Unadjusted means 11 1.9 1 16.3 50.4 51.6 53.5 55.8 62.9 65.1 132.0 130.9
Short Tai1
1 upp& face height N-ANS'
Adjus ted means 1 12.3 1 15.9 50.9 51.1 53.9 55.4 63.3 64.8 132.9 129.9
Short Ta11
Lower face height ANS'-Me
KEY: Height - Body height (inches) MdLl - Man&& length 1, Con-Gn (mm) M x U =1VLiOllYylen&3,PNS-ANS(mm) UFHZ = Upperface height 2,N-AP'Pi'(mm) LFW2 - Lowr face height 2, ANS'-Me (mm) CB < = G.anial base flexure, N-SBa (degrees)
129.0 133.2
Short Ta11
Cranial base angle
55.9 56.5
Short Ta11
129.4 132.7
58.6 60.7
Short Ta11
O .4 -0.5
56.3 56.1
71.7 74.2
0.4 -0.4
58.8 60.6
132.2 130.4
0.2 -0.1
1
7 1.8 74.1 132.8
O. 1 -0.1 0.6
129.8 -0.6 .
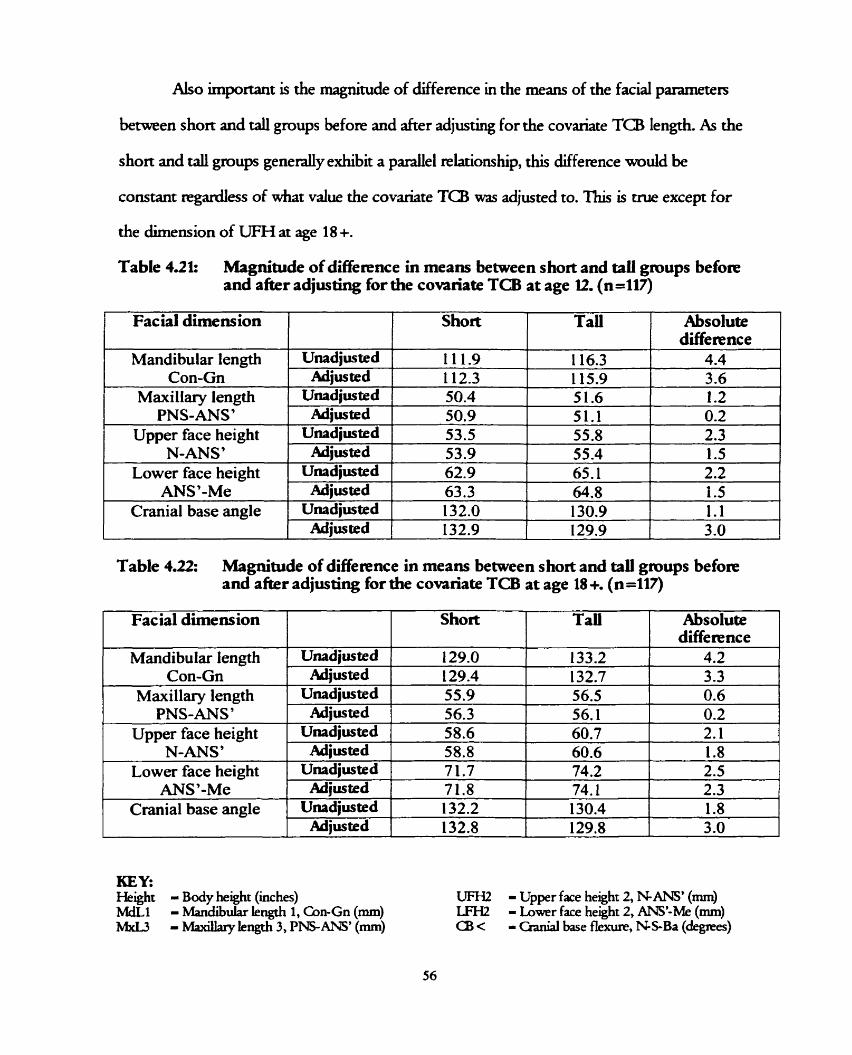
Also important is the magnitude of difference in the means of the facial panmeten
between short and ta11 groups before and after adjus* for the covariate TC8 lengrh. As the
short and d groups genedy exhibit a p d e l relationship, this difference would be
constant regardfess of whar vaiue the covariate TCB was adjusted to. 'Ihis is crue except for
the dimension of UFH at age 18 +.
Table 4.21: Magnitude of difierence in meam between short and taIl gmups befoa-e and a k r adjusting for the covnriate TCB at age 12. (n=117)
Con-Gn
Facial dimens ion
Maxillary length PNS-ANS'
Upper face height N-ANS'
1 Lower face heirrht 1 Unad
1 Cranial base angle K
Absolute difference
Short
sted 1 1 12.3 1 1 15.9 1 3.6
TaU
iusted 50.4 51.6 1.2 sted 50.9 5 1 . 1 0.2 mted 53.5 55.8 2.3 sted 53.9 55.4 1.5 usted 62.9 65.1 2.2 sted 63.3 64.8 1.5 usted 132.0 130.9 1 . 1 sted 132.9 129.9 3 .O
Table 4.22: Magnitude of difference in means between short and tau gmups b e f o ~ and a k r adjus ting for the covanate TCB at age 18 +. (n =IV)
Facial dimension
Mandibular length Con-Gn
Maxillary length PNS-ANS'
Absolute difference
Short
U n a d j ~ e d Adiusted
Upper face height N-ANS'
KEY. Helght - Body height (iches) MdL1 - Mandibuiar length 1, Con-Gn (mm) M d 3 - Miucillary kngth 3, PNSANS' (mm)
Tau
~nadjusted Adiu~ted
Lower face height ANS '-Me
Cranial base angle
UFH2 - Upper face height 2, N-ANS' (mm) LFI-I2 - Lower face height 2, ANS'-Me (mm) Ci3 < - Ganiai base flexure, NS-Ba (degrees)
129.0 129.4 55.9 56.3
~nadjmted ' 58.6
133.2 132.7
60.7 60.6 Adius ted
2.5 2.3 1.8 3 .O
~mdjusted i 7 1.7 74.2
4.2 3.3 -
56.5 56.1
2.1 1.8 58.8
0.6 0.2
74.1 130.4 129.8
Ahjus ted Unrdjued
Adjusted
7 1.8 132.2 132.8
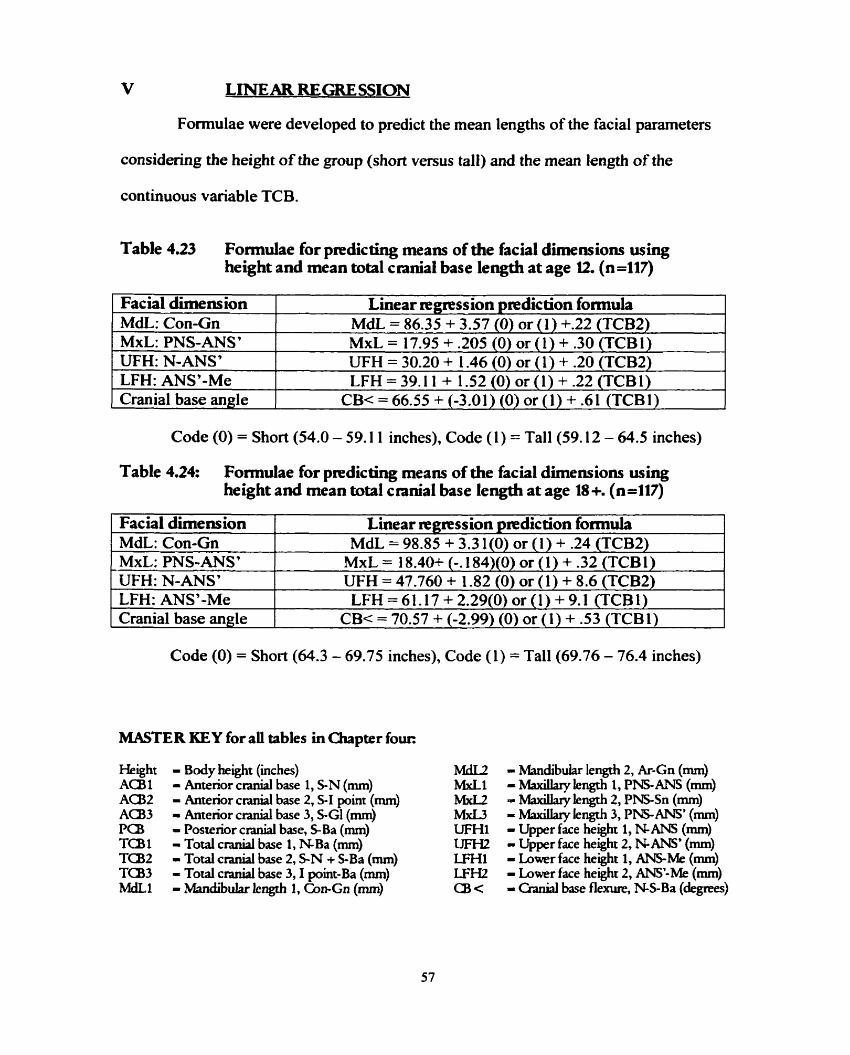
Formulae were developed to predict the mean lengths of the facial parameters
considering the height of the group (shon versus tall) and the mean length of the
continuous variable TCB.
Table 4.23 Formulae for predicting means of the facial dimensions using height and mean total cnnial base length at age U. (n=117)
Code (O) = Short (54.0 - 59.1 1 inches), Code (1) = Tall(59.12 - 64.5 inches)
Facial dimens ion MdL: Con-Gn MxL: PNS-ANS' UFH: N-ANS' LFH: ANS'-Me Cranial base angle
Table 4.24: F o d a e for p~dicting means of the facial dimensions using height and mean total cranial base length at age 18 +. (n=117)
Linear mgmssion prediction fornida MdL = 86.35 + 3.57 (0) or (1) +.22 (TCB2) MxL = 17.95 + .205 (0) or (1) + .30 (TCBI) WH = 30.20 + 1.46 (0) or (1) + .20 (TCBS) LFH = 39.1 1 + 1.52 (0) or (1) + .22 (TCBI)
CB< = 66.55 + (-3.01) (0) or (1) + .61 (TCE31)
Code (O) = Short (64.3 - 69.75 inches), Code (1) = Ta11 (69.76 - 76.4 inches)
Facial dirnens ion MdL: Con-Gn MxL: PNS-ANS' W H : N-ANS' LFH: ANS'-Me Cranial base angle
MASTER KEY for ali tables in Chapter four:
Linear rrgmssion p~diction formula MdL = 98.85 + 3.3 l(0) or (1) + .24 (TCB2)
MxL = 18.40+ (-. 184)(0) or (1) + .32 (TCB1) UFH = 47.760 + 1.82 (0) or (1) + 8.6 (TCB2) LFH=61.17+2.29(0)or( l )+9.1 (TCBl)
CB< = 70.57 + (-2.99) (0) or (1) + .53 (TCBI)
Height ACB1 AC82 AC33 Pa3 TC81 TC82 TC83 ml
- Body height (inches) - Anterior c d base 1, S N (mm) - Antenor craniai base 2, S-I point (mm) = Anterior c d base 3, SGl (mm) - Posterior cranial base, SBa (mm) - Total c d base 1, N B a (mm) - Total c d base 2, S-N -t S-Ba (mm) - Total cranial base 3,1 point-Ba (mm) - Mandibuiar kngth 1, Con-Gn (mm)
- MandibuLu lengrh 2, Ar-Gn (mm) - Maxillary length 1, P I S ANS (mm) - Maxdhy le& 2, PNS-Sn (mm) = M;uallary length 3, PNS-ANS' (mm) - Upper face heght 1, N ANS (mm) - Upper face herght 2, N-ANS' (mm) - Lower face height 1, M M e (mm) - Lower face height 2, ANS-Me (mm) - Ganial base flexure, NS-Ba (depes)
DISCUSSION DESCRIPTIVES
Descriptive statistics of ail panmeters were cakulated. The data appeared to foilow
normal patterns and disuibutions for the age groups stuclied and h o s i s was not significant.
The means and ranges were used in the statisticai anaiyses to recode the data In this study,
body height was often used as a categoncal variable, and renarned "Caregoricd Wight" with
the value (0) for short, and (1) for tall. For exarnple, at age 12, the range in height was from
54.0 - 64.5 inches and the mean was 59.1 1 inches. The disuibution of height was n o d
and the mean was chosen as the cutoff points in categorization. The group was then recoded
into a short group (O) spanning 54 to 59.1 1 inches and a td gmup (1) from 59.12 to 64.5
inches.
II CORRE LATIONS
Based on an interpretation of Landis and Koch's (1977) Kappa classifications, an r of
O - 39 was a margmal comlation, good correlations were considemd 1) - .75, and above .75
was excellent.
A. Antenor Cxanial Base
The ma& attaches to the midline ACB and the ~iatldible attaches to the laterai
aspect of the posterior c d base. Therefore, the m d a was assurned to have stronger
conektions than the mandible to the Am. In this study, rhat premise was supported with
srronger comlations found between ACB and m;uollary length than ACB and mandibular
length at age 12 and also at age 18 +. The strongest correlations involving ACB at both ages
were between S-N and mkuillary le@ PNSANS' (.39 at 12, .45 at 18 +). This is interesring,
as it confirms the popular use of S N to define the AC6 and also suggests that maxdhy
length may best be defined as PNSANS' instead of the typicd PNSANS. The point ANS is
often obscured in radiographs, o r is a cWenge to identify. ANS' is the rnidpoint b e m e n Sn
and Sn', which mark the most inferior and superior points on the anterior concavity of the
m;utill? with a vertical distance of 3mm between them. This poim c m readdy be found even
when ANS is impossible to visualize. In light of this, perhaps ANS' should be recognized as
a better anterior limit of the d in cephalornetnc studies.
At age 12 and 18+, as expected, marginal comktions were found between ACB and
rnandibular length. The strongest of these comktions (35 at 12, .3 1 at 18 +) was berween S
N and mandibular length Gn-Gn.
Kasai (1995) found sigruficant comlations between ACB and UFH as weli as ACf3
and LFtt In this study, only vely weak correlations were discovered for these parameters.
Marginal comlations were also found for ACE3 and cranial base flexure as well as ACB and
body height.
For ail correlations tabulared, S-1 point had much lower r-values than the other
definitions of A a . 1-point was the "intersectionn point developed in this study where the
midplaned roof of the orbit inteaected the inner contour of the frontal bone. This point
kept this segment of ACE3 purely intemal, free of any influence of the frontal bone.
had its tennllia point at nasion and AU33 ended at glabella, therefore both were affected by
growth of the face and frontal bone. One can assume these "extemal" c d base segments
displayed higher comlations to the facial parameten, as both were affected by the skeletal
pattern of growth.
Poste nor Cranial Base
Posterior c d base conelated weakiy to both the maxïlla and the mandible,
although the comlation was srronger to the mandible. Ar age 12, the correlation between
PCE3 and rnandibular length Con-Gn was fair with a r-value of .32, but it decreased ro 22 at
age 18 +. Noteworthy is that at both ages, the comlation was much svonger to Con-Gn
than Ar-Gn. This suppom using the dimension Con-Gn to define the length of the
ma~ldible.
The suongest correlation factor involving PCB was to body height. This factor was
good (.43) at age 12 but m a r g d (.34) at age 18 +. The svength of this correlation is likely
due to the fact that SOS growth rates into puberty are similar to growth rates for stanire.
Smahel and S M o v a (1988) reported correlations between P a and postenor upper
face height (PNS to the SN he). Kasai (1995) aiso found sigruficant conelations between
PCB and UFH (NANS). In this study, good comlations wex discovered benveen PCB and
UFH at age 12, but they decreased into only fair conelations at age 18 +. Very weak
comlations were reported for PCE3 and LFH at both ages. Conelations were similar whether
ANS or ANS' was used Therefore ANS does not seem to provide as much challenge or
ermr d e n used for masuremenu involving vertical heights as it does d e n used as a
terminal point for horizontal lengths such as maxdhy lengdi.
At both age 12 and 18+ PCB displayed an inveae ~lationship to c r d base
flexure. Our data is in agreement with previous work done by Andenon and PopovKh
(1983) who also used the BuXiington Growth Study and found the same inveae relationship
between PCB (S-Bo) and c d base flexure in children aged 12 and 16.

C Total &niai Base
The totai c d base was defined three different ways in this study. 1-point to Ba
displayed no smng correlations to any of the facial panmeten and could therefore be
eliminated from the discussion. Again, the reason is because when 1 point is use& the
mesure is suictly "intemal" and therefoie does not comiate as wel to linear facial
dimensions which axt affected bythe "extemai" or skeletai pattern of gmwth.
The svongest comlations involving mandibular length Con-Gn were when TCB
was defined as S N + S-Ba 'Ibis comlation factor was good (.46) at age 12 but m;uguial
(.37) at age 18 +. Regarding mknllary length, the smngest comlations were found between
N B a and PNSANS'. At both ages the correlations were good (A6 at 12, .48 at 18+). Kasai
(1995) reported fin* in 10 p r old boys d e n : N B a had a smng correlation to
rnaxillary length but a weak comiation to mandibular le&. 'Ihis was &O found in this
study where N B a showed consistently stronger correlations to the length of the maxiila.
Convashg opinions exist on whether TCl3 correlates to facial height. Scon (1953)
~ p o r t e d that N B a did not correlate to the face height d e Smahel and Skadova (1988)
showed that N B a was conelated to both upper and lower face heights. In this study at age
12, a good correlation (-41) was found between S-N + S-Ba and UFH. The conehtion was
aimost identical d e t h e r ANS or ANS' was used At age 18+, ail comlations between UFH
and T(B were insignificant. For both ages, correlations between LFH and TC6 weie also
veiy weak and will be excluded fmm the discussion.
Body height and S-N + S-Ba were ml1 comlated at both ages (.5 1 at 12, -39 at 18).
G a n d base flexuce exhibited a good comiation to N B a (.40 at 12, .39 at 18+). This
pattern supports p~v ious studies b y Andenon and Popovich (1983), and Bjork (1955) who
demonsvated that where the T a length is small the CB angle is accordingly small.
D. Body Height
Bahmba (1961) reported correlations between c d measurements and body
facial and c d dimensions. Solow (1966) &O found that a gened association existed
between cranial measu~s and the size of the body in young male ad&. Hk rereporred on a
set of low positive correlations becween height and rnost of the linear cephalomeuic
measuriements.
In this study, the correktions were also positive at both ages except for the
interaction of height and c d base angle, *ch displayed an inverse relauonship. Ar age
12, the facial and c d comlations to stature were good for mandibular length (.58),
upper face height (.SI), and total c r d base length (SI). At age 18 +, the correlation to
mandibukr length was still smng (.41), but the comlations to upper face height and T a
decreased (.39). Gnelations to lower face height and maxhtylength were marginal at 12
and 18+.
One can specuiate that body height, length of the mandible, UFH, and T a ail
follow the sarne gened skeletal pattern of growth. Body height is known to be genetically
determineci, as is the length of the mandible. The position of the mandible may be
influenced by environmental factors that cause rotation, but the absolute lengrh rernains
unchanged Upper face height could also foilow a genetically detennined path which is
closely related to growth of the cïvus. Furthemore, ANS is more likelyto be affected
horizontally byenvironmental factors than in a vertical direction. This means any
environmental influences would not sigdicantly affect the measurement of UEFL The
midline c d base is known to foilow n e 4 growth c w e s in some amas and skeletal
g m d c w e s in others (Ford 1958). In this study, TC!3 (SN + S-Ba) appears to foilow the

skeled pattern of growth more closely than the neural pattern based on its correlations to
mandibular length and body heïght.
Interestingly, maxihy length and LFH were poorly correlated to body height. 'Iliis
suggests that they folow different counes of growth or are largely affected by enWonmental
factors. An example of the duence of environmentai facton on the length of the manlla is
reported by Linder- Aronson (1970). His s d y compared children d o underwent
adenoidectomy for obsuucted nose brearhing to a conuol group of children with no
adenoids. Those cM&n with large adenoids tended to be mouth breathers and continually
held their mouths in an open position. The open mouth p o s ~ brought about supra-
eruption of the postenor dentition &ch war associated with a down and backwards
rotation of the mandible causing an increase in LFH The hyperactive lip muscles then
created a svain on the maxdhy bones that caused remodeling of the mavilla anterioriy.
SUMhrlARY
Existing correlations between the cranial base, height, and the facial complex were
identif ied Furthe r statistical analyses involved only those parameten with the svonges t
interactions as they offered the most meanuigful results. The definitions of these parameters
should be used in future studies involving craniofacial growth and development.
Correlations were generally smnger at age 12 compared to 18 +. This is likely due to
the similanty in facial and c d growth patterns and mes while the chiid is entering
pubeny. The correlations weaken at age 18 as the growth rates diversify. The TCB length
demonsvated the highest correlations to body height and the facial complex. At both ages,
N B a was found to have good comlaüons to maxd.hy length and cranial base flexure but
weak correlations to lower face height. At age 12, N-S + S-Ba had good comlaüons to
mandibukr length, upper face height, and body height bm these relationships were weaker at
age 18 +. Body height was also well correlated to rnandibular length and upper face height.
III BIVARIATE ANALYSES
Body height and the length of the TCa were both identified as parameters that were
comlated to the linear dimensions of the facial complex. Therefore, one can make the
assumption that groups who ue short, or who possess srnail mean TC5 lengths d ais0 be
small in linear dimensions of the facial complex. The converse should also be valid for dl
groups with large mean TCB length. T-tests were perfonned to test this hypothesis. The t-
test for two independent samples iiiustrated whether differences existed for the unadjusted
linear facial measurements between short and r d groups, and between groups with s m d
and large TC5 lengths.
The f i t set of t-tests was done with the sample divided by height into t w ~ groups:
short (0) and ta11 (1) as descnbed on page 41. The n d hypothesis was that the= were no
differences in linear dimensions of the face between groups who were short and tall. The
folowing facial parameten were investigated: mandibular length Con-Gn, mk.ollary length
PNS-Alr3S9, upper face height N-ANS', lower face height ANS9-Me, and c r a d base angle
NS-Ba At age 12, based on the Fvaiues, the nul hypothesis was rejected for ail parameters
except c d base angle. Therefore, differences did exist in linear facial dimensions between
short and tall groups of people. At age 18 +, the n d hypothesis was re jected for all
parameters except cranial base angle, and maxillary length.
For those parameters where significant differences exkted, the premise of s k
adjuthg is valid. Size adjusting for body height would mean that if the heights of the groups
were conuolled, the facial measurements would becorne more sirnilar and the groups could
be compared with more accuacy.

The second set of t-tests was performed to idenufy if there were differences in the
facial parameten of groups d o had small (O) and large (1) TCB lengths. The ndi hypothesis
assumed that there were no differences. 'Ihe TCa Lngth used depended on the faciai
dimensions to which it besr comlated NBa was used with m a x d h y length PNS-ANS',
lower face height M ' - M e , and c d base angle. S N + SBa was used with mandibuiar
length Con-Gn, and upper face height NAM'. Ar age 12, the n d hypothesis was rejected
for every parameter, thereby showing that groups with large TCB lengrhs have facial
measurements that are significantly diffemnt from groups with srnall TCB. At age 18 +, the
null hypothesis was rejected in ali parameten except for LFHi
Again, these fiidings pmvide support to the notion of size adjusting and specificdy
to ushg the TCa as the foundation of the adjusunenu. If the 12 par old population was
adjusted so that all TCB lengths were controiied for, the differences in linear facial
measurements would reduce.
N ANCOVA
ANGOVA was used to study the effea of height on the facial parameters aher
adjusting for TCa length. TCB length was adjusted to its grand mean at 12 and at 18 +.
ANGOVA models ais0 established whether TCa and height, (separately and combined)
contributed sigrilficantly to the faciai dimensions. The mode1 provided an adjusted R
squaried, wtiich is the proportion of variance that can be explained by the variables body
height and T a . The R squared was adjusted as two variables were accounted for instead of
just one.

At age 12, both height and S N + SBa conuibuted sipficantiy to mandibular
length and together accoumed for 37% of its variance. N B a sxgnificantly conuibuted to
r m x i h y length, but height did not. These factors together accounted for 20°/0 of iu
variance. Both he&t and S N + SBa conuibuted sgnt.ficantiy to UFH, accounting for 20%
of its variance. N B a contributed significanrly to LFH but height did not, together
accounting for ody9% of the variance. Hiight and TCB both significantiy conuibuted to
the c d base angle, accounring for 22% of its variance.
At age 18+, both height and S-N + %Ba influenced mandibular length and
c d base angle significantly and conuibuted to 23940 and 219/0 of the variance respectively.
N B a significantiy contributed to m+ length but height did not, accounting for 2 1% of
its variance. For UFH, body height had a significant influence, but TCB did not, accounting
for 10Y0 of the variance. Similady, NBa Bad not contribute significantly to LFH but body
height did, accounting for only 49/0 of the variance.
At both ages, the variance was moderate at best, suggested that other variables exkt
which conuibute to the lengrh of the faciai dimensions. Bone thichess, specificdy of the
radius, and head size may be other mas of the body that would likely be linked to
craniofacial linear measurements.
ANGOVA was ais0 used to predict the facial dimensions based on body height
(short and taU) and adjusting for the covariate TCB. Hkight was recoded into (O) for short
and (1) for talL The ANCOVA equation was as folIoas:
y = a, +b, +x, ,or
Adjusted facd dimension - intercept + difference in height (O) or (1) + coefficient (Ta)
Cornparisons of the adjusted and d j u s t e d means m found in tables 4.19 and
4.20. Because the adjusted means axe predictions, it is impossible to nui t-tests to detemine

if s~gNficant differences sd rernain between the groups. However, by analyzing the data it is
evident that adjusting for the mean TCB d e considering the influence of height brings the
values closer together and facilitates compakons. This method of size adjusting is a
statistically valid p ~ c i p l e where the 95% confidence intervals do not overlap (mandibular
length, upper face height, c d base angle).
Clinicaily however, the significance is questionable as at most an adjustrnent of 1 mm
occuned. Ar age 12, the adjutment ranged from -1.0 mm to 0.9 mm and at age 18+, the
adjustment ranged from -0.6 mm to 0.6 mm
It is &O important to examine the difference in means between the short and d
groups before and after adjuting for the covariate T a . ANGOVA models assume
parallelism bemen the short and ta11 groups with respect to the faciai parametea.
Therefore, this difference is constant for any value TCB is adjusted to and not just the mean.
This type of cornparison c o d i that adjustments bring the linear measurements of the taIl
and short groups closer together.
Ross (1987) had the %ht idea d e n he inmduced the principle of size adjusting
based on his clùiicai observations and impressions. This reseamh aimed to support Ross's
theory with statistically significant data. However, even after much research the idea may
remain hypothetical because clinicaily such a sxnall adjustment may not be relevant.
Adjustments may have been larger if the groups were comprised of individuals at the
extremes of the normal frequency distribution. For example, if the taIl and short samples
were selected from outside +/- 1 standard deviations from the mean, the amount of
adjustment may have been both clinically and statistically significant. Size adjusting would
also be more clinically relevant where a group 4th a craniofacial abnormality is compared to
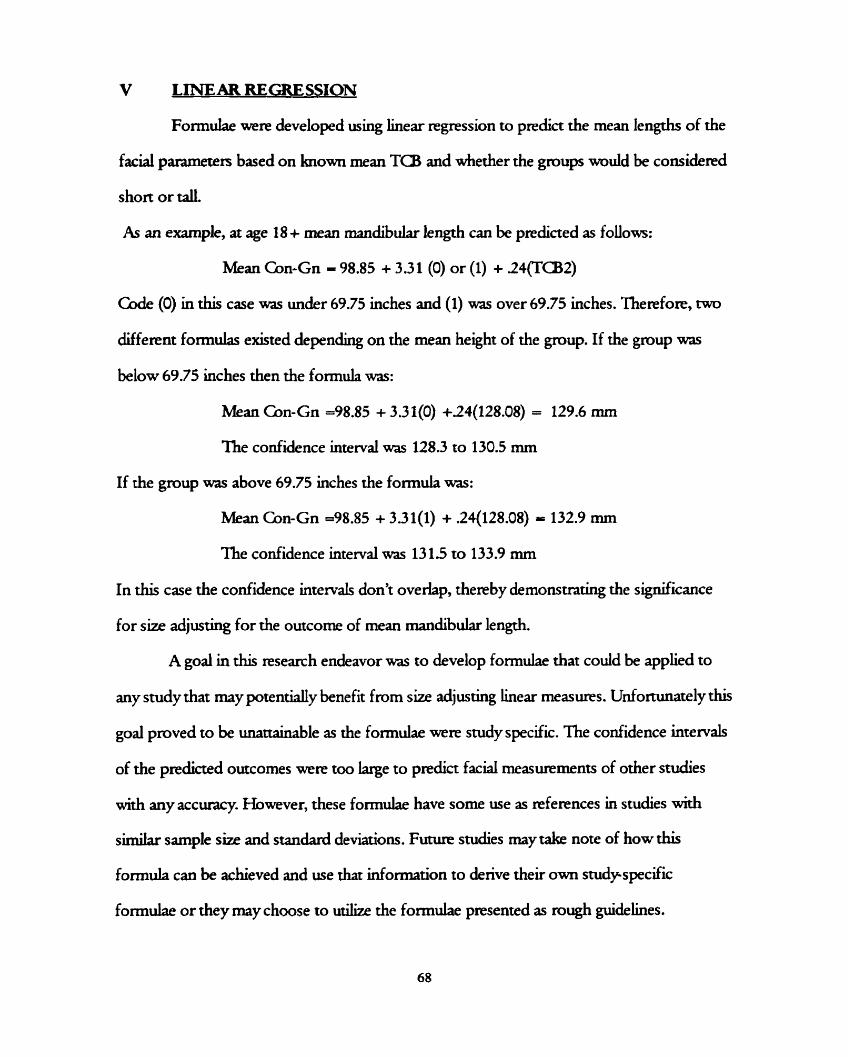
V LINEAR REGRESSION
FormuIae were developed using linear regression to predict the mean lengths of the
facial parameten based on known mean TCa and whether the groups would be considered
short o r taiI.
As an example, at age 18 + mean muidibular length can be predicted as foilows:
Mean Con-Gn - 98.85 + 3.3 1 (0) or (1) + 24('T'CB2)
Code (O) in this case was under 69.75 inches and (1) was over 69.75 inches. Therefore,
different formulas existed dependmg on the rnean height of the group. If the group was
below 69.75 inches then the formula was:
Mean Con-Gn ~98.85 + 3.31(0) +.24(128.08) = 129.6 mm
The confidence interval was 128.3 to 130.5 mm
If the group was above 69.75 inches the fornula was:
Mean Con-Gn =98.85 + 3.31(1) + .24(128.08) = 132.9 mm
The confidence interval was 13 1.5 to 133.9 mm
In this case the confidence intervals don't overiap, thereby demonsmting the sigrilficance
for size adjusting for the outcome of mean mandibular length.
A god in this research endeavor nas to develop formulae that could be applied to
any study that may potentially benef it from size adjusting iinear measures. Unfortunately this
goal proved to be unattainable as the formulae were study specific. The confidence intervais
of the predicted outcornes were too large to predict faciai rneasurements of other srudies
with any accuracy. However, these fomulae have some use as refelences in snidies with
similar sample size and standard deviatiom. Future studies may take note of how this
formula cm be achieved and use that information to denve their own study-specific
foxmulae or they rnay choose to utilize the fomulae presented as rough guidelines.

One important consideration is that body height was parc of the equation. Most
studies do not include height as part of the data reported. This study demonsmted that
hetght was a statistically signif icant factor in size adjusring linear measurernents and s hould
be included in future growth and development snidies. Studies should be designed so that
samples are rnatched for overall body size, (face size, head size, and body height) , and not
just for age. Again, this may not be essentia for studies involving nomial populatioons but
certainly would be relevant when studying groups with craniofacial anomalies.

CONuUsIONS
A study was conducted on the dimensional relationships between the cranial base,
the facial complex, and body height. The longitudinal data from 117 onhodontically
untreated males from the BurLngton Growth Study yielded the following conclusions:
Of al1 the c d base components, the total cranial base (TC6) length disphyed the highest comlations to the linear parameten of the facial cornplex. Good correlations were found to rnandibular length, mamllary length, and upper face height. Therefore, TCi3 length is a svong correlate to the face and can be used in a model to size adjust linear facial dimensions. Correlations were good at age 12 and slightly weaker at age 18 +.
At age 12, body height displayed smng correlations to mandibular kngth, upper face height and TC6 length. niese comlations were slightly weaker at age 18 +. Stmng correlations between facial parameten and body heighr suggest that future cephalometric stdies shouid record stature, and that body height can also be used in a model to size adjust linear facial dimensions.
The following landmarks should be used to defiie facial and cranial parameten in funire cephalometric snidies:
Anterior Chniid Base = S-N Postenor G a n d Base = S-Ba T o t a l G d B a s e = either N B a or { S-N + S-Ba) Mandibular Length = Con-Gn -LeWh = PM-ANS' Upper Face Height = either N-ANS or N-ANS'
0 Lower Face I-kight = either ANS-Me or ANS'-Me
T-Tests indicated that there w e ~ significant differences in the size of the iinear facial dimensions b e m e n groups d o were shon and groups d o were d. At age 12, significant differences were seen for upper and lower face height, mandibular length and maxilhy length. Ar age 18 + significant differences were seen for upper and lower face height and mandibular le&. Therefore, shon children generaliy have s d e r facial dimensions then taIl children.
T-tesu indicated that there weR significant differences in the size of the linear facial dimensions benveen groups who had small TCü lengths and groups Who had large TCB lengths. Ali the facd parameters examined displayed significant differences at age 12 and aii bia lower face height were significantly different between groups at 1 8 +. Therefore, children with s m d l TCB lengths genedy have smaller facial dimensions then children with large T(-B le&.

6. Size adjusting is a statistically valid principle and can be canied out to overcome o v e d size differences between diverse gmups. Clinicd significance of size adjusting was questionabk in this population of normal childnm.
7. Priediction models to adjust the linear facial &mensions should be based on the known values for mean TCB length and body height. These formulae are smdy specific and can ody be used as rough guidelines for other studies.
'Iheoreticaiiy, it is valid to make size adjustments between groups to account for the
general size differences in unmatched populations and facilitate more accurate comparisons.
Totd c d base length and body height are two important variables which should be used
in developing a mode1 for size adjusting.

CHAPTER 7:
SUGGESTIONS FOR FUTURE RESEARCH
This study demonsmed that size adjustïng was not a clinicaüy vahd concept for nomial
populations. It would be worthwhile to repeat this study using two sampks: one group of
nomial children and one group of children with a marked developmentai anomaly. In this
extirme case, the effects of size adjusUng would be more pronounced It is most likelythat
the results would yield both statistical and clinical significance.
Aiso, to examine the effeca of size adjusring berween the sexes, thir study could be
repeated using a female population.
The conclusions of this study highlight the importance of ensuring that samples are
matched for overall body size. In future studies, researrhen s hodd keep in mind the
fundamental principles of sample selection and study design.

Anderson DL; Popovich F (1983) Relation of c d base f l e m to c d form and rnandibular position. Am J Phys Anthrop. 6 l(2): 18 1- 187.
Andenon DL; Popovich F (1983) Lower c d height vs c&ofacial dimensions in Angle &s II maiocclusion. Angle Orthod 53(3): 253-260.
Andeaon DL; Popovich F (1983) Lower c d height vs craniofacial dimensions in Angle a s II ma~occlurion. Angle Orthod. 53(3): 253-260.
Bachmayer DI (1985) A cephaiomevic study of nxmhy growth following Le Fort III osteotomy in children with Gowon, Apert, and Pfeiffer syndmmes. Masten of Science Thesis, Univenity of Toronto, Toronto, Ontario.
Baer MJ; Harris JE (1969) A comtnentary on the growth of the hurnan brain and skull. Am J Phys Anthrop. 30: 39-44.
Baer MJ; Nanda SK (1976) A commentary on the p w t h and form of the cranial base. a p t e r 29 in: Symposium on Development of the Basicmnium. Edited by James Bosma, Bethesda Maryiand.
Bambha JK (1961) Longitudinal cephalomeuic roentgenographic study of face and canium in relation to body height. J Am Dent Assoc. 48: 776-799.
Baumrind S; Framz R (197 1) The reliability of head film measurements, 1. Landmark identification. Am J Orrhod. 60: 11 1- 127.
Baumrind S; Frantz R (197 1) The reliability of head film measurements, 2. Conventional anguiar and linear measurements. Am J Onhod. 60: 505-5 17.
Baumrind S; Miller D; Molthen R (1976) The reliability of head f i measuriements, 3. Txing superimposition. Am J Orthod. 70: 617-644.
Behrens RG (1985) Growth in the aging craniofacial skeieton. Gmiofacial Growth Senes, Monograph 17. Ann Arbor: Center for Human Growth and Development, University of Michigan.
Behrents RG (1991) An atlas of growth in the aging craniofacial skeleton. Ganiofacial Growth Series, Monograph 18. Ann Arbor: Center for Human Growth and Development, University of Michigan.
Birch RH (1968) Foetai Retrognathia and the cranial base. Angle Orthod. 38: 23 1-235
Bishara SE; T ~ d e r JE; Jakobsen JR (1994) Facial and dental changes in a d u i t h d Am J Onhod Dentofac Onhop. 106: 175- 186.
Bjork A (1955) Ganial base development. Am J Orthod. 4 1: 198-225.

Bjork A; &im S (1967) Prediction of the age of maximum pubertal growth in body height. Angle Orthod. 37: 134-143.
Bondevik O (1995) Gmwth changes in the cranial base and the face: a longinidinal cephalometxic sndy of linear and angular changes in du i t Nom+. Eus J O n h d 17: 525-532.
Booktein FL (1987) Describing a craniofacial a n o d y : finite elements and the biornetrics of landmark location. Am J Phys Anthrop. 74: 495-509.
Brader AC (1951) A cephalometric x-ray appraisal of morphological variations in c d base and associated pharyngeal suucnires: implications in cleh palate therapy. Angle O r t h d 27: 179- 1%.
Broadbent BH (1931) A new X-ray technique and its application to orthodontia. Angle Or thd 1: 45-66.
Brodie AG (1941) On the growth pattern of the human head. Am j Anat. 68: 209-262.
Buschang P Q Baume RM (1983) A craniofacial gmwth mturity gradient for males and females benmen 4 and 16 years of age. Am J Phys Anthrop. 61: 373-38 1.
Buschang Pe LaPalme L; Tanguay R et al. (1986) The technical reliability of superimposition on c r d base and mandibular suucnires. Eur J Onhod. 8: 152- 156.
Buschang PH (1998) Discussion response to Coben(1998). AJODO. 114: 713- 14.
B u s h E (1949) Correlations berween certain craniofacial measurernents, trunk length, and stature. Human Biol. 21: 246-256.
Coben SE (1955) The integration of facial skeletal variants. Am J Orthod. 41: 407-434.
Coben SE (1961) Gmwth concepts. Angle Orthod. 3 1: 194-20 1.
Coben SE (1986) Basion horizontal: an integrated concept of craniofacial gmwth and cephalometic analysis . Jenkintown PA Cornputer Ce phdomeuin Association.
Coben SE (1998) The spheneoccipital synchondrosis: The rnissing link between the profession's concept of craniofacial gmwth and oxthodontic treatment. AJO. 1 14;709- 12.
Cohen MM Jr, Waker GF, Phillips C (1985) A motphomeuic analysis of the craniofaciai configuntion in achondroplasia. J Ganofac Genet Dev Bi01 1: 139-165.
Cohen MM Jr, Kreiborg S (1994) Oanial size and c o n f i i t i o n in the Apen syndrome. J Ctaniofac Genet Dev Biol. 14: 153- 162.

Costaras-Volanch M; Pnizansky S (1984) 1s the mandible inuinsicdy different in Apen and Gouzon syndromes? Am J Orthod. 85: 475-487.
Ginner RM (1953) P~detennination of the adult face. AmJ Orthoc!. 39: 201-217.
De Coster L (1% 1) Hereditaty potentiaiity versus ambient factors. E ur Onhod Soc. 227- 234.
Doch1 RB (1959) Oanial and facial measurements and correlations in Aran Island children. Dent Prrictic and Dent Rec. 9: 143- 156
Engman LE; Spriestenbach DC; Moll KL (1965) Ganial base angle and nasophaqmgeal depth. Cieft Paiate J. 2: 32-39.
Enlow DH (1962) A study of the pst-natal growth and remodehg of bone. Am J Anat. 110: 79- 102.
Edow DH (1968) The Human Face. An account of postnatal gmwth and development of the craniofacd s keleton. New York Hoeber Med Div., Hirper and Row, pp xiv & 303.
Enlow Dfl McNamara JA, Jr. (1973) The neumcraniai basis for facial form and pattern. Angle Orthod. 43: 256-270.
Enlow DH (1976) The prenatal and postnatal growth of the human basicranium. Chapter 12 in: Symposium on Development of the Basicranium Edited by: James Bosma, Bethesda MaSand Evans CA; auirtiansen RL (1979) Faciai p w t h associated with a c d base defect - a case report. Angle Onhod 49: 44-46.
Fedun El (1971) A study of the c r d and facial characteristics of G o m n ' s and Apert's syndrome. Diplorna Thesis, University of Toronto, Toronto, Ontaxio.
Ford EHR (1958) Growth of the human canial base. Am J Orthod. 44: 498-506.
Ghafari J; Engel FE; Laster LL (1987) Cephdometic superimposition on the cranid base: A review and a cornparison of four methods. Am J Orthod Dentofac Oithop. 91: 403-413.
Gayson B; Gming C; Bookstein FL et al. (1988) The rhree-dimensional cephalogram: theory technique, and clincal application. AJODO. 94(4): 327-37.
Himis EF (1993) Sire and form of the c d base in isolated cleft Lip and palate. Cleft Paiate Ganiofac J. 30: 17û- 174.
Hemrend B; Moyen RE (1953) The growth of the caniofacial skeleton. University of Toronto, Department of Orthodonties.

Hiloowala RA; Trent RB; Pifer RG (1998) Interrelations hips of brain, c r d base and mandible. Ganio. 16: 267-274.
Hbpkin GB; Hbuston WJB; James GA (1968) The c r a d base as an aetiological factor in docchsion. An& Orthod. 38: 250255.
Hbrswel BB; Gallup BV (1992) G;uiial base morphology in cleft lip and pdate: A cephalometxic study from 7 to 18 pars of age. J Oal Maxiüofac Surg. 50: 681-685.
Houston WJB (1983) The analysis of erron in orthodontic measurements. Am J Orthod 83: 382-390.
Hughes BO; Moore GR (1941) Heredity, growth, and the dentofaciai complex. Angle Orthod. 11: 217-222.
H ~ h e s B O (1942) Heredity as a factor in cranial and faciai development. Am J W o d . 28: 357-360.
Hunter CJ (1966) The conelation of fafial p w t h with body height and skeletal matudon at adolescence. Angle Orrhod. 36: 44-54.
Israel H (1973) Age factor and the pattern of change in craniofacial strucniries. Am J Phys Anthrop. 39: 11 1- 128.
Jarvinen S (1980) Reiation of the SNA angle to the saddle angle. Am J Oxthod 78: 670-673.
Jensen BL (1994) aeidocranial dysplasia: Ganiofacd morphology in adult patients. J Ganiofac Genet Dev Biol. 14: 163- 176.
Jensen BL; Jensen KE; Kastrup KW; Pederron SA; Wagner A (1997) Final height and craniofacial development after surgical resection of craniopharyngiorna. J Ganiofac Genet Dev Biol. 17(4): 1907.
Kasai K; Moro T; Kanazawa E; Iwasawa T (1995) Relationship between cranid base and mavillofacial morphology. Eur J Onhod. 17: 403- 10.
Kerr WJS; Adams P (1988) Gaial base and jaw relations hip. Am J Phys Anrhrop. 77: 2 13- 220.
Kieth A; Campion GG (1922) A contribution to the mchanism of growth of the human face. Int J Orthod Oral Suxg and Rad. 8: 607-633.
Koski K (1960) Some aspects of the growth of the c d base and the upper face. Odont T. 68: 344-358.
Kaus BS, Ww WJ, Frei RH (1959) Heiedity and the craniofacial complex. Am J O r t h d 45: 172-217.

Kteiborg S (1981) C r o w n syndrome: clinicai and roentgencephalometric study. Scand J Reconstr Surg. Suppl18.
Kreiborg S; Bjork A (1982) Description of a dry s k d with Gouu>n syndrome. Scand J P h t Reconstr Surg. 85: 175- 184.
Landis JR; Koch GG (1977) The measurement of observer agreement for categorical dara Biomaterials 33(1): 159-74.
Latham RA (1972) The sella point and postnatal growth of the human c d base. Am J O r t h d 41: 156-162.
Lewis AB; Roche AF (1972) Ganial base elongation in girls duMg pubescence. Angle Orthod 42: 358-367.
Lewis AB; Roche AF (1974) Oanial base elongation in boys during pubescence. Angle O n h d 44: 83-93.
Liebgott B (1977) Factors of human skeletal craniofacial morphology. Angle Onhod. 47: 222-230.
Linder-Aronson S (1970) Adenoids: Their effect on mode of breathing and nasal d o w and their relationship to characteristics of the facial skeleton and the dentition. Acta-00- Laryngologica; Supplement 265.
Lundstrom A (1954) The importance of genetic and non-genetic factors in the facial skeleton studied in 100 pain of twins. Eur Onh Soc. 30: 92- 103.
Melsen B (1974) The cranial base. Acta Odont Scand. 32; Supplement 62.
Midtgard J; Bjork A; Linder- Aronson S (1974) Reproducibility of cephalomevic landrnarln and e m i s of measurements of cephalometric cranial distances. Angle Orthod 44: 56-6 1.
Mitani H (1973) Contributions of the postenor cranial base and rnandibular condyles to facial depth and heighr dwing puberty. Angle Otrhod. 43: 337-343.
Mitchell RA (1966) A cephalometric study of the craniofacial characte ristics of the achondroplastic dwarf. Diploma Thesis, University of Toronto, Toronto, Ontario.
Moore KL; Penaud TVN (1993) The developing human. WB Saunden Co, Philadelphia.
Moss ML (1959) The pathogenesis of prernanue cranial synostosû in man. Acta Anat. 37: 35 1-370.
Moss h4L; Young RW (1960) A functiod appmach to craniology. Am J Phys Anthrop. 18: 281-292.

Moyen RE; Booktein FL (1 979) The inappropriateness of conventionai cephalometrics . AJO. 75(6): 599-617.
Nakata h.I; Yu P; Davis B; Nance W (1973) The use of genetic data in the prediction of crMofacd dimensions. AJO. 63(5): 471-480.
Nakata M; Yu P; Nance W (1974) Muluvariate andysk of craniofacial measurements in min and familydata. Am J Phys A n h p . 41: 423-430.
Nanda RS (1955) The rates of growth of several facial components measund from serial cephaiomeuic roentgenograms. Am J Orthod. 4 1: 681673.
Panchen E& Hansen K (1984) The nasion-sella reference h e in cephaiorneuy: A methodoiogk s d y Am J Orthod. 86: 427-434.
Pirinen S; Majurin A; Lenko Y Koski K (1994) Ganiofacd feanves in patients with deficient and excessive growth hormone. J Ganiofac Genet Dev Biol. 14: 144 152.
Poole A; Greene 1; Buschang P (1982) The effect of growth hormone therapy on longinidinal growth of the oral facial strumms in chiidren. In: Dixon A, Sarnat B (eds): Factors of Mechanisms Influenci- Bone Gmwth, New York: Aian Liss Inc, pp 499-516.
Popovich F; Thompson G W (1977) Ganiofaciai templates for onhodontic case analysis. Am J Orthod. 71: 406.
Powell TV; Brodie AG (1963) Uosure of the spheno-occipital synchondrosis. IADR Absuact 251.
Richardson A (1966) An investigation into the reproducibility of some points, planes, and lines used in cephalomeuic analysis. Am J Orthod. 52: 637-65 1.
Roche AF; Lewis AB (1976) Lare growth changes in the cranial base. Chapter 14 in: Symposium on Development of the Basicranium. Edited by James Bosma, Bethesda Maryland*
Rose G (1953) A quantitative study of the facial areas from the profile roentgenograms and the mlationships to body measurements. Am J Oxthod. Abstmct 3959.
Rosner B (1995) Fundamentais of biostatistics. Fou& edition. Wadswonh Publishg Company, California.
Ross RB (1959) An appraisal of cephalomeuic mntgenographic analysis as an aid in onhodontic diagnosis. Diplorna Thesis, University of Toronto, Toronto, Ontario.
Ross RB (1961) The morphology of the c d base and anomalies of the ceMcal vertebrae in individuals with c leh of the lip and paiate. USc. Thesis, University of Toronto. Toronto, Ontario.

Ross RB (1965) Crania base in children with lip and p h t e clefts. Ueft Palate J. 2: 157- 166.
Ross RB (1987) T~aumrn variables affecting growth in complete unilateral cleft lip and palate. Part 1: Treaunern affecting gmwth. Ueft Paiate J. 24(1): 5-23.
Ross RB (1992) Discussion: Oania base morphology in cleft lip and palate. J Oral M o f a c Surg. 50: 686.
Ross RB (1993) Commentary.. My fnend the c r d base: Why is it so nod Cleft Palate - G;uiiofacd J o d . 30(5): 511-2.
Sarhan OA (1995) Sella-Nasion line =vis Red. J Oal Rehab. 22(12): 905-908.
Scott JH (1953) The variability of cranid and facial dimensions in modem skuils. Br Dent J. XCIV: 27-3 1.
Scott JH (1958) The adys i s of facial growth. Am J Orthod. 44: 507-5 12.
Scott JH (1963) The anaîysis of facial growth from fetal Me to adulthood. Angle Orthod. 33: 110-113.
Seward S (1987) Relation of basion to dculare. Angle Orthod. 51(2): 15 1- 161.
Sicher I-& WeinmannJP (1944) Bone gmwth and physiologie tooth movement. Am J Orthod. 30: 109.
Smahel 2; Skadova B (1988) Roentgence phdometic study of c r a d interrelations. J Ganio Genet. 8: 303-3 18.
Sperber Gfi Tobias PV (1989) Ganiofacial embryology. Wright Co, Gillingham.
S piegel RN; Sather AtI; Hayles AB (197 1) Cephalometnc s tudy of children with various endocrine diseases. Am J W o d . 59: 362-375.
Solow B (1966) The pattern of craniofacial association. Acta Odont Scand 24; Supplernent 46.
Steiner CC (1953) Gphaiometrics for p u and me. Am J Oithod 39: 729-755.
Steuer 1 (1972) The cranial base for superimposition of lateral cephalometic dogxaphs. Am J Orthod. 61: 493-500.
Stewart RE; Dixon G; CDhen A (1977) The pathogenesis of premature craniosynostosis in a c m c e p h a l o s y n ~ y Piast Reconstr Surg. 59: 699-707

Stevens GJ; Freer TJ (1979) A study of c d base c o n f ' i t i o n and its relation to antero- posterior jaw relationship. Am& Orthod J 6: 20-30.
Suamnid L (1959) Extemal and intemal c d base. A cross sectionai study of growth and of association in fonn Acta Odont Scand. 17: 239-261.
Van der Klaaw Cj (1946) Cerebral s k d and facial SM. A contribution to the knodedge of skull stnicture. Arch Need Zool.7: 16-37.
Van der Linden FPGM Edow D (1971) A study of the anterior cranial base. Angle Orthod 41: 119- 124.
van Erum R; Mulier M; Carels Ci V e h k e G; de Zegher F (1997) Ganiofacial gmwth in short children bom srnall for gestational age: effect of growth hormone treatment. J Dent Res. 76(9): 1579-86.
van Erum R; Mulier M; k l s C; Ve&L G; de Zegher F (1998) Short stature of p ~ ~ d ongLi: craniofaciai growth and dental matuiation. Eur J Orrhod. 20: 417-425.
Van Limborgh J (1983) Morphogenic conml of craniofacial growth. In: Clinicd aiterations of the growing face, Monogram 14, Ganofacial p w t h series, Ann Arbor, Michigan, pp 1- 15.
Verdonck A; Gaethofs M; Cmls C; de Zegher F (1999) Effect of low-dose testosterone matment on growth in borj with delayed puberty. Eur J Onhod. 21: 137-143.
Walker GF (1972) A new approach to the analysis of crMofacial morphology and p w t h . AJO. 61(3): 221-230.
Watnic k SS (1972) Inhentance of craniofacial morphology. Angle Orthod. 42: 339- 35 1.
Weidenreich F (1941) n i e brain and its role in the phylogeneuc uansfomiauon of the human s k d . Trans Am Philos. 31: 321-442.
Weinmann JP; Sicher H (1955) Bone and Bones. St. Louis: CV Mosby.

APPENDIX A=
DEFINITIONS OF CRANIQFAQAL LANDMARKS
Seh (S): Nasion (N):
Inteaection point (1) :
Ghbeila (a): Basion (Ba):
Gmdylion (Con): Gnathion (Gn) :
Artic u l a ~ (Ar):
Posterior Nasal Spine (PNS): Antenor Nasal Spine (ANS):
Subnasale (Sn):
Antenor Nasal Spine' (ANS'):
Menton (Me):
The midpoint of sella m i c a detennifled by inspection. The most antenor part of the nasefrontal suture. The consuucted point where the rnidpianed roof of the orbit interseas the inner contour of the frontai bone. The most anterior point on frontal bone. The median point of the anterior nq$n of foramen magnum. The most superior & postenor point on the head of the condyle. The point on the lower border of the mandible where the anterior c w a m becornes confluent with the base. The constructed point where the donal edge of the mandibular ramus intenects the basioccipital bone. The most posterior point on palatal plane. The most antenor point on nasal spine. The deepest point on the concavity of the anterior surface of the maxiila in the midline withui 3 mm of the floor of the nose. The midpoint berween Sn and Sn'. ( Sn': the most srqiaa point of the concavity of the anterior surface of the mamlla which is separated from Sn by 3 mm vekcally) The most inferior point on the midsagittal plane of the symphysis of the mandible

APPENDIX B:
THE CRANIAL BASE I N RELATION TO THE FAUAL COMPLEX
F oramen Caecum
M A X ILLA

APPENDIX C.
EXAMPLES OF CORRELATIONS BETWEEN THE CRANIAL BASE AND THE FACIAL DIMENSIONS
ACB + PCB
-Maxiua FH = Face Wight
Tumor surgery 7 Gmwth Hormone 7 Gmwth Honnone 7
LFH = Lower ~ a c e Height UFH =UpperFaceHkight

APPENDIX D:
EXAMPLES OF DEFINITIONS FOR PARTS OF THE CRGNIAL BASE
TCB N B a
- ACi3+PCB
N B a N - B d N A r
- - -
N- Ar
PU3 S-Ba
- S-Ba
- S-Ba& Ar
PP-Ba -
S-Bo S- Ar
P ~ c i p l e Author B d e (41)
DeCoster (5 1) Ross (51) Scott (53) Bjork (55) Ford (58)
SUWIXU~ (59) Bhamba (61) Hopkin (68)
ACB SN S-Fc S- N
- S-N
PP-N N S minus frontal bone
S- N S- N
Spiegel(71) SOr-S S-Ba SOr- Ba Seward (8 1)
Anderson (83) Ghen (85) Smahel(88)
Kerr (88) Pirinen (94) Kasai (95)
Jensen (97) Van Erum (97) ~ 0 0 ~ (98) Verdonck (99) N a Nasion S - Sella Ba = Basion B o =Bolton Ar = Articulare S O r = Supra-orbitale PP - Pituitary point Fc - F o m n cecum Gl ==Glabeiia
S-N S-N S-N S-N S- N S N S - N S- N S-N S- GI S-N
S- Ar S-Bo S-Ba S-Ba S-Ba S-Ba S-Ba S-Ba S-Ba S-Ba S-Ba
N A r - N B o N B a
- N B a N-Ba N-Ba
- N B a
- N-Ba

Aa3 Pa3 i.u SOS SES S-N N S S-Ba Ba Bo Ar Ta3 PHV ESL Ba- Ar S-FC Fc-GL S-Bo UFH LFH G H SGA BGS 1 ANS' G1 Con Gn Pl% ANS Sn Me MdL MXL a<
LIST OF ABBREVIATIONS (in onier of appearance)
= Antenor Gzuiia Base = Posterior G a r d Base - in=-uterine - Spheno-occipital Synchondrosis -; Spheneethrnoidal Synchondrosis = Sella-Nasion line = Nasion - Seiia - Sella-Basion line - Basion - Bolton = Articulare - Total Gand Base = Peak Height Velocity = Ethmoidale-Sella Line = Basion- Articulare line = Sella-Foramen cecum line = Forarnen cecum-Ghbeh line = Sella-Bolton line = Upper Face Height - b w e r Face Hkight - Growth Hormone - Small for Gestational Age - Burlington Gmwth Study - Intersection Point = Anterior Nasal Spine - GlabeUa = Condyiion - ~nath;on = Postenor Nasal Spine = Antenor Nasal spine - Subnasale - Menton - Mandibuiar Length - Ma>ollary I-ength - Oanial Base Angle


![l.gstludhiana.gov.in/uploads/tender352020.pdfOt]icer. Olllce ol'the Deput)- Commissioner of Central Coods & Services Tax Division, Der.ahssi- l. Paras PIazr Cornplex. Chandigalh-Anrbala](https://static.fdocuments.in/doc/165x107/5e9f0a5cd1664b58e742c400/l-oticer-olllce-olthe-deput-commissioner-of-central-coods-services-tax.jpg)