THE DIELECTRIC PROPERTIES OF SOLID BIOFUELS
62
Mälardalen University Press Dissertations No. 90 THE DIELECTRIC PROPERTIES OF SOLID BIOFUELS Ana Marta Paz 2010 School of Sustainable Development of Society and Technology
-
Upload
truongthuan -
Category
Documents
-
view
218 -
download
0
Transcript of THE DIELECTRIC PROPERTIES OF SOLID BIOFUELS
Mälardalen University Press DissertationsNo. 90
THE DIELECTRIC PROPERTIES OF SOLID BIOFUELS
Ana Marta Paz
2010
School of Sustainable Development of Society and Technology

Copyright © Ana Marta Paz,2010ISBN 978-91-86135-94-2ISSN 1651-4238Printed by Mälardalen University, Västerås, Sweden

Mälardalen University Press DissertationsNo. 90
THE DIELECTRIC PROPERTIES OF SOLID BIOFUELS
Ana Marta Paz
Akademisk avhandling
som för avläggande av teknologie doktorsexamen i energi- och miljöteknik vidAkademin för hållbar samhälls- och teknikutveckling kommer att offentligen försvaras
fredagen 26 november 2010, 10.00 i Lambda, Mälardalens högskola, Västerås.
Fakultetsopponent: Dr Ebbe Nyfors, Roxar, Norway
Akademin för hållbar samhälls- och teknikutveckling
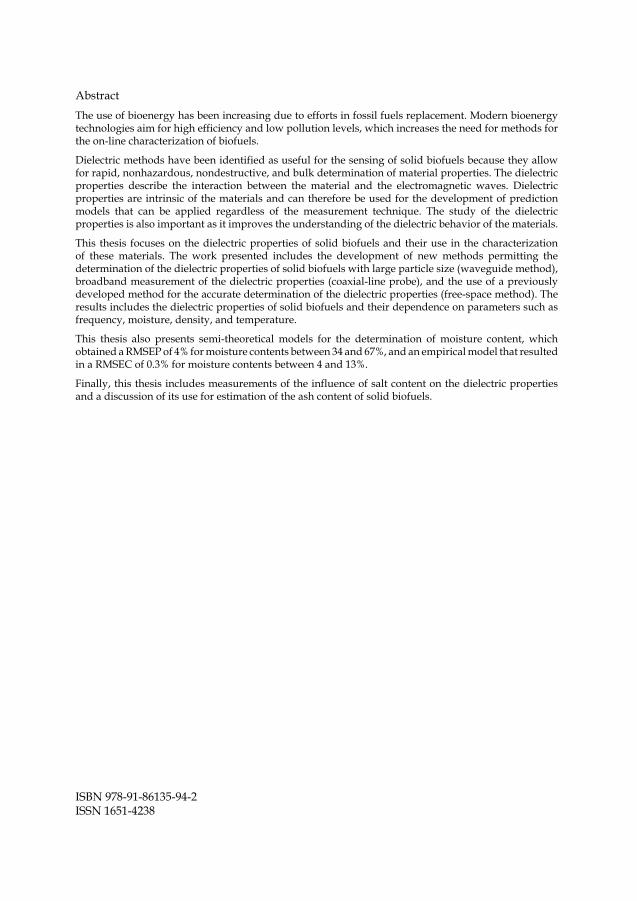
AbstractThe use of bioenergy has been increasing due to efforts in fossil fuels replacement. Modern bioenergytechnologies aim for high efficiency and low pollution levels, which increases the need for methods forthe on-line characterization of biofuels.
Dielectric methods have been identified as useful for the sensing of solid biofuels because they allowfor rapid, nonhazardous, nondestructive, and bulk determination of material properties. The dielectricproperties describe the interaction between the material and the electromagnetic waves. Dielectricproperties are intrinsic of the materials and can therefore be used for the development of predictionmodels that can be applied regardless of the measurement technique. The study of the dielectricproperties is also important as it improves the understanding of the dielectric behavior of the materials.
This thesis focuses on the dielectric properties of solid biofuels and their use in the characterizationof these materials. The work presented includes the development of new methods permitting thedetermination of the dielectric properties of solid biofuels with large particle size (waveguide method),broadband measurement of the dielectric properties (coaxial-line probe), and the use of a previouslydeveloped method for the accurate determination of the dielectric properties (free-space method). Theresults includes the dielectric properties of solid biofuels and their dependence on parameters such asfrequency, moisture, density, and temperature.
This thesis also presents semi-theoretical models for the determination of moisture content, whichobtained a RMSEP of 4% for moisture contents between 34 and 67%, and an empirical model that resultedin a RMSEC of 0.3% for moisture contents between 4 and 13%.
Finally, this thesis includes measurements of the influence of salt content on the dielectric propertiesand a discussion of its use for estimation of the ash content of solid biofuels.
ISBN 978-91-86135-94-2ISSN 1651-4238
Acknowledgments
I would like to express my gratitude to all those who gave me support duringmy research studies and made this thesis possible:- My main supervisor and school research director Professor Erik Dahlquist
for giving me the opportunity to become a research student at MälardalenUniversity, and for his support and confidence during these years.
- Dr. Eva Thorin for supervision, guidance and tireless support, and for beingco-author in several papers.
- Dr. Jenny Nyström for supervision, for being co-author in several papers,and for her warm friendship.
- Dr. Samir Trabelsi with special gratitude for the enthusiasm, ideas, co-authoring in several papers, and inspiring discussions during my intenseinternship in his research group.
- Dr. Stuart Nelson for the ideas, inspiring research life, and for his dedicatedwork as co-author of several papers.
- Dr. Clarke Topp for interesting discussions, ideas, and for his work as co-author.
- Värmeforsk for financing projects included in my research studies, and theheat and power plants Eskilstuna Energi och Miljö and Mälarenergi for thesupport with the measurements and biofuel samples.
- The colleagues at the Russell Research Center, and the Nelson and Trabelsifamilies for welcoming me and making me feel at home in Athens (GA).
- My colleagues at Mälardalen University for the companionship, help withexperiments, and other things such as the ping-pong games.
- My friends and family for their affectionate support.


Abstract
The use of bioenergy has been increasing due to efforts in fossil fuels re-placement. Modern bioenergy technologies aim for high efficiency and lowpollution levels, which increases the need for methods for the on-line charac-terization of biofuels.
Dielectric methods have been identified as useful for the sensing of solidbiofuels because they allow for rapid, nonhazardous, nondestructive, and bulkdetermination of material properties. The dielectric properties describe theinteraction between the material and the electromagnetic waves. Dielectricproperties are intrinsic of the materials and can therefore be used for the de-velopment of prediction models that can be applied regardless of the measure-ment technique. The study of the dielectric properties is also important as itimproves the understanding of the dielectric behavior of the materials.
This thesis focuses on the dielectric properties of solid biofuels and theiruse in the characterization of these materials. The work presented includesthe development of new methods permitting the determination of the dielec-tric properties of solid biofuels with large particle size (waveguide method),broadband measurement of the dielectric properties (coaxial-line probe), andthe use of a previously developed method for the accurate determination ofthe dielectric properties (free-space method). The results includes the dielec-tric properties of solid biofuels and their dependence on parameters such asfrequency, moisture, density, and temperature.
This thesis also presents semi-theoretical models for the determination ofmoisture content, which obtained a RMSEP of 4% for moisture contents be-tween 34 and 67%, and an empirical model that resulted in a RMSEC of 0.3%for moisture contents between 4 and 13%.
Finally, this thesis includes measurements of the influence of salt contenton the dielectric properties and a discussion of its use for estimation of the ashcontent of solid biofuels.
The results presented in this thesis contribute to the development and im-provement of methods for determination of important characteristics in solidbiofuels such as moisture content, density, and salt content using dielectricmeasurement techniques.

Sammanfattning
Bioenergianvändningen har ökat tack vare insatser för att byta ut fossilabränslen. Modern bioenergiteknik strävar efter hög effektivitet och låga emis-sioner. Detta har lett till ett behov av metoder för online-karakteriseringen avbiobränslen.
Dielektriska metoder har identifierats som fördelaktiga for mätning avbiobränslen, eftersom de kan ge en snabb, ofarlig och icke-förstörandebestämnig av stora volym av material. De dielektriska egenskaperna beskriversamverkan mellan material och elektromagnetiska vågor. Dielektriskaegenskaper är specifika egenskap hos ett material och kan användas förutvecklingen av prediktionsmodeller som kan tillämpas oavsett mätteknik.Undersäkningen av dielektriska egenskaper är också viktiga för att deförbättrar förståelsen av materialen.
Denna avhandling fokuserar på dielektriska egenskaper hos fastabiobränslen och deras användning för karakteriseringen av dessa material.Det arbete som presenteras här innefattar utvecklingen av nya metodersom tillåter bestämningen av dielektriska egenskaper hos fasta biobränslenmed stor partikelstorlek, bredbandmätning och användning av en tidigareutvecklad metod för noggrann bestämning av dielektriska egenskaper.Resultaten inkluderar de dielektriska egenskaperna för fasta biobränslen ochderas beroende av parametrar som frekvens, densitet, temperatur och fukt.
Denna avhandling presenterar även semiteoretiska modeller för bestämnin-gen av fukthalten, som gav en RMSEP på 4% för fukthalter mellan 34 och67%, och en empirisk modell som gav en RMSEC på 0.3% för fukthaltermellan 4 och 13%.
I avhandlingen ingår också mätningar av påverkan av salthalten på dielek-triska egenskaper och en diskussion om deras användning för skattningen avaskinnehållet i fasta biobränslen.
De resultat som presenteras bidrar till utveckling och förbättring av dielek-triska metoder för bestämning av viktiga egenskaper hos fasta biobränslensom fukthalt, densitet och salhalt.

List of Papers
This thesis is a comprehensive summary of the following papers, numberedin reverse chronological order of their writing. In the thesis, the papers arerefered to by Roman numerals.
I Ana Paz, Samir Trabelsi, Stuart Nelson, and Eva Thorin. Measurementof the 0.5- to 15-GHz dielectric properties of sawdust, submitted toIEEE Transactions on Instrumentation and Measurement, 2010.
II Ana Paz, Samir Trabelsi, Stuart Nelson, and Eva Thorin. Influence ofsodium chloride on sawdust dielectric properties, submitted to IEEETransactions on Instrumentation and Measurement, 2010.
III Samir Trabelsi, Ana Paz, and Stuart Nelson. Dielectric-based methodfor determining moisture content and bulk density of peanut-hullpellets, IMPI2010, International Microwave Power SymposiumConference Proceedings, pages 190-195, Denver (CO), USA, 2010.
IV Ana Paz, Samir Trabelsi, and Stuart Nelson. Dielectric properties ofpeanut-hull pellets, IMTC2010 Instrumentation and MeasurementConference Proceeding, pages 62-66, Austin (TX), USA, 2010.
V Ana Paz, Eva Thorin, Jenny Nyström, and Erik Dahlquist. ComplexPermittivity of woody biomass at radio frequencies, submitted toMeasurement Science and Technology, 2009.
VI Ana Paz, Eva Thorin, and Clarke Topp. Dielectric mixing formulas forwater content measurement in woody biomass, Wood Science and Tech-nology, DOI 10.1007/s00226-010-0316-8, 2010.
Ana Paz contributed with idea, method, and experimental work to all papersexcept the following:
Paper I: initial idea by Samir Trabelsi and Stuart Nelson.Paper III: idea and method by Samir Trabelsi and Stuart Nelson.Paper VI: initial idea by Clarke Topp.
Other papers by the author
Ana Paz. Moisture content determination from dielectric properties ofsolid biofuels, Aquametry 2010, First European Conference on MoistureMeasurement Conference Proceedings, pages 318-325, Weimar, Germany,2010.
Ana Paz, Eva Thorin, and Jenny Nyström. Dielectric properties ofwoody biomass at radio frequencies, ISEMA 09, Electromagnetic WaveInteraction with Water and Moist Substances Conference Proceedings,pages 249-268, Helsinki, Finland, 2009.
Ana Paz, Jenny Nyström, Eva Thorin, and Erik Dahlquist. Measuringwater content in woody biomass directly in transport containers, submittedto journal 2009.
Ana Paz, Eva Thorin, and Erik Dahlquist. A new method for bulkmeasurement of water content in woody biomass, Ecowood 2008, ThirdConference on Environmental Compatible Forest Materials Proceedings,Porto, Portugal, 2008.
Ana Paz, Jenny Nyström, and Eva Thorin. Influence of temperature inmoisture content measurement of biofuel, IMTC2006, Instrumentation andMeasurement Technology Conference Proceedings, pages 175-179, Sor-rento, Italy, 2006.
Reprints were made with permission from the publishers.

Symbols
ε relative complex permittivityε ′ the dielectric constantε ′′ the dielectric loss factorε0 permittivity of the free space (F·m−1)ε ′∞ permittivity at infinite hight frequenciesεe permittivity of the host phase in a mixtureεi relative dielectric constant of the component i in a mixtureε ′st static permittivityε ′′rd loss factor due to dielectric lossesθi volumetric content of the component i of a mixture (vol·vol−1)θ volumetric moisture content (vol·vol−1)µ permeability (H·m−1)ρw water densityρ density (or bulk density)ρd dry bulk densityσ conductivity (S·m−1)τ relaxation time (s)ω angular frequency (rad·s−1)ψ density-independent functionB magnetic flux density (T)D electrical flux density (C·m−1)Di depolarization factor for the component i in a mixtureE electrical field strength (V·m−1)J current density (A·m−2)H magnetic field strength (A·m−1)j square root of -1ms mass of dry phasemt total massmw mass of total water phaseMC gravimetric moisture content (% mass·mass−1)v total volumevs volume of the solidsvw volume of the total water phase

Abbreviations
CEN European committee for standardizationGPR ground penetrating radarMG Maxwell-Garnett dielectric mixing modelRMSEC root mean square error of calibrationRMSEP root mean square error of predictionRF radio frequencyTDR time domain reflectometryVNA vector network analyzer
Contents
Part I: Comprehensive summary1 Introduction . . . . . . . . . . . . . . . . . . . . . . . . . . . . . . . . . . . . . . . . . . 17
1.1 Characterization of solid biofuels . . . . . . . . . . . . . . . . . . . . . . . 171.2 Dielectric measurements . . . . . . . . . . . . . . . . . . . . . . . . . . . . . 191.3 Problem description and research questions . . . . . . . . . . . . . . . 201.4 Contributions of this thesis . . . . . . . . . . . . . . . . . . . . . . . . . . . . 20
2 The interaction of electromagnetic waves with materials . . . . . . . . . 232.1 Dielectric properties . . . . . . . . . . . . . . . . . . . . . . . . . . . . . . . . 242.2 Polarization phenomena . . . . . . . . . . . . . . . . . . . . . . . . . . . . . . 242.3 The dielectric properties of water . . . . . . . . . . . . . . . . . . . . . . . 262.4 The dielectric properties of wood . . . . . . . . . . . . . . . . . . . . . . . 27
3 Solid biofuels . . . . . . . . . . . . . . . . . . . . . . . . . . . . . . . . . . . . . . . . . 293.1 Definitions of solid biofuels properties . . . . . . . . . . . . . . . . . . . 31
4 Measurement of the dielectric properties . . . . . . . . . . . . . . . . . . . . 354.1 Waveguide method . . . . . . . . . . . . . . . . . . . . . . . . . . . . . . . . . 354.2 Free-space method . . . . . . . . . . . . . . . . . . . . . . . . . . . . . . . . . . 374.3 Coaxial-line method . . . . . . . . . . . . . . . . . . . . . . . . . . . . . . . . 37
5 Determination of moisture content . . . . . . . . . . . . . . . . . . . . . . . . . 395.1 Dielectric mixing models . . . . . . . . . . . . . . . . . . . . . . . . . . . . . 395.2 Density-independent functions . . . . . . . . . . . . . . . . . . . . . . . . . 405.3 Statistics for the performance of the models . . . . . . . . . . . . . . . 41
6 Results and discussion . . . . . . . . . . . . . . . . . . . . . . . . . . . . . . . . . . 436.1 Dielectric behavior . . . . . . . . . . . . . . . . . . . . . . . . . . . . . . . . . 436.2 Determination of moisture content . . . . . . . . . . . . . . . . . . . . . . 476.3 The influence of the salt content . . . . . . . . . . . . . . . . . . . . . . . . 50
7 Conclusions . . . . . . . . . . . . . . . . . . . . . . . . . . . . . . . . . . . . . . . . . . 53Bibliography . . . . . . . . . . . . . . . . . . . . . . . . . . . . . . . . . . . . . . . . . . . . 55
Part II: Papers

List of Figures
2.1 The dielectric properties of free water at 0, 20 and 60°C. . . . . 262.2 The dielectric properties of wood cell wall substance. . . . . . . . 28
3.1 From biomass to bioenergy. . . . . . . . . . . . . . . . . . . . . . . . . . . 293.2 Sawdust. . . . . . . . . . . . . . . . . . . . . . . . . . . . . . . . . . . . . . . . . 303.3 Tops and needles. . . . . . . . . . . . . . . . . . . . . . . . . . . . . . . . . . . 303.4 Residual woodchips. . . . . . . . . . . . . . . . . . . . . . . . . . . . . . . . . 313.5 Shelled peanuts and peanut-hull pellets. . . . . . . . . . . . . . . . . . 313.6 Classification of the biofuels included in this thesis. . . . . . . . . 32
4.1 Waveguide method . . . . . . . . . . . . . . . . . . . . . . . . . . . . . . . . . 364.2 Free-space method. . . . . . . . . . . . . . . . . . . . . . . . . . . . . . . . . 374.3 Coaxial-line probe. . . . . . . . . . . . . . . . . . . . . . . . . . . . . . . . . . 38
6.1 The permittivity of sawdust versus frequency. . . . . . . . . . . . . . 436.2 The permittivity of sawdust versus density. . . . . . . . . . . . . . . . 446.3 The permittivity of sawdust versus temperature. . . . . . . . . . . . 456.4 The permittivity of sawdust versus MC. . . . . . . . . . . . . . . . . . 466.5 The permittivity of sawdust versus θ . . . . . . . . . . . . . . . . . . . . 476.6 The complex MG mixing model. . . . . . . . . . . . . . . . . . . . . . . 486.7 Prediction results with the complex MG model. . . . . . . . . . . . 486.8 The Argand-diagram of the permittivity divided by density. . . 496.9 The density-independent function versus MC. . . . . . . . . . . . . . 496.10 The influence of salt content on the dielectric properties. . . . . . 516.11 The permittivity of sawdust with varying salt versus θ . . . . . . . 52

Part I:Comprehensive summary


1. Introduction
Humans have for a long time used biomass as a fuel, but about 150 years ago,it was fossil fuels that propelled the industrial revolution. Today, a major partof energy, chemicals, and materials has fossil origins. Fossil fuels have higherenergy density than biofuels (about 30 MJ·kg−1 for coal and about 19 MJ·kg−1
for dry woodchips), but fossil fuels have important drawbacks such as nega-tive environmental consequences, the uneven distribution of reserves, and theforeseeable exhaustion of those reserves. While the estimates on how longthe fossil reserves will last are not consensual, it is known that the as yetunexplored reserves will require higher exploration costs, increasing the fuelprice [1]. The current interest in renewable energy is related to attempts tosecure energy supply and reduce the emission of greenhouse gases. The In-tergovernmental Panel on Climate Change estimates that 56.6% of the globalwarming capacity derived from anthropogenic emissions has its origin in theuse of fossil fuels [2].
The European Union has set a goal of 20% of the energy use to be fromrenewable sources by 2020 [3]. Bioenergy is responsible for two thirds ofthe renewable energy in the European Union and was identified as havingthe largest growth potential among renewable sources because of relativelylow costs, low life cycle emissions, less dependence on short-term weatherchanges, and development of the agro-forestry sector [4].
Solid biofuels are products and by-products of agriculture, forestry, andtheir associated processing industries. Some examples of solid biofuels arewoodchips, sawdust, and straw. Direct combustion of solid biofuels at com-bined heat and power plants is a mature and highly efficient conversion tech-nique. This technique has been implemented in Sweden on a large scale, wherebioenergy accounted for 20% of the total energy supply in 2008 [5], and is un-dergoing worldwide expansion.
1.1 Characterization of solid biofuelsUnlike those of fossil fuels, the properties of biofuels vary widely. These vari-ations are due to different factors such as the origin of the biomass, the timeof harvest and collection, storage, and handling procedures [6]. The use ofsolid biofuels at an industrial level increased the need for the rapid and non-destructive sensing of their properties. Moisture content is the parameter with
17
the largest variation in solid biofuels. The typical moisture content for non-processed solid biofuels varies between 20% and 60%, while for pelletizedbiofuels the moisture content can vary between about 5% and 12% [7].
The determination of the moisture content of solid biofuels is important forpricing, quality control, and the control of the conversion process. The priceof biofuel is dependent on its moisture content because it directly affects theheating value. The possibility of correct pricing is one of the largest economicbenefits of rapid moisture sensors [8]. The moisture content can also be deci-sive for the quality of a biofuel, for instance before a densification process [9],or at plants where moisture content determines the acceptance or rejectionof biofuels. Moisture can also decrease the overall process efficiency and in-crease the emission of pollutants due to incomplete combustion [7]. When themoisture content is known, biofuels can be mixed in order to achieve a certainaverage moisture content (a common practice at heat and power plants), andprocess parameters such as input flows can be controlled.
Presently, the moisture content of solid biofuels used in heat and powerplants is determined with the standard oven method, which consists of dry-ing samples in an oven and registering the mass difference before and afterdrying [10]. This method is very accurate for solid biofuels [11], but it islabor-consuming and requires a long waiting time for drying. Furthermore, itdemands sampling of the solid biomass material, delivered to power plants inlarge truck containers. Samples are taken from surface layers of the biofuel inthe containers, leading to a moisture value that is not representative of entirethe biofuel load.
Due to the increasing interest in the rapid measurement of moisture con-tent of solid biofuels, some methods have recently been developed for thatpurpose. A comparative study of commercially available methods was per-formed by Jensen et al. [12], who studied dielectric methods for at-line de-termination of moisture content in solid biofuels, either by placing biofuel ina sample holder or by using a probe. There are also instruments using nearinfrared spectroscopy, with a penetration depth in a range of a few the mil-limeters, which are suitable for on-line measurements of biofuels in conveyorbelts [13].
Nyström [8] reviewed the methods that could be used for measuring mois-ture content of biofuel for power plants. The study compared methods suchas the dual X-ray, the indirect plant efficiency method, near-infrared spec-troscopy, radio and microwave methods, and nuclear magnetic resonance. Di-electric methods using radio frequency were considered the only ones suitablefor measuring a representative bulk of material, due to the large penetrationdepth of radio waves. Nyström [14] developed a reflection method using radiofrequencies, with the vision of its further development into an application foron-line moisture measurement of the biofuel directly in the truck containers.
18
1.2 Dielectric measurementsThe expression ”dielectric measurements” is used to describe the measure-ment of the interaction between dielectric materials and electromagnetic fieldsat radio and microwave frequencies. The phenomena occurring during the in-teraction between electromagnetic waves and materials are brieflly presentedin chapter 2.
Dielectric measurements have multiple advantages when compared withother measurement methods. Besides permitting the rapid and nondestructivedetermination of the properties of materials, dielectric measurements are non-hazardous, due to the use of low power levels, and have large penetration depthwhich provides subsurface sensing [15, 16].
Electromagnetic fields can be coupled to the materials under test usingstructures such as coaxial lines, hollow waveguides, and air-coupled antennas,measuring transmitted and/or reflected waves [16]. The parameters measuredcan be attenuation, phase shift, and scattering coefficients, from which thedielectric properties, characterized by the complex permittivity, can be calcu-lated.
Some applications determine the properties of interest in the material di-rectly from the parameters measured. An example is the method presentedby Kraszewski [17] for the determination of moisture using attenuation andphase-shift. Also Nyström [14] used multivariate data analysis to determinethe moisture content in biofuels using a range of reflection coefficients in thetime domain.
It is also possible to retrieve the dielectric properties from measured pa-rameters and thereafter determine the physical properties of the material. Thedielectric properties are intrinsic of the material and therefore independent ofthe measurement method and setup. The study of dielectric properties allowsfor the development of prediction models that can be applied regardless ofthe measurement method, as was also noted by Trabelsi et al [18]. Studyingthe dielectric properties also contributes to the understanding of the dielectricbehavior of the material, which can lead to improved sensing technology.
Many applications make use of the dielectric properties for the characteriza-tion of materials. An example is time-domain reflectometry (TDR), in whichthe dielectric constant is obtained from the travel time measured. The volumet-ric moisture content is determined from the dielectric constant using empiri-cal polynomials or dielectric mixing formulas [19, 20]. The method has beenwidely used for soils but also for other porous materials such as snow [21,22].Topp’s calibration polynomial found application in a variety of soils and alsowith measurement techniques such as ground penetration radar (GPR) [23].
Another interesting example is the work by Trabelsi et al [24] who devel-oped a model for the determination of density and moisture from the dielectricproperties and which showed very good results in a variety of particulate ma-terials such as grain, seeds, shelled and unshelled peanuts, and pellets [18,25].
19
Multivariate analysis was also used by Kent [26] for the determination of thecomposition and quality of foodstuffs from frequency spectra of dielectricproperties.
There are several applications of dielectric measurements for the on-linecharacterization of materials, as reviewed and compiled in different works[15,16,27–29]. Some examples of on-line applications are the free-space mea-surements for moisture determination in green tea in conveyor belts [27], andthe resonant sensors for measuring the compositions of materials under flowin pipelines [15].
Solid biofuels are mixtures of woody and herbaceous materials. There areseveral studies on the dielectric properties of wood [30–32], but studies onthe dielectric properties of solid biofuels have not been previously published.As resumed by Kraszewski [33], the development of new sensors requires notonly adequate technology but also specific knowledge concerning the materialof interest. Therefore, the focus of the work presented in this thesis was on thestudy of the dielectric properties of solid biofuels.
1.3 Problem description and research questionsAs previously mentioned, knowledge of dielectric properties is very importantfor the development of new applications for material characterization. Thestudy of the dielectric properties of materials such as wood, soil, and grainallows us to get an indication of the dielectric behavior of solid biofuels andto analyze the possibility of measuring such properties with dielectric mea-surements. However, the dielectric properties of solid biofuels are unknown.This is the problem underlying the work in this thesis, and from which thefollowing three main questions are drawn:1. What is the dielectric behavior of solid biofuels and what is the influence
of parameters such as wave frequency, density, temperature, and moisturecontent?
2. How can moisture content be determined from the dielectric properties?3. Which other characteristics of biofuels can be determined from the dielec-
tric properties?
1.4 Contributions of this thesisThe main contributions of the present thesis can be summarized as follows:- The determination of the dielectric properties of solid biofuels (sawdust,
tops and needles, residual woodchips, and peanut-hull pellets), and theirdependence on frequency, temperature, density, and moisture.
- The development of new methods for the determination of the dielectricproperties of solid biofuels with large particle size (waveguide-reflection
20

method), broadband measurements (coaxial-line probe), and the applica-tion of a previously developed method for accurate measurements (free-space reflection method).
- The development and application of semi-theoretical and empirical modelsfor moisture and density determination from the dielectric properties ofsolid biofuels.
- The study of the influence of salt content on the dielectric properties and adiscussion on their use for the estimation of the ash content of solid biofu-els.
The main contributions of the papers included in this thesis can be summedup according to the research questions they are most related to:
Question 1 - The dielectric behavior of solid biofuels and theinfluence of wave frequency, density, temperature, and moisture
Paper VI presents the apparent dielectric constant determined from measure-ments with the waveguide reflection method, for different types of solidbiofuels (sawdust, tops and needles, and residual woodchips) for a sin-gle frequency of 0.5 GHz. It is the first published estimate of a dielectricproperty of solid biofuels.
Paper V describes a method for the determination of the complexpermittivity from measurements performed with the waveguidereflection method. The complex permittivity is presented for differenttypes of solid biofuels (sawdust, tops and needles, and residualwoodchips) for a single frequency of 0.5 GHz. The fraction of lossfactor due to conductivity is also estimated using a dielectric mixingformula.
Paper IV presents the complex permittivity of peanut-hull pellets atmicrowaves (5 to 15 GHz) and its variation with frequency, moisture,temperature, and density.
Paper I presents the complex permittivity of sawdust over a wide frequencyrange (0.5 - 15 GHz) for different moisture contents. The papers alsopresents a method for the determination of actual sample density inmeasurements with the coaxial-line method.
Question 2 - The determination of moisture content determination fromthe dielectric properties
Paper VI models the dielectric constant with dielectric mixing models andevaluates their use for the determination of moisture content.
Paper V models the complex permittivity with a dielectric mixing modeland verifies its use for the determination of moisture content.
21

Paper III uses a density-independent function for determination of moisturecontent from the complex permittivity.
Question 3 - The determination of other properties than moisture content
Paper II presents a study on the influence of salt content on the broadbanddielectric properties of sawdust.
Paper III uses a density-independent function for the determination of thedensity of peanut-hull pellets.
22
2. The interaction of electromagneticwaves with materials
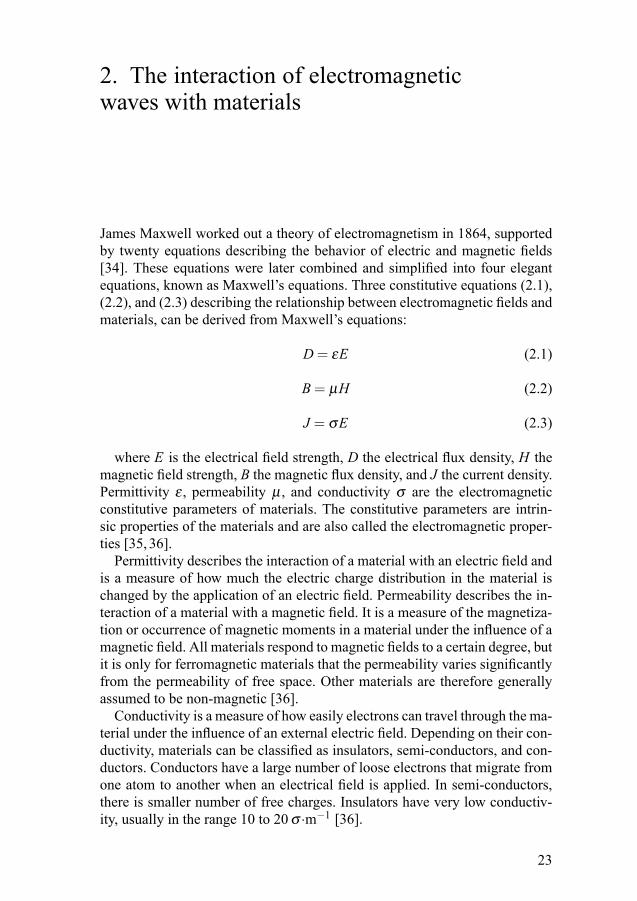
James Maxwell worked out a theory of electromagnetism in 1864, supportedby twenty equations describing the behavior of electric and magnetic fields[34]. These equations were later combined and simplified into four elegantequations, known as Maxwell’s equations. Three constitutive equations (2.1),(2.2), and (2.3) describing the relationship between electromagnetic fields andmaterials, can be derived from Maxwell’s equations:
D = εE (2.1)
B = µH (2.2)
J = σE (2.3)
where E is the electrical field strength, D the electrical flux density, H themagnetic field strength, B the magnetic flux density, and J the current density.Permittivity ε , permeability µ , and conductivity σ are the electromagneticconstitutive parameters of materials. The constitutive parameters are intrin-sic properties of the materials and are also called the electromagnetic proper-ties [35, 36].
Permittivity describes the interaction of a material with an electric field andis a measure of how much the electric charge distribution in the material ischanged by the application of an electric field. Permeability describes the in-teraction of a material with a magnetic field. It is a measure of the magnetiza-tion or occurrence of magnetic moments in a material under the influence of amagnetic field. All materials respond to magnetic fields to a certain degree, butit is only for ferromagnetic materials that the permeability varies significantlyfrom the permeability of free space. Other materials are therefore generallyassumed to be non-magnetic [36].
Conductivity is a measure of how easily electrons can travel through the ma-terial under the influence of an external electric field. Depending on their con-ductivity, materials can be classified as insulators, semi-conductors, and con-ductors. Conductors have a large number of loose electrons that migrate fromone atom to another when an electrical field is applied. In semi-conductors,there is smaller number of free charges. Insulators have very low conductiv-ity, usually in the range 10 to 20 σ ·m−1 [36].
23

2.1 Dielectric propertiesIn works on the electromagnetic characterization of materials, the term "di-electric" is used to describe materials with high polarizability. The perme-ability of dielectrics is comparable to that of free space and is therefore notconsidered in dielectric measurements. The conductivity of dielectrics is low,but its effects can be present the measurement of the complex permittivity. Inother words, the electromagnetic properties of dielectrics are characterized bythe complex permittivity, whose components are the dielectric properties.
Permittivity is expressed as a complex number, as shown in (2.4), in order torepresent the energy storage and energy dissipation phenomena that occur inthe material under the influence of an electric field. The real part of permittiv-ity, ε ′, is called the dielectric constant and describes the energy storage. Theimaginary part, ε ′′, is the dielectric loss factor and describes energy losses.The permittivity of a material is expressed in relation to the permittivity offree space, which is why it is a relative parameter with no units.
ε = ε ′ − jε ′′ (2.4)
Power loss occurs due to differences between the alignment of the chargesand the electric field (dielectric losses) and due to conductivity. Permittivitycan therefore be expressed as in (2.5), where ε ′′rd , is the loss factor due todielectric losses, ε0 is the permittivity of free space, and ω is the angularfrequency.
ε = ε ′ − j(ε ′′rd +σ
ωε0) (2.5)
The dielectric constant, ε ′, affects the speed of propagation and the wave-length of electromagnetic waves. The loss factor, ε ′′ represents the power thatis absorbed by the material, and, has only minor influence on the velocity of apropagating wave [28].
2.2 Polarization phenomenaPermittivity can be understood as measure of the polarization that occurs ina medium when submitted to an electric field. Polarization is a process ofdistortion of the electric charges in a material, which tend to align with theelectric field. The period required for the charges to align with the electricfield, is the relaxation time, τ . The frequency corresponding to the relaxationtime is called the relaxation frequency, and is calculated according to (2.6):
frelaxation =1
2πτ(2.6)
24
At frequencies under the relaxation frequency, the charges in the materialare able to align with the field, but as the frequency approaches the relaxationfrequency, a phase lag between the charges and the field arises, resulting inenergy dissipation [37].
The different phenomena contributing to polarization are discussed in thenext sections.
Electronic and atomic polarizationElectronic polarization occurs in neutral atoms when the electron cloud isdistorted by an external electric field. Atomic polarization occurs due to dis-tortion in the molecules without a permanent dipole but with regions that havepositive and negative charges. For many dry solids these are the dominantpolarization mechanisms, which determine their permittivity at radio and mi-crowave frequencies. Because electronic and atomic inertia are small, the re-laxation time is very small, and the resonant frequency is above the microwaveregion. If only these polarization mechanisms are present in a material, its di-electric constant is rather low and it is nearly lossless [35].
Orientation or dipole polarizationDipole polarization occurs in molecules with a permanent dipole. Because theinertia of the molecule is higher than that of an electron or an atom, this typeof polarization requires longer periods to develop and the relaxation frequencyis lower than for electronic and atomic polarization. Materials with permanentdipole moments are characterized by high dielectric constants at frequenciesbelow the resonant frequency of the molecules, as well as a peak in the lossfactor at the relaxation frequency [28, 35].
Ionic conductivity and the Maxwell-Wagner effectConductivity is the movement of unbound charge carriers under an electro-magnetic field. In moist materials, dissolved ions may contribute to conduc-tivity, which dominates the loss factor, ε ′′, at low frequencies, according to(2.5).
In heterogeneous dielectrics, ionic conduction can also affect the dielectricconstant, ε ′. As the ions move under the influence of the electric field, theyaccumulate in interfaces, creating regions in the material with higher con-ductivity. This results in space-charges with a relatively long relaxation time,which contribute both to conduction and polarization. This type of polariza-tion, called the Maxwell-Wagner effect, was noted in moist wood [31, 32].
25
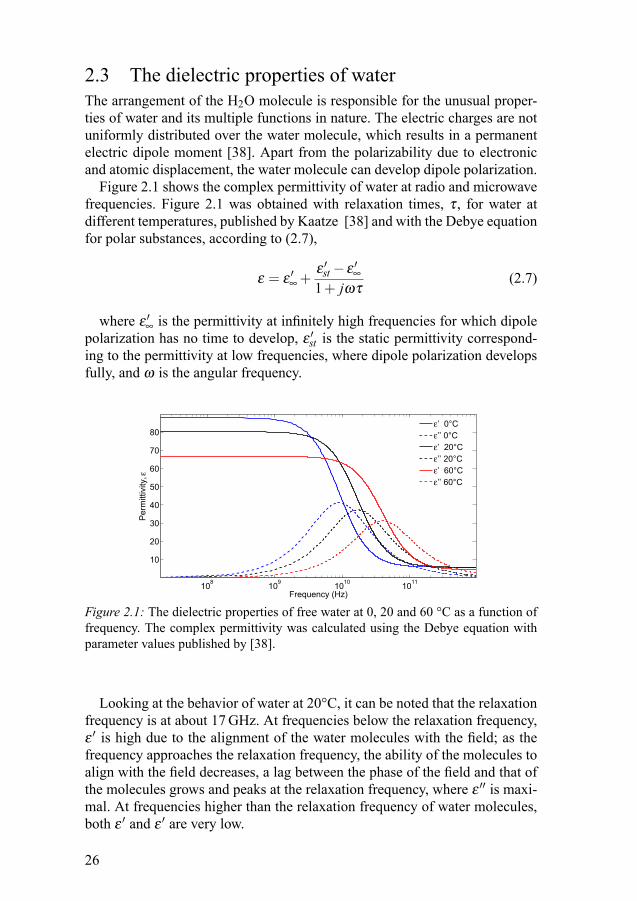
2.3 The dielectric properties of waterThe arrangement of the H2O molecule is responsible for the unusual proper-ties of water and its multiple functions in nature. The electric charges are notuniformly distributed over the water molecule, which results in a permanentelectric dipole moment [38]. Apart from the polarizability due to electronicand atomic displacement, the water molecule can develop dipole polarization.
Figure 2.1 shows the complex permittivity of water at radio and microwavefrequencies. Figure 2.1 was obtained with relaxation times, τ , for water atdifferent temperatures, published by Kaatze [38] and with the Debye equationfor polar substances, according to (2.7),
ε = ε ′∞ +ε ′st − ε ′∞1+ jωτ
(2.7)
where ε ′∞ is the permittivity at infinitely high frequencies for which dipolepolarization has no time to develop, ε ′st is the static permittivity correspond-ing to the permittivity at low frequencies, where dipole polarization developsfully, and ω is the angular frequency.
108 109 1010 1011
10
20
30
40
50
60
70
80
Frequency (Hz)
Per
mitt
ivity
,ε
ε’ 0°Cε’’ 0°Cε’ 20°Cε’’ 20°Cε’ 60°Cε’’ 60°C
Figure 2.1: The dielectric properties of free water at 0, 20 and 60 °C as a function offrequency. The complex permittivity was calculated using the Debye equation withparameter values published by [38].
Looking at the behavior of water at 20°C, it can be noted that the relaxationfrequency is at about 17 GHz. At frequencies below the relaxation frequency,ε ′ is high due to the alignment of the water molecules with the field; as thefrequency approaches the relaxation frequency, the ability of the molecules toalign with the field decreases, a lag between the phase of the field and that ofthe molecules grows and peaks at the relaxation frequency, where ε ′′ is maxi-mal. At frequencies higher than the relaxation frequency of water molecules,both ε ′ and ε ′ are very low.
26
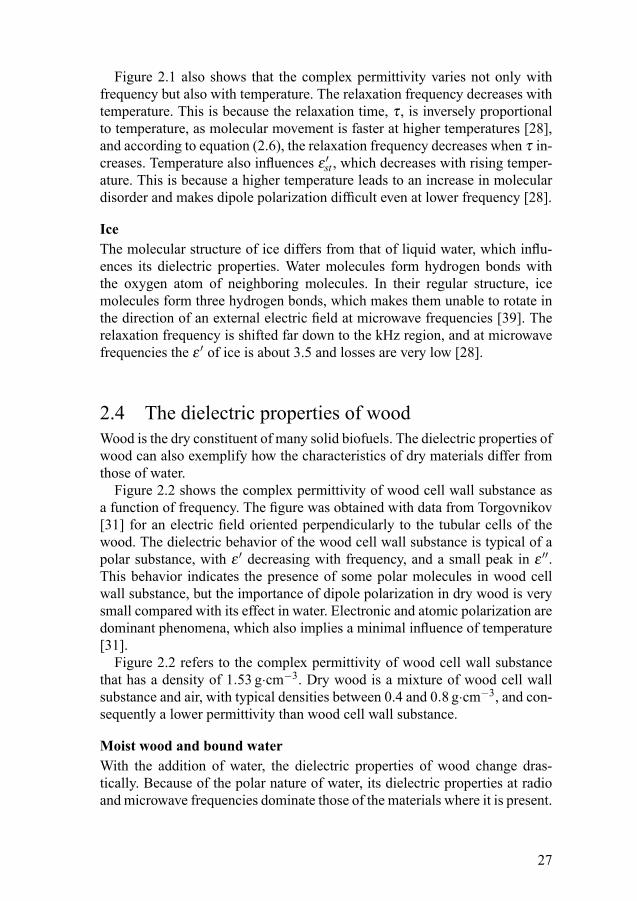
Figure 2.1 also shows that the complex permittivity varies not only withfrequency but also with temperature. The relaxation frequency decreases withtemperature. This is because the relaxation time, τ , is inversely proportionalto temperature, as molecular movement is faster at higher temperatures [28],and according to equation (2.6), the relaxation frequency decreases when τ in-creases. Temperature also influences ε ′st , which decreases with rising temper-ature. This is because a higher temperature leads to an increase in moleculardisorder and makes dipole polarization difficult even at lower frequency [28].
IceThe molecular structure of ice differs from that of liquid water, which influ-ences its dielectric properties. Water molecules form hydrogen bonds withthe oxygen atom of neighboring molecules. In their regular structure, icemolecules form three hydrogen bonds, which makes them unable to rotate inthe direction of an external electric field at microwave frequencies [39]. Therelaxation frequency is shifted far down to the kHz region, and at microwavefrequencies the ε ′ of ice is about 3.5 and losses are very low [28].
2.4 The dielectric properties of woodWood is the dry constituent of many solid biofuels. The dielectric properties ofwood can also exemplify how the characteristics of dry materials differ fromthose of water.
Figure 2.2 shows the complex permittivity of wood cell wall substance asa function of frequency. The figure was obtained with data from Torgovnikov[31] for an electric field oriented perpendicularly to the tubular cells of thewood. The dielectric behavior of the wood cell wall substance is typical of apolar substance, with ε ′ decreasing with frequency, and a small peak in ε ′′.This behavior indicates the presence of some polar molecules in wood cellwall substance, but the importance of dipole polarization in dry wood is verysmall compared with its effect in water. Electronic and atomic polarization aredominant phenomena, which also implies a minimal influence of temperature[31].
Figure 2.2 refers to the complex permittivity of wood cell wall substancethat has a density of 1.53 g·cm−3. Dry wood is a mixture of wood cell wallsubstance and air, with typical densities between 0.4 and 0.8 g·cm−3, and con-sequently a lower permittivity than wood cell wall substance.
Moist wood and bound waterWith the addition of water, the dielectric properties of wood change dras-tically. Because of the polar nature of water, its dielectric properties at radioand microwave frequencies dominate those of the materials where it is present.
27
102 104 106 108 10100
1
2
3
4
5
6
7
Frequency (Hz)
Per
mitt
ivity
,ε
ε’ε’’
Figure 2.2: The ε of the wood cell wall substance at temperatures of 20-25 °C as afunction of frequency. Values are for an electric field perpendicular to the tubular cellsof the wood and as published by Torgovnikov [31].
However, the resultant dielectric properties of the moist material are not a sim-ple combination of the dielectric properties of the dry matter and water.
Water in solid materials has different thermodynamic properties than freewater. Water in wood is primarily held by chemical bonds. These are hydrogenbonds formed by the hydroxyl groups in the wood cell walls. As moistureincreases, water occupies the cell cavities and pores, held only by mechanicalforces. The chemically bound water is generally called bound water, and thefraction up to which water is chemically bound in wood is called the fibersaturation point. This point can generally be assumed to be 30% of the massof dry material [40].
The properties of bound water are complex and inseparable from those ofthe dry phase. There can be different degrees of binding, and different fibersaturation points, depending on the constitution of the dry phase. Therefore aphase known as solid solution, composed of the dry-matter and bound-waterfractions in wood, is often used in studies [40].
28

3. Solid biofuels
Biofuels are solid, liquid, or gaseous products derived from organic raw ma-terials [6]. Some biofuels are obtained directly from biomass without any pro-cessing or conversion, as is the case with some logging residues. In othercases, biomass undergoes some form of processing such as chopping in orderto obtain woodchips, or drying and densification to produce pellets and bri-quettes. Some biofuels are obtained through a conversion process, as is thecase with ethanol, biogas, and bio-oil. Ultimately, all fuels are combusted forthe production of electricity, heat, or mechanical work. Figure 3.1 illustratesthe relationships between biomass, biofuels and bioenergy services.
Biomass
Non-fuels
Biofuel
Solid biofuels
Liquid andgaseousbiofuels
Bioenergy(Electricity
HeatWork)
Figure 3.1: From biomass to bioenergy. Adapted from CEN [41].
The biofuels studied in this thesis were:
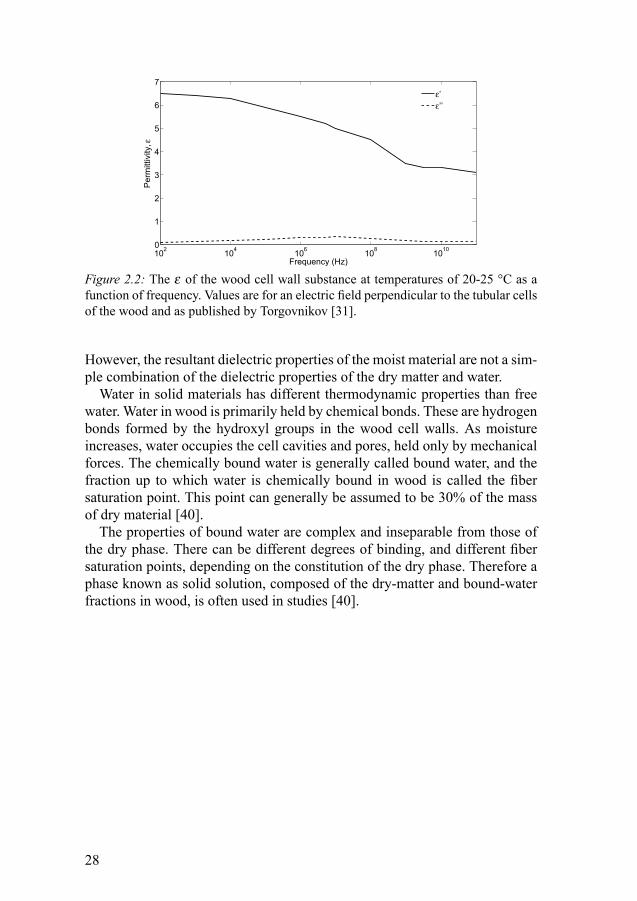
Sawdust: residue from sawmills, rather homogeneous with particle sizesmaller than 5 mm, mainly from spruce and pine.
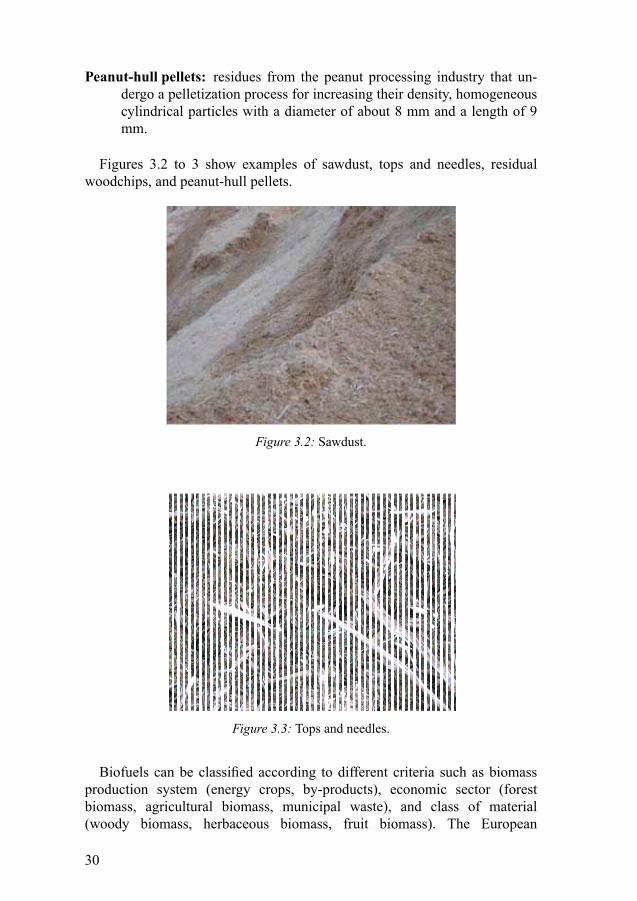
Tops and needles: residue from forest operations such as cleaning and prun-ing, a mixture of small woody parts and more or less green tops, mainlyfrom spruce and pine.
Residual woodchips: residue from the demolition of objects made of un-treated wood, such as pallets, with large and rather heterogeneous par-ticle size that can vary between 10 and 150 mm.
29
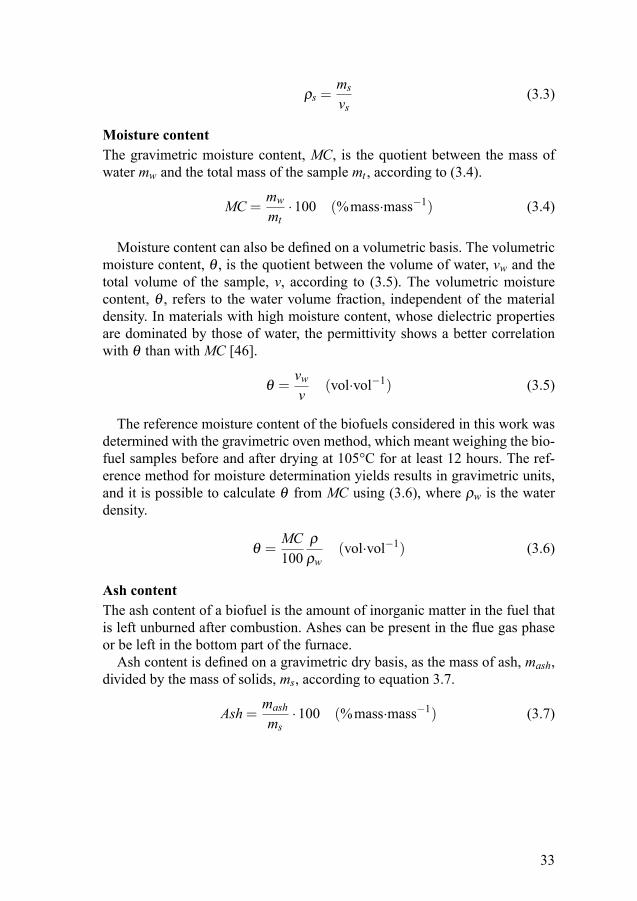
Peanut-hull pellets: residues from the peanut processing industry that un-dergo a pelletization process for increasing their density, homogeneouscylindrical particles with a diameter of about 8 mm and a length of 9mm.
Figures 3.2 to 3 show examples of sawdust, tops and needles, residualwoodchips, and peanut-hull pellets.
Figure 3.2: Sawdust.
Figure 3.3: Tops and needles.
Biofuels can be classified according to different criteria such as biomassproduction system (energy crops, by-products), economic sector (forestbiomass, agricultural biomass, municipal waste), and class of material(woody biomass, herbaceous biomass, fruit biomass). The European
30
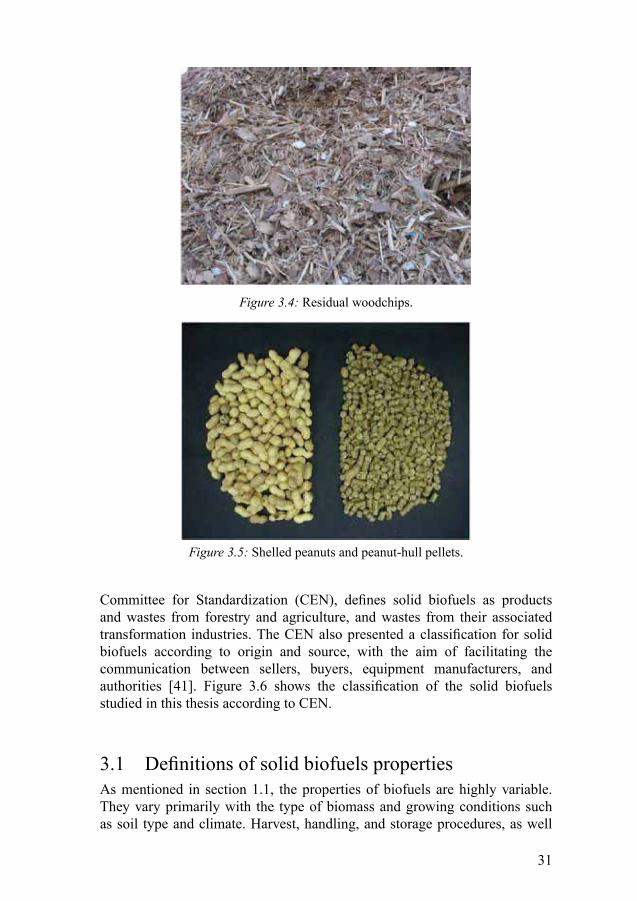
Figure 3.4: Residual woodchips.
Figure 3.5: Shelled peanuts and peanut-hull pellets.
Committee for Standardization (CEN), defines solid biofuels as productsand wastes from forestry and agriculture, and wastes from their associatedtransformation industries. The CEN also presented a classification for solidbiofuels according to origin and source, with the aim of facilitating thecommunication between sellers, buyers, equipment manufacturers, andauthorities [41]. Figure 3.6 shows the classification of the solid biofuelsstudied in this thesis according to CEN.
3.1 Definitions of solid biofuels propertiesAs mentioned in section 1.1, the properties of biofuels are highly variable.They vary primarily with the type of biomass and growing conditions suchas soil type and climate. Harvest, handling, and storage procedures, as well
31

Woody biomass
Fruit biomass
Forest plantation wood
Wood processingindustry by-products
and residues
Used wood
Fruit processing industry by-products
and residues
Chemically untreated fruit residues
NutsPeanut-hull
pellets
Logging residues
Chemically untreatedwood residues
Chemically untreatedwood
Bleands and mixtures
Without bark
Withour bark
Tops and needles
Sawdust
Residual woodchips
Figure 3.6: The solid biofuels in this thesis according to the CEN classification oforigin and sources [41].
as treatment such as drying, grading, and densification, will also affect thefinal characteristics of the biofuels. Important physical characteristics of bio-fuels are moisture content, bulk density, and ash content [14,42]. The moisturecontent is important for pricing and quality control, and also for controllingthe conversion process. The bulk density affects the flow dynamics of mate-rials and can also be important for the determination of quality. Ash contentaffects the heating value, and may contribute to increased concentrations ofpollutants in the flue gases, as well as to several equipment-related problemssuch as slagging, fouling, and corrosion, thus causing a decrease in the over-all efficiency of the plant, equipment wear and failure, and unscheduled andcostly shut-downs [43, 44]. Chlorine has been mentioned as the most impor-tant element causing ash-related problems, since it is responsible for makingalkali available in a corrosive form [42, 43, 45].
DensityThe density, also termed bulk density, of a material is defined as the total massof the material, which is the mass of water mw and the mass of solids ms,divided by the total volume, v, according to equation (3.1):
ρ =mw +ms
v(3.1)
Other definitions of density are also mentioned in this thesis. The dry bulkdensity, ρd , is used in Paper VI, defined as the mass of solids divided by thetotal volume, according to equation (3.2):
ρd =msv
(3.2)
Paper VI also used the definition of density of dry solids, ρs, which is de-fined as the mass of solids divided by the volume of the solids, vs, accordingto equation (3.3). In the case of wood the density of the dry solids is that ofthe wood cell wall, which properties are shown in figure 2.2.
32
ρs =msvs
(3.3)
Moisture contentThe gravimetric moisture content, MC, is the quotient between the mass ofwater mw and the total mass of the sample mt , according to (3.4).
MC =mwmt
·100 (%mass·mass−1) (3.4)
Moisture content can also be defined on a volumetric basis. The volumetricmoisture content, θ , is the quotient between the volume of water, vw and thetotal volume of the sample, v, according to (3.5). The volumetric moisturecontent, θ , refers to the water volume fraction, independent of the materialdensity. In materials with high moisture content, whose dielectric propertiesare dominated by those of water, the permittivity shows a better correlationwith θ than with MC [46].
θ =vwv
(vol·vol−1) (3.5)
The reference moisture content of the biofuels considered in this work wasdetermined with the gravimetric oven method, which meant weighing the bio-fuel samples before and after drying at 105°C for at least 12 hours. The ref-erence method for moisture determination yields results in gravimetric units,and it is possible to calculate θ from MC using (3.6), where ρw is the waterdensity.
θ =MC100
ρρw
(vol·vol−1) (3.6)
Ash contentThe ash content of a biofuel is the amount of inorganic matter in the fuel thatis left unburned after combustion. Ashes can be present in the flue gas phaseor be left in the bottom part of the furnace.
Ash content is defined on a gravimetric dry basis, as the mass of ash, mash,divided by the mass of solids, ms, according to equation 3.7.
Ash =mashms
·100 (%mass·mass−1) (3.7)
33


4. Measurement of the dielectricproperties
As discussed in section 1.2, there are different methods for measuring dielec-tric phenomena. In this thesis, three different measurement systems were used:the waveguide method, the free-space method, and the coaxial-line method.The measurement methods are useful in different measurement situations andhave different characteristics such as measurement frequency, setup, and vol-ume of the sample. Table 4.1 gives an overview of some characteristics andprincipal advantages of each of the three measurement methods. They are fur-ther described in the next sections.
Table 4.1: Overview of some characteristics of the methods for measurement of thedielectric properties used in this thesis.
Measurement system Waveguide Free-space Coaxial-line
Frequency (GHz) 0.56 5 - 15 0.5 - 15
Sample volume (m3) 1 0.01 0.001
Particle size (mm) <150 <9 <1.2
Principal advantages measurement of large vol-ume; reflection conceptthat can be applied on-line
accurate measurement oflow-loss materials
broadbandmeasurements
Used in papersV and VI I, III, and IV I and II
4.1 Waveguide methodThe method was developed by Nyström [14] for measuring the moisture con-tent of biofuels. It was developed as a laboratory-scale system, using an ap-proach meant to be further developed to measure an entire depth of biofuel di-rectly in lorries where only one side of the biofuel is accessible, requiring theuse of a reflection method. Nyström achieved good results with the waveguidereflection system using multivariate data analysis to correlate time-domaindata with moisture content [14].
Figure 4.1 shows a diagram of the method. The system consists of two steeldrums; the upper drum shields the antenna and the other drum contains the
35
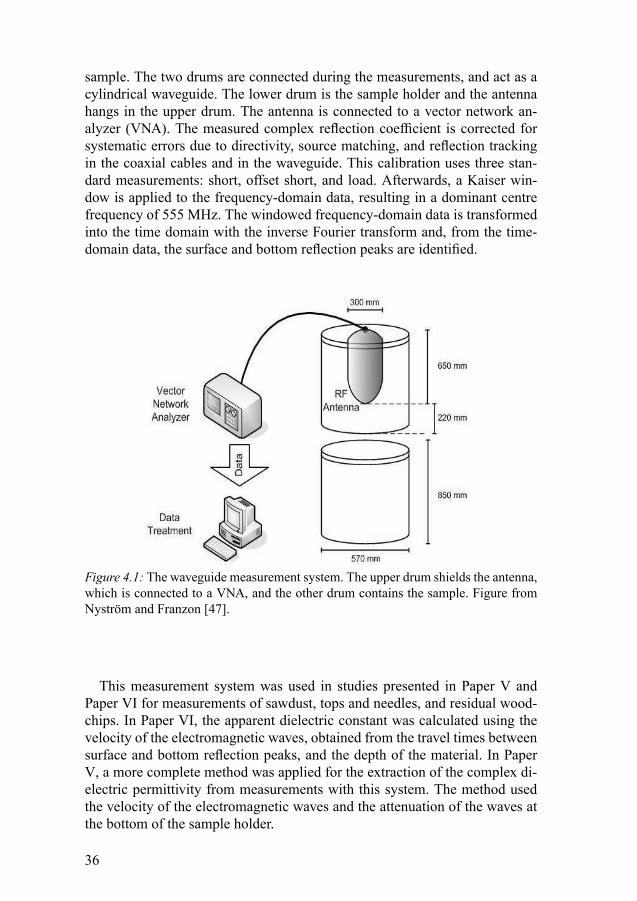
sample. The two drums are connected during the measurements, and act as acylindrical waveguide. The lower drum is the sample holder and the antennahangs in the upper drum. The antenna is connected to a vector network an-alyzer (VNA). The measured complex reflection coefficient is corrected forsystematic errors due to directivity, source matching, and reflection trackingin the coaxial cables and in the waveguide. This calibration uses three stan-dard measurements: short, offset short, and load. Afterwards, a Kaiser win-dow is applied to the frequency-domain data, resulting in a dominant centrefrequency of 555 MHz. The windowed frequency-domain data is transformedinto the time domain with the inverse Fourier transform and, from the time-domain data, the surface and bottom reflection peaks are identified.
Figure 4.1: The waveguide measurement system. The upper drum shields the antenna,which is connected to a VNA, and the other drum contains the sample. Figure fromNyström and Franzon [47].
This measurement system was used in studies presented in Paper V andPaper VI for measurements of sawdust, tops and needles, and residual wood-chips. In Paper VI, the apparent dielectric constant was calculated using thevelocity of the electromagnetic waves, obtained from the travel times betweensurface and bottom reflection peaks, and the depth of the material. In PaperV, a more complete method was applied for the extraction of the complex di-electric permittivity from measurements with this system. The method usedthe velocity of the electromagnetic waves and the attenuation of the waves atthe bottom of the sample holder.
36
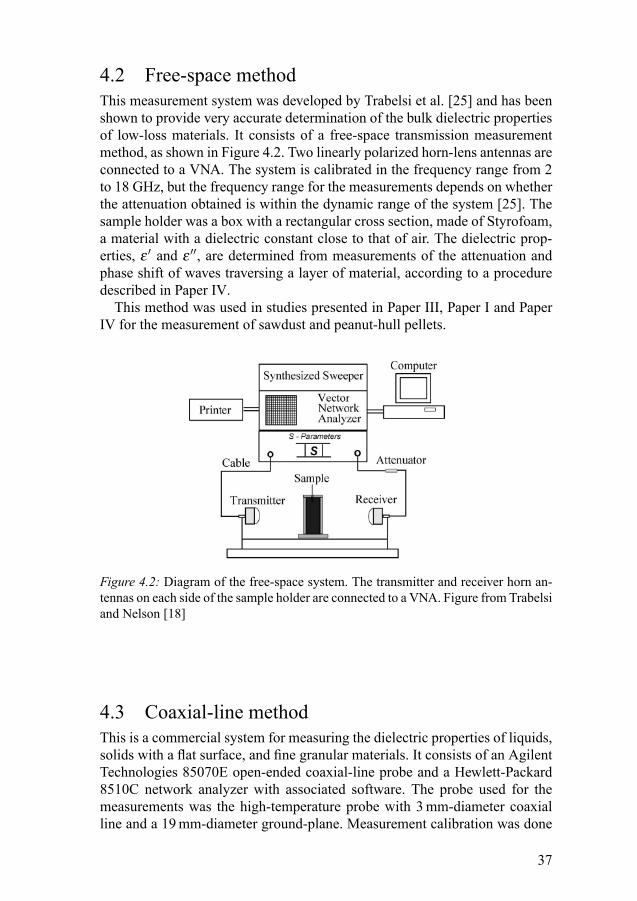
4.2 Free-space methodThis measurement system was developed by Trabelsi et al. [25] and has beenshown to provide very accurate determination of the bulk dielectric propertiesof low-loss materials. It consists of a free-space transmission measurementmethod, as shown in Figure 4.2. Two linearly polarized horn-lens antennas areconnected to a VNA. The system is calibrated in the frequency range from 2to 18 GHz, but the frequency range for the measurements depends on whetherthe attenuation obtained is within the dynamic range of the system [25]. Thesample holder was a box with a rectangular cross section, made of Styrofoam,a material with a dielectric constant close to that of air. The dielectric prop-erties, ε ′ and ε ′′, are determined from measurements of the attenuation andphase shift of waves traversing a layer of material, according to a proceduredescribed in Paper IV.
This method was used in studies presented in Paper III, Paper I and PaperIV for the measurement of sawdust and peanut-hull pellets.
Figure 4.2: Diagram of the free-space system. The transmitter and receiver horn an-tennas on each side of the sample holder are connected to a VNA. Figure from Trabelsiand Nelson [18]
4.3 Coaxial-line methodThis is a commercial system for measuring the dielectric properties of liquids,solids with a flat surface, and fine granular materials. It consists of an AgilentTechnologies 85070E open-ended coaxial-line probe and a Hewlett-Packard8510C network analyzer with associated software. The probe used for themeasurements was the high-temperature probe with 3 mm-diameter coaxialline and a 19 mm-diameter ground-plane. Measurement calibration was done
37
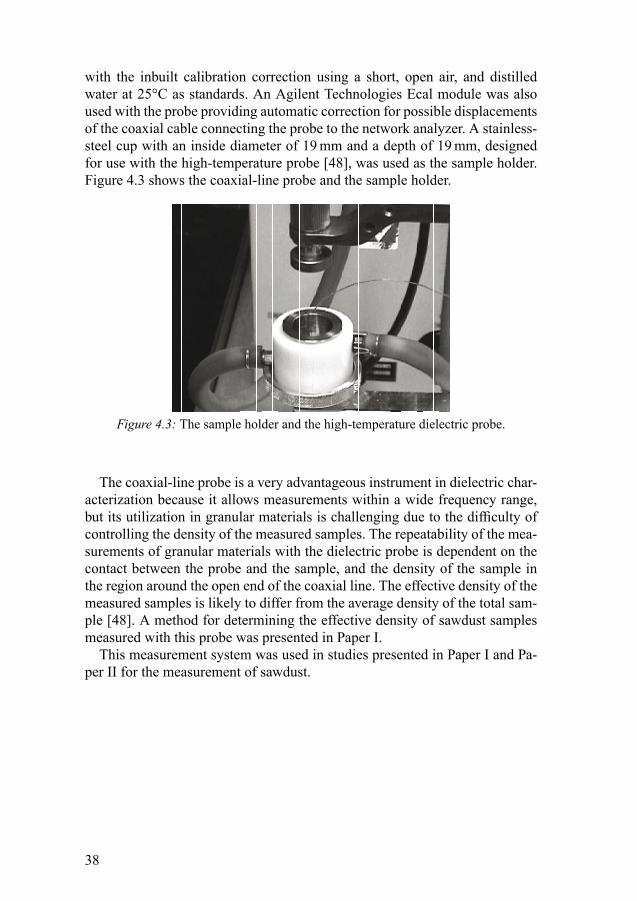
with the inbuilt calibration correction using a short, open air, and distilledwater at 25°C as standards. An Agilent Technologies Ecal module was alsoused with the probe providing automatic correction for possible displacementsof the coaxial cable connecting the probe to the network analyzer. A stainless-steel cup with an inside diameter of 19 mm and a depth of 19 mm, designedfor use with the high-temperature probe [48], was used as the sample holder.Figure 4.3 shows the coaxial-line probe and the sample holder.
Figure 4.3: The sample holder and the high-temperature dielectric probe.
The coaxial-line probe is a very advantageous instrument in dielectric char-acterization because it allows measurements within a wide frequency range,but its utilization in granular materials is challenging due to the difficulty ofcontrolling the density of the measured samples. The repeatability of the mea-surements of granular materials with the dielectric probe is dependent on thecontact between the probe and the sample, and the density of the sample inthe region around the open end of the coaxial line. The effective density of themeasured samples is likely to differ from the average density of the total sam-ple [48]. A method for determining the effective density of sawdust samplesmeasured with this probe was presented in Paper I.
This measurement system was used in studies presented in Paper I and Pa-per II for the measurement of sawdust.
38

5. Determination of moisture content
In order to determine the moisture content from the dielectric properties, amodel is necessary describing the relationships between those parameters.Models relating the dielectric properties to the physical properties can havea theoretical, semi-theoretical, or empirical basis. The advantage of theoret-ical models is their contribution to improved understanding of the dielectricbehavior of the materials and of water binding modes [49]. Empirical param-eters are often included in theoretical models in order to improve their abilityto fit empirical data. Empirical models are useful in practical applications asthey are often simpler than theoretical models and can provide good predictionresults.
In this thesis semi-theoretical approaches using dielectric mixing modelsand an empirical approach based on a density-independent function were used.A general presentation of these approaches is given in the next sections.
5.1 Dielectric mixing modelsDielectric mixing models relate the permittivity of a mixture to the permittiv-ity of all the individual components of the mixture, their fractional volumes,and the polarization effects, which are dependent on the shape of the compo-nents.
Dielectric mixing models can have a pure theoretical basis, or can incor-porate empirical parameters. The parameter describing the shape of the con-stituents is often obtained empirically in order to improve the performance ofmixing models in practical applications, but also because it is very difficult todefine the shape of the constituents on a theoretic basis.
Mixing models have been used to describe the dielectric behavior of differ-ent materials such as soil [50], granular materials [51], as well as snow andice [52]. Practical applications privilege the use of simple mixing equationssuch as the power law model, shown in equation (5.1):
εβ =n
∑i=1
(εβi ·θi) (5.1)
where εi and θi are the permittivity and the volumetric content, respectively,of the constituent i, and β is the geometric factor.
39
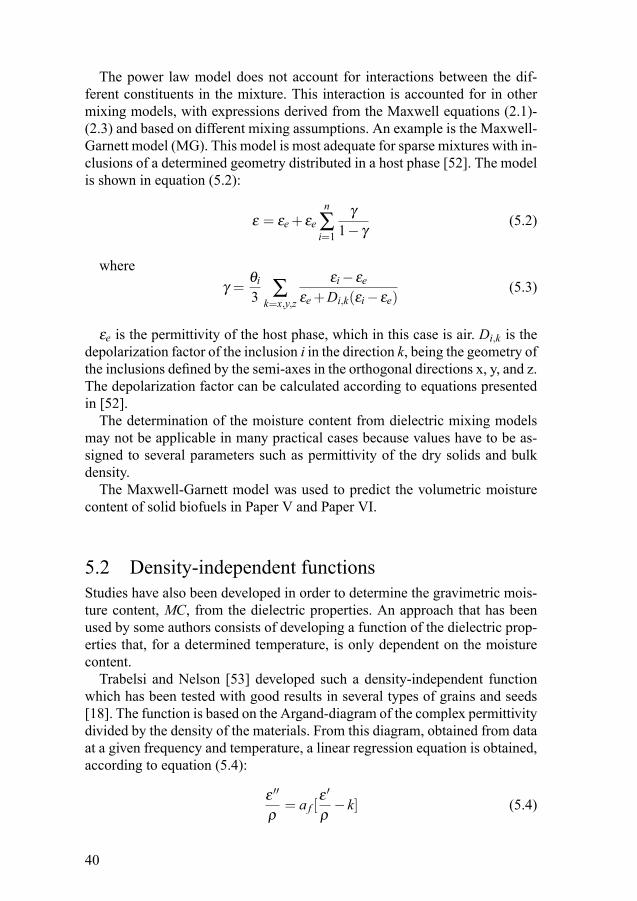
The power law model does not account for interactions between the dif-ferent constituents in the mixture. This interaction is accounted for in othermixing models, with expressions derived from the Maxwell equations (2.1)-(2.3) and based on different mixing assumptions. An example is the Maxwell-Garnett model (MG). This model is most adequate for sparse mixtures with in-clusions of a determined geometry distributed in a host phase [52]. The modelis shown in equation (5.2):
ε = εe + εen
∑i=1
γ1− γ
(5.2)
whereγ =
θi3 ∑
k=x,y,z
εi − εeεe +Di,k(εi − εe)
(5.3)
εe is the permittivity of the host phase, which in this case is air. Di,k is thedepolarization factor of the inclusion i in the direction k, being the geometry ofthe inclusions defined by the semi-axes in the orthogonal directions x, y, and z.The depolarization factor can be calculated according to equations presentedin [52].
The determination of the moisture content from dielectric mixing modelsmay not be applicable in many practical cases because values have to be as-signed to several parameters such as permittivity of the dry solids and bulkdensity.
The Maxwell-Garnett model was used to predict the volumetric moisturecontent of solid biofuels in Paper V and Paper VI.
5.2 Density-independent functionsStudies have also been developed in order to determine the gravimetric mois-ture content, MC, from the dielectric properties. An approach that has beenused by some authors consists of developing a function of the dielectric prop-erties that, for a determined temperature, is only dependent on the moisturecontent.
Trabelsi and Nelson [53] developed such a density-independent functionwhich has been tested with good results in several types of grains and seeds[18]. The function is based on the Argand-diagram of the complex permittivitydivided by the density of the materials. From this diagram, obtained from dataat a given frequency and temperature, a linear regression equation is obtained,according to equation (5.4):
ε ′′
ρ= a f [
ε ′
ρ− k] (5.4)
40

where a f is the slope and k is the x-axis intercept of the regression line.Equation (5.4) can also be used for the determination of density. a f is a cal-ibration parameter used in the density-independent function, ψ , according toequation (5.5):
ψ =
√
ε ′′
ε ′(a f ε ′ − ε ′′)(5.5)
The relation between ψ and MC is linear, and from the linear regressionequation, the slope a and the x-intercept b are obtained, and MC is determinedaccording to equation (5.6):
MC =ψ −b
a(5.6)
5.3 Statistics for the performance of the modelsThe analysis of the methods for moisture content determination was madeusing the root mean square error, according to (5.7):
RMSE =
√
(ymeas − ycalc)2
n−1(5.7)
where ymeas is the empirical moisture content, ycalc is the moisture contentcalculated with the model, and n is the number of samples.
In experiments with large data sets, the data was divided into a calibrationand a validation set. The calibration set was used to develop the calibrationmodel and the validation set to measure the prediction performance by usingthe root mean square error of prediction (RMSEP). When the data set didnot allow a validation with an independent set, the performance was analyzedusing the root mean square error of calibration (RMSEC), also referred to asSEC in Paper III.
41


6. Results and discussion
6.1 Dielectric behaviorFrequency dependenceFigure 6.1 shows the variation of ε ′ and ε ′′ with frequency for sawdust at fivemoisture levels. These results were obtained with the coaxial-line probe andwere published in Paper I. Figure 6.1 (a) shows that ε ′ decreases with fre-quency for all moisture levels, but samples with MC larger than 27% have aninflection point at about 9 GHz after which the decrease of ε ′ with frequencyis steeper. Figure 6.1 (b) shows a peak in ε ′′ for the high moisture samples atthe same frequency. The inflection point in ε ′ and the peak in ε ′′ evidence therelaxation of the free water molecules in the sawdust samples. The relaxationof free water at 20°C occurs at 17 GHz, as shown in figure 2.1, but it is knownthat a shift of the relaxation to lower frequencies occurs when the water isbound [38]. Even in samples with water above the fiber saturation point, thetotal water-phase has a lower energy level than free water, which explains thelower relaxation frequency. The fact that ε ′ of sawdust decreases also beforethe relaxation at 9 GHz can be attributed to the presence of bound water in thesample with a relaxation frequency occuring under the measured frequencyrange.
109 10101
2
3
4
5
6
Frequency (Hz)(a)
Die
lect
ric c
onst
ant,
ε´
109 10100
0.2
0.4
0.6
0.8
1
1.2
1.4
Frequency (Hz)(b)
Loss
fact
or, ε
´´
MC=45%
21%
13%
27%
13%
MC=45%
37%
27%
21%
37%
Figure 6.1: The complex permittivity of sawdust with MC between 13 and 45% andtemperature of 20°C in the frequency range 0.5−15 GHz.
43
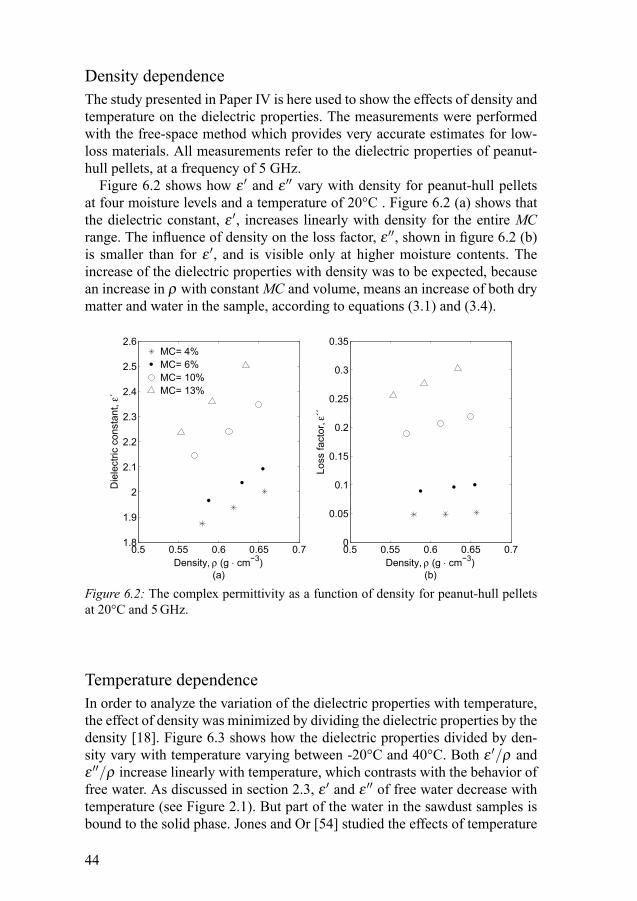
Density dependenceThe study presented in Paper IV is here used to show the effects of density andtemperature on the dielectric properties. The measurements were performedwith the free-space method which provides very accurate estimates for low-loss materials. All measurements refer to the dielectric properties of peanut-hull pellets, at a frequency of 5 GHz.
Figure 6.2 shows how ε ′ and ε ′′ vary with density for peanut-hull pelletsat four moisture levels and a temperature of 20°C . Figure 6.2 (a) shows thatthe dielectric constant, ε ′, increases linearly with density for the entire MCrange. The influence of density on the loss factor, ε ′′, shown in figure 6.2 (b)is smaller than for ε ′, and is visible only at higher moisture contents. Theincrease of the dielectric properties with density was to be expected, becausean increase in ρ with constant MC and volume, means an increase of both drymatter and water in the sample, according to equations (3.1) and (3.4).
0.5 0.55 0.6 0.65 0.71.8
1.9
2
2.1
2.2
2.3
2.4
2.5
2.6
Die
lect
ric c
onst
ant,
ε´
Density, ρ (g ⋅ cm−3)(a)
0.5 0.55 0.6 0.65 0.70
0.05
0.1
0.15
0.2
0.25
0.3
0.35
Loss
fact
or, ε
´´
Density, ρ (g ⋅ cm−3)(b)
MC= 4%MC= 6%MC= 10%MC= 13%
Figure 6.2: The complex permittivity as a function of density for peanut-hull pelletsat 20°C and 5 GHz.
Temperature dependenceIn order to analyze the variation of the dielectric properties with temperature,the effect of density was minimized by dividing the dielectric properties by thedensity [18]. Figure 6.3 shows how the dielectric properties divided by den-sity vary with temperature varying between -20°C and 40°C. Both ε ′/ρ andε ′′/ρ increase linearly with temperature, which contrasts with the behavior offree water. As discussed in section 2.3, ε ′ and ε ′′ of free water decrease withtemperature (see Figure 2.1). But part of the water in the sawdust samples isbound to the solid phase. Jones and Or [54] studied the effects of temperature
44

on the dielectric properties of granular material, concluding that an increasein temperature is accompanied by two concurrent phenomena: the release ofsome of the bound water, which increases the overall permittivity of the ma-terial, and a decrease in the permittivity of the free water. The authors suggestthat one of the phenomena dominates the changes of the overall permittivityof the mixture until a certain point where both phenomena would have equalinfluence. In the case of the peanut-hull pellets in figure 6.3, the increase inpermittivity resulting from the release of bound water dominates the variationof the permittivity of the mixture.
Figure 6.3 also shows that the effect of temperature is greater for highermoisture contents. This is to be expected because temperature mainly affectsthe phenomena of dipole polarization, which occurs in water.
The linear behavior of the dielectric properties within the temperature rangeshown in figure 6.3 indicates that the water in the sample is unfrozen. Thisnonfreezing condition can be explained because the water is bound to the drymatter and requires lower temperatures to break those bounds and freeze. Ingrain the freezing point has been identified at -20°C, where an inflection inthe relation bewteen the dielectric properties and temperature occurs [55].
−20 0 20 402.5
3
3.5
4
4.5
ε´/ρ
Temperature, (°C)(a)
−20 0 20 400
0.1
0.2
0.3
0.4
0.5
0.6
0.7
ε´´/ρ
Temperature, (°C)(b)
MC=4%MC=6%MC=10%MC=13%
Figure 6.3: The complex permittivity divided by density as a function of temperaturefor peanut-hull pellets at 5 GHz.
Moisture content dependenceAccording to the theory discussed in sections 2.3 and 2.4, moisture contentis expected to strongly influence the dielectric properties of biofuels. In thissection, the variation of the dielectric properties of both peanut-hull pellets
45
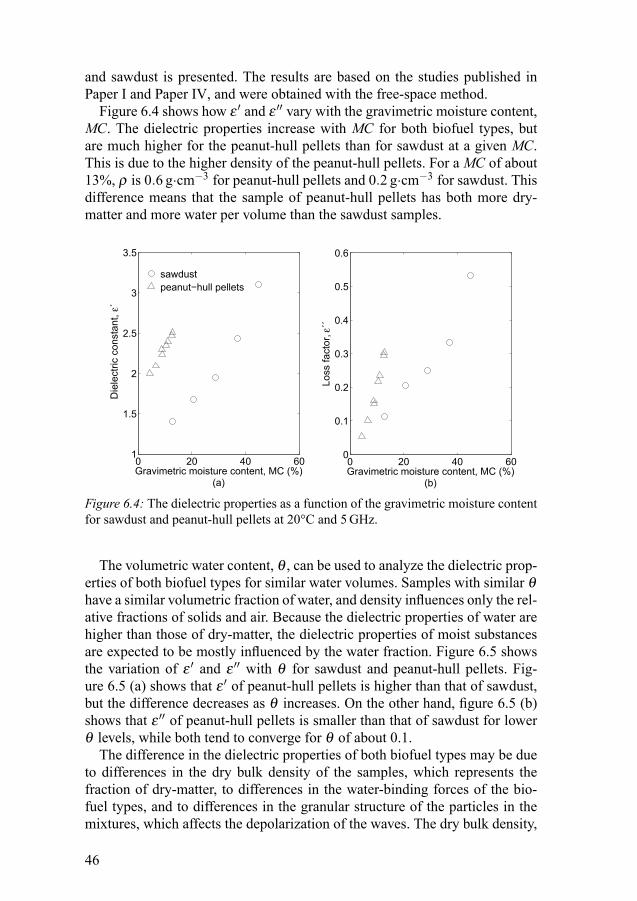
and sawdust is presented. The results are based on the studies published inPaper I and Paper IV, and were obtained with the free-space method.
Figure 6.4 shows how ε ′ and ε ′′ vary with the gravimetric moisture content,MC. The dielectric properties increase with MC for both biofuel types, butare much higher for the peanut-hull pellets than for sawdust at a given MC.This is due to the higher density of the peanut-hull pellets. For a MC of about13%, ρ is 0.6 g·cm−3 for peanut-hull pellets and 0.2 g·cm−3 for sawdust. Thisdifference means that the sample of peanut-hull pellets has both more dry-matter and more water per volume than the sawdust samples.
0 20 40 601
1.5
2
2.5
3
3.5
Die
lect
ric c
onst
ant,
ε´
Gravimetric moisture content, MC (%)(a)
0 20 40 600
0.1
0.2
0.3
0.4
0.5
0.6
Loss
fact
or, ε
´´
Gravimetric moisture content, MC (%)(b)
sawdustpeanut−hull pellets
Figure 6.4: The dielectric properties as a function of the gravimetric moisture contentfor sawdust and peanut-hull pellets at 20°C and 5 GHz.
The volumetric water content, θ , can be used to analyze the dielectric prop-erties of both biofuel types for similar water volumes. Samples with similar θhave a similar volumetric fraction of water, and density influences only the rel-ative fractions of solids and air. Because the dielectric properties of water arehigher than those of dry-matter, the dielectric properties of moist substancesare expected to be mostly influenced by the water fraction. Figure 6.5 showsthe variation of ε ′ and ε ′′ with θ for sawdust and peanut-hull pellets. Fig-ure 6.5 (a) shows that ε ′ of peanut-hull pellets is higher than that of sawdust,but the difference decreases as θ increases. On the other hand, figure 6.5 (b)shows that ε ′′ of peanut-hull pellets is smaller than that of sawdust for lowerθ levels, while both tend to converge for θ of about 0.1.
The difference in the dielectric properties of both biofuel types may be dueto differences in the dry bulk density of the samples, which represents thefraction of dry-matter, to differences in the water-binding forces of the bio-fuel types, and to differences in the granular structure of the particles in themixtures, which affects the depolarization of the waves. The dry bulk density,
46

ρd , is also about four times higher for the peanut-hull pellets than for sawdust,which can explain that peanut-hull pellets have a higher ε ′ than sawdust forthe same θ . It is likely that the fraction of dry-matter contributes to ε ′ dueto electronic and atomic polarization, but these polarization types do not con-tribute to ε ′′ (see section 2.2). The higher dry-matter fraction can result in adecrease in ε ′′, as seen in figure 6.5 (b), due to greater water binding forces.
0 0.05 0.1 0.151
1.5
2
2.5
3
3.5
Die
lect
ric c
onst
ant,
ε´
Volumetric moisture, θ (vol ⋅ vol−1)(a)
0 0.05 0.1 0.150
0.1
0.2
0.3
0.4
0.5
0.6
Los
s fa
ctor
, ε´´
Volumetric moisture, θ (vol ⋅ vol−1)(b)
sawdustpeanut−hull pellets
Figure 6.5: The dielectric properties as a function of the volumetric moisture contentfor sawdust and peanut-hull pellets at 20°C and 5 GHz.
6.2 Determination of moisture contentDielectric mixing modelsPaper VI studied the applicability of three dielectric mixing models to thedielectric constant of solid biofuels measured with the waveguide method. TheMaxwell-Garnett mixing model (presented in equation (5.2)), provided thebest fit of the data, using empirical parameters for the depolarization factors.The model was also used for the prediction of moisture content. The predictionof an independent test set resulted in a RMSEP of 0.03 vol·vol−1.
In Paper V, the Maxwell-Garnett mixing model was used to model both ε ′and ε ′ measured with the waveguide method. This model resulted in a RM-SEP of 0.018 vol·vol−1, which is significantly lower than the prediction errorobtained when predicting θ from ε ′ only.
Figure 6.6 shows the complex permittivity as a function of θ , for the mea-sured data and the data modeled with the Maxwell-Garnett model, developedin Paper V. The variation of ε ′ for a determined θ is not explained by thedielectric mixing model, which indicates that this variation is not due to the
47
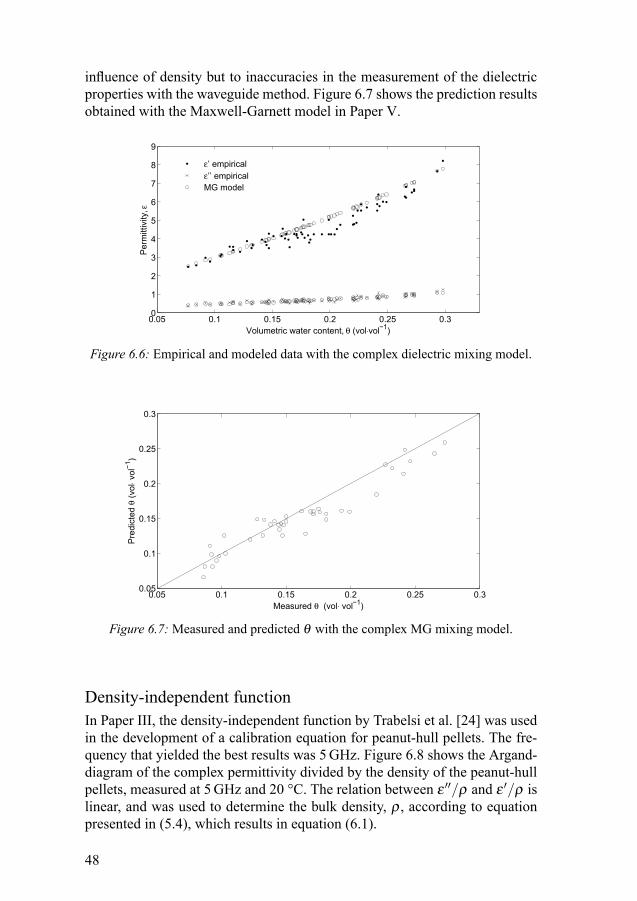
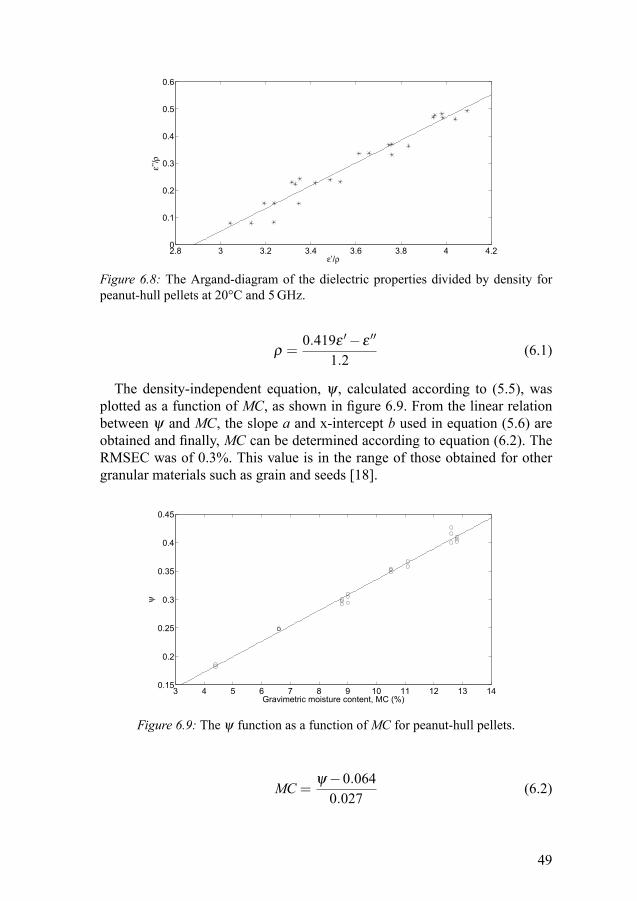
influence of density but to inaccuracies in the measurement of the dielectricproperties with the waveguide method. Figure 6.7 shows the prediction resultsobtained with the Maxwell-Garnett model in Paper V.
0.05 0.1 0.15 0.2 0.25 0.30
1
2
3
4
5
6
7
8
9
Volumetric water content, θ (vol⋅vol−1)
Per
mitt
ivity
,ε
ε’ empiricalε’’ empiricalMG model
Figure 6.6: Empirical and modeled data with the complex dielectric mixing model.
0.05 0.1 0.15 0.2 0.25 0.30.05
0.1
0.15
0.2
0.25
0.3
Pre
dict
edθ
(vol
⋅ vol
−1)
Measured θ (vol⋅ vol−1)
Figure 6.7: Measured and predicted θ with the complex MG mixing model.
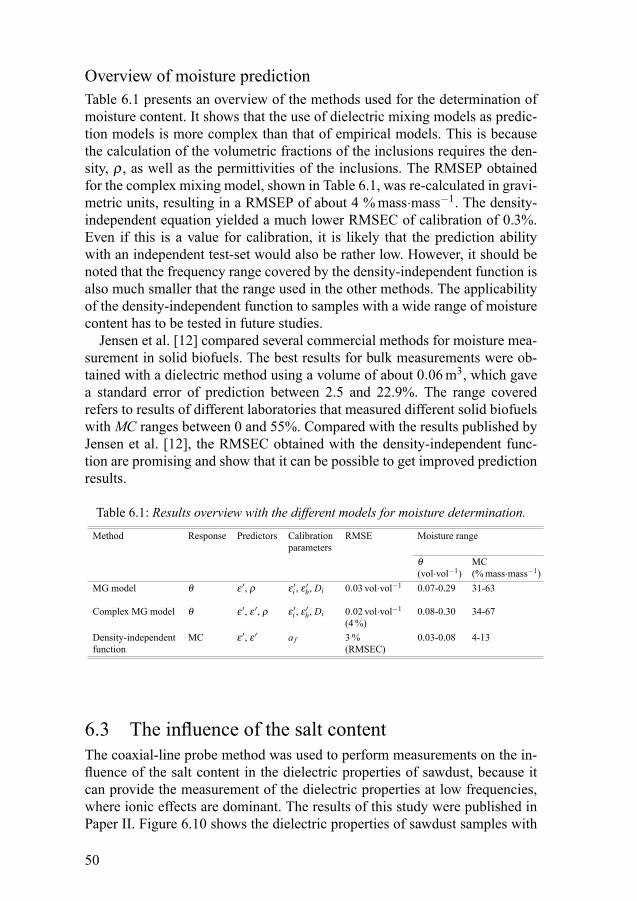
Density-independent functionIn Paper III, the density-independent function by Trabelsi et al. [24] was usedin the development of a calibration equation for peanut-hull pellets. The fre-quency that yielded the best results was 5 GHz. Figure 6.8 shows the Argand-diagram of the complex permittivity divided by the density of the peanut-hullpellets, measured at 5 GHz and 20 °C. The relation between ε ′′/ρ and ε ′/ρ islinear, and was used to determine the bulk density, ρ , according to equationpresented in (5.4), which results in equation (6.1).
48
2.8 3 3.2 3.4 3.6 3.8 4 4.20
0.1
0.2
0.3
0.4
0.5
0.6
ε’/ρ
ε’’/ρ
Figure 6.8: The Argand-diagram of the dielectric properties divided by density forpeanut-hull pellets at 20°C and 5 GHz.
ρ =0.419ε ′ − ε ′′
1.2(6.1)
The density-independent equation, ψ , calculated according to (5.5), wasplotted as a function of MC, as shown in figure 6.9. From the linear relationbetween ψ and MC, the slope a and x-intercept b used in equation (5.6) areobtained and finally, MC can be determined according to equation (6.2). TheRMSEC was of 0.3%. This value is in the range of those obtained for othergranular materials such as grain and seeds [18].
3 4 5 6 7 8 9 10 11 12 13 140.15
0.2
0.25
0.3
0.35
0.4
0.45
Gravimetric moisture content, MC (%)
ψ
Figure 6.9: The ψ function as a function of MC for peanut-hull pellets.
MC =ψ −0.064
0.027(6.2)
49
Overview of moisture predictionTable 6.1 presents an overview of the methods used for the determination ofmoisture content. It shows that the use of dielectric mixing models as predic-tion models is more complex than that of empirical models. This is becausethe calculation of the volumetric fractions of the inclusions requires the den-sity, ρ , as well as the permittivities of the inclusions. The RMSEP obtainedfor the complex mixing model, shown in Table 6.1, was re-calculated in gravi-metric units, resulting in a RMSEP of about 4 % mass·mass−1. The density-independent equation yielded a much lower RMSEC of calibration of 0.3%.Even if this is a value for calibration, it is likely that the prediction abilitywith an independent test-set would also be rather low. However, it should benoted that the frequency range covered by the density-independent function isalso much smaller that the range used in the other methods. The applicabilityof the density-independent function to samples with a wide range of moisturecontent has to be tested in future studies.
Jensen et al. [12] compared several commercial methods for moisture mea-surement in solid biofuels. The best results for bulk measurements were ob-tained with a dielectric method using a volume of about 0.06 m3, which gavea standard error of prediction between 2.5 and 22.9%. The range coveredrefers to results of different laboratories that measured different solid biofuelswith MC ranges between 0 and 55%. Compared with the results published byJensen et al. [12], the RMSEC obtained with the density-independent func-tion are promising and show that it can be possible to get improved predictionresults.
Table 6.1: Results overview with the different models for moisture determination.
Method Response Predictors Calibrationparameters
RMSE Moisture range
θ(vol·vol−1)
MC(% mass·mass−1)
MG model θ ε ′, ρ ε ′i , ε ′h, Di 0.03 vol·vol−1 0.07-0.29 31-63
Complex MG model θ ε ′, ε ′, ρ ε ′i , ε ′h, Di 0.02 vol·vol−1
(4 %)0.08-0.30 34-67
Density-independentfunction
MC ε ′, ε ′ a f 3 %(RMSEC)
0.03-0.08 4-13
6.3 The influence of the salt contentThe coaxial-line probe method was used to perform measurements on the in-fluence of the salt content in the dielectric properties of sawdust, because itcan provide the measurement of the dielectric properties at low frequencies,where ionic effects are dominant. The results of this study were published inPaper II. Figure 6.10 shows the dielectric properties of sawdust samples with
50
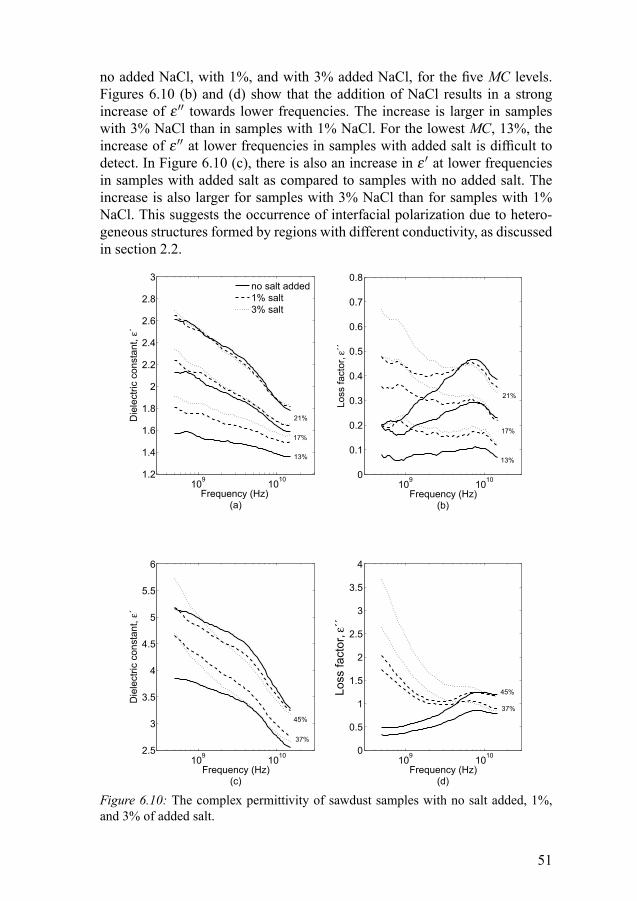
no added NaCl, with 1%, and with 3% added NaCl, for the five MC levels.Figures 6.10 (b) and (d) show that the addition of NaCl results in a strongincrease of ε ′′ towards lower frequencies. The increase is larger in sampleswith 3% NaCl than in samples with 1% NaCl. For the lowest MC, 13%, theincrease of ε ′′ at lower frequencies in samples with added salt is difficult todetect. In Figure 6.10 (c), there is also an increase in ε ′ at lower frequenciesin samples with added salt as compared to samples with no added salt. Theincrease is also larger for samples with 3% NaCl than for samples with 1%NaCl. This suggests the occurrence of interfacial polarization due to hetero-geneous structures formed by regions with different conductivity, as discussedin section 2.2.
109 10101.2
1.4
1.6
1.8
2
2.2
2.4
2.6
2.8
3
Frequency (Hz) (a)
Die
lect
ric c
onst
ant,
ε´
109 10100
0.1
0.2
0.3
0.4
0.5
0.6
0.7
0.8
Frequency (Hz)(b)
Loss
fact
or, ε
´´
no salt added1% salt 3% salt
21%
21%
17%17%
13%13%
109 10102.5
3
3.5
4
4.5
5
5.5
6
Frequency (Hz)(c)
Die
lect
ric c
onst
ant,
ε´
109 10100
0.5
1
1.5
2
2.5
3
3.5
4
Frequency (Hz)(d)
Loss
fact
or, ε
´´
45%
45%
37%
37%
Figure 6.10: The complex permittivity of sawdust samples with no salt added, 1%,and 3% of added salt.
51

Figure 6.11 shows the dielectric properties as functions of θ for sampleswith no added salt, and with 1% and 3% added salt at 0.5 GHz and 10 GHz.θ was calculated according to the method for density determination presentedin Paper I. Figure 6.11 (a) shows that ε ′ is larger for samples with higher saltcontent. A very large difference between different salt contents can be seen forε ′′ in figure 6.11 (b). Figures 6.11 (c) and (d) show that samples with differentsalt contents have very similar dielectric properties at 10 GHz. These resultsindicate that it may be possible to determine the salt content from the ionicconductivity of sawdust samples, by measurements at two frequencies, onewhere conductivity is not detectable and another one where it is dominant.
0 0.05 0.1 0.15 0.21
2
3
4
5
6
Volumetric water content, θ (vol/vol)(a)
Die
lect
ric c
onst
ant,
ε´
0 0.05 0.1 0.15 0.20
0.5
1
1.5
2
2.5
3
3.5
4
Volumetric water content, θ (vol/vol)(b)
Loss
fact
or, ε
´´
no NaCl added1% NaCl3% NaCl
0.5 GHz
0 0.05 0.1 0.15 0.21
2
3
4
5
6
Volumetric water content, θ (vol/vol)(c)
Dile
ctric
con
stan
t, ε´
0 0.05 0.1 0.15 0.20
0.5
1
1.5
2
2.5
3
3.5
4
Volumetric water content, θ (vol/vol)(d)
Loss
fact
orε´
´
10 GHz
Figure 6.11: The complex permittivity as a function of θ for sawdust samples at fiveMC levels with no added salt, with 1%, and with 3% added salt, at 0.5 and 10 GHz.
52
7. Conclusions
The aim of this thesis was to study the dielectric properties of solid biofuelsand their utilization for the characterization of such fuels. Three main researchquestions were posed at the beginning of this thesis. The first question con-cerned the influence of parameters such as the wave frequency, temperature,bulk density, and moisture.
The study of the frequency dependence of the dielectric properties of saw-dust between 5 and 15 GHz showed that sawdust samples with moisture con-tent above the fiber saturation point evidence a relaxation at about 9 GHz at-tributed to the free water in the samples. The measurements also evidencethe existence of bound water with a relaxation frequency under the measuredfrequency range.
Temperature was shown to affect the dielectric properties of peanut-hullpellets measured with the highly accurate free-space method. Both ε ′ and ε ′′increase linearly as the temperature rises from -20°C to 40°C. This behaviourevidences the existence of nonfreezing water due to its bound condition.
Density affects the dielectric properties because it changes the dry-matterand water fractions in the materials. In peanut-hull pellets with similar gravi-metric moisture contents, the dielectric properties increase linearly with den-sity. Density mainly affects the dielectric constant.
As expected, the dielectric properties of solid biofuels are strongly affectedby moisture content. Besides moisture content, temperature, density and fre-quency, other parameters such as water binding modes and granule structurecan affect the dielectric properties of different types of biofuels. This indicatesthat specific calibration might be necessary for different biofuel types.
The second question posed at the beginning of the thesis concerned to thedetermination of the moisture content of solid biofuels from their dielectricproperties.
Dielectric mixing models were used for modeling the dielectric behavior ofsolid biofuels. The Maxwell-Garnett model was found to be capable of fittingapparent dielectric constant and complex permittivity data, using empiricallydetermined parameters as depolarization factors. The models were used forthe prediction of moisture content in solid biofuels. The mixing model us-ing the complex permittivity showed a considerablely better prediction resultthan the mixing model using only the apparent dielectric constant, yieldinga RMSEP of 0.018 vol ·vol−1, or 4% mass·mass−1. Dielectric mixing modelsare important tools in the study of the dielectric behavior of granular materi-
53

als, but their use as prediction models is more complex than that of empiricalmodels. Furthermore, the Maxwell-Garnett model cannot be solved explicitlyfor the volumetric moisture content, which has to be calculated by iterations.
The density-independent equation by Trabelsi et al. for the determinationof the gravimetric moisture content was also tested with microwave frequencydata for peanut-hull pellets with MC between 4 and 13%. The RMSEC wasof 0.3 %, which is a very promising result. However, the application of thismethod should be tested for larger moisture ranges.
The third research question concerned the determination of other character-istics than moisture content from the dielectric properties.
The density-independent equation by Trabelsi et al. was also used with goodresults for the determination of the bulk density of peanut-hull pellets.
Another parameter of interest in the characterization of solid biofuels is ashcontent. Part of the ash content in solid biofuels has its origin in free ions inthe material. The influence of free ions on the dielectric properties was testedin sawdust with varying salt content. Salt content was shown to affect bothε ′ and ε ′′ at low frequencies. The influence is dominant at frequencies below4 GHz. This results can be used to determine the salt content from the ionicconductivity with measurements at two frequencies, one where conductivityis not detectable and another one where conductivity is dominant.
The results presented in this thesis contribute to the development and im-provement of methods for determination of important characteristics in solidbiofuels such as moisture content, density, and salt content using dielectricmeasurement techniques.
54
Bibliography
[1] A. Verbruggen and M. Marchohi. Views on peak oil and its relation to climatechange policy. Energy Policy, 2010.
[2] Climate change 2007: Synthesis report. Technical report, IntergovernmentalPanel on Climate Change.
[3] An energy policy for europe. Technical report, Commission of the EuropeanCommunities, Brussels, 2007.
[4] Biomass action plan. Technical report, Commission of the European Communi-ties, Brussels, 2005.
[5] Energy in sweden, figures and facts. Technical report, Swedish Energy Agency,2009.
[6] Ralph Sims. The Brilliance of Bioenergy: In Business and Practice. Earthscan,2002.
[7] Sjaak Van Loo and Jaap Koppejan. The handbook of biomass combustion andco-firing. Earthscan, 2008.
[8] J. Nyström and E. Dahlquist. Methods for determination of moisture content inwoodchips for power plants - a review. Fuel, 83(7-8):773 – 779, 2004.
[9] N. Kaliyan and R. Vance Morey. Factors affecting strength and durability ofdensified biomass products. Biomass and Bioenergy, 33(3):337–359, 2009.
[10] Solid biofuels—methods for determination of moisture content—oven drymethod—part 1: Total moisture—reference method. Technical report, EuropeanComitee for Standardization, CEN/TS 335, 2004.
[11] R. Samuelsson, J. Burvall, and R. Jirjis. Comparison of different methods forthe determination of moisture content in biomass. Biomass and Bioenergy,30(11):929–934, 2006.
[12] P.D. Jensen, H. Hartmann, T. Bohm, M. Temmerman, F. Rabier, and M. Mors-ing. Moisture content determination in solid biofuels by dielectric and NIRreflection methods. Biomass and Bioenergy, 30(11):935–943, 2006.
[13] T.A. Lestander, B. Johnsson, and M. Grothage. NIR techniques create addedvalues for the pellet and biofuel industry. Bioresource Technology, 100(4):1589–1594, 2009.
55

[14] J. Nyström. Rapid measurements of the moisture content in biofuel. PhD thesis,Mälardalen Univeristy, 2006.
[15] E. Nyfors. Industrial microwave Sensors-A review. Subsurface Sensing Tech-nologies and Applications, 1(1):23–43, 2000.
[16] R.J. King. On-line industrial applications of microwave moisture sensors. Sen-sors Update, 7(1):109–170, 2000.
[17] A. W. Kraszewski. Improved microwave method for moisture content measure-ment and control. IEEE transactions on industrial electronics, IECI-23(4):364–370, 1976.
[18] S. Trabelsi. Nondestructive sensing of physical properties of granular materialsby microwave permittivity measurement. IEEE transactions on instrumentationand measurement, 55(3):953–963, 2006.
[19] G. Topp, J. Davis, and A. Annan. Electromagnetic determination of soil watercontent: measurements in coaxial transmission lines. Water Resources Research,16(3):574 – 582, 1980.
[20] M. Dobson, F. Ulaby, M. Hallikainen, and M. El-Rayes. Microwave dielectricbehaviour of wet soil. II dielectric mixing models. IEEE Trans. Geosci. RemoteSens. (USA), GE-23(1):35 – 46, 1985.
[21] R. Fundinger M. Stacheder, M. Koehler. New time-domain reflectometrysensors for water content determination in porous media. Sensors Update,7(1):301–316, 2000.
[22] S. Schlaeger A. Brandelik M. Stacheder, C. Huebner. Combined tdr and low-frequency permittivity measurements for continuous snow wetness and snowdensity determination. In Electromagnetic Aquametry, pages 368–382. Springer,2005.
[23] L. Weihermuller, J.A. Huisman, S. Lambot, M. Herbst, and H. Vereecken. Map-ping the spatial variation of soil water content at the field scale with differentground penetrating radar techniques. Journal of Hydrology, 340(3-4):205–216,2007.
[24] S. Trabelsi, A.W. Krazsewski, and S.O. Nelson. New density-independent cali-bration function for microwave sensing of moisture content in particulate mate-rials. Instrumentation and Measurement, IEEE Transactions on, 47(3):613–622,1998.
[25] S. Trabelsi and S. O. Nelson. Free-space measurement of dielectric propertiesof cereal grain and oilseed at microwave frequencies. Measurement Science andTechnology, 14(5):589–600, 2003.
[26] M. Kent. Simultaneous determination of composition and other material prop-erties by using microwave sensors. Sensors Update, 7(1):301–316, 2000.
56
[27] S. Okamura. Microwave technology for moisture measurement. SubsurfaceSensing Technologies and Applications, 1(2):205–227, 2000.
[28] Ebbe Nyfors and Pertti Vainikainen. Industrial Microwave Sensors. ArtechHouse, 1994.
[29] Klaus Kupfer. Electromagnetic aquametry. Springer, 2005.
[30] W.L. James. Dielectric properties of wood and hardboard: Variation with fre-quency, moisture content, and grain orientation. Technical Report Pap. FPL-245,USDA For. Ser. Res., Madison, WI., 1975.
[31] G. Torgovnikov. Dielectric properties of wood and wood based materials.Springer-Verlag, 1992.
[32] Hiroyuki Sugimoto, Ryosuke Takazawa, and Misato Norimoto. Dielectric relax-ation due to heterogeneous structure in moist wood. Journal of wood science,51(6):549–553, 2005.
[33] A. W. Kraszewski. Recent advances in electromagnetic aquametry. In Electro-magnetic Aquametry, pages 1–14. Springer, 2005.
[34] Daniel A. Fleisch. A student’s guide to Maxwell’s equations. Cambridge Uni-versity Press, 2008.
[35] L. Chen, C. Ong, C. Neo, V. V. Varadan, and V. K. Varadan. Microwave elec-tronics, measurement and materials characterization. Wiley, 2004.
[36] F. Ulaby. Fundamentals of applied electromagnetics. Pearson Prentice Hall, 5edition, 2007.
[37] J Hasted. Aquous Dielectrics. Chapman and Hall, 1973.
[38] U. Kaatze. Electromagnetic wave interaction with water and aqueous solutions.In Electromagnetic Aquametry, pages 15–37. Springer, 2005.
[39] U. Kaatze. The dielectric properties of water in its different states of interaction.Journal of Solution Chemistry, 26(11):1049–1112, 1997.
[40] S. Berry and M. Roderick. Plant-water relations and the fibre saturation point.New Phytologist, 168(1):25–37, 2005.
[41] Solid biofuels - fuel specifications and classes. Technical Report DD CEN/TS14962:2005, European Comitee for Standardization, CEN/TS 335, 2005.
[42] B.M. Jenkins, L.L. Baxter, T.R. Miles, and T.R. Miles. Combustion propertiesof biomass. Fuel Processing Technology, 54(1-3):17–46, 1998.
[43] A. Khan, W. de Jong, and P. Jansens. Biomass combustion in fluidized bed boil-ers: Potential problems and remedies. Fuel Processing Technology, 90(1):21–51, 2009.
57
[44] F. Frandsen, S. van Lith, R. Korbee, P. Yrjas, R. Backman, I. Obernberger,T. Brunner, and M. Joller. Quantification of the release of inorganic elementsfrom biofuels. Fuel Processing Technology, 88(11-12):1118–1128, 2007.
[45] K.V. Shah, M.K. Cieplik, C.I. Betrand, W.L. van de Kamp, and H.B. Vuthaluru.Correlating the effects of ash elements and their association in the fuel matrixwith the ash release during pulverized fuel combustion. Fuel Processing Tech-nology, 91(5):531–545, 2010.
[46] M.T. Hallikainen, F.T. Ulaby, M.C. Dobson, M.A. El-Rayes, and Lil-Kun Wu.Microwave dielectric behavior of wet Soil-Part 1: Empirical models and exper-imental observations. Geoscience and Remote Sensing, IEEE Transactions on,GE-23(1):25–34, 1985.
[47] J. Nyström and B. Franzon. Radio frequency system for measuring characteris-tics of biofuels. In Proceedings of the IEEE Instrumentation and MeasurementTechnology Conference, Ottawa, Ontario, Canada, 2005.
[48] S.O. Nelson, P.G. Bartley, and K.C. Lawrence. Measuring RF and microwavepermittivities of adult rice weevils. Instrumentation and Measurement, IEEETransactions on, 46(4):941–946, 1997.
[49] D. Robinson, S. Jones, J. Wraith, D. Or, and S. Friedman. A Review of Ad-vances in Dielectric and Electrical Conductivity Measurement in Soils UsingTime Domain Reflectometry. Vadose Zone Journal, 2(4):444–475, 2003.
[50] M. Dobson, F. Ulaby, M. Hallikainen, and M. El-Rayes. Microwave dielectricbehaviour of wet soil. II dielectric mixing models. IEEE Trans. Geosci. RemoteSens. (USA), GE-23(1):35 – 46, 1985.
[51] M. Hilhorst, C. Dirksen, F. Kampers, and R. Feddes. New dielectric mixtureequation for porous materials based on depolarization factors. Soil Science So-ciety of America Journal, 64(5):1581 – 1587, 2000.
[52] Ari Sihvola. Electromagnetic mixing formulas and applications. The Institutionof Electrical Engineers, 1999.
[53] S. Trabelsi. Calibration methods for nondestructive microwave sensing of mois-ture content and bulk density of granular materials. Transactions of the ASAE,47(6):1999–2008, 2004.
[54] S. Jones and D. Or. Modeled effects on permittivity measurements of watercontent in high surface area porous media. Physica B: Condensed Matter, 338(1-4):284–290, 2003.
[55] S.O. Nelson S. Trabelsi. Temperature-dependent behaviour of dielectric prop-erties of bound water in grain at microwave frequencies. Measurement Scienceand Technology, 17(8):2289–2293, 2006.
58