Thickness Dependent Magnetic and Dielectric Behavior …€¦ · Thickness Dependent Magnetic and...
9
Thickness Dependent Magnetic and Dielectric Behavior of Iron Oxide Thin Films Saira Riaz 1) , Aseya Akbar 2) , Shahid Atiq 3) , *S. Sajjad Hussain 4) and Shahzad Naseem 5) 1), 2), 3), 4), 5) Centre of Excellence in Solid State Physics, University of the Punjab, Lahore-54590, Pakistan 5) [email protected] ABSTRACT Thin iron oxide films have been a subject of many studies, primarily due to their interesting magnetic properties. These films can exhibit several crystal structures and compositions because of the different possible valence states of iron cations. These structures include wustite (FeO), which is a rocksalt phase, magnetite (Fe 3 O 4 ), and maghemite (γ –Fe 2 O 3 ), which are both cubic spinel phases, and hematite (α-Fe 2 O 3 ), which is a corundum phase. Magnetite and maghemite have similar crystal structures, but the higher O/Fe ratio in the latter phase (i.e. maghemite) corresponds to a higher oxidation state of the iron ions. Iron oxide thin films are prepared using sol-gel and spin coating method. Thin films are deposited onto silicon substrates with variation in film thickness as 100nm, 200nm, 300nm, 400nm and 500nm. Thickness is confirmed using Variable Angle Spectroscopic Ellipsometer. These films are characterized using X-ray diffractometer (XRD), impedance analyzer and vibrating sample magnetometer (VSM). XRD patterns confirm the formation of phase pure magnetite. Crystallinity of the films increases as film thickness is increased to 400nm. With further increase in thickness crystallinity of the films decreases along with decrease in crystallite size. This increase in film thickness up to 400nm results in transition from weak ferromagnetic behavior to strong ferromagnetic behavior. Dielectric properties of iron oxide thin films show anomalous behavior whereas, normal dispersion behavior is observed in tangent loss. Highest dielectric constant and low tangent loss is observed for iron oxide thin films with 400nm thickness. 1. INTRODUCTION Thin film has attracted worldwide attraction due to their unique properties that leads it wide applications as a catalyst and in spintronic devices (Alraddadi et al. 2016, Genuzio et al. 2016). The advantage that magnetic thin films offers over bulk materials includes size dependent magnetic as well as structural properties. Control of various parameters, including film thickness, leads to deviation in different properties thus making them suitable for diverse applications (Alraddadi et al. 2016, Genuzio et al. 2016, Motlagh and Araghi 2016).
Transcript of Thickness Dependent Magnetic and Dielectric Behavior …€¦ · Thickness Dependent Magnetic and...
Thickness Dependent Magnetic and Dielectric Behavior of Iron OxideThin Films
Saira Riaz1), Aseya Akbar2), Shahid Atiq3), *S. Sajjad Hussain4)
and Shahzad Naseem5)
1), 2), 3), 4), 5) Centre of Excellence in Solid State Physics, University of the Punjab,Lahore-54590, Pakistan
ABSTRACT
Thin iron oxide films have been a subject of many studies, primarily due to theirinteresting magnetic properties. These films can exhibit several crystal structures andcompositions because of the different possible valence states of iron cations. Thesestructures include wustite (FeO), which is a rocksalt phase, magnetite (Fe3O4), andmaghemite (γ –Fe2O3), which are both cubic spinel phases, and hematite (α-Fe2O3),which is a corundum phase. Magnetite and maghemite have similar crystal structures,but the higher O/Fe ratio in the latter phase (i.e. maghemite) corresponds to a higheroxidation state of the iron ions. Iron oxide thin films are prepared using sol-gel and spincoating method. Thin films are deposited onto silicon substrates with variation in filmthickness as 100nm, 200nm, 300nm, 400nm and 500nm. Thickness is confirmed usingVariable Angle Spectroscopic Ellipsometer. These films are characterized using X-raydiffractometer (XRD), impedance analyzer and vibrating sample magnetometer (VSM).XRD patterns confirm the formation of phase pure magnetite. Crystallinity of the filmsincreases as film thickness is increased to 400nm. With further increase in thicknesscrystallinity of the films decreases along with decrease in crystallite size. This increasein film thickness up to 400nm results in transition from weak ferromagnetic behavior tostrong ferromagnetic behavior. Dielectric properties of iron oxide thin films showanomalous behavior whereas, normal dispersion behavior is observed in tangent loss.Highest dielectric constant and low tangent loss is observed for iron oxide thin filmswith 400nm thickness.
1. INTRODUCTION
Thin film has attracted worldwide attraction due to their unique properties thatleads it wide applications as a catalyst and in spintronic devices (Alraddadi et al. 2016,Genuzio et al. 2016). The advantage that magnetic thin films offers over bulk materialsincludes size dependent magnetic as well as structural properties. Control of variousparameters, including film thickness, leads to deviation in different properties thusmaking them suitable for diverse applications (Alraddadi et al. 2016, Genuzio et al.2016, Motlagh and Araghi 2016).
Among various materials of interest magnetite is a potential candidate for variouselectronic and spintronic applications. In magnetite, both 2+ and 3+ states of ironcations are available. The magnetic moments linked to these cations are 5.0μB and4.0μB (Nakamura et al. 2016, Tsuchiya et al. 2016, Craik 1975). No magnetization islinked to oxygen anions. The magnetic moments of Fe3+ cations cancel each other (Laiet al. 2006, Motlagh et al. 2016). Un-compensated magnetic moments lead tomagnetization in Fe3O4 (Riaz et al. 2014a,b, Akbar et al. 2014a,b, Akbar et al. 2015).
Iron oxide thin films have diversity in their structure as well as magnetic properties.These properties can be tuned with variation in various parameters during depositionand /or preparation. The parameter varied in this research work is film thickness.Thickness is varied as 100-500nm.
2. EXPERIMENTAL DETAILS
Iron oxide films were prepared using spin method after synthesis of iron oxide sol.Fe(NO3)3.9H2O was used as precursor. For sol synthesis, precursor was dissolved insuitable solvent and heated at 80˚C for sol synthesis (Riaz et al. 2014b, Akbar et al. 2014b).
Copper (Cu) was used as substrate. 5mm×5mm copper substrates were cleanedusing acetone and isopropyl alcohol in ultrasonic bath for 15 minutes, separately(Asghar et al. 2006a,b). Thin films were coated on Cu substrates using Delta 6RC spincoater. During successive coatings, film was dried at room temperature. In this waynumber of coatings was varied in order to achieve required film thickness. Sampleswere named as S1-S5 with increase in number of coatings thereby, increasing filmthickness.
For structural properties Bruker D8 Advance X-ray diffractometer (XRD), withCuKα (1.5406Å) radiations, was used. Magnetic properties were studied with the help ofLakeshore’s 7407 Vibrating Sample Magnetometer (VSM). Dielectric properties werestudied with the help of 6500B Precision Impedance Analyzer.
3. RESULTS AND DISCUSSION
Thickness of the films was determined using “M-2000 Variable AngleSpectroscopic Ellipsometer”. Model composed of three layers was built based onsubstrate material, film thickness and surface roughness. Film thickness and substrateroughness can be seen in Table 1. Decreases in roughness values was observed withincrease in film thickness. This effect arises because of the availability of morenucleation sites with the increase in film thickness. Furthermore, probability of absorbedatoms increases with increase in thickness values thus producing more uniform layerafter nucleation and by lowering energy difference between two nuclei. Therefore, thesurface roughness decreases as film becomes more thick within the limitation ofthickness. This effect is strengthened by XRD patterns. After saturation limit is achieved(in our case 400nm) the surface roughness increases.
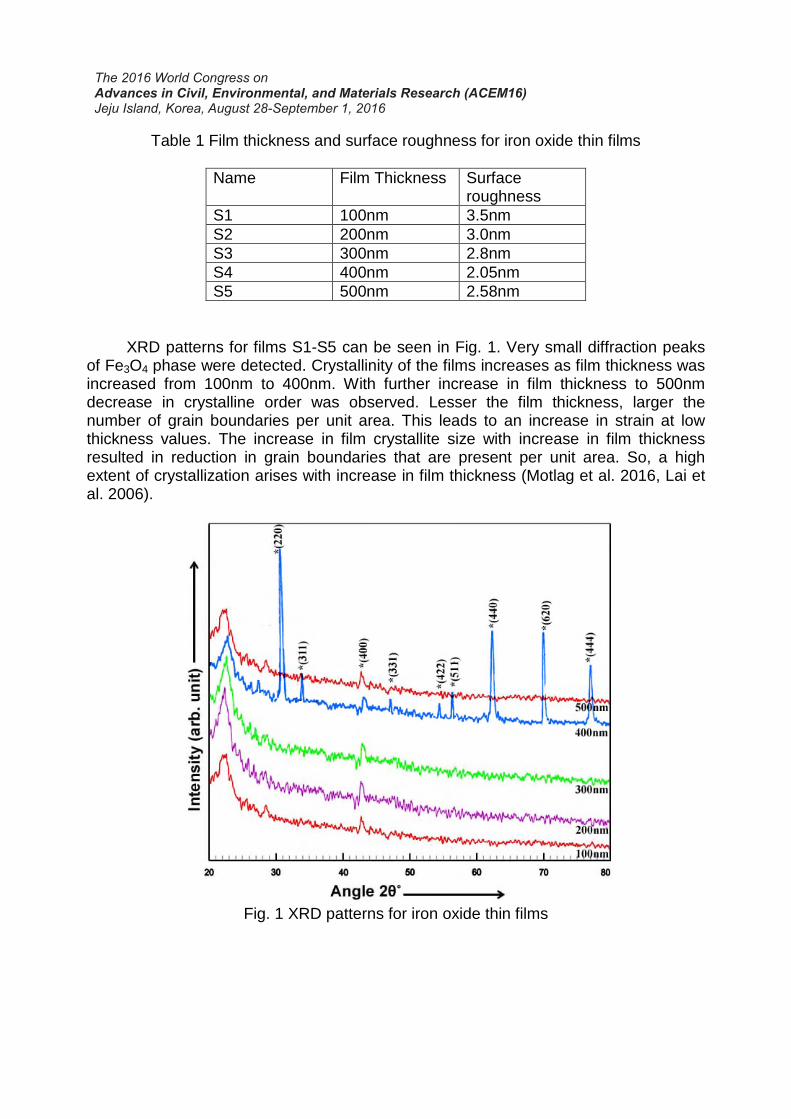
Table 1 Film thickness and surface roughness for iron oxide thin films
Name Film Thickness Surfaceroughness
S1 100nm 3.5nmS2 200nm 3.0nmS3 300nm 2.8nmS4 400nm 2.05nmS5 500nm 2.58nm
XRD patterns for films S1-S5 can be seen in Fig. 1. Very small diffraction peaksof Fe3O4 phase were detected. Crystallinity of the films increases as film thickness wasincreased from 100nm to 400nm. With further increase in film thickness to 500nmdecrease in crystalline order was observed. Lesser the film thickness, larger thenumber of grain boundaries per unit area. This leads to an increase in strain at lowthickness values. The increase in film crystallite size with increase in film thicknessresulted in reduction in grain boundaries that are present per unit area. So, a highextent of crystallization arises with increase in film thickness (Motlag et al. 2016, Lai etal. 2006).
Fig. 1 XRD patterns for iron oxide thin films
Crystallite size (t), strain (Cullity 1956), dislocation density (δ) (Kumar et al. 2011)and lattice parameters (Cullity 1956) were calculated using Eqs. 1-4
θ
λ
cos
9.0
Bt = (1)
2
1
t=δ (2)
hkl
hkl
d
dd
d
dStrain
−=
∆=
exp (3)
++= 222
24
22sin lkh
a
λθ (4)
Where, θ is the diffraction angle, λ is the wavelength (1.5406Å) and B is FullWidth at Half Maximum, dexp is the d-spacing calculated using XRD patterns in Fig. 1and dhkl is the d-spacing taken JCPDS cards.
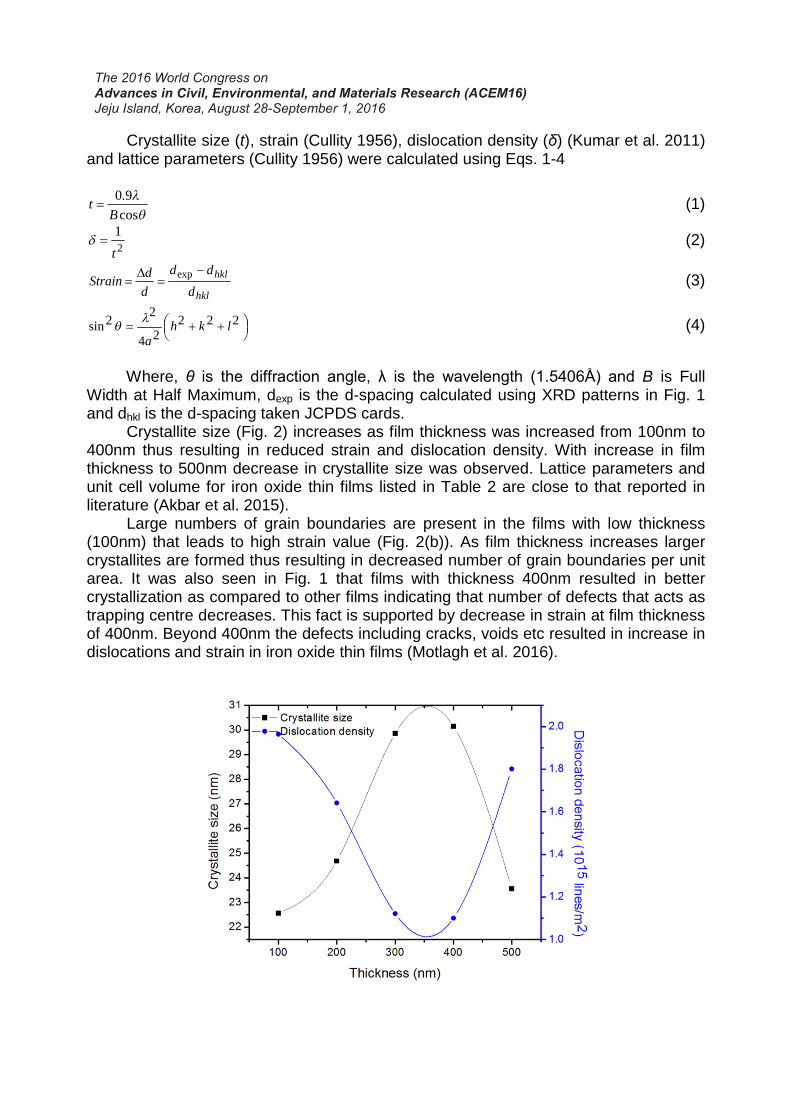
Crystallite size (Fig. 2) increases as film thickness was increased from 100nm to400nm thus resulting in reduced strain and dislocation density. With increase in filmthickness to 500nm decrease in crystallite size was observed. Lattice parameters andunit cell volume for iron oxide thin films listed in Table 2 are close to that reported inliterature (Akbar et al. 2015).
Large numbers of grain boundaries are present in the films with low thickness(100nm) that leads to high strain value (Fig. 2(b)). As film thickness increases largercrystallites are formed thus resulting in decreased number of grain boundaries per unitarea. It was also seen in Fig. 1 that films with thickness 400nm resulted in bettercrystallization as compared to other films indicating that number of defects that acts astrapping centre decreases. This fact is supported by decrease in strain at film thicknessof 400nm. Beyond 400nm the defects including cracks, voids etc resulted in increase indislocations and strain in iron oxide thin films (Motlagh et al. 2016).

Fig. 2 Crystallite size, strain and dislocation density plotted as a function of filmthickness
Table 2 Lattice parameters and unit cell volume for iron oxide thin films
Thickness (nm)Lattice
parameters (Å)Unit cell
volume (Å3)
100 8.374 587.2173
200 8.370 586.3763300 8.735 666.4825400 8.370 586.3763500 8.371 586.5864
M-H curves for iron oxide films can be seen in Fig. 3. Films with thickness 100-300nm showed weak magnetic behavior. Transition to strong ferromagnetic behaviorwas observed with increase in film thickness to 400nm. Magnetite (Fe3O4) is composedof Fe2+ and Fe3+ cations. These cations are arranged on octahedral and tetrahedrallattices. Fe2+ and Fe3+ have six and five electrons in their subshell, respectively. Whenthese electrons are arranged, in accordance with Hund’s rule, Fe3+ cations give highmagnetic moment of 5.0μB as compared to Fe2+ cations. But these Fe3+ cations haveantiferromagnetic coupling in the lattice. Therefore, magnetic moment of Fe2+ cationsleads to net magnetization in Fe3O4 (Craik 1975, Riaz et al. 2014b, Akbar et al. 2015).This transition to ferromagnetic behavior is associated with transition in crystallinebehavior of iron oxide films (Fig. 1).
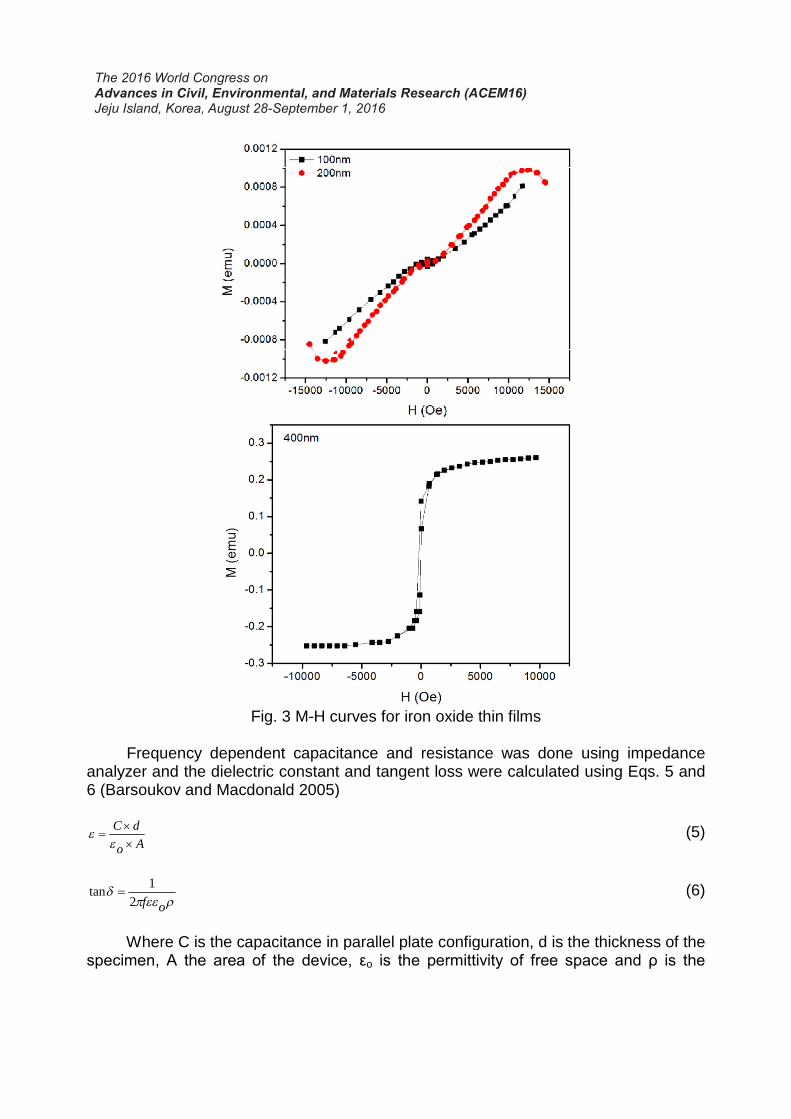
Fig. 3
Frequency dependent canalyzer and the dielectric constant and tangent loss were calculated using Eq6 (Barsoukov and Macdonald 2005)
Ao
dC
×
×=ε
ε
ρεεπδ
of2
1tan =
Where C is the capacitance in parallel plate configuration, d is the thickness of thespecimen, A the area of the device, ε
Fig. 3 M-H curves for iron oxide thin films
Frequency dependent capacitance and resistance was doneanalyzer and the dielectric constant and tangent loss were calculated using Eq6 (Barsoukov and Macdonald 2005)
the capacitance in parallel plate configuration, d is the thickness of thespecimen, A the area of the device, εo is the permittivity of free space and ρ is the
was done using impedanceanalyzer and the dielectric constant and tangent loss were calculated using Eqs. 5 and
(5)
(6)
the capacitance in parallel plate configuration, d is the thickness of theis the permittivity of free space and ρ is the
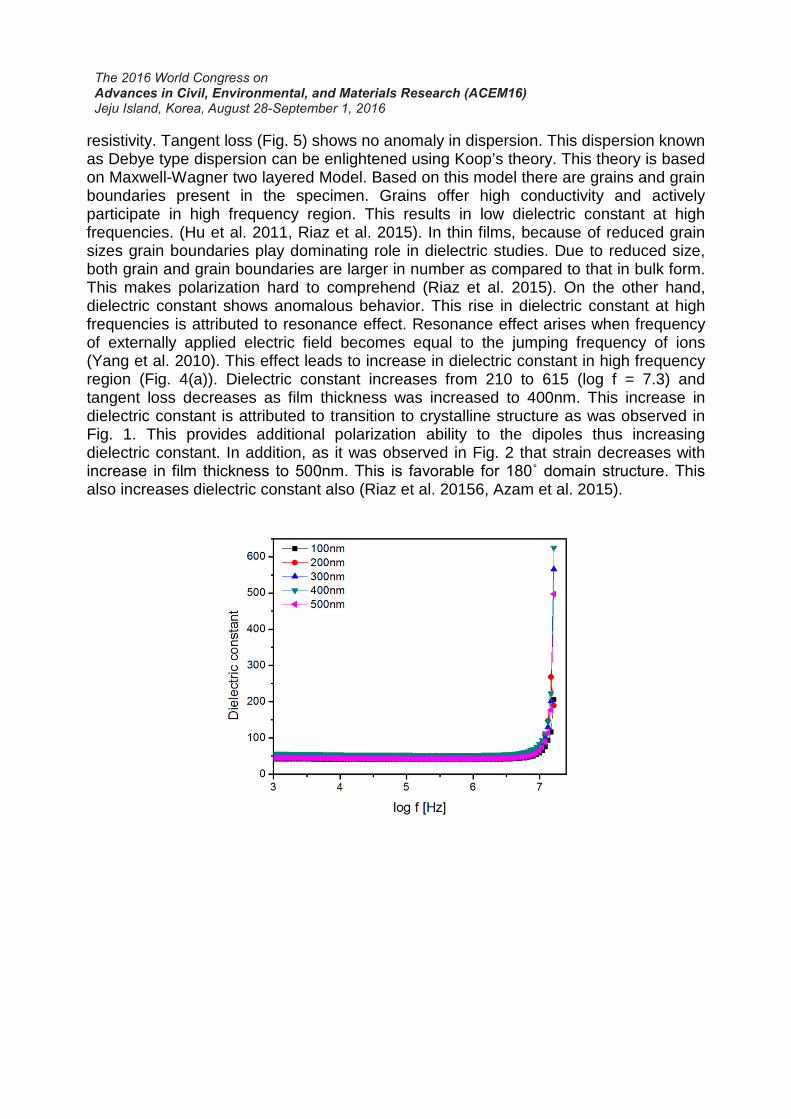
resistivity. Tangent loss (Fig. 5) shows no anomaly in dispersion. This dispersion knownas Debye type dispersion can be enlightened using Koop’s theory. This theory is basedon Maxwell-Wagner two layered Model. Based on this model there are grains and grainboundaries present in the specimen. Grains offer high conductivity and activelyparticipate in high frequency region. This results in low dielectric constant at highfrequencies. (Hu et al. 2011, Riaz et al. 2015). In thin films, because of reduced grainsizes grain boundaries play dominating role in dielectric studies. Due to reduced size,both grain and grain boundaries are larger in number as compared to that in bulk form.This makes polarization hard to comprehend (Riaz et al. 2015). On the other hand,dielectric constant shows anomalous behavior. This rise in dielectric constant at highfrequencies is attributed to resonance effect. Resonance effect arises when frequencyof externally applied electric field becomes equal to the jumping frequency of ions(Yang et al. 2010). This effect leads to increase in dielectric constant in high frequencyregion (Fig. 4(a)). Dielectric constant increases from 210 to 615 (log f = 7.3) andtangent loss decreases as film thickness was increased to 400nm. This increase indielectric constant is attributed to transition to crystalline structure as was observed inFig. 1. This provides additional polarization ability to the dipoles thus increasingdielectric constant. In addition, as it was observed in Fig. 2 that strain decreases withincrease in film thickness to 500nm. This is favorable for 180˚ domain structure. This also increases dielectric constant also (Riaz et al. 20156, Azam et al. 2015).
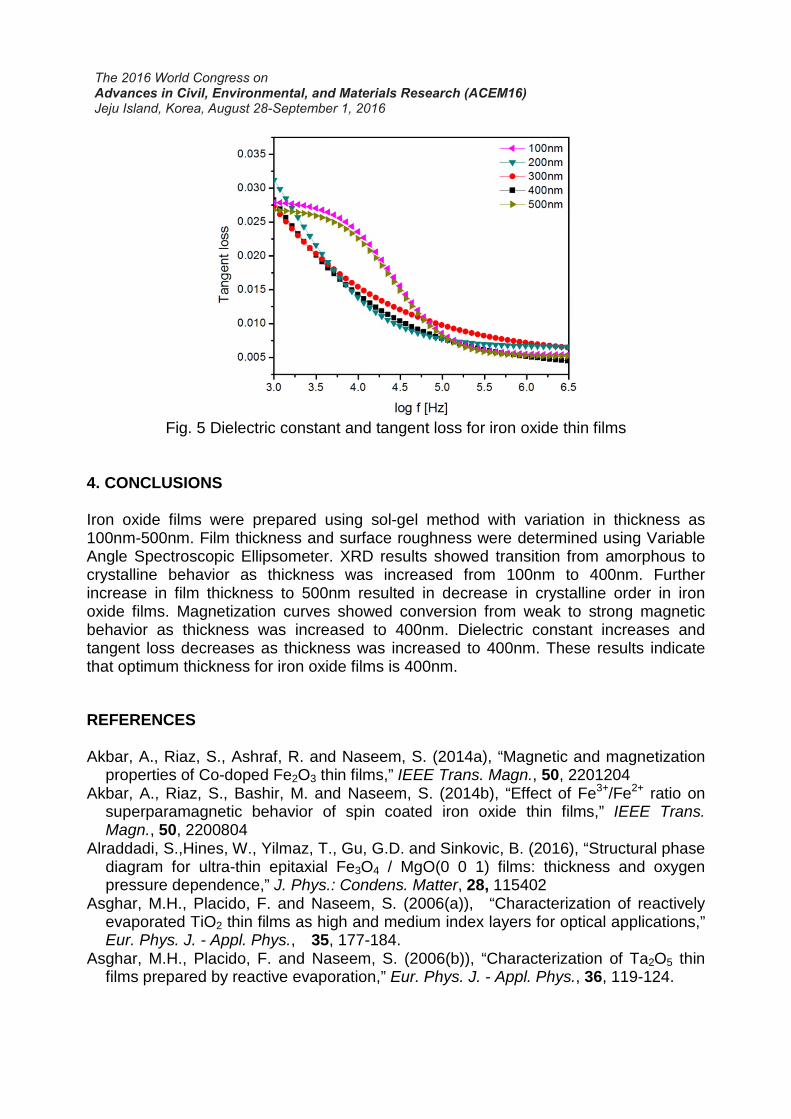
Fig. 5 Dielectric constant and tangent loss for iron oxide thin films
4. CONCLUSIONS
Iron oxide films were prepared using sol-gel method with variation in thickness as100nm-500nm. Film thickness and surface roughness were determined using VariableAngle Spectroscopic Ellipsometer. XRD results showed transition from amorphous tocrystalline behavior as thickness was increased from 100nm to 400nm. Furtherincrease in film thickness to 500nm resulted in decrease in crystalline order in ironoxide films. Magnetization curves showed conversion from weak to strong magneticbehavior as thickness was increased to 400nm. Dielectric constant increases andtangent loss decreases as thickness was increased to 400nm. These results indicatethat optimum thickness for iron oxide films is 400nm.
REFERENCES
Akbar, A., Riaz, S., Ashraf, R. and Naseem, S. (2014a), “Magnetic and magnetizationproperties of Co-doped Fe2O3 thin films,” IEEE Trans. Magn., 50, 2201204
Akbar, A., Riaz, S., Bashir, M. and Naseem, S. (2014b), “Effect of Fe3+/Fe2+ ratio onsuperparamagnetic behavior of spin coated iron oxide thin films,” IEEE Trans.Magn., 50, 2200804
Alraddadi, S.,Hines, W., Yilmaz, T., Gu, G.D. and Sinkovic, B. (2016), “Structural phasediagram for ultra-thin epitaxial Fe3O4 / MgO(0 0 1) films: thickness and oxygenpressure dependence,” J. Phys.: Condens. Matter, 28, 115402
Asghar, M.H., Placido, F. and Naseem, S. (2006(a)), “Characterization of reactivelyevaporated TiO2 thin films as high and medium index layers for optical applications,”Eur. Phys. J. - Appl. Phys., 35, 177-184.
Asghar, M.H., Placido, F. and Naseem, S. (2006(b)), “Characterization of Ta2O5 thinfilms prepared by reactive evaporation,” Eur. Phys. J. - Appl. Phys., 36, 119-124.

Azam, M., Riaz, S., Akbar, A. and Naseem, S. (2015), “Structural, magnetic anddielectric properties of spinel MgFe2O4 by sol–gel route,” J. Sol-Gel Sci. Technol.,74, 340–351
Barsoukov, E. and Macdonald, J.R. (2005), “Impedance Spectroscopy Theory,Experiment, and Applications,” John Wiley & Sons, Inc., Publication, New Jersey,2005.
Craik, D.J. (1975), Magnetic Oxides, John Wiley & Sons, New York.Cullity, B.D. (1956), “Elements of x-ray diffraction,” Addison Wesley Publishing
Company, USA.Genuzio, F., Schmidt, S.T., Menzel, D. and Freund, H.J. (2016), “Phase
transformations in thin iron oxide films: Spectromicroscopic study of velocity andshape of the reaction fronts,” Surf. Sci., 648, 177–187
Hu, Y., Fei, L., Zhang, Y., Yuan, J., Wang, Y., Gu, H. (2011) “Synthesis of BismuthFerrite Nanoparticles via a Wet Chemical Route at Low Temperature,” J. Nanomater.2011, 797639.
Kumar, N., Sharma, V., Parihar, U., Sachdeva, R., Padha, N. and Panchal, C.J. (2011)“Structure, optical and electrical characterization of tin selenide thin films depositedat room temperature using thermal evaporation method,” J. Nano- Electron. Phys., 3,117-126
Lai, F., Lin, L., Huang, Z., Gai, R. and Qu, Y. (2006), “Effect of thickness on thestructure, morphology and optical properties of sputter deposited Nb2O5 films,” Appl.Surf. Sci., 253, 1801–1805
Motlagh, Z.A. and Araghi, M.E.A. (2016), “Effect of film thickness and texturemorphology on the physical properties of lead sulfide thin films,” Semicond. Sci.Technol., 31, 025017
Nakamura, K., Kuriyama, N., Takagiwa, S., Sato, T. and Kushida, M. (2016), “Filmfabrication of Fe or Fe3O4 nanoparticles mixed with palmitic acid for verticallyaligned carbon nanotube growth using Langmuir–Blodgett technique,” Japanese J.Appl. Phys., 55, 03DD06
Riaz, S., Akbar, A. and Naseem, S. (2014a), “Ferromagnetic Effects in Cr-Doped Fe2O3
Thin Films,” IEEE Trans. Magn., 50, 2200704Riaz, S., Ashraf, R., Akbar, A. and Naseem, S. (2014b), “Microwave Assisted Iron
Oxide Nanoparticles—Structural and Magnetic Properties,” IEEE Trans. Magn., 50,2201504
Riaz, S., Shah, S.M.H., Akbar, A., Atiq, S. and Naseem, S. (2015), “Effect of Mn dopingon structural, dielectric and magnetic properties of BiFeO3 thin films,” J. Sol-Gel Sci.Technol. 74, 310-319.
Tsuchiya, T. Terabe, K., Ochi, M., Higuchi, T., Osada, M., Yamashita, Y., Ueda, S.and Aono, M. (2016), “In Situ Tuning of Magnetization and Magnetoresistance inFe3O4 Thin Film Achieved with All-Solid-State Redox Device,” ACS Nano, 10,1655−1661
Yang, C., Jiang, J.S., Qian, F.Z., Jiang, D.M., Wang, C.M., Zhang, W.G. (2010), “Effectof Ba doping on magnetic and dielectric properties of nanocrystalline BiFeO3 at roomtemperature,” J. Alloy Compd., 507, 29–32.