THE DETERMINANTS OF INTERNATIONAL COMMERCIAL REAL · PDF filethe determinants of international...
55
THE DETERMINANTS OF INTERNATIONAL COMMERCIAL REAL ESTATE INVESTMENTS Karsten Lieser Alexander Peter Groh IESE Business School – University of Navarra Av. Pearson, 21 – 08034 Barcelona, Spain. Phone: (+34) 93 253 42 00 Fax: (+34) 93 253 43 43 Camino del Cerro del Águila, 3 (Ctra. de Castilla, km 5,180) – 28023 Madrid, Spain. Phone: (+34) 91 357 08 09 Fax: (+34) 91 357 29 13 Copyright © 2011 IESE Business School. Working Paper WP-935 July, 2011
Transcript of THE DETERMINANTS OF INTERNATIONAL COMMERCIAL REAL · PDF filethe determinants of international...
IESE Business School-University of Navarra - 1
THE DETERMINANTS OF INTERNATIONAL COMMERCIAL REAL ESTATE INVESTMENTS
Karsten Lieser
Alexander Peter Groh
IESE Business School – University of Navarra Av. Pearson, 21 – 08034 Barcelona, Spain. Phone: (+34) 93 253 42 00 Fax: (+34) 93 253 43 43 Camino del Cerro del Águila, 3 (Ctra. de Castilla, km 5,180) – 28023 Madrid, Spain. Phone: (+34) 91 357 08 09 Fax: (+34) 91 357 29 13 Copyright © 2011 IESE Business School.
Working Paper
WP-935
July, 2011
IESE Business School-University of Navarra
THE DETERMINANTS OF INTERNATIONAL
COMMERCIAL REAL ESTATE INVESTMENTS
Karsten Lieser1
Alexander Peter Groh2
Abstract
We examine the determinants of commercial real estate investments using a unique set of panel data series for 47 countries from 2000 to 2009. We explore how different socio-economic, demographic and institutional characteristics affect commercial real estate investment activity through both cross-sectional and time-series analyses, running augmented random effect panel regressions. We provide evidence that economic growth, rapid urbanization and compelling demographics attract real estate investments and also confirm that lack of transparency in the legal framework, administrative burdens of doing real estate business, socio-cultural challenges and political instabilities of countries reduce international real estate allocations.
JEL Classification: C33, C23, G11, G23, G24, O16, O18, P25, P52
Keywords: Real Estate Investments, International Asset Allocation, Real Estate Market Attractiveness
1 Research Affiliate of the International Centre of Financial Research, IESE
2 Associate Professor of Finance, EMLYON Business School
IESE Business School-University of Navarra
THE DETERMINANTS OF INTERNATIONAL COMMERCIAL REAL ESTATE INVESTMENTS
1. Introduction According to Dunning’s (1977 and 2006) eclectic theory, any international investor needs to possess specific monopolistic advantages over his competition to successfully compete with local host market firms. Holsapple, Ozawa and Olienyk (2006) adapt Dunning’s theory for real estate investments. The authors argue that additional diversification advantages and return expectations also motivate investors to pursue investment in a foreign location. However, the sum of all these advantages must outweigh the implied transaction costs imposed by the liability of foreignness and foreign exchange. Before investors decide whether to internalize or externalize a target market opportunity through selecting the ideal type of market entry, the assessment of a host country’s attractiveness is essential for a successful allocation decision in foreign regions. New institutional economics theory defines a country’s attractiveness for investment by its socio-economic environment and institutional framework, e.g., Keogh and D’Arcy (1999) and Lee (2001 and 2005). Prior research submits that commercial real estate activity exists and stimulates in countries within a broad institutional context defined by sound economic growth, prevailing depth and liquid capital markets, and a stable political and socio-economic structure. Further, each country’s real estate market is conditioned by, among other criteria, administrative and regulatory burdens, and by the legal protection of investors. Clearly, these institutional characteristics vary strongly over countries and regions, and gradually over time. Van Doorn (2003) and Lee (2005) note that these differences are important for the analysis of long-term perspectives in investors’ international decision processes and require validation.
Yet for aggregated real estate investments, the effect of socio-economic and institutional differences across national markets and factors that impact international real estate asset allocations has remained limited in empirical literature, primarily due to the lack of appropriate data series. Therefore, we pioneer the real estate research by exploring the most comprehensive data set on the determinants of real estate investments in a way that controls for differences across countries and likewise over time. We review the literature for factors that sway international real estate investment decisions and define a conceptual framework of real estate market attractiveness. Based on this framework, we collect 66 data series from different databases ranging from 2000 to 2009 and structure a panel comprising 47 countries. We use commercial, aggregated, national real estate investments provided by Cushman & Wakefield as
2 - IESE Business School-University of Navarra
a dependent variable and apply augmented random effect panel regression analyses. This methodology uses decomposed estimators and controls for both effects: the differences between countries and within a country over the time period of the analyses.
We reveal the most important factors that spur real estate investments and shape national real estate markets and provide unique statistical evidence on our conceptual framework of a host country’s “attractiveness for investment”. Our results confirm that not only do economic growth, rapid urbanization and compelling demographics attract real estate investments; we also prove that international real estate investors are discouraged by lack of transparency in the legal framework, administrative burdens of doing real estate business, socio-cultural challenges and political instabilities. To our knowledge, we are the first to provide this evidence for real estate markets, as such a comprehensive empirical analysis on a complete set of drivers of country aggregate real estate investments has not previously been made. Thus, we increase the transparency and understanding of determinants for global real estate asset allocation decisions, and we believe that further research will build upon our framework to assess real estate market attractiveness.
2. Literature Review We searched the real estate literature for contributions that (i) provide notations of factors from theoretical market models and frameworks; (ii) examine the findings of surveys on investors’ selection criteria and market perceptions; and (iii) run quantitative or qualitative market analyses. Most research focuses on one or only a very limited number of factors that affect real estate investments in particular countries, markets or regions. None of the contributions has such a broad scope on a large number of countries, with a large number of potential determinants, and over time, as ours. We organize the literature overview into six parts and group the detected factors into latent “key drivers” in order to facilitate their interpretation and for organizational purposes. Each heading represents one of six latent key drivers identified as important, appropriate and quantifiable, to determine the attractiveness of a country for institutional real estate investments. The literature review concludes with a conceptual framework, which presents the outline of our regression models.
2.1 Economic Activity
It is intuitive that real estate investments are related to the general economic activity and prosperity of a region or country. According to DiPascal and Wheaton’s model (1992), a productive economy positively affects the demand for real estate assets. Chin, Dent and Roberts (2006) conclude from survey data that a sound economic structure and an expected strong and stable economy are perceived to be the most significant factors in a region’s ability to attract foreign real estate investments. Hoskins, Higgins and Cardew (2004) find that GDP growth, inflation, and unemployment show significant correlations with composite property returns. Chen and Hobbs (2003) find that the size of a country’s economy positively affects investment activity, as larger economies are usually more capable of withstanding external economic turmoil and are therefore more stable than smaller economies. Van Doorn (2003) notes that GDP per capita is commonly used for strategic real estate asset allocation decisions, and Connor and Liang (2000) argue that, over the long term, the impact of technological development is overwhelmingly positive on real estate investments. As technological advances enhance productivity and wealth, demand for all types of real estate also increase.
IESE Business School-University of Navarra - 3
2.2 Real Estate Investment Opportunities
Han (1996) concludes from his survey that real estate investment opportunities, demographic attributes, and the market structure are important selection criteria for investment decisions. The accessibility of property is a critical factor in real estate investment due to the close link between market entry probability, liquidity risk, and market transparency. Liang and Gordon (2003) estimate the availability of higher quality, not owner-occupied commercial real estate based on GDP estimations. Kurzrock et al. (2009) find via cross-sectional regression that a high degree of agglomeration affects property valuations. Obviously, accelerating urbanization, which determines the structure, potential and quality of the real estate environment, plays an important role for the investment decision. This is especially valid for the U.S., where urban areas are spreading across major regions, pushing up land and building values, and making real estate assets increasingly valuable. Lynn (2007) notes that improvement in communication and transportation infrastructure facilitates the migration to cities and drives the pace of urbanization, which supports new development. Furthermore, Thrall (2002) claims that the financial and business service sectors reflect a growing level of sophistication in the service economy and, thus, the demand for commercial real estate.
2.3 Depth and Sophistication of the Capital Market
Mueller (1995) argues that the physical real estate market, with its capital-intensive nature, depends on general international capital flows. Adair et al. (1999) and Adlington et al. (2008) find that viable and sustainable real estate markets require an established liquid capital market, including a stable banking and financial services system. Worzala and Newell (1997) find that access to local financing and credit facilities is important for investors to mitigate the cross-currency risks. Connor and Liang (2000) argue that publicly traded sources of equity capital, primarily as REITs, are particularly important for a dynamic real estate investment activity, due to the potential for raising capital in the public market at relatively low cost. More and more real estate firms consider initial public offerings (IPOs) as favored exit routes, and Hartzell, Liu and Kallberg (2004) find evidence of the positive link between IPO and commercial real estate activity. Black and Gilson (1998) focus on deal-supporting institutions, such as law firms, investment banks, M&A boutiques, auditors, and consultants, and point to the financial market infrastructure, which is required for successful deal-making. Additionally, FDI (foreign direct investment) inflow into a country plays an important role in the state of the real estate investment environment. Laposa and Lizieri (2005) show that relaxation of FDI regulation for investments in retail businesses has given further impetus to the commercial real estate sector. Even so, since commercial real estate assets are often used as collateral within leveraged buyout transactions, Roulac (1996a) notes that private equity investors play an active role in flourishing real estate markets.
2.4 Investor Protection and Quality of Legal Framework
In their seminal work, La Porta et al. (1997 and 1998) find that the legal environment strongly determines the size and extent of a country’s capital market and local companies’ ability to receive outside financing. They emphasize the difference between law on books and the quality of law enforcement. La Porta et al. (1997) argue that, of the world’s four legal systems (English, French, German and Scandinavian), the English common law system is the most suitable for enhancing capital market development, while the French system is the least attractive. Glaeser et al. (2001), and Djankov et al. (2003 and 2005) suggest that parties in common-law countries have greater ease in enforcing their rights arising from commercial contracts. Even so, Knack and

4 - IESE Business School-University of Navarra
Keefer (1995), Mauro (1995), and Svensson (1998) demonstrate that property rights significantly affect investments and economic growth. Only a few papers relate real estate investments to law; however, Chin, Dent and Roberts (2006) and Lim, McGreal and Webb (2006) conduct surveys and reveal that particular aspects of the legal framework and legal regulation are also very important for real estate investors’ market perceptions. They relate this finding to the immobility of real estate property and to the complexity of real estate transactions.
2.5 Administrative Burdens and Regulatory Limitations
Solnik (1999) argues that investors trying to invest in foreign countries are exposed to constraints on management and corporate activity and regulatory limitations, which comprise the restriction on capital flows and ownership controls set upon particular government policies. D’Arcy and Keogh (1998) claim that each country’s real estate market is further conditioned by, among other criteria, landlord and tenant law, planning law, and urban policy. Keogh and D'Arcy (1999) find that active management of properties can be difficult due to different property market conventions, different codes of doing business, and differing administrative and fiscal regimes, coupled with different valuation standards. Therefore, the burden of doing real estate business and taxation are considered to directly affect the operational efficiencies of any transaction. Webb (1984), Worzala (1994) and Adair et al. (1999) note that this significantly affects foreign investors at three distinct times: when investing, operating or exiting. Host governments have imposed penalties on overseas investors when market conditions deteriorated, creating adverse effects on investment returns. McGreal, Parsa and Keivani (2001) find that regulatory limitations, exchange controls, and the repatriation of capital restrain international capital flows and, hence, are a major source of concern for investors.
2.6 Socio-cultural and Political Environment
The fact that international investments are made in a different sovereign political jurisdiction has a major impact on the investment decision. Keogh and D’Arcy (1999) argue that countries’ national property markets are defined by their socio-cultural and political environment. The socio-political risk comprises social risk and government policy risk and is an indicator of institutional problems in a country’s public sector. Lim, McGreal and Webb (2006) and Chin, Dent and Roberts (2006) found political stability to be the most important factor underpinning international investors’ country choices when entering emerging or developing economies. Solnik (1999) confirms that the political risks of foreign investment lower the expected success of international diversification, as even with low probability, the associated potential loss may be large. Lee (2001) notes that the level of perceived crime and corruption faced within a country can prove to be a major impediment to the successful implementation of an investment strategy. Geurts and Jaffe (1996) argue that a country’s socio-cultural framework is closely related to its political environment, influencing the overall investment climate.
2.7 Conceptual Framework
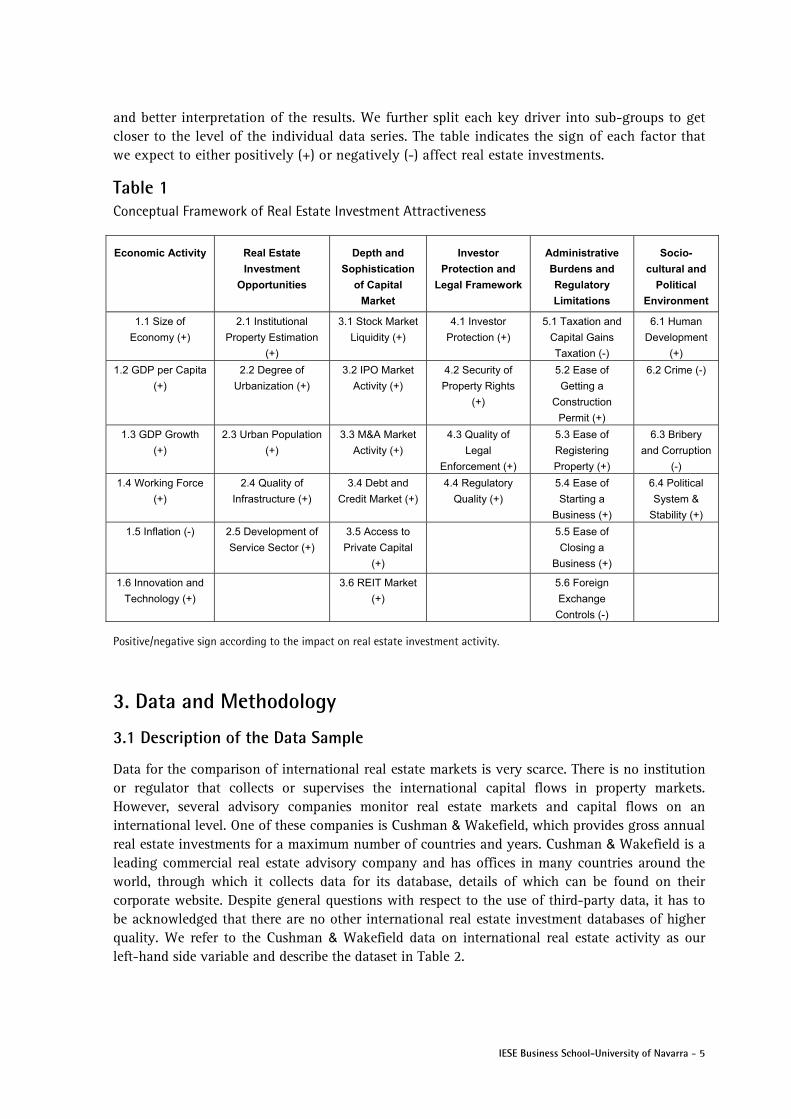
The literature submits the numerous aforementioned factors as determinants of the attractiveness of real estate markets in terms of their capital supply and demand conditions. We group these factors according to their socio-economic characteristics, and obtain six key drivers that impact commercial real estate investments: (i) economic activity; (ii) real estate investment opportunities; (iii) depth and sophistication of capital markets; (iv) investor protection and legal framework; (v) administrative burdens and regulatory limitations; and (vi) socio-cultural and political environment. These key driver definitions allow a clear structure of our methodology
IESE Business School-University of Navarra - 5
and better interpretation of the results. We further split each key driver into sub-groups to get closer to the level of the individual data series. The table indicates the sign of each factor that we expect to either positively (+) or negatively (-) affect real estate investments.
Table 1 Conceptual Framework of Real Estate Investment Attractiveness
Economic Activity Real Estate
Investment
Opportunities
Depth and
Sophistication
of Capital
Market
Investor
Protection and
Legal Framework
Administrative
Burdens and
Regulatory
Limitations
Socio-
cultural and
Political
Environment
1.1 Size of
Economy (+)
2.1 Institutional
Property Estimation
(+)
3.1 Stock Market
Liquidity (+)
4.1 Investor
Protection (+)
5.1 Taxation and
Capital Gains
Taxation (-)
6.1 Human
Development
(+)
1.2 GDP per Capita
(+)
2.2 Degree of
Urbanization (+)
3.2 IPO Market
Activity (+)
4.2 Security of
Property Rights
(+)
5.2 Ease of
Getting a
Construction
Permit (+)
6.2 Crime (-)
1.3 GDP Growth
(+)
2.3 Urban Population
(+)
3.3 M&A Market
Activity (+)
4.3 Quality of
Legal
Enforcement (+)
5.3 Ease of
Registering
Property (+)
6.3 Bribery
and Corruption
(-)
1.4 Working Force
(+)
2.4 Quality of
Infrastructure (+)
3.4 Debt and
Credit Market (+)
4.4 Regulatory
Quality (+)
5.4 Ease of
Starting a
Business (+)
6.4 Political
System &
Stability (+)
1.5 Inflation (-) 2.5 Development of
Service Sector (+)
3.5 Access to
Private Capital
(+)
5.5 Ease of
Closing a
Business (+)
1.6 Innovation and
Technology (+)
3.6 REIT Market
(+)
5.6 Foreign
Exchange
Controls (-)
Positive/negative sign according to the impact on real estate investment activity.
3. Data and Methodology
3.1 Description of the Data Sample
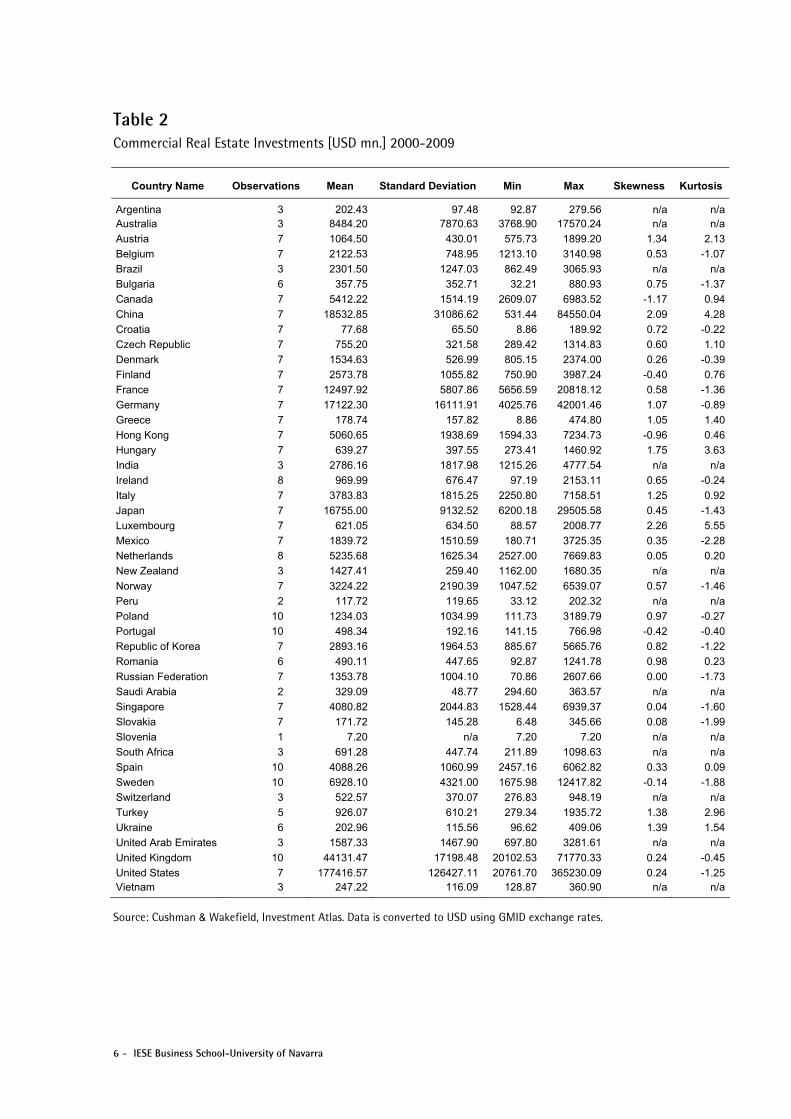
Data for the comparison of international real estate markets is very scarce. There is no institution or regulator that collects or supervises the international capital flows in property markets. However, several advisory companies monitor real estate markets and capital flows on an international level. One of these companies is Cushman & Wakefield, which provides gross annual real estate investments for a maximum number of countries and years. Cushman & Wakefield is a leading commercial real estate advisory company and has offices in many countries around the world, through which it collects data for its database, details of which can be found on their corporate website. Despite general questions with respect to the use of third-party data, it has to be acknowledged that there are no other international real estate investment databases of higher quality. We refer to the Cushman & Wakefield data on international real estate activity as our left-hand side variable and describe the dataset in Table 2.
6 - IESE Business School-University of Navarra
Table 2 Commercial Real Estate Investments [USD mn.] 2000-2009
Country Name Observations Mean Standard Deviation Min Max Skewness Kurtosis
Argentina 3 202.43 97.48 92.87 279.56 n/a n/aAustralia 3 8484.20 7870.63 3768.90 17570.24 n/a n/a
Austria 7 1064.50 430.01 575.73 1899.20 1.34 2.13
Belgium 7 2122.53 748.95 1213.10 3140.98 0.53 -1.07
Brazil 3 2301.50 1247.03 862.49 3065.93 n/a n/a
Bulgaria 6 357.75 352.71 32.21 880.93 0.75 -1.37
Canada 7 5412.22 1514.19 2609.07 6983.52 -1.17 0.94
China 7 18532.85 31086.62 531.44 84550.04 2.09 4.28
Croatia 7 77.68 65.50 8.86 189.92 0.72 -0.22
Czech Republic 7 755.20 321.58 289.42 1314.83 0.60 1.10
Denmark 7 1534.63 526.99 805.15 2374.00 0.26 -0.39
Finland 7 2573.78 1055.82 750.90 3987.24 -0.40 0.76
France 7 12497.92 5807.86 5656.59 20818.12 0.58 -1.36
Germany 7 17122.30 16111.91 4025.76 42001.46 1.07 -0.89
Greece 7 178.74 157.82 8.86 474.80 1.05 1.40
Hong Kong 7 5060.65 1938.69 1594.33 7234.73 -0.96 0.46
Hungary 7 639.27 397.55 273.41 1460.92 1.75 3.63
India 3 2786.16 1817.98 1215.26 4777.54 n/a n/a
Ireland 8 969.99 676.47 97.19 2153.11 0.65 -0.24
Italy 7 3783.83 1815.25 2250.80 7158.51 1.25 0.92
Japan 7 16755.00 9132.52 6200.18 29505.58 0.45 -1.43
Luxembourg 7 621.05 634.50 88.57 2008.77 2.26 5.55
Mexico 7 1839.72 1510.59 180.71 3725.35 0.35 -2.28
Netherlands 8 5235.68 1625.34 2527.00 7669.83 0.05 0.20
New Zealand 3 1427.41 259.40 1162.00 1680.35 n/a n/a
Norway 7 3224.22 2190.39 1047.52 6539.07 0.57 -1.46
Peru 2 117.72 119.65 33.12 202.32 n/a n/a
Poland 10 1234.03 1034.99 111.73 3189.79 0.97 -0.27
Portugal 10 498.34 192.16 141.15 766.98 -0.42 -0.40
Republic of Korea 7 2893.16 1964.53 885.67 5665.76 0.82 -1.22
Romania 6 490.11 447.65 92.87 1241.78 0.98 0.23
Russian Federation 7 1353.78 1004.10 70.86 2607.66 0.00 -1.73
Saudi Arabia 2 329.09 48.77 294.60 363.57 n/a n/a
Singapore 7 4080.82 2044.83 1528.44 6939.37 0.04 -1.60
Slovakia 7 171.72 145.28 6.48 345.66 0.08 -1.99
Slovenia 1 7.20 n/a 7.20 7.20 n/a n/a
South Africa 3 691.28 447.74 211.89 1098.63 n/a n/a
Spain 10 4088.26 1060.99 2457.16 6062.82 0.33 0.09
Sweden 10 6928.10 4321.00 1675.98 12417.82 -0.14 -1.88
Switzerland 3 522.57 370.07 276.83 948.19 n/a n/a
Turkey 5 926.07 610.21 279.34 1935.72 1.38 2.96
Ukraine 6 202.96 115.56 96.62 409.06 1.39 1.54
United Arab Emirates 3 1587.33 1467.90 697.80 3281.61 n/a n/a
United Kingdom 10 44131.47 17198.48 20102.53 71770.33 0.24 -0.45
United States 7 177416.57 126427.11 20761.70 365230.09 0.24 -1.25Vietnam 3 247.22 116.09 128.87 360.90 n/a n/a
Source: Cushman & Wakefield, Investment Atlas. Data is converted to USD using GMID exchange rates.
IESE Business School-University of Navarra - 7
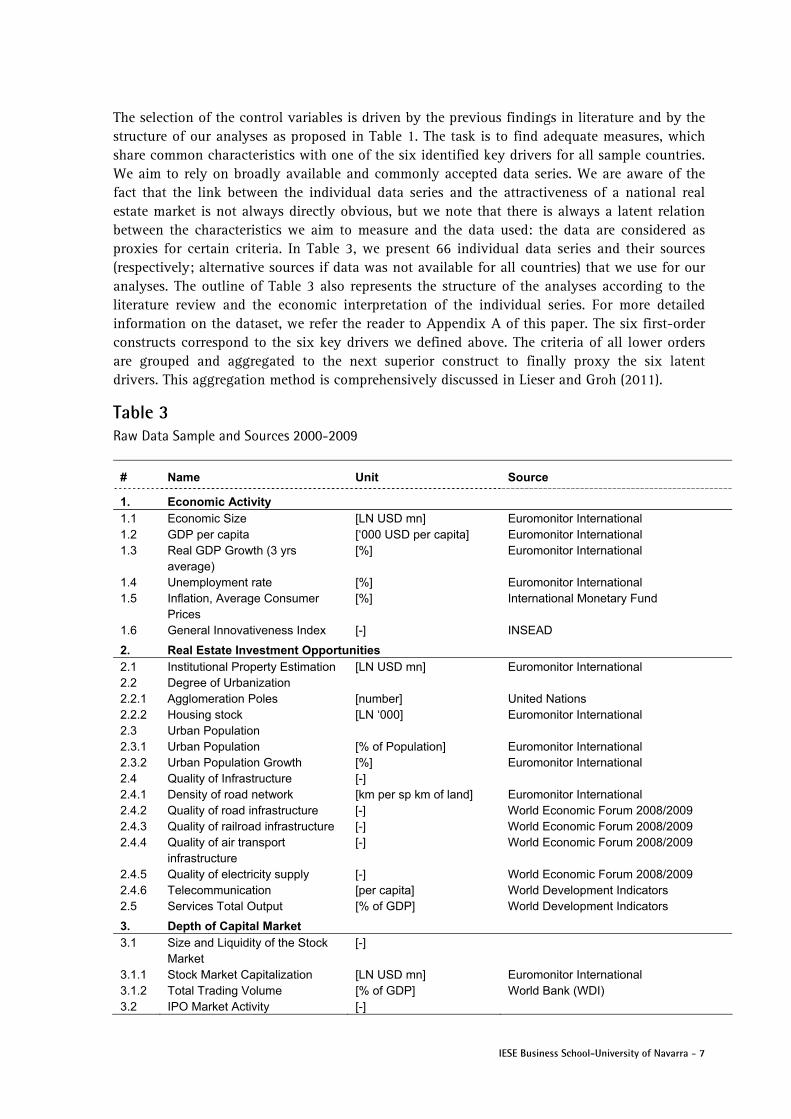
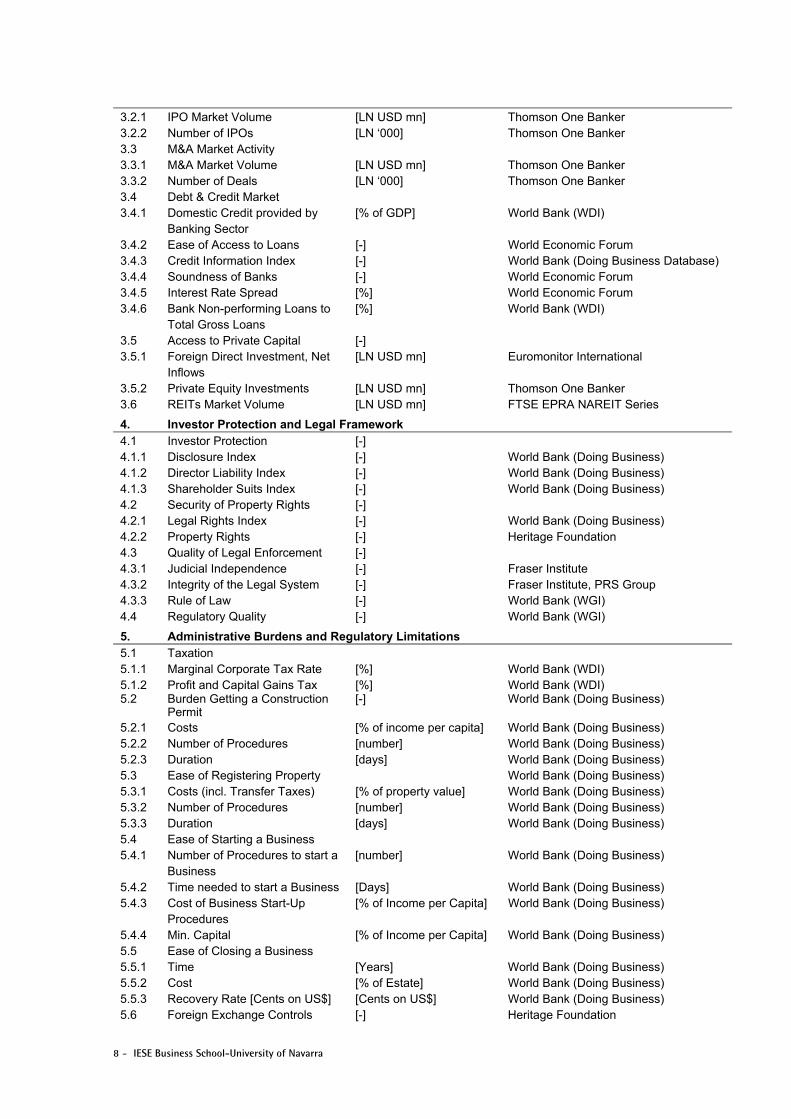
The selection of the control variables is driven by the previous findings in literature and by the structure of our analyses as proposed in Table 1. The task is to find adequate measures, which share common characteristics with one of the six identified key drivers for all sample countries. We aim to rely on broadly available and commonly accepted data series. We are aware of the fact that the link between the individual data series and the attractiveness of a national real estate market is not always directly obvious, but we note that there is always a latent relation between the characteristics we aim to measure and the data used: the data are considered as proxies for certain criteria. In Table 3, we present 66 individual data series and their sources (respectively; alternative sources if data was not available for all countries) that we use for our analyses. The outline of Table 3 also represents the structure of the analyses according to the literature review and the economic interpretation of the individual series. For more detailed information on the dataset, we refer the reader to Appendix A of this paper. The six first-order constructs correspond to the six key drivers we defined above. The criteria of all lower orders are grouped and aggregated to the next superior construct to finally proxy the six latent drivers. This aggregation method is comprehensively discussed in Lieser and Groh (2011).
Table 3 Raw Data Sample and Sources 2000-2009
# Name Unit Source
1. Economic Activity 1.1 Economic Size [LN USD mn] Euromonitor International 1.2 GDP per capita [‘000 USD per capita] Euromonitor International 1.3 Real GDP Growth (3 yrs
average) [%] Euromonitor International
1.4 Unemployment rate [%] Euromonitor International 1.5 Inflation, Average Consumer
Prices [%] International Monetary Fund
1.6 General Innovativeness Index [-] INSEAD
2. Real Estate Investment Opportunities 2.1 Institutional Property Estimation [LN USD mn] Euromonitor International 2.2 Degree of Urbanization 2.2.1 Agglomeration Poles [number] United Nations 2.2.2 Housing stock [LN ‘000] Euromonitor International 2.3 Urban Population 2.3.1 Urban Population [% of Population] Euromonitor International 2.3.2 Urban Population Growth [%] Euromonitor International 2.4 Quality of Infrastructure [-] 2.4.1 Density of road network [km per sp km of land] Euromonitor International 2.4.2 Quality of road infrastructure [-] World Economic Forum 2008/2009 2.4.3 Quality of railroad infrastructure [-] World Economic Forum 2008/2009 2.4.4 Quality of air transport
infrastructure [-] World Economic Forum 2008/2009
2.4.5 Quality of electricity supply [-] World Economic Forum 2008/2009 2.4.6 Telecommunication [per capita] World Development Indicators 2.5 Services Total Output [% of GDP] World Development Indicators
3. Depth of Capital Market 3.1 Size and Liquidity of the Stock
Market [-]
3.1.1 Stock Market Capitalization [LN USD mn] Euromonitor International 3.1.2 Total Trading Volume [% of GDP] World Bank (WDI) 3.2 IPO Market Activity [-]
8 - IESE Business School-University of Navarra
3.2.1 IPO Market Volume [LN USD mn] Thomson One Banker 3.2.2 Number of IPOs [LN ‘000] Thomson One Banker 3.3 M&A Market Activity 3.3.1 M&A Market Volume [LN USD mn] Thomson One Banker 3.3.2 Number of Deals [LN ‘000] Thomson One Banker 3.4 Debt & Credit Market 3.4.1 Domestic Credit provided by
Banking Sector [% of GDP] World Bank (WDI)
3.4.2 Ease of Access to Loans [-] World Economic Forum 3.4.3 Credit Information Index [-] World Bank (Doing Business Database) 3.4.4 Soundness of Banks [-] World Economic Forum 3.4.5 Interest Rate Spread [%] World Economic Forum 3.4.6 Bank Non-performing Loans to
Total Gross Loans [%] World Bank (WDI)
3.5 Access to Private Capital [-] 3.5.1 Foreign Direct Investment, Net
Inflows [LN USD mn] Euromonitor International
3.5.2 Private Equity Investments [LN USD mn] Thomson One Banker 3.6 REITs Market Volume [LN USD mn] FTSE EPRA NAREIT Series
4. Investor Protection and Legal Framework 4.1 Investor Protection [-] 4.1.1 Disclosure Index [-] World Bank (Doing Business) 4.1.2 Director Liability Index [-] World Bank (Doing Business) 4.1.3 Shareholder Suits Index [-] World Bank (Doing Business) 4.2 Security of Property Rights [-] 4.2.1 Legal Rights Index [-] World Bank (Doing Business) 4.2.2 Property Rights [-] Heritage Foundation 4.3 Quality of Legal Enforcement [-] 4.3.1 Judicial Independence [-] Fraser Institute 4.3.2 Integrity of the Legal System [-] Fraser Institute, PRS Group 4.3.3 Rule of Law [-] World Bank (WGI) 4.4 Regulatory Quality [-] World Bank (WGI)
5. Administrative Burdens and Regulatory Limitations 5.1 Taxation 5.1.1 Marginal Corporate Tax Rate [%] World Bank (WDI) 5.1.2 Profit and Capital Gains Tax [%] World Bank (WDI) 5.2 Burden Getting a Construction
Permit [-] World Bank (Doing Business)
5.2.1 Costs [% of income per capita] World Bank (Doing Business) 5.2.2 Number of Procedures [number] World Bank (Doing Business) 5.2.3 Duration [days] World Bank (Doing Business) 5.3 Ease of Registering Property World Bank (Doing Business) 5.3.1 Costs (incl. Transfer Taxes) [% of property value] World Bank (Doing Business) 5.3.2 Number of Procedures [number] World Bank (Doing Business) 5.3.3 Duration [days] World Bank (Doing Business) 5.4 Ease of Starting a Business 5.4.1 Number of Procedures to start a
Business [number] World Bank (Doing Business)
5.4.2 Time needed to start a Business [Days] World Bank (Doing Business) 5.4.3 Cost of Business Start-Up
Procedures [% of Income per Capita] World Bank (Doing Business)
5.4.4 Min. Capital [% of Income per Capita] World Bank (Doing Business) 5.5 Ease of Closing a Business 5.5.1 Time [Years] World Bank (Doing Business) 5.5.2 Cost [% of Estate] World Bank (Doing Business) 5.5.3 Recovery Rate [Cents on US$] [Cents on US$] World Bank (Doing Business) 5.6 Foreign Exchange Controls [-] Heritage Foundation
IESE Business School-University of Navarra - 9
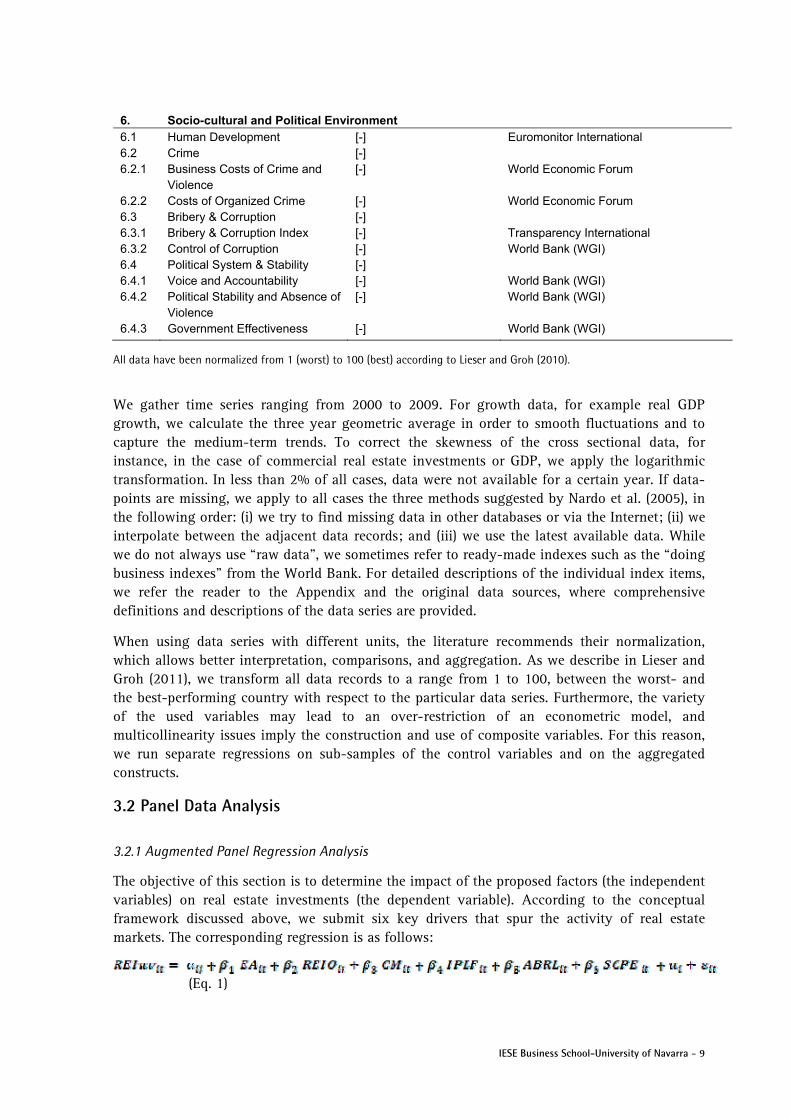
6. Socio-cultural and Political Environment 6.1 Human Development [-] Euromonitor International 6.2 Crime [-] 6.2.1 Business Costs of Crime and
Violence [-] World Economic Forum
6.2.2 Costs of Organized Crime [-] World Economic Forum 6.3 Bribery & Corruption [-] 6.3.1 Bribery & Corruption Index [-] Transparency International 6.3.2 Control of Corruption [-] World Bank (WGI) 6.4 Political System & Stability [-] 6.4.1 Voice and Accountability [-] World Bank (WGI) 6.4.2 Political Stability and Absence of
Violence [-] World Bank (WGI)
6.4.3 Government Effectiveness [-] World Bank (WGI)
All data have been normalized from 1 (worst) to 100 (best) according to Lieser and Groh (2010).
We gather time series ranging from 2000 to 2009. For growth data, for example real GDP growth, we calculate the three year geometric average in order to smooth fluctuations and to capture the medium-term trends. To correct the skewness of the cross sectional data, for instance, in the case of commercial real estate investments or GDP, we apply the logarithmic transformation. In less than 2% of all cases, data were not available for a certain year. If data-points are missing, we apply to all cases the three methods suggested by Nardo et al. (2005), in the following order: (i) we try to find missing data in other databases or via the Internet; (ii) we interpolate between the adjacent data records; and (iii) we use the latest available data. While we do not always use “raw data”, we sometimes refer to ready-made indexes such as the “doing business indexes” from the World Bank. For detailed descriptions of the individual index items, we refer the reader to the Appendix and the original data sources, where comprehensive definitions and descriptions of the data series are provided.
When using data series with different units, the literature recommends their normalization, which allows better interpretation, comparisons, and aggregation. As we describe in Lieser and Groh (2011), we transform all data records to a range from 1 to 100, between the worst- and the best-performing country with respect to the particular data series. Furthermore, the variety of the used variables may lead to an over-restriction of an econometric model, and multicollinearity issues imply the construction and use of composite variables. For this reason, we run separate regressions on sub-samples of the control variables and on the aggregated constructs.
3.2 Panel Data Analysis
3.2.1 Augmented Panel Regression Analysis
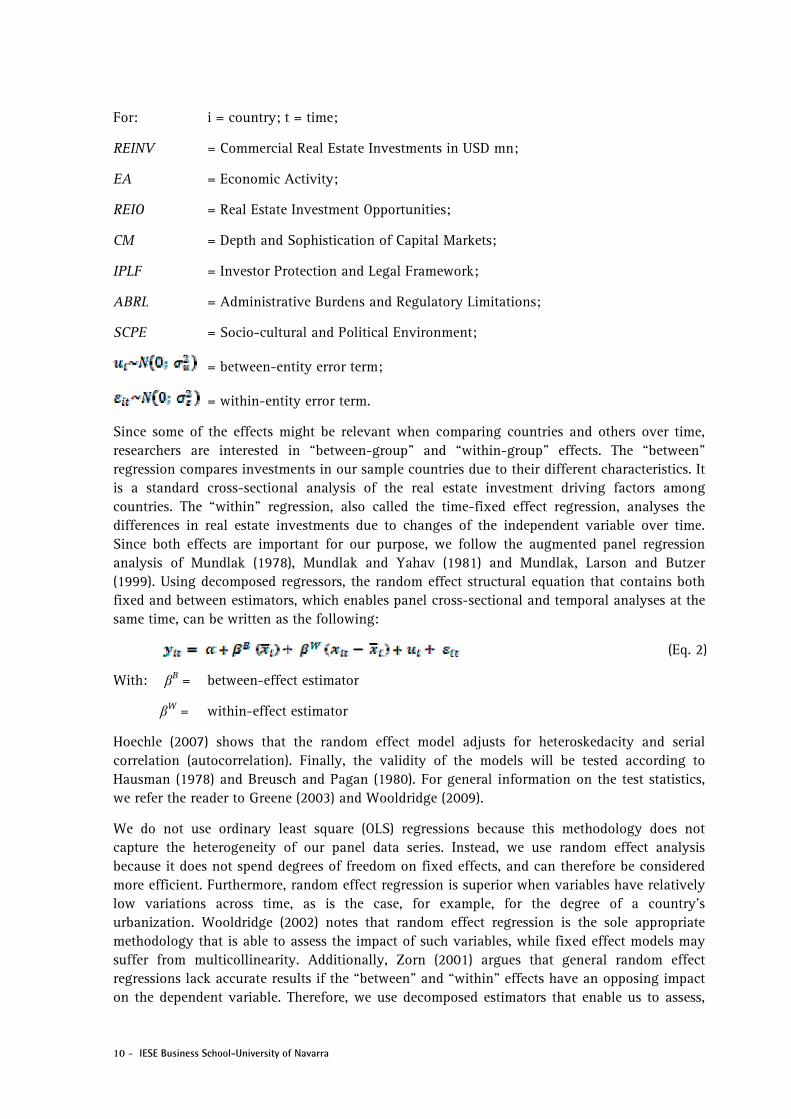
The objective of this section is to determine the impact of the proposed factors (the independent variables) on real estate investments (the dependent variable). According to the conceptual framework discussed above, we submit six key drivers that spur the activity of real estate markets. The corresponding regression is as follows:
(Eq. 1)
10 - IESE Business School-University of Navarra
For: i = country; t = time;
REINV = Commercial Real Estate Investments in USD mn;
EA = Economic Activity;
REIO = Real Estate Investment Opportunities;
CM = Depth and Sophistication of Capital Markets;
IPLF = Investor Protection and Legal Framework;
ABRL = Administrative Burdens and Regulatory Limitations;
SCPE = Socio-cultural and Political Environment;
= between-entity error term;
= within-entity error term.
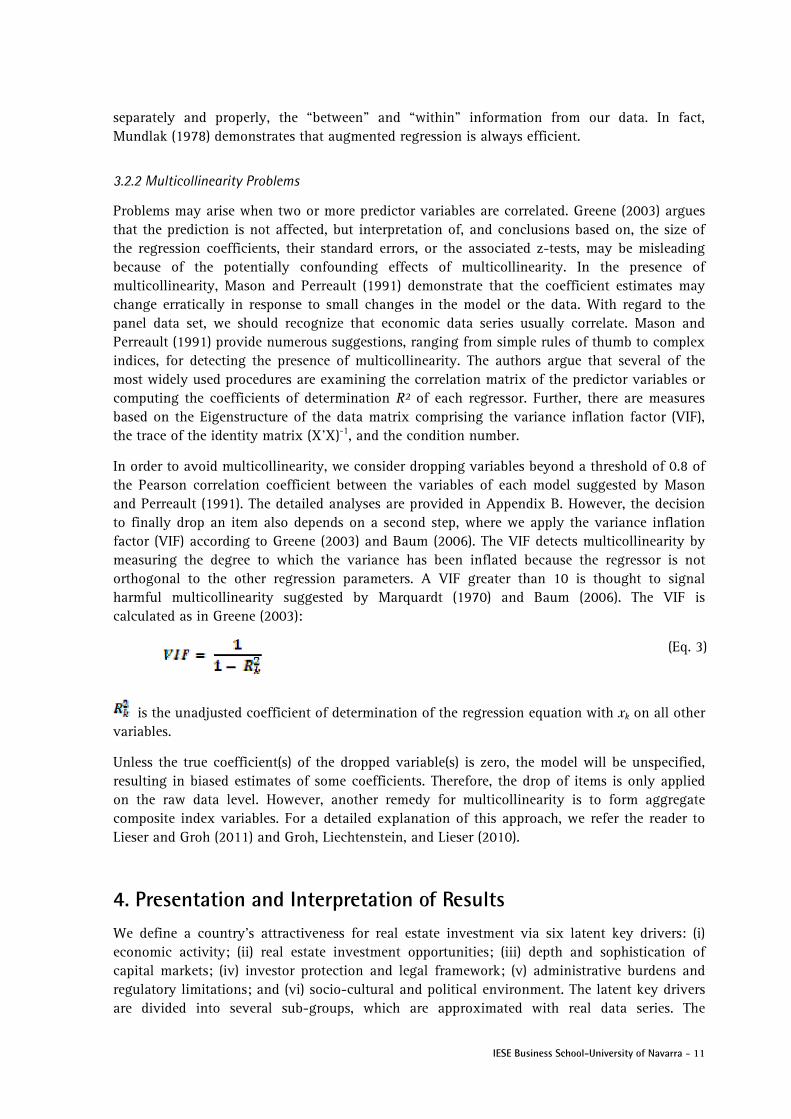
Since some of the effects might be relevant when comparing countries and others over time, researchers are interested in “between-group” and “within-group” effects. The “between” regression compares investments in our sample countries due to their different characteristics. It is a standard cross-sectional analysis of the real estate investment driving factors among countries. The “within” regression, also called the time-fixed effect regression, analyses the differences in real estate investments due to changes of the independent variable over time. Since both effects are important for our purpose, we follow the augmented panel regression analysis of Mundlak (1978), Mundlak and Yahav (1981) and Mundlak, Larson and Butzer (1999). Using decomposed regressors, the random effect structural equation that contains both fixed and between estimators, which enables panel cross-sectional and temporal analyses at the same time, can be written as the following:
(Eq. 2)
With: βB = between-effect estimator
βW = within-effect estimator
Hoechle (2007) shows that the random effect model adjusts for heteroskedacity and serial correlation (autocorrelation). Finally, the validity of the models will be tested according to Hausman (1978) and Breusch and Pagan (1980). For general information on the test statistics, we refer the reader to Greene (2003) and Wooldridge (2009).
We do not use ordinary least square (OLS) regressions because this methodology does not capture the heterogeneity of our panel data series. Instead, we use random effect analysis because it does not spend degrees of freedom on fixed effects, and can therefore be considered more efficient. Furthermore, random effect regression is superior when variables have relatively low variations across time, as is the case, for example, for the degree of a country’s urbanization. Wooldridge (2002) notes that random effect regression is the sole appropriate methodology that is able to assess the impact of such variables, while fixed effect models may suffer from multicollinearity. Additionally, Zorn (2001) argues that general random effect regressions lack accurate results if the “between” and “within” effects have an opposing impact on the dependent variable. Therefore, we use decomposed estimators that enable us to assess,
IESE Business School-University of Navarra - 11
separately and properly, the “between” and “within” information from our data. In fact, Mundlak (1978) demonstrates that augmented regression is always efficient.
3.2.2 Multicollinearity Problems
Problems may arise when two or more predictor variables are correlated. Greene (2003) argues that the prediction is not affected, but interpretation of, and conclusions based on, the size of the regression coefficients, their standard errors, or the associated z-tests, may be misleading because of the potentially confounding effects of multicollinearity. In the presence of multicollinearity, Mason and Perreault (1991) demonstrate that the coefficient estimates may change erratically in response to small changes in the model or the data. With regard to the panel data set, we should recognize that economic data series usually correlate. Mason and Perreault (1991) provide numerous suggestions, ranging from simple rules of thumb to complex indices, for detecting the presence of multicollinearity. The authors argue that several of the most widely used procedures are examining the correlation matrix of the predictor variables or computing the coefficients of determination R² of each regressor. Further, there are measures based on the Eigenstructure of the data matrix comprising the variance inflation factor (VIF), the trace of the identity matrix (X’X)-1, and the condition number.
In order to avoid multicollinearity, we consider dropping variables beyond a threshold of 0.8 of the Pearson correlation coefficient between the variables of each model suggested by Mason and Perreault (1991). The detailed analyses are provided in Appendix B. However, the decision to finally drop an item also depends on a second step, where we apply the variance inflation factor (VIF) according to Greene (2003) and Baum (2006). The VIF detects multicollinearity by measuring the degree to which the variance has been inflated because the regressor is not orthogonal to the other regression parameters. A VIF greater than 10 is thought to signal harmful multicollinearity suggested by Marquardt (1970) and Baum (2006). The VIF is calculated as in Greene (2003):
(Eq. 3)
is the unadjusted coefficient of determination of the regression equation with xk on all other variables.
Unless the true coefficient(s) of the dropped variable(s) is zero, the model will be unspecified, resulting in biased estimates of some coefficients. Therefore, the drop of items is only applied on the raw data level. However, another remedy for multicollinearity is to form aggregate composite index variables. For a detailed explanation of this approach, we refer the reader to Lieser and Groh (2011) and Groh, Liechtenstein, and Lieser (2010).
4. Presentation and Interpretation of Results We define a country’s attractiveness for real estate investment via six latent key drivers: (i) economic activity; (ii) real estate investment opportunities; (iii) depth and sophistication of capital markets; (iv) investor protection and legal framework; (v) administrative burdens and regulatory limitations; and (vi) socio-cultural and political environment. The latent key drivers are divided into several sub-groups, which are approximated with real data series. The
12 - IESE Business School-University of Navarra
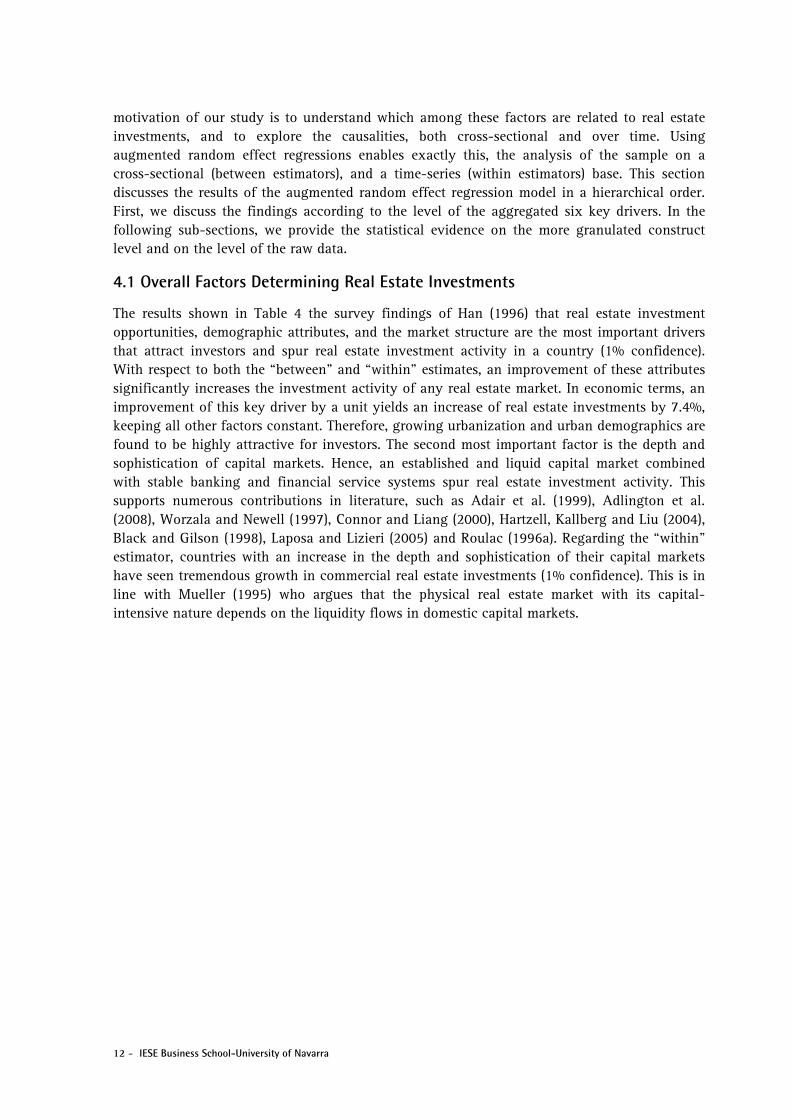
motivation of our study is to understand which among these factors are related to real estate investments, and to explore the causalities, both cross-sectional and over time. Using augmented random effect regressions enables exactly this, the analysis of the sample on a cross-sectional (between estimators), and a time-series (within estimators) base. This section discusses the results of the augmented random effect regression model in a hierarchical order. First, we discuss the findings according to the level of the aggregated six key drivers. In the following sub-sections, we provide the statistical evidence on the more granulated construct level and on the level of the raw data.
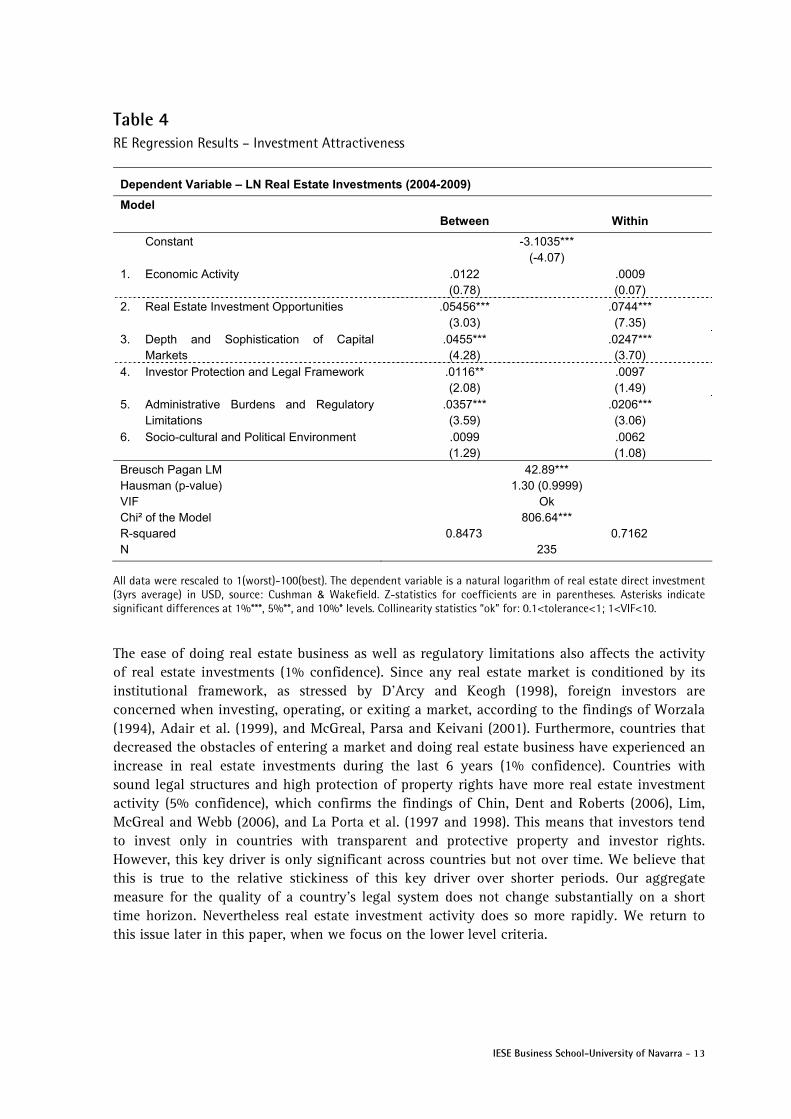
4.1 Overall Factors Determining Real Estate Investments
The results shown in Table 4 the survey findings of Han (1996) that real estate investment opportunities, demographic attributes, and the market structure are the most important drivers that attract investors and spur real estate investment activity in a country (1% confidence). With respect to both the “between” and “within” estimates, an improvement of these attributes significantly increases the investment activity of any real estate market. In economic terms, an improvement of this key driver by a unit yields an increase of real estate investments by 7.4%, keeping all other factors constant. Therefore, growing urbanization and urban demographics are found to be highly attractive for investors. The second most important factor is the depth and sophistication of capital markets. Hence, an established and liquid capital market combined with stable banking and financial service systems spur real estate investment activity. This supports numerous contributions in literature, such as Adair et al. (1999), Adlington et al. (2008), Worzala and Newell (1997), Connor and Liang (2000), Hartzell, Kallberg and Liu (2004), Black and Gilson (1998), Laposa and Lizieri (2005) and Roulac (1996a). Regarding the “within” estimator, countries with an increase in the depth and sophistication of their capital markets have seen tremendous growth in commercial real estate investments (1% confidence). This is in line with Mueller (1995) who argues that the physical real estate market with its capital-intensive nature depends on the liquidity flows in domestic capital markets.
IESE Business School-University of Navarra - 13
Table 4 RE Regression Results – Investment Attractiveness
Dependent Variable – LN Real Estate Investments (2004-2009)
Model Between Within
Constant -3.1035*** (-4.07)
1. Economic Activity .0122 (0.78)
.0009 (0.07)
2. Real Estate Investment Opportunities .05456*** (3.03)
.0744*** (7.35)
3. Depth and Sophistication of Capital Markets
.0455*** (4.28)
.0247*** (3.70)
4. Investor Protection and Legal Framework .0116** (2.08)
.0097 (1.49)
5. Administrative Burdens and Regulatory Limitations
.0357*** (3.59)
.0206*** (3.06)
6. Socio-cultural and Political Environment .0099 (1.29)
.0062 (1.08)
Breusch Pagan LM 42.89*** Hausman (p-value) 1.30 (0.9999) VIF Ok Chi² of the Model 806.64*** R-squared 0.8473 0.7162 N 235
All data were rescaled to 1(worst)-100(best). The dependent variable is a natural logarithm of real estate direct investment (3yrs average) in USD, source: Cushman & Wakefield. Z-statistics for coefficients are in parentheses. Asterisks indicate significant differences at 1%***, 5%**, and 10%* levels. Collinearity statistics “ok” for: 0.1<tolerance<1; 1<VIF<10.
The ease of doing real estate business as well as regulatory limitations also affects the activity of real estate investments (1% confidence). Since any real estate market is conditioned by its institutional framework, as stressed by D’Arcy and Keogh (1998), foreign investors are concerned when investing, operating, or exiting a market, according to the findings of Worzala (1994), Adair et al. (1999), and McGreal, Parsa and Keivani (2001). Furthermore, countries that decreased the obstacles of entering a market and doing real estate business have experienced an increase in real estate investments during the last 6 years (1% confidence). Countries with sound legal structures and high protection of property rights have more real estate investment activity (5% confidence), which confirms the findings of Chin, Dent and Roberts (2006), Lim, McGreal and Webb (2006), and La Porta et al. (1997 and 1998). This means that investors tend to invest only in countries with transparent and protective property and investor rights. However, this key driver is only significant across countries but not over time. We believe that this is true to the relative stickiness of this key driver over shorter periods. Our aggregate measure for the quality of a country’s legal system does not change substantially on a short time horizon. Nevertheless real estate investment activity does so more rapidly. We return to this issue later in this paper, when we focus on the lower level criteria.
14 - IESE Business School-University of Navarra
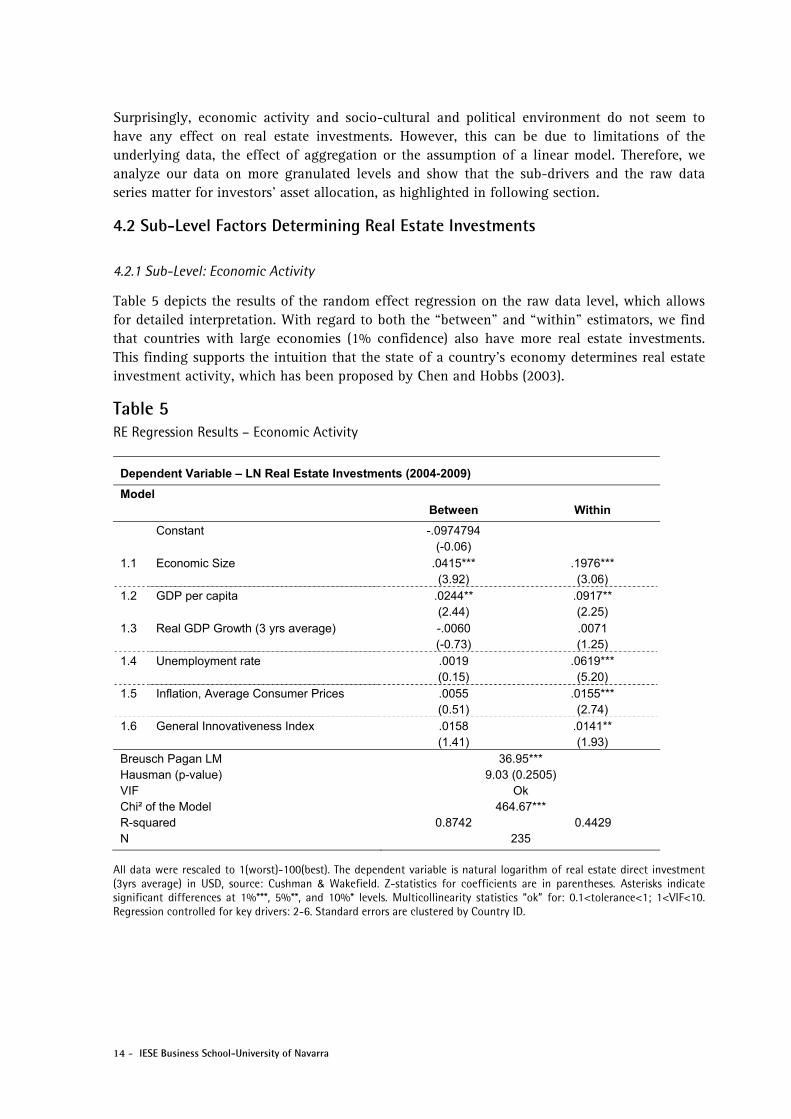
Surprisingly, economic activity and socio-cultural and political environment do not seem to have any effect on real estate investments. However, this can be due to limitations of the underlying data, the effect of aggregation or the assumption of a linear model. Therefore, we analyze our data on more granulated levels and show that the sub-drivers and the raw data series matter for investors’ asset allocation, as highlighted in following section.
4.2 Sub-Level Factors Determining Real Estate Investments
4.2.1 Sub-Level: Economic Activity
Table 5 depicts the results of the random effect regression on the raw data level, which allows for detailed interpretation. With regard to both the “between” and “within” estimators, we find that countries with large economies (1% confidence) also have more real estate investments. This finding supports the intuition that the state of a country’s economy determines real estate investment activity, which has been proposed by Chen and Hobbs (2003).
Table 5 RE Regression Results – Economic Activity
Dependent Variable – LN Real Estate Investments (2004-2009)
Model Between Within
Constant -.0974794 (-0.06)
1.1 Economic Size .0415*** (3.92)
.1976*** (3.06)
1.2 GDP per capita .0244** (2.44)
.0917** (2.25)
1.3 Real GDP Growth (3 yrs average) -.0060 (-0.73)
.0071 (1.25)
1.4 Unemployment rate .0019 (0.15)
.0619*** (5.20)
1.5 Inflation, Average Consumer Prices .0055 (0.51)
.0155*** (2.74)
1.6 General Innovativeness Index .0158 (1.41)
.0141** (1.93)
Breusch Pagan LM 36.95*** Hausman (p-value) 9.03 (0.2505) VIF Ok Chi² of the Model 464.67*** R-squared 0.8742 0.4429 N 235
All data were rescaled to 1(worst)-100(best). The dependent variable is natural logarithm of real estate direct investment (3yrs average) in USD, source: Cushman & Wakefield. Z-statistics for coefficients are in parentheses. Asterisks indicate significant differences at 1%***, 5%**, and 10%* levels. Multicollinearity statistics “ok” for: 0.1<tolerance<1; 1<VIF<10. Regression controlled for key drivers: 2-6. Standard errors are clustered by Country ID.
IESE Business School-University of Navarra - 15
Focusing on economic growth, we note that the fast-growing countries are usually small and, thus, do not absorb the magnitude of investments compared to large developed economies with high investment penetration. However, with regard to the “within” estimator of GDP, the positive sign gives evidence that annual economic growth drives investment activity even if the “between” regression of the average growth rate over three years does not show a significant impact. We interpret this as a strong causality of economic growth on real estate activity that is more closely related on a yearly basis than reflected by a three-year moving average. The results of GDP per capita are also in line with Van Doorn’s (2003) and Chen and Hobb’s (2003) findings that countries with high GDP per capita attract more real estate investments (5% confidence). With respect to the “within” estimator, falling unemployment rates and inflation spur investment activity (1% confidence), supporting the findings of Cardew (2004). The results suggest that a growing workforce affects the demand for real estate, while low inflation rates preserve the invested capital.1 Finally, innovative and technological improvements (within estimator) spur real estate investments (5% confidence), as also argued by Connor and Liang (2000).
4.2.2 Sub-Level: Real Estate Investment Opportunities
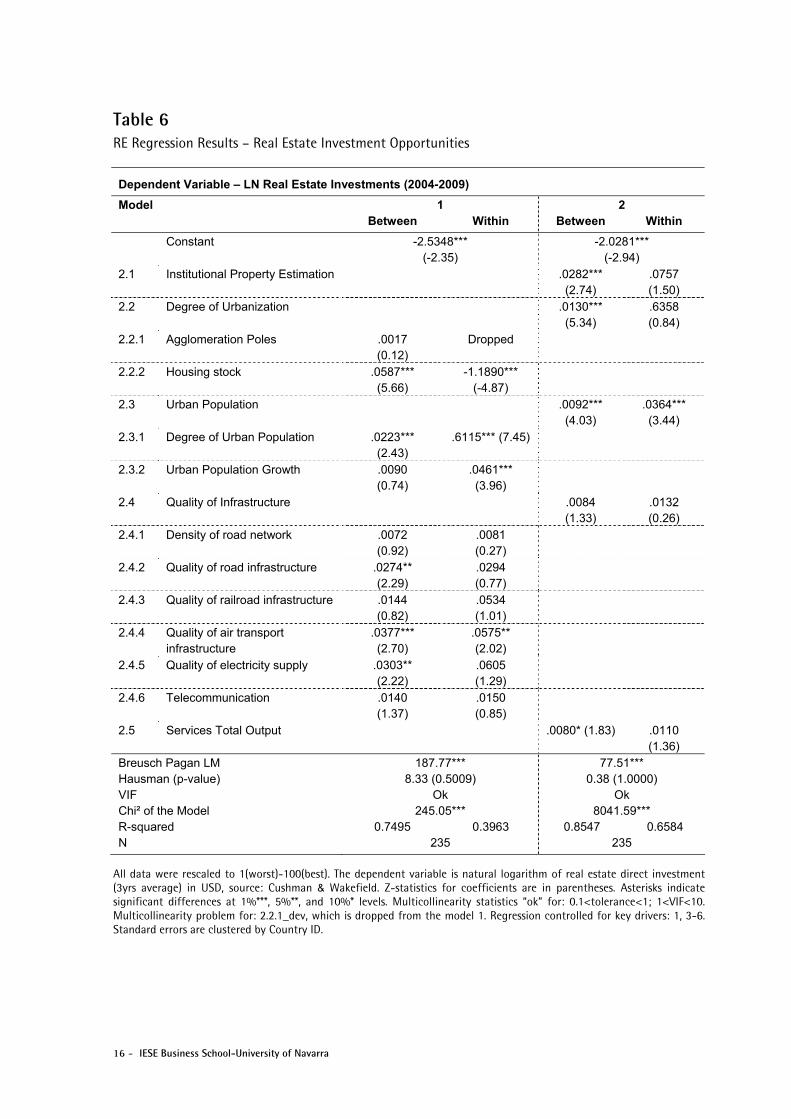
Table 6 shows that the accessibility of institutionally valuable property is important for real estate investment decisions, confirming the findings of Liang and Gordon (2003). It is obvious that there is limited market intelligence, lack of availability of data and only a few investment opportunities in small markets. Furthermore, we find that the degree of urbanization positively impacts (1% confidence) real estate market activity providing investors with more investment targets. This is in line with the findings of Kurzrock et al. (2009). On the more granulated levels, we find that the housing market has a significant impact on commercial real estate investments. First, we provide direct evidence that, in countries with a packed physical urban agglomeration structure, the probability of finding adequate investments is higher than in countries with “thin” markets. Furthermore, with regard to the negative sign of the “within” estimator, we find that commercial real estate investments increase when the housing market shrinks. This may be due to the fact that investors are able to buy cheaply when demand for housing markets is relaxed. Second, we provide direct evidence that urban demographics also affect real estate investments. We find that a fast growing urban population drives real estate investment. We also observe that countries with a high ratio of urban population are preferred for commercial real estate investments. Furthermore, the share of the service sector within an economy also affects commercial real estate activity (10% confidence), according to Thrall (2002). On the raw data level, we find that the quality of infrastructure sways real estate investments. This finding confirms Lynn (2007), who argues that improvements in the general infrastructure of countries supports the development of agglomeration poles and, hence, real estate investments.
1 Please note for interpretation that high inflation rate is unattractive for investments. The previous rescaling of the raw-data leads to opposite signs of the “inflation” estimators.
16 - IESE Business School-University of Navarra
Table 6 RE Regression Results – Real Estate Investment Opportunities
Dependent Variable – LN Real Estate Investments (2004-2009)
Model 1 2 Between Within Between Within
Constant -2.5348*** (-2.35)
-2.0281*** (-2.94)
2.1 Institutional Property Estimation .0282*** (2.74)
.0757 (1.50)
2.2 Degree of Urbanization .0130*** (5.34)
.6358 (0.84)
2.2.1 Agglomeration Poles .0017 (0.12)
Dropped
2.2.2 Housing stock .0587*** (5.66)
-1.1890*** (-4.87)
2.3 Urban Population .0092*** (4.03)
.0364*** (3.44)
2.3.1 Degree of Urban Population .0223*** (2.43)
.6115*** (7.45)
2.3.2 Urban Population Growth .0090 (0.74)
.0461*** (3.96)
2.4 Quality of Infrastructure .0084 (1.33)
.0132 (0.26)
2.4.1 Density of road network .0072 (0.92)
.0081 (0.27)
2.4.2 Quality of road infrastructure .0274** (2.29)
.0294 (0.77)
2.4.3 Quality of railroad infrastructure .0144 (0.82)
.0534 (1.01)
2.4.4 Quality of air transport infrastructure
.0377*** (2.70)
.0575** (2.02)
2.4.5 Quality of electricity supply .0303** (2.22)
.0605 (1.29)
2.4.6 Telecommunication .0140 (1.37)
.0150 (0.85)
2.5 Services Total Output .0080* (1.83) .0110 (1.36)
Breusch Pagan LM 187.77*** 77.51*** Hausman (p-value) 8.33 (0.5009) 0.38 (1.0000) VIF Ok Ok Chi² of the Model 245.05*** 8041.59*** R-squared 0.7495 0.3963 0.8547 0.6584 N 235 235
All data were rescaled to 1(worst)-100(best). The dependent variable is natural logarithm of real estate direct investment (3yrs average) in USD, source: Cushman & Wakefield. Z-statistics for coefficients are in parentheses. Asterisks indicate significant differences at 1%***, 5%**, and 10%* levels. Multicollinearity statistics “ok” for: 0.1<tolerance<1; 1<VIF<10. Multicollinearity problem for: 2.2.1_dev, which is dropped from the model 1. Regression controlled for key drivers: 1, 3-6. Standard errors are clustered by Country ID.
IESE Business School-University of Navarra - 17
4.2.3 Sub-Level: Depth and Sophistication of Capital Markets
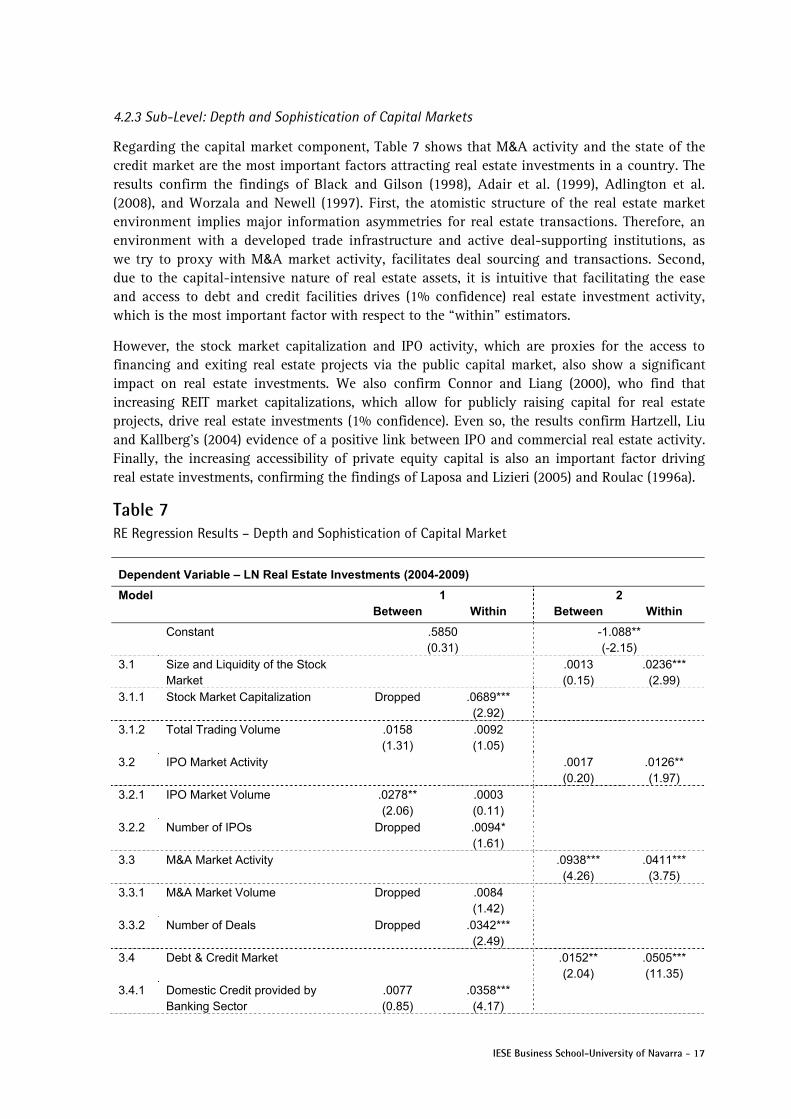
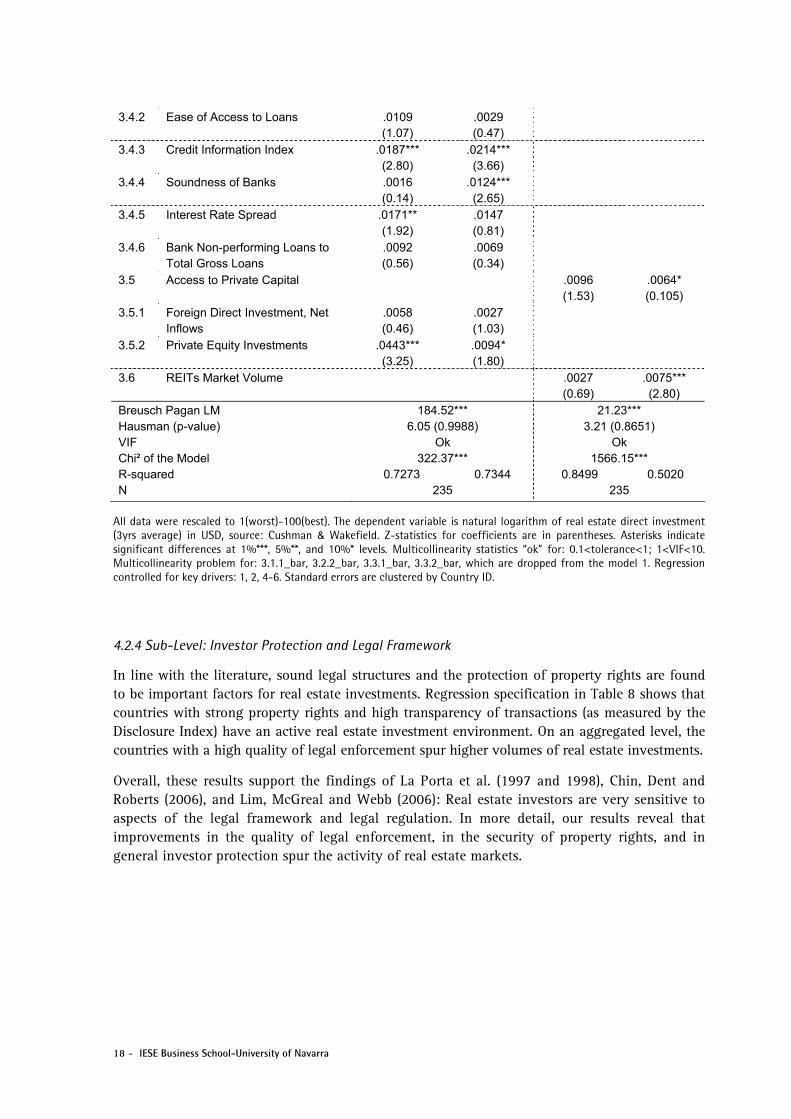
Regarding the capital market component, Table 7 shows that M&A activity and the state of the credit market are the most important factors attracting real estate investments in a country. The results confirm the findings of Black and Gilson (1998), Adair et al. (1999), Adlington et al. (2008), and Worzala and Newell (1997). First, the atomistic structure of the real estate market environment implies major information asymmetries for real estate transactions. Therefore, an environment with a developed trade infrastructure and active deal-supporting institutions, as we try to proxy with M&A market activity, facilitates deal sourcing and transactions. Second, due to the capital-intensive nature of real estate assets, it is intuitive that facilitating the ease and access to debt and credit facilities drives (1% confidence) real estate investment activity, which is the most important factor with respect to the “within” estimators.
However, the stock market capitalization and IPO activity, which are proxies for the access to financing and exiting real estate projects via the public capital market, also show a significant impact on real estate investments. We also confirm Connor and Liang (2000), who find that increasing REIT market capitalizations, which allow for publicly raising capital for real estate projects, drive real estate investments (1% confidence). Even so, the results confirm Hartzell, Liu and Kallberg’s (2004) evidence of a positive link between IPO and commercial real estate activity. Finally, the increasing accessibility of private equity capital is also an important factor driving real estate investments, confirming the findings of Laposa and Lizieri (2005) and Roulac (1996a).
Table 7 RE Regression Results – Depth and Sophistication of Capital Market
Dependent Variable – LN Real Estate Investments (2004-2009)
Model 1 2 Between Within Between Within
Constant .5850 (0.31)
-1.088** (-2.15)
3.1 Size and Liquidity of the Stock Market
.0013 (0.15)
.0236*** (2.99)
3.1.1 Stock Market Capitalization Dropped .0689*** (2.92)
3.1.2 Total Trading Volume .0158 (1.31)
.0092 (1.05)
3.2 IPO Market Activity .0017 (0.20)
.0126** (1.97)
3.2.1 IPO Market Volume .0278** (2.06)
.0003 (0.11)
3.2.2 Number of IPOs Dropped .0094* (1.61)
3.3 M&A Market Activity .0938*** (4.26)
.0411*** (3.75)
3.3.1 M&A Market Volume Dropped .0084 (1.42)
3.3.2 Number of Deals Dropped .0342*** (2.49)
3.4 Debt & Credit Market .0152** (2.04)
.0505*** (11.35)
3.4.1 Domestic Credit provided by Banking Sector
.0077 (0.85)
.0358*** (4.17)
18 - IESE Business School-University of Navarra
3.4.2 Ease of Access to Loans .0109 (1.07)
.0029 (0.47)
3.4.3 Credit Information Index .0187*** (2.80)
.0214*** (3.66)
3.4.4 Soundness of Banks .0016 (0.14)
.0124*** (2.65)
3.4.5 Interest Rate Spread .0171** (1.92)
.0147 (0.81)
3.4.6 Bank Non-performing Loans to Total Gross Loans
.0092 (0.56)
.0069 (0.34)
3.5 Access to Private Capital .0096 (1.53)
.0064* (0.105)
3.5.1 Foreign Direct Investment, Net Inflows
.0058 (0.46)
.0027 (1.03)
3.5.2 Private Equity Investments .0443*** (3.25)
.0094* (1.80)
3.6 REITs Market Volume .0027 (0.69)
.0075*** (2.80)
Breusch Pagan LM 184.52*** 21.23*** Hausman (p-value) 6.05 (0.9988) 3.21 (0.8651) VIF Ok Ok Chi² of the Model 322.37*** 1566.15*** R-squared 0.7273 0.7344 0.8499 0.5020 N 235 235
All data were rescaled to 1(worst)-100(best). The dependent variable is natural logarithm of real estate direct investment (3yrs average) in USD, source: Cushman & Wakefield. Z-statistics for coefficients are in parentheses. Asterisks indicate significant differences at 1%***, 5%**, and 10%* levels. Multicollinearity statistics “ok” for: 0.1<tolerance<1; 1<VIF<10. Multicollinearity problem for: 3.1.1_bar, 3.2.2_bar, 3.3.1_bar, 3.3.2_bar, which are dropped from the model 1. Regression controlled for key drivers: 1, 2, 4-6. Standard errors are clustered by Country ID.
4.2.4 Sub-Level: Investor Protection and Legal Framework
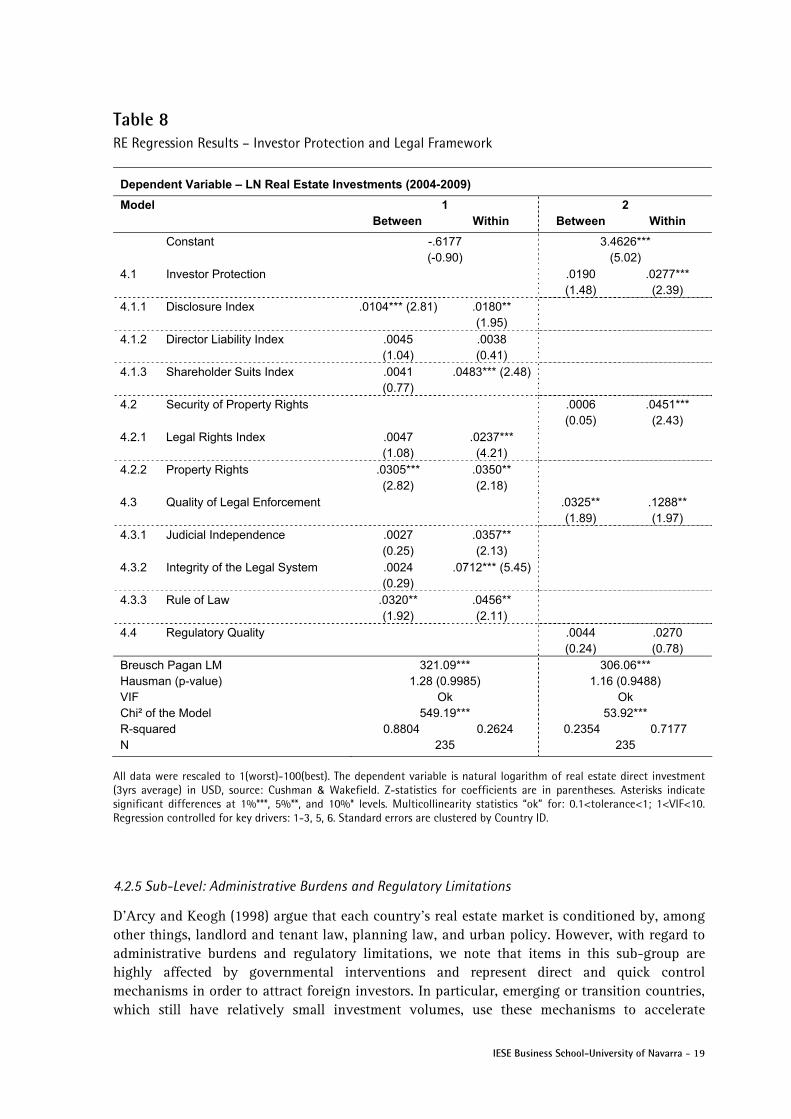
In line with the literature, sound legal structures and the protection of property rights are found to be important factors for real estate investments. Regression specification in Table 8 shows that countries with strong property rights and high transparency of transactions (as measured by the Disclosure Index) have an active real estate investment environment. On an aggregated level, the countries with a high quality of legal enforcement spur higher volumes of real estate investments.
Overall, these results support the findings of La Porta et al. (1997 and 1998), Chin, Dent and Roberts (2006), and Lim, McGreal and Webb (2006): Real estate investors are very sensitive to aspects of the legal framework and legal regulation. In more detail, our results reveal that improvements in the quality of legal enforcement, in the security of property rights, and in general investor protection spur the activity of real estate markets.
IESE Business School-University of Navarra - 19
Table 8 RE Regression Results – Investor Protection and Legal Framework
Dependent Variable – LN Real Estate Investments (2004-2009)
Model 1 2 Between Within Between Within
Constant -.6177 (-0.90)
3.4626*** (5.02)
4.1 Investor Protection
.0190 (1.48)
.0277*** (2.39)
4.1.1 Disclosure Index .0104*** (2.81) .0180** (1.95)
4.1.2 Director Liability Index .0045 (1.04)
.0038 (0.41)
4.1.3 Shareholder Suits Index .0041 (0.77)
.0483*** (2.48)
4.2 Security of Property Rights
.0006 (0.05)
.0451*** (2.43)
4.2.1 Legal Rights Index .0047 (1.08)
.0237*** (4.21)
4.2.2 Property Rights .0305*** (2.82)
.0350** (2.18)
4.3 Quality of Legal Enforcement .0325** (1.89)
.1288** (1.97)
4.3.1 Judicial Independence .0027 (0.25)
.0357** (2.13)
4.3.2 Integrity of the Legal System .0024 (0.29)
.0712*** (5.45)
4.3.3 Rule of Law .0320** (1.92)
.0456** (2.11)
4.4 Regulatory Quality .0044 (0.24)
.0270 (0.78)
Breusch Pagan LM 321.09*** 306.06*** Hausman (p-value) 1.28 (0.9985) 1.16 (0.9488) VIF Ok Ok Chi² of the Model 549.19*** 53.92*** R-squared 0.8804 0.2624 0.2354 0.7177 N 235 235
All data were rescaled to 1(worst)-100(best). The dependent variable is natural logarithm of real estate direct investment (3yrs average) in USD, source: Cushman & Wakefield. Z-statistics for coefficients are in parentheses. Asterisks indicate significant differences at 1%***, 5%**, and 10%* levels. Multicollinearity statistics “ok” for: 0.1<tolerance<1; 1<VIF<10. Regression controlled for key drivers: 1-3, 5, 6. Standard errors are clustered by Country ID.
4.2.5 Sub-Level: Administrative Burdens and Regulatory Limitations
D’Arcy and Keogh (1998) argue that each country’s real estate market is conditioned by, among other things, landlord and tenant law, planning law, and urban policy. However, with regard to administrative burdens and regulatory limitations, we note that items in this sub-group are highly affected by governmental interventions and represent direct and quick control mechanisms in order to attract foreign investors. In particular, emerging or transition countries, which still have relatively small investment volumes, use these mechanisms to accelerate
20 - IESE Business School-University of Navarra
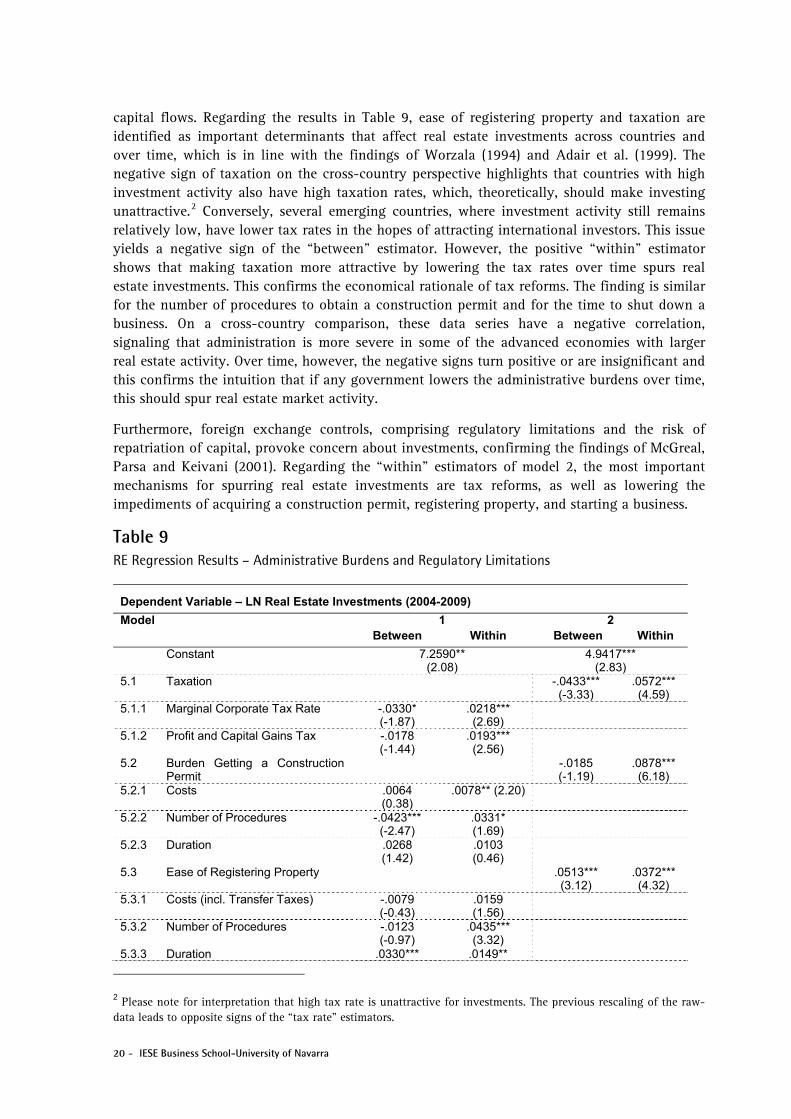
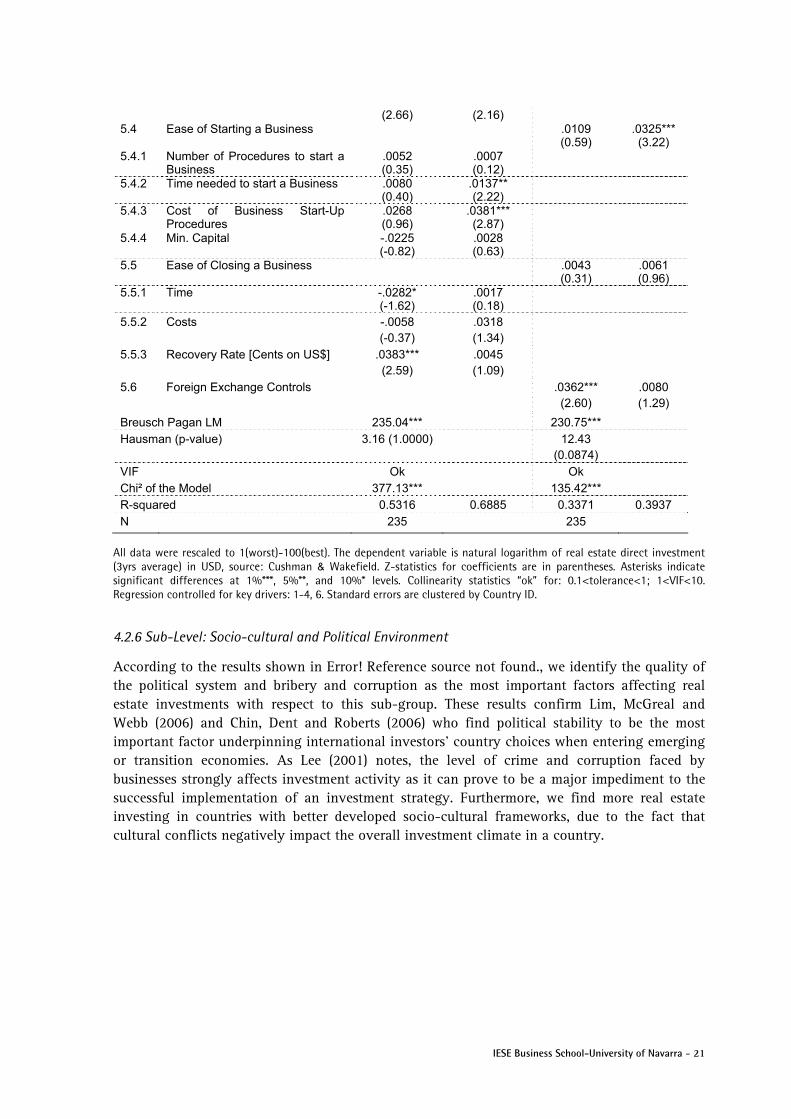
capital flows. Regarding the results in Table 9, ease of registering property and taxation are identified as important determinants that affect real estate investments across countries and over time, which is in line with the findings of Worzala (1994) and Adair et al. (1999). The negative sign of taxation on the cross-country perspective highlights that countries with high investment activity also have high taxation rates, which, theoretically, should make investing unattractive.2 Conversely, several emerging countries, where investment activity still remains relatively low, have lower tax rates in the hopes of attracting international investors. This issue yields a negative sign of the “between” estimator. However, the positive “within” estimator shows that making taxation more attractive by lowering the tax rates over time spurs real estate investments. This confirms the economical rationale of tax reforms. The finding is similar for the number of procedures to obtain a construction permit and for the time to shut down a business. On a cross-country comparison, these data series have a negative correlation, signaling that administration is more severe in some of the advanced economies with larger real estate activity. Over time, however, the negative signs turn positive or are insignificant and this confirms the intuition that if any government lowers the administrative burdens over time, this should spur real estate market activity.
Furthermore, foreign exchange controls, comprising regulatory limitations and the risk of repatriation of capital, provoke concern about investments, confirming the findings of McGreal, Parsa and Keivani (2001). Regarding the “within” estimators of model 2, the most important mechanisms for spurring real estate investments are tax reforms, as well as lowering the impediments of acquiring a construction permit, registering property, and starting a business.
Table 9 RE Regression Results – Administrative Burdens and Regulatory Limitations
Dependent Variable – LN Real Estate Investments (2004-2009)
Model 1 2 Between Within Between Within
Constant 7.2590** (2.08)
4.9417*** (2.83)
5.1 Taxation
-.0433*** (-3.33)
.0572*** (4.59)
5.1.1 Marginal Corporate Tax Rate -.0330* (-1.87)
.0218*** (2.69)
5.1.2 Profit and Capital Gains Tax -.0178 (-1.44)
.0193*** (2.56)
5.2 Burden Getting a Construction Permit
-.0185 (-1.19)
.0878*** (6.18)
5.2.1 Costs .0064 (0.38)
.0078** (2.20)
5.2.2 Number of Procedures -.0423*** (-2.47)
.0331* (1.69)
5.2.3 Duration .0268 (1.42)
.0103 (0.46)
5.3 Ease of Registering Property .0513*** (3.12)
.0372*** (4.32)
5.3.1 Costs (incl. Transfer Taxes) -.0079 (-0.43)
.0159 (1.56)
5.3.2 Number of Procedures -.0123 (-0.97)
.0435*** (3.32)
5.3.3 Duration .0330*** .0149**
2 Please note for interpretation that high tax rate is unattractive for investments. The previous rescaling of the raw-data leads to opposite signs of the “tax rate” estimators.
IESE Business School-University of Navarra - 21
(2.66) (2.16) 5.4 Ease of Starting a Business .0109
(0.59) .0325*** (3.22)
5.4.1 Number of Procedures to start a Business
.0052 (0.35)
.0007 (0.12)
5.4.2 Time needed to start a Business .0080 (0.40)
.0137** (2.22)
5.4.3 Cost of Business Start-Up Procedures
.0268 (0.96)
.0381*** (2.87)
5.4.4 Min. Capital -.0225 (-0.82)
.0028 (0.63)
5.5 Ease of Closing a Business .0043 (0.31)
.0061 (0.96)
5.5.1 Time -.0282* (-1.62)
.0017 (0.18)
5.5.2 Costs -.0058 (-0.37)
.0318 (1.34)
5.5.3 Recovery Rate [Cents on US$] .0383*** (2.59)
.0045 (1.09)
5.6 Foreign Exchange Controls .0362*** (2.60)
.0080 (1.29)
Breusch Pagan LM 235.04*** 230.75*** Hausman (p-value) 3.16 (1.0000) 12.43
(0.0874)
VIF Ok Ok Chi² of the Model 377.13*** 135.42*** R-squared 0.5316 0.6885 0.3371 0.3937 N 235 235
All data were rescaled to 1(worst)-100(best). The dependent variable is natural logarithm of real estate direct investment (3yrs average) in USD, source: Cushman & Wakefield. Z-statistics for coefficients are in parentheses. Asterisks indicate significant differences at 1%***, 5%**, and 10%* levels. Collinearity statistics “ok” for: 0.1<tolerance<1; 1<VIF<10. Regression controlled for key drivers: 1-4, 6. Standard errors are clustered by Country ID.
4.2.6 Sub-Level: Socio-cultural and Political Environment
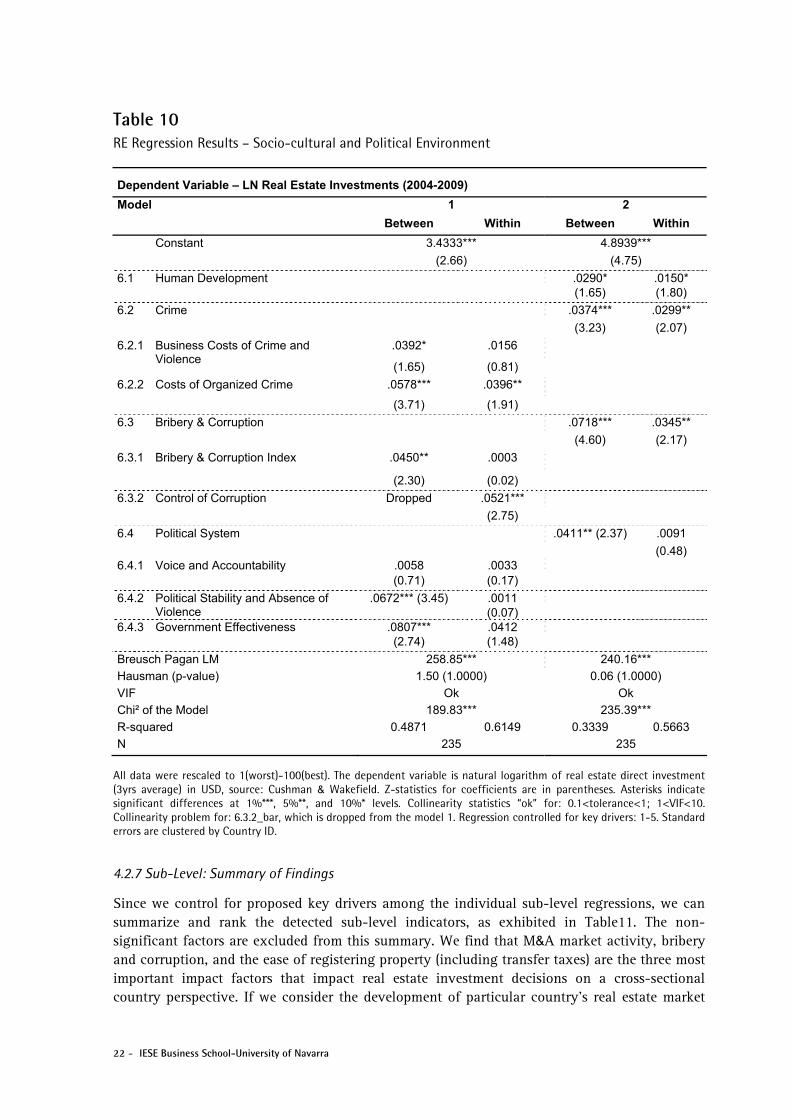
According to the results shown in Error! Reference source not found., we identify the quality of the political system and bribery and corruption as the most important factors affecting real estate investments with respect to this sub-group. These results confirm Lim, McGreal and Webb (2006) and Chin, Dent and Roberts (2006) who find political stability to be the most important factor underpinning international investors’ country choices when entering emerging or transition economies. As Lee (2001) notes, the level of crime and corruption faced by businesses strongly affects investment activity as it can prove to be a major impediment to the successful implementation of an investment strategy. Furthermore, we find more real estate investing in countries with better developed socio-cultural frameworks, due to the fact that cultural conflicts negatively impact the overall investment climate in a country.
22 - IESE Business School-University of Navarra
Table 10 RE Regression Results – Socio-cultural and Political Environment
Dependent Variable – LN Real Estate Investments (2004-2009)
Model 1 2
Between Within Between Within
3.4333*** 4.8939*** Constant
(2.66) (4.75)
.0290* .0150* 6.1 Human Development (1.65) (1.80)
.0374*** .0299** 6.2 Crime
(3.23) (2.07)
.0392* .0156 6.2.1 Business Costs of Crime and Violence
(1.65) (0.81)
.0578*** .0396** 6.2.2 Costs of Organized Crime
(3.71) (1.91)
.0718*** .0345** 6.3 Bribery & Corruption
(4.60) (2.17)
.0450** .0003 6.3.1 Bribery & Corruption Index
(2.30) (0.02)
.0521*** 6.3.2 Control of Corruption Dropped
(2.75)
.0091 6.4 Political System .0411** (2.37)
(0.48) .0058 .0033 6.4.1 Voice and Accountability (0.71) (0.17)
.0011 6.4.2 Political Stability and Absence of Violence
.0672*** (3.45) (0.07)
.0807*** .0412 6.4.3 Government Effectiveness (2.74) (1.48)
Breusch Pagan LM 258.85*** 240.16***
Hausman (p-value) 1.50 (1.0000) 0.06 (1.0000)
VIF Ok Ok
Chi² of the Model 189.83*** 235.39***
R-squared 0.4871 0.6149 0.3339 0.5663
N 235 235
All data were rescaled to 1(worst)-100(best). The dependent variable is natural logarithm of real estate direct investment (3yrs average) in USD, source: Cushman & Wakefield. Z-statistics for coefficients are in parentheses. Asterisks indicate significant differences at 1%***, 5%**, and 10%* levels. Collinearity statistics “ok” for: 0.1<tolerance<1; 1<VIF<10. Collinearity problem for: 6.3.2_bar, which is dropped from the model 1. Regression controlled for key drivers: 1-5. Standard errors are clustered by Country ID.
4.2.7 Sub-Level: Summary of Findings
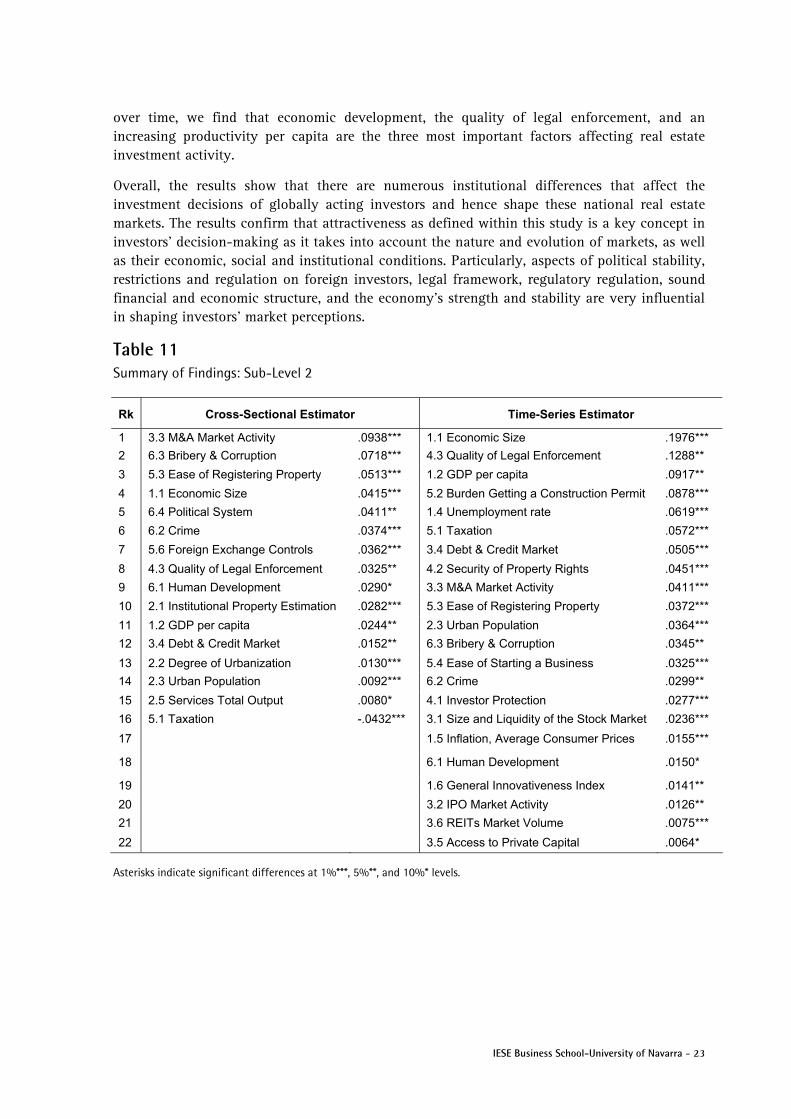
Since we control for proposed key drivers among the individual sub-level regressions, we can summarize and rank the detected sub-level indicators, as exhibited in Table11. The non-significant factors are excluded from this summary. We find that M&A market activity, bribery and corruption, and the ease of registering property (including transfer taxes) are the three most important impact factors that impact real estate investment decisions on a cross-sectional country perspective. If we consider the development of particular country’s real estate market
IESE Business School-University of Navarra - 23
over time, we find that economic development, the quality of legal enforcement, and an increasing productivity per capita are the three most important factors affecting real estate investment activity.
Overall, the results show that there are numerous institutional differences that affect the investment decisions of globally acting investors and hence shape these national real estate markets. The results confirm that attractiveness as defined within this study is a key concept in investors’ decision-making as it takes into account the nature and evolution of markets, as well as their economic, social and institutional conditions. Particularly, aspects of political stability, restrictions and regulation on foreign investors, legal framework, regulatory regulation, sound financial and economic structure, and the economy’s strength and stability are very influential in shaping investors’ market perceptions.
Table 11 Summary of Findings: Sub-Level 2
Rk Cross-Sectional Estimator Time-Series Estimator
1 3.3 M&A Market Activity .0938*** 1.1 Economic Size .1976***
2 6.3 Bribery & Corruption .0718*** 4.3 Quality of Legal Enforcement .1288**
3 5.3 Ease of Registering Property .0513*** 1.2 GDP per capita .0917**
4 1.1 Economic Size .0415*** 5.2 Burden Getting a Construction Permit .0878***
5 6.4 Political System .0411** 1.4 Unemployment rate .0619***
6 6.2 Crime .0374*** 5.1 Taxation .0572***
7 5.6 Foreign Exchange Controls .0362*** 3.4 Debt & Credit Market .0505***
8 4.3 Quality of Legal Enforcement .0325** 4.2 Security of Property Rights .0451***
9 6.1 Human Development .0290* 3.3 M&A Market Activity .0411***
10 2.1 Institutional Property Estimation .0282*** 5.3 Ease of Registering Property .0372***
11 1.2 GDP per capita .0244** 2.3 Urban Population .0364***
12 3.4 Debt & Credit Market .0152** 6.3 Bribery & Corruption .0345**
13 2.2 Degree of Urbanization .0130*** 5.4 Ease of Starting a Business .0325***
14 2.3 Urban Population .0092*** 6.2 Crime .0299**
15 2.5 Services Total Output .0080* 4.1 Investor Protection .0277***
16 5.1 Taxation -.0432*** 3.1 Size and Liquidity of the Stock Market .0236***
17 1.5 Inflation, Average Consumer Prices .0155***
18 6.1 Human Development .0150*
19 1.6 General Innovativeness Index .0141**
20 3.2 IPO Market Activity .0126**
21 3.6 REITs Market Volume .0075***
22 3.5 Access to Private Capital .0064*
Asterisks indicate significant differences at 1%***, 5%**, and 10%* levels.
24 - IESE Business School-University of Navarra
5. Conclusion Elaborating on prior research findings, we develop a conceptual framework of a host country’s attractiveness for real estate investments. This framework encompasses and combines the factors that determine the location advantage for international investments in a foreign country. We identify six dimensions determining the attractiveness of real estate markets, in terms of their capital supply and demand conditions: (i) economic activity; (ii) real estate investment opportunities; (iii) depth and sophistication of capital markets; (iv) investor protection and legal framework; (v) administrative burdens and regulatory limitations; and (vi) socio-cultural and political environment. Since the determinants vary over countries and over time, we explore how different socio-economic environments, demographic attributes and institutional frameworks affect commercial real estate investment through both cross-sectional and time-series analyses.
We use augmented random effect panel regressions to conduct analyses across 47 countries, 6 years and 66 raw data series, which proxy the aforementioned latent six key dimensions. The regressions enable examining the hierarchy and importance in both dimensions with effects occurring at the cross-country and time level. The augmented random effect panel regression methodology allows us to cope with the major weaknesses discussed in econometrics theory, such as heterogeneity, time-invariant variables, multicollinearity, and finally informational inefficient and commingled estimators. Therefore, we create decomposed estimators that are efficient and allow proper assessments of the “between” and “within” information from our panel data series. The results confirm many determinants named in literature. Regarding the cross-sectional and time-series analyses, the regressions reveal the following ranking of factors, based on their effects on real estate investments: (1) real estate investment opportunities; (2) depth and sophistication of capital markets; (3) administrative burdens and regulatory limitations; and (4) investor protection and legal framework.
Based on our broad concept of a host country’s attractiveness for real estate investments, we increase the understanding of the drivers of real estate markets and set a new benchmark for research on real estate investment determinants. Our results also provide guidelines for political improvements to attract international capital allocations.
An expansion of our analyses using property returns presents an interesting approach to understanding the tactical pricing in different markets. While Liu and Mei (1999) and Edelstein, Qian and Tsang (2010) test institutional factors with listed property returns, Lee (2006) conducts his analysis with non-listed property returns3 using several country risk measures. We believe that the assessment of risk-adjusted pricing in international real estate markets, in terms of their socio-economic and institutional structure, by testing our conceptual framework with property returns, provides a fruitful opportunity for further research.
3 Lee (2006) uses property returns from Investment Property Database (IPD).
IESE Business School-University of Navarra - 25
6. References Adair, A., Berry, J., McGreal, S., Syacutekora, L., Ghanbari Parsa, A. and B. Redding (1999), Globalization of real estate markets in Central Europe, In: European Planning Studies, vol. 7, no. 3, June, pp. 295-305.
Adlington, Gavin; Grover, Richard; Heywood, Mark; Keith, Simon; Munro-Faure, Paul; Perrotta, Louise (2008), Developing Real Estate Markets in Transition Economies, In: UN Intergovernmental Conference Paper, RICS Research Foundation, 6.-8. December.
Baum, A. (1995), Can foreign investment be successful? In: Real Estate Finance, vol. 12, no. 1, pp. 81-89.
Baum, A. (2009), Commercial Real Estate Investment: A Strategic Approach, Second edition, EG Books.
Baum, Christopher F. (2006), An Introduction to Modern Econometrics Using STATA, First edition, STATA Press.
Black, B. and R. Gilson (1998), Venture capital and the structure of capital markets: Banks versus stock markets, In: Journal of Financial Economics, vol. 47, pp. 243-277.
Breusch, T. and A. Pagan (1980), The LM Test and Its Application to Model Specification in Econometrics, In: Review of Economic Studies, vol. 47, pp. 239-254.
Brounen, D., Cools, T. and M. Schweizer (2001), Information Transparency Pays: Evidence from European Property Shares, In: Real Estate Finance, Summer, pp. 39-49.
Chen, Jun; Hobbs, Peter (2003), Global Real Estate Risk Index – To capture different levels of market risk, In: The Journal of Portfolio Management, Special Issue, pp. 66-76.
Chin, Wei; Dent, Peter; Roberts, Claire (2006), An Explanatory Analysis of Barriers to Investment and Market Maturity in Southeast Asian Cities, In: Journal of Real Estate Portfolio Management, vol. 12, no. 1, pp. 49-57.
Connor, Philip and Liang, Youguo (2000), Four Forces Shaping the Commercial Real Estate Industry, Pramerica Financial Research, November.
D’Arcy, Eámonn; Keogh, Geoffrey (1998), Territorial Competition and Property Market Process: An Explanatory Analysis, In: Journal of Urban Studies, vol. 35, no. 8, pp. 1215-1230.
DiPasquale, Denise and Wheaton, William C. (1992), The Markets for Real Estate and Space: A Conceptual Framework. In: Journal of the American Real Estate and Urban Economics Association, vol. 20, no. 1, pp. 181-197.
Djankov, S.; La Porta, R.; Lopez-de-Silanes, F.; Shleifer, A. (2002), The regulation of entry, In: Quarterly Journal of Economics, vol. 117, no. 1, pp. 1-37.
Djankov, S.; La Porta, R.; Lopez-de-Silanes, F.; Shleifer, A. (2003), Courts, In: Quarterly Journal of Economics, vol. 118, no. 2, pp. 453-517.

26 - IESE Business School-University of Navarra
Djankov, S.; La Porta, R.; Lopez-de-Silanes, F.; Shleifer, A. (2005), The Law and Economics of Self-Dealing. NBER working paper 11883.
Dunning, J. H. (1977), Trade, location of economic activity and the multinational enterprise: A search for an eclectic approach, In: Ohlin, B., Hesselborn, P. O., & Wilkman, P. M., editors, The international allocation of economic activity, pp. 395-418. London: Macmillan.
Dunning, J. H. (1980), Toward an eclectic theory of international production: Some empirical tests, In: Journal of International Business Studies, vol. 11, Spring/Summer, pp. 9-31.
Dunning, J. H. (1981), International Production and the Multinational Enterprise, George Allen and Unwin, London.
Dunning, J. H. (1995), Reappraising the eclectic paradigm in an age of alliance capitalism, In: Journal of International Business Studies, vol. 26, no. 3, pp. 461-491.
Dunning, J. H. (2000), The Eclectic Paradigm as an Envelope for Economic and Business Theories of MNE Activity, In: International Business Review, vol. 9, pp. 163-190.
Dunning, J. H. (2001), The Eclectic (OLI) Paradigm of International Production: Past, Present and Future, In: Economics of Business, vol. 8, pp. 173-190.
Dunning, J. H. (2006), Towards a new paradigm of development: implications for the determinants of international business, In: Transnational Corporations, vol. 15, pp. 173-230.
Edelstein, Robert; Qian, Wenlan; Tsang, Desmond (2010), How Do Institutional Factors Affect International Real Estate Returns? In: Journal of Real Estate Economics and Finance, online: DOI: 10.1007/s11146-010-9245-4.
Falkenbach, Heidi (2009), Market Selection for International Real Estate Investments, In: International Journal of Strategic Property Management, vol. 13, pp. 299-308.
Geurts, Tom G.; Jaffe, Austin J. (1996), Risk and Real Estate Investment: An International Perspective, In: The Journal of Real Estate Research, vol. 11, no. 2, pp. 117-130.
Glaeser, E. L., Johnson, S. and A. Shleifer (2001), Coase vs. the Coasians, In: Quarterly Journal of Economics, vol. 116, pp. 853-899.
Greene, William, H. (2003), Econometric Analysis, 5th edition, Prentice Hall, New Jersey.
Groh, Alexander Peter; Liechtenstein, Heinrich; Lieser, Karsten (2010), The European Venture Capital and Private Equity Country Attractiveness Indices, In: Journal of Corporate Finance, vol. 16, no. 2, pp. 205-224.
Han, J. (1996), Targeting markets is popular: A survey of pension real estate investment advisors, In: Real Estate Finance, vol. 13, no. 1, 1996, pp. 66-75.
Hartzell, Jay C.; Liu, Crocker H.; Kallberg, Jarl G. (2004), The Role of the Underlying Real Asset Market in REIT IPOs. Available at SSRN: http://ssrn.com/abstract=516662.
Hausman, J. A. (1978), Specification Tests in Econometrics, In: Econometria, vol. 46, no. 6.
Hoechle, D. (2007), Robust Standard Errors for Panel Regressions with Cross-Sectional Dependence, In: The Stata Journal, vol. 7, no. 3, pp. 281-312.
IESE Business School-University of Navarra - 27
Holsapple, Eric J.; Ozawa, Terutomo; Olienyk, John (2006), Foreign “Direct” and “Portfolio” Investment in Real Estate, In: Journal of Real Estate Portfolio Management, vol. 12, no. 1, pp. 37-47.
Hoskin, Nicholas; Higgins, David; Cardew, Richard (2004), Macroeconomic Variables and Real Estate Returns: An International Comparison, In: The Appraisal Journal, Spring, pp. 163-170.
Jeng, Leslie A.; Wells, Philippe C. (2000), The determinants of venture capital funding: evidence across countries, In: Journal of Corporate Finance, vol. 6, pp. 241-289.
Keogh, Geoffrey; D’Arcy, Eámonn (1999), Property Market Efficiency: An Institutional Economics Perspective, In: Journal of Urban Studies, vol. 36, no. 13, pp. 2401-2414.
Knack, S. and P. Keefer (1995), Institutions and economic performance: Cross-country tests using alternative institutional measures. In: Economics and Politics, vol. 7, no. 3, pp. 207-228.
Kurzrock, B. M., Rottke, N. and D. Schiereck (2009), Influence Factors on the Performance of Direct Property Investments, In: Journal of Real Estate Portfolio Management, vol. 15, no. 1, pp. 59-73.
La Porta, R., Lopez-de-Silanes, F., Shleifer, A. and R. Vishny (1997), Legal Determinants of External Finance, In: Journal of Finance, vol. 52, no. 3, pp. 1131-1150.
La Porta, R., Lopez-de-Silanes, F., Shleifer, A.and R. Vishny (1998), Law and finance, In: Journal of Political Economy, vol. 106, no. 6, pp. 1113-1155.
La Porta, R., Lopez-de-Silanes, F., Shleifer, A. and R. Vishny (2000), Agency problems and dividend policies around the word, In: Journal of Finance, vol. 55, pp. 1-33.
La Porta, R., Lopez-de-Silanes, F., Shleifer, A. and R. Vishny (2002), Investor Protection and Corporate Valuation, In: Journal of Finance, vol. 57, no. 3, pp. 1147-1170.
Laposa, Steven; Lizieri, Colin (2005), Real Estate Capital Flows and Transitional Economies, In: Conference Paper, ARES Meeting, Santa Fee, NM, 13.-16. April.
Lee, Stephen (2001), The Risks of Investing in the Real Estate Markets of the Asian Region, In: Working Paper of Department of Land Management, The University of Reading, no. 6.
Lee, Stephen (2005), Gauging the Investment Potential of International Real Estate Markets, In: Working Paper of Real Estate and Planning, The University of Reading, no. 19.
Lee, Stephen (2006a), The Impact of Country Risk on International Real Estate Returns, In: Working Paper of Real Estate and Planning, The University of Reading, no. 10.
Lee, Stephen (2006b), The Impact of Exchanges Rates on International Real Estate Portfolio Allocation, In: Working Paper of Real Estate and Planning, The University of Reading, no. 4.
Liang, Youguo; Gordon, Nancy M. (2003), A Bird’s Eye View of Global Real Estate Markets, Pramerica Financial Research, March.
Liao, Hsien-hsing; Mei, Jianping (1999): Institutional Factors and Real Estate Returns – A Cross Country Study, In: International Real Estate Review, vol. 2, no. 1, pp. 21-34.
Lieser, Karsten; Groh, Alexander Peter (2011), The Attractiveness of 66 Countries for Real Estate Investments – A Composite Index Approach, In: ERES Conference Paper and IESE Working Paper, WP-868, Available at SSRN: http://ssrn.com/abstract=1638286.
28 - IESE Business School-University of Navarra
Lim, Lay Cheng; McGreal, Stanley; Webb, James R. (2006), Perception of Real Estate Investment Opportunities in Central/South America and Africa, In: Journal of Real Estate Portfolio Management, vol. 12, no. 3, pp. 261-276.
Lynn, David J. (2007), The Tectonic Forces of Global Real Estate: Implications for Global Investment and Portfolio Managers, In: Journal of Real Estate Portfolio Management, vol. 13, no. 1, pp. 87-92.
Mason, C. H. and W. D. Perreault (1991), Collinearity, Power, and Interpretation of Multiple Regression Analysis, In: Journal of Marketing Research, vol. 28, August, pp. 268-280.
Mauro, P. (1995), Corruption and growth, In: Quarterly Journal of Economics, vol. 110, pp. 681-712.
McGreal, Stanely; Parsa, Ali; Keivani, Ramin (2001), Perceptions of Real Estate Markets in Central Europe: A Survey of European Investor, In: Journal of Real Estate Literature, vol. 9, no. 2, pp. 147-160.
Mueller, Glenn R. (1995), Understanding Real Estate’s Physical and Financial Market Cycles, In: Journal of Real Estate Finance, Spring, pp. 47.-52.
Mueller, Paige; Ball, Asli (2006), International Investing: A Global Demographic Primer, In: Journal of Real Estate Portfolio Management, vol. 12, no. 3, pp. 299-308.
Mundlak, Y. (1978), On the Pooling of Time Series and Cross Section Data, In: Econometrica, vol. 46, no. 1, pp. 69-85.
Mundlak, Y. (2001), Explaining Economic Growth, In: American Agricultural Economics Association, vol. 83, no. 5, pp. 1155-1167.
Mundlak, Y., Larson, D. F. and R. Butzer (1999), Rethinking Within and Between Regressions: The Case of Agricultural Production Functions. In: Annales d’économie et de statistique, no. 55-56.
Mundlak, Y. and J. A. Yahav (1981), Random Effects, Fixed Effects, Convolution, and Separation, In: Econometrica, vol. 49, no. 6, pp. 1399-1416.
Nardo, M., Saisana, M., Saltelli, A., Tarantola, S., Hoffman, A. and E. Giovannini (2005), Handbook on constructing composite indicators: Methodology and user guide, OECD statistics working paper STD/DOC(2005)3.
O’Hara, M. (1995), Market Microstructure Theory, Basil Blackwell Inc., Boston.
Roulac, Stephen E. (1996a), Real Estate Market Cycles, Transformation Forces and Structural Change, In: Journal of Real Estate Portfolio Management, vol. 2, no. 1, pp. 1-17.
Solnik, Bruno (1996), International Investments, 3rd edition, Massachusetts: Addision-Wesley.
Svensson, J. (1998), Investment, property rights and political instability: Theory and evidence, In: European Economic Review, vol. 42, no. 7, pp. 1317-1341.
Thrall, Grant Ian (2002), Business Geography and New Real Estate Market Analysis, Oxford University Press: New York and Oxford.
Van Doorn, Lisette (2003), Investing in Europe: The way to diversify, In: IPD Compendium of Real Estate Papers, paper presented at IPD European Property Strategies Conference, Wiesbaden.
IESE Business School-University of Navarra - 29
Webb, J. R. (1984), Real Estate Investment Acquisition Rules for Life Insurance Companies and Pension Funds, In: Journal of the American Real Estate and Urban Economics Association, vol. 12, no. 4, pp. 495–520.
Wooldridge, Jeffrey M. (2009), Introductory econometrics: a modern approach, In: 4th ed., South Western, Cengage Learning.
Worzala, Elaine (1994), Overseas Property Investments – How Are They Perceived by the Institutional Investor? In: Journal of Property Valuation & Investment, vol. 12, no. 3, pp. 31-47.
Worzala, Elaine; Newell, Graeme (1997), International Real Estate: A Review of Strategic Investment Issues, In: Journal of Real Estate Portfolio Management, vol. 3, no. 2, pp. 87-96.
Zorn, C. (2001), Estimating Between- and Within-Cluster Covariate Effects, with an Application to Models of International Disputes, In: International Interactions, vol. 27, pp. 433-445.
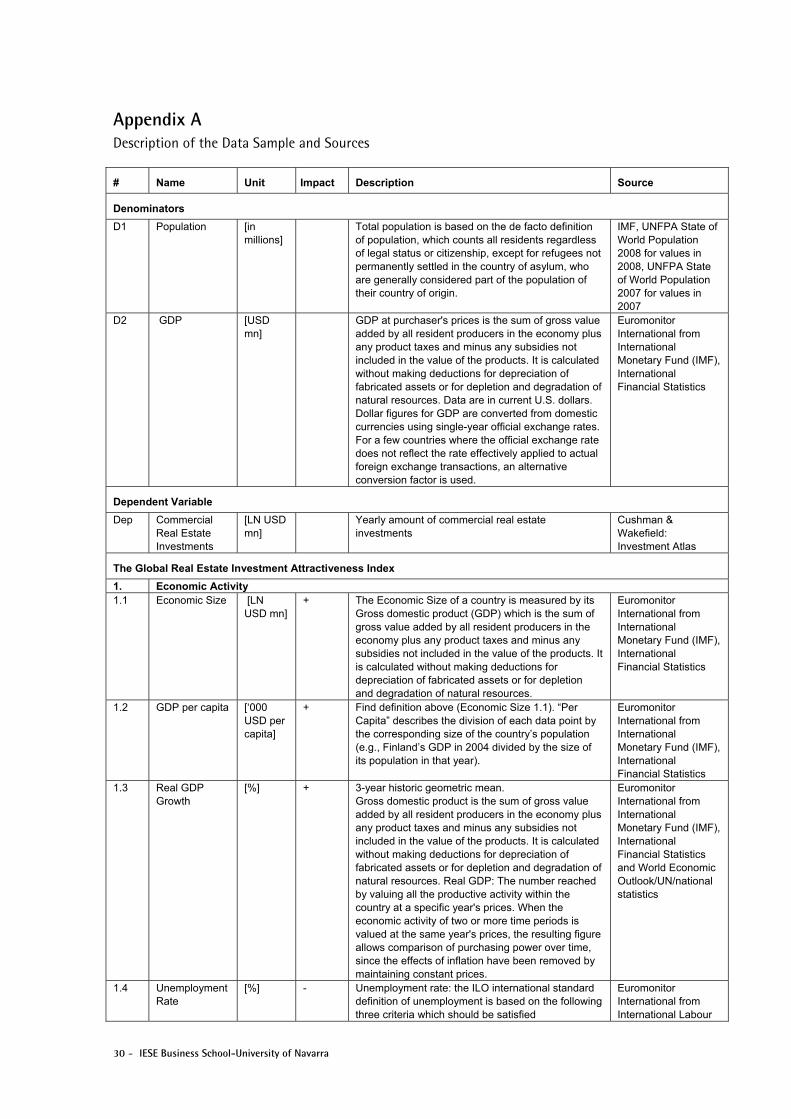
30 - IESE Business School-University of Navarra
Appendix A Description of the Data Sample and Sources
# Name Unit Impact Description Source
Denominators
D1 Population [in millions]
Total population is based on the de facto definition of population, which counts all residents regardless of legal status or citizenship, except for refugees not permanently settled in the country of asylum, who are generally considered part of the population of their country of origin.
IMF, UNFPA State of World Population 2008 for values in 2008, UNFPA State of World Population 2007 for values in 2007
D2 GDP [USD mn]
GDP at purchaser's prices is the sum of gross value added by all resident producers in the economy plus any product taxes and minus any subsidies not included in the value of the products. It is calculated without making deductions for depreciation of fabricated assets or for depletion and degradation of natural resources. Data are in current U.S. dollars. Dollar figures for GDP are converted from domestic currencies using single-year official exchange rates. For a few countries where the official exchange rate does not reflect the rate effectively applied to actual foreign exchange transactions, an alternative conversion factor is used.
Euromonitor International from International Monetary Fund (IMF), International Financial Statistics
Dependent Variable
Dep Commercial Real Estate Investments
[LN USD mn]
Yearly amount of commercial real estate investments
Cushman & Wakefield: Investment Atlas
The Global Real Estate Investment Attractiveness Index
1. Economic Activity 1.1 Economic Size [LN
USD mn] + The Economic Size of a country is measured by its
Gross domestic product (GDP) which is the sum of gross value added by all resident producers in the economy plus any product taxes and minus any subsidies not included in the value of the products. It is calculated without making deductions for depreciation of fabricated assets or for depletion and degradation of natural resources.
Euromonitor International from International Monetary Fund (IMF), International Financial Statistics
1.2 GDP per capita [‘000 USD per capita]
+ Find definition above (Economic Size 1.1). “Per Capita” describes the division of each data point by the corresponding size of the country’s population (e.g., Finland’s GDP in 2004 divided by the size of its population in that year).
Euromonitor International from International Monetary Fund (IMF), International Financial Statistics
1.3 Real GDP Growth
[%] + 3-year historic geometric mean. Gross domestic product is the sum of gross value added by all resident producers in the economy plus any product taxes and minus any subsidies not included in the value of the products. It is calculated without making deductions for depreciation of fabricated assets or for depletion and degradation of natural resources. Real GDP: The number reached by valuing all the productive activity within the country at a specific year's prices. When the economic activity of two or more time periods is valued at the same year's prices, the resulting figure allows comparison of purchasing power over time, since the effects of inflation have been removed by maintaining constant prices.
Euromonitor International from International Monetary Fund (IMF), International Financial Statistics and World Economic Outlook/UN/national statistics
1.4 Unemployment Rate
[%] - Unemployment rate: the ILO international standard definition of unemployment is based on the following three criteria which should be satisfied
Euromonitor International from International Labour
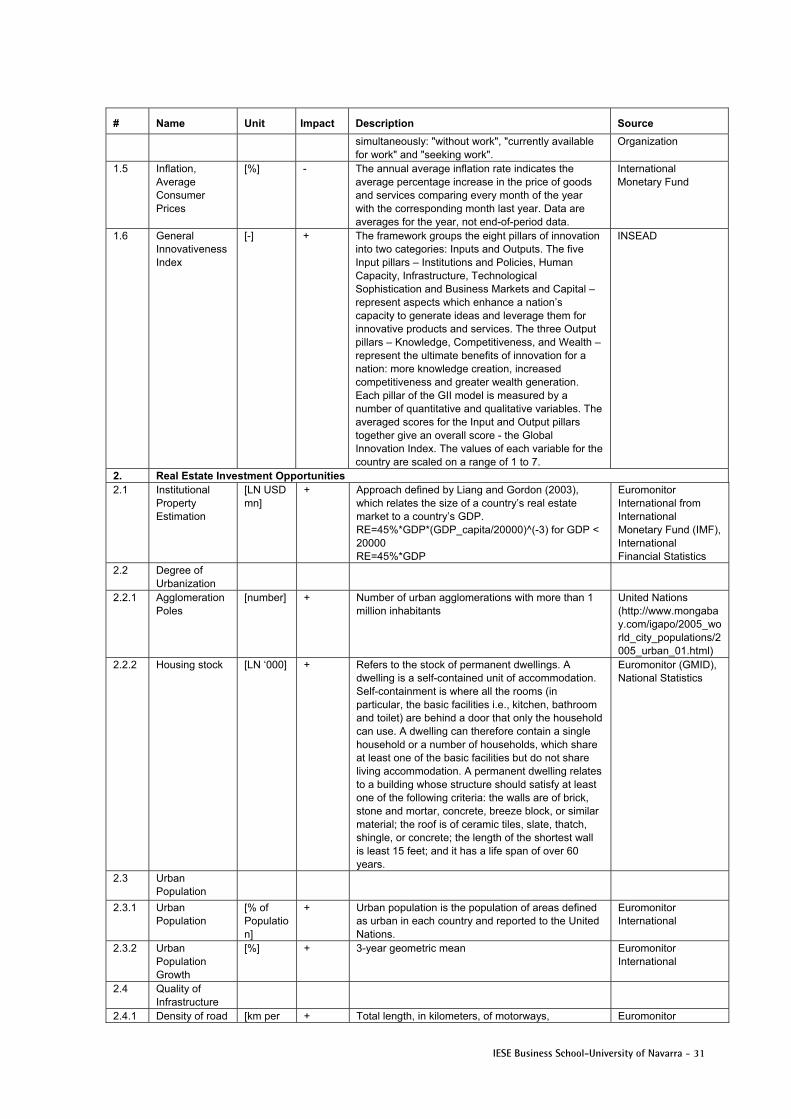
IESE Business School-University of Navarra - 31
# Name Unit Impact Description Source
simultaneously: "without work", "currently available for work" and "seeking work".
Organization
1.5 Inflation, Average Consumer Prices
[%] - The annual average inflation rate indicates the average percentage increase in the price of goods and services comparing every month of the year with the corresponding month last year. Data are averages for the year, not end-of-period data.
International Monetary Fund
1.6 General Innovativeness Index
[-] + The framework groups the eight pillars of innovation into two categories: Inputs and Outputs. The five Input pillars – Institutions and Policies, Human Capacity, Infrastructure, Technological Sophistication and Business Markets and Capital – represent aspects which enhance a nation’s capacity to generate ideas and leverage them for innovative products and services. The three Output pillars – Knowledge, Competitiveness, and Wealth – represent the ultimate benefits of innovation for a nation: more knowledge creation, increased competitiveness and greater wealth generation. Each pillar of the GII model is measured by a number of quantitative and qualitative variables. The averaged scores for the Input and Output pillars together give an overall score - the Global Innovation Index. The values of each variable for the country are scaled on a range of 1 to 7.
INSEAD
2. Real Estate Investment Opportunities 2.1 Institutional
Property Estimation
[LN USD mn]
+ Approach defined by Liang and Gordon (2003), which relates the size of a country’s real estate market to a country’s GDP. RE=45%*GDP*(GDP_capita/20000)^(-3) for GDP < 20000 RE=45%*GDP
Euromonitor International from International Monetary Fund (IMF), International Financial Statistics
2.2 Degree of Urbanization
2.2.1 Agglomeration Poles
[number] + Number of urban agglomerations with more than 1 million inhabitants
United Nations (http://www.mongabay.com/igapo/2005_world_city_populations/2005_urban_01.html)
2.2.2 Housing stock [LN ‘000] + Refers to the stock of permanent dwellings. A dwelling is a self-contained unit of accommodation. Self-containment is where all the rooms (in particular, the basic facilities i.e., kitchen, bathroom and toilet) are behind a door that only the household can use. A dwelling can therefore contain a single household or a number of households, which share at least one of the basic facilities but do not share living accommodation. A permanent dwelling relates to a building whose structure should satisfy at least one of the following criteria: the walls are of brick, stone and mortar, concrete, breeze block, or similar material; the roof is of ceramic tiles, slate, thatch, shingle, or concrete; the length of the shortest wall is least 15 feet; and it has a life span of over 60 years.
Euromonitor (GMID), National Statistics
2.3 Urban Population
2.3.1 Urban Population
[% of Population]
+ Urban population is the population of areas defined as urban in each country and reported to the United Nations.
Euromonitor International
2.3.2 Urban Population Growth
[%] + 3-year geometric mean Euromonitor International
2.4 Quality of Infrastructure
2.4.1 Density of road [km per + Total length, in kilometers, of motorways, Euromonitor
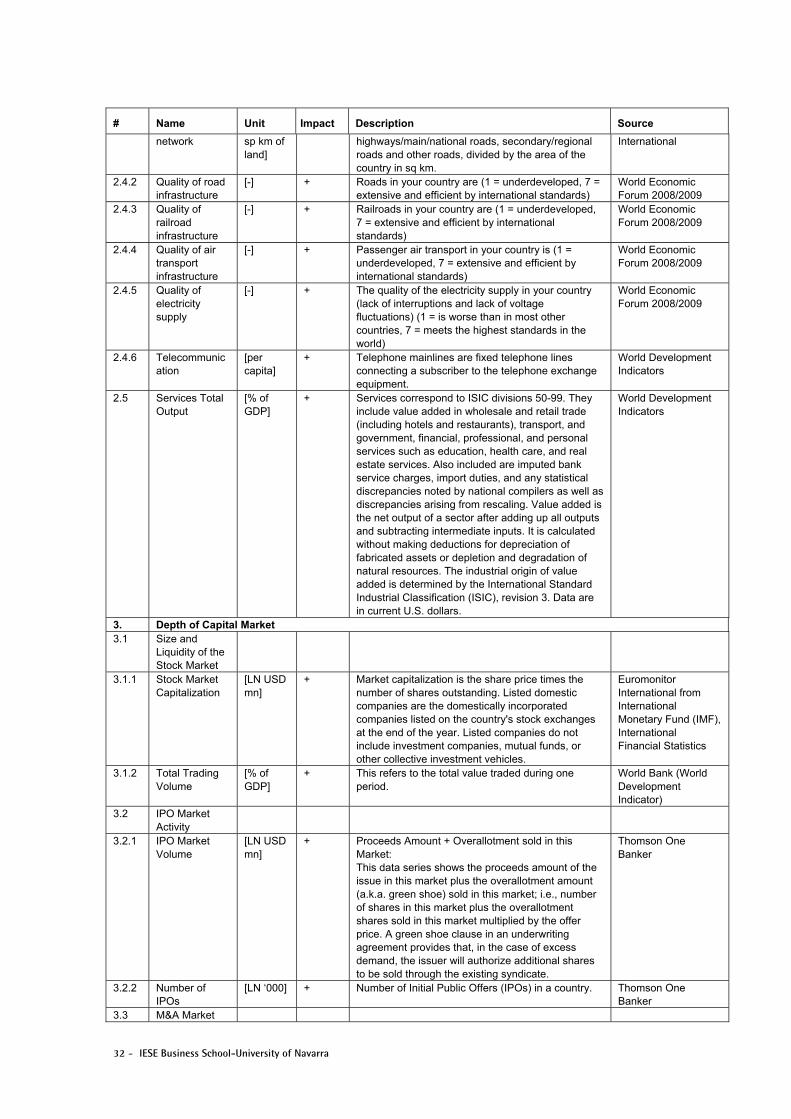
32 - IESE Business School-University of Navarra
# Name Unit Impact Description Source
network sp km of land]
highways/main/national roads, secondary/regional roads and other roads, divided by the area of the country in sq km.
International
2.4.2 Quality of road infrastructure
[-] + Roads in your country are (1 = underdeveloped, 7 = extensive and efficient by international standards)
World Economic Forum 2008/2009
2.4.3 Quality of railroad infrastructure
[-] + Railroads in your country are (1 = underdeveloped, 7 = extensive and efficient by international standards)
World Economic Forum 2008/2009
2.4.4 Quality of air transport infrastructure
[-] + Passenger air transport in your country is (1 = underdeveloped, 7 = extensive and efficient by international standards)
World Economic Forum 2008/2009
2.4.5 Quality of electricity supply
[-] + The quality of the electricity supply in your country (lack of interruptions and lack of voltage fluctuations) (1 = is worse than in most other countries, 7 = meets the highest standards in the world)
World Economic Forum 2008/2009
2.4.6 Telecommunication
[per capita]
+ Telephone mainlines are fixed telephone lines connecting a subscriber to the telephone exchange equipment.
World Development Indicators
2.5 Services Total Output
[% of GDP]
+ Services correspond to ISIC divisions 50-99. They include value added in wholesale and retail trade (including hotels and restaurants), transport, and government, financial, professional, and personal services such as education, health care, and real estate services. Also included are imputed bank service charges, import duties, and any statistical discrepancies noted by national compilers as well as discrepancies arising from rescaling. Value added is the net output of a sector after adding up all outputs and subtracting intermediate inputs. It is calculated without making deductions for depreciation of fabricated assets or depletion and degradation of natural resources. The industrial origin of value added is determined by the International Standard Industrial Classification (ISIC), revision 3. Data are in current U.S. dollars.
World Development Indicators
3. Depth of Capital Market 3.1 Size and
Liquidity of the Stock Market
3.1.1 Stock Market Capitalization
[LN USD mn]
+ Market capitalization is the share price times the number of shares outstanding. Listed domestic companies are the domestically incorporated companies listed on the country's stock exchanges at the end of the year. Listed companies do not include investment companies, mutual funds, or other collective investment vehicles.
Euromonitor International from International Monetary Fund (IMF), International Financial Statistics
3.1.2 Total Trading Volume
[% of GDP]
+ This refers to the total value traded during one period.
World Bank (World Development Indicator)
3.2 IPO Market Activity
3.2.1 IPO Market Volume
[LN USD mn]
+ Proceeds Amount + Overallotment sold in this Market: This data series shows the proceeds amount of the issue in this market plus the overallotment amount (a.k.a. green shoe) sold in this market; i.e., number of shares in this market plus the overallotment shares sold in this market multiplied by the offer price. A green shoe clause in an underwriting agreement provides that, in the case of excess demand, the issuer will authorize additional shares to be sold through the existing syndicate.
Thomson One Banker
3.2.2 Number of IPOs
[LN ‘000] + Number of Initial Public Offers (IPOs) in a country. Thomson One Banker
3.3 M&A Market
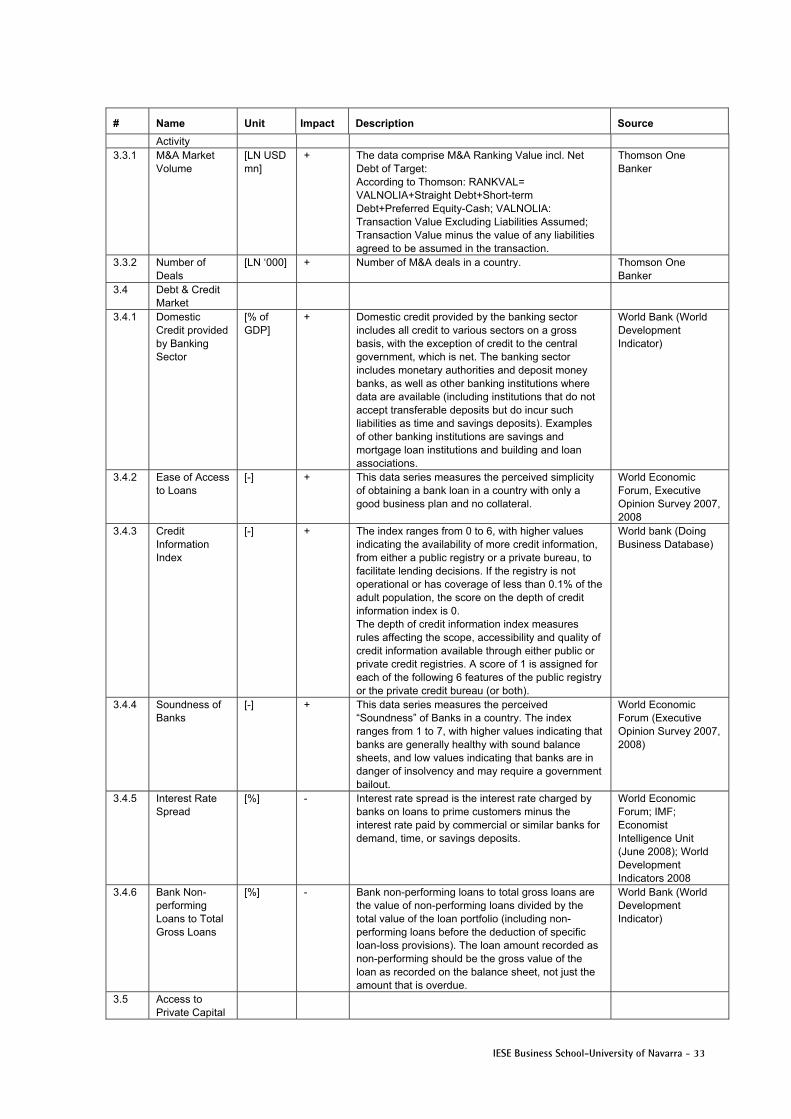
IESE Business School-University of Navarra - 33
# Name Unit Impact Description Source
Activity 3.3.1 M&A Market
Volume [LN USD mn]
+ The data comprise M&A Ranking Value incl. Net Debt of Target: According to Thomson: RANKVAL= VALNOLIA+Straight Debt+Short-term Debt+Preferred Equity-Cash; VALNOLIA: Transaction Value Excluding Liabilities Assumed; Transaction Value minus the value of any liabilities agreed to be assumed in the transaction.
Thomson One Banker
3.3.2 Number of Deals
[LN ‘000] + Number of M&A deals in a country. Thomson One Banker
3.4 Debt & Credit Market
3.4.1 Domestic Credit provided by Banking Sector
[% of GDP]
+ Domestic credit provided by the banking sector includes all credit to various sectors on a gross basis, with the exception of credit to the central government, which is net. The banking sector includes monetary authorities and deposit money banks, as well as other banking institutions where data are available (including institutions that do not accept transferable deposits but do incur such liabilities as time and savings deposits). Examples of other banking institutions are savings and mortgage loan institutions and building and loan associations.
World Bank (World Development Indicator)
3.4.2 Ease of Access to Loans
[-] + This data series measures the perceived simplicity of obtaining a bank loan in a country with only a good business plan and no collateral.
World Economic Forum, Executive Opinion Survey 2007, 2008
3.4.3 Credit Information Index
[-] + The index ranges from 0 to 6, with higher values indicating the availability of more credit information, from either a public registry or a private bureau, to facilitate lending decisions. If the registry is not operational or has coverage of less than 0.1% of the adult population, the score on the depth of credit information index is 0. The depth of credit information index measures rules affecting the scope, accessibility and quality of credit information available through either public or private credit registries. A score of 1 is assigned for each of the following 6 features of the public registry or the private credit bureau (or both).
World bank (Doing Business Database)
3.4.4 Soundness of Banks
[-] + This data series measures the perceived “Soundness” of Banks in a country. The index ranges from 1 to 7, with higher values indicating that banks are generally healthy with sound balance sheets, and low values indicating that banks are in danger of insolvency and may require a government bailout.
World Economic Forum (Executive Opinion Survey 2007, 2008)
3.4.5 Interest Rate Spread
[%] - Interest rate spread is the interest rate charged by banks on loans to prime customers minus the interest rate paid by commercial or similar banks for demand, time, or savings deposits.
World Economic Forum; IMF; Economist Intelligence Unit (June 2008); World Development Indicators 2008
3.4.6 Bank Non-performing Loans to Total Gross Loans
[%] - Bank non-performing loans to total gross loans are the value of non-performing loans divided by the total value of the loan portfolio (including non-performing loans before the deduction of specific loan-loss provisions). The loan amount recorded as non-performing should be the gross value of the loan as recorded on the balance sheet, not just the amount that is overdue.
World Bank (World Development Indicator)
3.5 Access to Private Capital
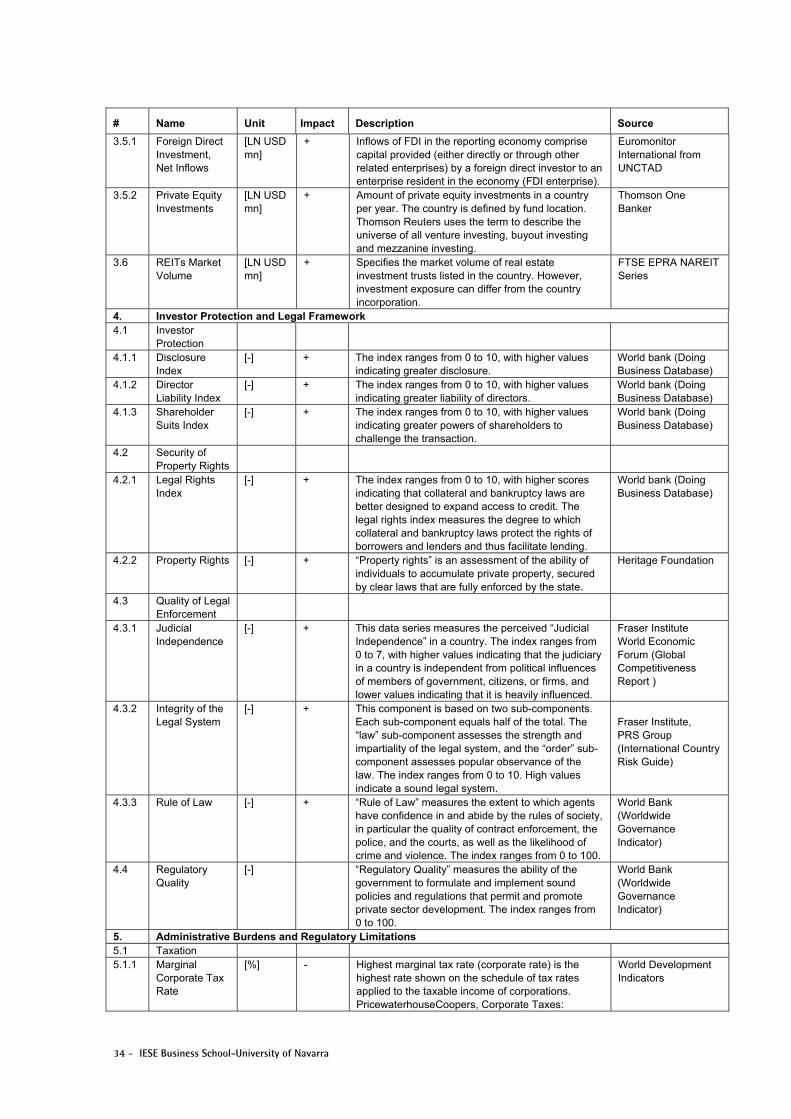
34 - IESE Business School-University of Navarra
# Name Unit Impact Description Source
3.5.1 Foreign Direct Investment, Net Inflows
[LN USD mn]
+ Inflows of FDI in the reporting economy comprise capital provided (either directly or through other related enterprises) by a foreign direct investor to an enterprise resident in the economy (FDI enterprise).
Euromonitor International from UNCTAD
3.5.2 Private Equity Investments
[LN USD mn]
+ Amount of private equity investments in a country per year. The country is defined by fund location. Thomson Reuters uses the term to describe the universe of all venture investing, buyout investing and mezzanine investing.
Thomson One Banker
3.6 REITs Market Volume
[LN USD mn]
+ Specifies the market volume of real estate investment trusts listed in the country. However, investment exposure can differ from the country incorporation.
FTSE EPRA NAREIT Series
4. Investor Protection and Legal Framework 4.1 Investor
Protection
4.1.1 Disclosure Index
[-] + The index ranges from 0 to 10, with higher values indicating greater disclosure.
World bank (Doing Business Database)
4.1.2 Director Liability Index
[-] + The index ranges from 0 to 10, with higher values indicating greater liability of directors.
World bank (Doing Business Database)
4.1.3 Shareholder Suits Index
[-] + The index ranges from 0 to 10, with higher values indicating greater powers of shareholders to challenge the transaction.
World bank (Doing Business Database)
4.2 Security of Property Rights
4.2.1 Legal Rights Index
[-] + The index ranges from 0 to 10, with higher scores indicating that collateral and bankruptcy laws are better designed to expand access to credit. The legal rights index measures the degree to which collateral and bankruptcy laws protect the rights of borrowers and lenders and thus facilitate lending.
World bank (Doing Business Database)
4.2.2 Property Rights [-] + “Property rights” is an assessment of the ability of individuals to accumulate private property, secured by clear laws that are fully enforced by the state.
Heritage Foundation
4.3 Quality of Legal Enforcement
4.3.1 Judicial Independence
[-] + This data series measures the perceived “Judicial Independence” in a country. The index ranges from 0 to 7, with higher values indicating that the judiciary in a country is independent from political influences of members of government, citizens, or firms, and lower values indicating that it is heavily influenced.
Fraser Institute World Economic Forum (Global Competitiveness Report )
4.3.2 Integrity of the Legal System
[-] + This component is based on two sub-components. Each sub-component equals half of the total. The “law” sub-component assesses the strength and impartiality of the legal system, and the “order” sub-component assesses popular observance of the law. The index ranges from 0 to 10. High values indicate a sound legal system.
Fraser Institute, PRS Group (International Country Risk Guide)
4.3.3 Rule of Law [-] + “Rule of Law” measures the extent to which agents have confidence in and abide by the rules of society, in particular the quality of contract enforcement, the police, and the courts, as well as the likelihood of crime and violence. The index ranges from 0 to 100.
World Bank (Worldwide Governance Indicator)
4.4 Regulatory Quality
[-] “Regulatory Quality” measures the ability of the government to formulate and implement sound policies and regulations that permit and promote private sector development. The index ranges from 0 to 100.
World Bank (Worldwide Governance Indicator)
5. Administrative Burdens and Regulatory Limitations 5.1 Taxation 5.1.1 Marginal
Corporate Tax Rate
[%] - Highest marginal tax rate (corporate rate) is the highest rate shown on the schedule of tax rates applied to the taxable income of corporations. PricewaterhouseCoopers, Corporate Taxes:
World Development Indicators
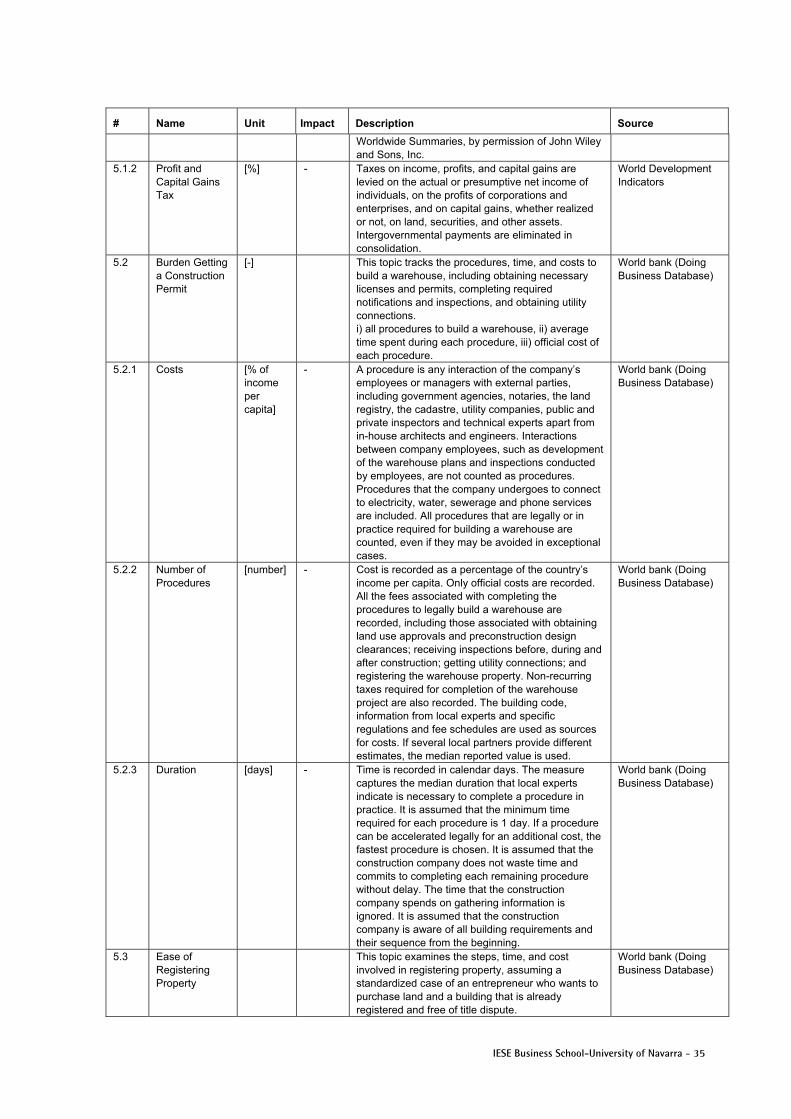
IESE Business School-University of Navarra - 35
# Name Unit Impact Description Source
Worldwide Summaries, by permission of John Wiley and Sons, Inc.
5.1.2 Profit and Capital Gains Tax
[%] - Taxes on income, profits, and capital gains are levied on the actual or presumptive net income of individuals, on the profits of corporations and enterprises, and on capital gains, whether realized or not, on land, securities, and other assets. Intergovernmental payments are eliminated in consolidation.
World Development Indicators
5.2 Burden Getting a Construction Permit
[-] This topic tracks the procedures, time, and costs to build a warehouse, including obtaining necessary licenses and permits, completing required notifications and inspections, and obtaining utility connections. i) all procedures to build a warehouse, ii) average time spent during each procedure, iii) official cost of each procedure.
World bank (Doing Business Database)
5.2.1 Costs [% of income per capita]
- A procedure is any interaction of the company’s employees or managers with external parties, including government agencies, notaries, the land registry, the cadastre, utility companies, public and private inspectors and technical experts apart from in-house architects and engineers. Interactions between company employees, such as development of the warehouse plans and inspections conducted by employees, are not counted as procedures. Procedures that the company undergoes to connect to electricity, water, sewerage and phone services are included. All procedures that are legally or in practice required for building a warehouse are counted, even if they may be avoided in exceptional cases.
World bank (Doing Business Database)
5.2.2 Number of Procedures
[number] - Cost is recorded as a percentage of the country’s income per capita. Only official costs are recorded. All the fees associated with completing the procedures to legally build a warehouse are recorded, including those associated with obtaining land use approvals and preconstruction design clearances; receiving inspections before, during and after construction; getting utility connections; and registering the warehouse property. Non-recurring taxes required for completion of the warehouse project are also recorded. The building code, information from local experts and specific regulations and fee schedules are used as sources for costs. If several local partners provide different estimates, the median reported value is used.
World bank (Doing Business Database)
5.2.3 Duration [days] - Time is recorded in calendar days. The measure captures the median duration that local experts indicate is necessary to complete a procedure in practice. It is assumed that the minimum time required for each procedure is 1 day. If a procedure can be accelerated legally for an additional cost, the fastest procedure is chosen. It is assumed that the construction company does not waste time and commits to completing each remaining procedure without delay. The time that the construction company spends on gathering information is ignored. It is assumed that the construction company is aware of all building requirements and their sequence from the beginning.
World bank (Doing Business Database)
5.3 Ease of Registering Property
This topic examines the steps, time, and cost involved in registering property, assuming a standardized case of an entrepreneur who wants to purchase land and a building that is already registered and free of title dispute.
World bank (Doing Business Database)
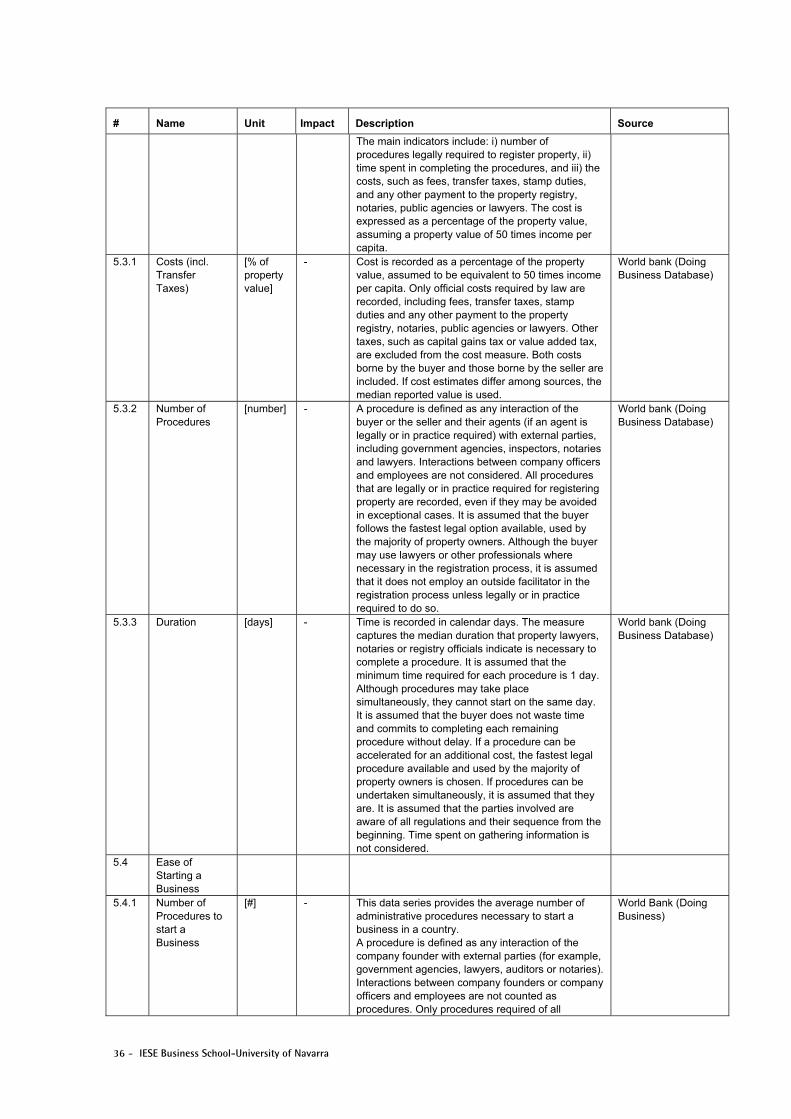
36 - IESE Business School-University of Navarra
# Name Unit Impact Description Source
The main indicators include: i) number of procedures legally required to register property, ii) time spent in completing the procedures, and iii) the costs, such as fees, transfer taxes, stamp duties, and any other payment to the property registry, notaries, public agencies or lawyers. The cost is expressed as a percentage of the property value, assuming a property value of 50 times income per capita.
5.3.1 Costs (incl. Transfer Taxes)
[% of property value]
- Cost is recorded as a percentage of the property value, assumed to be equivalent to 50 times income per capita. Only official costs required by law are recorded, including fees, transfer taxes, stamp duties and any other payment to the property registry, notaries, public agencies or lawyers. Other taxes, such as capital gains tax or value added tax, are excluded from the cost measure. Both costs borne by the buyer and those borne by the seller are included. If cost estimates differ among sources, the median reported value is used.
World bank (Doing Business Database)
5.3.2 Number of Procedures
[number] - A procedure is defined as any interaction of the buyer or the seller and their agents (if an agent is legally or in practice required) with external parties, including government agencies, inspectors, notaries and lawyers. Interactions between company officers and employees are not considered. All procedures that are legally or in practice required for registering property are recorded, even if they may be avoided in exceptional cases. It is assumed that the buyer follows the fastest legal option available, used by the majority of property owners. Although the buyer may use lawyers or other professionals where necessary in the registration process, it is assumed that it does not employ an outside facilitator in the registration process unless legally or in practice required to do so.
World bank (Doing Business Database)
5.3.3 Duration [days] - Time is recorded in calendar days. The measure captures the median duration that property lawyers, notaries or registry officials indicate is necessary to complete a procedure. It is assumed that the minimum time required for each procedure is 1 day. Although procedures may take place simultaneously, they cannot start on the same day. It is assumed that the buyer does not waste time and commits to completing each remaining procedure without delay. If a procedure can be accelerated for an additional cost, the fastest legal procedure available and used by the majority of property owners is chosen. If procedures can be undertaken simultaneously, it is assumed that they are. It is assumed that the parties involved are aware of all regulations and their sequence from the beginning. Time spent on gathering information is not considered.
World bank (Doing Business Database)
5.4 Ease of Starting a Business
5.4.1 Number of Procedures to start a Business
[#] - This data series provides the average number of administrative procedures necessary to start a business in a country. A procedure is defined as any interaction of the company founder with external parties (for example, government agencies, lawyers, auditors or notaries). Interactions between company founders or company officers and employees are not counted as procedures. Only procedures required of all
World Bank (Doing Business)
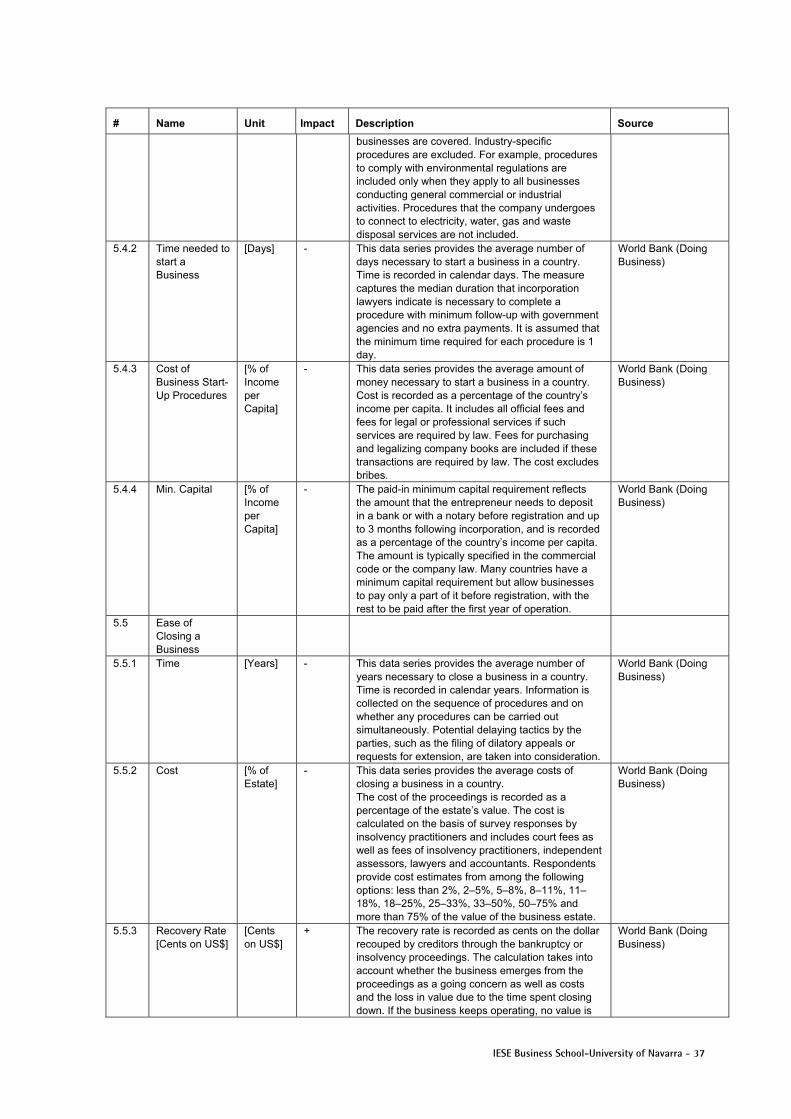
IESE Business School-University of Navarra - 37
# Name Unit Impact Description Source
businesses are covered. Industry-specific procedures are excluded. For example, procedures to comply with environmental regulations are included only when they apply to all businesses conducting general commercial or industrial activities. Procedures that the company undergoes to connect to electricity, water, gas and waste disposal services are not included.
5.4.2 Time needed to start a Business
[Days] - This data series provides the average number of days necessary to start a business in a country. Time is recorded in calendar days. The measure captures the median duration that incorporation lawyers indicate is necessary to complete a procedure with minimum follow-up with government agencies and no extra payments. It is assumed that the minimum time required for each procedure is 1 day.
World Bank (Doing Business)
5.4.3 Cost of Business Start-Up Procedures
[% of Income per Capita]
- This data series provides the average amount of money necessary to start a business in a country. Cost is recorded as a percentage of the country’s income per capita. It includes all official fees and fees for legal or professional services if such services are required by law. Fees for purchasing and legalizing company books are included if these transactions are required by law. The cost excludes bribes.
World Bank (Doing Business)
5.4.4 Min. Capital [% of Income per Capita]
- The paid-in minimum capital requirement reflects the amount that the entrepreneur needs to deposit in a bank or with a notary before registration and up to 3 months following incorporation, and is recorded as a percentage of the country’s income per capita. The amount is typically specified in the commercial code or the company law. Many countries have a minimum capital requirement but allow businesses to pay only a part of it before registration, with the rest to be paid after the first year of operation.
World Bank (Doing Business)
5.5 Ease of Closing a Business
5.5.1 Time [Years] - This data series provides the average number of years necessary to close a business in a country. Time is recorded in calendar years. Information is collected on the sequence of procedures and on whether any procedures can be carried out simultaneously. Potential delaying tactics by the parties, such as the filing of dilatory appeals or requests for extension, are taken into consideration.
World Bank (Doing Business)
5.5.2 Cost [% of Estate]
- This data series provides the average costs of closing a business in a country. The cost of the proceedings is recorded as a percentage of the estate’s value. The cost is calculated on the basis of survey responses by insolvency practitioners and includes court fees as well as fees of insolvency practitioners, independent assessors, lawyers and accountants. Respondents provide cost estimates from among the following options: less than 2%, 2–5%, 5–8%, 8–11%, 11–18%, 18–25%, 25–33%, 33–50%, 50–75% and more than 75% of the value of the business estate.
World Bank (Doing Business)
5.5.3 Recovery Rate [Cents on US$]
[Cents on US$]
+ The recovery rate is recorded as cents on the dollar recouped by creditors through the bankruptcy or insolvency proceedings. The calculation takes into account whether the business emerges from the proceedings as a going concern as well as costs and the loss in value due to the time spent closing down. If the business keeps operating, no value is
World Bank (Doing Business)
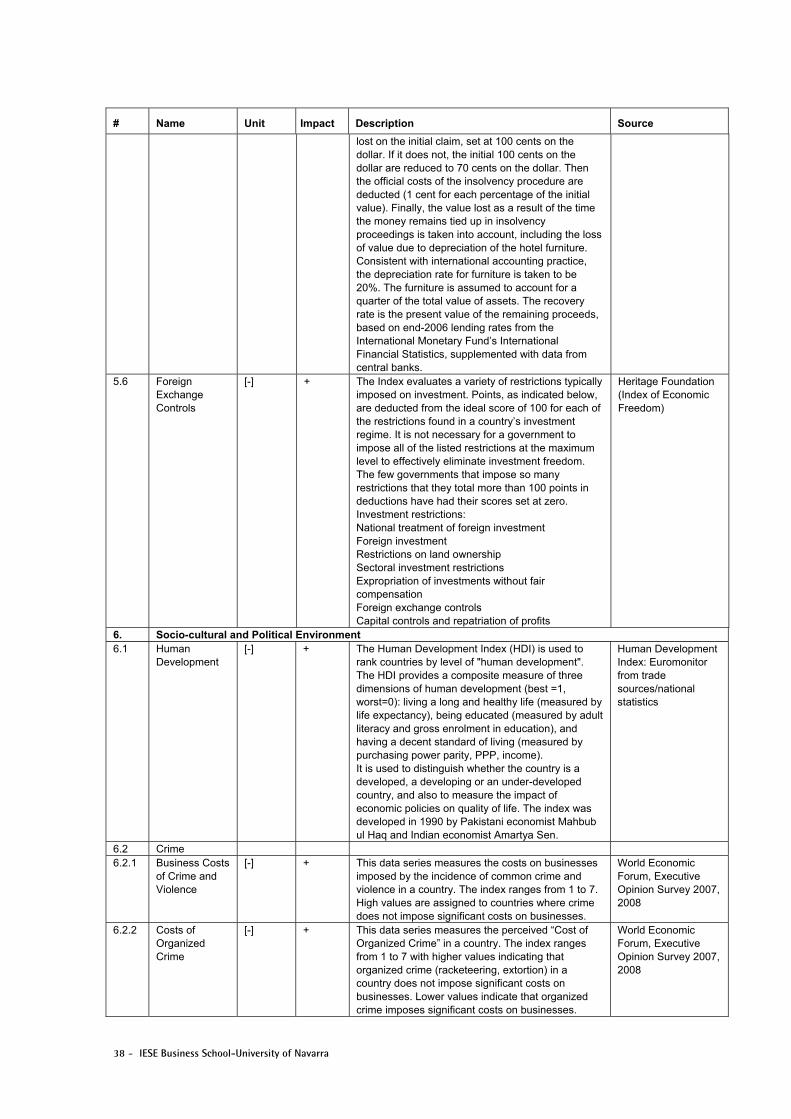
38 - IESE Business School-University of Navarra
# Name Unit Impact Description Source
lost on the initial claim, set at 100 cents on the dollar. If it does not, the initial 100 cents on the dollar are reduced to 70 cents on the dollar. Then the official costs of the insolvency procedure are deducted (1 cent for each percentage of the initial value). Finally, the value lost as a result of the time the money remains tied up in insolvency proceedings is taken into account, including the loss of value due to depreciation of the hotel furniture. Consistent with international accounting practice, the depreciation rate for furniture is taken to be 20%. The furniture is assumed to account for a quarter of the total value of assets. The recovery rate is the present value of the remaining proceeds, based on end-2006 lending rates from the International Monetary Fund’s International Financial Statistics, supplemented with data from central banks.
5.6 Foreign Exchange Controls
[-] + The Index evaluates a variety of restrictions typically imposed on investment. Points, as indicated below, are deducted from the ideal score of 100 for each of the restrictions found in a country’s investment regime. It is not necessary for a government to impose all of the listed restrictions at the maximum level to effectively eliminate investment freedom. The few governments that impose so many restrictions that they total more than 100 points in deductions have had their scores set at zero. Investment restrictions: National treatment of foreign investment Foreign investment Restrictions on land ownership Sectoral investment restrictions Expropriation of investments without fair compensation Foreign exchange controls Capital controls and repatriation of profits
Heritage Foundation (Index of Economic Freedom)
6. Socio-cultural and Political Environment 6.1 Human
Development [-] + The Human Development Index (HDI) is used to
rank countries by level of "human development". The HDI provides a composite measure of three dimensions of human development (best =1, worst=0): living a long and healthy life (measured by life expectancy), being educated (measured by adult literacy and gross enrolment in education), and having a decent standard of living (measured by purchasing power parity, PPP, income). It is used to distinguish whether the country is a developed, a developing or an under-developed country, and also to measure the impact of economic policies on quality of life. The index was developed in 1990 by Pakistani economist Mahbub ul Haq and Indian economist Amartya Sen.
Human Development Index: Euromonitor from trade sources/national statistics
6.2 Crime 6.2.1 Business Costs
of Crime and Violence
[-] + This data series measures the costs on businesses imposed by the incidence of common crime and violence in a country. The index ranges from 1 to 7. High values are assigned to countries where crime does not impose significant costs on businesses.
World Economic Forum, Executive Opinion Survey 2007, 2008
6.2.2 Costs of Organized Crime
[-] + This data series measures the perceived “Cost of Organized Crime” in a country. The index ranges from 1 to 7 with higher values indicating that organized crime (racketeering, extortion) in a country does not impose significant costs on businesses. Lower values indicate that organized crime imposes significant costs on businesses.
World Economic Forum, Executive Opinion Survey 2007, 2008
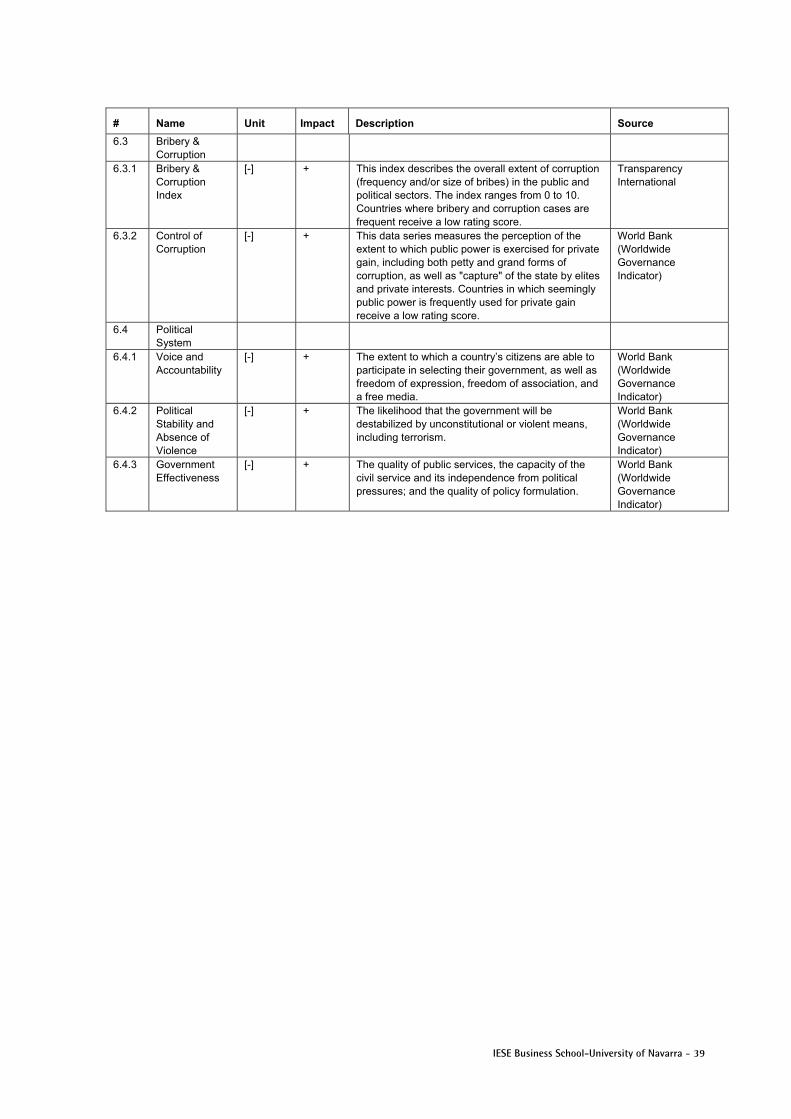
IESE Business School-University of Navarra - 39
# Name Unit Impact Description Source
6.3 Bribery & Corruption
6.3.1 Bribery & Corruption Index
[-] + This index describes the overall extent of corruption (frequency and/or size of bribes) in the public and political sectors. The index ranges from 0 to 10. Countries where bribery and corruption cases are frequent receive a low rating score.
Transparency International
6.3.2 Control of Corruption
[-] + This data series measures the perception of the extent to which public power is exercised for private gain, including both petty and grand forms of corruption, as well as "capture" of the state by elites and private interests. Countries in which seemingly public power is frequently used for private gain receive a low rating score.
World Bank (Worldwide Governance Indicator)
6.4 Political System
6.4.1 Voice and Accountability
[-] + The extent to which a country’s citizens are able to participate in selecting their government, as well as freedom of expression, freedom of association, and a free media.
World Bank (Worldwide Governance Indicator)
6.4.2 Political Stability and Absence of Violence
[-] + The likelihood that the government will be destabilized by unconstitutional or violent means, including terrorism.
World Bank (Worldwide Governance Indicator)
6.4.3 Government Effectiveness
[-] + The quality of public services, the capacity of the civil service and its independence from political pressures; and the quality of policy formulation.
World Bank (Worldwide Governance Indicator)
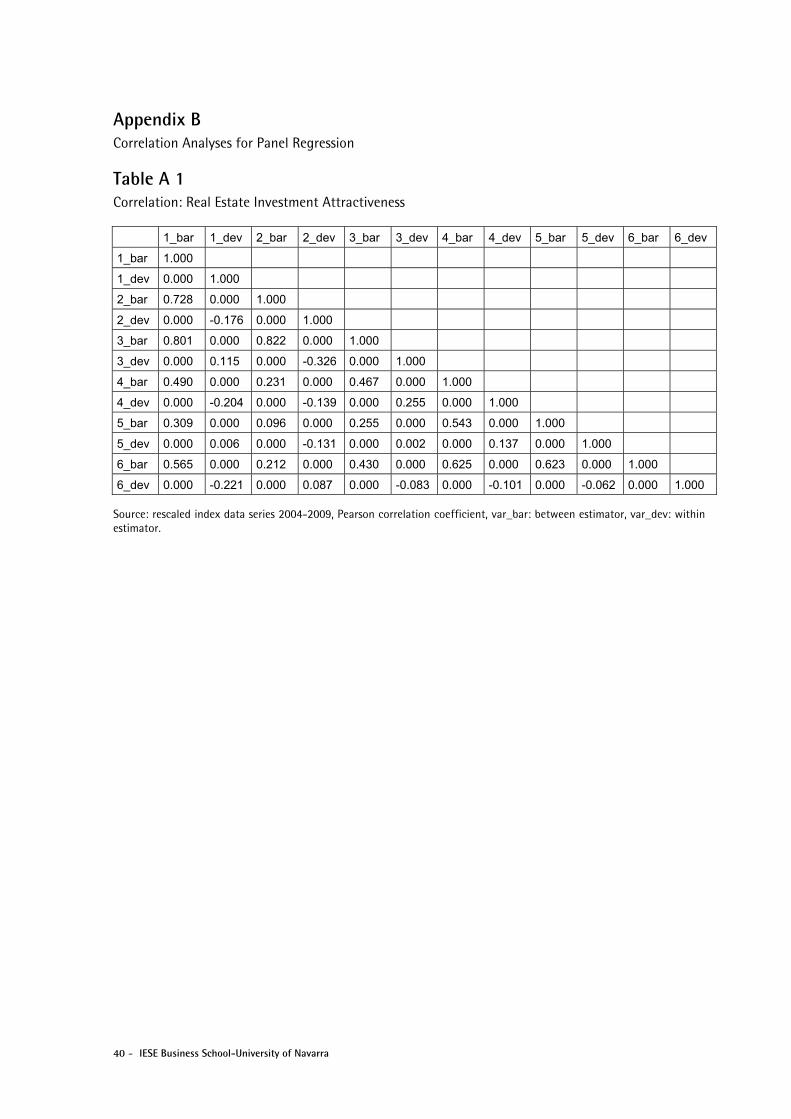
40 - IESE Business School-University of Navarra
Appendix B Correlation Analyses for Panel Regression
Table A 1 Correlation: Real Estate Investment Attractiveness
1_bar 1_dev 2_bar 2_dev 3_bar 3_dev 4_bar 4_dev 5_bar 5_dev 6_bar 6_dev
1_bar 1.000
1_dev 0.000 1.000
2_bar 0.728 0.000 1.000
2_dev 0.000 -0.176 0.000 1.000
3_bar 0.801 0.000 0.822 0.000 1.000
3_dev 0.000 0.115 0.000 -0.326 0.000 1.000
4_bar 0.490 0.000 0.231 0.000 0.467 0.000 1.000
4_dev 0.000 -0.204 0.000 -0.139 0.000 0.255 0.000 1.000
5_bar 0.309 0.000 0.096 0.000 0.255 0.000 0.543 0.000 1.000
5_dev 0.000 0.006 0.000 -0.131 0.000 0.002 0.000 0.137 0.000 1.000
6_bar 0.565 0.000 0.212 0.000 0.430 0.000 0.625 0.000 0.623 0.000 1.000
6_dev 0.000 -0.221 0.000 0.087 0.000 -0.083 0.000 -0.101 0.000 -0.062 0.000 1.000
Source: rescaled index data series 2004-2009, Pearson correlation coefficient, var_bar: between estimator, var_dev: within estimator.

IESE Business School-University of Navarra - 41
Table A 2 Correlation: Economic Activity
1_ba
r
1_de
v
1.1_
bar
1.1_
dev
1.2_
bar
1.2_
dev
1.3_
bar
1.3_
dev
1.4_
bar
1.4_
dev
1.5_
bar
1.5_
dev
1.6_
bar
1.6_
dev
1_ba
r
1.00
0
1_de
v
0.00
0
1.00
0
1.1_
bar
0.89
1
0.00
0
1.00
0
1.1_
dev
0.00
0
-0.1
44
0.00
0
1.00
0
1.2_
bar
0.64
3
0.00
0
0.33
9
0.00
0
1.00
0
1.2_
dev
0.00
0
0.12
8
0.00
0
0.76
9
0.00
0
1.00
0
1.3_
bar
-0.5
28
0.00
0
-0.3
92
0.00
0
-0.6
21
0.00
0
1.00
0
1.3_
dev
0.00
0
0.02
4
0.00
0
0.15
7
0.00
0
0.13
8
0.00
0
1.00
0
1.4_
bar
0.43
3
0.00
0
0.24
4
0.00
0
0.37
1
0.00
0
-0.0
70
0.00
0
1.00
0
1.4_
dev
0.00
0
-0.0
95
0.00
0
0.16
2
0.00
0
0.26
1
0.00
0
0.47
3
0.00
0
1.00
0
1.5_
bar
0.61
9
0.00
0
0.32
2
0.00
0
0.62
0
0.00
0
-0.5
52
0.00
0
0.32
7
0.00
0
1.00
0
1.5_
dev
0.00
0
0.31
1
0.00
0
0.03
9
0.00
0
0.13
3
0.00
0
-0.0
89
0.00
0
-0.1
57
0.00
0
1.00
0
1.6_
bar
0.86
5
0.00
0
0.61
8
0.00
0
0.75
0
0.00
0
-0.5
42
0.00
0
0.34
1
0.00
0
0.65
9
0.00
0
1.00
0
1.6_
dev
0.00
0
0.42
6
0.00
0
-0.3
13
0.00
0
-0.0
17
0.00
0
-0.0
24
0.00
0
0.02
1
0.00
0
0.22
7
0.00
0
1.00
0
1_ba
r
1_de
v
1.1_
bar
1.1_
dev
1.2_
bar
1.2_
dev
1.3_
bar
1.3_
dev
1.4_
bar
1.4_
dev
1.5_
bar
1.5_
dev
1.6_
bar
1.6_
dev
Source: rescaled index data series 2004-2009, Pearson correlation coefficient, var_bar: between estimator, var_dev: within estimator.
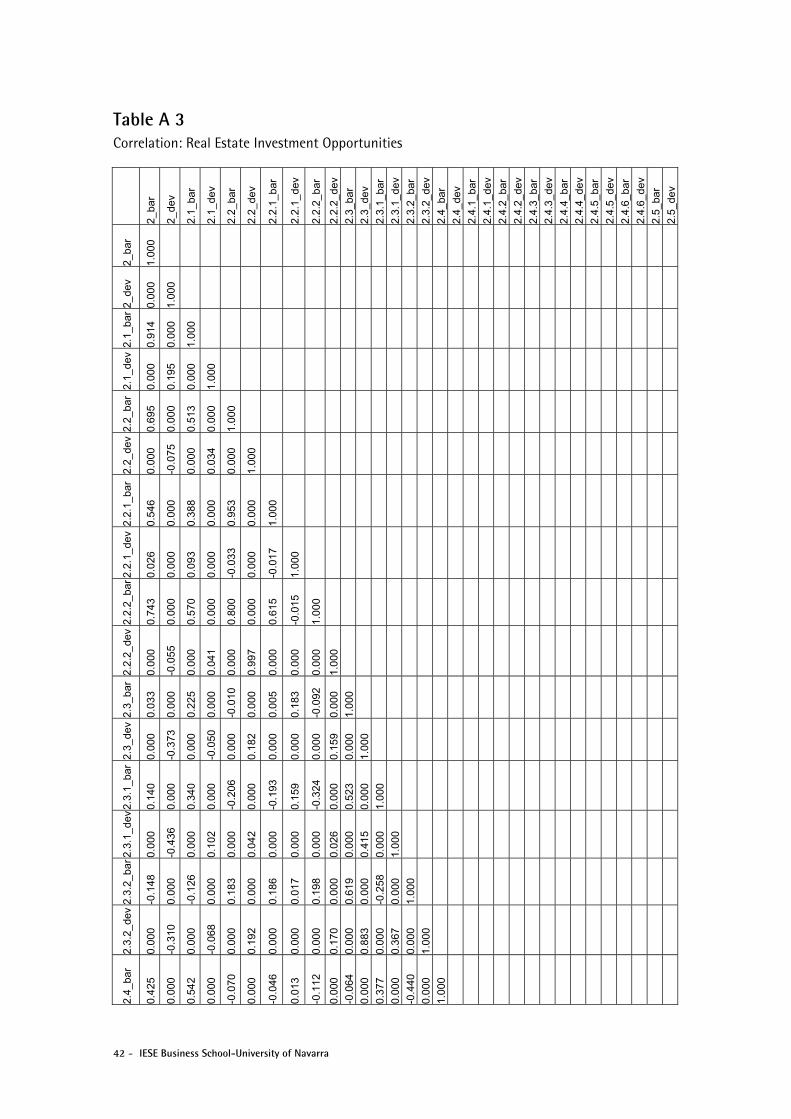
42 - IESE Business School-University of Navarra
Table A 3 Correlation: Real Estate Investment Opportunities
2_ba
r
2_de
v
2.1_
bar
2.1_
dev
2.2_
bar
2.2_
dev
2.2.
1_ba
r
2.2.
1_de
v
2.2.
2_ba
r
2.2.
2_de
v
2.3_
bar
2.3_
dev
2.3.
1_ba
r
2.3.
1_de
v
2.3.
2_ba
r
2.3.
2_de
v
2.4_
bar
2.4_
dev
2.4.
1_ba
r
2.4.
1_de
v
2.4.
2_ba
r
2.4.
2_de
v
2.4.
3_ba
r
2.4.
3_de
v
2.4.
4_ba
r
2.4.
4_de
v
2.4.
5_ba
r
2.4.
5_de
v
2.4.
6_ba
r
2.4.
6_de
v
2.5_
bar
2.5_
dev
2_ba
r
1.00
0
2_de
v
0.00
0
1.00
0
2.1_
bar
0.91
4
0.00
0
1.00
0
2.1_
dev
0.00
0
0.19
5
0.00
0
1.00
0
2.2_
bar
0.69
5
0.00
0
0.51
3
0.00
0
1.00
0
2.2_
dev
0.00
0
-0.0
75
0.00
0
0.03
4
0.00
0
1.00
0
2.2.
1_ba
r
0.54
6
0.00
0
0.38
8
0.00
0
0.95
3
0.00
0
1.00
0
2.2.
1_de
v
0.02
6
0.00
0
0.09
3
0.00
0
-0.0
33
0.00
0
-0.0
17
1.00
0
2.2.
2_ba
r
0.74
3
0.00
0
0.57
0
0.00
0
0.80
0
0.00
0
0.61
5
-0.0
15
1.00
0
2.2.
2_de
v
0.00
0
-0.0
55
0.00
0
0.04
1
0.00
0
0.99
7
0.00
0
0.00
0
0.00
0
1.00
0
2.3_
bar
0.03
3
0.00
0
0.22
5
0.00
0
-0.0
10
0.00
0
0.00
5
0.18
3
-0.0
92
0.00
0
1.00
0
2.3_
dev
0.00
0
-0.3
73
0.00
0
-0.0
50
0.00
0
0.18
2
0.00
0
0.00
0
0.00
0
0.15
9
0.00
0
1.00
0
2.3.
1_ba
r
0.14
0
0.00
0
0.34
0
0.00
0
-0.2
06
0.00
0
-0.1
93
0.15
9
-0.3
24
0.00
0
0.52
3
0.00
0
1.00
0
2.3.
1_de
v
0.00
0
-0.4
36
0.00
0
0.10
2
0.00
0
0.04
2
0.00
0
0.00
0
0.00
0
0.02
6
0.00
0
0.41
5
0.00
0
1.00
0
2.3.
2_ba
r
-0.1
48
0.00
0
-0.1
26
0.00
0
0.18
3
0.00
0
0.18
6
0.01
7
0.19
8
0.00
0
0.61
9
0.00
0
-0.2
58
0.00
0
1.00
0
2.3.
2_de
v
0.00
0
-0.3
10
0.00
0
-0.0
68
0.00
0
0.19
2
0.00
0
0.00
0
0.00
0
0.17
0
0.00
0
0.88
3
0.00
0
0.36
7
0.00
0
1.00
0
2.4_
bar
0.42
5
0.00
0
0.54
2
0.00
0
-0.0
70
0.00
0
-0.0
46
0.01
3
-0.1
12
0.00
0
-0.0
64
0.00
0
0.37
7
0.00
0
-0.4
40
0.00
0
1.00
0
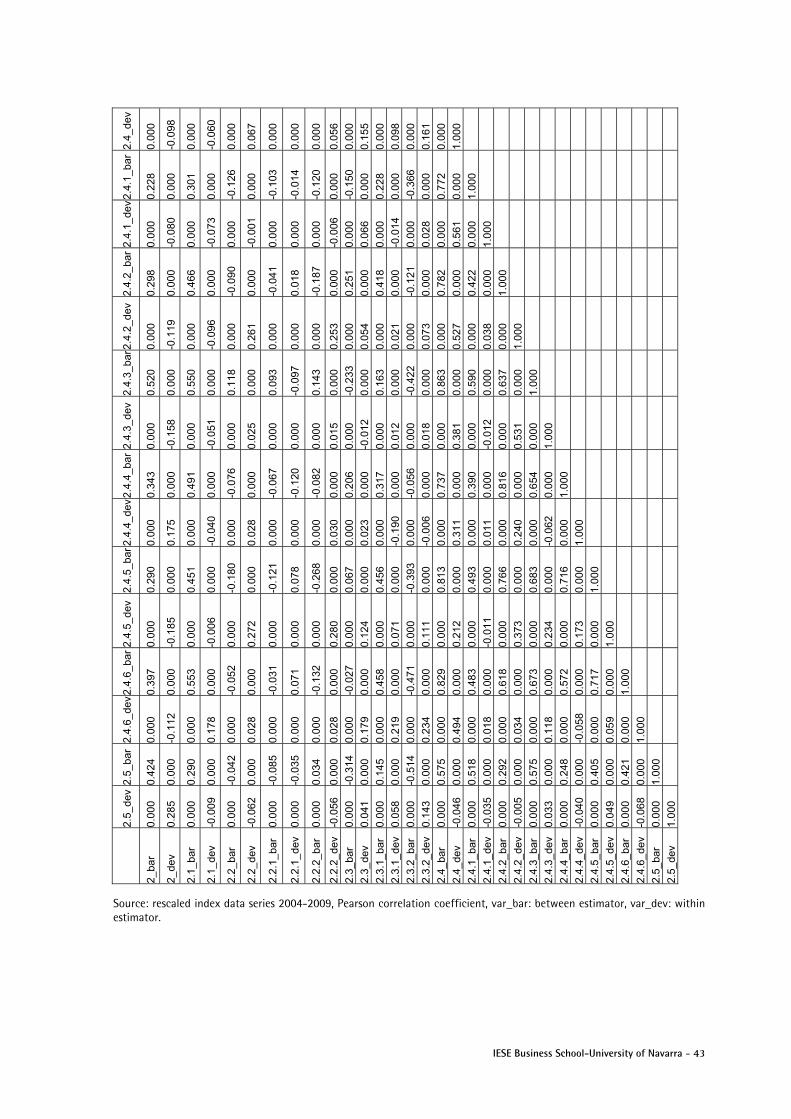
IESE Business School-University of Navarra - 43
2.4_
dev
0.00
0
-0.0
98
0.00
0
-0.0
60
0.00
0
0.06
7
0.00
0
0.00
0
0.00
0
0.05
6
0.00
0
0.15
5
0.00
0
0.09
8
0.00
0
0.16
1
0.00
0
1.00
0
2.4.
1_ba
r
0.22
8
0.00
0
0.30
1
0.00
0
-0.1
26
0.00
0
-0.1
03
-0.0
14
-0.1
20
0.00
0
-0.1
50
0.00
0
0.22
8
0.00
0
-0.3
66
0.00
0
0.77
2
0.00
0
1.00
0
2.4.
1_de
v
0.00
0
-0.0
80
0.00
0
-0.0
73
0.00
0
-0.0
01
0.00
0
0.00
0
0.00
0
-0.0
06
0.00
0
0.06
6
0.00
0
-0.0
14
0.00
0
0.02
8
0.00
0
0.56
1
0.00
0
1.00
0
2.4.
2_ba
r
0.29
8
0.00
0
0.46
6
0.00
0
-0.0
90
0.00
0
-0.0
41
0.01
8
-0.1
87
0.00
0
0.25
1
0.00
0
0.41
8
0.00
0
-0.1
21
0.00
0
0.78
2
0.00
0
0.42
2
0.00
0
1.00
0
2.4.
2_de
v
0.00
0
-0.1
19
0.00
0
-0.0
96
0.00
0
0.26
1
0.00
0
0.00
0
0.00
0
0.25
3
0.00
0
0.05
4
0.00
0
0.02
1
0.00
0
0.07
3
0.00
0
0.52
7
0.00
0
0.03
8
0.00
0
1.00
0
2.4.
3_ba
r
0.52
0
0.00
0
0.55
0
0.00
0
0.11
8
0.00
0
0.09
3
-0.0
97
0.14
3
0.00
0
-0.2
33
0.00
0
0.16
3
0.00
0
-0.4
22
0.00
0
0.86
3
0.00
0
0.59
0
0.00
0
0.63
7
0.00
0
1.00
0
2.4.
3_de
v
0.00
0
-0.1
58
0.00
0
-0.0
51
0.00
0
0.02
5
0.00
0
0.00
0
0.00
0
0.01
5
0.00
0
-0.0
12
0.00
0
0.01
2
0.00
0
0.01
8
0.00
0
0.38
1
0.00
0
-0.0
12
0.00
0
0.53
1
0.00
0
1.00
0
2.4.
4_ba
r
0.34
3
0.00
0
0.49
1
0.00
0
-0.0
76
0.00
0
-0.0
67
-0.1
20
-0.0
82
0.00
0
0.20
6
0.00
0
0.31
7
0.00
0
-0.0
56
0.00
0
0.73
7
0.00
0
0.39
0
0.00
0
0.81
6
0.00
0
0.65
4
0.00
0
1.00
0
2.4.
4_de
v
0.00
0
0.17
5
0.00
0
-0.0
40
0.00
0
0.02
8
0.00
0
0.00
0
0.00
0
0.03
0
0.00
0
0.02
3
0.00
0
-0.1
90
0.00
0
-0.0
06
0.00
0
0.31
1
0.00
0
0.01
1
0.00
0
0.24
0
0.00
0
-0.0
62
0.00
0
1.00
0
2.4.
5_ba
r
0.29
0
0.00
0
0.45
1
0.00
0
-0.1
80
0.00
0
-0.1
21
0.07
8
-0.2
68
0.00
0
0.06
7
0.00
0
0.45
6
0.00
0
-0.3
93
0.00
0
0.81
3
0.00
0
0.49
3
0.00
0
0.76
6
0.00
0
0.68
3
0.00
0
0.71
6
0.00
0
1.00
0
2.4.
5_de
v
0.00
0
-0.1
85
0.00
0
-0.0
06
0.00
0
0.27
2
0.00
0
0.00
0
0.00
0
0.28
0
0.00
0
0.12
4
0.00
0
0.07
1
0.00
0
0.11
1
0.00
0
0.21
2
0.00
0
-0.0
11
0.00
0
0.37
3
0.00
0
0.23
4
0.00
0
0.17
3
0.00
0
1.00
0
2.4.
6_ba
r
0.39
7
0.00
0
0.55
3
0.00
0
-0.0
52
0.00
0
-0.0
31
0.07
1
-0.1
32
0.00
0
-0.0
27
0.00
0
0.45
8
0.00
0
-0.4
71
0.00
0
0.82
9
0.00
0
0.48
3
0.00
0
0.61
8
0.00
0
0.67
3
0.00
0
0.57
2
0.00
0
0.71
7
0.00
0
1.00
0
2.4.
6_de
v
0.00
0
-0.1
12
0.00
0
0.17
8
0.00
0
0.02
8
0.00
0
0.00
0
0.00
0
0.02
8
0.00
0
0.17
9
0.00
0
0.21
9
0.00
0
0.23
4
0.00
0
0.49
4
0.00
0
0.01
8
0.00
0
0.03
4
0.00
0
0.11
8
0.00
0
-0.0
58
0.00
0
0.05
9
0.00
0
1.00
0
2.5_
bar
0.42
4
0.00
0
0.29
0
0.00
0
-0.0
42
0.00
0
-0.0
85
-0.0
35
0.03
4
0.00
0
-0.3
14
0.00
0
0.14
5
0.00
0
-0.5
14
0.00
0
0.57
5
0.00
0
0.51
8
0.00
0
0.29
2
0.00
0
0.57
5
0.00
0
0.24
8
0.00
0
0.40
5
0.00
0
0.42
1
0.00
0
1.00
0
2.5_
dev
0.00
0
0.28
5
0.00
0
-0.0
09
0.00
0
-0.0
62
0.00
0
0.00
0
0.00
0
-0.0
56
0.00
0
0.04
1
0.00
0
0.05
8
0.00
0
0.14
3
0.00
0
-0.0
46
0.00
0
-0.0
35
0.00
0
-0.0
05
0.00
0
0.03
3
0.00
0
-0.0
40
0.00
0
0.04
9
0.00
0
-0.0
68
0.00
0
1.00
0
2_ba
r
2_de
v
2.1_
bar
2.1_
dev
2.2_
bar
2.2_
dev
2.2.
1_ba
r
2.2.
1_de
v
2.2.
2_ba
r
2.2.
2_de
v
2.3_
bar
2.3_
dev
2.3.
1_ba
r
2.3.
1_de
v
2.3.
2_ba
r
2.3.
2_de
v
2.4_
bar
2.4_
dev
2.4.
1_ba
r
2.4.
1_de
v
2.4.
2_ba
r
2.4.
2_de
v
2.4.
3_ba
r
2.4.
3_de
v
2.4.
4_ba
r
2.4.
4_de
v
2.4.
5_ba
r
2.4.
5_de
v
2.4.
6_ba
r
2.4.
6_de
v
2.5_
bar
2.5_
dev
Source: rescaled index data series 2004-2009, Pearson correlation coefficient, var_bar: between estimator, var_dev: within estimator.
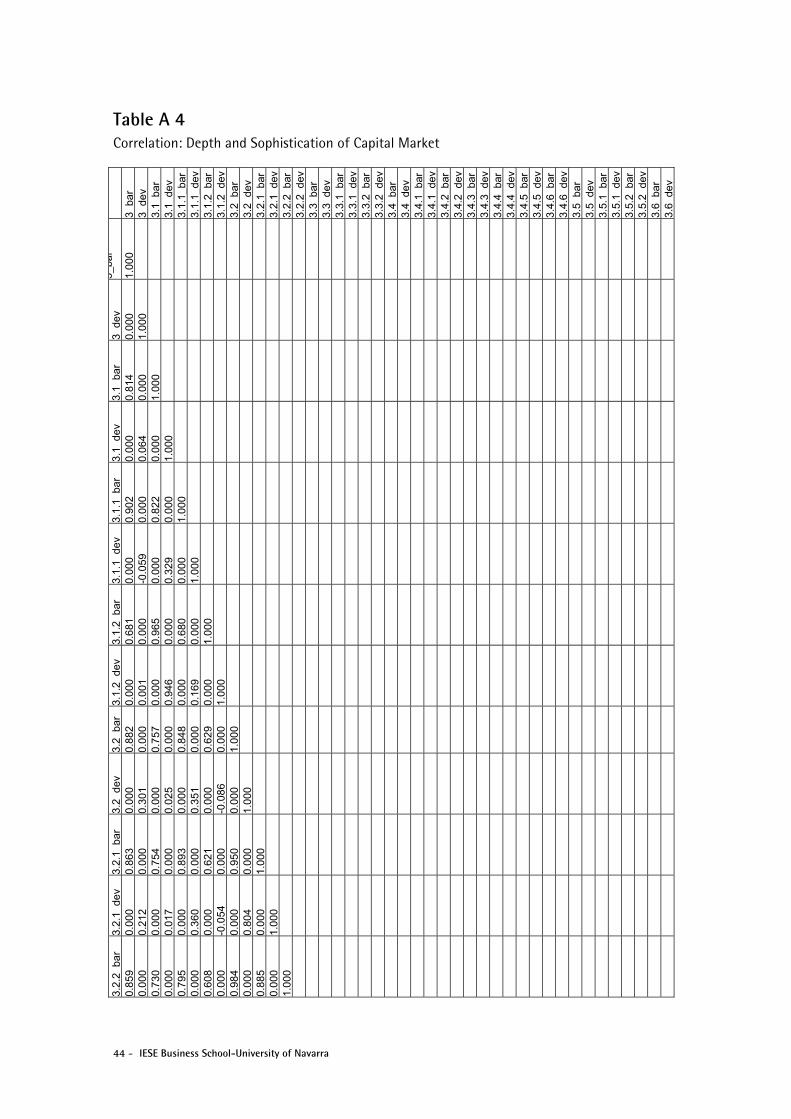
44 - IESE Business School-University of Navarra
Table A 4 Correlation: Depth and Sophistication of Capital Market
3_ba
r 3_
dev
3.1_
bar
3.1 _
dev
3.1.
1 _ba
r 3.
1.1 _
dev
3.1.
2 _ba
r 3.
1.2 _
dev
3.2
bar
3.2_
dev
3.2.
1_ba
r 3.
2.1
dev
3.2.
2_ba
r 3.
2.2
dev
3.3_
bar
3.3_
dev
3.3.
1ba
r 3.
3.1_
dev
3.3.
2ba
r 3.
3.2_
dev
3.4_
bar
3.4
dev
3.4.
1_ba
r 3.
4.1
dev
3.4.
2_ba
r 3.
4.2_
dev
3.4.
3ba
r 3.
4.3_
dev
3.4.
4ba
r 3.
4.4_
dev
3.4.
5_ba
r 3.
4.5
dev
3.4.
6_ba
r 3.
4.6
dev
3.5_
bar
3.5_
dev
3.5.
1ba
r 3.
5.1_
dev
3.5.
2ba
r 3.
5.2_
dev
3.6_
bar
3.6
dev
3_ba
r
1.00
0
3_de
v 0.
000
1.00
0
3.1_
bar
0.81
4 0.
000
1.00
0
3.1_
dev
0.00
0 0.
064
0.00
0 1.
000
3.1.
1_ba
r 0.
902
0.00
0 0.
822
0.00
0 1.
000
3.1.
1_de
v 0.
000
-0.0
59
0.00
0 0.
329
0.00
0 1.
000
3.1.
2_ba
r 0.
681
0.00
0 0.
965
0.00
0 0.
680
0.00
0 1.
000
3.1.
2_de
v 0.
000
0.00
1 0.
000
0.94
6 0.
000
0.16
9 0.
000
1.00
0
3.2_
bar
0.88
2 0.
000
0.75
7 0.
000
0.84
8 0.
000
0.62
9 0.
000
1.00
0
3.2_
dev
0.00
0 0.
301
0.00
0 0.
025
0.00
0 0.
351
0.00
0 -0
.086
0.
000
1.00
0
3.2.
1_ba
r 0.
863
0.00
0 0.
754
0.00
0 0.
893
0.00
0 0.
621
0.00
0 0.
950
0.00
0 1.
000
3.2.
1_de
v 0.
000
0.21
2 0.
000
0.01
7 0.
000
0.36
0 0.
000
-0.0
54
0.00
0 0.
804
0.00
0 1.
000
3.2.
2_ba
r 0.
859
0.00
0 0.
730
0.00
0 0.
795
0.00
0 0.
608
0.00
0 0.
984
0.00
0 0.
885
0.00
0 1.
000
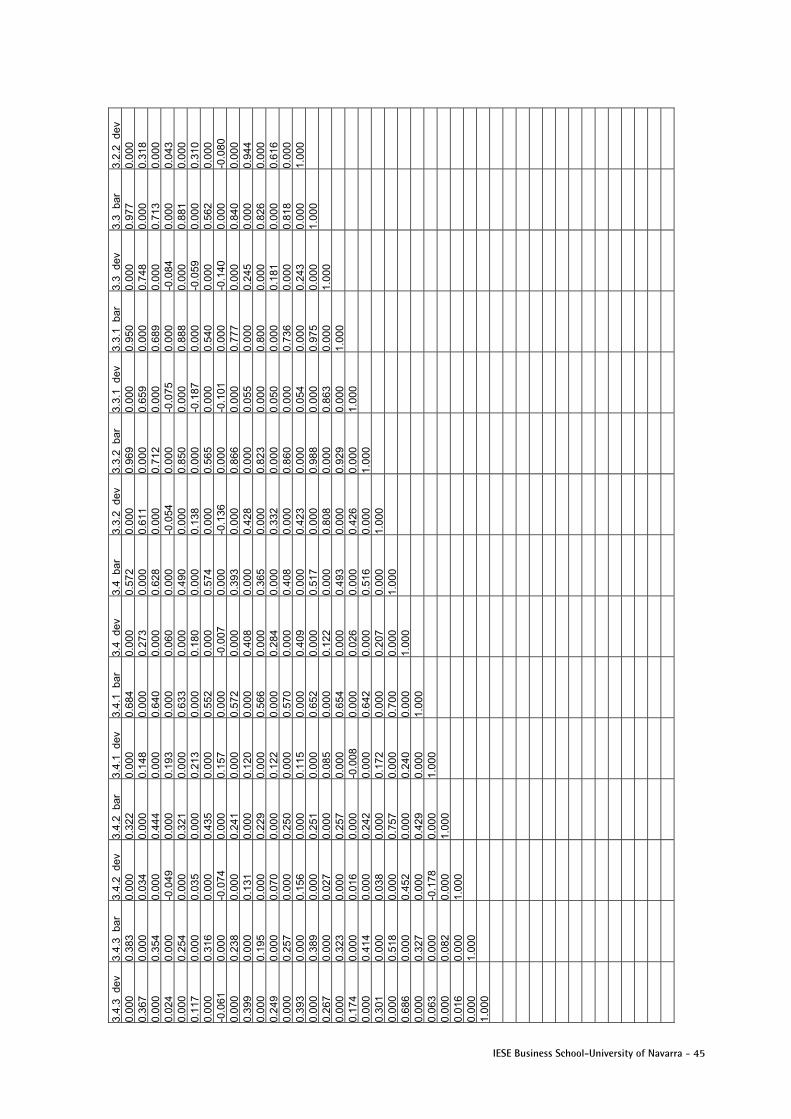
IESE Business School-University of Navarra - 45
3.2.
2_de
v 0.
000
0.31
8 0.
000
0.04
3 0.
000
0.31
0 0.
000
-0.0
80
0.00
0 0.
944
0.00
0 0.
616
0.00
0 1.
000
3.3_
bar
0.97
7 0.
000
0.71
3 0.
000
0.88
1 0.
000
0.56
2 0.
000
0.84
0 0.
000
0.82
6 0.
000
0.81
8 0.
000
1.00
0
3.3_
dev
0.00
0 0.
748
0.00
0 -0
.084
0.
000
-0.0
59
0.00
0 -0
.140
0.
000
0.24
5 0.
000
0.18
1 0.
000
0.24
3 0.
000
1.00
0
3.3.
1_ba
r 0.
950
0.00
0 0.
689
0.00
0 0.
888
0.00
0 0.
540
0.00
0 0.
777
0.00
0 0.
800
0.00
0 0.
736
0.00
0 0.
975
0.00
0 1.
000
3.3.
1_de
v 0.
000
0.65
9 0.
000
-0.0
75
0.00
0 -0
.187
0.
000
-0.1
01
0.00
0 0.
055
0.00
0 0.
050
0.00
0 0.
054
0.00
0 0.
863
0.00
0 1.
000
3.3.
2_ba
r 0.
969
0.00
0 0.
712
0.00
0 0.
850
0.00
0 0.
565
0.00
0 0.
866
0.00
0 0.
823
0.00
0 0.
860
0.00
0 0.
988
0.00
0 0.
929
0.00
0 1.
000
3.3.
2_de
v 0.
000
0.61
1 0.
000
-0.0
54
0.00
0 0.
138
0.00
0 -0
.136
0.
000
0.42
8 0.
000
0.33
2 0.
000
0.42
3 0.
000
0.80
8 0.
000
0.42
6 0.
000
1.00
0
3.4_
bar
0.57
2 0.
000
0.62
8 0.
000
0.49
0 0.
000
0.57
4 0.
000
0.39
3 0.
000
0.36
5 0.
000
0.40
8 0.
000
0.51
7 0.
000
0.49
3 0.
000
0.51
6 0.
000
1.00
0
3.4_
dev
0.00
0 0.
273
0.00
0 0.
060
0.00
0 0.
180
0.00
0 -0
.007
0.
000
0.40
8 0.
000
0.28
4 0.
000
0.40
9 0.
000
0.12
2 0.
000
0.02
6 0.
000
0.20
7 0.
000
1.00
0
3.4.
1_ba
r 0.
684
0.00
0 0.
640
0.00
0 0.
633
0.00
0 0.
552
0.00
0 0.
572
0.00
0 0.
566
0.00
0 0.
570
0.00
0 0.
652
0.00
0 0.
654
0.00
0 0.
642
0.00
0 0.
700
0.00
0 1.
000
3.4.
1_de
v 0.
000
0.14
8 0.
000
0.19
3 0.
000
0.21
3 0.
000
0.15
7 0.
000
0.12
0 0.
000
0.12
2 0.
000
0.11
5 0.
000
0.08
5 0.
000
-0.0
08
0.00
0 0.
172
0.00
0 0.
240
0.00
0 1.
000
3.4.
2_ba
r 0.
322
0.00
0 0.
444
0.00
0 0.
321
0.00
0 0.
435
0.00
0 0.
241
0.00
0 0.
229
0.00
0 0.
250
0.00
0 0.
251
0.00
0 0.
257
0.00
0 0.
242
0.00
0 0.
757
0.00
0 0.
429
0.00
0 1.
000
3.4.
2_de
v 0.
000
0.03
4 0.
000
-0.0
49
0.00
0 0.
035
0.00
0 -0
.074
0.
000
0.13
1 0.
000
0.07
0 0.
000
0.15
6 0.
000
0.02
7 0.
000
0.01
6 0.
000
0.03
8 0.
000
0.45
2 0.
000
-0.1
78
0.00
0 1.
000
3.4.
3_ba
r 0.
383
0.00
0 0.
354
0.00
0 0.
254
0.00
0 0.
316
0.00
0 0.
238
0.00
0 0.
195
0.00
0 0.
257
0.00
0 0.
389
0.00
0 0.
323
0.00
0 0.
414
0.00
0 0.
518
0.00
0 0.
327
0.00
0 0.
082
0.00
0 1.
000
3.4.
3_de
v 0.
000
0.36
7 0.
000
0.02
4 0.
000
0.11
7 0.
000
-0.0
61
0.00
0 0.
399
0.00
0 0.
249
0.00
0 0.
393
0.00
0 0.
267
0.00
0 0.
174
0.00
0 0.
301
0.00
0 0.
686
0.00
0 0.
063
0.00
0 0.
016
0.00
0 1.
000
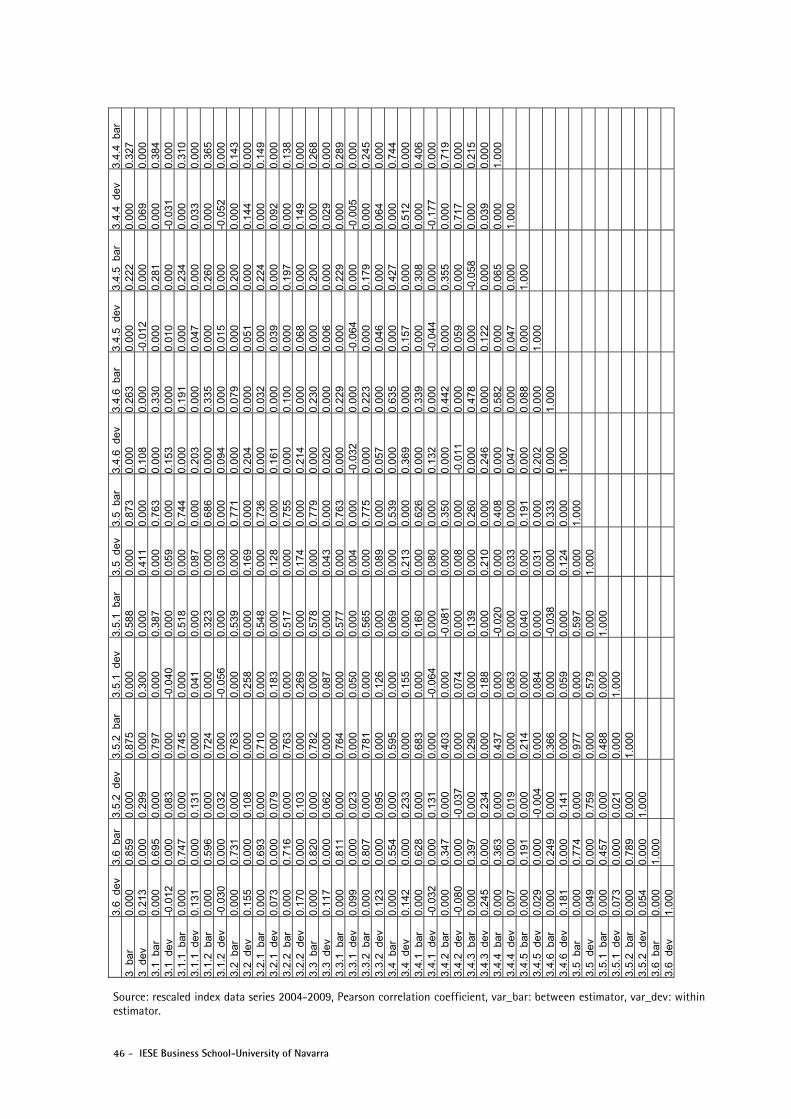
46 - IESE Business School-University of Navarra
3.4.
4_ba
r 0.
327
0.00
0 0.
384
0.00
0 0.
310
0.00
0 0.
365
0.00
0 0.
143
0.00
0 0.
149
0.00
0 0.
138
0.00
0 0.
268
0.00
0 0.
289
0.00
0 0.
245
0.00
0 0.
744
0.00
0 0.
406
0.00
0 0.
719
0.00
0 0.
215
0.00
0 1.
000
3.4.
4_de
v 0.
000
0.06
9 0.
000
-0.0
31
0.00
0 0.
033
0.00
0 -0
.052
0.
000
0.14
4 0.
000
0.09
2 0.
000
0.14
9 0.
000
0.02
9 0.
000
-0.0
05
0.00
0 0.
064
0.00
0 0.
512
0.00
0 -0
.177
0.
000
0.71
7 0.
000
0.03
9 0.
000
1.00
0
3.4.
5_ba
r 0.
222
0.00
0 0.
281
0.00
0 0.
234
0.00
0 0.
260
0.00
0 0.
200
0.00
0 0.
224
0.00
0 0.
197
0.00
0 0.
200
0.00
0 0.
229
0.00
0 0.
179
0.00
0 0.
427
0.00
0 0.
308
0.00
0 0.
355
0.00
0 -0
.058
0.
000
0.06
5 0.
000
1.00
0
3.4.
5_de
v 0.
000
-0.0
12
0.00
0 0.
010
0.00
0 0.
047
0.00
0 0.
015
0.00
0 0.
051
0.00
0 0.
039
0.00
0 0.
068
0.00
0 0.
006
0.00
0 -0
.064
0.
000
0.04
6 0.
000
0.15
7 0.
000
-0.0
44
0.00
0 0.
059
0.00
0 0.
122
0.00
0 0.
047
0.00
0 1.
000
3.4.
6_ba
r 0.
263
0.00
0 0.
330
0.00
0 0.
191
0.00
0 0.
335
0.00
0 0.
079
0.00
0 0.
032
0.00
0 0.
100
0.00
0 0.
230
0.00
0 0.
229
0.00
0 0.
223
0.00
0 0.
635
0.00
0 0.
339
0.00
0 0.
442
0.00
0 0.
478
0.00
0 0.
582
0.00
0 0.
088
0.00
0 1.
000
3.4.
6_de
v 0.
000
0.10
8 0.
000
0.15
3 0.
000
0.20
3 0.
000
0.09
4 0.
000
0.20
4 0.
000
0.16
1 0.
000
0.21
4 0.
000
0.02
0 0.
000
-0.0
32
0.00
0 0.
057
0.00
0 0.
369
0.00
0 0.
132
0.00
0 -0
.011
0.
000
0.24
6 0.
000
0.04
7 0.
000
0.20
2 0.
000
1.00
0
3.5_
bar
0.87
3 0.
000
0.76
3 0.
000
0.74
4 0.
000
0.68
6 0.
000
0.77
1 0.
000
0.73
6 0.
000
0.75
5 0.
000
0.77
9 0.
000
0.76
3 0.
000
0.77
5 0.
000
0.53
9 0.
000
0.62
6 0.
000
0.35
0 0.
000
0.26
0 0.
000
0.40
8 0.
000
0.19
1 0.
000
0.33
3 0.
000
1.00
0
3.5_
dev
0.00
0 0.
411
0.00
0 0.
059
0.00
0 0.
087
0.00
0 0.
030
0.00
0 0.
169
0.00
0 0.
128
0.00
0 0.
174
0.00
0 0.
043
0.00
0 0.
004
0.00
0 0.
089
0.00
0 0.
213
0.00
0 0.
080
0.00
0 0.
008
0.00
0 0.
210
0.00
0 0.
033
0.00
0 0.
031
0.00
0 0.
124
0.00
0 1.
000
3.5.
1_ba
r 0.
588
0.00
0 0.
387
0.00
0 0.
518
0.00
0 0.
323
0.00
0 0.
539
0.00
0 0.
548
0.00
0 0.
517
0.00
0 0.
578
0.00
0 0.
577
0.00
0 0.
565
0.00
0 0.
069
0.00
0 0.
160
0.00
0 -0
.081
0.
000
0.13
9 0.
000
-0.0
20
0.00
0 0.
040
0.00
0 -0
.038
0.
000
0.59
7 0.
000
1.00
0
3.5.
1_de
v 0.
000
0.30
0 0.
000
-0.0
40
0.00
0 0.
041
0.00
0 -0
.056
0.
000
0.25
8 0.
000
0.18
3 0.
000
0.26
9 0.
000
0.08
7 0.
000
0.05
0 0.
000
0.12
6 0.
000
0.15
5 0.
000
-0.0
64
0.00
0 0.
074
0.00
0 0.
188
0.00
0 0.
063
0.00
0 0.
084
0.00
0 0.
059
0.00
0 0.
579
0.00
0 1.
000
3.5.
2_ba
r 0.
875
0.00
0 0.
797
0.00
0 0.
745
0.00
0 0.
724
0.00
0 0.
763
0.00
0 0.
710
0.00
0 0.
763
0.00
0 0.
782
0.00
0 0.
764
0.00
0 0.
781
0.00
0 0.
595
0.00
0 0.
683
0.00
0 0.
403
0.00
0 0.
290
0.00
0 0.
437
0.00
0 0.
214
0.00
0 0.
366
0.00
0 0.
977
0.00
0 0.
488
0.00
0 1.
000
3.5.
2_de
v 0.
000
0.29
9 0.
000
0.08
3 0.
000
0.13
1 0.
000
0.03
2 0.
000
0.10
8 0.
000
0.07
9 0.
000
0.10
3 0.
000
0.06
2 0.
000
0.02
3 0.
000
0.09
5 0.
000
0.23
3 0.
000
0.13
1 0.
000
-0.0
37
0.00
0 0.
234
0.00
0 0.
019
0.00
0 -0
.004
0.
000
0.14
1 0.
000
0.75
9 0.
000
0.02
1 0.
000
1.00
0
3.6_
bar
0.85
9 0.
000
0.69
5 0.
000
0.74
7 0.
000
0.59
6 0.
000
0.73
1 0.
000
0.69
3 0.
000
0.71
6 0.
000
0.82
0 0.
000
0.81
1 0.
000
0.80
7 0.
000
0.55
4 0.
000
0.62
8 0.
000
0.34
7 0.
000
0.39
7 0.
000
0.36
3 0.
000
0.19
1 0.
000
0.24
9 0.
000
0.77
4 0.
000
0.45
7 0.
000
0.78
9 0.
000
1.00
0
3.6_
dev
0.00
0 0.
213
0.00
0 -0
.012
0.
000
0.13
1 0.
000
-0.0
30
0.00
0 0.
155
0.00
0 0.
073
0.00
0 0.
170
0.00
0 0.
117
0.00
0 0.
099
0.00
0 0.
123
0.00
0 0.
142
0.00
0 -0
.032
0.
000
-0.0
80
0.00
0 0.
245
0.00
0 0.
007
0.00
0 0.
029
0.00
0 0.
181
0.00
0 0.
049
0.00
0 0.
073
0.00
0 0.
054
0.00
0 1.
000
3 _ba
r 3 _
dev
3.1_
bar
3.1 _
dev
3.1.
1 _ba
r 3.
1.1 _
dev
3.1.
2 _ba
r 3.
1.2 _
dev
3.2
bar
3.2_
dev
3.2.
1_ba
r 3.
2.1
dev
3.2.
2_ba
r 3.
2.2
dev
3.3_
bar
3.3_
dev
3.3.
1ba
r 3.
3.1_
dev
3.3.
2ba
r 3.
3.2_
dev
3.4_
bar
3.4
dev
3.4.
1_ba
r 3.
4.1
dev
3.4.
2_ba
r 3.
4.2_
dev
3.4.
3ba
r 3.
4.3_
dev
3.4.
4ba
r 3.
4.4_
dev
3.4.
5_ba
r 3.
4.5
dev
3.4.
6_ba
r 3.
4.6
dev
3.5_
bar
3.5_
dev
3.5.
1ba
r 3.
5.1_
dev
3.5.
2ba
r 3.
5.2_
dev
3.6_
bar
3.6
dev
Source: rescaled index data series 2004-2009, Pearson correlation coefficient, var_bar: between estimator, var_dev: within estimator.
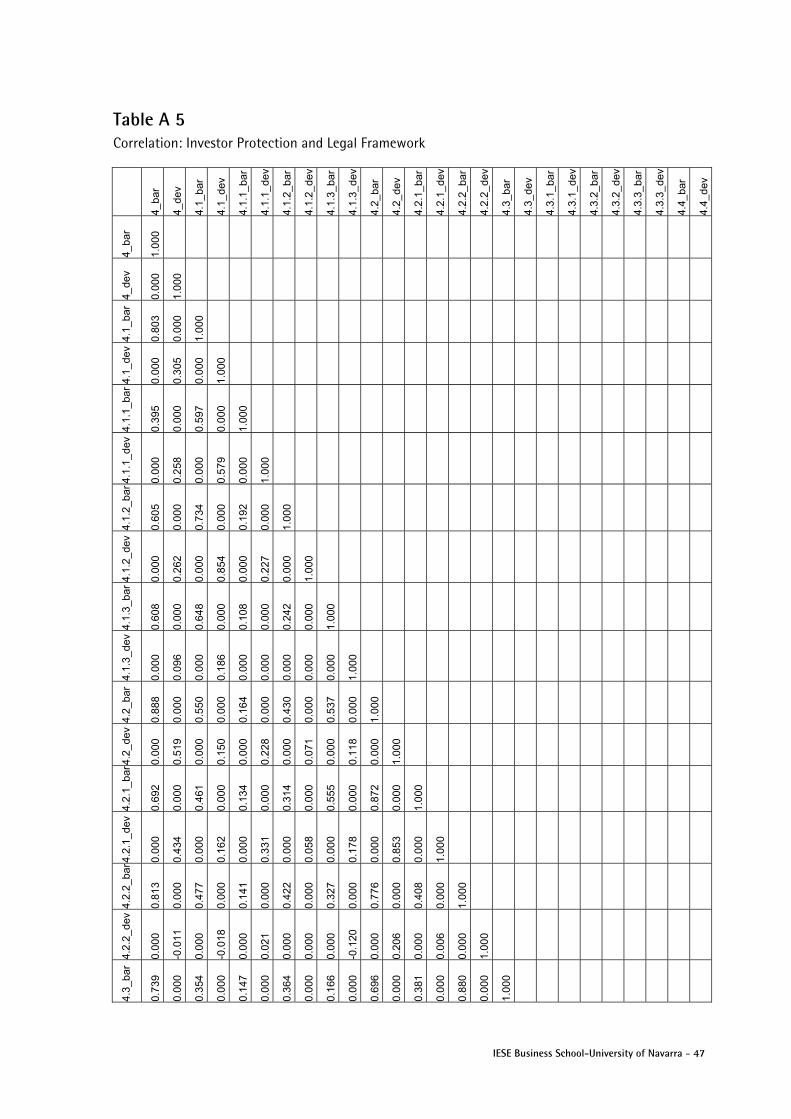
IESE Business School-University of Navarra - 47
Table A 5 Correlation: Investor Protection and Legal Framework
4_ba
r
4_de
v
4.1_
bar
4.1_
dev
4.1.
1_ba
r
4.1.
1_de
v
4.1.
2_ba
r
4.1.
2_de
v
4.1.
3_ba
r
4.1.
3_de
v
4.2_
bar
4.2_
dev
4.2.
1_ba
r
4.2.
1_de
v
4.2.
2_ba
r
4.2.
2_de
v
4.3_
bar
4.3_
dev
4.3.
1_ba
r
4.3.
1_de
v
4.3.
2_ba
r
4.3.
2_de
v
4.3.
3_ba
r
4.3.
3_de
v
4.4_
bar
4.4_
dev
4_ba
r
1.00
0
4_de
v
0.00
0
1.00
0
4.1_
bar
0.80
3
0.00
0
1.00
0
4.1_
dev
0.00
0
0.30
5
0.00
0
1.00
0
4.1.
1_ba
r
0.39
5
0.00
0
0.59
7
0.00
0
1.00
0
4.1.
1_de
v
0.00
0
0.25
8
0.00
0
0.57
9
0.00
0
1.00
0
4.1.
2_ba
r
0.60
5
0.00
0
0.73
4
0.00
0
0.19
2
0.00
0
1.00
0
4.1.
2_de
v
0.00
0
0.26
2
0.00
0
0.85
4
0.00
0
0.22
7
0.00
0
1.00
0
4.1.
3_ba
r
0.60
8
0.00
0
0.64
8
0.00
0
0.10
8
0.00
0
0.24
2
0.00
0
1.00
0
4.1.
3_de
v
0.00
0
0.09
6
0.00
0
0.18
6
0.00
0
0.00
0
0.00
0
0.00
0
0.00
0
1.00
0
4.2_
bar
0.88
8
0.00
0
0.55
0
0.00
0
0.16
4
0.00
0
0.43
0
0.00
0
0.53
7
0.00
0
1.00
0
4.2_
dev
0.00
0
0.51
9
0.00
0
0.15
0
0.00
0
0.22
8
0.00
0
0.07
1
0.00
0
0.11
8
0.00
0
1.00
0
4.2.
1_ba
r
0.69
2
0.00
0
0.46
1
0.00
0
0.13
4
0.00
0
0.31
4
0.00
0
0.55
5
0.00
0
0.87
2
0.00
0
1.00
0
4.2.
1_de
v
0.00
0
0.43
4
0.00
0
0.16
2
0.00
0
0.33
1
0.00
0
0.05
8
0.00
0
0.17
8
0.00
0
0.85
3
0.00
0
1.00
0
4.2.
2_ba
r
0.81
3
0.00
0
0.47
7
0.00
0
0.14
1
0.00
0
0.42
2
0.00
0
0.32
7
0.00
0
0.77
6
0.00
0
0.40
8
0.00
0
1.00
0
4.2.
2_de
v
0.00
0
-0.0
11
0.00
0
-0.0
18
0.00
0
0.02
1
0.00
0
0.00
0
0.00
0
-0.1
20
0.00
0
0.20
6
0.00
0
0.00
6
0.00
0
1.00
0
4.3_
bar
0.73
9
0.00
0
0.35
4
0.00
0
0.14
7
0.00
0
0.36
4
0.00
0
0.16
6
0.00
0
0.69
6
0.00
0
0.38
1
0.00
0
0.88
0
0.00
0
1.00
0
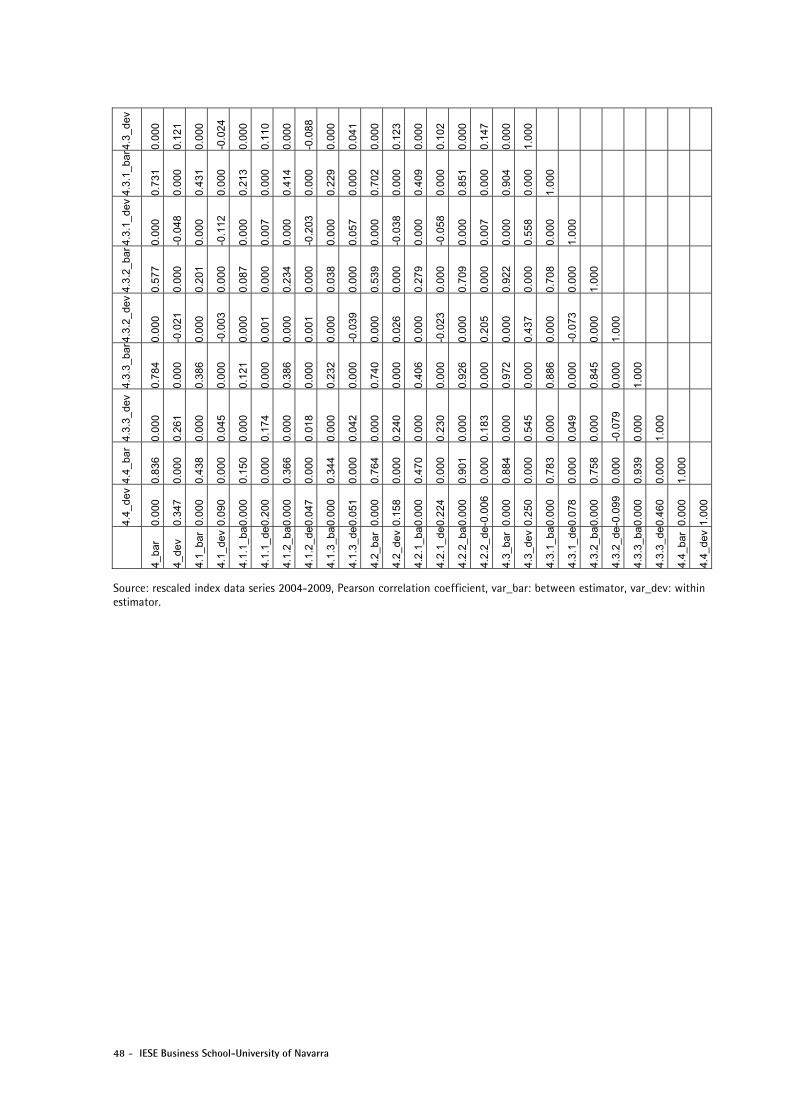
48 - IESE Business School-University of Navarra
4.3_
dev
0.00
0
0.12
1
0.00
0
-0.0
24
0.00
0
0.11
0
0.00
0
-0.0
88
0.00
0
0.04
1
0.00
0
0.12
3
0.00
0
0.10
2
0.00
0
0.14
7
0.00
0
1.00
0
4.3.
1_ba
r
0.73
1
0.00
0
0.43
1
0.00
0
0.21
3
0.00
0
0.41
4
0.00
0
0.22
9
0.00
0
0.70
2
0.00
0
0.40
9
0.00
0
0.85
1
0.00
0
0.90
4
0.00
0
1.00
0
4.3.
1_de
v
0.00
0
-0.0
48
0.00
0
-0.1
12
0.00
0
0.00
7
0.00
0
-0.2
03
0.00
0
0.05
7
0.00
0
-0.0
38
0.00
0
-0.0
58
0.00
0
0.00
7
0.00
0
0.55
8
0.00
0
1.00
0
4.3.
2_ba
r
0.57
7
0.00
0
0.20
1
0.00
0
0.08
7
0.00
0
0.23
4
0.00
0
0.03
8
0.00
0
0.53
9
0.00
0
0.27
9
0.00
0
0.70
9
0.00
0
0.92
2
0.00
0
0.70
8
0.00
0
1.00
0
4.3.
2_de
v
0.00
0
-0.0
21
0.00
0
-0.0
03
0.00
0
0.00
1
0.00
0
0.00
1
0.00
0
-0.0
39
0.00
0
0.02
6
0.00
0
-0.0
23
0.00
0
0.20
5
0.00
0
0.43
7
0.00
0
-0.0
73
0.00
0
1.00
0
4.3.
3_ba
r
0.78
4
0.00
0
0.38
6
0.00
0
0.12
1
0.00
0
0.38
6
0.00
0
0.23
2
0.00
0
0.74
0
0.00
0
0.40
6
0.00
0
0.92
6
0.00
0
0.97
2
0.00
0
0.88
6
0.00
0
0.84
5
0.00
0
1.00
0
4.3.
3_de
v
0.00
0
0.26
1
0.00
0
0.04
5
0.00
0
0.17
4
0.00
0
0.01
8
0.00
0
0.04
2
0.00
0
0.24
0
0.00
0
0.23
0
0.00
0
0.18
3
0.00
0
0.54
5
0.00
0
0.04
9
0.00
0
-0.0
79
0.00
0
1.00
0
4.4_
bar
0.83
6
0.00
0
0.43
8
0.00
0
0.15
0
0.00
0
0.36
6
0.00
0
0.34
4
0.00
0
0.76
4
0.00
0
0.47
0
0.00
0
0.90
1
0.00
0
0.88
4
0.00
0
0.78
3
0.00
0
0.75
8
0.00
0
0.93
9
0.00
0
1.00
0
4.4_
dev
0.00
0
0.34
7
0.00
0
0.09
0
0.00
0
0.20
0
0.00
0
0.04
7
0.00
0
0.05
1
0.00
0
0.15
8
0.00
0
0.22
4
0.00
0
-0.0
06
0.00
0
0.25
0
0.00
0
0.07
8
0.00
0
-0.0
99
0.00
0
0.46
0
0.00
0
1.00
0
4_ba
r
4_de
v
4.1_
bar
4.1_
dev
4.1.
1_ba
4.1.
1_de
4.1.
2_ba
4.1.
2_de
4.1.
3_ba
4.1.
3_de
4.2_
bar
4.2_
dev
4.2.
1_ba
4.2.
1_de
4.2.
2_ba
4.2.
2_de
4.3_
bar
4.3_
dev
4.3.
1_ba
4.3.
1_de
4.3.
2_ba
4.3.
2_de
4.3.
3_ba
4.3.
3_de
4.4_
bar
4.4_
dev
Source: rescaled index data series 2004-2009, Pearson correlation coefficient, var_bar: between estimator, var_dev: within estimator.
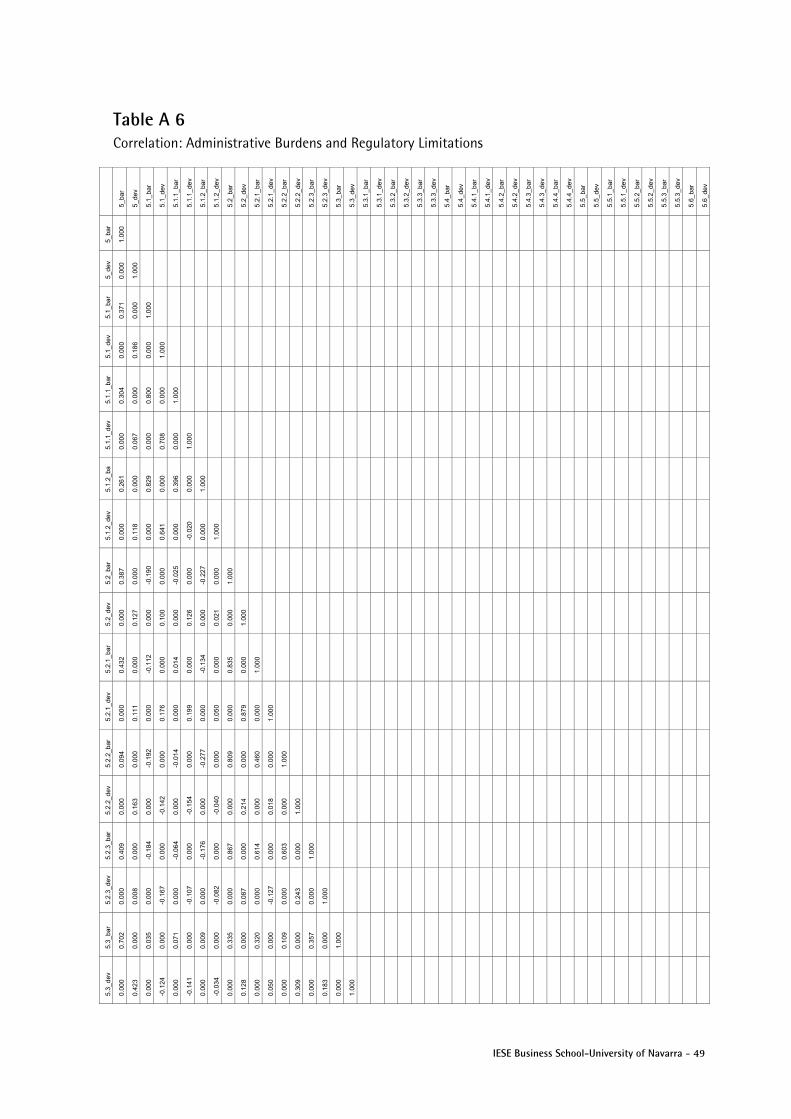
IESE Business School-University of Navarra - 49
Table A 6 Correlation: Administrative Burdens and Regulatory Limitations
5_ba
r
5_de
v
5.1_
bar
5.1_
dev
5.1.
1_b
ar
5.1.
1_d
ev
5.1.
2_b
ar
5.1.
2_d
ev
5.2_
bar
5.2_
dev
5.2.
1_b
ar
5.2.
1_d
ev
5.2.
2_b
ar
5.2.
2_d
ev
5.2.
3_b
ar
5.2.
3_d
ev
5.3_
bar
5.3_
dev
5.3.
1_b
ar
5.3.
1_d
ev
5.3.
2_b
ar
5.3.
2_d
ev
5.3.
3_b
ar
5.3.
3_d
ev
5.4_
bar
5.4_
dev
5.4.
1_b
ar
5.4.
1_d
ev
5.4.
2_b
ar
5.4.
2_d
ev
5.4.
3_b
ar
5.4.
3_d
ev
5.4.
4_b
ar
5.4.
4_d
ev
5.5_
bar
5.5_
dev
5.5.
1_b
ar
5.5.
1_d
ev
5.5.
2_b
ar
5.5.
2_d
ev
5.5.
3_b
ar
5.5.
3_d
ev
5.6_
bar
5.6_
dev
5_ba
r
1.00
0
5_de
v
0.00
0
1.00
0
5.1_
bar
0.37
1
0.00
0
1.00
0
5.1_
dev
0.00
0
0.18
6
0.00
0
1.00
0
5.1.
1_b
ar
0.30
4
0.00
0
0.80
0
0.00
0
1.00
0
5.1.
1_d
ev
0.00
0
0.06
7
0.00
0
0.70
8
0.00
0
1.00
0
5.1.
2_b
a
0.26
1
0.00
0
0.82
9
0.00
0
0.39
6
0.00
0
1.00
0
5.1.
2_d
ev
0.00
0
0.11
8
0.00
0
0.64
1
0.00
0
-0.0
20
0.00
0
1.00
0
5.2_
bar
0.38
7
0.00
0
-0.1
90
0.00
0
-0.0
25
0.00
0
-0.2
27
0.00
0
1.00
0
5.2_
dev
0.00
0
0.12
7
0.00
0
0.10
0
0.00
0
0.12
6
0.00
0
0.02
1
0.00
0
1.00
0
5.2.
1_b
ar
0.43
2
0.00
0
-0.1
12
0.00
0
0.01
4
0.00
0
-0.1
34
0.00
0
0.83
5
0.00
0
1.00
0
5.2.
1_d
ev
0.00
0
0.11
1
0.00
0
0.17
6
0.00
0
0.19
9
0.00
0
0.05
0
0.00
0
0.87
9
0.00
0
1.00
0
5.2.
2_b
ar
0.09
4
0.00
0
-0.1
92
0.00
0
-0.0
14
0.00
0
-0.2
77
0.00
0
0.80
9
0.00
0
0.46
0
0.00
0
1.00
0
5.2.
2_d
ev
0.00
0
0.16
3
0.00
0
-0.1
42
0.00
0
-0.1
54
0.00
0
-0.0
40
0.00
0
0.21
4
0.00
0
0.01
8
0.00
0
1.00
0
5.2.
3_b
ar
0.40
9
0.00
0
-0.1
84
0.00
0
-0.0
64
0.00
0
-0.1
76
0.00
0
0.86
7
0.00
0
0.61
4
0.00
0
0.60
3
0.00
0
1.00
0
5.2.
3_d
ev
0.00
0
0.00
8
0.00
0
-0.1
67
0.00
0
-0.1
07
0.00
0
-0.0
82
0.00
0
0.08
7
0.00
0
-0.1
27
0.00
0
0.24
3
0.00
0
1.00
0
5.3_
bar
0.70
2
0.00
0
0.03
5
0.00
0
0.07
1
0.00
0
0.00
9
0.00
0
0.33
5
0.00
0
0.32
0
0.00
0
0.10
9
0.00
0
0.35
7
0.00
0
1.00
0
5.3_
dev
0.00
0
0.42
3
0.00
0
-0.1
24
0.00
0
-0.1
41
0.00
0
-0.0
34
0.00
0
0.12
8
0.00
0
0.05
0
0.00
0
0.30
9
0.00
0
0.18
3
0.00
0
1.00
0
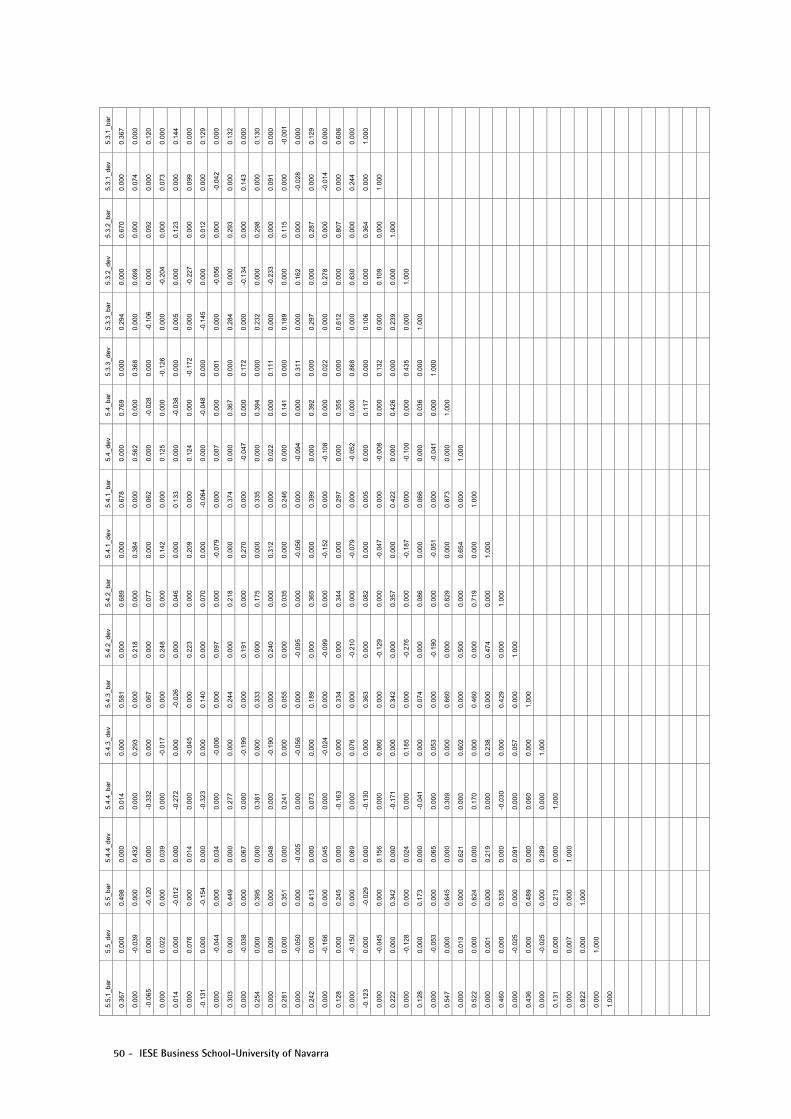
50 - IESE Business School-University of Navarra
5.3.
1_b
ar
0.36
7
0.00
0
0.12
0
0.00
0
0.14
4
0.00
0
0.12
9
0.00
0
0.13
2
0.00
0
0.13
0
0.00
0
-0.0
01
0.00
0
0.12
9
0.00
0
0.60
6
0.00
0
1.00
0
5.3.
1_d
ev
0.00
0
0.07
4
0.00
0
0.07
3
0.00
0
0.09
9
0.00
0
-0.0
42
0.00
0
0.14
3
0.00
0
0.09
1
0.00
0
-0.0
28
0.00
0
-0.0
14
0.00
0
0.24
4
0.00
0
1.00
0
5.3.
2_b
ar
0.67
0
0.00
0
0.09
2
0.00
0
0.12
3
0.00
0
0.01
2
0.00
0
0.29
3
0.00
0
0.29
8
0.00
0
0.11
5
0.00
0
0.28
7
0.00
0
0.80
7
0.00
0
0.36
4
0.00
0
1.00
0
5.3.
2_d
ev
0.00
0
0.09
9
0.00
0
-0.2
04
0.00
0
-0.2
27
0.00
0
-0.0
56
0.00
0
-0.1
34
0.00
0
-0.2
33
0.00
0
0.16
2
0.00
0
0.27
8
0.00
0
0.63
0
0.00
0
0.10
9
0.00
0
1.00
0
5.3.
3_b
ar
0.29
4
0.00
0
-0.1
06
0.00
0
0.00
5
0.00
0
-0.1
45
0.00
0
0.28
4
0.00
0
0.23
2
0.00
0
0.18
9
0.00
0
0.29
7
0.00
0
0.61
2
0.00
0
0.10
6
0.00
0
0.23
9
0.00
0
1.00
0
5.3.
3_d
ev
0.00
0
0.36
8
0.00
0
-0.1
26
0.00
0
-0.1
72
0.00
0
0.00
1
0.00
0
0.17
2
0.00
0
0.11
1
0.00
0
0.31
1
0.00
0
0.02
2
0.00
0
0.86
8
0.00
0
0.13
2
0.00
0
0.43
5
0.00
0
1.00
0
5.4_
bar
0.76
9
0.00
0
-0.0
28
0.00
0
-0.0
38
0.00
0
-0.0
48
0.00
0
0.36
7
0.00
0
0.39
4
0.00
0
0.14
1
0.00
0
0.39
2
0.00
0
0.35
5
0.00
0
0.11
7
0.00
0
0.42
6
0.00
0
0.03
6
0.00
0
1.00
0
5.4_
dev
0.00
0
0.56
2
0.00
0
0.12
5
0.00
0
0.12
4
0.00
0
0.00
7
0.00
0
-0.0
47
0.00
0
0.02
2
0.00
0
-0.0
94
0.00
0
-0.1
08
0.00
0
-0.0
52
0.00
0
-0.0
08
0.00
0
-0.1
00
0.00
0
-0.0
41
0.00
0
1.00
0
5.4.
1_b
ar
0.67
8
0.00
0
0.06
2
0.00
0
0.13
3
0.00
0
-0.0
64
0.00
0
0.37
4
0.00
0
0.33
5
0.00
0
0.24
6
0.00
0
0.39
9
0.00
0
0.29
7
0.00
0
0.00
5
0.00
0
0.42
2
0.00
0
0.06
6
0.00
0
0.87
3
0.00
0
1.00
0
5.4.
1_d
ev
0.00
0
0.38
4
0.00
0
0.14
2
0.00
0
0.20
9
0.00
0
-0.0
79
0.00
0
0.27
0
0.00
0
0.31
2
0.00
0
-0.0
56
0.00
0
-0.1
52
0.00
0
-0.0
79
0.00
0
-0.0
47
0.00
0
-0.1
87
0.00
0
-0.0
51
0.00
0
0.65
4
0.00
0
1.00
0
5.4.
2_b
ar
0.68
9
0.00
0
0.07
7
0.00
0
0.04
6
0.00
0
0.07
0
0.00
0
0.21
8
0.00
0
0.17
5
0.00
0
0.03
5
0.00
0
0.36
5
0.00
0
0.34
4
0.00
0
0.08
2
0.00
0
0.35
7
0.00
0
0.08
6
0.00
0
0.82
9
0.00
0
0.71
9
0.00
0
1.00
0
5.4.
2_d
ev
0.00
0
0.21
8
0.00
0
0.24
8
0.00
0
0.22
3
0.00
0
0.09
7
0.00
0
0.19
1
0.00
0
0.24
0
0.00
0
-0.0
95
0.00
0
-0.0
99
0.00
0
-0.2
10
0.00
0
-0.1
29
0.00
0
-0.2
76
0.00
0
-0.1
90
0.00
0
0.50
0
0.00
0
0.47
4
0.00
0
1.00
0
5.4.
3_b
ar
0.58
1
0.00
0
0.06
7
0.00
0
-0.0
26
0.00
0
0.14
0
0.00
0
0.24
4
0.00
0
0.33
3
0.00
0
0.05
5
0.00
0
0.18
9
0.00
0
0.33
4
0.00
0
0.36
3
0.00
0
0.34
2
0.00
0
0.07
4
0.00
0
0.66
0
0.00
0
0.46
0
0.00
0
0.42
9
0.00
0
1.00
0
5.4.
3_d
ev
0.00
0
0.29
3
0.00
0
-0.0
17
0.00
0
-0.0
45
0.00
0
-0.0
06
0.00
0
-0.1
99
0.00
0
-0.1
90
0.00
0
-0.0
56
0.00
0
-0.0
24
0.00
0
0.07
6
0.00
0
0.06
0
0.00
0
0.18
5
0.00
0
0.05
3
0.00
0
0.60
2
0.00
0
0.23
8
0.00
0
0.05
7
0.00
0
1.00
0
5.4.
4_b
ar
0.01
4
0.00
0
-0.3
32
0.00
0
-0.2
72
0.00
0
-0.3
23
0.00
0
0.27
7
0.00
0
0.38
1
0.00
0
0.24
1
0.00
0
0.07
3
0.00
0
-0.1
63
0.00
0
-0.1
30
0.00
0
-0.1
71
0.00
0
-0.0
41
0.00
0
0.30
9
0.00
0
0.17
0
0.00
0
-0.0
30
0.00
0
0.06
0
0.00
0
1.00
0
5.4.
4_d
ev
0.00
0
0.43
2
0.00
0
0.03
9
0.00
0
0.01
4
0.00
0
0.03
4
0.00
0
0.06
7
0.00
0
0.04
8
0.00
0
-0.0
05
0.00
0
0.04
5
0.00
0
0.06
9
0.00
0
0.15
6
0.00
0
0.02
4
0.00
0
0.06
5
0.00
0
0.62
1
0.00
0
0.21
9
0.00
0
0.09
1
0.00
0
0.28
9
0.00
0
1.00
0
5.5_
bar
0.49
8
0.00
0
-0.1
20
0.00
0
-0.0
12
0.00
0
-0.1
54
0.00
0
0.44
9
0.00
0
0.39
5
0.00
0
0.35
1
0.00
0
0.41
3
0.00
0
0.24
5
0.00
0
-0.0
29
0.00
0
0.34
2
0.00
0
0.17
3
0.00
0
0.64
5
0.00
0
0.62
4
0.00
0
0.53
5
0.00
0
0.48
9
0.00
0
0.21
3
0.00
0
1.00
0
5.5_
dev
0.00
0
-0.0
39
0.00
0
0.02
2
0.00
0
0.07
6
0.00
0
-0.0
44
0.00
0
-0.0
38
0.00
0
0.00
9
0.00
0
-0.0
50
0.00
0
-0.1
66
0.00
0
-0.1
50
0.00
0
-0.0
45
0.00
0
-0.1
28
0.00
0
-0.0
53
0.00
0
0.01
3
0.00
0
0.00
1
0.00
0
-0.0
25
0.00
0
-0.0
25
0.00
0
0.00
7
0.00
0
1.00
0
5.5.
1_b
ar
0.36
7
0.00
0
-0.0
65
0.00
0
0.01
4
0.00
0
-0.1
31
0.00
0
0.30
3
0.00
0
0.25
4
0.00
0
0.28
1
0.00
0
0.24
2
0.00
0
0.12
8
0.00
0
-0.1
23
0.00
0
0.22
2
0.00
0
0.12
8
0.00
0
0.54
7
0.00
0
0.52
2
0.00
0
0.46
0
0.00
0
0.43
6
0.00
0
0.13
1
0.00
0
0.82
2
0.00
0
1.00
0
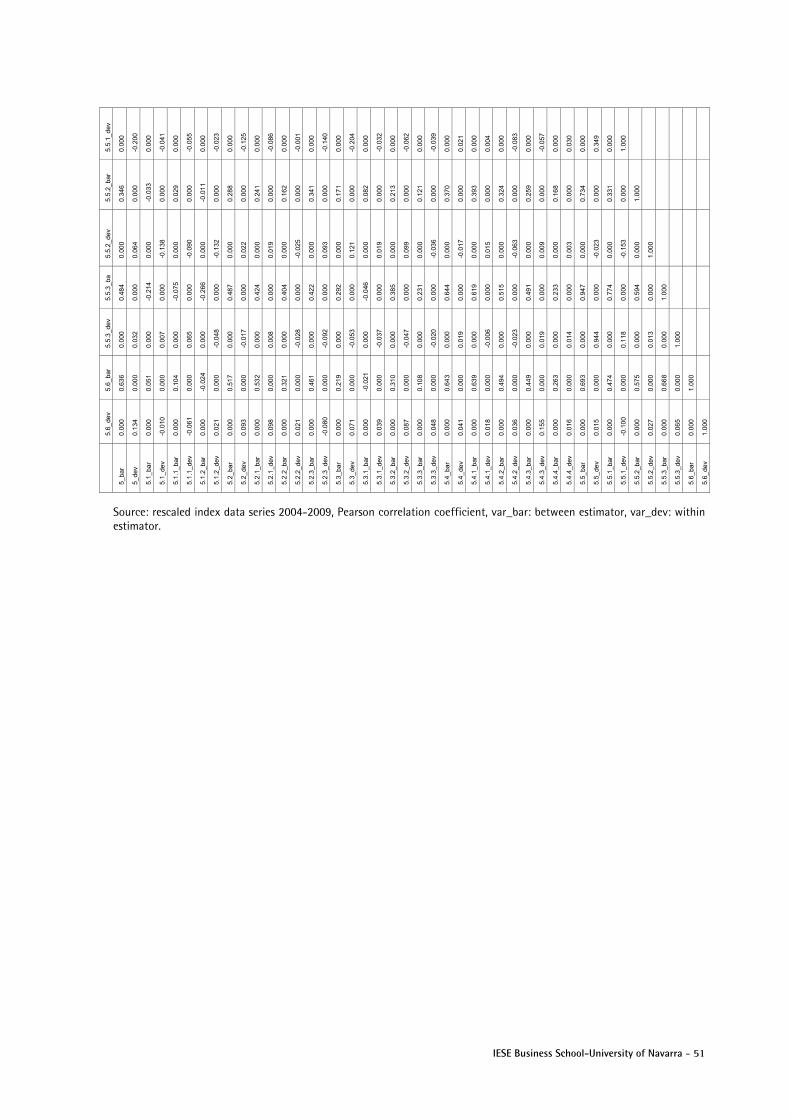
IESE Business School-University of Navarra - 51
5.5.
1_d
ev
0.00
0
-0.2
00
0.00
0
-0.0
41
0.00
0
-0.0
55
0.00
0
-0.0
23
0.00
0
-0.1
25
0.00
0
-0.0
86
0.00
0
-0.0
01
0.00
0
-0.1
40
0.00
0
-0.2
04
0.00
0
-0.0
32
0.00
0
-0.0
62
0.00
0
-0.0
39
0.00
0
0.02
1
0.00
0
0.00
4
0.00
0
-0.0
83
0.00
0
-0.0
57
0.00
0
0.03
0
0.00
0
0.34
9
0.00
0
1.00
0
5.5.
2_b
ar
0.34
6
0.00
0
-0.0
33
0.00
0
0.02
9
0.00
0
-0.0
11
0.00
0
0.28
8
0.00
0
0.24
1
0.00
0
0.16
2
0.00
0
0.34
1
0.00
0
0.17
1
0.00
0
0.08
2
0.00
0
0.21
3
0.00
0
0.12
1
0.00
0
0.37
0
0.00
0
0.39
3
0.00
0
0.32
4
0.00
0
0.25
9
0.00
0
0.16
8
0.00
0
0.73
4
0.00
0
0.33
1
0.00
0
1.00
0
5.5.
2_d
ev
0.00
0
0.06
4
0.00
0
-0.1
38
0.00
0
-0.0
90
0.00
0
-0.1
32
0.00
0
0.02
2
0.00
0
0.01
9
0.00
0
-0.0
25
0.00
0
0.09
3
0.00
0
0.12
1
0.00
0
0.01
9
0.00
0
0.09
9
0.00
0
-0.0
36
0.00
0
-0.0
17
0.00
0
0.01
5
0.00
0
-0.0
63
0.00
0
0.00
9
0.00
0
0.00
3
0.00
0
-0.0
23
0.00
0
-0.1
53
0.00
0
1.00
0
5.5.
3_b
a
0.48
4
0.00
0
-0.2
14
0.00
0
-0.0
75
0.00
0
-0.2
66
0.00
0
0.48
7
0.00
0
0.42
4
0.00
0
0.40
4
0.00
0
0.42
2
0.00
0
0.29
2
0.00
0
-0.0
46
0.00
0
0.38
5
0.00
0
0.23
1
0.00
0
0.64
4
0.00
0
0.61
9
0.00
0
0.51
5
0.00
0
0.49
1
0.00
0
0.23
3
0.00
0
0.94
7
0.00
0
0.77
4
0.00
0
0.59
4
0.00
0
1.00
0
5.5.
3_d
ev
0.00
0
0.03
2
0.00
0
0.00
7
0.00
0
0.06
5
0.00
0
-0.0
48
0.00
0
-0.0
17
0.00
0
0.00
8
0.00
0
-0.0
28
0.00
0
-0.0
92
0.00
0
-0.0
53
0.00
0
-0.0
37
0.00
0
-0.0
47
0.00
0
-0.0
20
0.00
0
0.01
9
0.00
0
-0.0
06
0.00
0
-0.0
23
0.00
0
0.01
9
0.00
0
0.01
4
0.00
0
0.94
4
0.00
0
0.11
8
0.00
0
0.01
3
0.00
0
1.00
0
5.6_
bar
0.63
6
0.00
0
0.05
1
0.00
0
0.10
4
0.00
0
-0.0
24
0.00
0
0.51
7
0.00
0
0.53
2
0.00
0
0.32
1
0.00
0
0.46
1
0.00
0
0.21
9
0.00
0
-0.0
21
0.00
0
0.31
0
0.00
0
0.10
8
0.00
0
0.64
3
0.00
0
0.63
9
0.00
0
0.49
4
0.00
0
0.44
9
0.00
0
0.26
3
0.00
0
0.69
3
0.00
0
0.47
4
0.00
0
0.57
5
0.00
0
0.66
8
0.00
0
1.00
0
5.6_
dev
0.00
0
0.13
4
0.00
0
-0.0
10
0.00
0
-0.0
61
0.00
0
0.02
1
0.00
0
0.09
3
0.00
0
0.09
8
0.00
0
0.02
1
0.00
0
-0.0
80
0.00
0
0.07
1
0.00
0
0.03
9
0.00
0
0.08
7
0.00
0
0.04
8
0.00
0
0.04
1
0.00
0
0.01
8
0.00
0
0.03
6
0.00
0
0.15
5
0.00
0
0.01
6
0.00
0
0.01
5
0.00
0
-0.1
00
0.00
0
0.02
7
0.00
0
0.06
5
0.00
0
1.00
0
5_ba
r
5_de
v
5.1_
bar
5.1_
dev
5.1.
1_b
ar
5.1.
1_d
ev
5.1.
2_b
ar
5.1.
2_d
ev
5.2_
bar
5.2_
dev
5.2.
1_b
ar
5.2.
1_d
ev
5.2.
2_b
ar
5.2.
2_d
ev
5.2.
3_b
ar
5.2.
3_d
ev
5.3_
bar
5.3_
dev
5.3.
1_b
ar
5.3.
1_d
ev
5.3.
2_b
ar
5.3.
2_d
ev
5.3.
3_b
ar
5.3.
3_d
ev
5.4_
bar
5.4_
dev
5.4.
1_b
ar
5.4.
1_d
ev
5.4.
2_b
ar
5.4.
2_d
ev
5.4.
3_b
ar
5.4.
3_d
ev
5.4.
4_b
ar
5.4.
4_d
ev
5.5_
bar
5.5_
dev
5.5.
1_b
ar
5.5.
1_d
ev
5.5.
2_b
ar
5.5.
2_d
ev
5.5.
3_b
ar
5.5.
3_d
ev
5.6_
bar
5.6_
dev
Source: rescaled index data series 2004-2009, Pearson correlation coefficient, var_bar: between estimator, var_dev: within estimator.
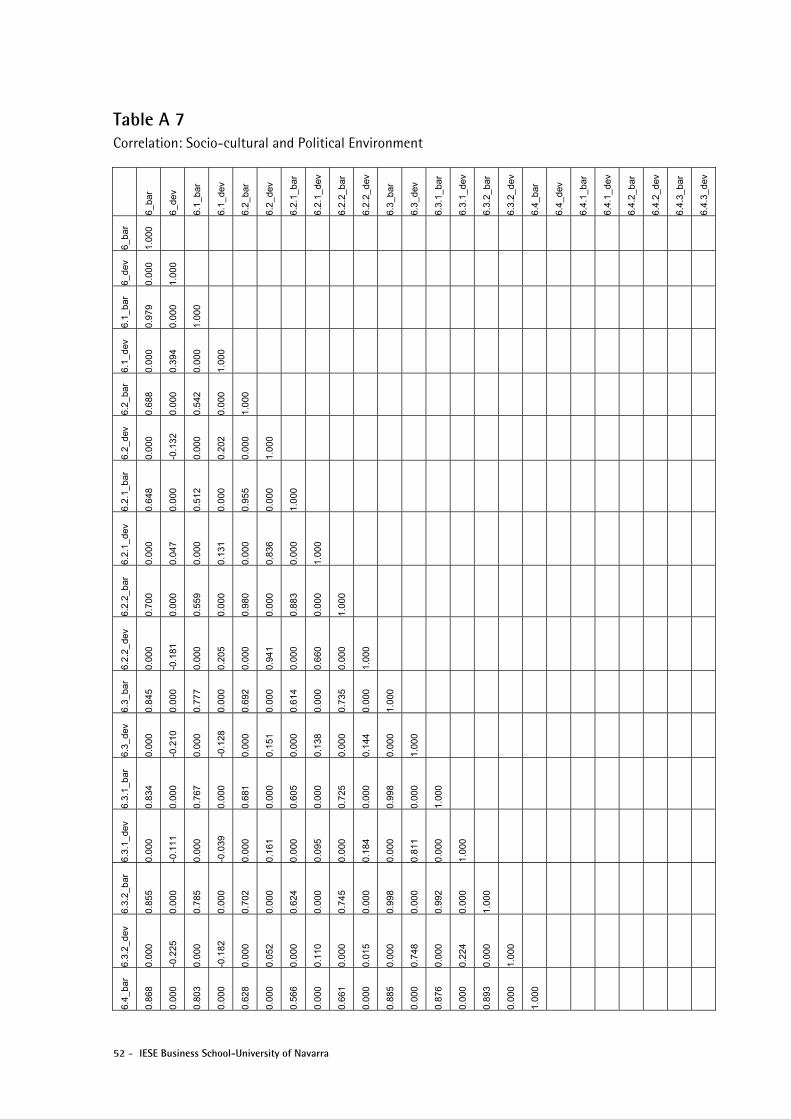
52 - IESE Business School-University of Navarra
Table A 7 Correlation: Socio-cultural and Political Environment
6_ba
r
6_de
v
6.1_
bar
6.1_
dev
6.2_
bar
6.2_
dev
6.2.
1_ba
r
6.2.
1_de
v
6.2.
2_ba
r
6.2.
2_de
v
6.3_
bar
6.3_
dev
6.3.
1_ba
r
6.3.
1_de
v
6.3.
2_ba
r
6.3.
2_de
v
6.4_
bar
6.4_
dev
6.4.
1_ba
r
6.4.
1_de
v
6.4.
2_ba
r
6.4.
2_de
v
6.4.
3_ba
r
6.4.
3_de
v
6_ba
r
1.00
0
6_de
v
0.00
0
1.00
0
6.1_
bar
0.97
9
0.00
0
1.00
0
6.1_
dev
0.00
0
0.39
4
0.00
0
1.00
0
6.2_
bar
0.68
8
0.00
0
0.54
2
0.00
0
1.00
0
6.2_
dev
0.00
0
-0.1
32
0.00
0
0.20
2
0.00
0
1.00
0
6.2.
1_ba
r
0.64
8
0.00
0
0.51
2
0.00
0
0.95
5
0.00
0
1.00
0
6.2.
1_de
v
0.00
0
0.04
7
0.00
0
0.13
1
0.00
0
0.83
6
0.00
0
1.00
0
6.2.
2_ba
r
0.70
0
0.00
0
0.55
9
0.00
0
0.98
0
0.00
0
0.88
3
0.00
0
1.00
0
6.2.
2_de
v
0.00
0
-0.1
81
0.00
0
0.20
5
0.00
0
0.94
1
0.00
0
0.66
0
0.00
0
1.00
0
6.3_
bar
0.84
5
0.00
0
0.77
7
0.00
0
0.69
2
0.00
0
0.61
4
0.00
0
0.73
5
0.00
0
1.00
0
6.3_
dev
0.00
0
-0.2
10
0.00
0
-0.1
28
0.00
0
0.15
1
0.00
0
0.13
8
0.00
0
0.14
4
0.00
0
1.00
0
6.3.
1_ba
r
0.83
4
0.00
0
0.76
7
0.00
0
0.68
1
0.00
0
0.60
5
0.00
0
0.72
5
0.00
0
0.99
8
0.00
0
1.00
0
6.3.
1_de
v
0.00
0
-0.1
11
0.00
0
-0.0
39
0.00
0
0.16
1
0.00
0
0.09
5
0.00
0
0.18
4
0.00
0
0.81
1
0.00
0
1.00
0
6.3.
2_ba
r
0.85
5
0.00
0
0.78
5
0.00
0
0.70
2
0.00
0
0.62
4
0.00
0
0.74
5
0.00
0
0.99
8
0.00
0
0.99
2
0.00
0
1.00
0
6.3.
2_de
v
0.00
0
-0.2
25
0.00
0
-0.1
82
0.00
0
0.05
2
0.00
0
0.11
0
0.00
0
0.01
5
0.00
0
0.74
8
0.00
0
0.22
4
0.00
0
1.00
0
6.4_
bar
0.86
8
0.00
0
0.80
3
0.00
0
0.62
8
0.00
0
0.56
6
0.00
0
0.66
1
0.00
0
0.88
5
0.00
0
0.87
6
0.00
0
0.89
3
0.00
0
1.00
0
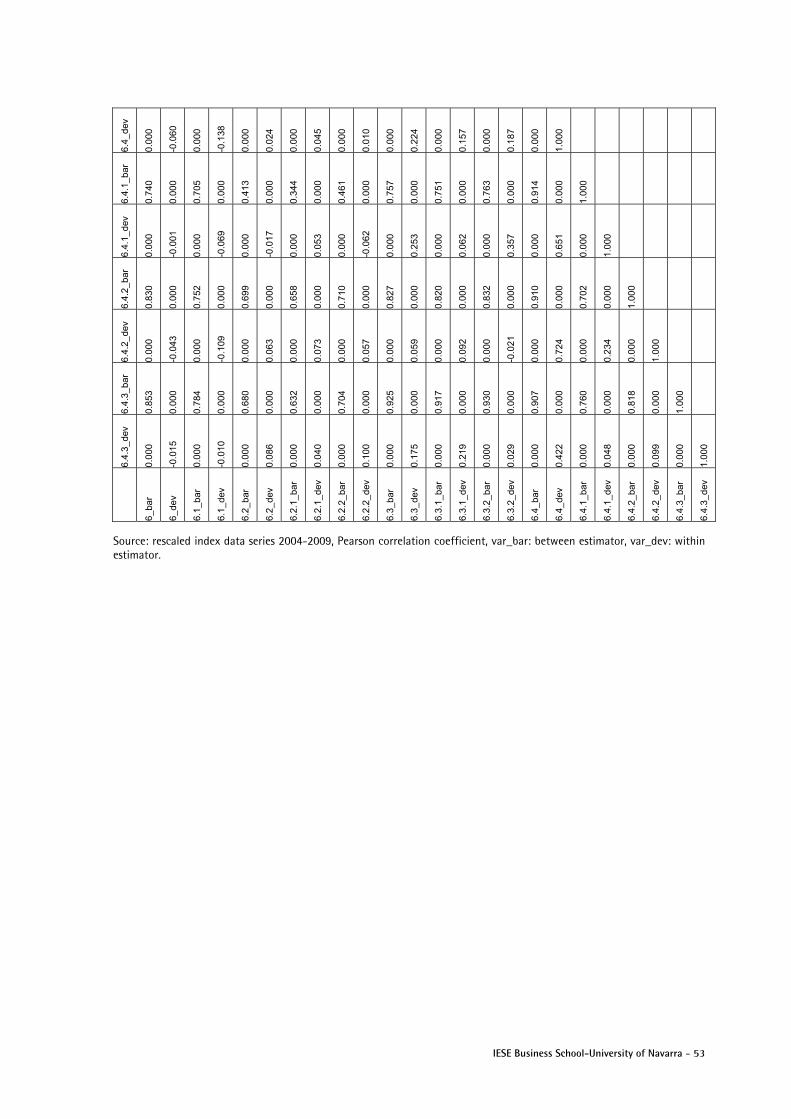
IESE Business School-University of Navarra - 53
6.4_
dev
0.00
0
-0.0
60
0.00
0
-0.1
38
0.00
0
0.02
4
0.00
0
0.04
5
0.00
0
0.01
0
0.00
0
0.22
4
0.00
0
0.15
7
0.00
0
0.18
7
0.00
0
1.00
0
6.4.
1_ba
r
0.74
0
0.00
0
0.70
5
0.00
0
0.41
3
0.00
0
0.34
4
0.00
0
0.46
1
0.00
0
0.75
7
0.00
0
0.75
1
0.00
0
0.76
3
0.00
0
0.91
4
0.00
0
1.00
0
6.4.
1_de
v
0.00
0
-0.0
01
0.00
0
-0.0
69
0.00
0
-0.0
17
0.00
0
0.05
3
0.00
0
-0.0
62
0.00
0
0.25
3
0.00
0
0.06
2
0.00
0
0.35
7
0.00
0
0.65
1
0.00
0
1.00
0
6.4.
2_ba
r
0.83
0
0.00
0
0.75
2
0.00
0
0.69
9
0.00
0
0.65
8
0.00
0
0.71
0
0.00
0
0.82
7
0.00
0
0.82
0
0.00
0
0.83
2
0.00
0
0.91
0
0.00
0
0.70
2
0.00
0
1.00
0
6.4.
2_de
v
0.00
0
-0.0
43
0.00
0
-0.1
09
0.00
0
0.06
3
0.00
0
0.07
3
0.00
0
0.05
7
0.00
0
0.05
9
0.00
0
0.09
2
0.00
0
-0.0
21
0.00
0
0.72
4
0.00
0
0.23
4
0.00
0
1.00
0
6.4.
3_ba
r
0.85
3
0.00
0
0.78
4
0.00
0
0.68
0
0.00
0
0.63
2
0.00
0
0.70
4
0.00
0
0.92
5
0.00
0
0.91
7
0.00
0
0.93
0
0.00
0
0.90
7
0.00
0
0.76
0
0.00
0
0.81
8
0.00
0
1.00
0
6.4.
3_de
v
0.00
0
-0.0
15
0.00
0
-0.0
10
0.00
0
0.08
6
0.00
0
0.04
0
0.00
0
0.10
0
0.00
0
0.17
5
0.00
0
0.21
9
0.00
0
0.02
9
0.00
0
0.42
2
0.00
0
0.04
8
0.00
0
0.09
9
0.00
0
1.00
0
6_ba
r
6_de
v
6.1_
bar
6.1_
dev
6.2_
bar
6.2_
dev
6.2.
1_ba
r
6.2.
1_de
v
6.2.
2_ba
r
6.2.
2_de
v
6.3_
bar
6.3_
dev
6.3.
1_ba
r
6.3.
1_de
v
6.3.
2_ba
r
6.3.
2_de
v
6.4_
bar
6.4_
dev
6.4.
1_ba
r
6.4.
1_de
v
6.4.
2_ba
r
6.4.
2_de
v
6.4.
3_ba
r
6.4.
3_de
v
Source: rescaled index data series 2004-2009, Pearson correlation coefficient, var_bar: between estimator, var_dev: within estimator.