The Determinants of ETF Trading Pauses on August 24 th · PDF fileDivision of Economic and...
23
Division of Economic and Risk Analysis 1 The Determinants of ETF Trading Pauses on August 24 th , 2015 Austin Gerig and Keegan Murphy 1 FEBRUARY 2016 ABSTRACT On the morning of August 24 th , 2015, U.S. equity markets experienced extreme price volatility that triggered limit up-limit down (LULD) trading pauses in many securities. U.S. listed exchange traded funds (ETFs) were particularly affected: out of 1569 ETFs, 302 (or 19.2%) sustained price movements large enough to activate a trading pause. Here, we use publicly available data to determine the causes of extreme price movements in ETFs on August 24 th and to uncover the properties of ETFs that made them more or less susceptible to these movements. We find that ETF price volatility was due to both a spike in trading volume and a pullback in liquidity supply. ETFs with the largest volume spikes and largest drops in liquidity were 7 and 5 times more likely to pause, respectively, than those with the smallest. In addition, we report a very strong relationship between ETF pauses and correlations with the S&P 500 index. Those ETFs with the highest correlation to the S&P 500 index were 21 times more likely to pause than those with the lowest. This relationship is partly explained by the above-mentioned channels: ETFs with high S&P 500 correlations experienced large volume spikes and large drops in liquidity, which led to trading pauses. However, S&P 500 correlation continued to predict ETF pauses even when controlling for these two channels. In addition, we find that high average daily turnover (daily share volume/shares outstanding) was related to a lower probability of pausing. Those ETFs with the highest turnover were 3 times less likely to pause than those with the lowest. Finally, to demonstrate the explanatory power of the factors mentioned above, we consider the group of ETFs that are most correlated with the S&P 500 index and show that a regression model based on the factors separates those ETFs that paused from those that did not. 1 This study was prepared for Mark Flannery, Director and Chief Economist of the Division of Economic and Risk Analysis (DERA). The U.S. Securities and Exchange Commission, as a matter of policy, disclaims responsibility for any private publication or statement of any of its employees. The views expressed herein are those of the authors and do not necessarily reflect the views of the Commission or of the authors’ colleagues upon the staff of the Commission.
Transcript of The Determinants of ETF Trading Pauses on August 24 th · PDF fileDivision of Economic and...

Division of Economic and Risk Analysis 1
The Determinants of ETF Trading Pauses on August 24th, 2015 Austin Gerig and Keegan Murphy1
FEBRUARY 2016
ABSTRACT On the morning of August 24th, 2015, U.S. equity markets experienced extreme price volatility that triggered limit up-limit down (LULD) trading pauses in many securities. U.S. listed exchange traded funds (ETFs) were particularly affected: out of 1569 ETFs, 302 (or 19.2%) sustained price movements large enough to activate a trading pause. Here, we use publicly available data to determine the causes of extreme price movements in ETFs on August 24th and to uncover the properties of ETFs that made them more or less susceptible to these movements. We find that ETF price volatility was due to both a spike in trading volume and a pullback in liquidity supply. ETFs with the largest volume spikes and largest drops in liquidity were 7 and 5 times more likely to pause, respectively, than those with the smallest. In addition, we report a very strong relationship between ETF pauses and correlations with the S&P 500 index. Those ETFs with the highest correlation to the S&P 500 index were 21 times more likely to pause than those with the lowest. This relationship is partly explained by the above-mentioned channels: ETFs with high S&P 500 correlations experienced large volume spikes and large drops in liquidity, which led to trading pauses. However, S&P 500 correlation continued to predict ETF pauses even when controlling for these two channels. In addition, we find that high average daily turnover (daily share volume/shares outstanding) was related to a lower probability of pausing. Those ETFs with the highest turnover were 3 times less likely to pause than those with the lowest. Finally, to demonstrate the explanatory power of the factors mentioned above, we consider the group of ETFs that are most correlated with the S&P 500 index and show that a regression model based on the factors separates those ETFs that paused from those that did not.
1 This study was prepared for Mark Flannery, Director and Chief Economist of the Division of Economic and Risk Analysis (DERA). The U.S. Securities and Exchange Commission, as a matter of policy, disclaims responsibility for any private publication or statement of any of its employees. The views expressed herein are those of the authors and do not necessarily reflect the views of the Commission or of the authors’ colleagues upon the staff of the Commission.

Division of Economic and Risk Analysis 2
1. Summary of main findings
• ETF price volatility on August 24th was due to both a spike in trading volume and a pullback in liquidity supply.
o We report a statistically significant relationship between ETF pauses and both volume spikes and liquidity drops.
o ETFs in the top quartile of volume spikes were 7 times more likely to pause than those in the bottom quartile.
o ETFs in the top quartile of liquidity drops were 5 times more likely to pause than those in the bottom quartile.
• ETFs with high correlation to the S&P 500 index were much more likely to pause than those with low correlation.
o ETFs within the top quartile of S&P 500 correlations were 21 times more likely to pause than those in the bottom quartile.
o The relationship between S&P 500 correlations and trading pauses is partly explained by volume spikes and liquidity drops: ETFs with high S&P 500 correlations experienced both large volume spikes and large liquidity drops which led to trading pauses.
o Correlation with the S&P 500 index continued to predict ETF trading pauses even after controlling for volume spikes and liquidity drops, suggesting it may also be a proxy for other unaccounted-for factors that produced pauses.
o The results of our analysis were unchanged when replacing correlations to the S&P 500 index with correlations to other U.S. equity indices (the CRSP U.S. Total Market Index and the Nasdaq 100 index). This suggests that the relationship between S&P 500 correlations and trading pauses was most likely due to the S&P 500 being a broad U.S. equity index rather than to any properties specific to S&P 500 securities.
• ETFs with high turnover (average of daily volume/shares outstanding) were less likely to pause than those with low turnover.
o ETFs in the top quartile of turnover were 3 times less likely to pause than those in the bottom quartile.
• Even within groups of very similar ETFs, the factors mentioned above performed well at separating those ETFs that paused from those that did not.
o A regression model including only volume spikes, liquidity drops, S&P 500 correlation, and turnover was able to perfectly separate a group of 20 very similar U.S. Equity ETFs into those that paused and those that did not.
• There were several ETF properties that might be expected to increase or decrease the likelihood of LULD pauses under market-wide stress, but in fact, did not appear to predict ETF pausing on the 24th. These properties include:
o market capitalization o average daily dollar volume o price volatility o average order book liquidity

Division of Economic and Risk Analysis 3
2. Introduction On Monday, August 24th, 2015, the prices of many U.S. listed exchange traded funds (ETFs) dropped sharply soon after markets opened at 9:30 AM. Of the 1569 ETFs trading that morning, 302 (or 19.2%) experienced a large enough price swing to trigger a limit up-limit down (LULD) trading pause. In this paper, we use publicly available data to determine the causes of extreme ETF price movements on August 24th and to uncover the properties of ETFs that made them more or less susceptible to these movements.2 Although our primary interest is in understanding the determinants of ETF price volatility on August 24th, the main variable we study is LULD trading pauses in ETFs. We focus on trading pauses because they are directly linked to sudden, sharp price movements in securities: as prescribed in current regulation, a trading pause occurs when a security price moves greater than a threshold amount within a short period of time. An LULD trading pause, therefore, acts as an indicator that a security has experienced extreme price volatility. We analyze trading pauses, rather than price movements directly, in order to sidestep the censoring effect that pauses have on price movements.3 Mechanically, extreme price movements result from one or a combination of the following three conditions: (1) a spike in trading volume, (2) a drop in order book liquidity, and/or (3) a rapid price shift of orders in the order book. The first condition can occur, for example, when investors decide to buy or sell large quantities of a security in a short period of time. Such activity will exert price pressure on one or both sides of the order book and potentially lead to an extreme price move unless liquidity suppliers increase their activity. The second condition can occur, for example, when liquidity suppliers collectively reduce the number and/or increase the spacing of their limit orders in the order book. This activity will also lead to price pressure on one or both sides of the order book, potentially leading to an extreme price move, unless investors reduce their trading activity. The third condition can occur, for example, when investors and liquidity suppliers collectively agree to shift the pricing of their orders, perhaps in response to an easily interpretable news release which establishes a new higher or lower price of the security. So far, the academic literature has not reached a consensus on which of the above three conditions is the most important driver of extreme price movements. Clark (1973), Ane and Geman (2000), and Gabaix et al. (2003) present evidence that trade volume (or trade count) is most important. Farmer et al. (2004) and Weber and Rosenow (2006) argue that order book liquidity is more important than trading volume. No academic papers have found evidence that extreme price movements commonly result from the third condition (a rapid price shift in the order book). Here, we contribute to the literature by analyzing the relationship of volume spikes and liquidity drops to the sudden, sharp price movements of ETFs on August 24th. We report a statistically significant relationship between both of these measures and ETF pauses, suggesting that extreme price volatility on August 24th was driven by a combination of both a spike in trading volume and a pullback in liquidity. In addition to analyzing the cause of extreme price movements in ETFs, we also study the properties of ETFs that made them more or less prone to these movements. By far, the most significant predictor of ETF trading pauses on August 24th was correlation with the S&P 500 index. Those ETFs that were most correlated with the S&P 500 index were 21 times more likely to pause than those that were least
2 See “Research Note: Equity Market Volatility on August 24, 2015” available at www.sec.gov/marketstructure/ for a more broad analysis of the events of August 24th. 3 Limit up-limit down requirements are designed to prevent trades in individual NMS Stocks from occurring outside of specified price bands. See SEC Release No. 34-67091; File No. 4-631, http://www.sec.gov/rules/sro/nms/2012/34-67091.pdf

Division of Economic and Risk Analysis 4
correlated. The connection between S&P 500 correlations and trading pauses was through multiple channels. ETFs with high S&P 500 correlations experienced both large volume spikes and large liquidity drops which led to trading pauses. However, even after controlling for these two channels, correlations with the S&P 500 index still maintained predictive power regarding ETF pauses. There were two motivating reasons for including an ETF’s S&P 500 correlation in our analysis, both of which might help explain its strong relationships with volume spikes, liquidity drops, and ETF pauses. First, ETFs that are highly correlated with the S&P 500 index are likely to be selling (buying) targets for investors wishing to quickly decrease (increase) their exposure to the U.S. equity market. Second, it is known that automated and high-frequency trading activity is higher in securities that are correlated with market indices (see Gerig (2015)), and there is evidence that automated and high-frequency trading activity can either reduce or exacerbate market volatility during periods of market stress (see e.g., Raman, Robe, and Yadav (2014) and Brogaard et al. (2015)). Although we find a strong relationship between ETF pauses and correlations to the S&P 500 index, this does not necessarily mean S&P 500 securities themselves contributed to ETF volatility. The importance of the S&P 500 index on August 24th was most likely due to it being a broad U.S. equity index rather than to any properties specific to S&P 500 securities. In the Appendix, we show that when substituting the S&P 500 index with other U.S. equity indices (the CRSP U.S. Total Market Index and the Nasdaq 100 Index), our results are unchanged. In addition to S&P 500 correlations, we also find that ETF turnover, defined as the average of daily share volume divided by shares outstanding, was related to ETF pauses on August 24th: those ETFs with higher turnover were less likely to pause. The ultimate explanation for this relationship is unknown, but perhaps is related to a higher baseline level of liquidity provision or speculative activity within the security that was not already accounted for in the other variables we study. Interestingly we find no consistent statistically significant relationship between trading pauses on August 24th and the following ETF properties: market capitalization, average daily dollar volume, price volatility, and average order book liquidity. Although we believe we have uncovered several important factors leading to the sharp, sudden price movements of ETFs on August 24th, our results are not exhaustive. There may be other unstudied factors that contributed to the extreme volatility of that day. In addition, with the use of additional data, it may be possible to analyze additional factors that led to ETF pauses and to attribute volume spikes and liquidity drops – shown here to be causes of ETF volatility on August 24th – to specific market participants. 3. LULD trading pauses Due to a National Market System (NMS) pilot plan put into place after the extreme market-wide volatility of May 6, 2010 (commonly known as the “Flash Crash”), trading in an individual security is paused if it experiences a large enough price swing in a short enough period of time.4 The pilot plan that governs trading pauses is known as “Limit Up-Limit Down” (LULD). An LULD trading pause is triggered when the national best bid (offer) moves to, and stays longer than 15 seconds at, an upper (lower) band set a certain distance away from the LULD reference price (described below). LULD trading pauses are in effect for at least 5 minutes and apply to all equity exchanges and off-exchange trading venues.
4 See SEC Release No. 34-67091; File No. 4-631, http://www.sec.gov/rules/sro/nms/2012/34-67091.pdf

Division of Economic and Risk Analysis 5
The LULD reference price is set to the opening price of the listing exchange5 and is continuously updated to the average transaction price of the security over the last 5 minutes if this average is at least 1% away from the current reference price. LULD price bands are set according to the following security categories: Tier 1 NMS securities (S&P 500, Russell 1000, and exchange traded products with more than $2 million average daily dollar volume), leveraged exchange traded products, Tier 2 NMS securities (all other NMS stocks), and securities with reference prices between $0.75 and $3 and below $0.75. Tier 1 securities initially have LULD price bands set at 10% above and below the LULD reference price that narrow to 5% after 9:45 AM and widen again at 3:35 PM. For Tier 2 securities, these percentages are 20% and 10% respectively. For securities with prices between $0.75 and $3, these percentages are 40% and 20%, and for securities below $0.75, the bands are set at the lesser of $0.15 or 75% initially and widen to the lesser of $0.30 or 150% between 9:45 AM and 3:35 PM. Leveraged exchange traded products have bands set to the applicable bands above multiplied by their absolute leverage ratio. In our analysis below, all ETFs we study have prices larger than $3. 58% of the ETFs are Tier 1 securities and 42% are Tier 2 securities. We exclude all leveraged ETFs due to their idiosyncratic LULD price bands. 4. Data and Descriptive Statistics The data used in this paper was collected from several public sources including Morningstar Direct, CRSP (The Center for Research in Security Prices), and public exchange feeds from SEC’s MIDAS system.6 The list of ETFs in our study is from Morningstar Direct and includes all U.S. listed ETFs trading as of August 1st, 2015 (1569 ETFs in total). From this list, we exclude all ETFs that Morningstar categorizes as “Alternative” because this category mainly consists of leveraged ETFs with idiosyncratic LULD bands (246 ETFs were excluded). We then exclude any ETFs with zero share volume in MIDAS during the first hour of trading on any of the four Mondays prior to August 24th or with missing trading information in CRSP on any of the 40 trading days prior to August 24th (our control days) (397 ETFs were excluded).7 Our final sample consists of 926 ETFs. The variables studied are:
• Main variable of study:
o Pause: A dummy variable for each ETF based on whether or not it paused on August 24th (LULD pause information from MIDAS). The dummy is set to 1 for an ETF if trading was paused at any point on August 24th due to an LULD event and is set to 0 otherwise.
• Control for LULD bands:
o Tier2: A dummy variable that is set to 1 for an ETF categorized as a Tier 2 NMS security for LULD purposes and set to 0 for an ETF categorized as a Tier 1 security.
5 If the listing exchange does not open the security within 5 minutes of the start of regular trading at 9:30 AM, the first reference price is set to the average transaction price by other markets during the preceding 5 minutes. 6 MIDAS stands for Market Information Data Analytics System. Information about MIDAS is available at http://www.sec.gov/marketstructure/midas.html. 7 Note that CRSP does not include trading information for any of the 17 ETFs listed on BATS.
Division of Economic and Risk Analysis 6
• Potential causes:
o VolSpike: The spike in volume of an ETF on the morning of August 24th (data from MIDAS). Volume spike is the number of shares traded during the first hour of trading on August 24th divided by the average number of shares traded during the first hour of trading on the four Mondays prior to August 24th.
o LiqDrop: The drop in order book depth of an ETF at the open on August 24th (data from MIDAS). Liquidity drop is the average number of shares up to 20 price levels in the consolidated order book during the first minute of trading on August 24th divided by the average number of shares up to 20 price levels of the order book during the first minute of trading on the four Mondays prior to August 24th.
• ETF properties:
o MarkCap: The market capitalization of an ETF on August 21st (data from CRSP). Market capitalization is set to the number of shares outstanding times the closing price and is reported in millions of USD.
o ADV$: The average daily dollar volume of an ETF over the 40 trading days prior to August 24th (data from CRSP). Average daily dollar volume is set to the average of daily share volume times the closing price and is reported in millions of USD.
o Volatility: The daily volatility of an ETF over the 40 trading days prior to August 24th (data from CRSP). Daily volatility is set to the standard deviation of daily returns and is reported as a percentage.
o Turnover: The average daily turnover of an ETF over the 40 trading days prior to August 24th (data from CRSP). Turnover is set to the average of daily share volume over shares outstanding and is reported as a percentage.
o Liquidity: The average order book depth of an ETF over the first minute of trading on the four Mondays prior to August 24th (data from MIDAS and CRSP). Liquidity is set to the average total number of shares up to 20 price levels on both sides of the consolidated order book divided by the average daily share volume. Liquidity is reported as a percentage.
o CorrS&P: The correlation of an ETF’s daily returns with the returns of the S&P 500 index over the 40 trading days prior to August 24th (data from CRSP).
A summary of trading pauses for the ETFs in our sample is reported in Table 1. Note that 78% (180 out of 231) of the ETFs that paused in our sample experienced their first pause during the first 15 minutes of trading when LULD bands were doubled.

Division of Economic and Risk Analysis 7
Table 1: Summary of ETF pauses in our sample
Correlations and summary statistics for the studied variables are reported in Tables 2 and 3 below. There are several things of note in these tables. First, in Table 2, Pause is most positively correlated with CorrS&P, VolSpike, and LiqDrop and most negatively correlated with Turnover. Pause’s strongest correlation is with CorrS&P. The positive and strong relationship between Pause and CorrS&P is consistent with Table 3, where the mean of Pause for both Tier 1 and Tier 2 securities is highest in ETFs associated with U.S. equity securities, which have the highest correlation with the S&P 500 index. Second, CorrS&P, VolSpike, and LiqDrop are all positively correlated with each other, but their correlations are all at or under 0.24. This suggests the three variables are related, but are not so interrelated that their effects on Pause are indistinguishable. Table 2: Correlation matrix
Tier 1 Tier 2 Total# ETFs 532 394 926# ETFs with pause(s) 151 80 231% ETFs with pause(s) 28% 20% 25%# First pause before 9:45 AM 138 42 180# First pause after 9:45 AM 13 38 51
Pause Tier2 MarkCap ADV$ Volatility Turnover Liquidity CorrS&P VolSpike LiqDropPause 1.00 ― ― ― ― ― ― ― ― ― Tier2 -0.09 1.00 ― ― ― ― ― ― ― ― MarkCap -0.02 -0.22 1.00 ― ― ― ― ― ― ― ADV$ -0.04 -0.07 0.79 1.00 ― ― ― ― ― ― Volatility -0.05 0.08 -0.07 0.00 1.00 ― ― ― ― ― Turnover -0.13 -0.14 0.11 0.20 0.32 1.00 ― ― ― ― Liquidity -0.03 0.24 -0.07 -0.03 -0.05 -0.08 1.00 ― ― ― CorrS&P 0.34 0.00 0.06 0.04 0.18 -0.04 -0.02 1.00 ― ― VolSpike 0.24 0.08 -0.04 -0.02 -0.10 -0.10 0.06 0.15 1.00 ― LiqDrop 0.25 0.10 0.02 0.02 -0.06 -0.09 0.10 0.24 0.13 1.00

Division of Economic and Risk Analysis 8
Table 3: Summary statistics Pause is a dummy variable. MarkCap and ADV$ are reported in millions of USD. The US, International and Bond/Commod groups are derived from the following Morningstar categories: US: “US Equity”, “Sector Equity”, and “Allocation”; International: “International”; and Bond/Commod: “Municipal Bond”, “Taxable Bond”, and “Commodities”.
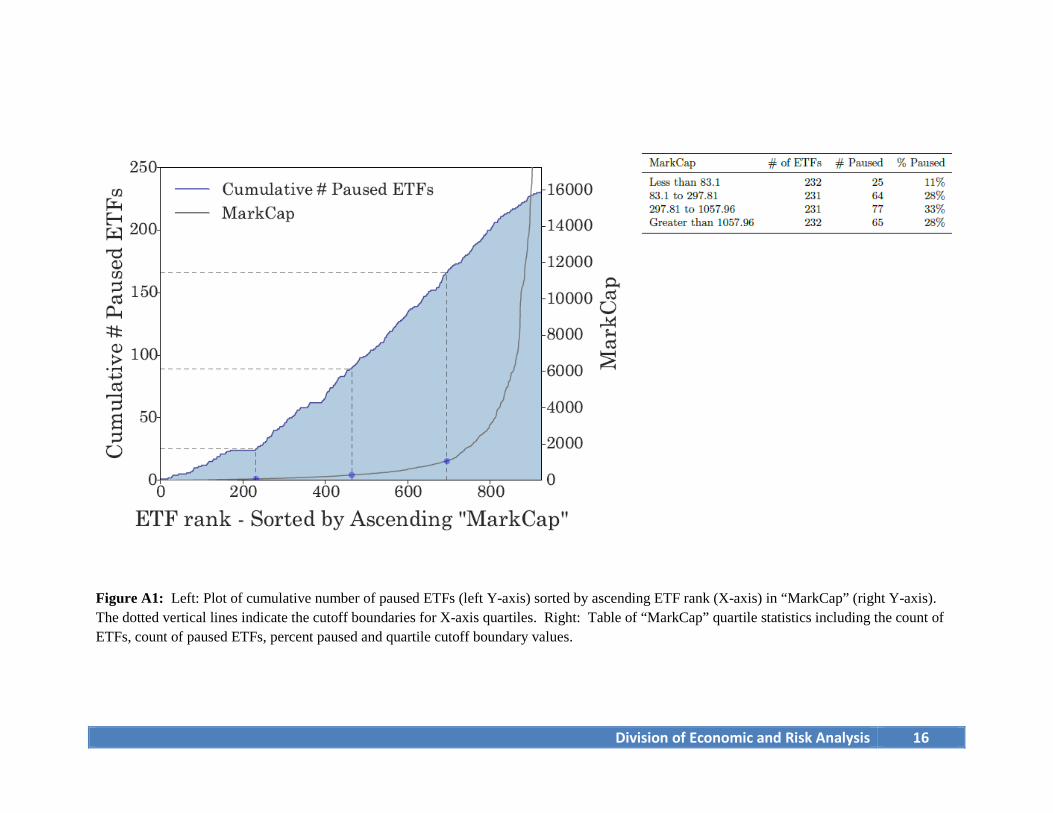
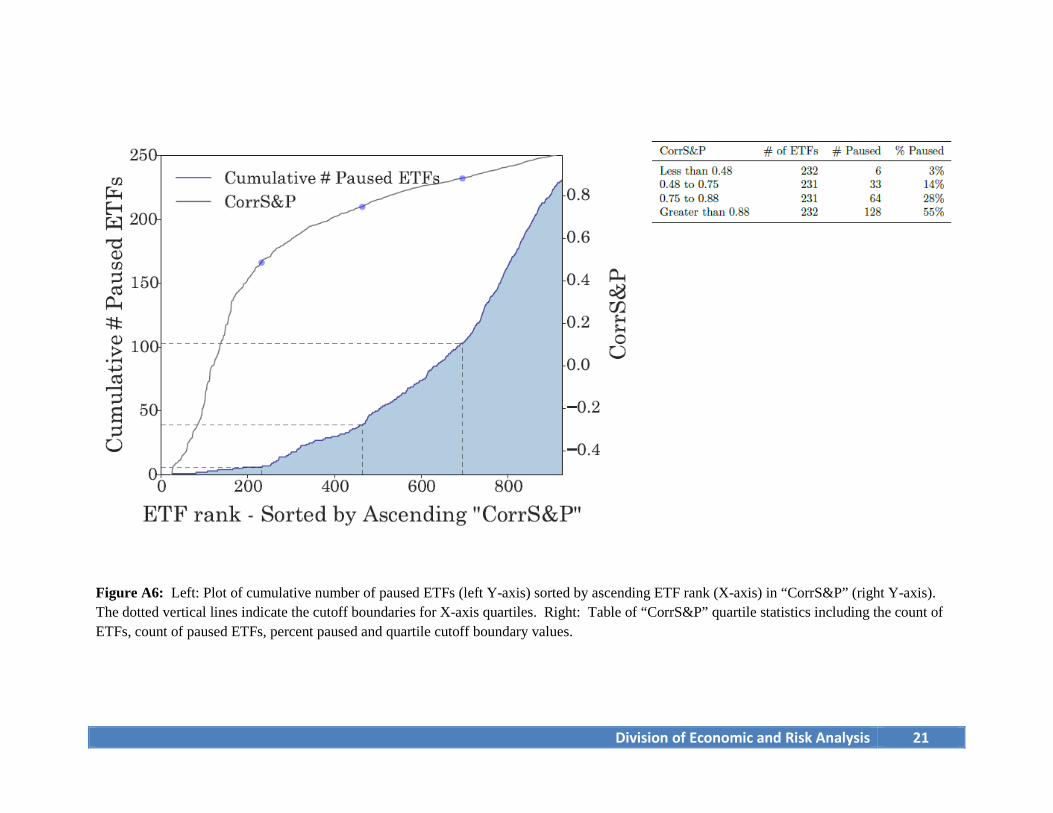
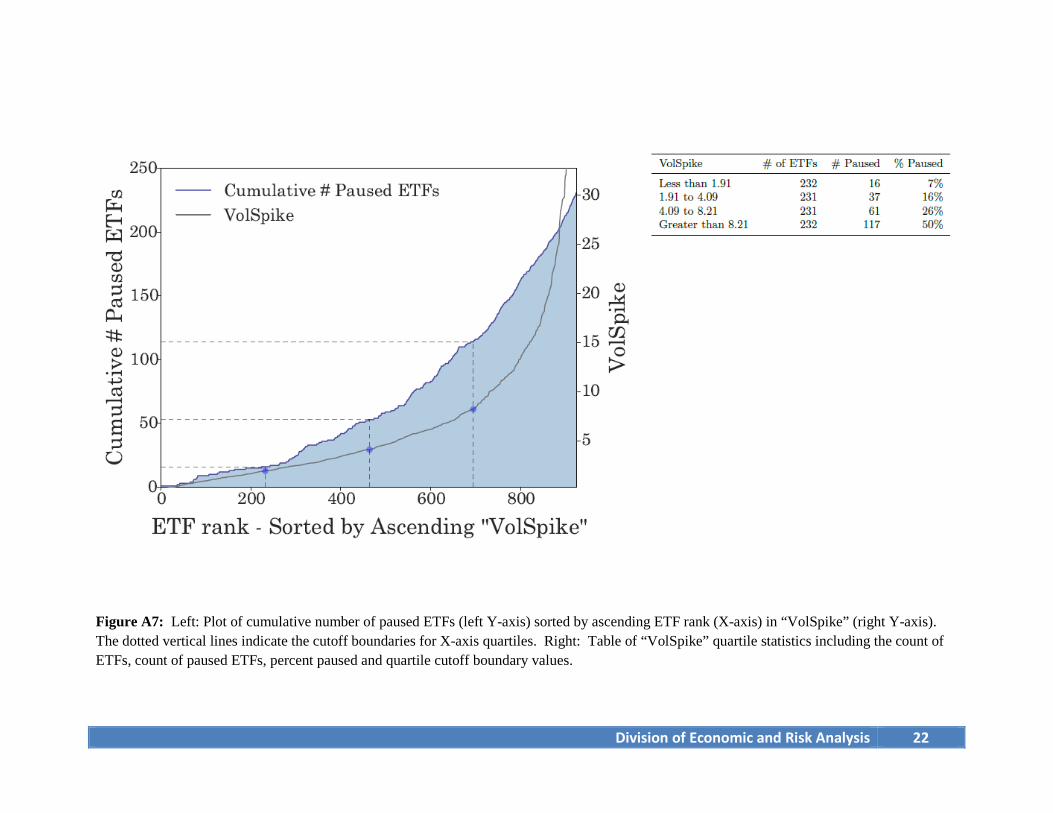
5. Bivariate analysis To analyze the direct relationship of each variable with the likelihood of an ETF pausing, we plot in Figures A1-A8 (shown in the Appendix) the cumulative number of paused ETFs as a function of ETF rank for each variable. On the X-axis of each plot, ETFs are sorted by ascending value of the variable of interest – those on the left have the smallest value and those on the right the largest. The Y-axis (left) keeps track of the total number of ETF pauses when traversing the sorted ETFs along the X-axis. When the curve increases slowly, this means there are not that many pauses accumulating. When the curve increases rapidly, many ETFs at that rank paused. The local slope of the line is an estimate of the local probability of ETF pausing. In the figures, we also plot on the Y-axis (right) the value of the variable of interest as a function of rank. The plots in Figures A1-A8 can be used to estimate the fraction of ETFs pausing when the variable of interest is bucketed into various quantiles. To demonstrate this, on the right hand side of the figures, we present tables that record the fraction of ETFs pausing for each quartile of the variable of interest. Note that the cutoff boundaries for the quartiles from the first column of the table are shown with dashed lines in the plot. Both the number of ETFs in each quartile and the number of ETFs pausing in each quartile can be estimated in the plot and compared to the values in the table. Odds ratios and risk ratios are two additional ways of representing the effects of each variable on ETF pauses. Odds ratios report how each variable increases or decreases the odds of an ETF pausing and risk
MeanMarkCap ADV$ VolatilityTurnover Liquidity CorrS&P VolSpike LiqDrop
Total 926 2106 73 1.1% 1.8% 0.28% 0.59 7.5 13.9(7687) (859) (0.8%) (3.7%) (0.88%) (0.43) (14.3) (26.2)
532 3589 126 1.1% 2.2% 0.10% 0.59 6.5 10.8(9886) (1130) (4.6%) (0.8%) (0.20%) (0.46) (7.4) (19.4)
266 4263 189 1.1% 2.3% 0.09% 0.84 8.6 14.8(12519) (1586) (5.6%) (0.5%) (0.12%) (0.17) (8.0) (23.1)
136 3020 79 1.6% 2.6% 0.07% 0.73 4.0 8.2(7106) (240) (3.6%) (1.1%) (0.15%) (0.15) (3.7) (13.0)
130 2807 46 0.4% 1.5% 0.15% -0.08 4.7 5.3(5063) (134) (2.9%) (0.5%) (0.33%) (0.44) (7.8) (14.6)
394 104 0.81 1.2% 1.1% 0.52% 0.59 8.9 18.1(104) (0.84) (1.8%) (0.7%) (1.28%) (0.37) (20.2) (32.8)
210 113 0.79 1.2% 0.9% 0.59% 0.76 10.6 24.2(105) (0.84) (0.9%) (0.5%) (1.58%) (0.20) (16.0) (38.6)
115 78 0.80 1.6% 1.5% 0.30% 0.66 8.1 14.7(87) (0.91) (2.1%) (0.8%) (0.46%) (0.17) (27.0) (27.3)
69 120 0.87 0.6% 1.4% 0.68% 0.05 5.1 5.3(121) (0.74) (2.9%) (0.5%) (1.18%) (0.32) (17.7) (9.7)
Mean and (Standard Deviation)Pause0.25
Count
Tier 1 0.28
US 0.51
Bond/Commod 0.04
International 0.07
Tier 2 0.20
US 0.31
International 0.10
Bond/Commod 0.04

Division of Economic and Risk Analysis 9
ratios report how each variable increases or decreases how likely an ETF is to pause. The odds ratio for pausing from the highest to lowest quartile, O4/1, is calculated as follows,
O4/1 = (H4/N4) / (H1/N1), where H1 and H4 are the number of pauses in quartiles 1 and 4 respectively and N1 and N4 are the number of non-pauses in quartiles 1 and 4 respectively. The risk ratio of pausing from the highest to lowest quartile, R4/1, is calculated as follows,
R4/1 = (H4/(H4+N4)) / (H1/(H1+N1)), The odds ratio and risk ratio for each variable is reported in Table 4. The ratios for MarkCap, Turnover, CorrS&P, VolSpike, and LiqDrop are all statistically significantly different from 1. The risk ratios are reported in the Abstract and Summary of Main Findings at the beginning of the paper.
Table 4: Odds ratio and risk ratio of pausing Ratios are from the highest to lowest quartile for the ETF variable of interest. p values were calculated testing the null hypothesis that the ratios were 1. Note: p ≤ 0.05 *, p ≤ 0.01 **, p ≤ 0.001 ***
6. Regression analysis Our regression analysis proceeds as follows. We first regress Pause on VolSpike and LiqDrop to establish their relationship with ETF pauses on August 24th. Second, we regress VolSpike and LiqDrop separately on ETF properties to determine whether these properties could potentially predict ETF pauses through one or both of these channels. Third, we regress Pause on all of the ETF properties separately and together to discern what ETF properties predicted ETF pauses on August 24th. Finally, we regress Pause on all ETF properties and also VolSpike and LiqDrop to discern if any ETF properties maintained residual predictive power of pauses. In Table 5, we report the results of regressing Pause on VolSpike and LiqDrop. Because volume spikes can reduce the liquidity in the order book, we use VolSpike as a control when regressing Pause on LiqDrop. As seen in the table, both VolSpike and LiqDrop increased the likelihood that an ETF paused on August 24th, and both relationships are statistically significant.
Variable Odds Ratio Risk RatioMarkCap 3.23*** 2.60***ADV$ 1.20 1.15Volatility 0.68 0.72Turnover 0.24*** 0.33***Liquidity 1.39 1.28CorrS&P 46.4*** 21.3***VolSpike 13.7*** 7.31***LiqDrop 9.06*** 5.24***

Division of Economic and Risk Analysis 10
Table 5: Regression of Pause on potential causes Separate columns are separate regressions. Regression coefficients are reported with standard errors in parentheses underneath. Note: p ≤ 0.05 *, p ≤ 0.01 **, p ≤ 0.001 ***
In Table 6, we report the results of regressing VolSpike and LiqDrop on ETF properties. As seen in the table, for VolSpike, the coefficient on CorrS&P is positive and significant and the coefficient on Volatility is negative and significant. Volume spikes tended to occur in ETFs with higher correlations with the S&P 500 index and in ETFs with lower volatility. For LiqDrop, the coefficients on Volatility, Liquidity, and CorrS&P are all significant, with Volatility reducing the drop in liquidity and Liquidity and CorrS&P increasing it.
(1) (2)Pause Pause
Intercept 0.24*** 0.24***(0.02) (0.02)
Tier2 -0.10*** -0.11***(0.03) (0.03)
VolSpike 7.4E-3*** 6.5E-3***(9.6E-4) (9.4E-4)
LiqDrop ― 3.8E-3***(5.0E-4)
R2 0.07 0.12F 34.2*** 43.3***Obs. 926 926
Division of Economic and Risk Analysis 11
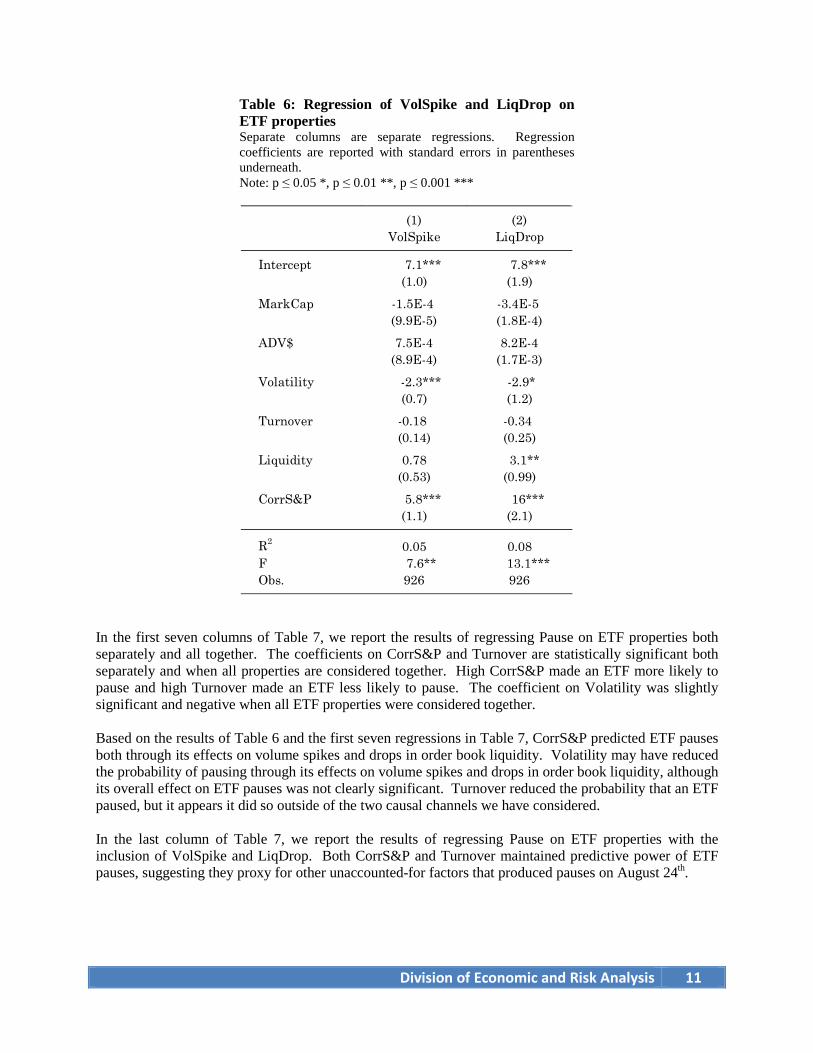
Table 6: Regression of VolSpike and LiqDrop on ETF properties Separate columns are separate regressions. Regression coefficients are reported with standard errors in parentheses underneath. Note: p ≤ 0.05 *, p ≤ 0.01 **, p ≤ 0.001 ***
In the first seven columns of Table 7, we report the results of regressing Pause on ETF properties both separately and all together. The coefficients on CorrS&P and Turnover are statistically significant both separately and when all properties are considered together. High CorrS&P made an ETF more likely to pause and high Turnover made an ETF less likely to pause. The coefficient on Volatility was slightly significant and negative when all ETF properties were considered together. Based on the results of Table 6 and the first seven regressions in Table 7, CorrS&P predicted ETF pauses both through its effects on volume spikes and drops in order book liquidity. Volatility may have reduced the probability of pausing through its effects on volume spikes and drops in order book liquidity, although its overall effect on ETF pauses was not clearly significant. Turnover reduced the probability that an ETF paused, but it appears it did so outside of the two causal channels we have considered. In the last column of Table 7, we report the results of regressing Pause on ETF properties with the inclusion of VolSpike and LiqDrop. Both CorrS&P and Turnover maintained predictive power of ETF pauses, suggesting they proxy for other unaccounted-for factors that produced pauses on August 24th.
(1) (2)VolSpike LiqDrop
Intercept 7.1*** 7.8***(1.0) (1.9)
MarkCap -1.5E-4 -3.4E-5 (9.9E-5) (1.8E-4)
ADV$ 7.5E-4 8.2E-4(8.9E-4) (1.7E-3)
Volatility -2.3*** -2.9*(0.7) (1.2)
Turnover -0.18 -0.34 (0.14) (0.25)
Liquidity 0.78 3.1**(0.53) (0.99)
CorrS&P 5.8*** 16***(1.1) (2.1)
R2 0.05 0.08F 7.6** 13.1***Obs. 926 926

Division of Economic and Risk Analysis 12
Table 7: Regression of Pause on ETF properties Separate columns are separate regressions. Regression coefficients are reported with standard errors in parentheses underneath. Note: p ≤ 0.05 *, p ≤ 0.01 **, p ≤ 0.001 ***
Finally, we demonstrate that volume spikes, liquidity drops, S&P 500 correlations, and turnover performed well at separating otherwise similar ETFs into those that paused and those that did not. In Table 8 on the left side, we estimate a regression model for all ETFs in our sample using only those factors found to be significant above: Turnover, CorrS&P, VolSpike, and LiqDrop. We then use the coefficients from the regression to estimate Pause, i.e., E[Pause], for the 20 ETFs that were most highly correlated to the S&P 500 index. The 20 ETF tickers are listed in Table 8 on the right side and sorted according to E[Pause]. As seen, the regression model perfectly separates those ETFs that paused from those that did not.
(1) (2) (3) (4) (5) (6) (7) (8)Pause Pause Pause Pause Pause Pause Pause Pause
Intercept 0.29*** 0.29*** 0.31*** 0.32*** 0.28*** 0.08** 0.16*** 0.11***(0.02) (0.02) (0.03) (0.02) (0.02) (0.03) (0.03) (0.03)
Tier2 -0.09** -0.08** -0.08** -0.10*** -0.08** -0.08** -0.10*** -0.12***(0.03) (0.03) (0.03) (0.03) (0.03) (0.03) (0.03) (0.03)
MarkCap -2.4E-6 ― ― ― ― ― -4.0E-6 -3.8E-6 (1.9E-6) (2.9E-6) (2.8E-6)
ADV$ ― -2.3E-5 ― ― ― ― 7.7E-6 5.7E-6(1.7E-5) 2.6E-5 2.5E-5
Volatility ― ― -0.025 ― ― ― -0.043* -0.021 (0.019) (0.019) (0.019)
Turnover ― ― ― -0.017*** ― ― -0.012** -0.011** (0.004) (0.004) (0.004)
Liquidity ― ― ― ― -1.7E-3 ― -3.7E-3 -0.013 (1.7E-2) (1.6E-2) (0.015)
CorrS&P ― ― ― ― ― 0.34*** 0.36*** 0.28***(0.03) (0.03) (0.03)
VolSpike ― ― ― ― ― ― ― 5.2E-3***(9.1E-4)
LiqDrop ― ― ― ― ― ― ― 2.7E-3***(4.9E-4)
R2 0.01 0.01 0.01 0.03 0.01 0.12 0.15 0.21F 4.8** 4.9** 4.8** 13.9*** 4.0* 64.9*** 22.7*** 26.5***Obs. 926 926 926 926 926 926 926 926

Division of Economic and Risk Analysis 13
Table 8: Explaining pauses and non-pauses among similar ETFs Left: Regression model for Pause using only those variables found to be significant in previous regressions. Regression coefficients are reported with standard errors in parentheses underneath. Right: The list of 20 ETFs with the highest correlation to the S&P 500 index, sorted by E[Pause], i.e., the expected value of pause for each ETF based on the regression model. Notice that sorting by E[Pause] separates those ETFs that paused from those that did not. Note: p ≤ 0.05 *, p ≤ 0.01 **, p ≤ 0.001 ***
Pause
Intercept 0.08**(0.03)
Tier2 -0.12**(0.03)
Turnover -0.012*** (0.003)
CorrS&P 0.27***(0.03)
VolSpike 5.3E-3***(9.1E-4)
LiqDrop 2.7E-3***(4.9E-4)
R2 0.20F 46.6***Obs. 926
Ticker Pause E[Pause] Tier2 Turnover CorrS&P VolSpike LiqDropSPY 0 0.28 0 14.41% 1.00 3.54 29.63IWB 0 0.37 0 1.04% 1.00 3.48 2.59SCHX 0 0.39 0 0.70% 1.00 5.05 5.19OEF 0 0.39 0 1.23% 0.99 7.06 4.69VOO 0 0.39 0 1.13% 1.00 4.19 9.66VTV 0 0.40 0 0.58% 0.99 8.54 4.45SCHV 0 0.41 0 0.64% 0.99 6.18 10.13VONE 0 0.41 0 0.42% 0.99 7.76 6.02SCHB 0 0.41 0 0.78% 1.00 8.84 6.50IWV 0 0.42 0 0.37% 1.00 11.22 3.43PRF 0 0.43 0 0.38% 0.99 10.91 6.66VTI 0 0.43 0 0.53% 1.00 9.33 10.17ITOT 0 0.43 0 0.66% 1.00 11.95 6.21SCHG 1 0.43 0 0.69% 0.99 9.48 13.09VV 1 0.45 0 0.32% 1.00 14.46 8.83IVV 1 0.47 0 1.21% 1.00 3.52 39.80CSM 1 0.55 0 0.52% 0.99 35.64 5.74IYY 1 0.61 0 0.38% 0.99 31.55 34.46MGC 1 0.68 0 0.22% 1.00 10.42 99.36IVW 1 1.30 0 0.71% 0.99 9.90 333.69

Division of Economic and Risk Analysis 14
References
Ané, Thierry, and Hélyette Geman, (2000), “Order flow, transaction clock, and normality of asset returns.” Journal of Finance, 55(5), 2259-2284. Brogaard, Jonathan, Allen Carrion, Thibaut Moyaert, Ryan Riordan, Andriy Shkilko, and Konstantin Sokolov, (2015), “High-Frequency Trading and Extreme Price Movements.” Working paper, available at SSRN: http://ssrn.com/abstract=2531122 Clark, Peter K, (1973), "A subordinated stochastic process model with finite variance for speculative prices." Econometrica, 41(1), 135-155. Farmer, J. Doyne, Laszlo Gillemot, Fabrizio Lillo, Szabolcs Mike, and Anindya Sen, (2004), “What really causes large price changes?” Quantitative Finance, 4(4), 383-397. Gabaix, Xavier, Parameswaran Gopikrishnan, Vasiliki Plerou, and H. Eugene Stanley, (2003), “A theory of power-law distributions in financial market fluctuations.” Nature, 423(6937), 267-270. Gerig, Austin, (2015), “High-Frequency Trading Synchronizes Prices in Financial Markets.” Working paper, available at SSRN: http://ssrn.com/abstract=2173247 Raman, Vikas, Michel A. Robe, and Pradeep K. Yadav, (2014), “Electronic Market Makers, Trader Anonymity and Market Fragility.” Working paper, available at SSRN: http://ssrn.com/abstract=2445223 Weber, Philipp, and Bernd Rosenow, (2006), “Large stock price changes: volume or liquidity?” Quantitative Finance, 6(1), 7-14.

Division of Economic and Risk Analysis 15
Appendix In Table A1, we demonstrate that the results of the paper continue to hold when considering ETF correlations with U.S. equity market indices other than the S&P 500 index. The coefficients in the regressions are nearly identical when using ETF correlation with the CRSP U.S. Total Market index (CorrTot) or the Nasdaq 100 index (CorrNDX) rather than the S&P 500 index (CorrS&P).
Table A1: Regression of Pause on ETF properties using different indices CorrS&P is the correlation of an ETF’s daily returns with the returns of the S&P 500 index over the 40 trading days prior to August 24th. CorrTot is correlation with the CRSP Total U.S. Market index and CorrNDX is correlation with the Nasdaq 100 index. Separate columns are separate regressions. Regression coefficients are reported with standard errors in parentheses underneath. Note: p ≤ 0.05 *, p ≤ 0.01 **, p ≤ 0.001 ***
(1) (2) (3) (4) (5) (6)Pause Pause Pause Pause Pause Pause
Intercept 0.08** 0.08** 0.08** 0.11*** 0.11*** 0.11***(0.03) (0.03) (0.03) (0.03) (0.03) (0.03)
Tier2 -0.08** -0.08** -0.08** -0.12*** -0.13*** -0.12***(0.03) (0.03) (0.03) (0.03) (0.03) (0.03)
MarkCap ― ― ― -3.8E-6 -3.7E-6 -3.8E-6 (2.8E-6) (2.8E-6) (2.8E-6)
ADV$ ― ― ― 5.7E-6 5.5E-6 5.6E-62.5E-5 2.5E-5 2.5E-5
Volatility ― ― ― -0.021 -0.023 -0.021 (0.019) (0.019) (0.019)
Turnover ― ― ― -0.011** -0.011** -0.010**(0.004) (0.004) (0.004)
Liquidity ― ― ― -0.013 -0.013 -0.014 (0.015) (0.015) (0.015)
CorrS&P 0.34*** ― ― 0.28*** ― ―(0.03) (0.03)
CorrTot ― 0.34*** ― ― 0.28*** ―(0.03) (0.03)
CorrNDX ― ― 0.38*** ― ― 0.31***(0.03) (0.03)
VolSpike ― ― ― 5.2E-3*** 5.2E-3*** 5.2E-3***(9.1E-4) (9.2E-4) (9.1E-4)
LiqDrop ― ― ― 2.7E-3*** 2.7E-3*** 2.7E-3***(4.9E-4) (4.9E-4) (4.9E-4)
R2 0.12 0.12 0.13 0.21 0.21 0.21F 64.9*** 62.9*** 66.2*** 26.5*** 26.5*** 26.6***Obs. 926 926 926 926 926 926
Division of Economic and Risk Analysis 16
Figure A1: Left: Plot of cumulative number of paused ETFs (left Y-axis) sorted by ascending ETF rank (X-axis) in “MarkCap” (right Y-axis). The dotted vertical lines indicate the cutoff boundaries for X-axis quartiles. Right: Table of “MarkCap” quartile statistics including the count of ETFs, count of paused ETFs, percent paused and quartile cutoff boundary values.

Division of Economic and Risk Analysis 17
Figure A2: Left: Plot of cumulative number of paused ETFs (left Y-axis) sorted by ascending ETF rank (X-axis) in “ADV$” (right Y-axis). The dotted vertical lines indicate the cutoff boundaries for X-axis quartiles. Right: Table of “ADV$” quartile statistics including the count of ETFs, count of paused ETFs, percent paused and quartile cutoff boundary values.

Division of Economic and Risk Analysis 18
Figure A3: Left: Plot of cumulative number of paused ETFs (left Y-axis) sorted by ascending ETF rank (X-axis) in “Volatility” (right Y-axis). The dotted vertical lines indicate the cutoff boundaries for X-axis quartiles. Right: Table of “Volatility” quartile statistics including the count of ETFs, count of paused ETFs, percent paused and quartile cutoff boundary values.

Division of Economic and Risk Analysis 19
Figure A4: Left: Plot of cumulative number of paused ETFs (left Y-axis) sorted by ascending ETF rank (X-axis) in “Turnover” (right Y-axis). The dotted vertical lines indicate the cutoff boundaries for X-axis quartiles. Right: Table of “Turnover” quartile statistics including the count of ETFs, count of paused ETFs, percent paused and quartile cutoff boundary values.
.

Division of Economic and Risk Analysis 20
Figure A5: Left: Plot of cumulative number of paused ETFs (left Y-axis) sorted by ascending ETF rank (X-axis) in “Liquidity” (right Y-axis). The dotted vertical lines indicate the cutoff boundaries for X-axis quartiles. Right: Table of “Liquidity” quartile statistics including the count of ETFs, count of paused ETFs, percent paused and quartile cutoff boundary values.
Division of Economic and Risk Analysis 21
Figure A6: Left: Plot of cumulative number of paused ETFs (left Y-axis) sorted by ascending ETF rank (X-axis) in “CorrS&P” (right Y-axis). The dotted vertical lines indicate the cutoff boundaries for X-axis quartiles. Right: Table of “CorrS&P” quartile statistics including the count of ETFs, count of paused ETFs, percent paused and quartile cutoff boundary values.
Division of Economic and Risk Analysis 22
Figure A7: Left: Plot of cumulative number of paused ETFs (left Y-axis) sorted by ascending ETF rank (X-axis) in “VolSpike” (right Y-axis). The dotted vertical lines indicate the cutoff boundaries for X-axis quartiles. Right: Table of “VolSpike” quartile statistics including the count of ETFs, count of paused ETFs, percent paused and quartile cutoff boundary values.

Division of Economic and Risk Analysis 23
Figure A8: Left: Plot of cumulative number of paused ETFs (left Y-axis) sorted by ascending ETF rank (X-axis) in “LiqDrop” (right Y-axis). The dotted vertical lines indicate the cutoff boundaries for X-axis quartiles. Right: Table of “LiqDrop” quartile statistics including the count of ETFs, count of paused ETFs, percent paused and quartile cutoff boundary values.