The Determinants Excessiveness of Current Account Deficits in … · current account balances were...
28
Munich Personal RePEc Archive The Determinants Excessiveness of Current Account Deficits in Eastern Europe the Former Soviet Union Aristovnik, Aleksander 5 June 2006 Online at https://mpra.ub.uni-muenchen.de/483/ MPRA Paper No. 483, posted 17 Oct 2006 UTC
Transcript of The Determinants Excessiveness of Current Account Deficits in … · current account balances were...

Munich Personal RePEc Archive
The Determinants Excessiveness of
Current Account Deficits in Eastern
Europe the Former Soviet Union
Aristovnik, Aleksander
5 June 2006
Online at https://mpra.ub.uni-muenchen.de/483/
MPRA Paper No. 483, posted 17 Oct 2006 UTC

THE WILLIAM DAVIDSON INSTITUTE AT THE UNIVERSITY OF MICHIGAN
The Determinants and Excessiveness of Current Account
Deficits in Eastern Europe and the Former Soviet Union
By: Aleksander Aristovnik
William Davidson Institute Working Paper Number 827
June 2006

THE DETERMINANTS AND EXCESSIVENESS OF
CURRENT ACCOUNT DEFICITS
IN EASTERN EUROPE AND THE FORMER SOVIET UNION
Aleksander Aristovnik
Faculty of Administration, University of Ljubljana, Slovenia
Abstract
The article investigates the main factors of current account deficits in order to assess the potential excessiveness
of current account deficits in selected countries of Eastern Europe and former Soviet Union. According to the
simulated benchmark calculated on the basis of selected determinants (in period 1992-2003), the results confirm
that the actual current account balances are generally close to their estimated levels in the 2000-2003 period in
the transition region. This notion is in line with the intertemporal approach to the current account balance,
suggesting that higher external deficits are a natural outcome when permanent domestic output exceeds the
current one and when current investments and government consumption exceed their permanent levels. Hence,
the results suggest that most countries in Eastern Europe and former Soviet Union are justified in running
relatively high current account deficits.
JEL Classification: C33, F32
Key words: transition countries, current account deficits, excessiveness, determinants, dynamic
panel data
Contact details:
University of Ljubljana
Faculty of Administration
Gosarjeva ulica 5
1000 Ljubljana
Slovenia
Tel: +386 (0)1 5805 548
Fax: +386 (0)1 5805 541
E-mail: [email protected]

2
NON-TECHNICAL SUMMARY
This article examines the main current account balance determinants in order to assess the
potential excessiveness of current account deficits in selected transition countries. In this
respect different estimators are presented and sensitivity tests are conducted, showing that the
results are mostly robust across estimators and across countries. The results are chiefly
consistent with the theoretical and previous empirical analysis and indicate that there is a
moderate level of persisting current account deficits beyond what can be explained by the
behavior of its determinants. Economic growth has a negative effect on the current account
balance, implying that the domestic growth rate is associated with a larger increase in
domestic investment than saving. Moreover, the stages of development hypothesis can be
confirmed since poorer countries in the region reveal higher current account deficits. Further,
shocks in public budget rates are likely to be accompanied with a current account balance
deterioration, confirming the validity of the twin deficit hypothesis in the region The results
also indicate the partial impact of demographic factors as well as the strong influence of the
growth rate of EU-15 countries on the external imbalances. Finally, appreciation of the real
exchange rate and a worsening of the terms of trade are generating a deterioration of the
current account deficit in the transition region.
According to the simulated benchmark calculated on the basis of selected determinants, the
results confirm that the actual current account balances are generally close to their estimated
levels in the 2000-2003 period. In fact, this suggests that most transition countries are
justified in running relatively high current account deficits. Indeed, the excessiveness
problem could only be noticed in some less developed transition countries such as Albania,
Bulgaria, Latvia and Tajikistan. This notion is also in line with the intertemporal approach to
the current account balance, suggesting that higher external deficits are a natural outcome
when permanent domestic output exceeds the current one and when current investments and
government consumption exceed their permanent levels. Nevertheless, when taking possible
liquidity and solvency issues into account the current account excessiveness problem might
be more widespread in the region. Moreover, for some CEE countries, despite their relatively
high level of integration with world capital markets, large current account deficits can present
a serious obstacle to further monetary integration. To conclude, since this article is one of the
few papers to address these topics there remains much to study by way of extending and
improving the presented analysis.

3
INTRODUCTION
The current account balance is an important indicator of a transition economy’s performance
and it plays several roles in policymakers’ analyses of economic developments. First, its
significance stems from the fact that the current account balance, reflecting the saving-
investment ratio, is closely related to the status of the fiscal balance and private savings
which are key factors of economic growth. Second, a country’s balance on the current
account is the difference between exports and imports, reflecting the totality of domestic
residents’ transactions with foreigners in the markets for goods and services. Third, since the
current account balance determines the evolution over time of a country’s stock of net claims
on (or liabilities to) the rest of the world, it reflects the intertemporal decisions of (domestic
and foreign) residents. Consequently, policymakers endeavor to explain current account
balance movements, to assess their sustainable (and/or excessive) levels and to seek to induce
changes to the balance through policy measures.
The growth of current account deficits in transition countries has raised questions about their
potential excessiveness and concerns regarding the potential impact a rapid and disorderly
correction of these imbalances might have. Roubini and Wachtel (1999) argued that the
current account deficits seen in transition countries reflect two important aspects. On one
hand, these deficits reflect the success of structural changes that have enabled capital and
investment inflows and have opened up prospects of fast economic growth. On the other
hand, from another perspective current account deficits frequently reflect mismanaged
transition processes featuring unsustainable imbalances that are potentially a source of a
value or a balance of payments crisis (e.g. Czech Rep. (1997), Russia (1998)). In a line with
this, strong demands have emerged to assess the ‘excessiveness’ of the external position of
the so far mainly neglected transition countries.
Practically all transition countries have been involved in their own catching-up processes
which includes financing a huge amount of productive investment without endangering their
external sustainability as far as their current account positions and external debt are
concerned. In fact, these countries suffer from relatively low and even stagnant saving rates.
Hence, to close the gap they need to turn to foreign savings which has generally induced the
high and even growing current account deficits of the last decade. In this respect, the problem
of external imbalances is particularly important for the Central and Eastern European (CEE)
countries which joined the EU in May 2004 and have already expressed their desire to adopt
the euro as soon as possible. Consequently, for the new (and other prospective) members of
the EU (e.g. Southern and Eastern Europe (SEE)) a trade-off has emerged between the
catching-up process and meeting the qualitative current account Maastricht criteria.1
The approach taken in the article is to view the current account positions as a reflection of
their saving and investment balances and, thus, to characterize the fundamental determinants
of their levels in a short- to medium-term perspective. Even though such an approach is
essentially empirical, it relies primarily on various theoretical models for identifying these
fundamental determinants and interpreting their impact on the current account levels.
Accordingly, the article primarily focuses on the (short-term) determinants of current account
1 Article 121 (Treaty of the European Union, 1992) states that among other (qualitative) criteria »the situation
and the evolution of the balance of current payments« of the applicant countries have to be examined before
they enter the Euro Area. Recently, an important step towards the Euro Area was taken by Estonia, Lithuania
and Slovenia which joined the ERM II with effect from 28 June 2004 (ECB, 2004) and by Latvia joining the
ERM II with effect from 2 May 2005.

4
dynamics in transition countries.2 In this respect, the empirical analysis expands and builds
upon some previous similar attempts for transition countries (see Roubini and Wachtel, 1999,
Doisy and Hervé, 2003, Zanghieri, 2004, Herrmann and Jochem, 2005 etc.) in the following
important ways:
a) annual data for 26 (or 14) transition countries in the 1992-2003 period are included;
b) a wide number of (internal and external) macroeconomic and other variables
suggested by theoretical and empirical literature is used;
c) time-series cross-sectional (panel) data with the inclusion of a variety of modern
econometric techniques are employed; and
d) the potential ex post excessiveness of current account deficits in transition countries in
the 2000-03 period is assessed.
The article is organized as follows. The next section briefly presents current account balance
trends and developments in transition countries in the 1992-2003 period. Section 3 presents
some theoretical considerations and empirical evidence on the current account balance and its
excessiveness, which have so far mainly been concentrated on developed economies. Section
4 then describes the empirical methodology, assumptions, data and empirical results of the
determinants and assesses (potential) excessive current account positions for the selected
transition countries. The final section provides some concluding remarks.
1. CURRENT ACCOUNT DEVELOPMENTS IN TRANSITION COUNTRIES
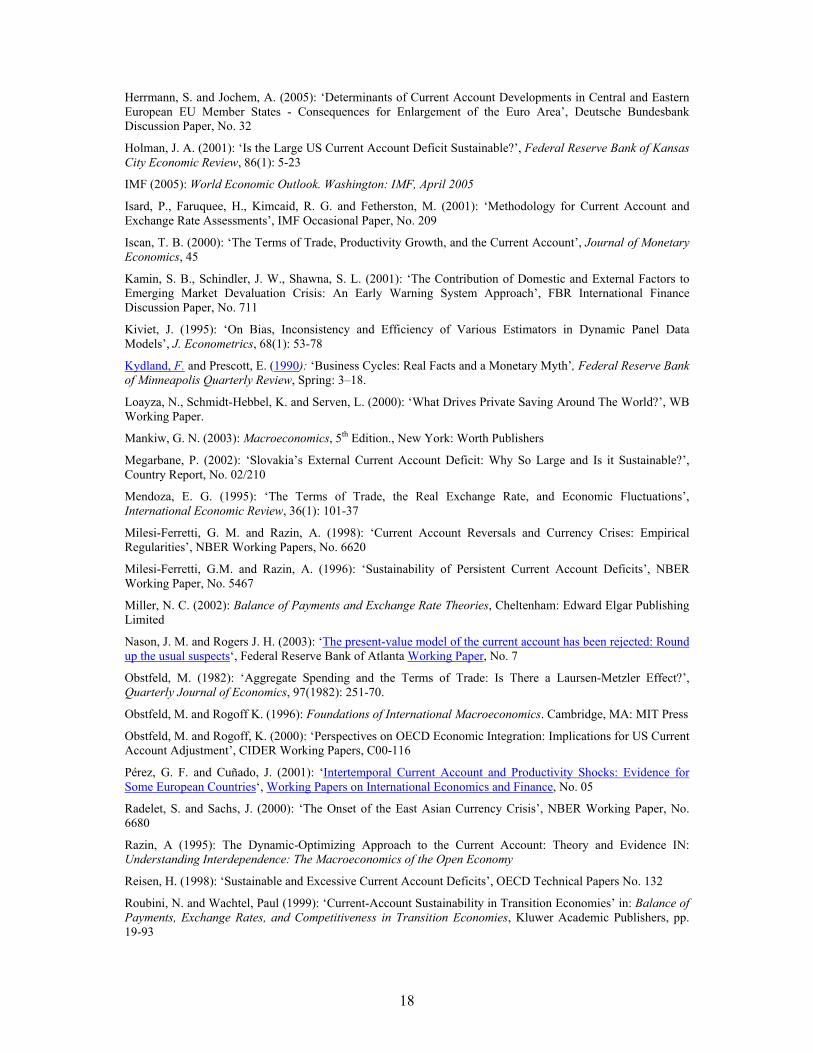
An overview of the current account balance in transition countries shows that, with the
exception of Russia – a major commodity exporter, the opening up to external trade has been
accompanied by significant current account deficits (see Table 1 in Appendix B). In CEE the
current account balances were not problematic with even a moderate positive balance as a
share of GDP up until 1994 (averaging around 1 per cent of GDP), reflecting contractions in
domestic demand, real exchange rate undervaluations and external financing constraints.
Afterwards, a significant current account deficit deterioration was noticed in the region,
peaking at almost 7 per cent of GDP in 1998 on average (e.g. Lithuania (11.7), Latvia (10.7)
and Slovakia (9.6)), mostly as a result of growing imports of both consumption and
investment goods. Moreover, the gradual growth of the current account deficit in the CEE
region reflects a combination of long-term growth and structural factors, external shocks and
domestic policies. More precisely, the deterioration of current accounts in the region was the
result of the growth of merchandise trade deficits, downward trends in the service balance,
rising indebtedness and profit repatriation as well as the consequence of the continuous real
appreciation of domestic currency in most of the cases examined.3
2 The short-term, cyclical influence of selected current account determinants could be considered by including
their average values. However, due to the relatively small number of observations (countries) in the sample the
long-term influence could not be assessed. 3 In transition countries a large part of real appreciation accounts for the real appreciation that reflects
productivity gains in the tradable sector (due to the Balassa-Samuelson (B-S) effect) This trend is commonly the
case in fast growing economies like transition countries where the catch-up process is mainly driven by an
increasingly productive tradable sector. For example, Coricelli and Jazbec (2001) estimated that B-S effects in
(19 selected) transition countries were between 0.7-1.2 per cent p.a. over the 1990-1998 period.

5
Figure 1: Average current account balances (CA), investments (I) and savings (S)
in transition regions (in percentage of GDP; unweighted average)
CEE
-10
0
10
20
30
92 93 94 95 96 97 98 99 00 01 02 03
CA I S
in %
of
GD
P
SEE CIS
-30
-20
-10
0
10
20
92 93 94 95 96 97 98 99 00 01 02 03
CA I S
in %
of
GD
P
-20
-10
0
10
20
30
92 93 94 95 96 97 98 99 00 01 02 03
CA I S
in %
of
GD
P
Sources: WDI (2004), EIU (2004), EBRD (2004), author’s calculations.
Similar but even more intensive current account deficit dynamics were seen in the
Commonwealth of Independent States (CIS) region by achieving the top average current
account deficit at a significantly higher level (13.7 per cent of GDP) than the CEE region in
1998. The major contributors to such a huge deterioration of the current account balance were
some countries in the region with current account deficits above 20 per cent of GDP (e.g.
Turkmenistan (37.4), Azerbaijan (30.7) etc.). Several factors contributed to this. First, many
countries in the region experienced large losses in their terms of trade as prices for energy
imports from the former Council for Mutual Economic Assistance’s (CMEA) trading partners
moved to market-determined levels. Second, these countries ran high negative fiscal
imbalances as the authorities tried to absorb the revenue and expenditure pressure associated
with sharp falls in national income and fiscal restructuring (see Table 1 in Appendix B).
Third, as a result of slow progress in building a competitive and diversified export sector
trade liberalization mainly stimulated imports of consumer goods and services. As a response
to the Russian crisis the average current account deficits narrowed in the group. However, in
many cases the deficits remained high – around or even above 10 per cent of GDP
(Azerbaijan (15.9), Armenia (8.1) etc.) on average in the 2001-2003 period. On the other
hand, the SEE region achieved the highest average current account deficit with around 20 per
cent of GDP in 1992 due to the enormous deficit in Albania (68.5 per cent). Later, these huge
external imbalances improved significantly. However, at the beginning of the second half of
the 1990s and in the early years of the 21st century they again deteriorated, ultimately raising
the question about their sustainability and excessiveness. Eventually, the average current
account deficit was 8.2 per cent of GDP in the 2001-2003 period in comparison to the
previous three years when it averaged out at 5.9 per cent of GDP (see Figure 1).

6
2. VIEWS ON THE CURRENT ACCOUNT BALANCE AND ITS EXCESSIVENESS
2.1. Do Current Account Deficits Matter?
In his comprehensive review Edwards (2001) describes economists’ evolving views
regarding the nature and consequences of current account deficits. The attitude has changed
from ‘the current account matters’ to ‘the current account deficit does not matter as long as
the public sector is in balance’, then to ‘the current account deficit may matter’. In fact, in the
1970s this elastic approach to the current account was placed on the backburner and attention
was switched to the intertemporal properties of current account deficits. In terms of national
accounting, the current account is simply the difference between national saving and
investment. Since both saving and investment are inherently intertemporal phenomena, e.g.
saving with respect to the lifetime of individuals and investment with respect to the expected
future return on investment, the same must also hold for the current account.
In this respect, Obstfeld and Rogoff (1996) provided an extensive review of modern models
of the current account that assume intertemporal optimization on behalf of consumers and
firms. In this type of model (assuming a constant interest rate), consumption smoothing
across periods is one of the fundamental drivers of the current account. According to the
intertemporal approach, if output falls below its permanent value there will be a higher
current account deficit. Similarly, if investment increases above its permanent value the
current account deficit will grow. The reason for this is that new investment projects will be
partially financed by an increase in foreign borrowing, thus generating a bigger current
account deficit. Likewise, increased government consumption will result in a higher current
account deficit. If the constant world interest rate assumption is relaxed, a country’s net
foreign asset position and the level of the world interest rate will fundamentally affect the
current account deficit. Accordingly, if a country is a net foreign debtor, and the world
interest rate exceeds its permanent level, the current account deficit will be higher (Miller,
2002).
During the last three decades most financial crises have highlighted the part played by large
current account deficits in the run-up to crisis episodes. Consequently, the concept of a
sustainable (and excessive) current account deficit became an important theoretical, political
and economic issue. In this sense, Corsetti et al. (1998) concluded that, on the whole, those
countries hit hardest by currency crises were those running persistent current account deficits
throughout the 1990s.4 This result is confirmed by Radelet and Sachs (2000), Kamin et al.
(2001) and Edwards (2004), whereby Edwards shows that the probability of experiencing
abrupt current account reversals is closely linked to the size of current account deficits.
Accordingly, although this is not a universal truth, the conventional wisdom is that current
account deficits above 5 per cent of GDP generally represent a problem, especially if funded
through short-term borrowing. However, because of the lasting improvement in capital
market access, the persistent enhancement of the terms of trade and productivity growth seen
in transition countries can, as predicted by the intertemporal models, finance moderate
current account deficits on an ongoing basis. Nevertheless, Edwards (2001) supported the
relevancy of current account imbalances as there is strong evidence that large current account
deficits should be a cause for concern of economic policy.
4 Nevertheless, this does not imply that a large deficit always leads to a crisis, nor that a crisis can only occur if a
large current account deficit is present (Summers, 2000).

7
2.2. Solvency, sustainability and excessive current account imbalances
According to Milesi-Ferretti and Razin (1996, hereafter ‘MFR’), three different yet interrelated
concepts can be distinguished: an economy’s solvency, current account sustainability and
current account deficit excessiveness. In fact, the three concepts of current account deficits
imply an increasing order of restrictiveness. First, an economy is treated as solvent if the
present discounted value of the future trade surplus is equal to the current external
indebtedness. Ultimately, such a definition is difficult to apply since it relies on future
events/policy decisions without imposing any ‘structure’ on them. Second, a narrower
definition of solvency brings us to a more widespread idea i.e. the definition of sustainability.
A current account is sustainable if the continuation of the current government policy stance
and/or of present private sector behavior will not entail a need for a ‘drastic’ policy shift or a
balance of payments (currency) crisis.5 Finally, an unsustainable deficit should be
distinguished from an excessive one, i.e. a deficit which is too large to be explained in the
terms of any given model of consumption, investment and production. In fact, the notion of
excessive current account deficits is based of deviations from an ‘optimal’ benchmark, which
can be calculated under some strict assumptions such as perfect capital mobility and efficient
financial markets. Since our primary goal is to assess the potential excessiveness of current
account balances, we focus particularly on the latter concept.
Three main approaches to the empirical implementation of the concept of excessiveness have
recently been used. The first approach relies on a structural estimation of the model, focusing
in particular on estimated responses to various types of productivity shocks (permanent,
global etc.), as well as other shocks (see Glick and Rogoff, 1995 and Razin, 1995). While the
presence of investment adjustment costs and stochastic productivity lend more realism to the
model, the data requirements for the model’s estimation have so far limited its applications to
a sample of developed countries (see, for example, Iscan, 2000, Perez de Gracia and Cũnado,
2001 etc.).
The second approach emphasizes the consumption-smoothing role of the current account,
where the current account deficit reflects expected increases in future net output. The basic
idea is based on the application of Campbell’s (1987) methodology for testing the permanent
income theory of consumption, and is consistent in the estimation of a simple VAR model.
The model’s implication is that the current account balance should incorporate all available
information for predicting future changes in net output. Accordingly, a predicted current
account path is constructed and can be compared with the actual one in order to gauge the
excessiveness of external imbalances (see, for example, Adedeji, 2001, Nason and Rogers,
2003 etc.).
The third one is based on saving-investments balance determinants as suggested by the
theoretical literature (including intertemporal approach literature). On the basis of these
determinants, fitted values of the model are compared to the actual levels of the current
account, presenting a benchmark of excessiveness. This approach is closely related to the
intertemporal approach to the current account where the current account imbalance is a result
of an intertemporal optimization with the objective of optimally distributing consumption
over time (consumption smoothing) (see Sachs, 1981, Obstfeld, 1982 and Svensson and
5 A similar notion of current account sustainability has been applied by many authors such as Obstfeld and
Rogoff (2000), Holman (2001), Megarbane (2002) and Zanghieri (2004).

8
Razin, 1983). This approach has recently been widely applied (see, for example, Isard et al.,
2001, Doisy and Hervé, 2003 and Bussière et al., 2004) and indicates the special importance
of demographics, stage of development and fiscal policy (in a long-term period) and the real
exchange rate, terms of trade as well as world economy conditions (economic growth and
interest rate) (in a short-term period). In fact, the article builds upon the work of the authors
cited above and, in particular, generalizes the work of Doisy and Hervé (2003) and Bussière
et al. (2004) by extending the analysis to practically all transition countries for a longer time
span and by exploring a wider range of specifications.
3. THE EMPIRICAL FRAMEWORK
3.1. Empirical methodology
The initial aim of the empirical research is to identify the main (short-term) determinants of
current account deficits in the transition region in the 1992-2003 period. Following previous
theoretical and empirical studies of Debelle and Faruqee (1996), Calderon et al. (2002),
Chinn and Prasad (2003), Doisy and Hervé (2003), Bussière et al. (2004) and Zanghieri
(2004) we estimate a model which may be expressed in the following general form:
CAit = αi + γt + βCAit-1 + λxit + ui + εit (1)
where the dependent variable is current account balance (CA) (negative values indicate a
deficit) for the i-th unit at time t and the vector of independent variables, (xi), includes real
GDP growth (GDPG), relative income (RELY), general government budget balance (GOVB),
openness (OPEN), external debt (EXTDEBT) and GDP growth of the EU-15 (GDP-EU) (for
the extended-form model - model A); and general government budget balance (GGBB),
relative dependency (RELDEP), real effective exchange rate (REER) and terms of trade
(TOT) (for the reduced-form model - model B). The vector β and λ is a vector of coefficients,
γt denotes time-specific effects which are peculiar to a particular period but constant for all
countries and ui and εit denote a two-part error term. The first component of the latter, ui,
captures unobserved and time-invariant country effects that influence the current account
while εit captures the residual errors. The term αi represents the effects of those variables
peculiar to the i-th individual country in more or less the same fashion over time. In our case,
the dummy vector represents 26 (model A) or 14 (model B) individual countries entering the
panel data.
As heterogeneity is the main characteristic of the countries under consideration, other
specifications might be preferred to a simple OLS specification in our analysis. In fact, in the
case of transition countries this argument is plausible once differences like macroeconomic
conditions and structural reforms are taken into account. Moreover, since panel data typically
exhibit group-wise heteroscedastic, contemporaneously and serially correlated residuals, we
must take into account the existence of a non-spherical error structure. Therefore, we
extended the benchmark OLS model by using special techniques, i.e. the Parks-Kmenta
method and the Beck-Katz PCSE method.
The Parks-Kmenta method performs the estimation by using Generalized Least Squares
(GLS) and consists of applying two sequential transformations on the estimated model. The
first transformation removes the serial correlation, while second simultaneously corrects for
contemporaneous correlation and heteroscedasticity (see Beck and Katz, 1996)). The Parks-

9
Kmenta method was revised by Beck and Katz (1996). They confirm that GLS have optimal
properties for panel data but remark that GLS can only be used when the variance-covariance
matrix of errors is known. Otherwise, it should be estimated from the sample implying the
use of Feasible Generalized Least Squares (FGLS) instead of GLS. On the other hand, Beck
and Katz (1996) proposed a less complex method, retaining OLS parameter estimates
(consistent but inefficient) and replacing OLS standard errors with panel-corrected standard
errors (PCSE). Since the sample of the models (A and B) contains more countries than annual
observations per country, we propose using ordinary least squares with panel corrected
standard errors (OLS-PCSE). Nevertheless, we present the estimations based on both
methods (FGLS and OLS-PCSE), including country and time-fixed effects.
However, since CAit is a function of ui, CAit-1 will also be a function of ui thereby rendering
OLS biased and inconsistent. Further, ui is likely to be correlated with at least one or more of
the RHS variables. Therefore, we use fixed (FEM or sometimes called a Least Square
Dummy Variable – LSDV) and random effects (REM) estimators adding both country and
time effects. Indeed, the Breusch-Pagan LM test confirms the appropriateness of the models
based on panel data. Moreover, Hausman’s test indicates that for both models the fixed-effect
model (LSDV) provides a better specification. But these approaches do not correct the biases
due to the presence of the lagged depended variable.6 Thus, in order to obtain consistent and
efficient estimates of the model we employed the generalized method of moments GMM-IV
of Arellano and Bond (1991). Initially, a first difference transformation of equation 1 is used
to do away with the correlation between ui and CAit-1 and xit:
CAit - CAit-1 = β(CAit-1 - CAit-2) + γ(xit - xit-1) + (εit - εit-1) (2)
Next, the lagged dependent variable (CAit-1 - CAit-2) is instrumented for. As long as εit are not
serially correlated, a natural choice for an instrument is CAit-2. Additional instruments can be
obtained by utilizing the orthogonality conditions existing between the various available
lagged CAit and εit. The consistency of the GMM estimator depends on whether lagged values
of the explanatory variables are valid instruments in the current account balance regression.
We address this issue by considering two specification tests suggested by Arellano and Bond
(1991) and Arellano and Bover (1995). The first is a Sargan test of over-identifying
restrictions which tests the overall validity of the instruments by analyzing the sample along
with the momentary conditions used in the estimation process. Failure to reject the null
hypothesis lends support to the model. The second test examines the hypothesis that the error
term εit is not serially correlated. We test whether the differenced error term is first-, second-,
and third-order serially correlated. If the test confirms the null hypothesis of the absence of a
first-order serial correlation and rejects it of the second-order, then we conclude that the
original error term is serially uncorrelated and use the corresponding momentary conditions.
Since all alternatives to the LSDV estimators are not without their disadvantages, we estimate
all four estimators. Indeed, while these estimators have superior asymptotic properties they
are less precise than the LSDV (see Kiviet, 1995). Bond (2002) also emphasizes that
alternatives to the LSDV estimator may be subject to large sample biases where the
instruments are weak. In addition, Chen et al. (2005) suggest that the use of the OLS-PCSE
method is most appropriate if we are concentrating on testing hypotheses and to use the
6 In particular, the LSDV estimator introduces a correlation between the transformed βCAit-1 and transformed
error εit even when εit is not serially correlated. The LSDV estimator is thus biased while it will be consistent for
a longer panel (i.e. larger T).

10
FGLS method if our prime interest is accurate coefficient estimates. In what follows, we
estimate the models using the LSDV, FGLS, OLS-PCSE and GMM-IV estimators and use all
our estimators and base the further analysis on the joint evidence. The results of the tests and
partial regression coefficient are presented in Tables 1 and 2.
3.2. Data
We estimate models (A and B) on the basis of pooled cross-sectional and time-series (panel)
data for transition countries in the 1992-2003 period. The data set comes from the EBRD
Transition Reports, the Economist Intelligence Unit (EIU) and World Development
Indicators (WDI) and covers the 26 transition countries, i.e. eight CEE, six SEE and twelve
CIS countries. Our estimates are based on unbalanced panel data while data for some
countries included in the sample were unavailable for the whole period. The dependent
variable is a current account balance (CA), expressed as a ratio to GDP (negative values
indicate a deficit). Independent variables (for model A) are: a) the lagged CA; b) growth rate
of gross domestic product, where the real economic growth is taken (GDPG); c) income per
capita relative to income per capita in the EU-15 (RELY); d) the general government budget
balance as measured by the general government budget balance (GOVB); e) openness,
expressed as the ratio of goods and services trade to GDP (OPEN); f) external debt, measured
as external debt as a percentage of GDP (EXTDEBT); and, g) real economic growth in the
EU-15 (GDPG-EU). Moreover, independent variables (for model B) are (besides GOVB): a)
age dependency ratio, defined as the ratio of the number of people younger than 15 and older
than 65 years over the total population relative to sample average (RELDEP); b) the real
effective exchange rate (REER) is expressed as an index with the base year 1997; an increase
in the index denotes real appreciation; and, c) terms of trade (TOT) is considered as the ratio
of export and import prices with the base year 1996.7 Variable descriptions and data sources
as well as the countries included in the sample are presented in Appendix A. In addition,
summary statistics of the variables are shown in Table 3 in Appendix B.
3.3. Empirical results
The results of the empirical analyses of (short-term) current account determinants of
transition countries by using the LDSV, FGLS, OLS-PCSE and GMM-IV estimators for both
models (A and B) are presented in Tables 1 and 2.8 The estimates of partial regression
coefficients are generally in line with the theoretical and previous empirical analysis. Since
we estimate dynamic panel data model, the most appropriate technique is the GMM-IV
estimator. However, in order to ensure the robustness of the estimates the estimators of other
econometric techniques are also employed.
Persistency: Empirical analysis shows that the lagged current account balance (as a ratio to
GDP) has a positive and statistically significant effect on the current account. The size of this
partial regression coefficient (0.19-0.33) reveals the modest persistence of transitory shocks,
implying that the persistency of these shocks on the current account is up to one year (similar
to heavily-indebted countries as found by Calderon et al. (2002)). The results reflect a
7 Additional variables, like financial deepening (ratio between M2 and GDP) and foreign real interest rate
(LIBOR) do not improve the model since they express theoretically expected, but statistically insignificant
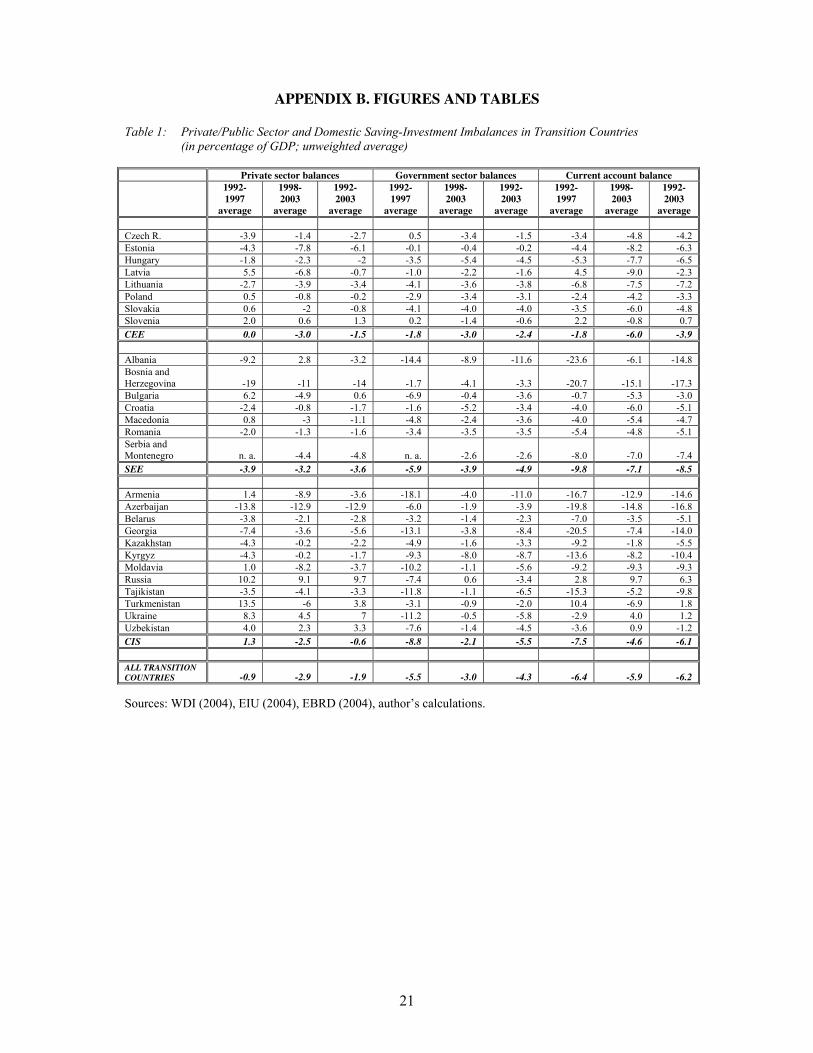
results. 8 Since there is no high pair-wise correlation among explanatory variables (see Tables 4 and 5 in Appendix B)
and variance inflation factors (VIF) are within the permitted borders, multicollinearity seems not to be a
problem in our analyses.

11
relatively moderate current account adjustment process, which could be influenced by foreign
creditors as well as by decisions of the private sector. Indeed, it captures the partial
adjustment of the current account and can be explained by decisions on private sector net
savings which are influenced by the relatively high persistency of private consumption in the
region. The alternative estimators yield approximately similar results regarding the size and
significance of the lagged current account balance. Moreover, such results are similar to the
results of Bussière et al. (2004), Zanghieri (2004), and Herrmann and Jochem (2005).
Table 1: Estimates of Regression Coefficients for Model (A) –
26 Transition Countries, (1992-2003)
(Dependent Variable: CA)
Explanatory Variables
LSDV
FGLS
OLS-PCSE
GMM-IV
Persistency
CA-1
0.349
(0.051; 0.00)
0.438
(0.04; 0.00)
0.432
(0.101; 0.00)
0.330
(0.065; 0.00)
Internal Economic Conditions
GDPG
-0.158
(0.053; 0.00)
-0.155
(0.045; 0.00)
-0.197
(0.080; 0.01)
-0.544
(0.233; 0.02)
RELY (in logs)
0.066
(0.038; 0.08)
0.004
(0.004; 0.35)
0.012
(0.007; 0.08)
0.064
(0.021; 0.00)
GOVB
0.727
(0.143; 0.00)
0.653
(0.097; 0.00)
0.608
(0.177; 0.00)
0.391
(0.199; 0.05)
External Sector
OPEN
-0.019
(0.023; 0.38)
-0.027
(0.008; 0.00)
-0.038
(0.011; 0.00)
-0.011
(0.030; 0.70)
EXTDEBT-1
0.043
(0.018; 0.02)
0.020
(0.011; 0.06)
0.038
(0.016; 0.02)
0.024
(0.036; 0.50)
Evolution of the World Economy
GDPG-EU
0.750
(0.343; 0.03)
0.388
(0.208; 0.06)
0.650
(0.500; 0.19)
1.243
(0.605; 0.04)
Adj. R2 0.357 0.457
No. of Countries 26 26 26 26
No. of obs. 255 255 255 207
Hausman test (χ2)
(p)
82.6
(0.00)
Modified Wald test (χ2)
(p)
2249.48
(0.00)
Breusch-Pagan LM (χ2)
(p)
6.13
(0.03)
Woolbridge test (F)
(p)
56.64
(0.00)
Sargan test (p) 0.179
Arellano-Bond test AR(1) (p) 0.000
Arellano-Bond test AR(2) (p) 0.010
Note: standard errors (se) and p-values are presented below their corresponding coefficient (se; p).
Source: author’s calculations.
Domestic Economic Conditions
Real Economic Growth: An increase in the domestic output growth rate (GDPG) has the
effect of expanding the current account deficit. The result is consistent with theoretical

12
expectations that domestic economic growth accelerates demand for foreign goods and
services and consequently deteriorates the current account balance (see Abel and Bernanke,
2001 and Gandolfo, 2004). A one-percentage point rise in GDP growth leads to about 0.54 of
a percentage point rise in the current account deficit. Although a rise in domestic output
growth may be associated with a greater savings rate, it seems that its correlation with the
investment rate is somewhat stronger, thus leading to a worsening of the current account
balance.9 When endogeneity is not controlled for, a smaller coefficient on growth may be the
result of negative reverse causality. This is consistent with the notion that a larger current
account deficit brings about a poorer growth performance in the region. In fact, these results
are in line with the findings of Zanghieri (2004) for selected transition countries, Calderon et
al. (2002) for developing countries, Chinn and Prasad (2003) for developed countries and the
IMF (2005) for emerging market economies.
Relative income: We find a positive association between relative income (RELY) and the
current account balance. A per capita income of 10 per cent below the average of the EU-15
lowers the current account by approximately 0.64 of a percentage point. The rationale is that
less developed countries are assumed to grow faster than the average and are thus borrowing
against future income (consistent with the stages of development hypothesis). Indeed, the
consumption smoothing process, lack of physical capital and relatively large educated labor
force provide an important explanation for current account deficits that reflect the catching-
up process seen in the region (Duczynski, 2005). This result is similar to the findings of
Calderon et al. (2002), Chinn et al. (2003), Zanghieri (2004) and Herrmann and Jochem
(2005).
Public balance: The government budget balance (GOVB) appears to be positively statistically
significant in relation to the current account balance. A one-percentage point rise in the
government budget balance leads to about 0.30-0.40 of a percentage point rise in the current
account balance. The estimated coefficient for GOVB suggests that a one-percentage point
increase in the government budget deficit is associated on average with approximately two-
thirds of a percentage point increase in the current-account-deficit-to-GDP ratio, with all
other things being equal. Such results imply moderate liquidity constraints and the inelasticity
of domestic (private) consumption and are similar to the results of Roubinni (1988), Chinn
and Prasad (2003), Zanghieri (2004), Herrmann and Jochem (2005). The significant positive
relationship between the government budget balance and the current account provide some
evidence in favor of the so-called twin deficits hypothesis, but we could not reject the inter-
temporal approach due to the short time period involved and disregarding the distinction
between temporal and permanent shocks.
Age dependency ratio: The assessment of the relevance of a demographic factor (i.e. ratio of
the number of people younger than 15 and older than 65 years of age over the total
population - RELDEP) shows negative and statistically significant results (FGLS and OLS-
PCSE estimators). This negative relationship between the variables is closely related to the
life-cycle hypothesis where younger and older parts of the population save less. Partial
confirmation of the impact of a demographic factor on the external imbalance probably
reflects its (negative) influence on (private and public) domestic savings, which additionally
confirms the validity of the twin deficit hypothesis in the region (see also Loayza et al., 2000).
9 The results confirm the theory of real business cycles (see Kydland and Prescott, 1990) in that part where it
advocates the dominance of investments over savings when the economy grows. In addition, the results are in
line with new Keynesian macroeconomics, which predicts anti-cyclical effects of the current account balance
(see Mankiw, 2003).

13
Moreover, such results are similar to the results of Bussière et al. (2004), Zanghieri (2004)
and Herrmann and Jochem (2005).
External Economic Conditions
Openness: We find that the degree of openness (OPEN) of an economy is weakly negatively
(but statistically insignificantly) related to its current account position. However, partial
confirmation of the correlation is expressed by statistically significant estimates based on the
FGLS and OLS-PCSE estimators. In fact, the openness variable could be indicative of
attributes such as liberalized trade, receptiveness to technology transfers, and the ability to
service external debt through export earnings (see MFR, 1996). Thus, transition countries
with greater exposure to international trade tend to be more attractive to foreign capital.
Further, the results indicate that external imbalances are significantly related to capital and
financial account liberalization in the region. In any case, the results are similar to the
conclusions of Chinn and Prasad (2003) for developing countries.
Real effective exchange rate: The relationship between the real exchange rate (REER) and the
current account deficit is positive and statistically significant, confirming the predictions of
the Mundell-Fleming model. Indeed, real appreciation of the domestic currency by 10 per
cent has the effect of reducing the current account balance by around 0.90 of a percentage
point. The result is not a surprise since real appreciation reflects productivity gains in
manufacturing (Balassa-Samuelson effect) as well as demand-side influences such as the use
of capital inflows and relatively high government spending to build up infrastructure. In
addition, the result (not shown in Table 2) cannot confirm the appropriateness of the ‘J-curve’
in the region. Similar results have been found by Aristovnik in Zajc (2001), Calderon et al.
(2002) and Herrmann and Jochem (2005).
Terms of trade: We find a positive and statistically significant relationship between the terms
of trade (TOT) and current account balance, which is somewhat consistent with the
Harberger-Lauresen-Metzler effect10
. In fact, an improvement of the terms of trade by 10 per
cent leads to a current account deficit that is between 0.6-1.4 percentage points lower.
Nevertheless, the decline in savings was not solely a result of adverse transitory terms of
trade shocks but also a consequence of the poor economic state of these countries, especially
in the first half of the 1990s. Similar results are found by Debelle in Faruqee (1996),
Calderon et al. (2002) and Aristovnik (2002).
External debt: A country’s current account deficit is likely to be effected by its stock of
foreign assets. Nevertheless, the effect of the stock of debt on its flow (which is to a large
extent given by the current account deficit) is a complex relationship marked by non-
linearities, asymmetries, and threshold effects. Because of a lack of data, total external debt
(EXTDEBT) can be used as an indicator of a country’s net foreign asset position. We find a
positive and statistically significant association between total (lagged) external debt and the
current account balance. A one-percentage point rise in total external debt leads to about
0.02-0.04 of a percentage point rise in the current account balance (in the next year).
However, one should not regard this relationship as a univocal reflection of the sole debt-
cycle hypothesis. Indeed, many transition countries started their transition process with
10 The Harberger-Lauresen-Metzler effect predicts that positive transitory terms of trade shocks produce an
improvement in current income that is greater than that in permanent income. Accordingly, an increase in
savings follows and an improvement in current account positions emerges (see Obstfeld, 1982 and Mendoza,
1995).

14
virtually no external debt, while some of them have accumulated sizable amounts of
liabilities during the last decade. The results are in line with the previous findings of Doisy
and Hervé (2003) and Zanghieri (2004).
Table 2: Estimates of Regression Coefficients for Model (B) –
14 Transition Countries, (1992-2003)
(Dependent Variable: CA)
Explanatory Variables
LSDV
FGLS
OLS-PCSE
GMM-IV
Persistency
CA-1
0.193
(0.083; 0.02)
0.424
(0.067; 0.00)
0.406
(0.109; 0.00)
0.191
(0.091; 0.04)
Internal Economic Conditions
RELDEP (in logs)
0.043
(0.133; 0.75)
-0.180
(0.056; 0.00)
-0.158
(0.058; 0.01)
-0.370
(0.290; 0.20)
GOVB
0.262
(0.123; 0.04)
0.292
(0.067; 0.01)
0.174
(0.136; 0.20)
0.256
(0.134; 0.06)
External Sector
REER (in logs)
-0.086
(0.025; 0.00)
-0.094
(0.019; 0.00)
-0.092
(0.023; 0.00)
-0.090
(0.038; 0.02)
TOT (in logs)
0.057
(0.029; 0.06)
0.060
(0.025; 0.02)
0.057
(0.028; 0.04)
0.143
(0.043; 0.00)
Adj. R2 0.335 0.455
No. of Countries 14 14 14 14
No. of obs. 141 141 141 119
Hausman test (χ2)
(p)
73.4
(0.00)
Modified Wald test (χ2)
(p)
123.91
(0.00)
Breusch-Pagan LM (χ2)
(p)
2.90
(0.09)
Woolbridge test (F)
(p)
67.61
(0.00)
Sargan test (p) 0.197
Arellano-Bond test AR(1) (p) 0.000
Arellano-Bond test AR(2) (p) 0.367
Note: standard errors (se) and p-values are presented below their corresponding coefficient (se; p).
Source: author’s calculations.
Evolution of the World Economy
EU economic growth: An increase in the growth rate of the EU-15 (GDPG-EU) leads to a
reduction in the current account deficits of transition countries. This can be explained by both
a rise in the demand for transition country exports and the increased capital flows between
developed countries at the expense of flows to transition countries. According to our
estimates a one-percentage point rise in the growth rate of EU-15 countries would generate an
improvement of between 0.75 and 1.25 percentage points in the current account balance.
Indeed, the results are consistent with previous findings of MFR (1996) and Calderon et al.
(2002).

15
On the basis of the determinants we simulate a historical benchmark for the current account
positions to be compared to the actual current account balance (2000-2003 averages). In
particular, we attempt to assess whether the actual current account positions among transition
countries are consistent with the estimated ones. As there is generally no evidence of a
possible downward bias of the LSDV estimator, we focus on estimates based on the
(relatively more robust) LSDV estimator. Table 3 reports the actual and calculated positions
which are implied by the value of models A and B.
Table 3: Estimates of Current Account Deficits Excessiveness in Transition Countries
(averages 2000-03)
Estimated CA
(average 2000-03)
model A
Estimated CA
(average 2000-03)
model B
CA
(average 2000-03)
CEE
Czech R. -7.7 -6.0 -5.9
Estonia -6.3 -7.1 -8.8
Hungary -9.3 -7.8 -7.7
Latvia -5.3 - -8.4
Lithuania -7.7 -7.7 -5.6
Poland -4.5 -4.1 -3.4
Slovakia -6.3 -5.5 -5.2
Slovenia -0.9 0.0 -0.2
SEE
Albania -4.4 - -6.6
Bulgaria -3.9 -3.3 -6.6
Bosnia and
Herzegovina -15.2 - -16.0
Croatia -6.8 -6.7 -5.5
Macedonia -7.1 -5.1 -5.9
Romania -5.3 -4.7 -4.6
CIS
Armenia -11.5 - -9.8
Azerbaijan -13.4 - -11.3
Belarus -3.3 - -3.2
Georgia -5.9 - -6.9
Kazakhstan -0.2 -0.5 -1.1
Kyrgyz -6.2 - -3.1
Moldavia -7.9 -8.4 -7.4
Russia 11.3 10.3 11.4
Tajikistan -3.9 - -4.7
Turkmenistan -8.4 - 6.3
Ukraine 3.9 - 5.5
Uzbekistan 1.0 - 1.7
Note: (-) calculation is impossible due to a lack of data
Source: Tables 1 and 2; author’s calculations.
In fact, a number of important conclusions can be drawn from Table 3. First, the performance
of the empirical models is good for most counties in the sample. This indicates that the
models capture important elements to explain the current account positions for selected
transition countries. Second, an important implication of the models is that the actual current

16
account positions in most transition countries are recently (2000-03 period averages) not out
of line with the fundamentals. Indeed, within the group of CEE countries only Estonia and
Latvia with a current account deficit over 8 per cent of GDP show larger deficits than their
estimated ones. On the other hand, it is relatively common to have excessive (negative)
current account positions in the SEE region, such as in Albania, Bulgaria and Bosnia and
Herzegovina. Even though most CIS countries have current account positions in line with the
fundamentals, there are some exceptions such as Georgia, Kazakhstan and Tajikistan.
Moreover, the confirmation of substantial differences in the degree of convergence achieved
so far and the economic fundamentals is presented by the relatively high external imbalances
which are not seen as being excessive (for example in Azerbaijan (average deficit of 11.3 per
cent of GDP), Armenia (9.8 per cent) and Hungary (7.7 per cent)). To sum up, there are
generally no significant problems of excessive current account deficits in the region, with
only a few countries recently exceeding estimated normal levels of external imbalance.
CONCLUSIONS
This article examines the main current account balance determinants in order to assess the
potential excessiveness of current account deficits in selected transition countries. In this
respect different estimators are presented and sensitivity tests are conducted, showing that the
results are mostly robust across estimators and across countries. The results are chiefly
consistent with the theoretical and previous empirical analysis and indicate that there is a
moderate level of persisting current account deficits beyond what can be explained by the
behavior of its determinants. Economic growth has a negative effect on the current account
balance, implying that the domestic growth rate is associated with a larger increase in
domestic investment than saving. Moreover, the stages of development hypothesis can be
confirmed since poorer countries in the region reveal higher current account deficits. Further,
shocks in public budget rates are likely to be accompanied with a current account balance
deterioration, confirming the validity of the twin deficit hypothesis in the region The results
also indicate the partial impact of demographic factors as well as the strong influence of the
growth rate of EU-15 countries on the external imbalances. Finally, appreciation of the real
exchange rate and a worsening of the terms of trade are generating a deterioration of the
current account deficit in the transition region.
According to the simulated benchmark calculated on the basis of selected determinants, the
results confirm that the actual current account balances are generally close to their estimated
levels in the 2000-2003 period. In fact, this suggests that most transition countries are
justified in running relatively high current account deficits. Indeed, the excessiveness
problem could only be noticed in some less developed transition countries such as Albania,
Bulgaria, Latvia and Tajikistan. This notion is also in line with the intertemporal approach to
the current account balance, suggesting that higher external deficits are a natural outcome
when permanent domestic output exceeds the current one and when current investments and
government consumption exceed their permanent levels. Nevertheless, when taking possible
liquidity and solvency issues into account the current account excessiveness problem might
be more widespread in the region. Moreover, for some CEE countries, despite their relatively
high level of integration with world capital markets, large current account deficits can present
a serious obstacle to further monetary integration. To conclude, since this article is one of the
few papers to address these topics there remains much to study by way of extending and
improving the presented analysis.

17
BIBLIOGRAPHY
Abell, A. B. and Bernanke, B. S. (2001): Macroeconomics, 4th Edition, Boston: Addison Wesley Longman
Adedeji, O. S. (2001): ‘The Size and Sustainability of Nigerian Current Account Deficits’, IMF, Washington,
Working Paper, No. 01/87
Arellano, M. and Bond, S. (1991): ‘Some tests of specification for panel data: Monte Carlo evidence and an
application to employment equations’, Review of Economic Studies, 58, pp. 277-297
Arellano, M. and Bover, O. (1995): ‘Another look at the instrumental variable estimation of error-components
models‘, Journal of Econometrics, 68(1): 29-51
Aristovnik, A. and Zajc, K. (2001): ‘Current Account Performance and Fiscal Policy: Evidence on the Twin
Deficits in Central and Eastern Europe’, in: Economics of Transition: Theory, Experience and EU Enlargement,
INFER, Berlin, 7-8 September, 2001, pp. 121-140
Aristovnik, A. (2002): ‘What determines the current account balances in Central and Eastern Europe?’, Naše
gospodarstvo (Our Economy), 48(5/6): 450-467
Bond, S. (2002): ‘Dynamic Panel Data Models: A Guide to Micro Data Methods and Practices’, Cemmap
Working Paper, No. 09/02
Beck, N. and Katz, J. N. (1996): ‘Nuisance vs. substance: specifying and estimating time-series-cross models’,
Political Analysis, 6: 1-36
Bussière, M., Fratzscher, M., and Müller G. J. (2004): ‘Current account dynamics in OECD and EU acceding
countries – an intertemporal approach’, EIB, Luxembourg, EIB Working Paper Series, No. 311
Calderon, C., Chong A. and Loayza, N. (2002): ‘Determinants of Current Account Deficits in Developing
Countries’, Contributions to Macroeconomics, 2: 1-35
Campbell, J. Y. (1987): ‘Does Saving Anticipate Declining Labor Income? An Alternative Test of the
Permanent Income Hypothesis’, Econometrica, 55, 6, pp. 1249-1273.
Chen, X., Lin, S. and Reed, R. W. (2005): ‘Another Look At What To Do With Time-Series Cross-Section
Data’, Economics Working Paper Archive at WUSTL, No. 0506004.
Chinn, M. and Prasad, E. S. (2003): ‘Medium-term Determinants of Current Accounts in Industrial and
Developing Countries: An Empirical Exploration’, Journal of International Economics, Elsevier, 59(2003), 1,
pp. 47-76
Coricelli, F. and Jazbec, B. (2001): ‘Real Exchange Rate Dynamics in Transition Economies’, CEPR Discussion
Papers, No. 2869
Corsetti, G., Pesenti, P. and Roubini, N. (1998): ‘What Caused the Asian Currency and Financial Crisis? Part I:
A Macroeconomic Overview’, NBER Working Paper, No. 6833
Debelle, G. and Faruqee, H. (1996): ‘What Determines the Current Account? A Cross-Sectional and Panel
Approach’, IMF Working Paper, No. 58
Doisy, H. and Hervé, K. (2003): ‘Les implication des deficits ciurants des PECO’, Economies Internationale,
95: 59-88
Duczynski, P. (2005): ‘Long-run Current Account Deficits in Transition Economies’, Eastern European
Economics, 43(3): 21-54
ECB (2004) Convergence Report 2004, Frankfurt: ECB
Edwards, S. (2001): ‘Does the Current Account Matter?’, NBER Working Paper, No. 8275
Edwards, S. (2004): ‘Thirty Years of Current Account Imbalances, Current Account Reversals and Sudden
Stops’, NBER Working Paper, No. 10276
Gandolfo, G. (2004): Elements of International Economics. Berlin: Springer-Verlag.
Glick R. and Rogoff K. (1995): ‘Global versus Country-Specific Productivity Shocks and the Current Account’,
Journal of Monetary Economics, 35
18
Herrmann, S. and Jochem, A. (2005): ‘Determinants of Current Account Developments in Central and Eastern
European EU Member States - Consequences for Enlargement of the Euro Area’, Deutsche Bundesbank
Discussion Paper, No. 32
Holman, J. A. (2001): ‘Is the Large US Current Account Deficit Sustainable?’, Federal Reserve Bank of Kansas
City Economic Review, 86(1): 5-23
IMF (2005): World Economic Outlook. Washington: IMF, April 2005
Isard, P., Faruquee, H., Kimcaid, R. G. and Fetherston, M. (2001): ‘Methodology for Current Account and
Exchange Rate Assessments’, IMF Occasional Paper, No. 209
Iscan, T. B. (2000): ‘The Terms of Trade, Productivity Growth, and the Current Account’, Journal of Monetary
Economics, 45
Kamin, S. B., Schindler, J. W., Shawna, S. L. (2001): ‘The Contribution of Domestic and External Factors to
Emerging Market Devaluation Crisis: An Early Warning System Approach’, FBR International Finance
Discussion Paper, No. 711
Kiviet, J. (1995): ‘On Bias, Inconsistency and Efficiency of Various Estimators in Dynamic Panel Data
Models’, J. Econometrics, 68(1): 53-78
Kydland, F. and Prescott, E. (1990): ‘Business Cycles: Real Facts and a Monetary Myth’, Federal Reserve Bank
of Minneapolis Quarterly Review, Spring: 3–18.
Loayza, N., Schmidt-Hebbel, K. and Serven, L. (2000): ‘What Drives Private Saving Around The World?’, WB
Working Paper.
Mankiw, G. N. (2003): Macroeconomics, 5th Edition., New York: Worth Publishers
Megarbane, P. (2002): ‘Slovakia’s External Current Account Deficit: Why So Large and Is it Sustainable?’,
Country Report, No. 02/210
Mendoza, E. G. (1995): ‘The Terms of Trade, the Real Exchange Rate, and Economic Fluctuations’,
International Economic Review, 36(1): 101-37
Milesi-Ferretti, G. M. and Razin, A. (1998): ‘Current Account Reversals and Currency Crises: Empirical
Regularities’, NBER Working Papers, No. 6620
Milesi-Ferretti, G.M. and Razin, A. (1996): ‘Sustainability of Persistent Current Account Deficits’, NBER
Working Paper, No. 5467
Miller, N. C. (2002): Balance of Payments and Exchange Rate Theories, Cheltenham: Edward Elgar Publishing
Limited
Nason, J. M. and Rogers J. H. (2003): ‘The present-value model of the current account has been rejected: Round
up the usual suspects‘, Federal Reserve Bank of Atlanta Working Paper, No. 7
Obstfeld, M. (1982): ‘Aggregate Spending and the Terms of Trade: Is There a Laursen-Metzler Effect?’,
Quarterly Journal of Economics, 97(1982): 251-70.
Obstfeld, M. and Rogoff K. (1996): Foundations of International Macroeconomics. Cambridge, MA: MIT Press
Obstfeld, M. and Rogoff, K. (2000): ‘Perspectives on OECD Economic Integration: Implications for US Current
Account Adjustment’, CIDER Working Papers, C00-116
Pérez, G. F. and Cuñado, J. (2001): ‘Intertemporal Current Account and Productivity Shocks: Evidence for
Some European Countries‘, Working Papers on International Economics and Finance, No. 05
Radelet, S. and Sachs, J. (2000): ‘The Onset of the East Asian Currency Crisis’, NBER Working Paper, No.
6680
Razin, A (1995): The Dynamic-Optimizing Approach to the Current Account: Theory and Evidence IN:
Understanding Interdependence: The Macroeconomics of the Open Economy
Reisen, H. (1998): ‘Sustainable and Excessive Current Account Deficits’, OECD Technical Papers No. 132
Roubini, N. and Wachtel, Paul (1999): ‘Current-Account Sustainability in Transition Economies’ in: Balance of
Payments, Exchange Rates, and Competitiveness in Transition Economies, Kluwer Academic Publishers, pp.
19-93

19
Sachs, J. D. (1981): ‘The Current Account and Macroeconomic Adjustment in the 1970s’, Brookings Papers on
Economic Activity, No. 1
Senhadji, A. S. (1998): ‘Dynamics of the trade balance and the terms of trade in LDCs: The S-curve’, Journal of
International Economics, 46: 105-131.
Servén, L. (1999): ‘Terms-of-trade Shocks and Optimal Investment: Another Look at the Laursen-Metzler
effect’, Journal of International Money and Finance, 18: 337-65.
Summers, L. H. (2000): ‘International Financial Crises: Causes, Prevention, and Cures’, American Economic
Review, 90 (2): 12-28.
Svensson, L. and Razin, A. (1983): ‘The Terms of Trade and the Current Account: The Harberger-Laursen-
Metzler Effect’, Journal of Political Economy, 91(1): 97-125
Tornell, A. and Lane, P (1994): ‘Are Windfalls a Curse? A Non-representative Agent Model of the Current
Account and Fiscal Policy’, NBER Working Paper, No. 4839
Zanghieri, P. (2004): ‘Current Account Dynamics in New EU Members’, CEPII Working Paper, No. 2004-07

20
APPENDIX A. VARIABLE DESCRIPTIONS AND DATA SOURCES
The data used in this article were drawn from a number of different sources. Below we provide a list of the
abbreviations (symbols) for the variables used in the analysis, a description of the variables and the source(s)
from which the primary data used for constructing these variables were taken.
VARIABLE SYMBOL DESCRIPTION NOTE SOURCE*
Current account
balance CA
Current account
balance
(% of GDP)
positive
(negative) values
indicate a surplus
(deficit)
EIU
EBRD
IFS
Real economic
growth GDPG
Growth rate of real
GDP (%) WDI
Relative income
RELY
Income per capita
relative to income per
capita in the EU-15
(in logs)
WDI
EUROSTAT
General government
budget balance GOVB
General government
budget balance (% of
GDP)
positive
(negative) values
indicate a surplus
(deficit)
EBRD
Age dependency
ratio
RELDEP
Ratio of the number
of people younger
than 15 and older
than 65 years over
the total population
relative to the sample
average (in logs)
WDI
Openness OPEN
Sum of exports and
imports of goods and
services
(% of GDP)
WDI
Real effective
exchange rate REER
Real effective
exchange rate index,
base year 1997 =100
(in logs)
increase in index
denotes real
appreciation.
EIU
Terms of trade TOT
Changes in the
relative prices of
exports and imports,
base year 1997 =100
(in logs)
EIU
External debt EXTDEBT Gross external debt
(in % GDP) EBRD
Real economic
growth of the EU GDPG-EU
Growth rate of real
GDP in EU-15
(in %)
EUROSTAT
COUNTRIES included in the
sample (model A)
CEE – Czech R., Estonia, Hungary, Latvia, Lithuania, Poland,
Slovakia and Slovenia; SEE – Albania, Bosnia and
Herzegovina, Bulgaria, Croatia, Macedonia and Romania; CIS –
Armenia, Azerbaijan, Belarus, Georgia, Kazakhstan, Kyrgyz,
Moldavia, Russia, Tajikistan, Turkmenistan, Ukraine and
Uzbekistan
COUNTRIES included in the
sample (model B)
CEE – Czech R., Estonia, Hungary, Lithuania, Poland, Slovakia
and Slovenia; SEE – Bulgaria, Croatia, Macedonia and
Romania; CIS –Kazakhstan, Moldavia and Russia * WDI – World Development Indicators (World Bank); EUROSTAT – EU database;
EBRD – Transition Report (different issues); IFS – International Financial Statistics (IFS).
21
APPENDIX B. FIGURES AND TABLES
Table 1: Private/Public Sector and Domestic Saving-Investment Imbalances in Transition Countries
(in percentage of GDP; unweighted average)
Private sector balances Government sector balances Current account balance
1992-
1997
average
1998-
2003
average
1992-
2003
average
1992-
1997
average
1998-
2003
average
1992-
2003
average
1992-
1997
average
1998-
2003
average
1992-
2003
average
Czech R. -3.9 -1.4 -2.7 0.5 -3.4 -1.5 -3.4 -4.8 -4.2
Estonia -4.3 -7.8 -6.1 -0.1 -0.4 -0.2 -4.4 -8.2 -6.3
Hungary -1.8 -2.3 -2 -3.5 -5.4 -4.5 -5.3 -7.7 -6.5
Latvia 5.5 -6.8 -0.7 -1.0 -2.2 -1.6 4.5 -9.0 -2.3
Lithuania -2.7 -3.9 -3.4 -4.1 -3.6 -3.8 -6.8 -7.5 -7.2
Poland 0.5 -0.8 -0.2 -2.9 -3.4 -3.1 -2.4 -4.2 -3.3
Slovakia 0.6 -2 -0.8 -4.1 -4.0 -4.0 -3.5 -6.0 -4.8
Slovenia 2.0 0.6 1.3 0.2 -1.4 -0.6 2.2 -0.8 0.7
CEE 0.0 -3.0 -1.5 -1.8 -3.0 -2.4 -1.8 -6.0 -3.9
Albania -9.2 2.8 -3.2 -14.4 -8.9 -11.6 -23.6 -6.1 -14.8
Bosnia and
Herzegovina -19 -11 -14 -1.7 -4.1 -3.3 -20.7 -15.1 -17.3
Bulgaria 6.2 -4.9 0.6 -6.9 -0.4 -3.6 -0.7 -5.3 -3.0
Croatia -2.4 -0.8 -1.7 -1.6 -5.2 -3.4 -4.0 -6.0 -5.1
Macedonia 0.8 -3 -1.1 -4.8 -2.4 -3.6 -4.0 -5.4 -4.7
Romania -2.0 -1.3 -1.6 -3.4 -3.5 -3.5 -5.4 -4.8 -5.1
Serbia and
Montenegro n. a. -4.4 -4.8 n. a. -2.6 -2.6 -8.0 -7.0 -7.4
SEE -3.9 -3.2 -3.6 -5.9 -3.9 -4.9 -9.8 -7.1 -8.5
Armenia 1.4 -8.9 -3.6 -18.1 -4.0 -11.0 -16.7 -12.9 -14.6
Azerbaijan -13.8 -12.9 -12.9 -6.0 -1.9 -3.9 -19.8 -14.8 -16.8
Belarus -3.8 -2.1 -2.8 -3.2 -1.4 -2.3 -7.0 -3.5 -5.1
Georgia -7.4 -3.6 -5.6 -13.1 -3.8 -8.4 -20.5 -7.4 -14.0
Kazakhstan -4.3 -0.2 -2.2 -4.9 -1.6 -3.3 -9.2 -1.8 -5.5
Kyrgyz -4.3 -0.2 -1.7 -9.3 -8.0 -8.7 -13.6 -8.2 -10.4
Moldavia 1.0 -8.2 -3.7 -10.2 -1.1 -5.6 -9.2 -9.3 -9.3
Russia 10.2 9.1 9.7 -7.4 0.6 -3.4 2.8 9.7 6.3
Tajikistan -3.5 -4.1 -3.3 -11.8 -1.1 -6.5 -15.3 -5.2 -9.8
Turkmenistan 13.5 -6 3.8 -3.1 -0.9 -2.0 10.4 -6.9 1.8
Ukraine 8.3 4.5 7 -11.2 -0.5 -5.8 -2.9 4.0 1.2
Uzbekistan 4.0 2.3 3.3 -7.6 -1.4 -4.5 -3.6 0.9 -1.2
CIS 1.3 -2.5 -0.6 -8.8 -2.1 -5.5 -7.5 -4.6 -6.1
ALL TRANSITION
COUNTRIES -0.9 -2.9 -1.9 -5.5 -3.0 -4.3 -6.4 -5.9 -6.2
Sources: WDI (2004), EIU (2004), EBRD (2004), author’s calculations.

22
Table 2: Determinants of Current Account Deficits
Variable
Theoretically
Expected Sign
Empirical Sign And Sources
Persistency
+
+
Debelle and Faruqee (1996),
Reisen (1998), Calderon et al. (2002), Chinn and
Prasad (2003), Zanghieri (2004), Bussière et al. (2004),
Herrmann and Jochem (2005)
Internal Economic Conditions
Growth Rate
+
+
MFR (1996, 1998),
Aristovnik and Zajc (2001),
Aristovnik (2002), IMF (2005)
Local
productivity
shock
(temporary/
permanent):
+/-
+
Glick and Rogoff (1995),
Razin (1995),
Reisen (1998)
Global
productivity
shock
(temporary/
permanent):
+/0
0
Reisen (1998)
Relative income
-
-
Backus et al. (1994), Chinn and Prasad (2003),
Bussière et al. (2004),
Herrmann and Jochem (2005)
Investments
+
+
Glick and Rogoff (1995), Debelle and Faruqee (1996),
Reisen (1998), Bussière et al. (2004),
Herrmann and Jochem (2005)
Savings
-
-
Calderon, et al. (2002),
Aristovnik (2002)
Demographics
+
-
Doisy and Hervé (2003),
IMF (2005)
Fiscal policy
+
+
Debelle and Faruqee (1996), Aristovnik and Zajc
(2001),
Doisy and Hervé (2003), Zanghieri (2004),
Bussière et al. (2004), Herrmann and Jochem (2005),
Duczynski (2005), IMF (2005)

23
External Sector
Degree of Openness
+/-
-
MFR (1996, 1998),
Calderon, et al. (2002), Aristovnik (2002),
Chinn and Prasad (2003),
Doisy and Hervé (2003), Duczynski (2005)
Real Effective Exchange Rate
Marshall-
Lerner effect:
+
+
Debelle & Faruqee (1996), Aristovnik and Zajc (2001),
Calderon, et al. (2002), Herrmann and Jochem (2005)
Harberger-
Laursen-
Metzler effect:
-
-
Razin (1995),
Debelle & Faruqee (1996),
Reisen (1998), Iscan (1998),
Calderon, et al. (2002), Duncan (2003),
IMF (2005)
Terms of Trade
+/-
J-krivulja: Tornell and Lane (1994), Serven (1999)
S-krivulja: Senhadji (1998)
Net Foreign Assets
+/-
+/-
Calderon, et al. (2002), Chinn and Prasad (2003)
+
Aristovnik (2002)
Evolution of the World Economy
Developed Countries Growth
Rate
-
-
MFR (1996, 1998),
Calderon, et al. (2002)
World Real Interest Rate
Net Creditor:
+
Net
Debtor: -
0
Reisen (1998)
-
Calderon, et al. (2002)
Note: + deficit increase; - deficit decrease.
24
Table 3: Current Account Determinants: Descriptive Statistics - 26 Transtion Countries
(Annual Data, 1992–2003)
Variables No. of obs. Mean Std. Dev. Minimum Maximum
Current account
balance (CA)
306
-0.06109
0.10104
-0.685
0.685
Internal Economic Conditions
Real economic
growth (GDPG)
316
0.13237
0.10598
-0.449
0.859
Relative income
(RELY)*
308
-1.65895
0.76872
-3.5367
-0.43510
Budget balance
(GOVB)
313
-0.43633
0.57040
-0.547
0.031
Age
dependency
(RELDEP) *
324
-0.01522
0.16856
-0.26084
0.45929
External Sector
Openness
(OPEN)
307
0.97035
0.33169
0.35962
1.91352
Real effective
exchange rate
(REER) *
181
4.517367
0.3199754
2.375557
4.96783
Terms of trade
(TOT) *
172
4.60747
0.1199813
4.279915
5.05745
External debt
(EXTDEBT)
302
0.49427
0.31451
0.040
1.92878
External Sector
EU real
economic
growth (GDPG-EU)
12
0.01875
0.01117
-0.004
0.036
Note: * in logs.
Source: author’s calculations.
Table 4: Simple Correlation Matrix of Current Account Determinats: 26 transtion countries (model A)
(annual data, 1992–2003)
CA-1
GDPG
RELY*
GOVB
OPEN
EXT-
DEBT-1
GDPG-
EU
CA-1 1.00
GDPG -0.11 1.00
RELY* 0.30 0.01 1.00
GOVB 0.44 0.25 0.24 1.00
OPEN -0.03 -0.02 0.18 0.26 1.00
EXTDEBT-1 -0.23 0.30 -0.22 -0.11 0.15 1.00
GDPG-EU -0.09 0.02 -0.07 0.02 -0.04 -0.06 1.00
Note: * in logs.
Source: author’s calculations.

25
Table 5: Simple Correlation Matrix of Current Account Determinats: 14 transtion countries (model B)
(annual data, 1992–2003)
CA-1
GOVB
RELDEP*
OPEN
REER*
TOT*
CA-1 1.00
GOVB 0.29 1.00
RELDEP* -0.38 -0.18 1.00
OPEN -0.34 0.16 0.05 1.00
REER* -0.33 0.01 -0.04 0.17 1.00
TOT* 0.01 0.09 0.07 0.01 0.30 1.00
Note: * in logs.
Source: author’s calculations.

DAVIDSON INSTITUTE WORKING PAPER SERIES - Most Recent Papers The entire Working Paper Series may be downloaded free of charge at: www.wdi.umich.edu
CURRENT AS OF 7/6/06
Publication Authors Date
No. 827: The Determinants & Excessiveness of Current AccountDeficits
in Eastern Europe & the Former Soviet Union
Aleksander Aristovnik June 2006
No. 826: Privatization with Government Control: Evidence from the
Russian Oil Sector
Daniel Berkowitz and Yadviga
Semikolenova
February
2006
No. 825: Corruption & Bureaucratic Structure in a Developing Economy John Bennett and Saul Estrin February
2006
No. 824: Regulatory Barriers & Entry in Developing Economies John Bennett and Saul Estrin March
2006
No. 823: Enterprise Restructuring in Belarus Marina Bakanova, Saul Estrin,
Igor Pelipas and Sergei Pukovic
May 2006
No. 822: Reforms, Entry and Productivity: Some Evidence from the
Indian Manufacturing Sector
Sumon Kumar Bhaumik,
Shubhashis Gangopadhyay and
Shagun Krishnan
March
2006
No. 821: Falling Walls and Lifting Curtains: Analysis of Border Effects
in Transition Countries
Yener Kandogan March
2006
No. 820: Home versus Host Country Effects of FDI: Searching for New
Evidence of Productivity Spillovers
Priit Vahter and Jaan Masso March
2006
No. 819: Earnings Inequality in India: Has the Rise of Caste and
Religion Based Politics in India had an Impact?
Kumar S. Bhaumik and Manisha
Chakrabarty
March
2006
No. 818: Financial Deregulation and Industrial Development:
Subsequent Impacton Economic Growth in the Czech Republic,
Hungary and Poland
Patricia McGrath February
2006
No. 817: The Politics of Institutional Renovation & Economic
Upgrading: Lessons from the Argentine Wine Industry
Gerald Mc Dermott Dec 2005
No. 816: Worker Morale in Russia: An Exploratory Study Susan Linz, Linda Good &
Patricia Huddleston
January
2006
No. 815: Capital Account Liberalization and Exchange Rate Regime
Choice, What Scope for Flexibility in Tunisia?
BEN ALI Mohamed Sami
March
2006
No. 814: Evaluation of Mass Privatization in Bulgaria Jeffrey Miller March
2006
No. 813: Current Account Adjustments in Selected Transition Countries Aleksander Aristovnik Feb. 2006
No. 812: Reassessing the Standard of Living in the Soviet Union: An
Analysis Using Archival and Anthropometric Data
Elizabeth Brainerd Jan. 2006
No. 811: Foreign Exchange Risk Premium Determinants: Case of
Armenia
Tigran Poghoysan and Evzen
Kocenda
March
2006
No. 810: Convergence and shocks in the road to EU: Empirical
investigations for Bulgaria and Romania
Jean-Marc Figuet and Nikolay
Nenovsky
March
2006
No. 809: The Cost Structure of Microfinance Institutions in Eastern
Europe and Central Asia
Valentina Hartarska, Steven B.
Caudill and Daniel M. Gropper
Jan. 2006
No. 808: Ethnic Conflict & Economic Disparity: Serbians & Albanians
in Kosovo
Sumon Bhaumik, Ira Gang and
Myeong-Su Yun
Sept. 2005
No. 807: A Note on Poverty in Kosovo Sumon Bhaumik, Ira Gang and
Myeong-Su Yun
Dec. 2005
No. 806: Privatization & State Capacity in Postcommunist Society Lawrence King and Patrick
Hamm
Dec. 2005
No. 805: Corporate Governance, Managers’ Independence, Exporting &
Performance in Firms in Transition Economies
Igor Filatotchev, Natalia
Isachenkova and Tomasz
Mickiewicz,
Nov. 2005
No. 804: Financial Deregulation & Economic Growth in the Czech
Republic, Hungary and Poland
Patricia Mc Grath Nov. 2005
No. 803: Evaluating the Causal Effect of Foreign Acquisition on
Domestic Performances: The Case of Slovenian Manufacturing Firms
Sergio Salis Jan. 2006