The current economic situation Jönköping March 2009 Deputy Governor Svante Öberg
37
The current economic situation Jönköping March 2009 Deputy Governor Svante Öberg
-
Upload
eleanor-knight -
Category
Documents
-
view
25 -
download
0
description
The current economic situation Jönköping March 2009 Deputy Governor Svante Öberg. Summary. The financial turmoil worsened last autumn and has developed into a global financial crisis. - PowerPoint PPT Presentation
Transcript of The current economic situation Jönköping March 2009 Deputy Governor Svante Öberg
The current economic situation
Jönköping March 2009
Deputy GovernorSvante Öberg
Summary The financial turmoil worsened last autumn
and has developed into a global financial crisis.
International developments will be weak this year and there is a considerable risk that economic activity will be weak next year, too.
GDP growth in Sweden will be negative this year and inflation will fall.
The Riksbank has cut the interest rate to 1 per cent and may need to cut it further.
Contents Financial market International outlook Sweden Monetary policy
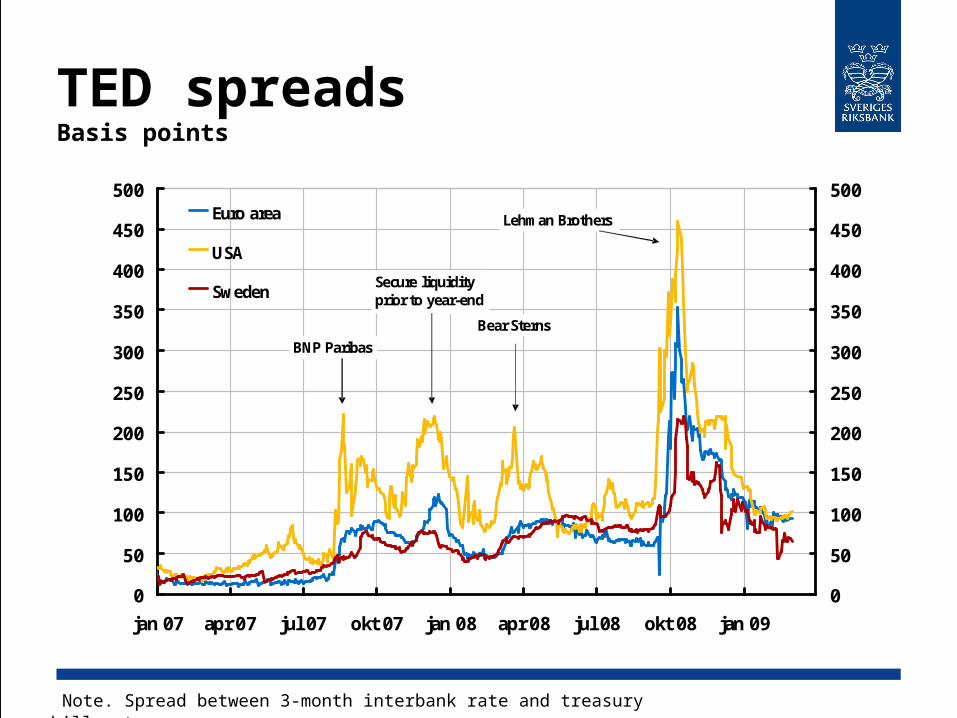
TED spreads Basis points
Note. Spread between 3-month interbank rate and treasury bill rate.
0
50
100
150
200
250
300
350
400
450
500
jan 07 apr 07 jul 07 okt 07 jan 08 apr 08 jul 08 okt 08 jan 09
0
50
100
150
200
250
300
350
400
450
500Euro area
USA
Sweden
BNP Paribas
Secure liquidity prior to year-end
Bear Sterns
Lehman Brothers
Causes of the crisis Global imbalances Expansionary monetary policy Credit rating agencies Supervision Regulatory frameworks
Management of the crisis Liquidity supplied by central banks ELA to individual institutions Interest rate cuts Guarantees and capital injections Expansionary fiscal policy
Despite these measures the financial markets are still functioning much less efficiently than normal
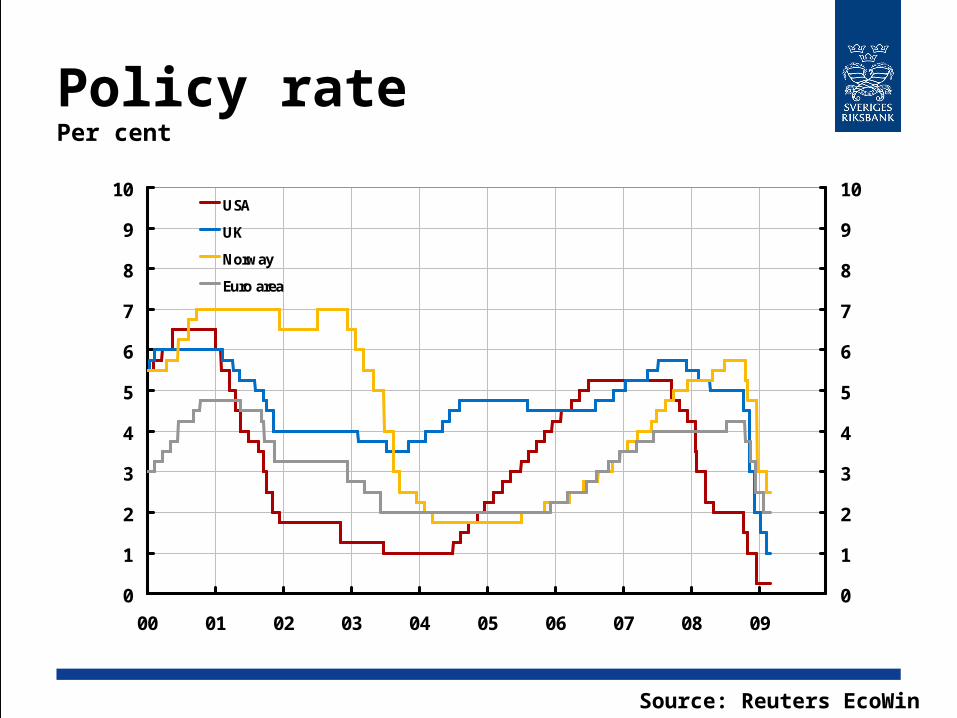
Policy ratePer cent
Source: Reuters EcoWin
0
1
2
3
4
5
6
7
8
9
10
00 01 02 03 04 05 06 07 08 09
0
1
2
3
4
5
6
7
8
9
10USA
UK
Norway
Euro area
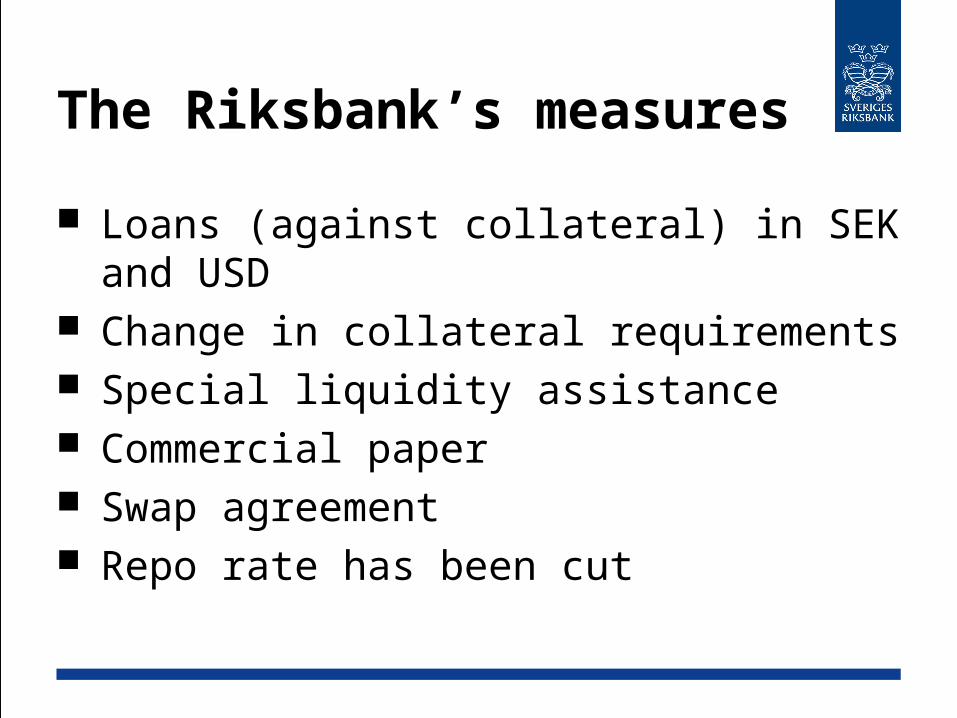
The Riksbank’s measures
Loans (against collateral) in SEK and USD
Change in collateral requirements Special liquidity assistance Commercial paper Swap agreement Repo rate has been cut
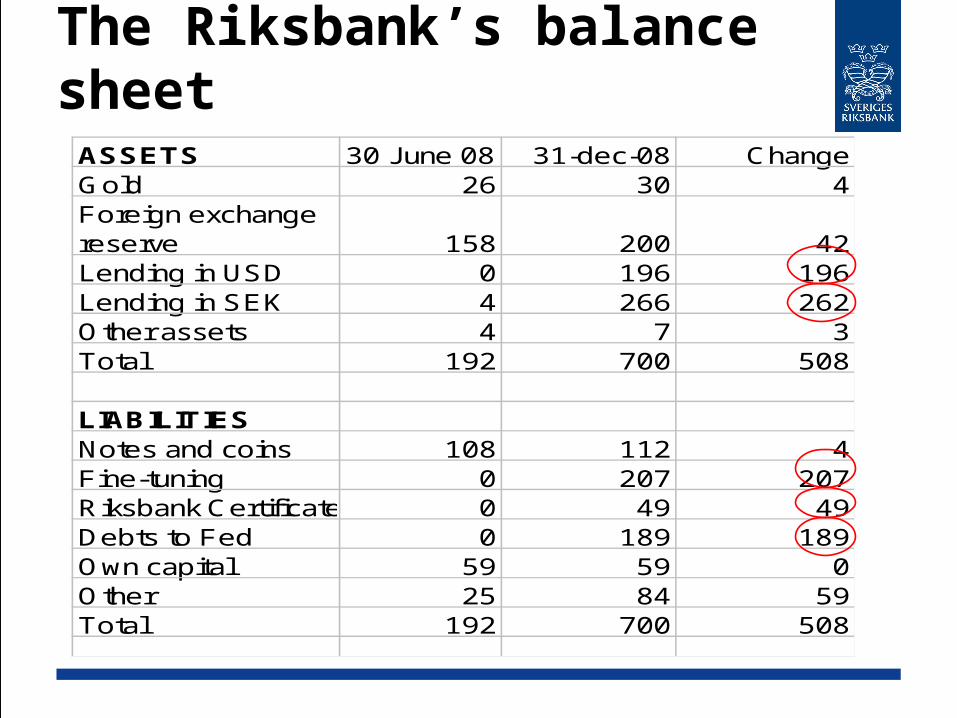
The Riksbank’s balance sheetASSETS 30 June 08 31-dec-08 ChangeGold 26 30 4Foreign exchange reserve 158 200 42Lending in USD 0 196 196Lending in SEK 4 266 262Other assets 4 7 3Total 192 700 508
LIABILITIESNotes and coins 108 112 4Fine-tuning 0 207 207Riksbank Certificates 0 49 49Debts to Fed 0 189 189Own capital 59 59 0Other 25 84 59Total 192 700 508
Contents Financial market
International outlook Sweden Monetary policy
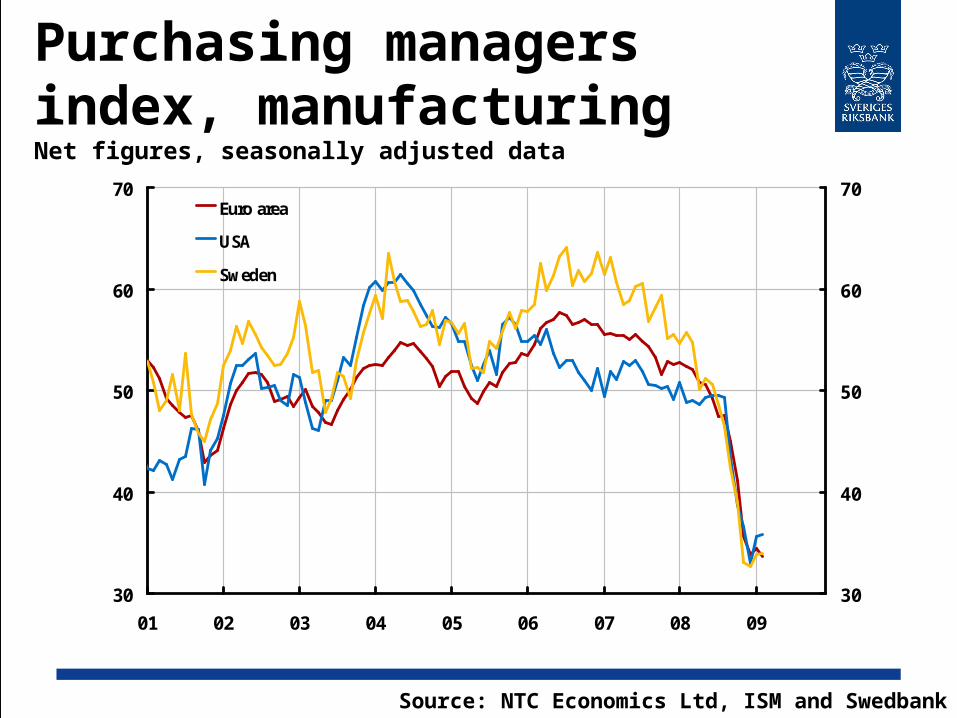
Purchasing managers index, manufacturingNet figures, seasonally adjusted data
Source: NTC Economics Ltd, ISM and Swedbank
30
40
50
60
70
01 02 03 04 05 06 07 08 09
30
40
50
60
70Euro area
USA
Sweden
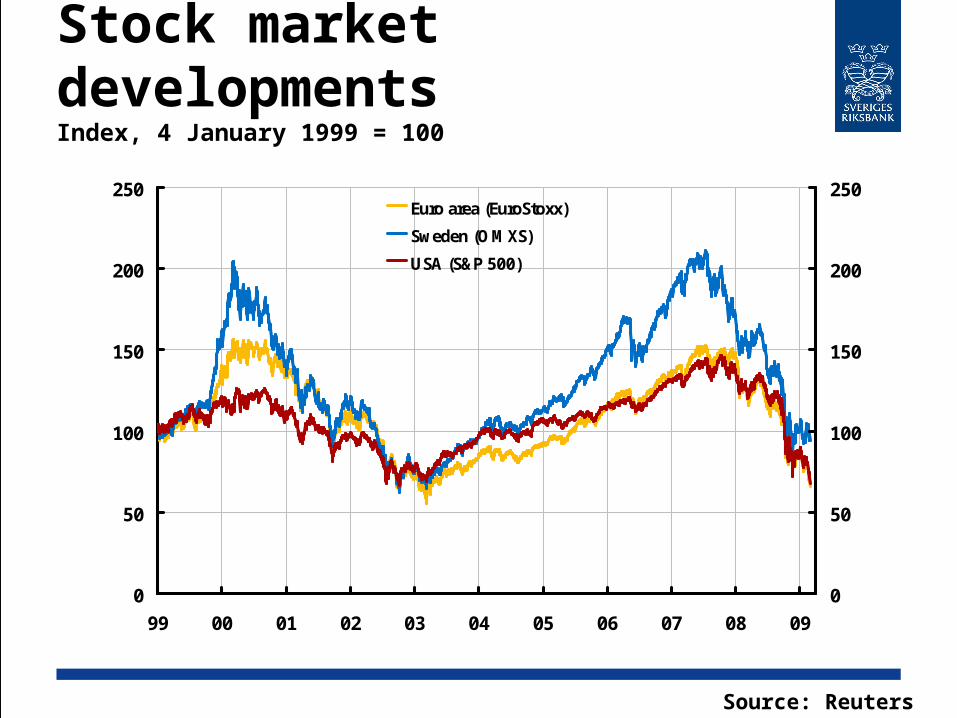
Stock market developmentsIndex, 4 January 1999 = 100
Source: Reuters Ecowin
0
50
100
150
200
250
99 00 01 02 03 04 05 06 07 08 09
0
50
100
150
200
250Euro area (EuroStoxx)
Sweden (OMXS)
USA (S&P 500)
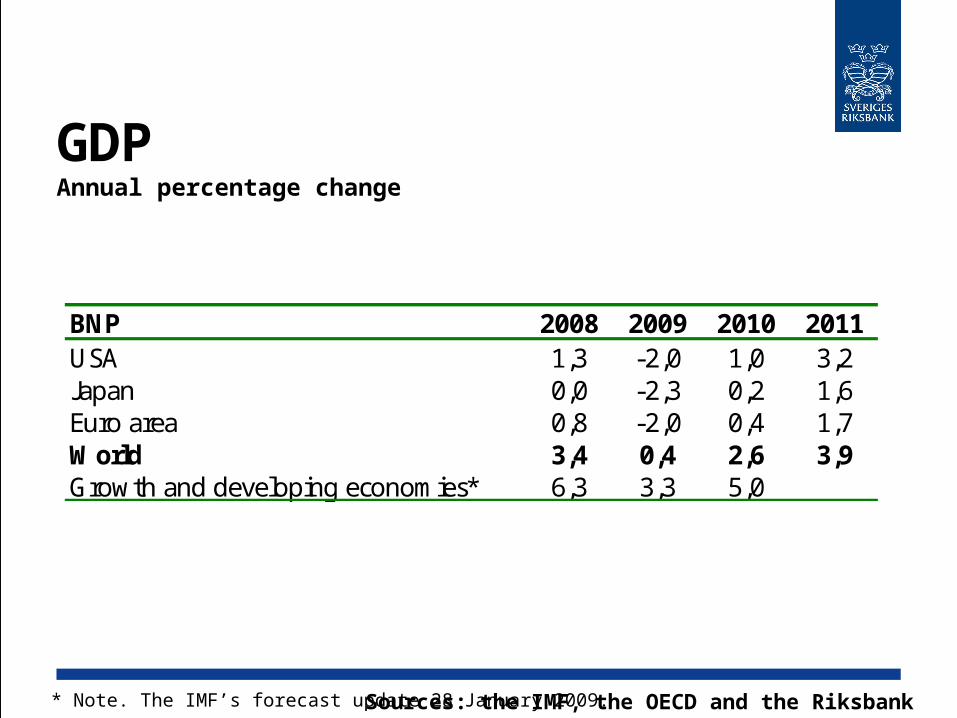
GDPAnnual percentage change
Sources: the IMF, the OECD and the Riksbank* Note. The IMF’s forecast update 28 January 2009.
BNP 2008 2009 2010 2011USA 1,3 -2,0 1,0 3,2Japan 0,0 -2,3 0,2 1,6Euro area 0,8 -2,0 0,4 1,7World 3,4 0,4 2,6 3,9Growth and developing economies* 6,3 3,3 5,0
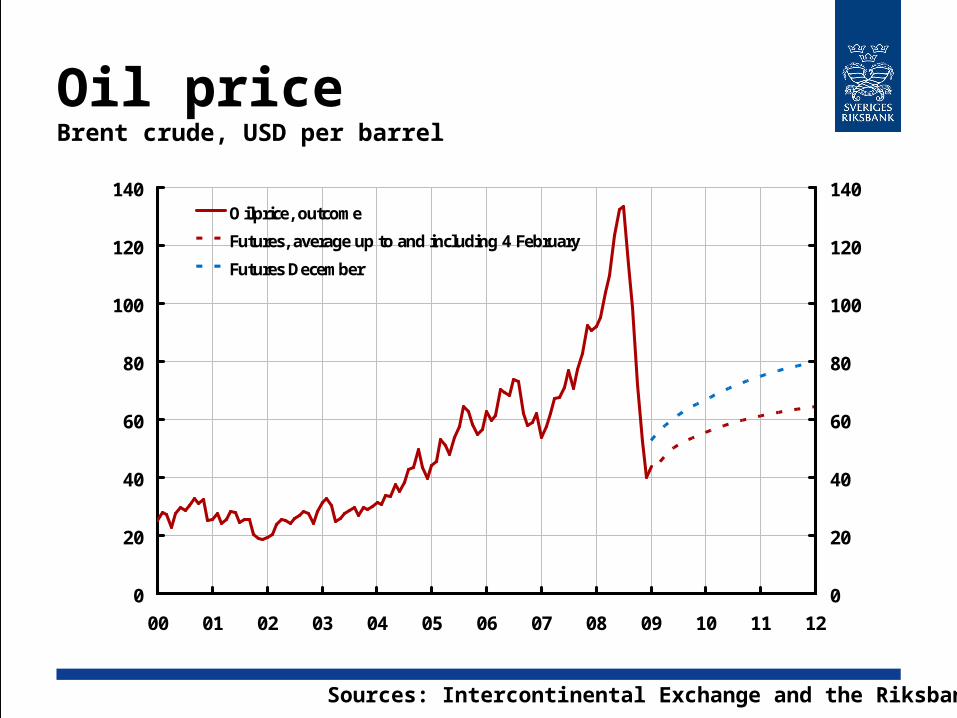
Oil priceBrent crude, USD per barrel
Sources: Intercontinental Exchange and the Riksbank
0
20
40
60
80
100
120
140
00 01 02 03 04 05 06 07 08 09 10 11 12
0
20
40
60
80
100
120
140Oilprice, outcome
Futures, average up to and including 4 February
Futures December
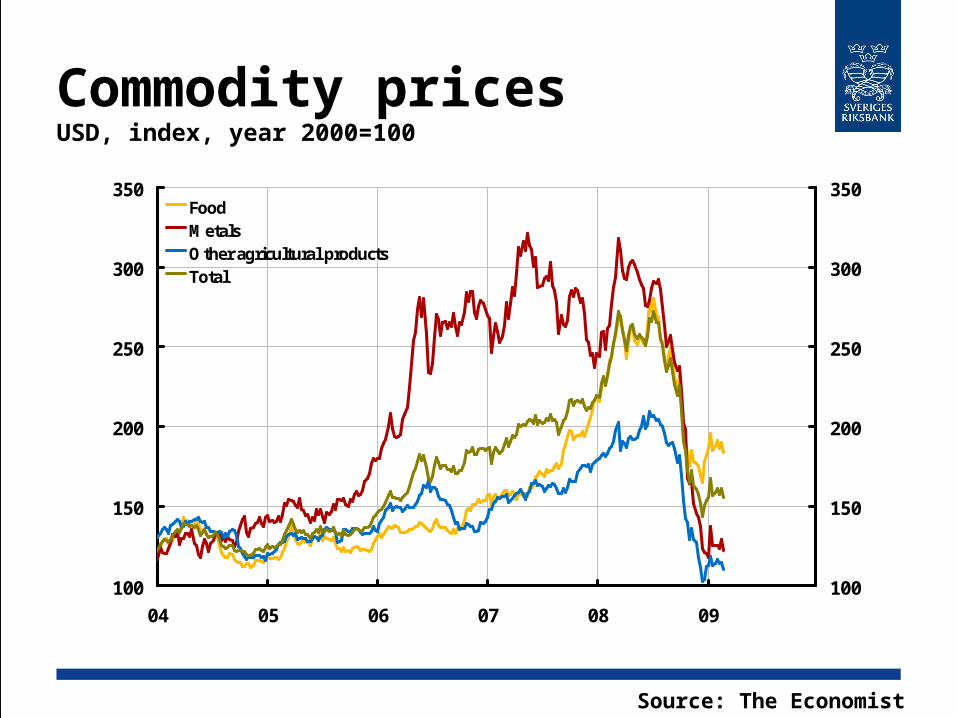
Commodity pricesUSD, index, year 2000=100
Source: The Economist
100
150
200
250
300
350
04 05 06 07 08 09
100
150
200
250
300
350FoodMetalsOther agricultural productsTotal
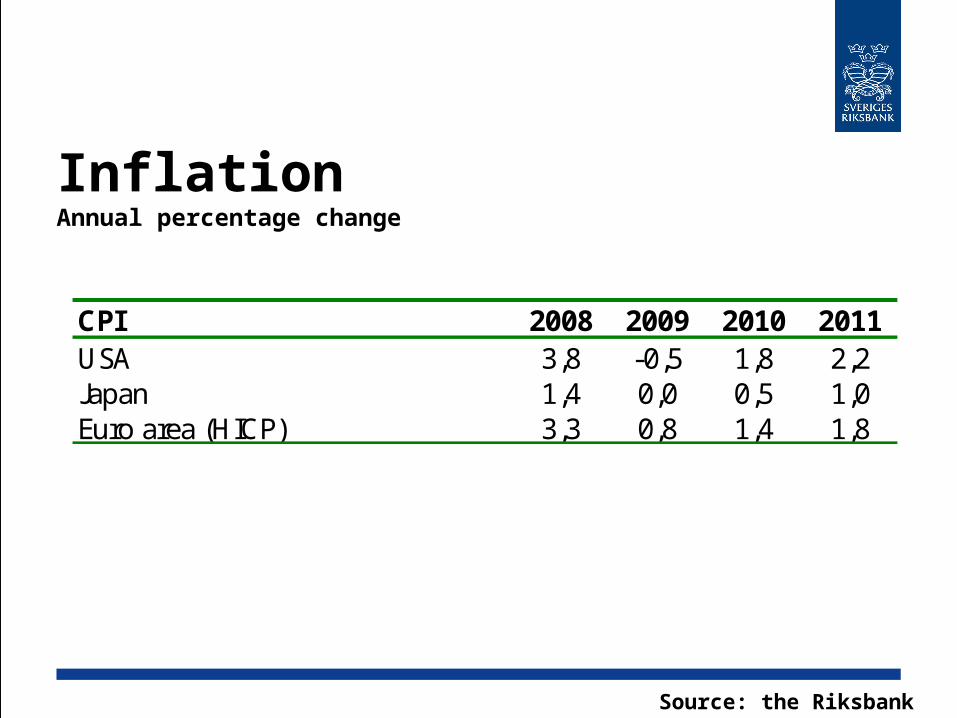
InflationAnnual percentage change
Source: the Riksbank
CPI 2008 2009 2010 2011USA 3,8 -0,5 1,8 2,2Japan 1,4 0,0 0,5 1,0Euro area (HICP) 3,3 0,8 1,4 1,8
Growth picks up again in 2010
Forceful measures to stabilise the financial markets
Expansionary fiscal and monetary policy
Low inflation
Risk of poorer developments
Reinhart and Rogoff House prices and share prices Production and employment Public finances Risk that 2010 will also be a year of
very weak growth in the world economy
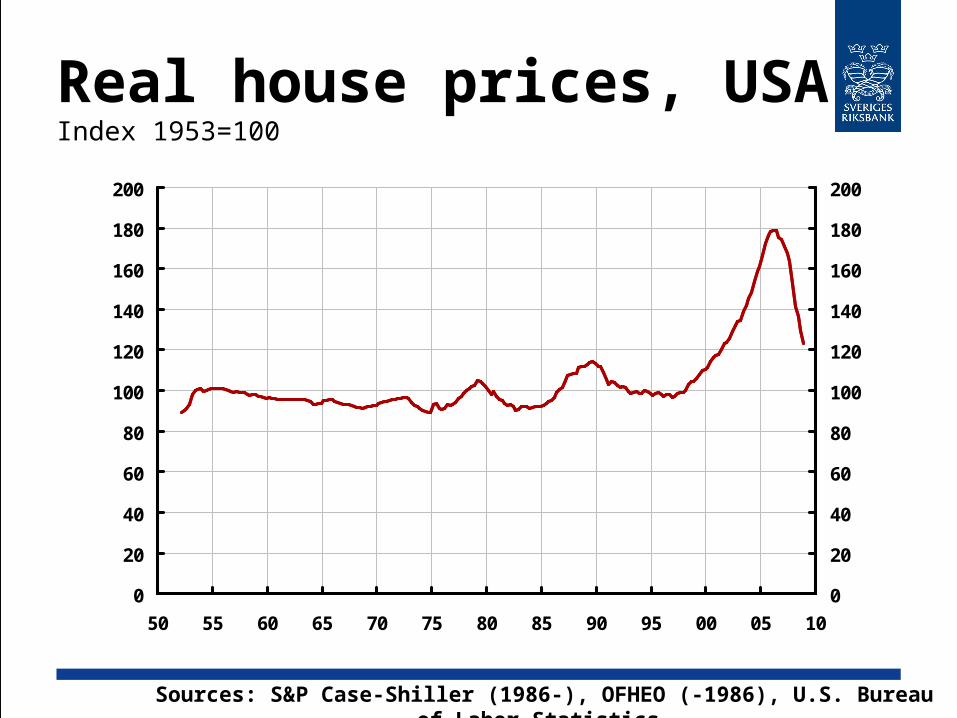
Real house prices, USAIndex 1953=100
Sources: S&P Case-Shiller (1986-), OFHEO (-1986), U.S. Bureau of Labor Statistics
0
20
40
60
80
100
120
140
160
180
200
50 55 60 65 70 75 80 85 90 95 00 05 10
0
20
40
60
80
100
120
140
160
180
200
Contents Financial market International outlook
Sweden Monetary policy
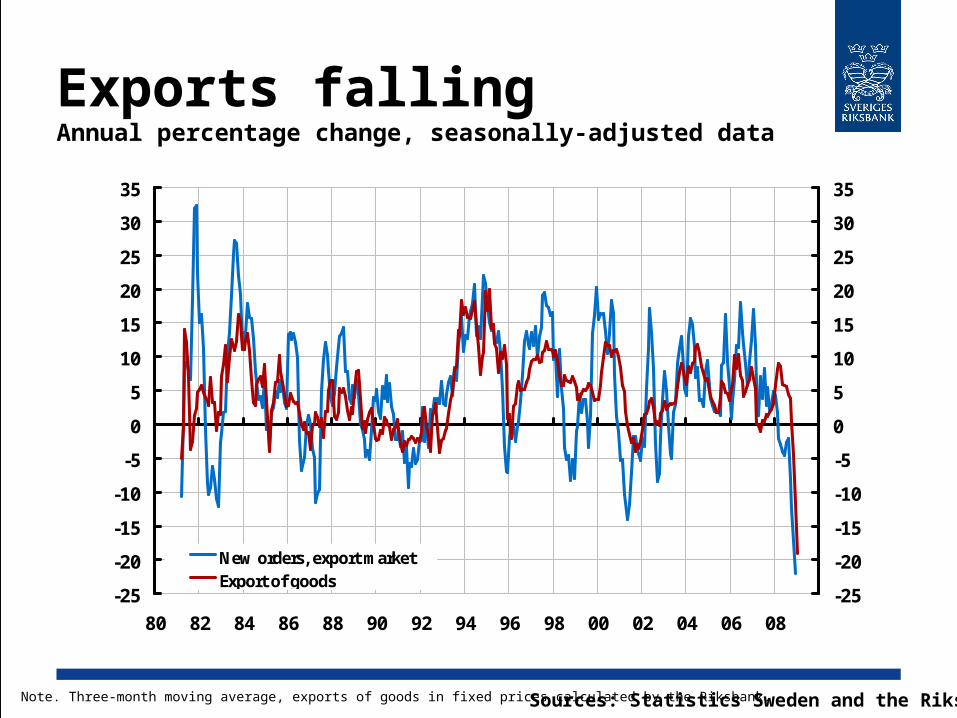
Exports fallingAnnual percentage change, seasonally-adjusted data
Note. Three-month moving average, exports of goods in fixed prices calculated by the Riksbank.Sources: Statistics Sweden and the Riksbank
-25
-20
-15
-10
-5
0
5
10
15
20
25
30
35
80 82 84 86 88 90 92 94 96 98 00 02 04 06 08
-25
-20
-15
-10
-5
0
5
10
15
20
25
30
35
New orders, export marketExport of goods
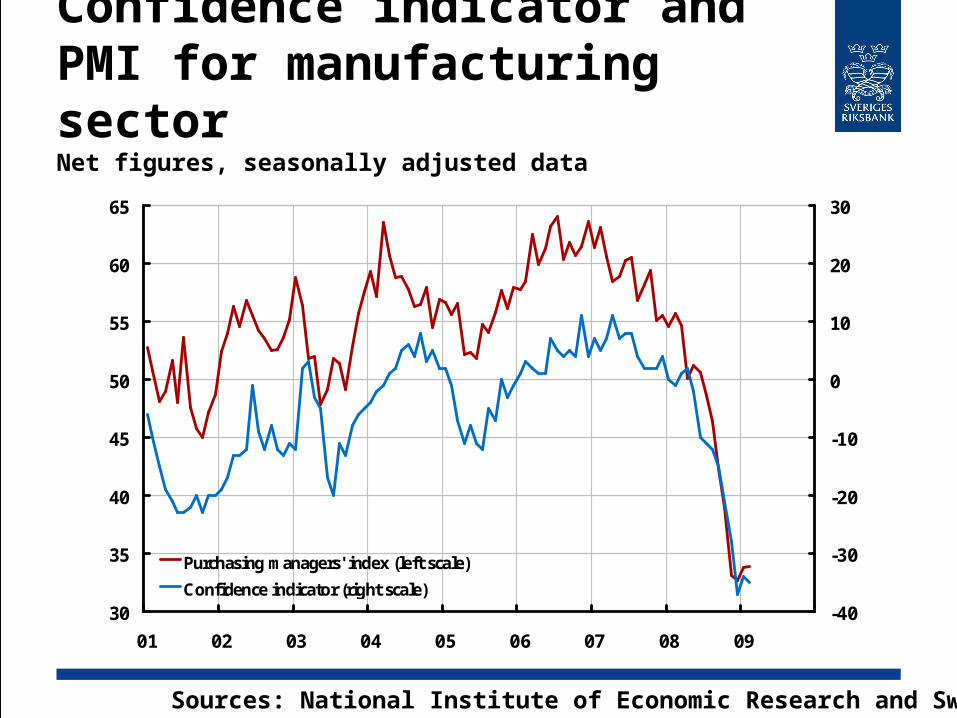
Confidence indicator andPMI for manufacturing sectorNet figures, seasonally adjusted data
Sources: National Institute of Economic Research and Swedbank
30
35
40
45
50
55
60
65
01 02 03 04 05 06 07 08 09
-40
-30
-20
-10
0
10
20
30
Purchasing managers' index (left scale)
Confidence indicator (right scale)
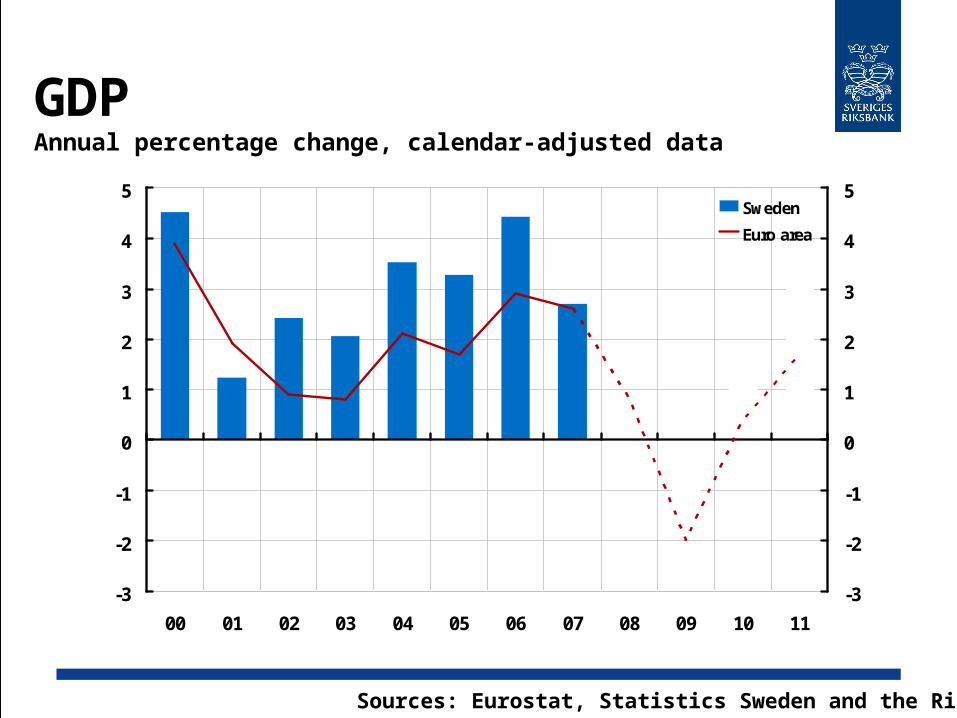
GDPAnnual percentage change, calendar-adjusted data
Sources: Eurostat, Statistics Sweden and the Riksbank
-3
-2
-1
0
1
2
3
4
5
00 01 02 03 04 05 06 07 08 09 10 11
-3
-2
-1
0
1
2
3
4
5Sweden
Euro area
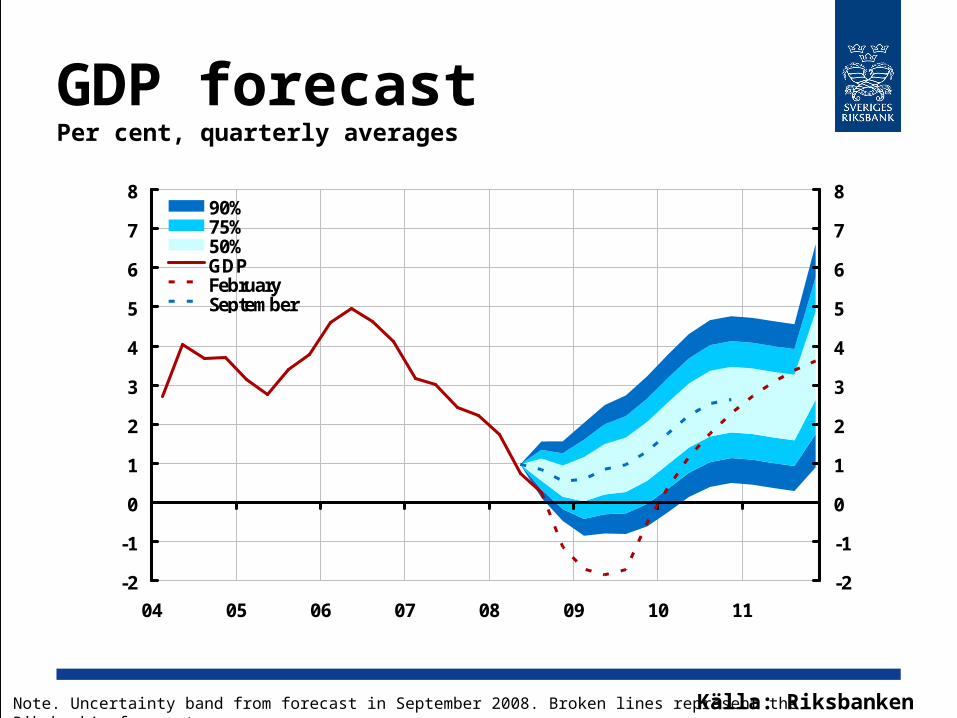
GDP forecastPer cent, quarterly averages
Källa: RiksbankenNote. Uncertainty band from forecast in September 2008. Broken lines represent the Riksbank’s forecasts.
-2
-1
0
1
2
3
4
5
6
7
8
04 05 06 07 08 09 10 11
-2
-1
0
1
2
3
4
5
6
7
890%75%50%GDPFebruarySeptember
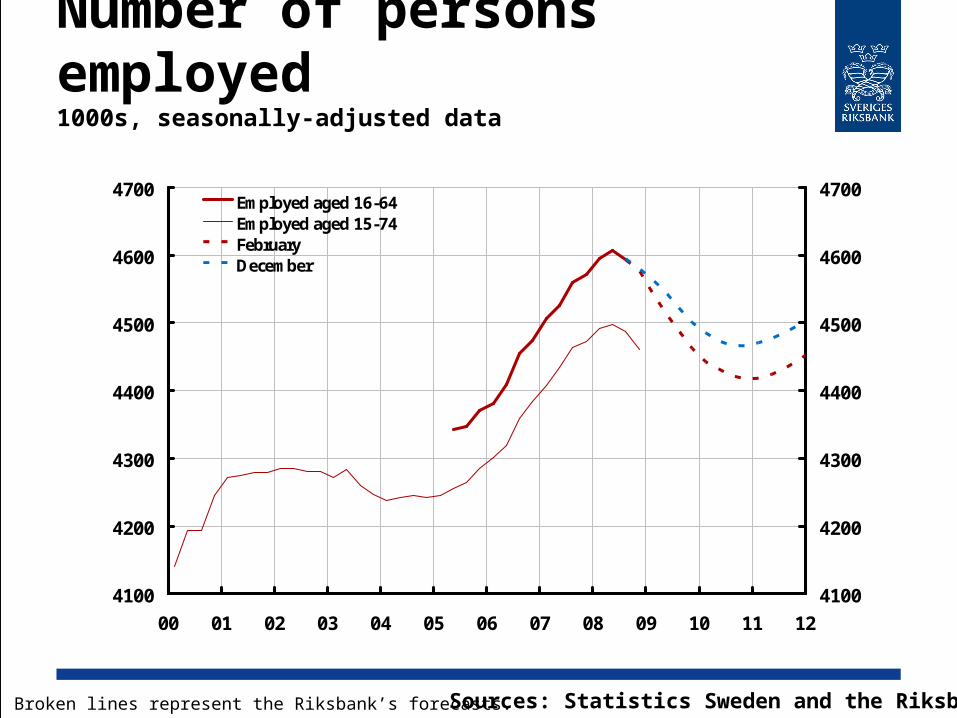
Number of persons employed1000s, seasonally-adjusted data
Sources: Statistics Sweden and the Riksbank
4100
4200
4300
4400
4500
4600
4700
00 01 02 03 04 05 06 07 08 09 10 11 12
4100
4200
4300
4400
4500
4600
4700Employed aged 16-64 Employed aged 15-74 FebruaryDecember
Note. Broken lines represent the Riksbank’s forecasts.
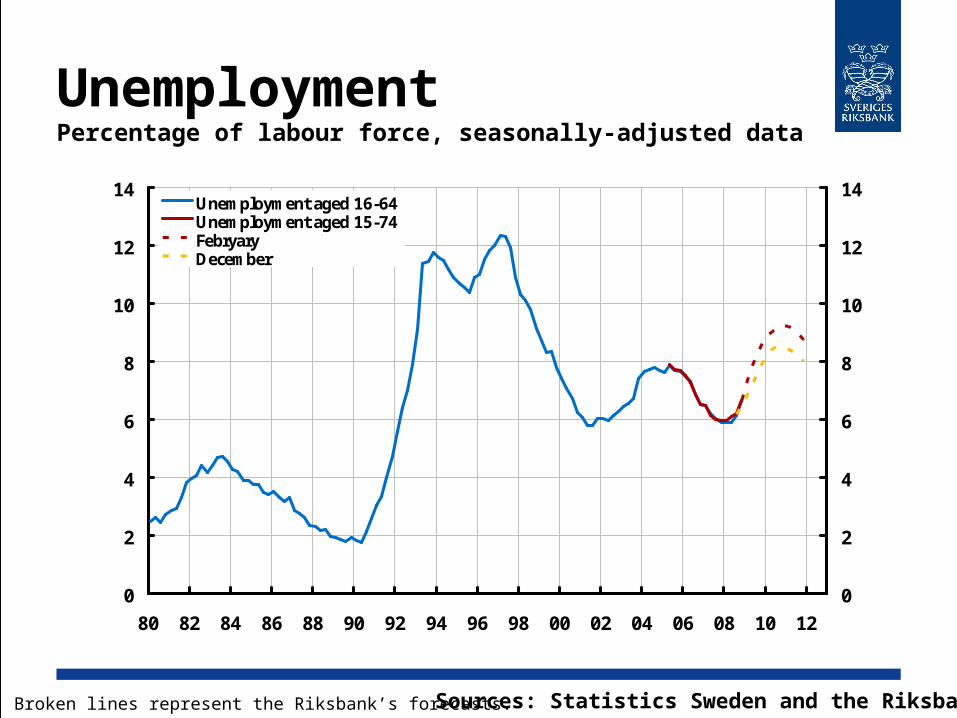
UnemploymentPercentage of labour force, seasonally-adjusted data
Sources: Statistics Sweden and the Riksbank
0
2
4
6
8
10
12
14
80 82 84 86 88 90 92 94 96 98 00 02 04 06 08 10 12
0
2
4
6
8
10
12
14Unemployment aged 16-64 Unemployment aged 15-74 FebryaryDecember
Note. Broken lines represent the Riksbank’s forecasts.
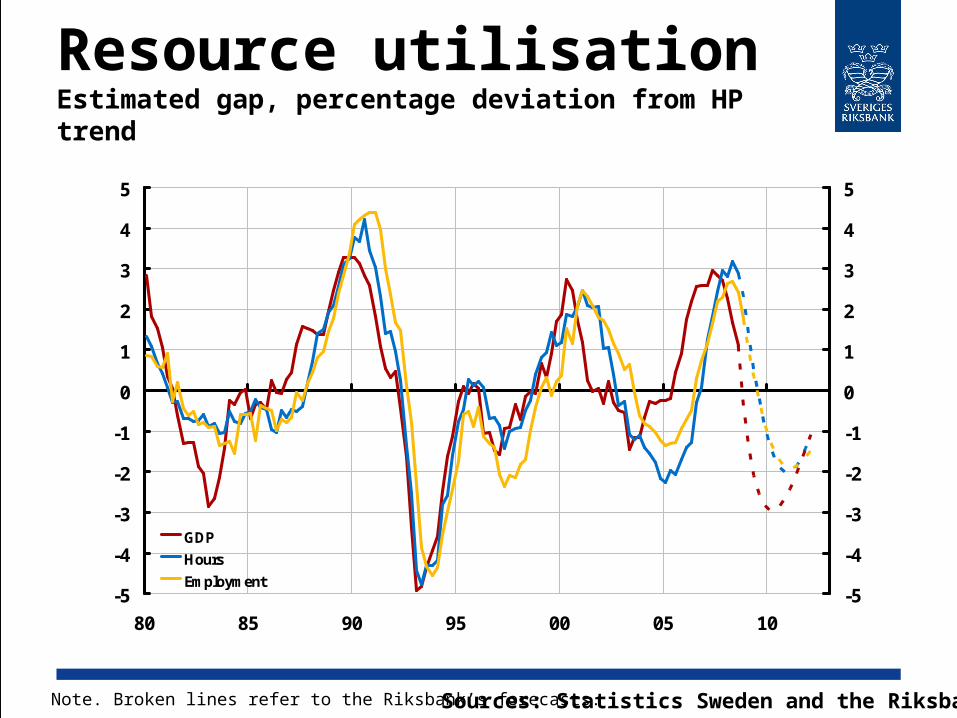
Resource utilisationEstimated gap, percentage deviation from HP trend
Sources: Statistics Sweden and the RiksbankNote. Broken lines refer to the Riksbank’s forecasts.
-5
-4
-3
-2
-1
0
1
2
3
4
5
80 85 90 95 00 05 10
-5
-4
-3
-2
-1
0
1
2
3
4
5
GDP
Hours
Employment
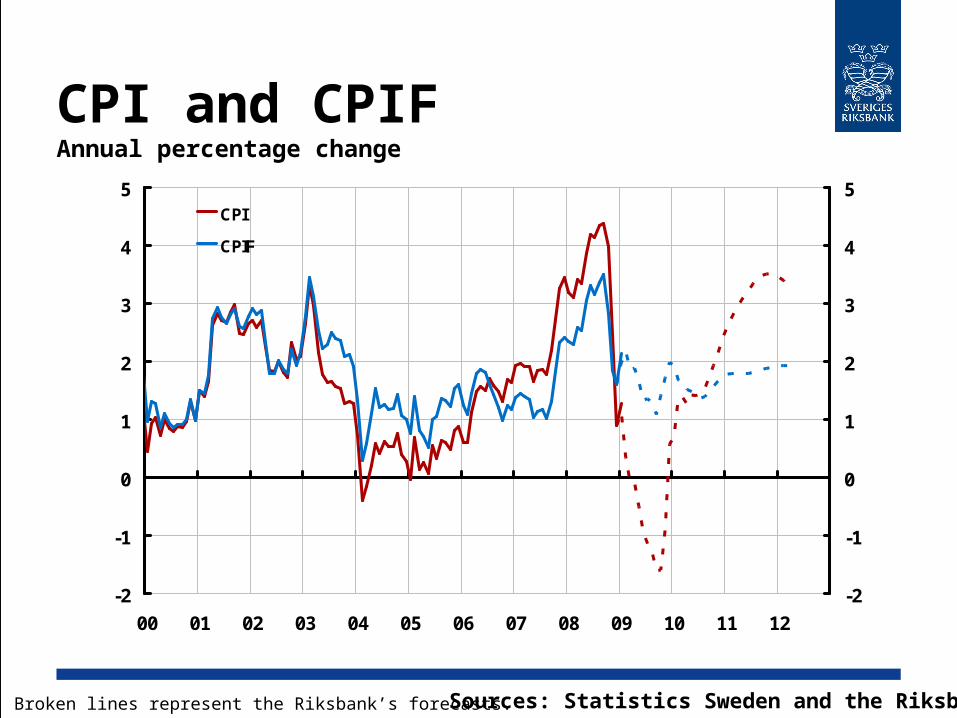
CPI and CPIFAnnual percentage change
Sources: Statistics Sweden and the Riksbank
-2
-1
0
1
2
3
4
5
00 01 02 03 04 05 06 07 08 09 10 11 12
-2
-1
0
1
2
3
4
5CPI
CPIF
Note. Broken lines represent the Riksbank’s forecasts.
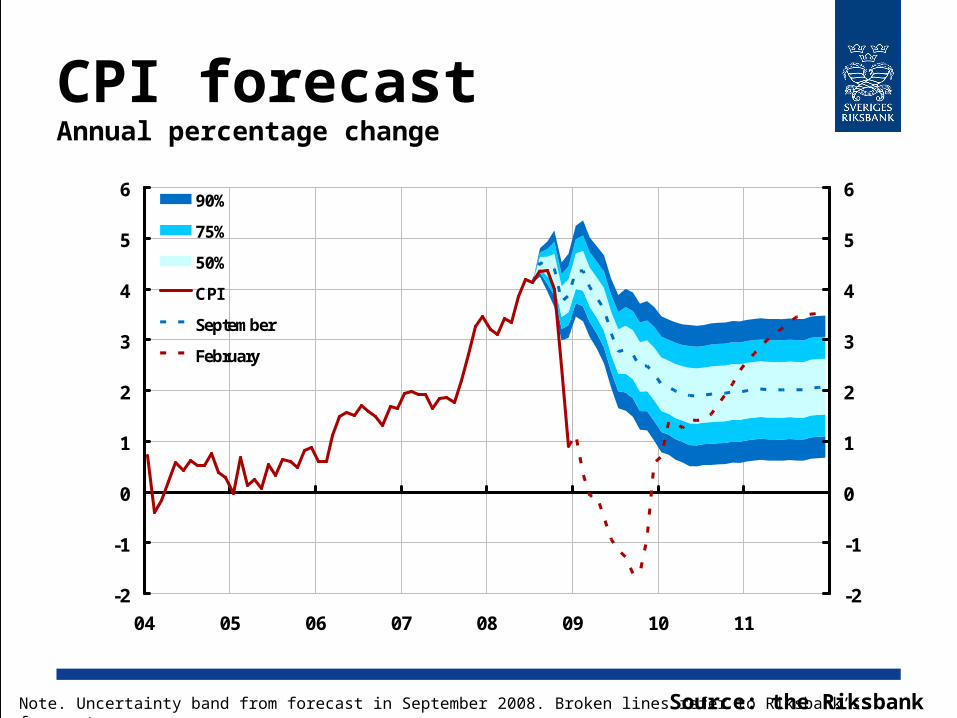
CPI forecastAnnual percentage change
Source: the RiksbankNote. Uncertainty band from forecast in September 2008. Broken lines refer to Riksbank’s forecasts.
-2
-1
0
1
2
3
4
5
6
04 05 06 07 08 09 10 11
-2
-1
0
1
2
3
4
5
690%
75%
50%
CPI
September
February
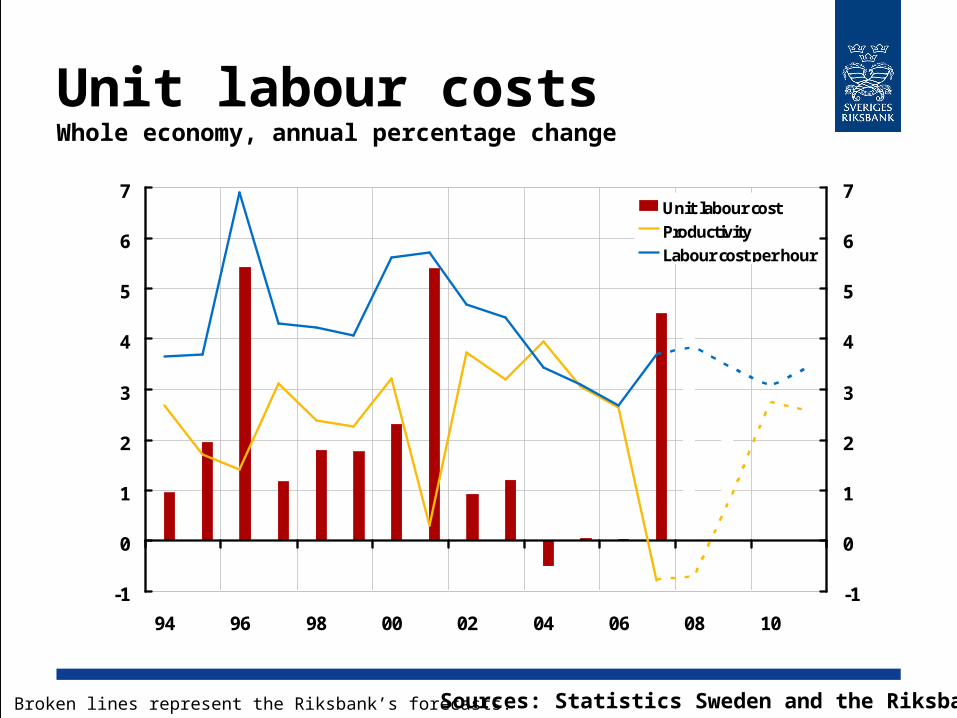
Unit labour costs Whole economy, annual percentage change
Sources: Statistics Sweden and the Riksbank
-1
0
1
2
3
4
5
6
7
94 96 98 00 02 04 06 08 10
-1
0
1
2
3
4
5
6
7Unit labour costProductivityLabour cost per hour
Note. Broken lines represent the Riksbank’s forecasts.
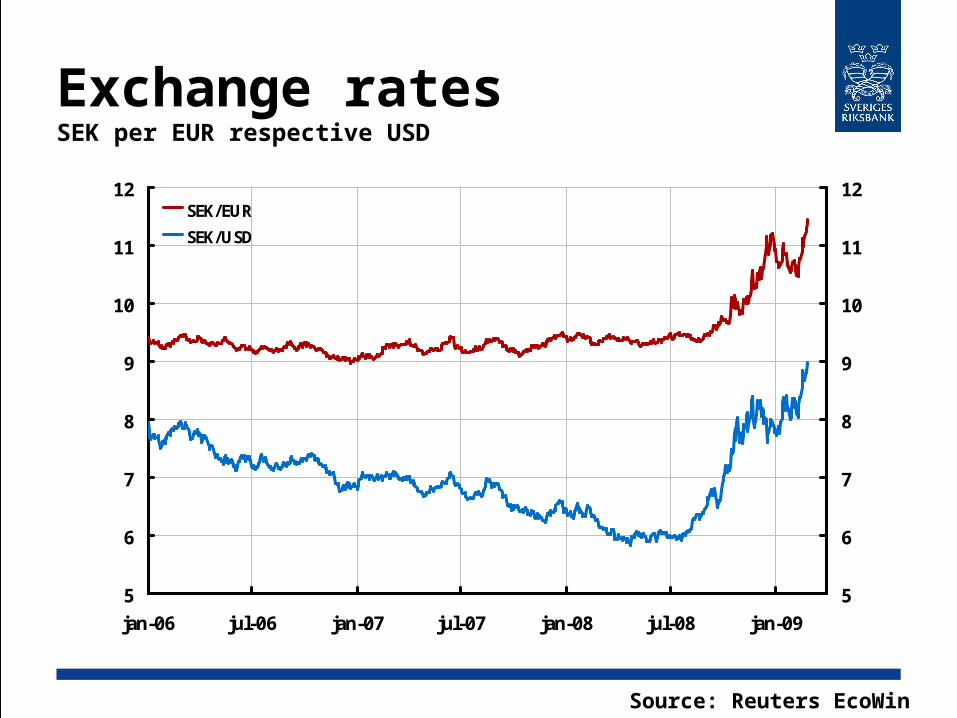
Exchange ratesSEK per EUR respective USD
Source: Reuters EcoWin
5
6
7
8
9
10
11
12
jan-06 jul-06 jan-07 jul-07 jan-08 jul-08 jan-09
5
6
7
8
9
10
11
12SEK/EUR
SEK/USD
Contents Financial market International outlook Sweden
Monetary policy
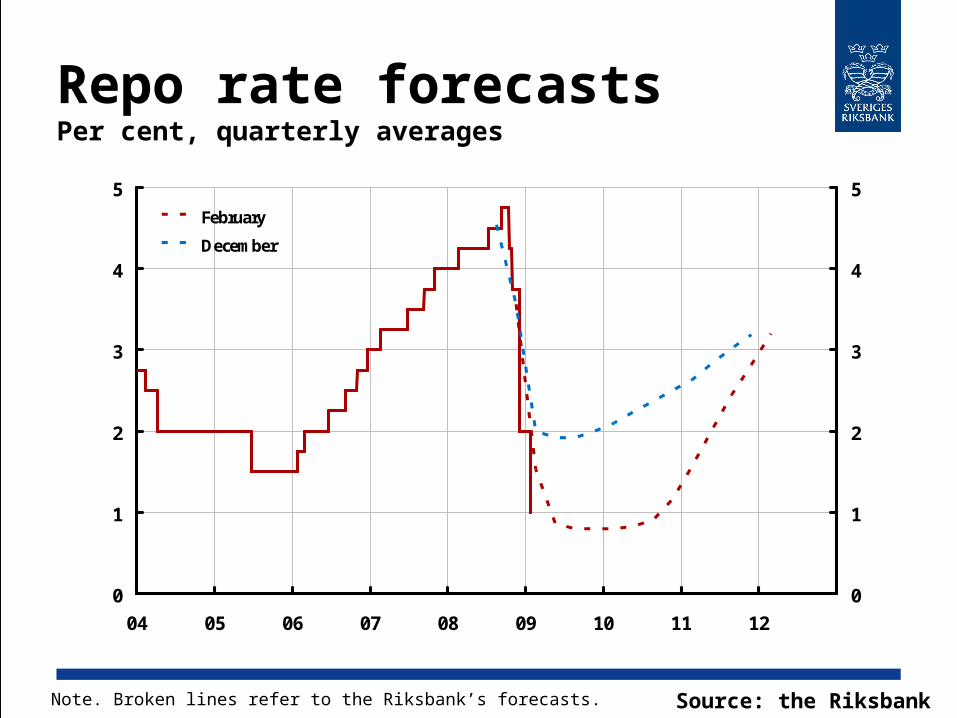
Repo rate forecastsPer cent, quarterly averages
Source: the RiksbankNote. Broken lines refer to the Riksbank’s forecasts.
0
1
2
3
4
5
04 05 06 07 08 09 10 11 12
0
1
2
3
4
5February
December
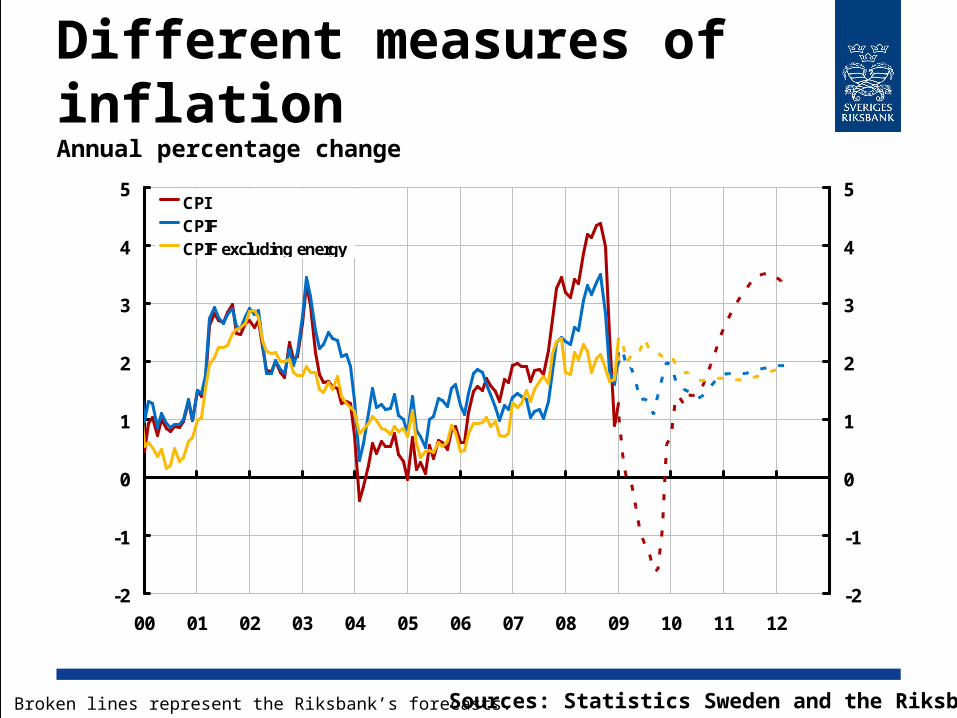
Different measures of inflationAnnual percentage change
Sources: Statistics Sweden and the Riksbank
-2
-1
0
1
2
3
4
5
00 01 02 03 04 05 06 07 08 09 10 11 12
-2
-1
0
1
2
3
4
5CPICPIFCPIF excluding energy
Note. Broken lines represent the Riksbank’s forecasts.
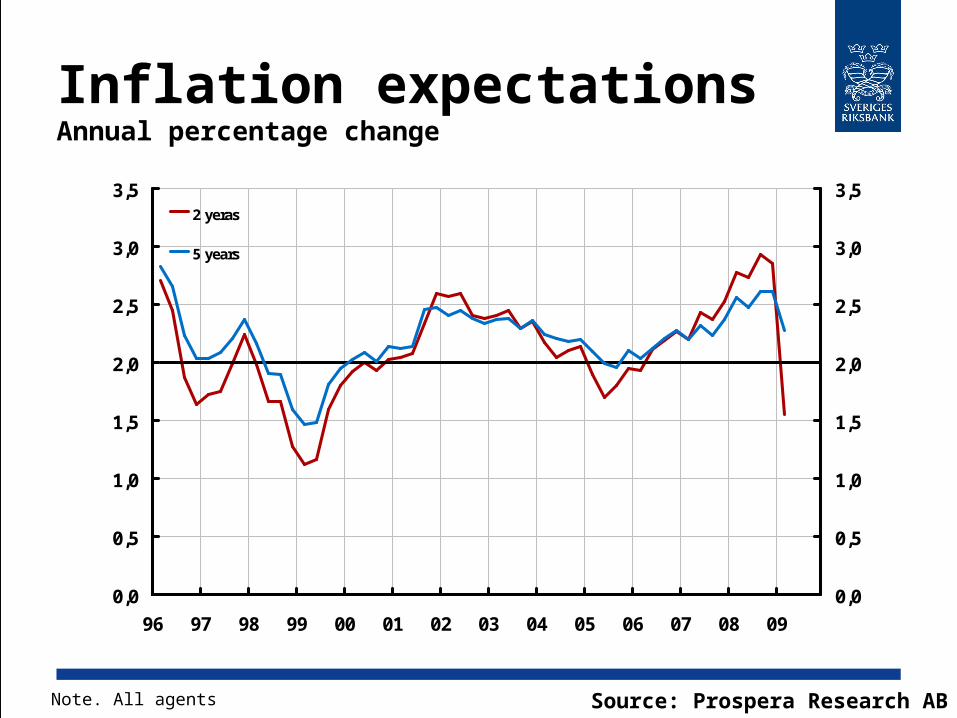
Inflation expectationsAnnual percentage change
Source: Prospera Research ABNote. All agents
0,0
0,5
1,0
1,5
2,0
2,5
3,0
3,5
96 97 98 99 00 01 02 03 04 05 06 07 08 09
0,0
0,5
1,0
1,5
2,0
2,5
3,0
3,52 yeras
5 years
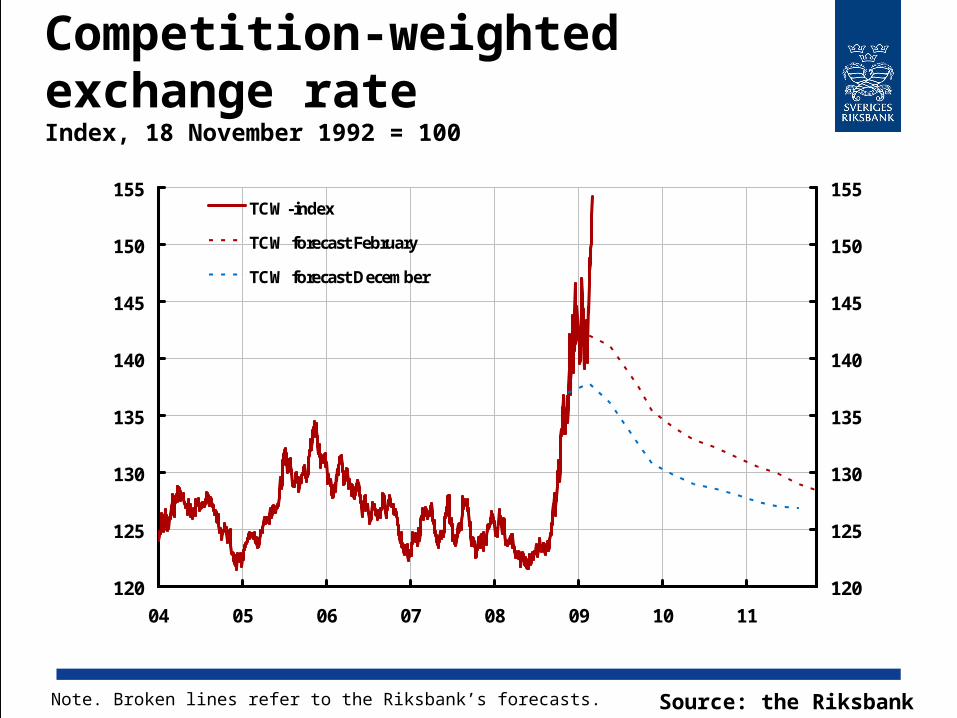
Competition-weighted exchange rateIndex, 18 November 1992 = 100
Source: the RiksbankNote. Broken lines refer to the Riksbank’s forecasts.
120
125
130
135
140
145
150
155
04 05 06 07 08 09 10 11
120
125
130
135
140
145
150
155TCW-index
TCW forecast February
TCW forecast December

Summary The financial turmoil worsened last autumn
and has developed into a global financial crisis.
International developments will be weak this year and there is a considerable risk that economic activity will be weak next year, too.
GDP growth in Sweden will be negative this year and inflation will fall.
The Riksbank has cut the interest rate to 1 per cent and may need to cut it further.