
Finite difference simulations of seismic wave propagation for

University of Mississippi University of Mississippi
eGrove eGrove
Honors Theses Honors College (Sally McDonnell Barksdale Honors College)
5-10-2019
The Critical Difference Seismic Design Can Make for a Reinforced The Critical Difference Seismic Design Can Make for a Reinforced
Concrete Building Located in Oxford, Mississippi Concrete Building Located in Oxford, Mississippi
Naim Daghmash University of Mississippi
Follow this and additional works at: https://egrove.olemiss.edu/hon_thesis
Part of the Civil Engineering Commons
Recommended Citation Recommended Citation Daghmash, Naim, "The Critical Difference Seismic Design Can Make for a Reinforced Concrete Building Located in Oxford, Mississippi" (2019). Honors Theses. 1016. https://egrove.olemiss.edu/hon_thesis/1016
This Undergraduate Thesis is brought to you for free and open access by the Honors College (Sally McDonnell Barksdale Honors College) at eGrove. It has been accepted for inclusion in Honors Theses by an authorized administrator of eGrove. For more information, please contact [email protected].

THE CRITICAL DIFFERENCE SEISMIC DESIGN CAN MAKE FOR
A REINFORCED CONCRETE BUILDING LOCATED IN OXFORD,
MISSISSIPPI
Naim Nashat Daghmash
A thesis submitted to the faculty of The University of Mississippi in partial fulfillment of
the requirements of the Sally McDonnell Barksdale Honors College.
Oxford
May, 2019
Approved by:
_________________________
Advisor: Dr. Christopher Mullen
_________________________
Reader: Dr. Ahmed Alostaz
_________________________
Reader: Dr. Hunain Alkhateb

i
ACKNOWLEDGEMENTS I would like to thank my thesis advisor Dr. Christopher Mullen for his continuous
support and advise through this academic year. Not only did he inspire me to pursue more
knowledge about earthquake design during the Senior Design Course, but he accepted to
offer me his help throughout the semester whenever I was confused about a concept. I am
more than grateful for the Sally McDonnell Barksdale Honors College for accepting me
through the Junior-Entry program, for giving me a chance to become an Honors Scholar,
and for inspiring me through the life of mind into becoming the best version of myself.
Such an opportunity would not have been possible without Dr. John Sammonds who was
the person responsible for admitting me to the Honors College.
I am forever in debt to my parents Mr. Nashat Daghmash and Mrs. Rima Daghmash
who supported me with their unconditional love throughout every step of my life. My
father works a stressful job 60 hours a week on average and is required to travel on
business trips from time to time.
I would like to thank Dr. Hunain Alkhateb, Dr. Ahmad Alostaz, Dr. Elizabeth Ervin,
Dr. Hakan Yasarer, Dr. Waheed Uddin and Dr. Yavuz Ozeren for being my instructors
throughout my undergraduate edition. If it wasn’t for their densely educational material, I
would have never got a “wake up” call resonating in the void of my mind, a message that
I needed to work harder to become a successful and ethically abiding engineer. It was
because of such a stressful experience that I was able to push myself into my limits and to
reach my maximum potential as a student.
I understand that an education is the primary goal for attending a college. But I
believe that the friendships we make as students, the memories we share, and the

ii
common hardships we encounter are just as important of a goal to accomplish. I would
like formally thank the following people for those goals; Hemant Joshi, Jai Rao and
Parker Sowers, all whom I wouldn’t simply refer to friends, but more like brothers. Being
an international student from a small town who travelled thousands of miles away to
pursue his dreams, I found it hard to blend into the American society. I felt outcast in a
way. I thought my goal was to merely focus on my academics. But I was wrong and have
changed so much after watching the three of them excel at their academic work and
exhibit extraordinary social skills. My friendship with each of the individuals Parker, Jai
and Hemant has built trust, with trust I built growth, and with growth I built strength. I
know for a fact that I would not be writing this publication if it was not for those
students.

iii
ABSTRACT The Senior Design course at the University of Mississippi requires the completion of
a capstone project. One part of the capstone project is a complete structural design of the
NOLA, an ongoing construction in the city of Oxford in Mississippi. The course requires
the NOLA to be designed according to gravity loads, meaning the forces act in the
downward direction towards the earth’s surface. Some loading mechanisms that could
occur in a different direction than gravity are seismic loads, which are earthquake-
generated loads.
I was not required by my instructors to consider the effect of an earthquake on the
structural design of the NOLA, neither was I given enough information to do so.
Therefore, I decided to investigate -on my own- how crucial it would be to actually
consider the effect of an earthquake on a building in Oxford by researching and
consulting the most recent versions of the International Building Code and the American
Society of Civil Engineers Minimum Design Standards, I discovered that it is against the
guidelines to ignore the effect of an earthquake with the given seismic activity parameters
for the city of Oxford. I wanted to investigate and find out the reason behind why it’s not
permitted to ignore the earthquake effect. Consequently, I would be able to prove that it
is vital to consider an earthquake effect in the structural design of any building in Oxford.
I structurally analyzed one frame of the building using two load cases: the first
loading case does not consider earthquake activity and the second one does. The frame
was then designed to withstand only gravity loads. The results indicated that an
earthquake could have a tremendous impact on the design of the structure. An effect
significant enough to demolish the initial design with no earthquake activity
consideration.

iv
TABLE OF CONTENTS
ACKNOWLEDGEMENTS ................................................................................................. i
ABSTRACT ....................................................................................................................... iii
LIST OF ABBREVIATIONS ............................................................................................ vi
CHAPTER 1 ....................................................................................................................... 1
1.1 Introduction ............................................................................................................... 1
1.2 Project Outline .......................................................................................................... 2
CHAPTER 2 ....................................................................................................................... 5
2. 1 Loading Calculations ............................................................................................... 5
2.1.1 Gravity Loads..................................................................................................... 5
2.1.2 Lateral Loads ..................................................................................................... 7
2.2 Slab Thickness ........................................................................................................ 12
2.3 Frame Loading Calculations ................................................................................... 13
2.3.1 Tributary Area .................................................................................................. 13
2.3.2 Dead loading from weight applied to the slab ................................................. 13
2.3.3 Dead loading from slab weight ........................................................................ 14
2.3.4 Total Linear Dead Load ................................................................................... 14
2.3.5 Total Linear Live Load on each floor .............................................................. 15
2.3.6 Total Joint Lateral Load from seismic effect ................................................... 15
CHAPTER 3 ..................................................................................................................... 17
3.1 Building Code Requirements .................................................................................. 17
3.1.1 Bending Moment Design in Beams ................................................................. 17
3.1.2 Shear Design in Beams .................................................................................... 18
3.1.3 Beam Column Design ...................................................................................... 20
3.1.4 Overturning and Deflection ............................................................................. 22
3.2 Structural Analysis Method .................................................................................... 23
CHAPTER 4 ..................................................................................................................... 25
4.1 Frame Analysis and Design .................................................................................... 25
4.1.1 Bending Moment Design ................................................................................. 26
4.1.3 Shear Design .................................................................................................... 27
4.1.5 Column Axial and Bending Moment Design................................................... 29
4.2 Results and Comparison of the Frame Analysis ..................................................... 31
4.3 Discussion of the results ......................................................................................... 32

v
SUMMARY and Conclusions .......................................................................................... 34
RECOMMENDATIONS .................................................................................................. 35
LIST OF REFERENCES .................................................................................................. 36
APPENDICES .................................................................................................................. 39

vi
LIST OF ABBREVIATIONS Rn – a term used in required percentage of steel expression for vertical members
Ф – safety factor for beam bending design, a value equal to 0.9 for a 10% reduction
Using Rn, the steel fraction percentage may be found. Which could be used to select the
reinforcing steel bars at the tensile zone of the beam.
ρ – steel fraction percentage of the concrete area
f’c – specified compressive strength of concrete
𝑙 – clear span length
fy – specified yield strength of non-prestressed reinforcing
As – Area of steel needed
bw – width of the beam
k – effective length factor
𝑙𝑢 – unbraced length of the column
M1 – smaller moment applied to column
M2 – bigger moment applied to column
∅𝑃𝑛 – factored nominal axial load
D – Dead load
L – Live load
b – base width of the beam
d – distance from the top of the beam to the centroid of the bottom reinforcement or the
distance
from the bottom of the beam to the centroid of the top reinforcement
Mu – Ultimate moment experienced by the beam
r – radius of gyration
Ss – mapped MCER, 5% damped, spectral response acceleration parameter at short
periods
S1 – mapped MCER, 5% damped, spectral response acceleration parameter at a period of
1 second
SDS – design, 5% damped, spectral response acceleration parameter at short periods
SD1 – design, 5% damped, spectral response acceleration parameter at a period of 1
second

vii
R –response modification coefficient for lateral loading
QE – effect of horizontal seismic (earthquake-induced) forces
hx – the height above the base to level x, respectively
Cd – deflection amplification factor
Cu – the coefficient for upper limit on calculated period
Ct – building period coefficient
Cs – Seismic response coefficient
Cvx – vertical distribution factor
Ie – The seismic importance factor, a factor that accounts for the degree of risk to human
life, health, and welfare associated with damage to property or loss of use or functionality
Ta – approximate fundamental period of the building
δxe – deflection of Level x at the center of the mass at and above Level x determined by
an elastic analysis
δx – deflection of Level x at the center of the mass at and above Level x
Fx – portion of the seismic base shear, V, induced at Level i, n, or x,
V – total design lateral force or shear at the base
Vx – seismic design shear in story x
Δ – design story drift
Δa – allowable story drift

1
CHAPTER 1
1.1 Introduction
Reinforced concrete will be used as the building material. Thus, the building will be
composed of a slab, beam and column layout. Concrete is typically among the best
materials to use for construction since it is unreactive, durable and strong in compression.
In the Civil Engineering work force, the first step to begin the design of a building is to
acquire and calculate the loading on each frame. Knowing the exact amount of load, with
safety and LRFD factors included, the engineer could design each section as
economically as possible. The goal behind the design is to create a building that is just
strong enough to become structurally stable in the real world.
A group of structural engineers usually work on this type of task, where one group is
responsible for determining the loads and another uses those loads to design. This process
is rather very time-efficient given the futuristic technology engineers can now utilize to
perform three-dimensional modelling of an entire structure.
With the rapidly growing infrastructure, structural engineers who design with
concrete always refer to the American Concrete Institute (ACI), American Society of
Civil Engineers (ASCE), and the International Building Code (IBC). Those codes provide
rules and guidelines as permitted by law to design any structure. This ensures the work
ethic of the engineers analyzing and designing the building is up to pace with the first
priority being the safety and welfare of the public.
By showcasing a comparison between the most critically affected beam and column
design due to an earthquake, there would be solid evidence of the significant change in
2
bending moment, axial force and shear resistance that is needed to completely assure the
structural safety of the NOLA in the city of Oxford in Mississippi.
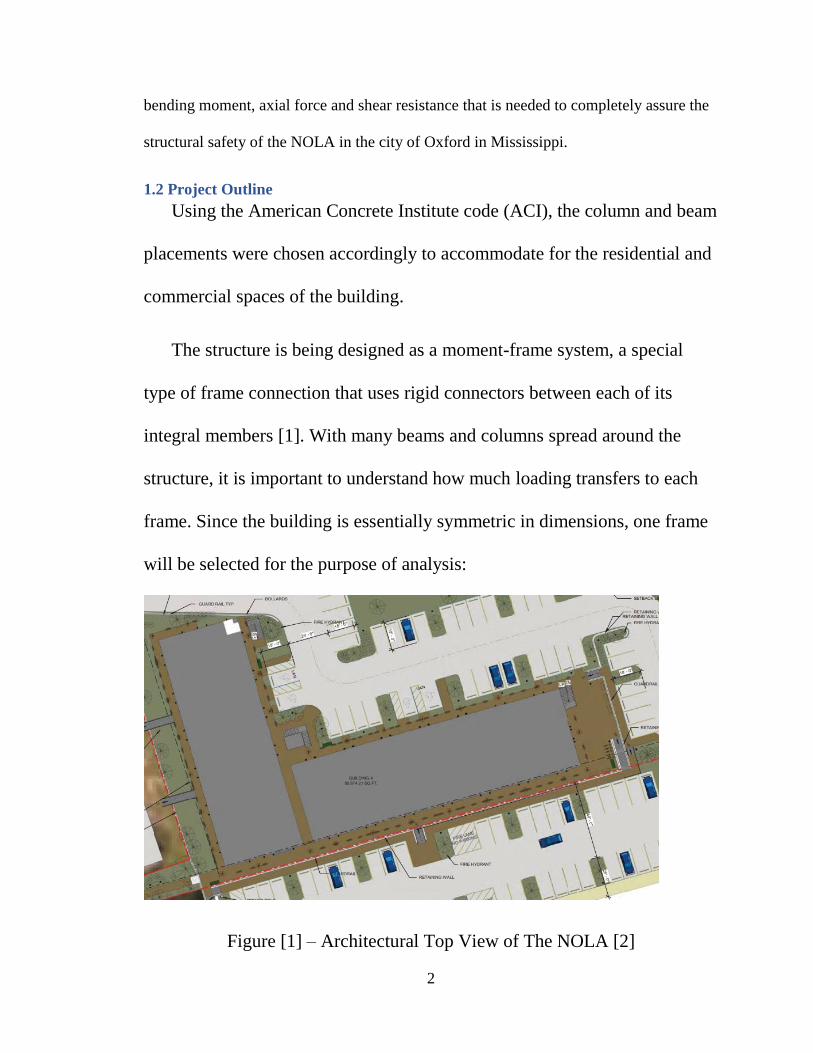
1.2 Project Outline
Using the American Concrete Institute code (ACI), the column and beam
placements were chosen accordingly to accommodate for the residential and
commercial spaces of the building.
The structure is being designed as a moment-frame system, a special
type of frame connection that uses rigid connectors between each of its
integral members [1]. With many beams and columns spread around the
structure, it is important to understand how much loading transfers to each
frame. Since the building is essentially symmetric in dimensions, one frame
will be selected for the purpose of analysis:
Figure [1] – Architectural Top View of The NOLA [2]
3
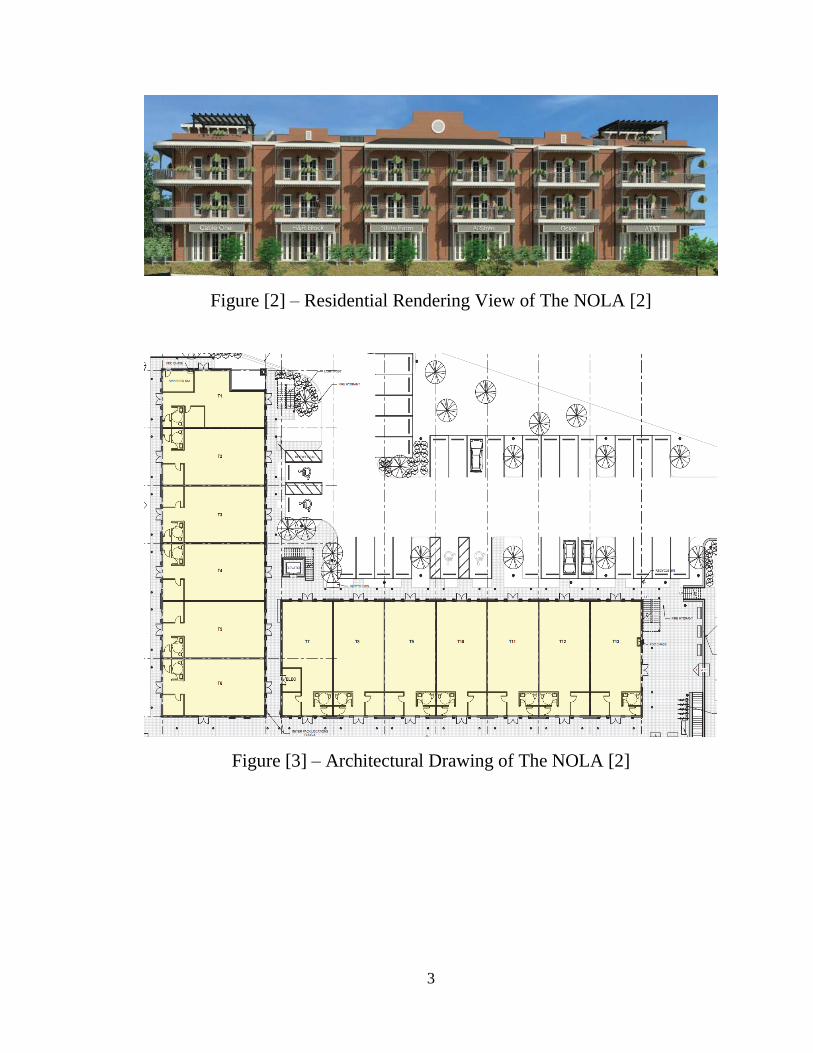
Figure [2] – Residential Rendering View of The NOLA [2]
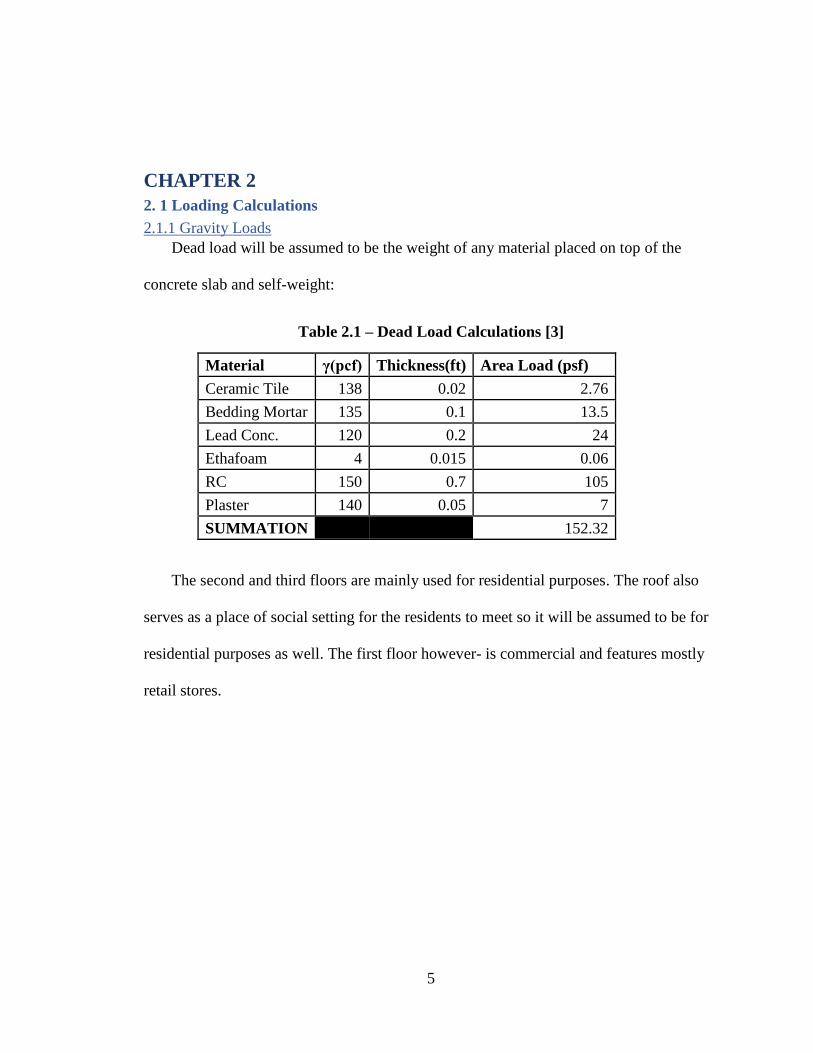
Figure [3] – Architectural Drawing of The NOLA [2]

4
Figure [4] – Selected Frame for Structural Analysis [2]
Figure [5] – 2-Dimensional View of the Selected Frame
5
CHAPTER 2
2. 1 Loading Calculations
2.1.1 Gravity Loads
Dead load will be assumed to be the weight of any material placed on top of the
concrete slab and self-weight:
Table 2.1 – Dead Load Calculations [3]
Material γ(pcf) Thickness(ft) Area Load (psf)
Ceramic Tile 138 0.02 2.76
Bedding Mortar 135 0.1 13.5
Lead Conc. 120 0.2 24
Ethafoam 4 0.015 0.06
RC 150 0.7 105
Plaster 140 0.05 7
SUMMATION 152.32
The second and third floors are mainly used for residential purposes. The roof also
serves as a place of social setting for the residents to meet so it will be assumed to be for
residential purposes as well. The first floor however- is commercial and features mostly
retail stores.

6
Table 2.2 – Minimum Uniformly Distributed Live Loads and Minimum
Concentrated live loads [4]
Table 2.3 – Final Live Load Values for Selected Frame
Total live load 40 psf
7
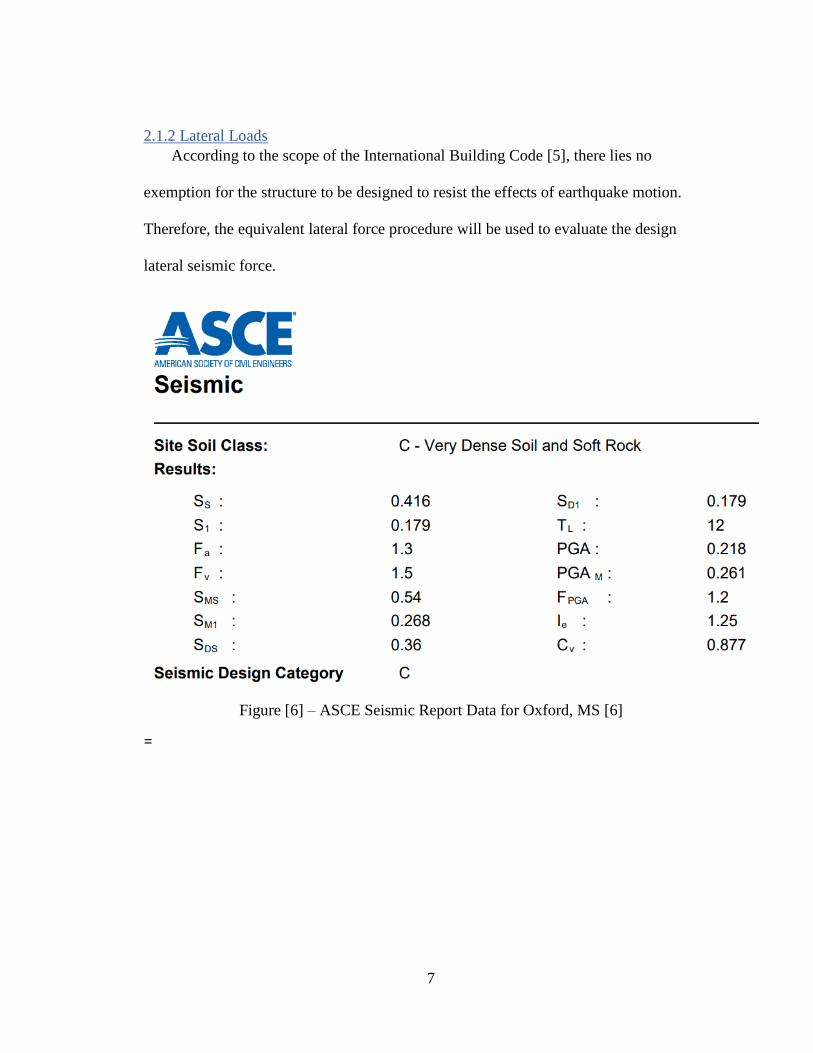
2.1.2 Lateral Loads
According to the scope of the International Building Code [5], there lies no
exemption for the structure to be designed to resist the effects of earthquake motion.
Therefore, the equivalent lateral force procedure will be used to evaluate the design
lateral seismic force.
Figure [6] – ASCE Seismic Report Data for Oxford, MS [6]
=

8
Table 2.4 – Risk Category of Buildings and Other Structures [7]

9
Table 2.5 – Design Coefficients and Factors for Seismic Force-Resisting Systems [8]

10
Table 2.6 – Importance Factors by risk Category of Buildings and Other
Structures for Snow, Ice, and Earthquake Loads [9]
𝑆𝐷𝑆 = 2
3 𝑆𝑀𝑆 [Eqn. 1] [10]
𝑆𝐷𝑆 =2
3 × 0.54 = 0.36
𝑆𝐷1 =2
3 𝑆𝑀1 [Eqn. 2] [11]
𝑆𝐷𝑆 =2
3 × 0.268 = 0.18
Table 2.7 – IBC Risk Category Determination
IBC Specification Risk Category
0.33 g ≤ SDS < 0.5 g C
0.133 g ≤ SD1 < 0.20 g C
Most Severe category C
𝐶𝑠 = 𝑆𝐷𝑆
(𝑅/𝐼𝑒) [Eqn. 3] [12]
Risk Category is III from Table 2.4
𝐼𝑒 = 1.25 from Table 2.6
𝑅 = 3 from Table 2.5
𝐶𝑑 = 2.5 from Table 2.5
Risk Category is C from Table 2.7
𝐶𝑠 = 0.18
(3/1.25)

11
𝐶𝑠 = 0.15
𝑇𝑎 = 𝐶𝑡ℎ𝑛𝑥 [Eqn. 4] [13]
The effective seismic weight of each floor was calculated using the known
dimensions of slabs and the design dimension of the beam and columns from gravity load
design.
𝑊 = 3476.9 𝑘𝑖𝑝𝑠
𝑉 = 𝐶𝑠𝑊 [Eqn. 5] [14]
𝑉 = 0.15 × 3476.9 𝑘𝑖𝑝𝑠
𝑉 = 522.3 𝑘𝑖𝑝𝑠
The distribution exponent is equal to 1.0 for buildings with an elastic fundamental
period less than or equal to 0.5 seconds [15]
The vertical distribution factor must be calculated, which is equal to a percentage of
the base shear that is assigned at each floor level.
𝐶𝑣𝑥 =𝑤𝑥ℎ𝑥
𝑘
∑ 𝑤𝑖ℎ𝑖 [Eqn. 6] [16]
The previous values computed for lateral load undergo a complicated set of
calculations and summations, therefore the best method to continue the calculation
procedure is through tabulation of the values:
Table 2.8 – Evaluation of the Seismic Design Shear for Each Story
Story Wx (kips)
hx
(ft) Wxhxk Cvx
Fx
(kips)
Vx / story
(kips)
1 0.0 0 522
2 522 10.5 5484 0.17 87 435
3 522 21.0 10968 0.33 174 261
Roof 522 31.5 16453 0.50 261 0
SUMMATION 1567 32905 522

12
2.2 Slab Thickness
The selected frame from Figure [4] has to carry some of the weight of the slab that is
placed on top of it. The weight of slab cannot be determined without knowing how thick
the slab needs to be.
Table 2.9 – Minimum Thickness of Non-prestressed Beams or One-Way Slabs Unless Deflections Are Computed [17]
The slab placed on top of the frame is a solid one-way slab since the length to
width ratio is greater than 2.0. From Table 2.9, the one end continuous equation
governs the minimum thickness permissible. Therefore:
ℎ = 𝑙
24 [Eqn. 7]
h = (16.67 ft x
12 𝑖𝑛1 𝑓𝑡
)
24= 8.335 𝑖𝑛, 𝑢𝑠𝑒 8.5 𝑖𝑛.
13
2.3 Frame Loading Calculations
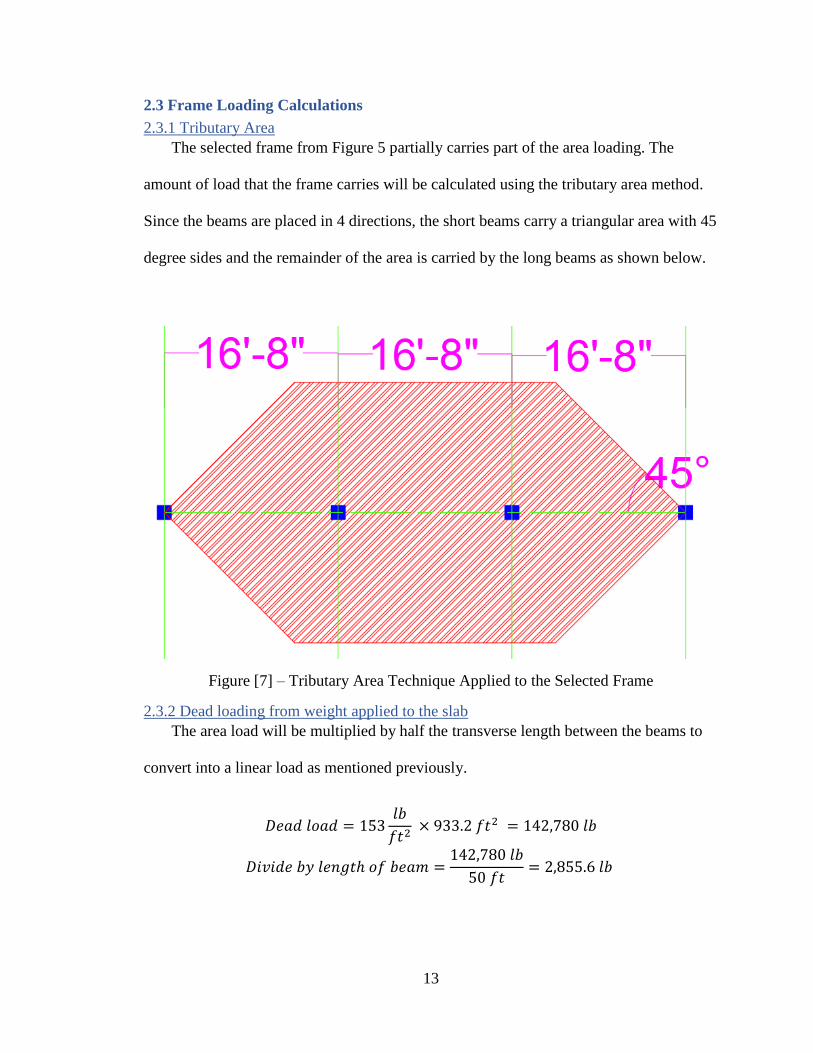
2.3.1 Tributary Area
The selected frame from Figure 5 partially carries part of the area loading. The
amount of load that the frame carries will be calculated using the tributary area method.
Since the beams are placed in 4 directions, the short beams carry a triangular area with 45
degree sides and the remainder of the area is carried by the long beams as shown below.
Figure [7] – Tributary Area Technique Applied to the Selected Frame
2.3.2 Dead loading from weight applied to the slab
The area load will be multiplied by half the transverse length between the beams to
convert into a linear load as mentioned previously.
𝐷𝑒𝑎𝑑 𝑙𝑜𝑎𝑑 = 153𝑙𝑏
𝑓𝑡2 × 933.2 𝑓𝑡2 = 142,780 𝑙𝑏
𝐷𝑖𝑣𝑖𝑑𝑒 𝑏𝑦 𝑙𝑒𝑛𝑔𝑡ℎ 𝑜𝑓 𝑏𝑒𝑎𝑚 =142,780 𝑙𝑏
50 𝑓𝑡= 2,855.6 𝑙𝑏

14
2.3.3 Dead loading from slab weight
Based off of Figure 7, the area loading for the dead and live load results can now be
converted into a linear load onto the selected frame.
𝐷𝑒𝑎𝑑 𝑙𝑜𝑎𝑑 = 150 𝑓𝑡 × 25 𝑓𝑡 × 8.5
12 𝑓𝑡 ×
0.15 𝑘
𝑓𝑡3= 398.44 𝑘𝑖𝑝𝑠
1 frame carries the total weight of the slab divided by the number of frames in the
span subtracted from 1. This is because the edge frames only carry half the weight:
398.44 𝑘
7 − 1 = 66.41 𝑘𝑖𝑝𝑠 𝑑𝑖𝑠𝑡𝑟𝑢𝑏𝑢𝑡𝑒𝑑 𝑜𝑣𝑒𝑟 50 𝑓𝑡 𝑓𝑟𝑎𝑚𝑒
66.41 𝑘
50 𝑓𝑡= 1.33
𝑘
𝑓𝑡= 1,330
𝑙𝑏
𝑓𝑡
2.3.4 Total Linear Dead Load
𝑇𝑜𝑡𝑎𝑙 𝐷𝑒𝑎𝑑 𝐿𝑜𝑎𝑑 = 2855.6𝑙𝑏
𝑓𝑡+ 1,330
𝑙𝑏
𝑓𝑡= 4185.6
𝑙𝑏
𝑓𝑡= 4.19
𝑘
𝑓𝑡
Figure [8] – Total Dead Load Applied to the Selected 2-D Frame

15
2.3.5 Total Linear Live Load on each floor
From Table 2.3, live loading is 40 lb/ft2
𝑡𝑜𝑡𝑎𝑙 𝑙𝑖𝑣𝑒 𝑙𝑜𝑎𝑑 𝑜𝑛 𝑒𝑎𝑐ℎ 𝑓𝑙𝑜𝑜𝑟 𝑜𝑓 𝑡ℎ𝑒 𝑓𝑟𝑎𝑚𝑒 = 40𝑙𝑏
𝑓𝑡2 × 933.2 𝑓𝑡2 = 37,328 𝑙𝑏
𝐷𝑖𝑣𝑖𝑑𝑒 𝑏𝑦 𝑙𝑒𝑛𝑔𝑡ℎ 𝑜𝑓 𝑓𝑟𝑎𝑚𝑒 =37,328 𝑙𝑏
50 𝑓𝑡= 746.56 𝑙𝑏 = 0.75 𝑘
Figure [9] – Total Live Load Applied to the Selected 2-D Frame
2.3.6 Total Joint Lateral Load from seismic effect
After redistribution of the seismic shear across the height of the building as seen in
Table 2.8, it can be seen that in a ascending order of stories, the lateral force increases
which is logically valid as to which the groundular movement occurs at the fault lines of
the earth’s surface. Thus, this allows the advancement into the next designing procedure
of a ordinary reinforced concrete moment frame.

16
The lateral force is applied onto the centroid of each beam-slab joint over a two-
dimensional analysis on each story, as it was derived from the weight of the entire floor
and story height. For structural design purposes, the loads are applied in a distributed way
to the entire story, hence avoiding any numerical singularity and overdesigning, as it
would be the case if point loads would be applied in a conventional way.
Figure [10] – Distributed Seismic Shear Applied to the Centroid of each Beam of the
Selected 2-D frame
17
CHAPTER 3
3.1 Building Code Requirements
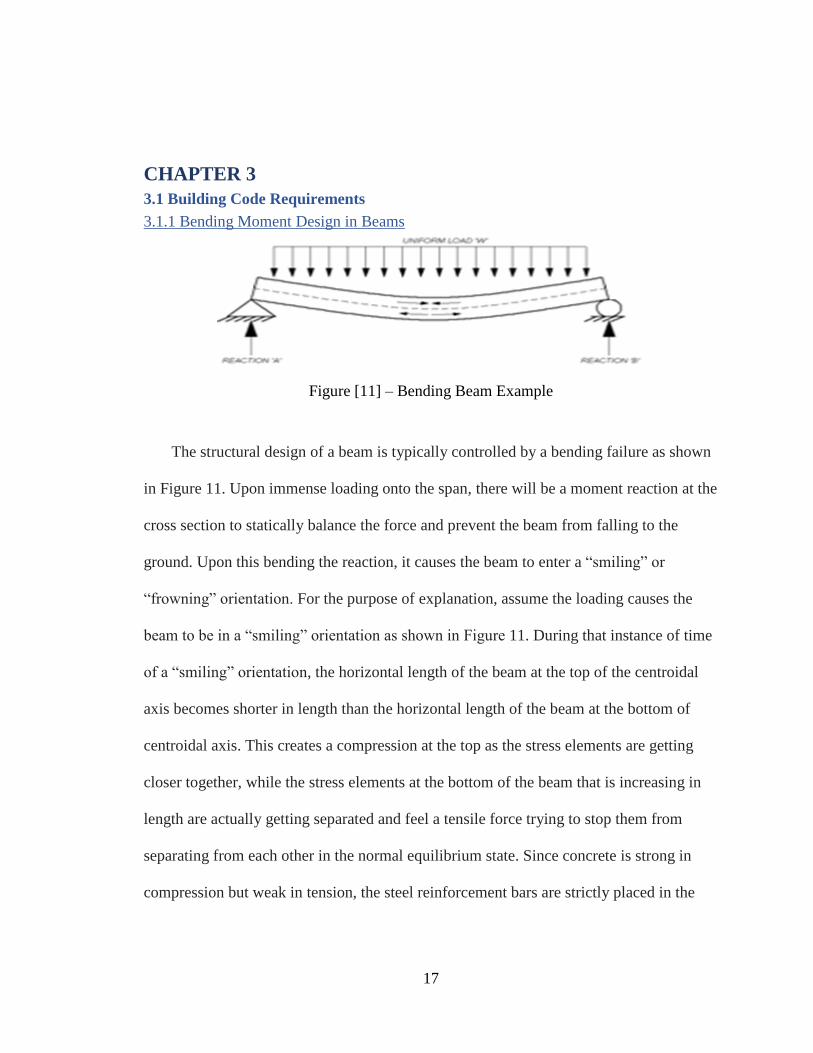
3.1.1 Bending Moment Design in Beams
Figure [11] – Bending Beam Example
The structural design of a beam is typically controlled by a bending failure as shown
in Figure 11. Upon immense loading onto the span, there will be a moment reaction at the
cross section to statically balance the force and prevent the beam from falling to the
ground. Upon this bending the reaction, it causes the beam to enter a “smiling” or
“frowning” orientation. For the purpose of explanation, assume the loading causes the
beam to be in a “smiling” orientation as shown in Figure 11. During that instance of time
of a “smiling” orientation, the horizontal length of the beam at the top of the centroidal
axis becomes shorter in length than the horizontal length of the beam at the bottom of
centroidal axis. This creates a compression at the top as the stress elements are getting
closer together, while the stress elements at the bottom of the beam that is increasing in
length are actually getting separated and feel a tensile force trying to stop them from
separating from each other in the normal equilibrium state. Since concrete is strong in
compression but weak in tension, the steel reinforcement bars are strictly placed in the

18
tensile zone, as it simultaneously strengthens the design and is more economic.
Therefore, the first controlling parameter of the beam is a bending due to a moment [19].
𝑅𝑁 = 𝑀𝑢
∅𝑏𝑑2 [Eqn. 8]
𝜌 = 0.85𝑓′
𝑐
𝑓𝑦(1 − √1 −
2𝑅𝑛
0.85𝑓′𝑐
) [Eqn. 9]
𝐴𝑠 = 𝜌𝑏𝑑 [Eqn. 10]
3.1.2 Shear Design in Beams
Figure [12] - Demonstration of a Shear Failure in a Beam
Beams could also fail in shear. This is a vertical force parallel to the cross section of
the beam which occurs to reach equilibrium after a vertical force application. A stirrup
reinforcement is typically used to strengthen the shear strength of the beam [20]. Thus,
the final design of the beam will be a combination of stirrups and reinforcing bars. A
typical example of the final design cross section of a beam is shown in Figure 13.
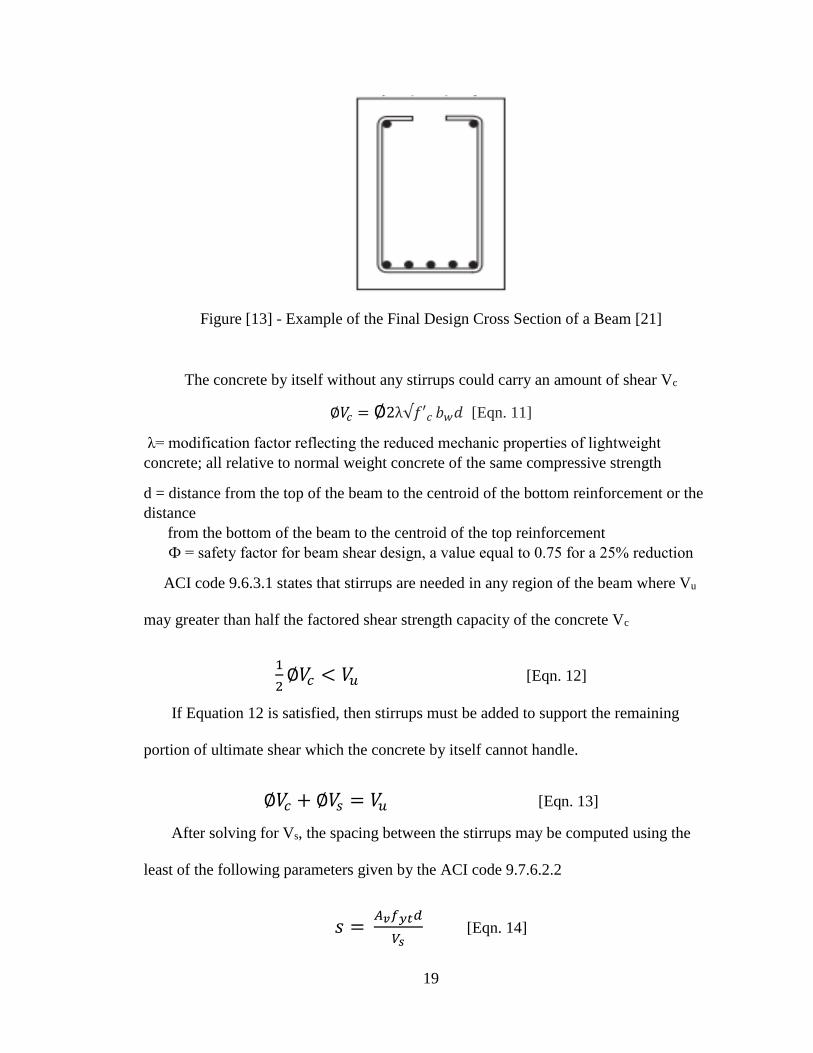
19
Figure [13] - Example of the Final Design Cross Section of a Beam [21]
The concrete by itself without any stirrups could carry an amount of shear Vc
∅𝑉𝑐 = ∅2λ√𝑓′𝑐 𝑏𝑤𝑑 [Eqn. 11]
λ= modification factor reflecting the reduced mechanic properties of lightweight
concrete; all relative to normal weight concrete of the same compressive strength
d = distance from the top of the beam to the centroid of the bottom reinforcement or the
distance
from the bottom of the beam to the centroid of the top reinforcement
Ф = safety factor for beam shear design, a value equal to 0.75 for a 25% reduction
ACI code 9.6.3.1 states that stirrups are needed in any region of the beam where Vu
may greater than half the factored shear strength capacity of the concrete Vc
1
2∅𝑉𝑐 < 𝑉𝑢 [Eqn. 12]
If Equation 12 is satisfied, then stirrups must be added to support the remaining
portion of ultimate shear which the concrete by itself cannot handle.
∅𝑉𝑐 + ∅𝑉𝑠 = 𝑉𝑢 [Eqn. 13]
After solving for Vs, the spacing between the stirrups may be computed using the
least of the following parameters given by the ACI code 9.7.6.2.2
𝑠 = 𝐴𝑣𝑓𝑦𝑡𝑑
𝑉𝑠 [Eqn. 14]

20
𝑠 = 𝐴𝑣𝑓𝑦𝑡
0.75√𝑓′𝑐𝑏𝑤 [Eqn. 15]
𝑠 = 𝐴𝑣𝑓𝑦𝑡
50𝑏𝑤 [Eqn. 16]
𝑠 = 𝑑
2 [Eqn. 17]
3.1.3 Beam Column Design
In a structural project, it is important to understand the load path through the
members. In general, the slab transfers the load to the beams, which transfer the load to
the nearby column. Those stresses travel in the vertical direction until the next beam
underneath. This process occurs again for each beam to column until the loading reaches
the footing. Regardless of how many floors are present in a building, each column
operates on a continuous column, consequently, this means each beam at each floor gives
the same reaction at the joint of the continuous column. This is because each floor is
made up of the same slab and presumably the same amount of people, thus the slabs
receive the same amount of factored load while the continuous column bears those loads
individually at each slab joint. Knowingly, this means the columns placed at the floor will
have to bear the weight of the whatever part of the structure is above [22].
Before initiating the design process, the slenderness of the column itself must be
determined. This is based on the geometry of the column and whether it is laterally
braced. Reinforced concrete columns usually have small slenderness ratios. As a result,
they can usually be designed as short columns without strength reductions because of
slenderness. However, no design shall begin unless the column is proven to be short
using the slenderness ratio according to the ACI Code requirements [23].

21
For an unbraced column that is fixed at both ends:
𝑘 = 0.5 [Eqn. 18]
For sway frames, the column is considered short if the following equation is satisfied
𝑘𝑙𝑢
𝑟≤ 22 [Eqn. 19]
(Where that M1 is the smaller of the two moments. Note that M1 should have a negative
sign for single curvature and a positive sign for double curvature)
(ACI Code section 2.5.6.1 permits to equalize r to 0.3 times the dimension of the
rectangular column stability is being considered in)
After determination of each column of the building being short using the Equation
19, the project has been designed using short reinforced concrete columns. Since short
columns failure occurs due to initial material failure, the load that it can support is
controlled by the dimensions of the cross sections and the strength of the material. This
fact has been taken in account and the following equation is used to calculate the gross
area of square column.
∅𝑃𝑛 = ∅0.80[0.85f ′c(Ag − Ast) + fyAst] [Eqn. 20]
Ag is no more than the preliminary design area for the column experiencing pure
axial loading. In reality however-the columns also experience a moment. An interaction
diagram which has been already developed by the ACI code has different design
parameters for the steel fractional area based on multiple iterations of assumed steel
strain. Thus, the diagram may be used to design a column that undergoes both axial load
and bending [24].

22
Figure [14] – Example of an Interaction Diagram
3.1.4 Overturning and Deflection
The structure shall be designed to resist overturning effects caused by the seismic
forces. Rigid diaphragms are applied to each joint of each story. Rigid diaphragms are
structural elements that transmit the lateral loads to the frame.
δ𝑥 =𝐶𝑑δ𝑥𝑒
𝐼𝑒 [Eqn. 21] [25]
The drift at story level x is determined by subtracting the design earthquake
displacement at the bottom of the story from the design earthquake displacement at the
top of the story.
∆ = δ𝑥 − δ𝑥−1 [Eqn. 22] [26]
The design story drift (Δ) as determined Equation 22 shall not exceed the allowable
story drift (Δa) as obtained from Table 2.10

23
Table 2.10 – Allowable Story Drift Δa [27]
∆𝑎= 0.020ℎ𝑥𝑥 [Eqn. 23]
If the deflection of any joint of the frame surpasses Equation 23, then the design is
not safe. Results for the deflections can be found in Table 4.4.
3.2 Structural Analysis Method
The structural analysis is performed using Load & Resistance Factor Design,
commonly referred to as the LRFD Load Factors in the structural engineering field.
LRFD Load Factors compute for a percentage increase/decrease for multiple combined
loading cases. This creates a limit state condition for which if bypassed, the structure no
longer fulfills the safety design criteria. Its a method of proportioning structural members
such that the computed forces produced in the members by the factored loads do not
exceed the member design strength.
Since only dead, live and earthquake loading will be used, the following LRFD [28]
equations govern:
1.4𝐷 [Eqn. 24]
1.2𝐷 + 1.6𝐿 [Eqn. 25]
1.2 𝐷 + 0.5𝐿 + 1.0𝐸 [Eqn. 26]
0.9𝐷 + 1.0𝐸 [Eqn. 27]
E = Earthquake effect
24
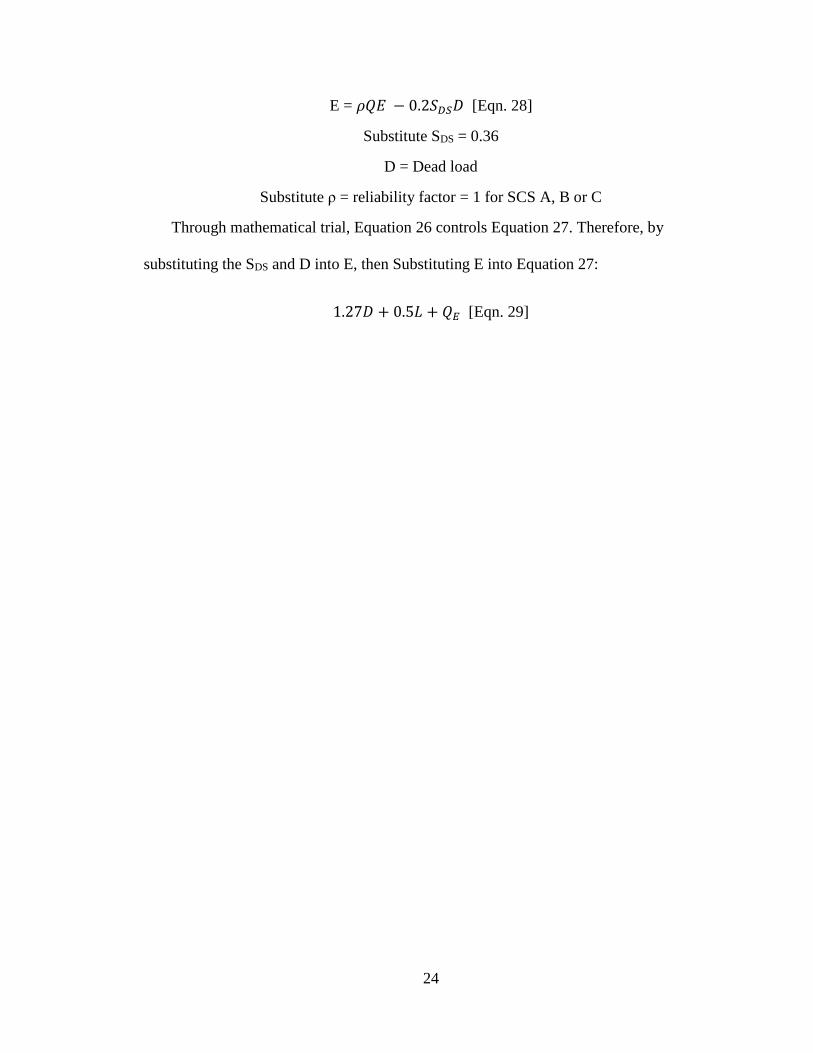
E = 𝜌𝑄𝐸 − 0.2𝑆𝐷𝑆𝐷 [Eqn. 28]
Substitute SDS = 0.36
D = Dead load
Substitute ρ = reliability factor = 1 for SCS A, B or C
Through mathematical trial, Equation 26 controls Equation 27. Therefore, by
substituting the SDS and D into E, then Substituting E into Equation 27:
1.27𝐷 + 0.5𝐿 + 𝑄𝐸 [Eqn. 29]

25
CHAPTER 4
4.1 Frame Analysis and Design
It is completely possible to analyze the frame in Figure 5 without the use of
technology but it is rather very time consuming. For the purposes of merely
accomplishing the objective of this study comparison, a structural analysis software
called “SAP2000” will be used to determine the axial force, bending moment, and shear
in the critical beam and column of the frame [29]. Within the software itself, the loading
cases of Equation 25 & 29 were implemented to demonstrate the results for each case
separately.
Figure [15] – Load Case Implementation in SAP2000
The frame will be designed based on two sets of results. The first set involves only
gravity loads. The second set involves both the gravity loads and lateral loads previously
discussed. All the results for each category may be found in the Appendix.

26
4.1.1 Bending Moment Design
The main goal behind the design of a beam is finding the depth, width and the steel
percentage. This can only be done by starting with a reasonable assumption. A good
approach is to attempt to minimize the steel area and also to reach an aspect ratio between
1.5-2.0 to maintain strong rigidity. Therefore, the analysis procedure was performed with
repetitive trials of assumed frame sections. The depth and width would be decreased by 1
inch in each structural analysis trial until the value of the bending moment began to
exceed 240 kip-ft. Thus, the final beam dimensions where chosen to be a 24.5” depth and
a 14” base thickness. The cover for the reinforcing bars is 2.5” which is the generic value
used in reality.
When designing for the positive moment, the tension occurs at the bottom.
Therefore, the maximum moment is used to design for the steel reinforcing bars placed at
the bottom of the beam.
From Equation 8, 𝑅𝑁 = 𝑀𝑢
∅𝑏𝑑2 and Appendix B3
𝑅𝑁 = 12
𝑖𝑛𝑓𝑡
× 115,500 − 𝑓𝑡
0.9 × 14 𝑖𝑛 × (24.5 𝑖𝑛)2= 182.46 𝑝𝑠𝑖
From Equation 9,
𝜌 = 0.85𝑓′
𝑐
𝑓𝑦(1 − √1 −
2𝑅𝑛
0.85𝑓′𝑐
)
𝜌 = 0.85×4000 𝑝𝑠𝑖
60,000 𝑝𝑠𝑖(1 − √1 −
2 ×182.46 𝑝𝑠𝑖
0.85×4000 𝑝𝑠𝑖) = 0.00313 < 𝜌𝑚𝑖𝑛 = 0.0033
27
From Equation 10, 𝐴𝑠 = 0.0033 × 14 𝑖𝑛 × 24.5 𝑖𝑛 = 1.132 𝑖𝑛2
Therefore, use 6 #4 bars at the bottom of the beam as they have an area of
1.18 in2 > 1.132 in2 [32]
The same calculation was repeated for the critical negative moment of 158.6 k-ft
which yields a final As of 1.5 in2. Therefore, use 5 #5 bars at top of the beam as they have
an area of 1.53 in2 > 1.5 in2 [33]
Final design of reinforcing bars:
6 #4 at the bottom of the beam, 2.5” cover
5 #5 bars at the top of the beam, 2.5” cover
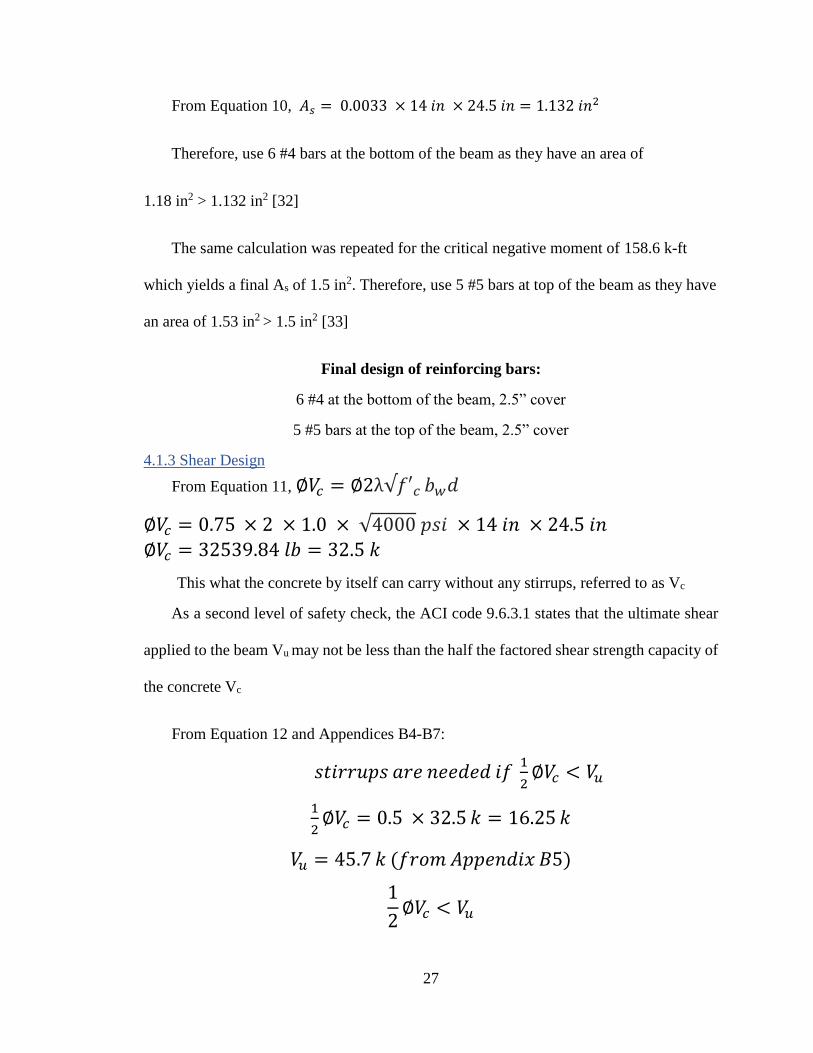
4.1.3 Shear Design
From Equation 11, ∅𝑉𝑐 = ∅2λ√𝑓′𝑐 𝑏𝑤𝑑
∅𝑉𝑐 = 0.75 × 2 × 1.0 × √4000 𝑝𝑠𝑖 × 14 𝑖𝑛 × 24.5 𝑖𝑛
∅𝑉𝑐 = 32539.84 𝑙𝑏 = 32.5 𝑘
This what the concrete by itself can carry without any stirrups, referred to as Vc
As a second level of safety check, the ACI code 9.6.3.1 states that the ultimate shear
applied to the beam Vu may not be less than the half the factored shear strength capacity of
the concrete Vc
From Equation 12 and Appendices B4-B7:
𝑠𝑡𝑖𝑟𝑟𝑢𝑝𝑠 𝑎𝑟𝑒 𝑛𝑒𝑒𝑑𝑒𝑑 𝑖𝑓 1
2∅𝑉𝑐 < 𝑉𝑢
1
2∅𝑉𝑐 = 0.5 × 32.5 𝑘 = 16.25 𝑘
𝑉𝑢 = 45.7 𝑘 (𝑓𝑟𝑜𝑚 𝐴𝑝𝑝𝑒𝑛𝑑𝑖𝑥 𝐵5)
1
2∅𝑉𝑐 < 𝑉𝑢

28
Therefore, Equation 12 is not satisfied, and stirrups must be added to support the
remaining portion of the ultimate shear which the concrete itself cannot handle. From
Equation 13:
∅𝑉𝑐 + ∅𝑉𝑠 = 𝑉𝑢
∅𝑉𝑠 = 𝑉𝑢 − ∅𝑉𝑐
∅𝑉𝑠 = 45.7 − 32.5 𝑘 = 13.2 𝑘 = 13,200 𝑙𝑏
𝑉𝑠 = 13,200 𝑙𝑏
∅=
13,200 𝑙𝑏
.65= 20,308 = 20.31𝑘
The spacing between the stirrups may be computed using the least of the following
parameters given by the ACI code 9.7.6.2.211
𝑠 = 𝐴𝑣𝑓𝑦𝑡𝑑
𝑉𝑠 [Eqn. 14]
𝑠 = 𝐴𝑣𝑓𝑦𝑡
0.75√𝑓′𝑐𝑏𝑤 [Eqn. 15]
𝑠 = 𝐴𝑣𝑓𝑦𝑡
50𝑏𝑤 [Eqn. 16]
𝑠 = 𝑑
2 𝑜𝑟 12" [Eqn. 17]
Where Av is equal to 0.22 in2, the area of a #3 stirrup.
After mathematical trials, the least spacing is obtained using Equation 17:
𝑠 = 12"
Since the shear value can only get smaller, the spacing can only get bigger. With 12
inches being the max spacing allowed by ACI code, 12 inch spaced #3 stirrups will be
used across the beam until termination at the location where the shear experienced is less
than 1
2∅𝑉𝑐. The stirrup termination location can be found in Appendices B6-B7

29
Final design of stirrup:
1 #3 at 2”, 4 #3 at 12” spacing starting from left supporting
1 #3 at 2”, 6 #3 at 12” from starting from right support
4.1.5 Column Axial and Bending Moment Design
During the entire structural analysis, 9 inch by 9 inch columns were used. This was
no more than an assumption, as the smallest column that could be used is a 9 inch by 9
inch and the building is designed merely as a residential building, thus it mainly just
carries occupant weight and self-weight.
For an unbraced column with both ends fixed, Equation 18 states:
𝑘 = 0.5
Using Equation 19, if the inequality is satisfied then the column is confirmed to be short:
𝑘𝑙𝑢
𝑟≤ 34 − 12
𝑀1
𝑀2
0.5 × (10.5 𝑓𝑡 × 12𝑖𝑛𝑓𝑡
− (13.5 𝑖𝑛 + 13.5 𝑖𝑛)
(0.3 × 9 𝑖𝑛)≤ 34 − 12(
−11.6 𝑘 − 𝑓𝑡
23.6 𝑘 − 𝑓𝑡)
13.333 ≤ 22 , column is short
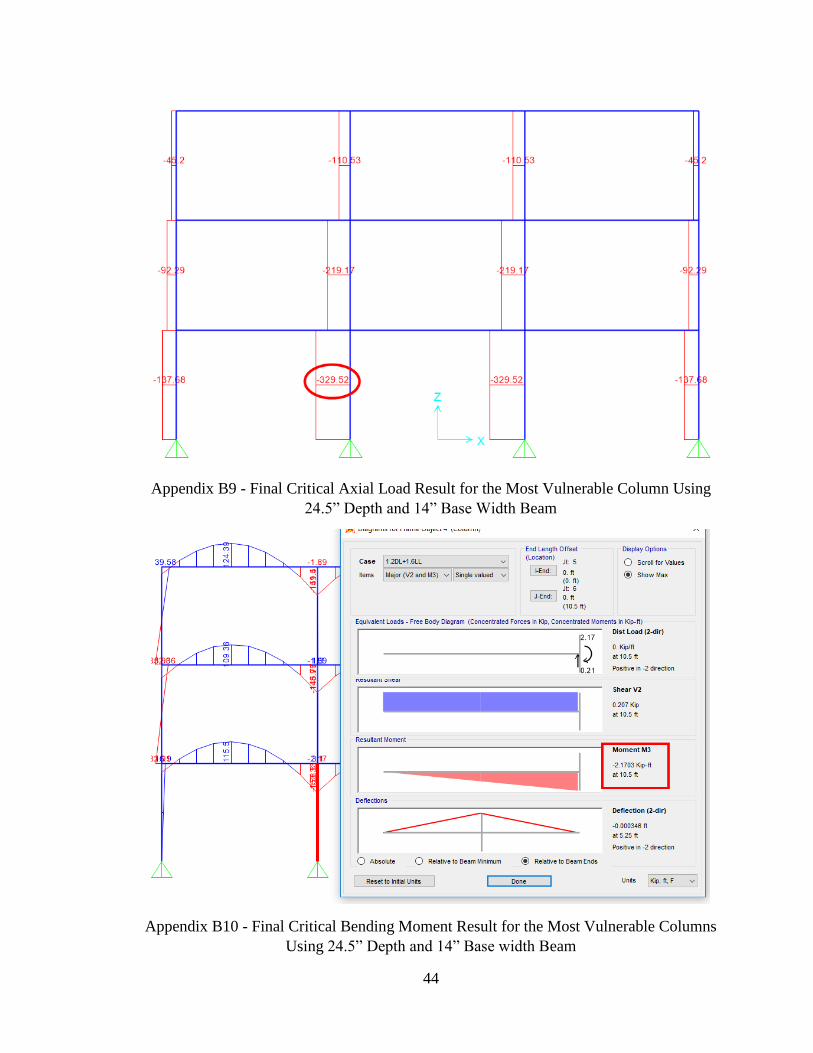
Using Equation 20, Appendices B8-B10, and assuming 30% reinforcement is needed:
∅𝑃𝑛 = ∅0.80[0.85f ′c(Ag − Ast) + fyAst]
(0.65)(329.52) 𝑘 = (0.65)(0.80)[0.85(4 ksi)(Ag − 0.03Ag) + (60 ksi)0.03Ag]
𝐴𝑔 = 80.79 𝑖𝑛2
The area used by the SAP2000 model is 81 in2 > 80.79 in2. The design is safe as long as
30% reinforcing bars are used.
Using the Equations given by the interaction diagram in Figure 14:
𝐾𝑛 =𝑃𝑛
𝑓′𝑐𝐴𝑔
𝑃𝑛 = 𝑃𝑢
∅=
329.52 𝑘
0.65= 507 𝑘

30
𝐾𝑛 =507 𝑘
4 𝑘𝑠𝑖 (81 𝑖𝑛2)= 1.56
𝑅𝑛 =𝑃𝑛𝑒
𝑓′𝑐𝐴𝑔ℎ
𝑀𝑛 = 𝑀𝑢
∅=
2.17 𝑘 − 𝑓𝑡
0.65= 3.34 𝑘 − 𝑓𝑡
𝑒 = 𝑀𝑛
𝑃𝑛=
3.34 𝑘 − 𝑓𝑡
507 𝑘 (
12 𝑖𝑛
1 𝑓𝑡) = 0.079 𝑖𝑛
𝑅𝑛 =507 𝑘 (0.079 𝑖𝑛)
(4 𝑘𝑠𝑖)(81 𝑖𝑛2)(9 𝑖𝑛)= 0.0137
𝛾 = 𝑐𝑙𝑒𝑎𝑟 𝑑𝑖𝑠𝑡𝑎𝑛𝑐𝑒 𝑏𝑒𝑡𝑤𝑒𝑒𝑛 𝑐𝑜𝑛𝑓𝑖𝑛𝑒𝑚𝑒𝑛𝑡 𝑏𝑎𝑟𝑠
𝑡𝑜𝑡𝑎𝑙 𝑙𝑒𝑛𝑔𝑡ℎ 𝑜𝑓 𝑐𝑜𝑙𝑢𝑚𝑛=
6 𝑖𝑛
9 𝑖𝑛= 0.667
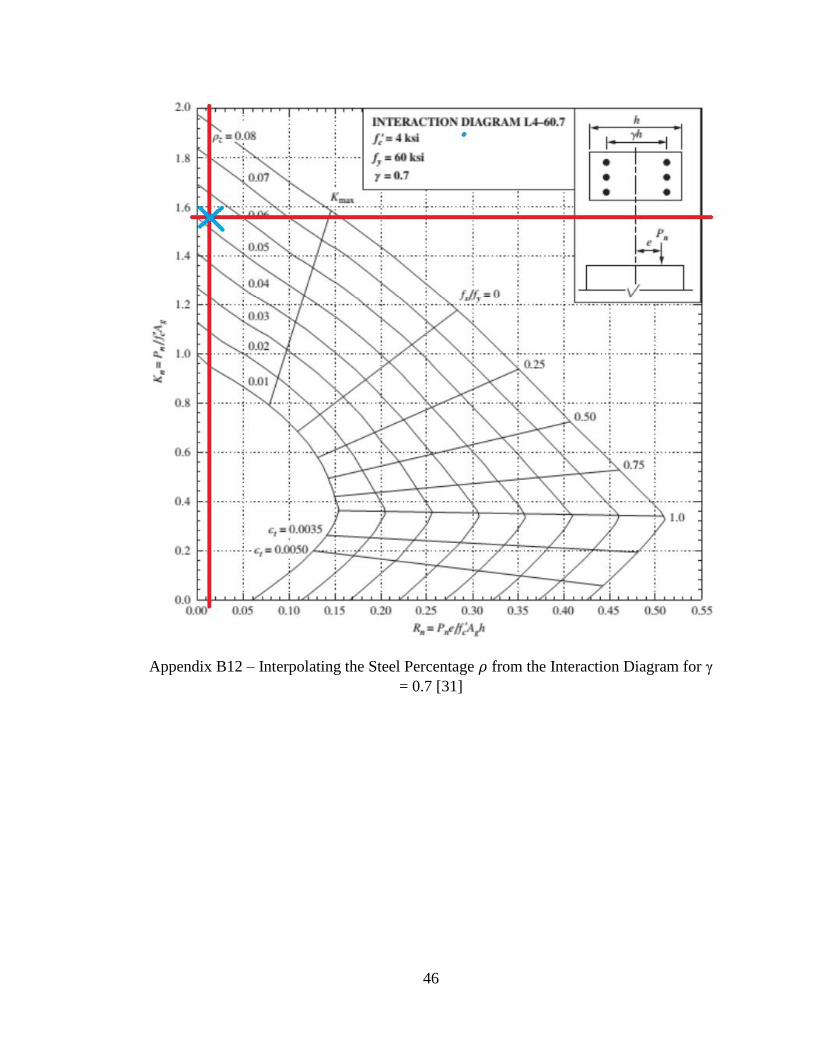
After interpolating both graphs in Appendix B11 and B12, the value for the steel
percentage ρ was around 0.0525
𝑅𝑒𝑖𝑛𝑓𝑜𝑟𝑐𝑒𝑚𝑒𝑛𝑡 𝐴𝑟𝑒𝑎 = 𝜌𝐴𝑔 = 0.0525 (81 𝑖𝑛2) = 4.25 𝑖𝑛2
Final column design for axial and bending:
Use 10 #6 bars which have an area of 4.42 in2 > 4.25 in2

31
4.2 Results and Comparison of the Frame Analysis
The structure was re-analyzed with the exact same frame section dimensions used
previously; the only difference is that the effect of the earthquake was taken into account
using Equation 29. The results for each table in this section can be found in Appendices
B13-B16
Table 4.1 – Bending Moment in Critical Beam Comparison
BEAM Seismic Effect NOT
Considered
Seismic Effect
Considered
Positive Bending Moment 115.5 k-ft 225.2 k-ft
Negative Bending Moment 158.6 k-ft 321.12 k-ft
Table 4.2 – Shear Force in Critical Beam Comparison
BEAM Seismic Effect NOT considered Seismic Effect Considered
Shear Force 58.4 k-ft 79.1 k-ft
Table 4.3 – Beam Comparison
COLUMN Seismic Effect NOT
considered
Seismic Effect
Considered
Axial Load 329.52 k 316.44 k
Bending Moment 2.17 k-ft 206.7 k-ft
Table 4.4 – Defection Check of the Centroid of Each Joint
It can be seen that the second story deflects more than the allowable 2.52 inch
Story
N-S Direction E-W Directions CHECK
δxe (ft) δx (ft) Δ(in) δxe (ft) δx (ft) Δ (in) Δa (in) Roof 0.2577 0.5154 0.648 0.0126 0.0252 0.0056 2.52
3 0.2307 0.4614 1.14 0.0098 0.0196 0.008 2.52 2 0.1832 0.3664 4.3968 0.0058 0.0116 0.0116 2.52 1 0 0 0 0 0 0 2.52
32
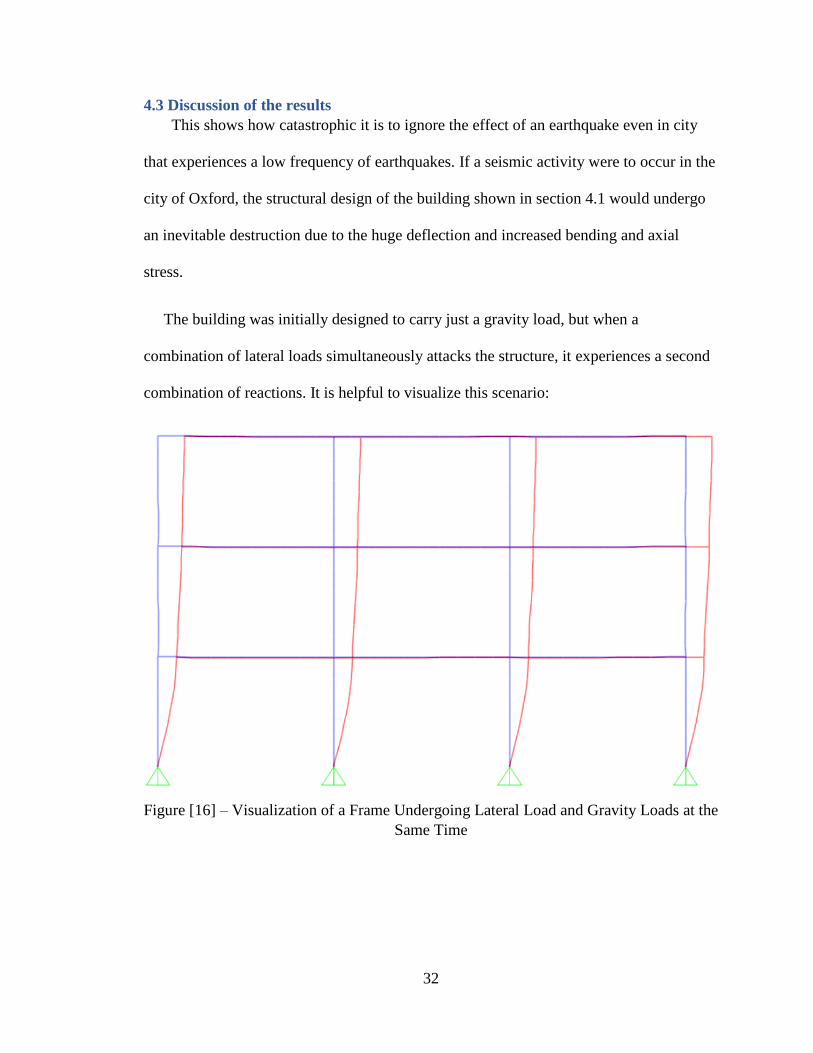
4.3 Discussion of the results
This shows how catastrophic it is to ignore the effect of an earthquake even in city
that experiences a low frequency of earthquakes. If a seismic activity were to occur in the
city of Oxford, the structural design of the building shown in section 4.1 would undergo
an inevitable destruction due to the huge deflection and increased bending and axial
stress.
The building was initially designed to carry just a gravity load, but when a
combination of lateral loads simultaneously attacks the structure, it experiences a second
combination of reactions. It is helpful to visualize this scenario:
Figure [16] – Visualization of a Frame Undergoing Lateral Load and Gravity Loads at the
Same Time

33
From Figure [16], several key differences can be seen when a frame experiences
lateral load. The beams do not just bend, the ends also rotate along. The columns at the
first floor experience a double curvature instead of a single curvature. This completely
interferes with determining if the column is slender or not as stated in Equation 19.
From Table 4.1, the bending moment increases by more than a double when an
earthquake hits the building. The building was initially designed to only withstand a
237.6 k-ft moment.
Initially, every beam was designed to resist a shear force of 51.4 kips according to
the critical beam in the top right of the frame (Appendix B4). With the lateral load, the
critical beam becomes the member at the bottom right of the frame, and experiences 69.4
kips of shear as seen in Table 4.2. That is 18,000 more pounds of shear force that has not
been accounted for at all during the design with no seismic effect consideration.
Therefore, the design should be rejected and the calculation for the stirrup design should
be re-iterated with a shear force of 69.4 kips to ensure adequate stirrups are placed to
carry the 18 extra kips.
The column experiences about 55 more kips of axial load as seen in Table 4.3. This
does not make much of a difference when the gross area Ag is re-calculated because the
load is still relatively small regardless. The enormous difference comes from the bending
moment, which goes from 6.61 k-ft to 426.6 k-ft. This would change the value of Rn
tremendously and require much bigger reinforcing bars.
The columns were initially defined to be 9 inches by 9 inches. This was enough to
resist gravity loads, but when lateral loads were applied-the deflections as seen in Table
34
4.4 were tremendous. This is not surprising, as the columns were the smallest possible
dimension, meaning the smallest possible moment of inertia, making the column most
prone to deflection.
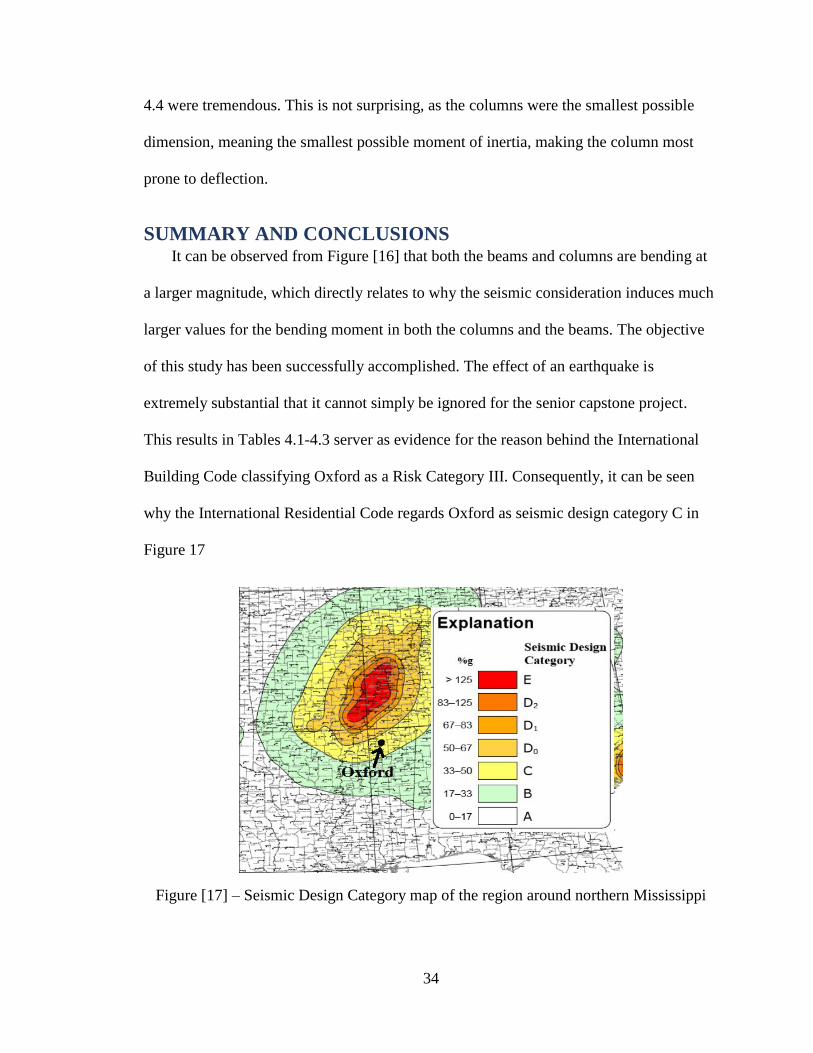
SUMMARY AND CONCLUSIONS It can be observed from Figure [16] that both the beams and columns are bending at
a larger magnitude, which directly relates to why the seismic consideration induces much
larger values for the bending moment in both the columns and the beams. The objective
of this study has been successfully accomplished. The effect of an earthquake is
extremely substantial that it cannot simply be ignored for the senior capstone project.
This results in Tables 4.1-4.3 server as evidence for the reason behind the International
Building Code classifying Oxford as a Risk Category III. Consequently, it can be seen
why the International Residential Code regards Oxford as seismic design category C in
Figure 17
Figure [17] – Seismic Design Category map of the region around northern Mississippi

35
When designing a building, regardless of the location, the seismic activity should
always be considered as it can have a huge impact on the design. The frequency of
earthquake occurrence does not necessarily guarantee whether or not an earthquake will
take place. Therefore, it is highly beneficial for every civil engineering student to learn
the step-by-step process on how to evaluate the lateral load based on the location and be
able to design for it using the code provisions of ACI, ASCE and IBC. Structural
engineers always account for the seismic effect in the real world, therefore the students
who are interested in the structural engineering field should be familiar with seismic
design as well.
RECOMMENDATIONS The technique used to determine the effect of the seismic loads was an overdesign.
This is because the selected frame from Figure [4] was structurally analyzed without
considering the stiffness of the slab placed on top of each beam. Had the slab stiffness
been taken into account, the amount of lateral restrained on the frame would decrease by
a large amount. This decreased amount of lateral movement would lower the amount of
bending and thus lower the bending moment values.
All work was based on a 2-Dimensional analysis. If a complete 3-Dimensional
analysis of the NOLA was done, the moment values would be less since the out-of-plane
beams could have contributed to resisting the lateral force on the joints, which would
lower the amount of lateral movement and thus the amount of bending moment.
A complete 3-Dimensional model as well as a slab stiffness consideration is
recommended for future work regarding the topic of this thesis.

36
LIST OF REFERENCES [1] Jack C. McCormack and Russel H. Brown, Chapter 14 “Continuous Reinforced
Concrete Structures” Design of Reinforced Concrete: 10th Edition, ACI 318-14, 2016.
[2] “The NOLA Oxford, MS”, Eley Barkley P.A. Engineering and Architecture,
October 3 2018
[3] Aqua-Calc, “Search for substances, materials, gravels and foods,” 2019 AVCalc LLC,
https://www.aqua-calc.com/page/density-table/substance/cement-coma-and-blank-mortar
[4] ASCE 7-16 “Table 4.3-1 Minimum Uniformly Distributed Live Loads, Lo , and
Minimum Concentrated Live Loads”, American Society of Civil Engineers, 2017.
[5] SECTION 1613 EARTHQUAKE LOADS, 1613.1 Scope, International Building
Code 2015.
[6] ASCE 7 Hazards Report “University of Mississippi”, American Society of Civil
Engineers, Oct 2 2018
[7] Table 1604.5 RISK CATEGORY OF BUILDINGS AND OTHER STRUCTURES,
International Building Code 2015
[8] ASCE 7-16, Table 12.2-1 Design Coefficient and Factors for Seismic Force-Resisting
Systems”, American Society of Civil Engineers, 2017.
[9] ASCE 7-16, Table 1.5-2 Importance Factors by Risk Category of Buildings and Other
Structures for Snow, Ice, and Earthquake loads, International Building Code 2015
[10] ASCE 7-16, 11.4.5 Design Spectral Acceleration Parameters, Equation 11.4-3,
American Society of Civil Engineers, 2017.
[11] ASCE 7-16, 11.4.5 Design Spectral Acceleration Parameters, Equation 11.4-4,
American Society of Civil Engineers, 2017.
[12] ASCE 7-16, 12.7 MODELING CRITERIA, Equation 12.8-2, American Society of
Civil Engineers, 2017.
[13] ASCE 7-16, 12.8.2.1 Approximate Fundamental Period, Equation 12.8-7, American
Society of Civil Engineers, 2017.
[14] ASCE 7-16, 12.8.1 Seismic Base Shear, Equation 12.8-1
[15] ASCE 7-16, 12.8.3 Vertical Distribution of Seismic Forces, American Society of
Civil Engineers, 2017.
[16] ASCE 7-16, 12.8.3 Vertical Distribution of Seismic Forces, Equation 12.8-12
American Society of Civil Engineers, 2017.

37
[17] ACI 318-14, 9.5.2 – One-way construction(nonprestressed), TABLE 9.5(a) –
MINIMUM THICKNESS OF NONPRESTRESSED BEAMS OR ONE-WAY SLABS
UNLESS DEFLECTIONS ARE CALCULATED, American Concrete Institute 2014
[18] Jack C. McCormack and Russel H. Brown, Chapter 14 “Continuous Reinforced
Concrete Structures” Design of Reinforced Concrete: 10th Edition, ACI 318-14, 2016.
[19] Jack C. McCormack and Russel H. Brown, Chapter 4 “Design of Rectangular Beams
and One-Way Slabs”, 4.2 Design of Rectangular Beams, Design of Reinforced Concrete:
10th Edition, ACI 318-14, 2016.
[20] Jack C. McCormack and Russel H. Brown, Chapter 8 “Shear and Diagonal Torsion”,
8.8 Design for Shear, Design of Reinforced Concrete: 10th Edition, ACI 318-14, 2016.
[21] Jack C. McCormack and Russel H. Brown, Chapter 8 “Shear and Diagonal Torsion”,
8.9 ACI Code Requirements, Figure 8.7, Design of Reinforced Concrete: 10th Edition,
ACI 318-14, 2016.
[22] Jack C. McCormack and Russel H. Brown, Chapter 10 “Design of Short Columns
Subject to Axial Load and Bending”, 10.1 Axial Load and Bending, Design of
Reinforced Concrete: 10th Edition, ACI 318-14, 2016.
[23] Jack C. McCormack and Russel H. Brown, Chapter 11 “Slender Columns”, 11.3
Slenderness Effects, Design of Reinforced Concrete: 10th Edition, ACI 318-14, 2016.
[24] Jack C. McCormack and Russel H. Brown, Chapter 10 “Design of Short Columns
Subject to Axial Load and Bending”, 10.4 Use of Interaction Diagrams, Design of
Reinforced Concrete: 10th Edition, ACI 318-14, 2016.
[25] ASCE 7-16, 12.8.5 Overturning, Equation 12.8-15
[26] ASCE 7-16, 12.8.6 Story Drift Determination, American Society of Civil Engineers,
2017.
[27] ASCE 7-16, 12.12.3 Structural Separation, Table 12.12-1 Allowable Story Drift,
American Society of Civil Engineers, 2017.
[28] ASCE 7-16, 2.3 LOAD COMBINATIONS FOR STRENGTH DESIGN, 2.3.1 Basic
Combinations, American Society of Civil Engineers, 2017.
[29] SAP2000 v20 Integrated Software for Structural Analysis and Design, Computers
and Structures, Inc. (CSI)
[30] Jack C. McCormack and Russel H. Brown, Appendix A “Tables and Graphs”,
Design of Reinforced Concrete: 10th Edition, ACI 318-14, 2016.
[31] Jack C. McCormack and Russel H. Brown, Appendix A “Tables and Graphs”,
Design of Reinforced Concrete: 10th Edition, ACI 318-14, 2016.

38
[32] Jack C. McCormack and Russel H. Brown, Appendix A “Tables and Graphs”,
Design of Reinforced Concrete: 10th Edition, ACI 318-14, 2016.
[33] Jack C. McCormack and Russel H. Brown, Appendix A “Tables and Graphs”,
Design of Reinforced Concrete: 10th Edition, ACI 318-14, 2016.

39
APPENDICES Appendix A – Excel Sheet Used to Derive the Seismic Design Shear for each Story
Appendix A1 – Part 1 of the Excel Calculation for Deriving Seismic Design Shear
Appendix A2 – Part 2 of the Excel Calculation for Deriving Seismic Design Shear
Appendix A3 – Part 2 of the Excel Calculation for Deriving Seismic Design Shear

40
Appendix B – SAP2000 Results and Interaction Diagram Interpolation
Appendix B1 – Critical Bending Moment Results of Dead and Live Load Case Using the
Initial Beam Dimension Assumption
Appendix B2 – Final Frame definition of Beam

41
Appendix B3 – Final Critical Bending Moment Results for the Most Vulnerable Beams
Using 24.5” Depth and 14” Base Width Beam
/
Appendix B4 - Final Critical Shear Result for the Most Vulnerable Beam Using 24.5”
Depth and 14” Base Width Beam

42
Appendix B5 – Ultimate Shear at a Distance equal to d from the Face of the Support
Appendix B6 – Stirrup Termination Location at Approximately 8.6 ft Away from the Left
Support (Where The Shear Experienced by the Beam = 1
2∅𝑉𝑐 = 16.5 k)

43
Appendix B7 – Stirrup Re-Applied at Approximately 21.14 ft Away from the Left
Support (Where the Shear Experienced by the Beam = 1
2∅𝑉𝑐 = 16.5 k)
Appendix B8 – Final Frame Definition of a Column
44
Appendix B9 - Final Critical Axial Load Result for the Most Vulnerable Column Using
24.5” Depth and 14” Base Width Beam
Appendix B10 - Final Critical Bending Moment Result for the Most Vulnerable Columns
Using 24.5” Depth and 14” Base width Beam

45
Appendix B11 – Interpolating the Steel Percentage 𝜌 from the Interaction Diagram for γ
= 0.6 [30]
46
Appendix B12 – Interpolating the Steel Percentage 𝜌 from the Interaction Diagram for γ
= 0.7 [31]

47
Appendix B13 - Final Critical Bending Moment Result for the Most Affected Beam After
Lateral Loading
Appendix B14 - Final Critical Shear Result for the Most Affected Beam After Lateral
Loading

48
Appendix B15 - Final Critical Axial Load Result for the Most Affected Column After
Lateral Loading
Appendix B16 - Final Critical Bending Moment Result for the Most Affected Column
After Lateral Loading