
The CreditMetrics Package - Welcome to Rmetrics · PDF fileThe CreditMetrics package Provides...
35
Introduction Fundamentals Examples Summary and Outlook The CreditMetrics Package Andreas Wittmann Munich, Germany andreas_wittmann@gmx.de 1st R/Rmetrics User and Developer Workshop, July 10th, 2007 Thune, Switzerland 1 / 35
Transcript of The CreditMetrics Package - Welcome to Rmetrics · PDF fileThe CreditMetrics package Provides...
IntroductionFundamentals
ExamplesSummary and Outlook
The CreditMetrics Package
Andreas Wittmann
Munich, Germany
1st R/Rmetrics User and Developer Workshop,
July 10th, 2007
Thune, Switzerland
1 / 35

IntroductionFundamentals
ExamplesSummary and Outlook
Outline
1 IntroductionMotivationCredit Risk
2 FundamentalsCreditMetricsMigration MatrixSimulation ApproachComputation of thresholdsCalculation of Credit SpreadMonte carlo simulation
3 ExamplesComputation of thresholdsCalculation of Credit SpreadComputation of CVaRHistogram
2 / 35
IntroductionFundamentals
ExamplesSummary and Outlook
MotivationCredit Risk
About Credit Risk and why is it important? (1)
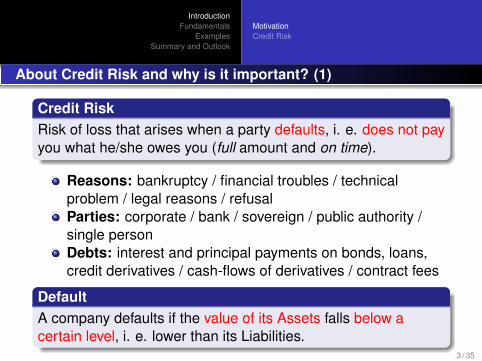
Credit RiskRisk of loss that arises when a party defaults, i. e. does not payyou what he/she owes you (full amount and on time).
Reasons: bankruptcy / financial troubles / technicalproblem / legal reasons / refusalParties: corporate / bank / sovereign / public authority /single personDebts: interest and principal payments on bonds, loans,credit derivatives / cash-flows of derivatives / contract fees
DefaultA company defaults if the value of its Assets falls below acertain level, i. e. lower than its Liabilities.
3 / 35
IntroductionFundamentals
ExamplesSummary and Outlook
MotivationCredit Risk
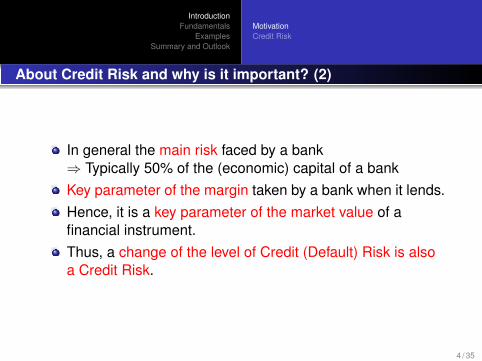
About Credit Risk and why is it important? (2)
In general the main risk faced by a bank⇒ Typically 50% of the (economic) capital of a bankKey parameter of the margin taken by a bank when it lends.Hence, it is a key parameter of the market value of afinancial instrument.Thus, a change of the level of Credit (Default) Risk is alsoa Credit Risk.
4 / 35

IntroductionFundamentals
ExamplesSummary and Outlook
MotivationCredit Risk
Credit Value at Risk (CVaR) (1)
A measure of the losses caused on a portfolio byDefaults:
L̃ = Exposure At Default · Loss Given Default
Deterioration of credit quality⇒ This adds complexity
5 / 35
IntroductionFundamentals
ExamplesSummary and Outlook
MotivationCredit Risk
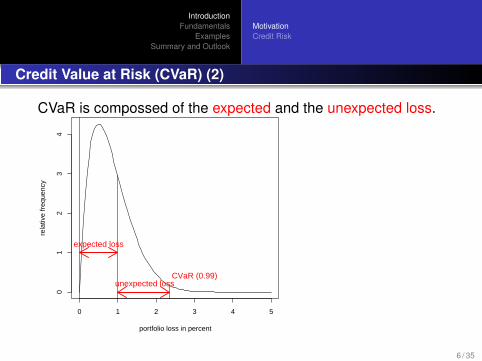
Credit Value at Risk (CVaR) (2)
CVaR is compossed of the expected and the unexpected loss.
portfolio loss in percent
rela
tive
freq
uenc
y
0 1 2 3 4 5
01
23
4
expected loss
unexpected lossCVaR (0.99)
6 / 35

IntroductionFundamentals
ExamplesSummary and Outlook
MotivationCredit Risk
Credit Risk models
model background computation of loss distr.CreditMetrics option price theory monte carlo simulation
CreditPortfolioView macroeconomics monte carlo simulationCreditRisk+ actuary sciences analytical approximation
model input data model byCreditMetrics price of shares J.P. Morgan
CreditPortfolioView macroeconomical data McKinseyCreditRisk+ default rates Credit Suisse Group
7 / 35
IntroductionFundamentals
ExamplesSummary and Outlook
MotivationCredit Risk
The CreditMetrics package
Provides a collection of functions for calculating key datafrom the CreditMetrics Risk model.This model uses an one-year Migration Matrix.The Migration Matrix uses historical transition probabilitiesbetween rating classes.(A credit rating assesses the credit worthiness of anindividual, corporation, or even a country.)Feasible migrations at time t determine the value of acredit position.This can be calculated analytically, but this is extensivewith a high number of obligors.An approach which uses simulation is applied.
8 / 35
IntroductionFundamentals
ExamplesSummary and Outlook
MotivationCredit Risk
Main parameters for Credit Risk (1)
To compute the loss distribution the following informations arenecessary.
Probability of Default (PD): Is the probability that a loanwill not be repayed and fall into default.⇒What is my risk of loosing money?Exposure At Default (EAD): Can be seen as anestimation of the extent to which a bank may be exposedto a counterparty in the event of, and at the time of, thatcounterpartys default.⇒What is my amount at risk?
9 / 35
IntroductionFundamentals
ExamplesSummary and Outlook
MotivationCredit Risk
Main parameters for Credit Risk (2)
Loss Given Default (LGD): Is the fraction of EAD that willnot be recovered following default.⇒ If my counterparty defaults, how much am I going toloose?Credit Spread: Is the difference in yield between differentsecurities due to different credit quality.⇒What is the Market Value of my Credit Risk?
10 / 35
IntroductionFundamentals
ExamplesSummary and Outlook
MotivationCredit Risk
Main parameters for Credit Risk (3)
Expected Loss (EL) can be calculated from the product ofthese quantities
EL = PD · EAD · LGD
Besides the expected loss also the loss distribution can becomputed.
11 / 35

IntroductionFundamentals
ExamplesSummary and Outlook
CreditMetricsMigration MatrixSimulation ApproachComputation of thresholdsCalculation of Credit SpreadMonte carlo simulation
CreditMetrics
Historical transition probabilities between rating classesprovide a basis.⇒ MigrationsThese are illustrated in a one-year Migration Matrix.Possible migrations up to time t determine the value of acredit position.This value can be calculated analytically.But with a high number of debitors this is very extensive.⇒ CorrelationsTherefore a simulation-based approach is used.
12 / 35

IntroductionFundamentals
ExamplesSummary and Outlook
CreditMetricsMigration MatrixSimulation ApproachComputation of thresholdsCalculation of Credit SpreadMonte carlo simulation
Migration Matrix
Gives transition probabilities from initial rating (rows) intotarget rating (columns).Sum of rows has to be 1.Constructed with the basis of historical data.
Example of Migration Matrix (probabilities in percent)AAA AA A BBB BB B CCC D
AAA 90.81 8.33 0.68 0.06 0.12 0 0 0AA 0.70 90.65 7.79 0.64 0.06 0.14 0.02 0A 0.09 2.27 91.05 5.52 0.74 0.26 0.01 0.06BBB 0.02 0.33 5.95 85.93 5.30 1.17 1.12 0.18BB 0.03 0.14 0.67 7.73 80.53 8.84 1.00 1.06B 0.01 0.11 0.24 0.43 6.48 83.46 4.07 5.20CCC 0.21 0 0.22 1.30 2.38 11.24 64.86 19.79
13 / 35
IntroductionFundamentals
ExamplesSummary and Outlook
CreditMetricsMigration MatrixSimulation ApproachComputation of thresholdsCalculation of Credit SpreadMonte carlo simulation
Simulation Approach
Idea: Company returns Vt are assumed to be standardnormal distributed Vt ∼ N(0,1) and simulated.Company value Vt at time t determines the rating at time t .Levels this off, the company remains in the same ratingclass.Migration thresholds (quantils) can be computed withtransition probabilities.
14 / 35
IntroductionFundamentals
ExamplesSummary and Outlook
CreditMetricsMigration MatrixSimulation ApproachComputation of thresholdsCalculation of Credit SpreadMonte carlo simulation
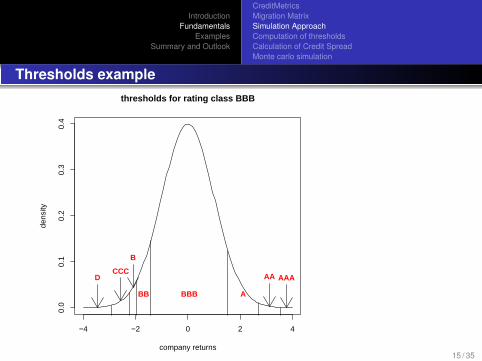
Thresholds example
−4 −2 0 2 4
0.0
0.1
0.2
0.3
0.4
thresholds for rating class BBB
company returns
dens
ity
DCCC
B
BB BBB A
AA AAA
15 / 35
IntroductionFundamentals
ExamplesSummary and Outlook
CreditMetricsMigration MatrixSimulation ApproachComputation of thresholdsCalculation of Credit SpreadMonte carlo simulation
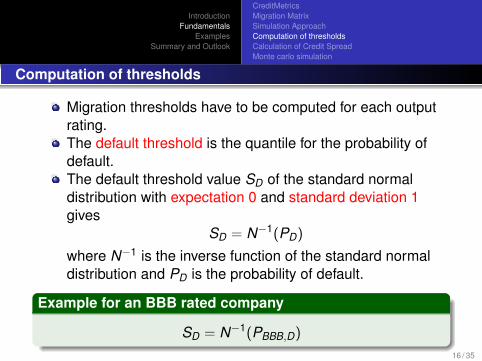
Computation of thresholds
Migration thresholds have to be computed for each outputrating.The default threshold is the quantile for the probability ofdefault.The default threshold value SD of the standard normaldistribution with expectation 0 and standard deviation 1gives
SD = N−1(PD)
where N−1 is the inverse function of the standard normaldistribution and PD is the probability of default.
Example for an BBB rated company
SD = N−1(PBBB,D)
16 / 35

IntroductionFundamentals
ExamplesSummary and Outlook
CreditMetricsMigration MatrixSimulation ApproachComputation of thresholdsCalculation of Credit SpreadMonte carlo simulation
Threshold for migration to CCCis computed with
SD = N−1(PBBB,D + PBBB,CCC)
⇒ For each rating class thresholds can be computed
17 / 35

IntroductionFundamentals
ExamplesSummary and Outlook
CreditMetricsMigration MatrixSimulation ApproachComputation of thresholdsCalculation of Credit SpreadMonte carlo simulation
Calculation of Credit Spread (1)
The Credit Spread is the risk premium demanded by themarket.According migration the nominal is differently calculated
V0 = Vte−(rt+CSt )t
where t is the time.Under a riskless probability measure the value of a creditposition at time t is computed as
V0 = E [Vt ]e−rt t .
The default event is bernoulli distributed, so the expectedvalue is
E [Vt ] = Vt(1− PDt) + Vt(1− LGD)PDt .
18 / 35
IntroductionFundamentals
ExamplesSummary and Outlook
CreditMetricsMigration MatrixSimulation ApproachComputation of thresholdsCalculation of Credit SpreadMonte carlo simulation
Calculation of Credit Spread (2)
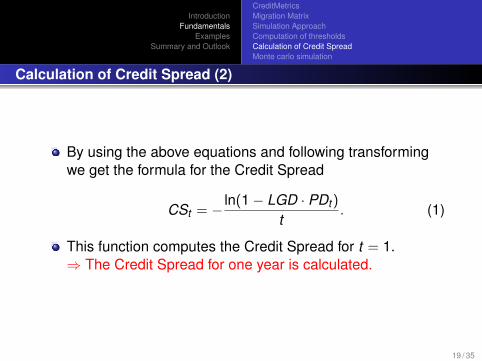
By using the above equations and following transformingwe get the formula for the Credit Spread
CSt = − ln(1− LGD · PDt)
t. (1)
This function computes the Credit Spread for t = 1.⇒ The Credit Spread for one year is calculated.
19 / 35
IntroductionFundamentals
ExamplesSummary and Outlook
CreditMetricsMigration MatrixSimulation ApproachComputation of thresholdsCalculation of Credit SpreadMonte carlo simulation
Monte carlo simulation
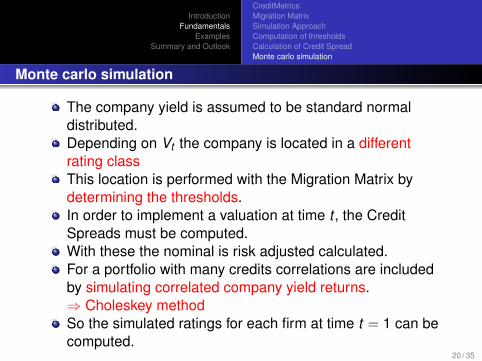
The company yield is assumed to be standard normaldistributed.Depending on Vt the company is located in a differentrating classThis location is performed with the Migration Matrix bydetermining the thresholds.In order to implement a valuation at time t , the CreditSpreads must be computed.With these the nominal is risk adjusted calculated.For a portfolio with many credits correlations are includedby simulating correlated company yield returns.⇒ Choleskey methodSo the simulated ratings for each firm at time t = 1 can becomputed.
20 / 35

IntroductionFundamentals
ExamplesSummary and Outlook
CreditMetricsMigration MatrixSimulation ApproachComputation of thresholdsCalculation of Credit SpreadMonte carlo simulation
Antithetic Sampling
An amount of random numbers can be duplicated with thereflection method, here the calculating effort is low.
Relection method with normal distributionGiven a sequence of normal distributed random numbers(Z1, . . . ,Zn) with Zi ∼ N(0,1) for i = 1 : n.The reflected random numbers Z̃i can be computed with
Z̃i = (−1) · Zi .
The sequence
Z̃1 = −Z1, . . . , Z̃n = −Zn.
is therefore normal distributed also.21 / 35
IntroductionFundamentals
ExamplesSummary and Outlook
CreditMetricsMigration MatrixSimulation ApproachComputation of thresholdsCalculation of Credit SpreadMonte carlo simulation
Correlations (1)
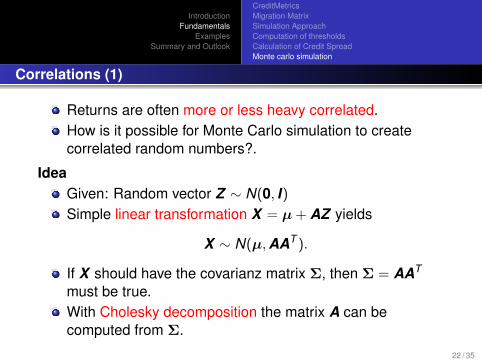
Returns are often more or less heavy correlated.How is it possible for Monte Carlo simulation to createcorrelated random numbers?.
IdeaGiven: Random vector Z ∼ N(0, I)Simple linear transformation X = µ+ AZ yields
X ∼ N(µ,AAT ).
If X should have the covarianz matrix Σ, then Σ = AAT
must be true.With Cholesky decomposition the matrix A can becomputed from Σ.
22 / 35
IntroductionFundamentals
ExamplesSummary and Outlook
CreditMetricsMigration MatrixSimulation ApproachComputation of thresholdsCalculation of Credit SpreadMonte carlo simulation
Correlations (2)
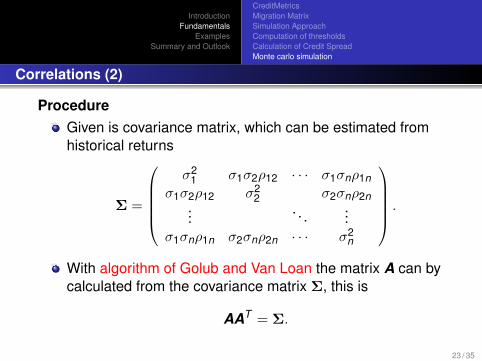
ProcedureGiven is covariance matrix, which can be estimated fromhistorical returns
Σ =
σ2
1 σ1σ2ρ12 · · · σ1σnρ1nσ1σ2ρ12 σ2
2 σ2σnρ2n...
. . ....
σ1σnρ1n σ2σnρ2n · · · σ2n
.
With algorithm of Golub and Van Loan the matrix A can bycalculated from the covariance matrix Σ, this is
AAT = Σ.
23 / 35
IntroductionFundamentals
ExamplesSummary and Outlook
CreditMetricsMigration MatrixSimulation ApproachComputation of thresholdsCalculation of Credit SpreadMonte carlo simulation
Correlations (3)
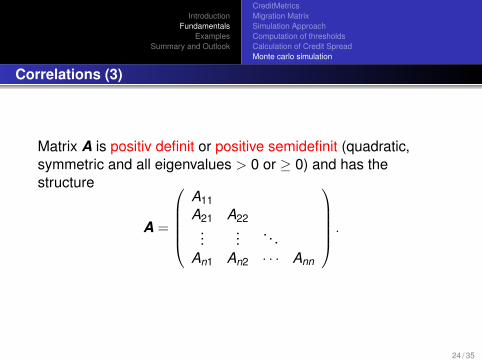
Matrix A is positiv definit or positive semidefinit (quadratic,symmetric and all eigenvalues > 0 or ≥ 0) and has thestructure
A =
A11A21 A22
......
. . .An1 An2 · · · Ann
.
24 / 35
IntroductionFundamentals
ExamplesSummary and Outlook
CreditMetricsMigration MatrixSimulation ApproachComputation of thresholdsCalculation of Credit SpreadMonte carlo simulation
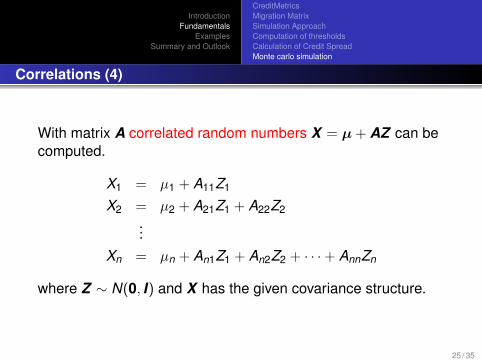
Correlations (4)
With matrix A correlated random numbers X = µ+ AZ can becomputed.
X1 = µ1 + A11Z1
X2 = µ2 + A21Z1 + A22Z2...
Xn = µn + An1Z1 + An2Z2 + · · ·+ AnnZn
where Z ∼ N(0, I) and X has the given covariance structure.
25 / 35
IntroductionFundamentals
ExamplesSummary and Outlook
Computation of thresholdsCalculation of Credit SpreadComputation of CVaRHistogram
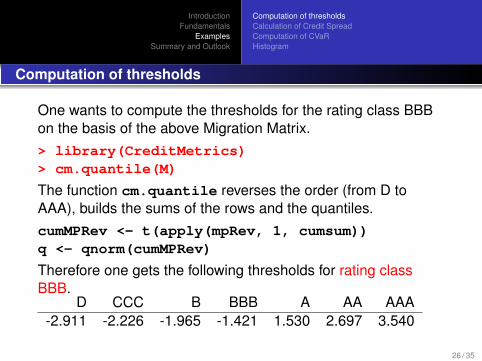
Computation of thresholds
One wants to compute the thresholds for the rating class BBBon the basis of the above Migration Matrix.> library(CreditMetrics)> cm.quantile(M)
The function cm.quantile reverses the order (from D toAAA), builds the sums of the rows and the quantiles.cumMPRev <- t(apply(mpRev, 1, cumsum))q <- qnorm(cumMPRev)
Therefore one gets the following thresholds for rating classBBB.
D CCC B BBB A AA AAA-2.911 -2.226 -1.965 -1.421 1.530 2.697 3.540
26 / 35

IntroductionFundamentals
ExamplesSummary and Outlook
Computation of thresholdsCalculation of Credit SpreadComputation of CVaRHistogram
Calculation of Credit Spread
One wants to compute the credits spreads for all rating classes,the LGD is assumed to be 45%.> library(CreditMetrics)> cm.cs(M, 0.45)
The function cm.cs uses equation (1).cs <- -(log(1 - lgd * pd))
Therefore one gets the following Credit Spreads for all ratingclasses.
AAA AA A BBB BB B CCC0.00005 0.00005 0.00027 0.00081 0.00478 0.02368 0.09327
27 / 35
IntroductionFundamentals
ExamplesSummary and Outlook
Computation of thresholdsCalculation of Credit SpreadComputation of CVaRHistogram
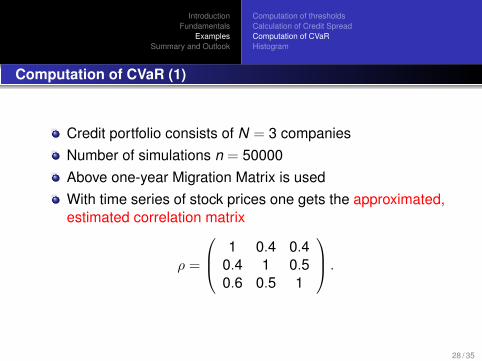
Computation of CVaR (1)
Credit portfolio consists of N = 3 companiesNumber of simulations n = 50000Above one-year Migration Matrix is usedWith time series of stock prices one gets the approximated,estimated correlation matrix
ρ =
1 0.4 0.40.4 1 0.50.6 0.5 1
.
28 / 35

IntroductionFundamentals
ExamplesSummary and Outlook
Computation of thresholdsCalculation of Credit SpreadComputation of CVaRHistogram
Computation of CVaR (2)
Riskless interest rate: r = 0.03Exposure At Default:ead = (4000000,1000000,10000000)
Loss Given Default: lgd = 0.45Companies have the rating = (BBB,AA,B)
Confidence level: α = 0.99
29 / 35
IntroductionFundamentals
ExamplesSummary and Outlook
Computation of thresholdsCalculation of Credit SpreadComputation of CVaRHistogram
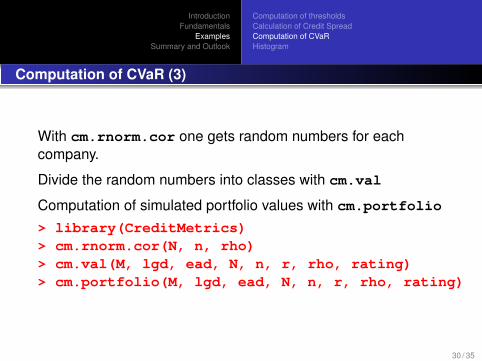
Computation of CVaR (3)
With cm.rnorm.cor one gets random numbers for eachcompany.
Divide the random numbers into classes with cm.val
Computation of simulated portfolio values with cm.portfolio
> library(CreditMetrics)> cm.rnorm.cor(N, n, rho)> cm.val(M, lgd, ead, N, n, r, rho, rating)> cm.portfolio(M, lgd, ead, N, n, r, rho, rating)
30 / 35

IntroductionFundamentals
ExamplesSummary and Outlook
Computation of thresholdsCalculation of Credit SpreadComputation of CVaRHistogram
Computation of CVaR (4)
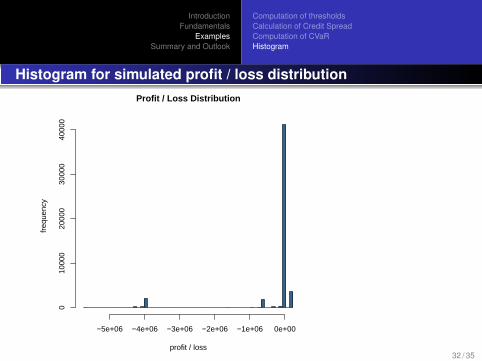
Computation of simulated profits and losses with cm.gain
Computation of Credit Value at Risk with cm.CVaR
> cm.gain(M, lgd, ead, N, n, r, rho, rating)> cm.CVaR(M, lgd, ead, N, n, r, rho, alpha, rating)
1%4015408
⇒ potential negative value change of credit portfolio, which willwith probability 0.99 not excess 4015408 in one year
31 / 35
IntroductionFundamentals
ExamplesSummary and Outlook
Computation of thresholdsCalculation of Credit SpreadComputation of CVaRHistogram
Histogram for simulated profit / loss distributionProfit / Loss Distribution
profit / loss
freq
uenc
y
−5e+06 −4e+06 −3e+06 −2e+06 −1e+06 0e+00
010
000
2000
030
000
4000
0
32 / 35
IntroductionFundamentals
ExamplesSummary and Outlook
Summary
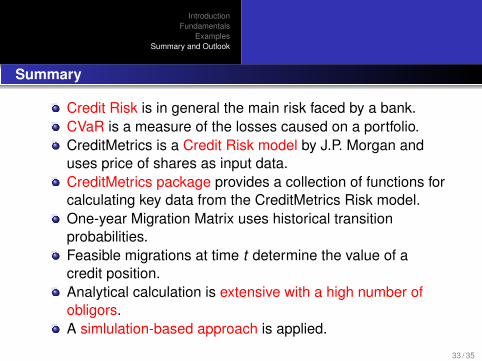
Credit Risk is in general the main risk faced by a bank.CVaR is a measure of the losses caused on a portfolio.CreditMetrics is a Credit Risk model by J.P. Morgan anduses price of shares as input data.CreditMetrics package provides a collection of functions forcalculating key data from the CreditMetrics Risk model.One-year Migration Matrix uses historical transitionprobabilities.Feasible migrations at time t determine the value of acredit position.Analytical calculation is extensive with a high number ofobligors.A simlulation-based approach is applied.
33 / 35
IntroductionFundamentals
ExamplesSummary and Outlook
Outlook
A few bug fixes for the yet existing package have to bedone.At the present stage a company / debt can only belong toone country and one industry, e. g. german bankingsector.A two-factor FAMILLY model which incorporates manycountries and industries will be developed for the future.Different LGD’s for different companies in the portfolio isalso an extension for the next version.
34 / 35
Appendix
For Further Reading
Paul GlassermanMonte Carlo Methods in Financial Engineering.Springer, 2004.
Greg M. Gupton, Christopher C. Finger and Mickey BhatiaCreditMetricsTM– Technical DocumentJ.P. Morgan, 1997, www.riskmetrics.com
Nils Friewald and Manuel LingoCredit Risk – Numerical MethodsVienna University of Economics and BusinessAdministration, 2006
35 / 35