The Contributions of New Americans in West...
43
REPORT AUGUST, 2016 The Contributions of New Americans in West Virginia
Transcript of The Contributions of New Americans in West...

REPORT AUGUST, 2016
The Contributions of New Americans in West Virginia

Partners

The Contributions of New Americans in West Virginia
CONTENTS
Demographics 1
The Role of Immigrants as Entrepreneurs 2
Income and Tax Contributions 4
The Role of Immigrants in the Broader Workforce 6
Science, Technology, Engineering, and Math 10
Healthcare 12
Spotlight: Dr. Ashu Dhanjal 14
Housing 16
Visa Demand 17
Naturalization 19
International Students 20
Voting Power 21
Undocumented Population 22
Methodology 27
Endnotes 34
Endnotes: Methodology 37

Demographics
A lthough West Virginia has not historically had a large immigrant population, the number of foreign-born residents living in the state
has increased in recent years. Between 2010 and 2014, West Virginia’s foreign-born population grew by 19 percent, which is more than three times faster than the immigrant population increased in the country as a whole.
West Virginia today is home to more than 26,000 immigrants. These new Americans serve as everything from physicians to university professors, making them a vital part of this state’s economy overall. They are also playing a large role helping West Virginia avoid the type of sharp population decline that has hurt other cities and states in recent years, depriving businesses of customers and governments of the taxpayers they need. While West Virginia’s foreign-born population swelled between
2010 and 2014, the state’s native-born population declined during that period. That means the more than 4,000 immigrants that arrived in West Virginia between 2010 and 2014 helped to stave off a more significant population decline in the state. West Virginia’s overall population fell just slightly, or by 0.2 percent, during that time period.
Between 2010 and 2014, the number of immigrants calling West Virginia home grew by 19%—or more than three times faster than the foreign-born population grew nationally.
4,277people immigrated to West Virginia between 2010 and 2014.
2010 2014
5.8% Growth in immigrant population, U.S.
19.0% Growth in immigrant population, WV
26,821West Virginia residents were born abroad.
Share of West Virginia residents born abroad
Share of U.S. residents born abroad
13%4+96R2%
The Contributions of New Americans in West Virginia | Demographics
1

G iven that the act of picking up and moving to another country is inherently brave and risky, it should be little surprise that immigrants
have repeatedly been found to be more entrepreneurial than the U.S. population as a whole.1 According to The Kauffman Foundation, a nonprofit group that studies entrepreneurship, immigrants were almost twice as likely to start a new business in 2015 than the native-born population.2 The companies they founded ranged from small businesses on Main Street to large firms responsible for thousands of American jobs. Recent studies, for instance, have indicated that immigrants own more than half of the grocery stores in America and 48 percent of nail salons.3 Foreign-born entrepreneurs are also behind 51 percent of our country’s billion dollar startups.4 More than 40 percent of Fortune 500 firms have at least one founder who was an immigrant or the children of immigrants.
In 2010, roughly one in 10 American workers with jobs at private firms were employed at immigrant-founded companies.The super-charged entrepreneurial activity of immigrants provides real and meaningful benefits to everyday Americans. In 2010, roughly one in 10 American workers with jobs at private firms were employed at immigrant-founded companies. Such businesses also generated more than $775 billion in annual business revenue that year.5 In West Virginia like the country as a whole, immigrants are currently punching above their weight class as entrepreneurs. Foreign-born workers currently make up 1.6 percent of all entrepreneurs in the state, despite being just 1.5 percent of West Virginia’s population. The more than
The Role of Immigrants as Entrepreneurs
9,863people in West Virginia are employed at firms owned by immigrants.
722 immigrants in West Virginia are self-employed.
Share of entrepreneurs in West Virginia who are immigrants
* This is a conservative estimate that excludes large, publicly owned firms.
2+98R2%
The Contributions of New Americans in West Virginia | The Role of Immigrants as Entrepreneurs
2
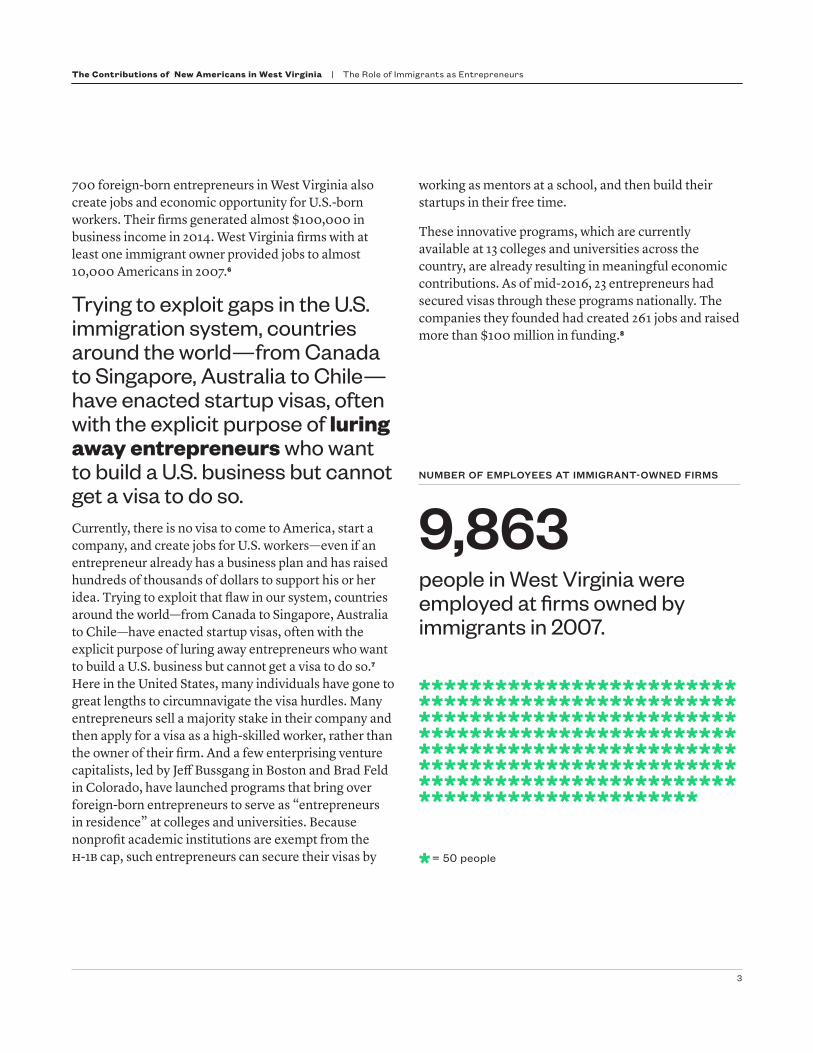
700 foreign-born entrepreneurs in West Virginia also create jobs and economic opportunity for U.S.-born workers. Their firms generated almost $100,000 in business income in 2014. West Virginia firms with at least one immigrant owner provided jobs to almost 10,000 Americans in 2007.6
Trying to exploit gaps in the U.S. immigration system, countries around the world—from Canada to Singapore, Australia to Chile—have enacted startup visas, often with the explicit purpose of luring away entrepreneurs who want to build a U.S. business but cannot get a visa to do so.Currently, there is no visa to come to America, start a company, and create jobs for U.S. workers—even if an entrepreneur already has a business plan and has raised hundreds of thousands of dollars to support his or her idea. Trying to exploit that flaw in our system, countries around the world—from Canada to Singapore, Australia to Chile—have enacted startup visas, often with the explicit purpose of luring away entrepreneurs who want to build a U.S. business but cannot get a visa to do so.7 Here in the United States, many individuals have gone to great lengths to circumnavigate the visa hurdles. Many entrepreneurs sell a majority stake in their company and then apply for a visa as a high-skilled worker, rather than the owner of their firm. And a few enterprising venture capitalists, led by Jeff Bussgang in Boston and Brad Feld in Colorado, have launched programs that bring over foreign-born entrepreneurs to serve as “entrepreneurs in residence” at colleges and universities. Because nonprofit academic institutions are exempt from the H-1B cap, such entrepreneurs can secure their visas by
working as mentors at a school, and then build their startups in their free time.
These innovative programs, which are currently available at 13 colleges and universities across the country, are already resulting in meaningful economic contributions. As of mid-2016, 23 entrepreneurs had secured visas through these programs nationally. The companies they founded had created 261 jobs and raised more than $100 million in funding.8
9,863
*****************************************************************************************************************************************************************************************************
*= 50 people
people in West Virginia were employed at firms owned by immigrants in 2007.
NUMBER OF EMPLOYEES AT IMMIGRANT-OWNED FIRMS
The Contributions of New Americans in West Virginia | The Role of Immigrants as Entrepreneurs
3
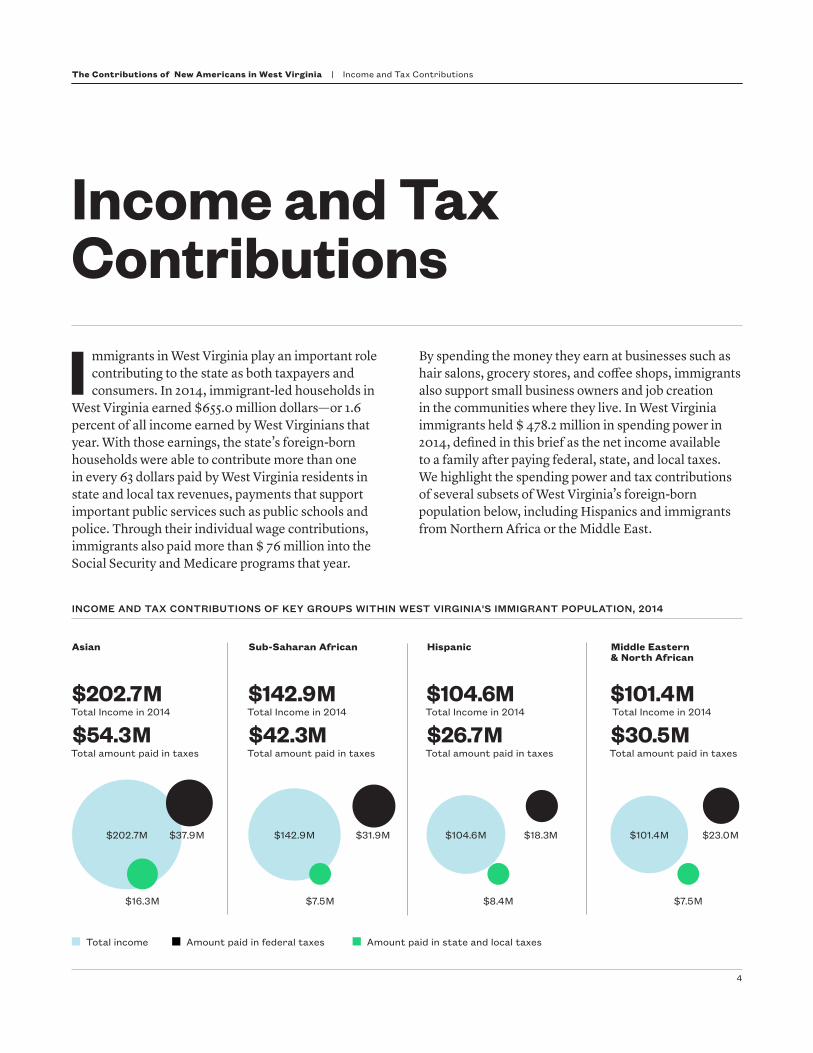
I mmigrants in West Virginia play an important role contributing to the state as both taxpayers and consumers. In 2014, immigrant-led households in
West Virginia earned $655.0 million dollars—or 1.6 percent of all income earned by West Virginians that year. With those earnings, the state’s foreign-born households were able to contribute more than one in every 63 dollars paid by West Virginia residents in state and local tax revenues, payments that support important public services such as public schools and police. Through their individual wage contributions, immigrants also paid more than $ 76 million into the Social Security and Medicare programs that year.
By spending the money they earn at businesses such as hair salons, grocery stores, and coffee shops, immigrants also support small business owners and job creation in the communities where they live. In West Virginia immigrants held $ 478.2 million in spending power in 2014, defined in this brief as the net income available to a family after paying federal, state, and local taxes. We highlight the spending power and tax contributions of several subsets of West Virginia’s foreign-born population below, including Hispanics and immigrants from Northern Africa or the Middle East.
Income and Tax Contributions
INCOME AND TAX CONTRIBUTIONS OF KEY GROUPS WITHIN WEST VIRGINIA'S IMMIGRANT POPULATION, 2014
Total income Amount paid in federal taxes Amount paid in state and local taxes
Asian
Total Income in 2014$202.7 M
Total amount paid in taxes$54.3 M
$202.7M $37.9 M
$16.3 M
Hispanic
Total Income in 2014$104.6M
$26.7 MTotal amount paid in taxes
$18.3M$104.6 M
$8.4 M
Sub-Saharan African
Total Income in 2014$142.9 M
Total amount paid in taxes$42.3M
$31.9 M$142.9 M
$7.5 M
Middle Eastern & North African
Total Income in 2014$101.4 M
Total amount paid in taxes$30.5 M
$101.4 M $23.0 M
$7.5 M
The Contributions of New Americans in West Virginia | Income and Tax Contributions
4

5
In 2014, immigrants in West Virginia earned $655.0 M.
West Virginia's immigrants also contribute to our country’s entitlement programs. In 2014, through taxes on their individual wages, immigrants contributed $16.6 M to Medicare and $59.9 M to Social Security.
ENTITLEMENT CONTRIBUTIONS
Social Security
Medicare
$59.9M
$51.9 M — Went to state and local taxes...
$125.0 M — Went to federal taxes...
Leaving them with $478.2 M in remaining spending power.
$16.6 M
The Contributions of New Americans in West Virginia | Income and Tax Contributions

P eople who come to the United States often come here to work. Because of that, they often have skills that make them a good fit for our labor
force—and a strong complement to American workers already here. In the country as a whole, immigrants are much more likely to be working-age than the U.S.-born. They also have a notably different educational profile. The vast majority of Americans – more than 79 percent of the U.S.-born population – fall into the middle of the education spectrum by holding a high school or bachelor’s degree. Immigrants, by contrast, are more likely to gravitate toward either end of the skill spectrum. They are more likely to lack a high school diploma than the native born, but also more likely to have an advanced degree. This makes them good candidates for labor-intensive positions, such as housekeeping, that many more educated U.S.-born
workers are less interested in pursuing, as well as high-level positions that allow innovation-driven firms to expand and add jobs for Americans at all skill levels.
West Virginia has the widest gap in educational attainment in the country: 21.7% of immigrants have a graduate degree compared to just 7.4% of natives.In some ways, West Virginia follows the national pattern. When it comes to educational attainment, immigrants in the state are almost three times as likely to hold a graduate degree than natives. West Virginia, in fact, has the widest such gap in educational attainment in the
The Role of Immigrants in the Broader Workforce
Immigrants made up 2% of West Virginia's employed population in 2014.
Immigrants were 7% more likely to work than native-born West Virginians.
11,638 immigrants in West Virginia were working in 2014 of the native-born
population worked.
40.5%of immigrants of all ages worked in 2014.
43.4%
Because they tended to be working-age,
2+98R2%
The Contributions of New Americans in West Virginia | The Role of Immigrants in the Broader Workforce
6

country: More than one in every five immigrants in the state, or 21.7 percent, has a graduate degree, compared to just 7.4 percent of the native-born population . The foreign-born population is also more likely to be working age. In West Virginia, 58.4 percent of the foreign-born population falls into that age band, while only 52.1 percent of the native-born population does. That 6.3-percentage point gap, while narrower than in most states, has implications for the state’s workforce. In 2014, West Virginia’s immigrants were 7.0 percent more likely to be actively employed than the state’s native-born residents—a reality driven largely by the fact that a larger than average share of the native-born population had already reached retirement age.
The immigrants who are working in West Virginia contribute to a wide range of different industries in the state—many of which are growing and important parts of the local economy. Foreign-born residents make up almost one in 11 employees at the state’s colleges, universities, and professional schools. They also account for 7.2 percent of the state’s workers in computer systems design, contributing to West Virginia’s high technology sector, a major focus in recent years of policymakers and advocates trying to grow the number of jobs in the state.9 Immigrants also frequently gravitate toward sectors where employers may struggle to find enough interested
U.S.-born workers. Immigrants in West Virginia, for instance, make up 5.7 percent of workers in an industry the government calls “other health care services,” a sector that includes home health aides and paramedics.
In recent decades, immigrants have also played an important role in West Virginia’s manufacturing industry. Studies have found that the arrival of immigrants to a community can have a powerful impact creating or preserving manufacturing jobs. This is because foreign-born workers give employers access to a large and relatively affordable pool of laborers, making it less attractive for firms to move work to cheaper locations offshore. One study by the Partnership for a New American Economy and the Americas Society/Council of the Americas, for instance, found that every time 1,000 immigrants arrive in a given U.S. county, 46 manufacturing jobs are preserved that would otherwise not exist or have moved elsewhere. 10 The more than 22,500 immigrants who were living in the state in 2010 were responsible for creating or preserving more than 1,000 manufacturing jobs.
Aside from just looking at overarching industry groups, our work also examines the share of workers that are foreign-born in specific occupations and jobs. Immigrants in West Virginia, like the country
AGE BREAKDOWN OF WEST VIRGINIA'S FOREIGN-BORN AND NATIVE-BORN POPULATIONS, 2014
EDUCATIONAL ATTAINMENT OF WEST VIRGINIA'S FOREIGN-BORN AND NATIVE-BORN POPULATION (AGES 25+), 2014
NATIVE-BORNNATIVE-BORN
FOREIGN-BORNFOREIGN-BORN
0-24 25-64 65+
14%30%
14%
140+670+120+70=300+520+180=
140+430+210+220=
67%52%
43%
12%18%
21%
7%
22%
Less than High School
High School/Some College Graduate Degree
Bachelor's Degree
WORKING AGE
25%
250+580+170=58% 17%
WORKING AGE
The Contributions of New Americans in West Virginia | The Role of Immigrants in the Broader Workforce
7
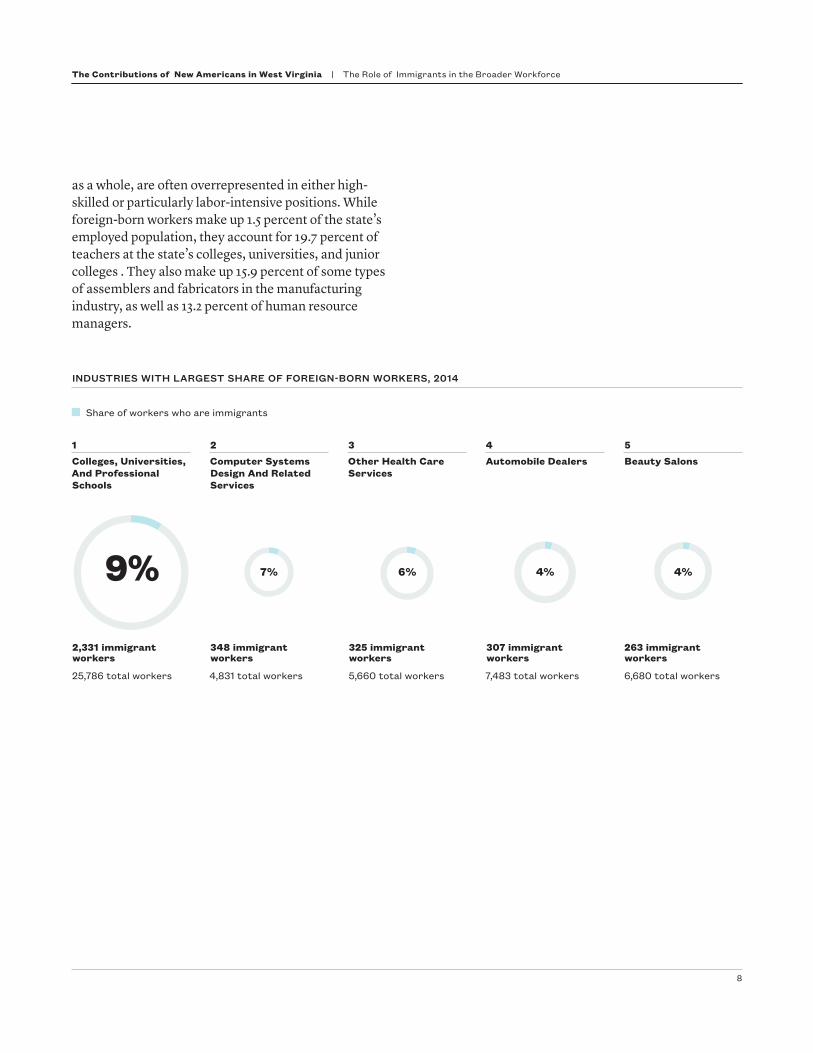
as a whole, are often overrepresented in either high-skilled or particularly labor-intensive positions. While foreign-born workers make up 1.5 percent of the state’s employed population, they account for 19.7 percent of teachers at the state’s colleges, universities, and junior colleges . They also make up 15.9 percent of some types of assemblers and fabricators in the manufacturing industry, as well as 13.2 percent of human resource managers.
INDUSTRIES WITH LARGEST SHARE OF FOREIGN-BORN WORKERS, 2014
Colleges, Universities, And Professional Schools
2,331 immigrant workers
25,786 total workers
Computer Systems Design And Related Services
348 immigrant workers
4,831 total workers
Automobile Dealers
7,483 total workers
307 immigrant workers
Beauty Salons
263 immigrant workers
6,680 total workers
4+96N9+91T9% 6+94N6%7+93N7% 4%4+96N4%
1Other Health Care Services
5,660 total workers
325 immigrant workers
32 4 5
Share of workers who are immigrants
The Contributions of New Americans in West Virginia | The Role of Immigrants in the Broader Workforce
8

The Contributions of New Americans in West Virginia | The Role of Immigrants in the Broader Workforce
10+90R
OCCUPATIONS WITH LARGEST SHARE OF FOREIGN-BORN WORKERS, 2014
259 immigrant workers4,499 total workers
Food Preparation Workers9
Postsecondary Teachers
1,767 immigrant workers8,966 total workers
1
847 immigrant workers8,672 total workers
Accountants and Auditors5
402 immigrant workers3,050 total workers
Human Resource Workers3
493 immigrant workers7,692 total workers
Food Service Managers7
247 immigrant workers4,824 total workers
Financial Managers10
552 immigrant workers3,474 total workers
Miscellaneous Assemblers and Fabricators
2
697 immigrant workers8,572 total workers
Carpenters6
4,860 total workers505 immigrant workers
Physicians and Surgeons4
295 immigrant workers5,098 total workers
Counselors8
13+87R 10+90R20+80R8+92R6+94R10%
13% 10%20%
8% 6%
16+84R16%
6+94R6%
5+95R5%6+94R6%
Share of workers who are immigrants
The Contributions of New Americans in West Virginia | The Role of Immigrants in the Broader Workforce
9

Science, Technology, Engineering, and Math
B etween 2014 and 2024, science, technology, engineering, and math—or “STEM”—fields are projected to play a key role in U.S. economic
growth, adding almost 800,000 new jobs and growing 37.0 percent faster than the U.S. economy as a whole.11 Immigrants are already playing a huge part ensuring that West Virginia remains a leading innovator in STEM fields like natural gas and advanced manufacturing. Despite making up 1.5 percent of the state’s population, foreign-born West Virginians represented 4.0 percent of STEM workers in the state in 2014. Our outdated immigration system, however, makes it difficult for STEM employers to sponsor the high-skilled workers they need to fill critical positions. This is problematic because it can slow the ability of firms to expand and add jobs for U.S.-born workers. It also makes little sense, given the country’s ongoing shortage of STEM talent—an issue that heavily impacts employers here. In 2014, 7.6 STEM jobs were advertised online in West Virginia for every one unemployed STEM worker in the state.
Despite making up 1.5% of West Virginia's population, immigrants represented 4.0% of all STEM workers in the state in 2014. Immigrants, however, are not just a crucial piece of West Virginia’s STEM workforce now—they are also likely to power it in the future. In 2014 students on temporary visas made up roughly one out of every five students earning a STEM Master’s degree at West Virginia’s
6,305available STEM jobs were advertised online in 2014, compared to 833 unemployed STEM workers.
1,116Number of foreign-born STEM workers in West Virginia.
The resulting ratio of open jobs to available workers was
7.6 to 1
The Contributions of New Americans in West Virginia | Science, Technology, Engineering, and Math
10

universities, and 31.5 percent of students earning a PhD-level degree in STEM. Even after America’s universities invest in their education, however, many of those students struggle to remain in the country after graduation. Creating visa pathways that would make it easier for them to stay would have a major economic benefit to West Virginia. A study by the Partnership for a New American Economy and the American Enterprise Institute found that every time a state gains 100 foreign-born STEM workers with graduate-level STEM training from a U.S. school, 262 more jobs are created for U.S.-born workers there in the seven years that follow.12 For West Virginia, that means that retaining even half of the 144 graduates earning advanced-level STEM degrees in 2014 could result in the creation of nearly 190 new, high-skilled, high-paying positions for U.S.-born workers by 2021. 19+81R
32+68R Share of students earning STEM PhDs who are foreign-born.
32%
Share of students earning STEM Master's degrees who are foreign-born.
19%
189
If half of West Virginia's 144 advanced level STEM grads on temporary visas stayed in the state after graduation…
jobs for U.S.-born workers would be created by 2021.
The Contributions of New Americans in West Virginia | Science, Technology, Engineering, and Math
11

Healthcare
I n the coming years, the American healthcare industry is projected to see incredibly rapid growth—adding more new positions from 2014 to 2024 than
any other industry in our economy.13 Already, caregivers are facing near unprecedented levels of demand. Between 2013 and 2015, the number of Americans with health insurance rose by almost 17 million,14 opening the door for many patients to receive more regular care. The country’s 76.4 million baby boomers are also aging rapidly—at a major cost to our healthcare system. Studies have found that elderly Americans spend three
times more on healthcare services than those of working age each year.15
In West Virginia, a state where more than one out of every six residents is currently elderly, finding enough healthcare workers remains a challenge—and one that will likely worsen in the future. Currently the state has 273.0 practicing physicians per 100,000 people—a figure that ranks it 25th in the country in terms of physician coverage relative to other states. The ratio of practicing psychiatrists per capita is also low. All this comes on top
WEST VIRGINIA HAS A SHORTAGE OF HEALTHCARE WORKERS
11,640available healthcare jobs were advertised online in 2014, compared to 2,651 unemployed healthcare workers.
The resulting ratio of open jobs to available workers was
4.4 to 1
Shortage of occupational therapists by 2030: 353
Shortage of dentists projected by 2025: 99
Additional number of psychiatrists needed now: 51
The Contributions of New Americans in West Virginia | Healthcare
12

of shortages already impacting the state across the entire healthcare workforce. In 2014, 4.4 healthcare jobs were listed online in West Virginia for every one unemployed healthcare worker in the state. As baby boomers age a variety of other healthcare professions that cater largely to seniors, such as occupational therapists, will feel additional strain.
Immigrants are already playing a valuable role helping West Virginia meet some of its healthcare workforce gaps. In 2016 more than one in four physicians in West Virginia graduated from a foreign medical school, a
likely sign they were born elsewhere. In fact, West Virginia ranks among the top 10 states in the country that rely most heavily on foreign-educated physicians. Immigrant healthcare practitioners also made up 1.4 percent of those working as nursing, psychiatric, or home health aides.
West Virginia ranks among the top 10 states in the country that rely most heavily on foreign-educated physicians.
FOREIGN-BORN AND FOREIGN-EDUCATED PROFESSIONALS HELP FILL HEALTHCARE LABOR GAPS
Foreign-Educated Foreign-Born
Doctors1,401 graduates of foreign medical schools
Psychiatrists63 graduates of foreign medical schools
Nurses184 foreign-born workers
Nursing, Psychiatric, and Home Health Aides267 foreign-born workers
28+72R30+70R1+99R1+99R28% 30% 1% 1%
The Contributions of New Americans in West Virginia | Healthcare
13

Ashu Dhanjal
Dr. Ashu Dhanjal, an invasive cardiologist originally from India, is one of several foreign-born doctors that in recent years have become an important part of the healthcare infrastructure in mountainous, rural West Virginia. When Dhanjal arrived in 2013, the Logan Regional Medical Center, where she was based, had just one cardiologist on staff. Many of the patients in the area were traveling to Charleston or Huntington for their care. “My colleague had built up a large practice, but there was so much need here, one person couldn’t take care of it all,” Dhanjal says. That was especially true given the unique health challenges Logan and the surrounding area face. Many young people left the region when coal industry jobs dried up, leaving a largely elderly population. The high incidence of conditions like diabetes, high blood pressure, and black lung, as well as financial challenges, hinders patient care. “I was initially seeing so many patients here who had a heart attacks four, five, or even 10 years ago, got treated in an emergency room, and then never had any follow up care,” Dhanjal says. “It was just too far and too expensive for them to drive.”
Once Dhanjal began working in the hospital full time, the number of heart attack patients being transferred from emergency rooms to cardiology practices in bigger cities decreased dramatically. She and her partner also helped the hospital grow its cardiology services to a point that most major procedures can now be done in house. “Now the community feels comfortable that, when they come to our emergency room with a heart issue, they will be taken care of—and the care will be really good,” Dhanjal says. She’s also made promoting a healthy lifestyle a real focus of her work, trying to prevent heart problems before they start.
“You get really attached to the Appalachian community,” Dhanjal says, “And I want to do everything I can to help.”Dhanjal thinks she will remain in West Virginia for the long term and has plans to become an American citizen.
“I tell my daughter that the United States is a place where if you are willing to work hard and put in your best, the sky is truly the limit,” Dhanjal says. “That’s what really drew me here.” Like many foreign doctors in the United States, however, her path has been long. After practicing medicine for several years in India, she came
SPOTLIGHT ON
Invasive Cardiologist, Logan Regional Medical Center
The Contributions of New Americans in West Virginia | Spotlight On: Ashu Dhanjal
14
to the United States in 2007 and essentially repeated six years of residency and fellowship training so she could practice cardiology in the States. After all that work, Dhanjal was almost not allowed to remain here: She had done her residency using a J-1 visa, which requires holders to return home for at least two years after completing training.
“I tell my daughter that the United States is a place where if you are willing to work hard and put in your best, the sky is truly the limit,” Dhanjal says. “That’s what really drew me here.”Dhanjal, however, was able to take advantage of the Conrad 30 Waiver program, an initiative that allows doctors who trained on the J-1 visa to get out of the requirement that they return home, as long as they agree to practice in a medically underserved community for at least three years. In West Virginia, 27.8 percent of doctors went to medical school abroad—a share that puts the state in the top 10 in the country in terms of its reliance on foreign-educated doctors. Most years, West Virginia uses all of its Conrad 30 waivers. Dhanjal says she felt lucky that after finishing her residency she was able to get a waiver so she could keep practicing in the state.
Justin Turner, director of physician recruitment for the Logan Regional Medical Center in West Virginia, says doctors like Dhanjal are not alone. He says, in fact, it would be hard to imagine his hospital functioning without international doctors like Dhanjal on staff. Logan, which is based in a town of 1,200 people, often has trouble recruiting U.S.-born doctors unless they already have a tie to the local area or the Appalachian community more broadly. In the past several years, however, Turner has been able to bring in dozens of foreign-born doctors using the Conrad 30 State Waiver program. “Our physicians are from everywhere—from Lebanon to Nigeria to Egypt,” Turner says. “We really have the United Nations here now.”
The Contributions of New Americans in West Virginia | Spotlight On: Ashu Dhanjal
15
14+86R34+66R
Housing
I mmigrant families have long played an important role helping to build housing wealth in the United States. One study released by the Partnership for a
New American Economy and Americas Society/Council of the Americas, for instance, found that in recent decades the country’s more than 40 million immigrants collectively raised U.S. housing wealth by $3.7 trillion. Much of this was possible because immigrants moved into neighborhoods once in decline, helping to revitalize communities and make them more attractive to U.S.-born residents.16
In West Virginia, immigrants are actively strengthening the state’s housing market. The roughly 6,000 foreign-
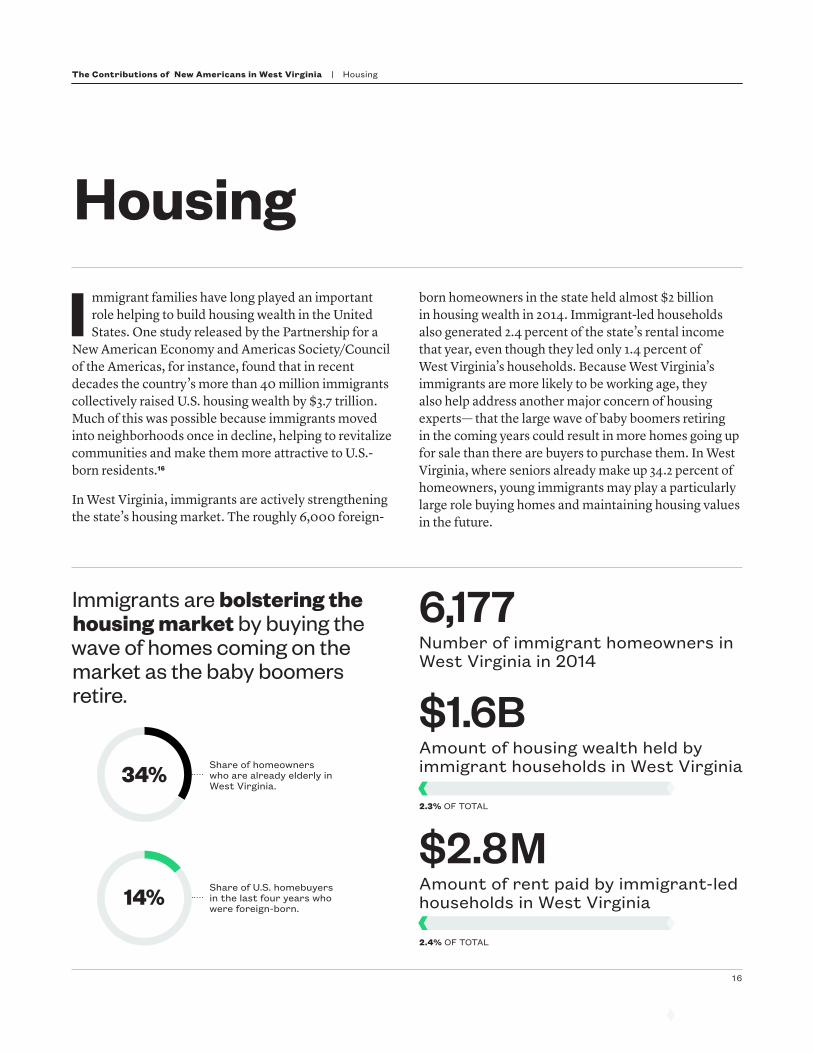
born homeowners in the state held almost $2 billion in housing wealth in 2014. Immigrant-led households also generated 2.4 percent of the state’s rental income that year, even though they led only 1.4 percent of West Virginia’s households. Because West Virginia’s immigrants are more likely to be working age, they also help address another major concern of housing experts— that the large wave of baby boomers retiring in the coming years could result in more homes going up for sale than there are buyers to purchase them. In West Virginia, where seniors already make up 34.2 percent of homeowners, young immigrants may play a particularly large role buying homes and maintaining housing values in the future.
6,177Number of immigrant homeowners in West Virginia in 2014
Immigrants are bolstering the housing market by buying the wave of homes coming on the market as the baby boomers retire.
Share of U.S. homebuyers in the last four years who were foreign-born.
14%
Share of homeowners who are already elderly in West Virginia.
34%
$1.6BAmount of housing wealth held by immigrant households in West Virginia
2.3% OF TOTAL
$2.8 MAmount of rent paid by immigrant-led households in West Virginia
2.4% OF TOTAL
The Contributions of New Americans in West Virginia | Housing
16

Visa Demand
O ne key measure of the demand for immigrant workers involves the number of visas requested by employers in a given state. Before an
employer can formally apply for many types of visas, however, it must first obtain “certification” from the Department of Labor—essentially a go-ahead from the DOL that the employer can apply for a visa to fill a given job or role. For the H-1B visa, which is used to sponsor high-skilled workers, an employer gains certification by filing what’s known as a Labor Condition Application, or LCA. In the LCA the employer must detail
the position the foreign national would fill, the salary he would be paid, and the geographic location of the job. Firms must also attest that hiring an immigrant will not adversely impact similarly situated American workers. For two other large work visa categories—the H-2A for agricultural laborers and the H-2B for seasonal or temporary needs—employers file what is known as a Labor Certification application, or a “labor cert” for short. To get a labor cert approved, the employer must demonstrate that it is unable to locate an American worker that is available, willing, and able to fill the job.
H-1B
574Number of positions:
Top jobs:Computer Systems Analysts
Computer Programmers
Software Developers, Systems Software
GREEN CARD
97Number of positions:
Top jobs:Internists, General
Physicians and Surgeons, All Other
Engineering Teachers, Postsecondary
H-2A
37Number of positions:
Top crops or jobs:Watercress
Nursery and Greenhouse Workers
Fruits and Vegetables
H-2B
99Number of positions:
Top jobs:Groundskeeping Workers
Recreation Attendants
Helpers-Carpenters
CERTIFIED POSITIONS BY VISA TYPE, 2014
H-1B: 574
GREEN CARD: 97H-2A: 37 H-2B: 99
IF ALL APPROVED LCAS HAD TURNED INTO VISAS…
574 LCAs for H-1B workers could have created 1,050 jobs.
1,050
Approved LCAs
Potential jobs created by 2020
* This includes only employment-based green cards
574
The Contributions of New Americans in West Virginia | Visa Demand
17

1
2 33
3
Top cities: Martinsburg
Lesage
Buffalo
1
2
3
H-2A
Top cities: Morgantown
Ona
Kearneysville
1
2
3
H-2B
Top cities: Charleston
Morgantown
Huntington
1
2
3
H-1B
2
2
1
1
In fiscal year 2014, West Virginia employers received DOL certification for more than 800 positions, including jobs across a wide variety of occupations and geographies within the state. They included almost 580 positions for potential workers on H-1B visas, as well as roughly 100 green cards. Federal officials also issued almost 100 certifications for H-2B visas, which are frequently used to staff places like hotels, fisheries, and stables during the high season. Given that it is expensive and cumbersome for employers to obtain labor certs—and similarly daunting to formally apply for an H-1B visa—the large interest in all these visa categories indicates West Virginia employers likely were having real trouble finding the workers they needed on U.S. soil.
Applying for certification, however, is not the same as receiving a visa. The H-1B program is currently capped at 85,000 visas a year for private sector employers. In the country as a whole, this resulted in almost half of all such applications being rejected in fiscal year 2014 alone. The H-2B program is similarly limited to just 66,000 visas per year. Even permanent immigrants get ensnared in the limitations of our outdated immigration system. Only seven percent of all green cards can go to nationals of any one country in a given year—resulting in backlogs lasting years for many Indian, Chinese, Mexican, and Filipino workers.17
When companies are denied the visas they need, company expansion is commonly slowed—often at a real and meaningful cost to the U.S.-born population. One study by the Partnership for a New American Economy and the American Enterprise Institute estimated that when a state receives 100 H-2B visas, 464 jobs are created for U.S.-born workers in the seven years that follow.18 The fact that H-1B visa holders actually create—not take away—jobs from Americans has also been widely supported in the literature. A 2013 paper written by professors at Harvard University looking at the 1995 to 2008 period found that 1 additional young, high-skilled immigrant worker hired by a firm created 3.1 jobs for U.S.-born workers at that same company during the period studied.19 Other academics have tied each H-1B
CITIES ARE DEMANDING VISAS ALL OVER THE STATE
visa award or labor request with the creation of four20 or five21 American jobs in the immediate years that follow.
In this brief, we rely on a more conservative estimate of the impact of the H-1B program on the American workforce. Specifically, we use the estimate that every 1 additional H-1B visa awarded to a state was associated with the creation of 1.83 more jobs for U.S.-born workers there in the following seven years.22 On the first page of this section, we show the number of jobs that would have been created for U.S.-born workers in West Virginia by 2020 if all the fiscal year 2014 LCAs for H-1Bs had turned into actual visas.
The Contributions of New Americans in West Virginia | Visa Demand
18

32+68R Share of non-citizen population eligible to naturalize.
32%
4,622Number of non-citizens eligible to naturalize in 2014
$15.7 MAggregate additional earnings if eligible non-citizens naturalized.
The average non-citizen in West Virginia earns $42,515 per year. If they naturalized, they each could earn an average of $3,401 more per year.
Naturalization
W est Virginia’s immigrants are not only living in the state, they are also laying down roots in the state as well. Our analysis found
that immigrants in West Virginia are naturalizing, or becoming citizens, at similar rates to immigrants in the country as a whole. In 2014, 46.1 percent of immigrants in the state were already U.S. citizens, a slightly lower rate than the national average (47.3 percent).
Like almost all parts of the country, however, West Virginia is also home to a population of immigrants who are eligible to naturalize, but have not yet taken that step. Embracing public policies that would help those individuals navigate the naturalization process could have an important economic impact on the state. Studies have found that immigrants who become citizens seek
out higher education at greater rates than non-citizens.23 Because citizenship allows immigrants to pursue a greater range of positions, including public and private sector jobs requiring a security clearance, it also has been found to raise a person’s annual wages. One study by researchers at the University of Southern California pegged the size of that wage increase at 8 to 11 percent.24 If the average non-citizen in West Virginia saw a wage boost at the low end of that range, or 8 percent, she would earn over $3,400 more per year— money that could be reinvested in the state’s economy through her spending at local businesses. Multiplied by the roughly 4,622 non-citizens in West Virginia currently eligible to naturalize, such policy initiatives could collectively boost wages in the state by $15.7 million.
Share of immigrants in West Virginia who are citizens.
Share of immigrants in the U.S. as a whole who are citizens.47%
NATURALIZATION RATES IN WEST VIRGINIA
46+54R46%
The Contributions of New Americans in West Virginia | Naturalization
19

International Students
P olicymakers are increasingly realizing that international students provide huge benefits to the communities where they live and study. The
World Bank has found that an increase in the number of international graduate students studying at American schools leads to large boosts in the number of patents awarded to local research universities in the years that follow.25 Through their tuition payments and day-to-day spending, international students in the broader United States also contributed more than $30.5 billion to the U.S. economy in the 2014-2015 school year and supported more than 370,000 jobs.26
In West Virginia, the roughly 3,400 international college students studying on temporary visas make up just 4.2 percent of all college students in the state. Still, their
economic contribution is meaningful. They support more than 900 jobs in the state, including positions in transportation, health insurance, and retail.
Through their tuition payments and day-to-day spending, international students in the broader United States also contributed more than $30.5B to the U.S. economy in the 2014-2015 school year and supported more than 370,000 jobs.
International students represent a very small portion of all students in West Virginia, but they make a big impact…
$91.2MEconomic contribution of international students to the state, 2015.
950Jobs supported by international students, 2015.
International students make up only 4% of all students in West Virginia.4+96R4%
The Contributions of New Americans in West Virginia | International Students
20
Voting Power
I mmigrants in West Virginia do not only make a difference to the state’s economy, they also play a role at the voting booth. In 2014, West Virginia was
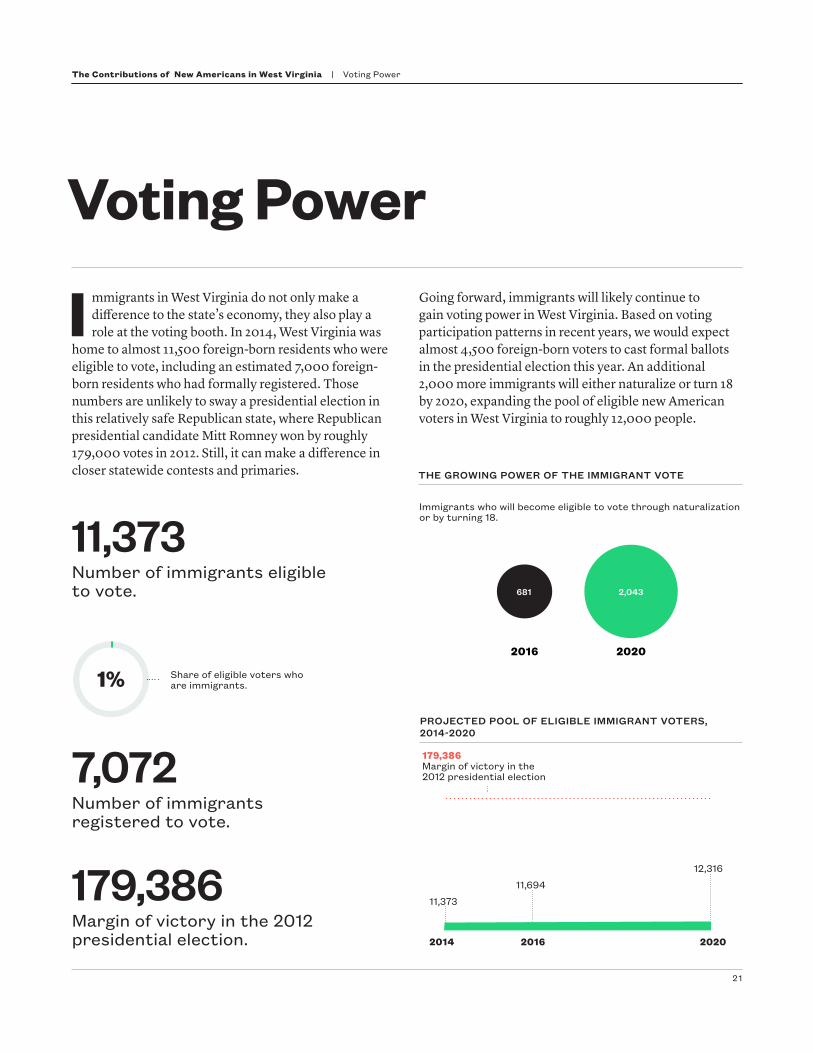
home to almost 11,500 foreign-born residents who were eligible to vote, including an estimated 7,000 foreign-born residents who had formally registered. Those numbers are unlikely to sway a presidential election in this relatively safe Republican state, where Republican presidential candidate Mitt Romney won by roughly 179,000 votes in 2012. Still, it can make a difference in closer statewide contests and primaries.
Going forward, immigrants will likely continue to gain voting power in West Virginia. Based on voting participation patterns in recent years, we would expect almost 4,500 foreign-born voters to cast formal ballots in the presidential election this year. An additional 2,000 more immigrants will either naturalize or turn 18 by 2020, expanding the pool of eligible new American voters in West Virginia to roughly 12,000 people.
2014
11,373
11,694
179,386 Margin of victory in the 2012 presidential election
12,316
2016 2020
PROJECTED POOL OF ELIGIBLE IMMIGRANT VOTERS, 2014-2020
THE GROWING POWER OF THE IMMIGRANT VOTE
11,373Number of immigrants eligible to vote.
1+99R Share of eligible voters who are immigrants.1%
Number of immigrants registered to vote.
7,072
Margin of victory in the 2012 presidential election.
179,386
Immigrants who will become eligible to vote through naturalization or by turning 18.
2,043681
2016 2020
The Contributions of New Americans in West Virginia | Voting Power
21
Undocumented Population
T he United States is currently home to an estimated 11.4 million undocumented immigrants, the vast majority of whom have
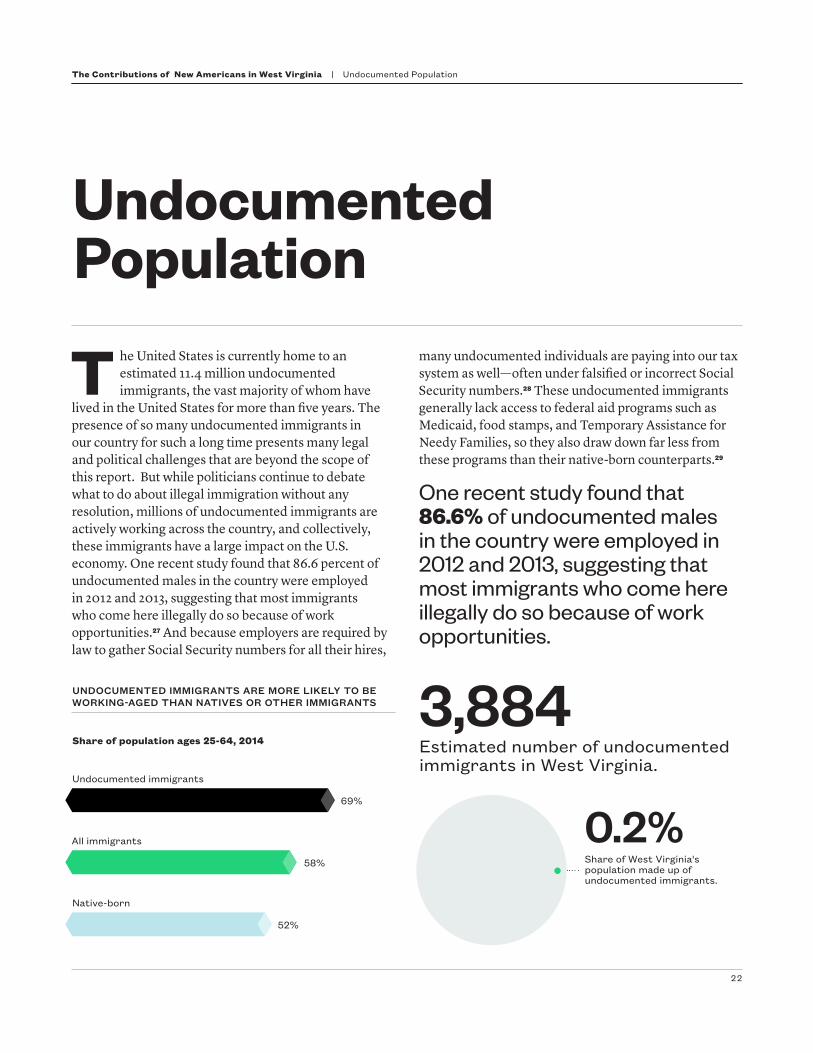
lived in the United States for more than five years. The presence of so many undocumented immigrants in our country for such a long time presents many legal and political challenges that are beyond the scope of this report. But while politicians continue to debate what to do about illegal immigration without any resolution, millions of undocumented immigrants are actively working across the country, and collectively, these immigrants have a large impact on the U.S. economy. One recent study found that 86.6 percent of undocumented males in the country were employed in 2012 and 2013, suggesting that most immigrants who come here illegally do so because of work opportunities.27 And because employers are required by law to gather Social Security numbers for all their hires,
many undocumented individuals are paying into our tax system as well—often under falsified or incorrect Social Security numbers.28 These undocumented immigrants generally lack access to federal aid programs such as Medicaid, food stamps, and Temporary Assistance for Needy Families, so they also draw down far less from these programs than their native-born counterparts.29
One recent study found that 86.6% of undocumented males in the country were employed in 2012 and 2013, suggesting that most immigrants who come here illegally do so because of work opportunities.
3,884Estimated number of undocumented immigrants in West Virginia.
Share of West Virginia's population made up of undocumented immigrants.
0.2%
UNDOCUMENTED IMMIGRANTS ARE MORE LIKELY TO BE WORKING-AGED THAN NATIVES OR OTHER IMMIGRANTS
Share of population ages 25-64, 2014
Undocumented immigrants
69%
58%
All immigrants
52%
Native-born
The Contributions of New Americans in West Virginia | Undocumented Population
22
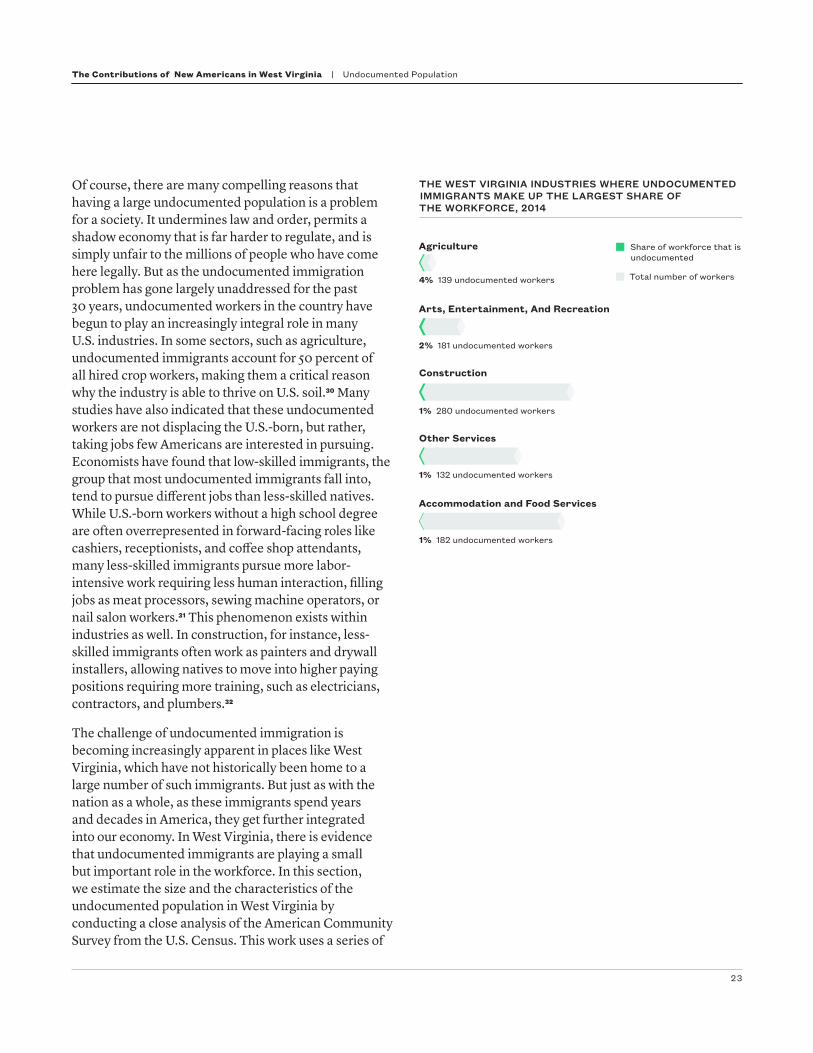
Of course, there are many compelling reasons that having a large undocumented population is a problem for a society. It undermines law and order, permits a shadow economy that is far harder to regulate, and is simply unfair to the millions of people who have come here legally. But as the undocumented immigration problem has gone largely unaddressed for the past 30 years, undocumented workers in the country have begun to play an increasingly integral role in many U.S. industries. In some sectors, such as agriculture, undocumented immigrants account for 50 percent of all hired crop workers, making them a critical reason why the industry is able to thrive on U.S. soil.30 Many studies have also indicated that these undocumented workers are not displacing the U.S.-born, but rather, taking jobs few Americans are interested in pursuing. Economists have found that low-skilled immigrants, the group that most undocumented immigrants fall into, tend to pursue different jobs than less-skilled natives. While U.S.-born workers without a high school degree are often overrepresented in forward-facing roles like cashiers, receptionists, and coffee shop attendants, many less-skilled immigrants pursue more labor-intensive work requiring less human interaction, filling jobs as meat processors, sewing machine operators, or nail salon workers.31 This phenomenon exists within industries as well. In construction, for instance, less-skilled immigrants often work as painters and drywall installers, allowing natives to move into higher paying positions requiring more training, such as electricians, contractors, and plumbers.32
The challenge of undocumented immigration is becoming increasingly apparent in places like West Virginia, which have not historically been home to a large number of such immigrants. But just as with the nation as a whole, as these immigrants spend years and decades in America, they get further integrated into our economy. In West Virginia, there is evidence that undocumented immigrants are playing a small but important role in the workforce. In this section, we estimate the size and the characteristics of the undocumented population in West Virginia by conducting a close analysis of the American Community Survey from the U.S. Census. This work uses a series of
THE WEST VIRGINIA INDUSTRIES WHERE UNDOCUMENTED IMMIGRANTS MAKE UP THE LARGEST SHARE OF THE WORKFORCE, 2014
Construction
1% 280 undocumented workers
Arts, Entertainment, And Recreation
2% 181 undocumented workers
Accommodation and Food Services
1% 182 undocumented workers
Agriculture
4% 139 undocumented workers
Share of workforce that is undocumented
Total number of workers
1% 132 undocumented workers
Other Services
The Contributions of New Americans in West Virginia | Undocumented Population
23

73+27R 26+31+25+13+5
variables to identify immigrants in the survey who are likely to lack legal status—a method that has recently emerged in the academic literature on immigration.33 (See the Methodology Appendix for more details.)
Using this technique, we estimate that West Virginia is home to almost 4,000 undocumented immigrants. These individuals are far more likely than the native-born population—or even the broader foreign-born one—to be in the prime of their working years, or ranging in age from 25-64. They also contribute to a range of industries that could not thrive without a pool of workers willing to take on highly labor-intensive roles. In 2014, for instance, undocumented immigrants made up 3.7 percent of workers in the state’s agriculture industry, a sector that often requires individuals to handpick crops by hand. They also made up 1.7 percent of workers in the arts, entertainment, and recreation industry, which includes those employed as gaming cage workers, parking attendants, and as cleaners at amusement parks.
Undocumented immigrants in West Virginia are far more likely than the native-born population—or even the broader foreign-born one—to be in the prime of their working years, or ranging in age from 25 to 64. The larger political debate around the economic cost or benefits of undocumented immigration tends to focus on the expense of educating immigrant children or the healthcare costs associated with increased use of emergency rooms and other services. These costs are real and can be substantial, but taken alone they paint an incomplete picture of the impact of undocumented immigration. This is because the debate infrequently recognizes that since most undocumented immigrants are working, they also make large federal and state tax
MEASURES OF ASSIMILATION AMONG WEST VIRGINIA'S UNDOCUMENTED POPULATION, 2014
Time in the United States English Proficiency (population ages 5+)
26%
31%
25%
13%5%
70%
Share of undocumented immigrants who have been in the U.S. for five years or more.
Speaks only English Speaks English well
Speaks English very well Does not speak English well
Does not speak any English
The Contributions of New Americans in West Virginia | Undocumented Population
24

The Contributions of New Americans in West Virginia | Undocumented Population
In 2014, undocumented immigrants in West Virginia earned $46.7 M.
Undocumented immigrants also contribute to our country’s entitlement programs. In 2014, through taxes on their individual wages, immigrants contributed $1.0 M to Medicare and $4.2 M to Social Security.
ENTITLEMENT CONTRIBUTIONS
Social Security
Medicare
$2.0 M — Went to state and local taxes...
$3.6 M — Went to federal taxes...
Leaving them with $41.0 M in remaining spending power.
$4.2M
$1.0 M
The Contributions of New Americans in West Virginia | Undocumented Population
25

contributions and frequently are net contributors to many of our most important—and most imperiled—benefits programs. Social Security’s Chief Actuary, for example, has credited unauthorized immigrants with contributing $100 billion more to Social Security than they drew down in benefits during the last decade.34 Several in-depth studies at the state level have similarly come to the conclusion that undocumented immigrants represent a net benefit to the states in which they live. One paper, from researchers at Arizona State University, estimated that undocumented immigrants in that state pay $2.4 billion in taxes each year—a figure far eclipsing the $1.4 billion spent on the law enforcement, education, and healthcare resources they use.35 Another study estimated that, on a per capita basis, Florida’s undocumented immigrants pay $1,500 more in taxes than they draw down in public benefits each year.36
Social Security’s Chief Actuary, for example, has credited unauthorized immigrants with contributing $100B more to Social Security than they drew down in benefits during the last decade. Although we are currently unable to calculate the amount spent on any public benefits or services used by undocumented immigrant families, we can gain a fairly clear sense of the amount they are paying in taxes each year. A variety of studies have estimated that anywhere from 50 to 80 percent of households led by undocumented immigrants file federal income taxes annually.37 Federal government officials have also estimated that 75 percent of undocumented workers have taxes withheld from their paychecks.38 In this paper, we make the assumption that 50 percent of the country’s undocumented households paid income taxes in 2014. Although many experts would call this share highly conservative, it has been modeled in several academic papers, and also by think tanks that specialize exclusively in the study of U.S. tax policy.39
In 2014, we estimate that West Virginia households led by undocumented immigrants earned almost $46.7 million in income. Of that, they paid an estimated $3.6 million in federal taxes. They also contributed
more than $4.2 million directly to the Social Security program through taxes on their individual wages. West Virginia’s undocumented immigrants also made an important impact through their state and local tax contributions—money that many localities use to pay for police forces, public education, and city services like garbage collection and recycling. We estimate that West Virginia’s undocumented immigrants paid more than $2 million in state and local taxes in 2014.
Giving legal status to undocumented immigrants would increase their access to a variety of public benefits—resulting in potentially higher costs for federal, state, and local governments. But because legalization is expected to raise the earning power of undocumented immigrants and give them access to a wider array of jobs and educational opportunities, it would have the opposite effect as well, potentially allowing them to spend more as consumers and pay more in taxes each year.40 Provisions within immigration reform requiring that undocumented immigrants pay any back taxes before normalizing their status would temporarily boost U.S. tax revenues still further.
But while the debate over legalization continues without resolution, the data suggests that the undocumented immigrants in West Virginia have largely assimilated into the United States, making it less likely that mass deportation will ever be a realistic option . We estimate that 69.6 percent of the state’s undocumented population has been in the United States for five or more years. More than 82 percent speak English well, very well, or fluently. Studies show that when immigrants with limited English proficiency learn the language, they see a substantial wage benefit and become less isolated in their communities.41 The labor market outcomes and educational levels of their children increase with time as well.42
The Contributions of New Americans in West Virginia | Undocumented Population
26

MethodologyThe vast majority of data that appears in this brief was calculated by the Partnership for a New American Economy research team, using a variety of publicly available data sources. Our work relied most heavily on the 2014 American Community Survey (ACS) 1-year sample using the Integrated Public Use Microdata Series (IPUMS) database.1 Unless otherwise noted this data is weighted using the person weight for analysis at the individual level, and is weighted using the household weight for analysis at the household level.
DemographicsThe data points on the foreign-born population in the demographics section are calculated using both the 2010 and 2014 ACS 1-year sample.
EntrepreneurshipThe data on self-employed immigrants and the business income generated by immigrant entrepreneurs come from the 2014 ACS 1-year sample. We define immigrants as foreign-born individuals (excluding those that are children of U.S. citizens or born on U.S. territories).
The number of employees at immigrant-owned firms is estimated by using the 2007 Survey of Business Owners (SBO) Public Use Microdata Sample (PUMS),2 which is the most recent microdata on business owners currently available. The estimates are weighted using the tabulation weights provided in the dataset. We define immigrant-owned businesses as firms with at least one foreign-born owner. For confidentiality, the data exclude businesses classified as publicly owned firms because they can be easily identified in many states. Based on our own analysis, we believe that many of the publicly owned firms excluded from this data are companies with
500 employees or more. As a result, the final number of employees at immigrant-owned companies in this report is a conservative estimate, and is likely lower than the true value.
Fortune magazine ranks U.S. companies by revenue and publishes a list of top 500 companies and their annual revenue as well as their employment level each year. To produce our estimates, we use the 2015 Fortune 500 list.3 Our estimates in this section build on past work done by PNAE examining each of the Fortune 500 firms in the country in 2011, and determining who founded them.4 We then use publicly available data, including historical U.S. Census records and information obtained directly by the firms, to determine the background of each founder. In the rare cases where we could not determine a founder’s background, we assumed that the individual was U.S.-born to be conservative in our estimates. Some firms created through the merger of a large number of smaller companies or public entities were also excluded from our analysis. These included all companies in the utilities sector and several in insurance.
To produce the Fortune 500 estimates for each state, we allocate firms to the states where their current headquarters are located. We then aggregate and report the annual revenue and employment of the firms in each state that we identify as “New American” Fortune 500 companies. These are firms with at least one founder who was an immigrant or the child of immigrants.
Income and Tax ContributionsUsing the 2014 ACS 1-year data, we estimate the aggregate household income, tax contributions, and spending power of foreign-born households.
The Contributions of New Americans in West Virginia | Methodology
27

To produce these estimates, a foreign-born household is defined as a household with a foreign-born household head. Immigrant sub-groups are defined as follows: 1) Asian immigrants refer to the foreign-born persons who self identify as Chinese, Taiwanese, Japanese, Filipino, Asian Indian, Korean, Native Hawaiian, Vietnamese, Bhutanese, Mongolian, Nepalese, Cambodian, Hmong, Laotian, Thai, Bangladeshi, Burmese, Indonesian, Malaysian, Pakistani, Sri Lankan, Samoan, Tongan, Guamanian/Chamorro, Fijian, or other Pacific Islanders; 2) Hispanic immigrants include those foreign-born persons who report their ethnicity as Hispanic; 3) Immigrants grouped under Sub-Saharan Africa originate from African countries, excluding the North African countries of Egypt, Libya, Tunisia, Algeria, and Morocco ; 4) Middle Eastern and North African immigrants are foreign-born persons from North Africa as well as the following Middle Eastern countries: Iran, Iraq, Bahrain, Israel, Jordan, Kuwait, Lebanon, Oman, Palestine, Qatar, Saudi Arab, Syria, United Arab Emirates, and Yemen.
In this brief, mirroring past PNAE reports on this topic, we use the term “spending power.”5 Here and elsewhere we define spending power as the disposable income leftover after subtracting federal, state, and local taxes from household income. We estimate state and local taxes using the tax rates estimates produced by Institute on Taxation and Economic Policy by state income quintiles.6 For federal tax rate estimates, we use data released by the Congressional Budget Office in 2014 and calculate the federal tax based on the household income federal tax bracket.7
Social Security and Medicare contributions are drawn from taxes on an individual’s wage earnings.8 This is far different from a household’s overall income, which may include other revenue streams such as rental income and returns on investments. To account for this difference between overall federal taxes and Social Security and Medicare contributions, we estimate Medicare and Social Security contributions based on wage and salary data provided at the individual level in the ACS. For self-employed individuals, we use the self-employment income as the income base. The amount of earnings that can be taxed by the Social Security
program is capped at $117,000, while there no such limit for the Medicare program.9 We use a flat tax rate of 12.4 percent to estimate Social Security contributions and 2.9 percent for to capture Medicare contributions. This estimates the total amount that immigrants and their employers contributed in 2014.10
It is also worth noting that half of the amount contributed to Social Security and Medicare (6.4 percent of Social Security tax rate and 1.45 percent of Medicare tax rate) comes from individual workers, while the other half comes directly from their employers. Self-employed workers have to pay the full tax themselves. When estimating Social Security and Medicare contributions, we include all individual wage earners in the households and aggregate the amount paid by state.
WorkforceWe use the 2014 ACS 1-year sample to estimate all data points in the workforce segment of the report. We define the working age population as those 25 to 64 years old. When estimating how much more foreign-born persons are likely to be employed than native-born persons, however, we calculate the percentage of native-born and foreign-born residents of all ages who were employed in 2014. The reason why we choose a more inclusive population for that estimate is because we want to make the point that the increased likelihood of being working aged that we see among immigrants leads to higher employment in the vast majority of states.
Because the employment status of people who are 16 years old or younger is not available in the ACS, we assume that these young people are not employed. The employed population also does not include those in the Armed Forces.
To estimate how much more likely immigrants are to be employed than natives, we calculate the percent difference between the immigrant and native-born employment rates. Our estimates on the share of immigrants and natives of different education levels only take into consideration individuals aged 25 or older.
The Contributions of New Americans in West Virginia | Methodology
28

The North American Industry Classification System, or NAICS Industry code, is used to estimate the industries with the largest share of foreign-born workers. All individuals 16 years old and above are included in these calculations. The total number of workers for certain industries in some states is extremely small, thus skewing results. In order to avoid this, we calculate the percentile distribution of the total number of workers per industry per state and drop the industries in each state that fall below the lowest 25th percentile. Estimated occupations with the largest share of foreign-born workers per state also follow the same restrictions — the universe is restricted to workers age 16 and above, and the occupations per state that fall under the 25th percentile benchmark are not included.
Our estimates on the number of manufacturing jobs created or preserved by immigrants rely on a 2013 report by the Partnership for a New American Economy and the Americas Society/Council of the Americas. That report used instrumental variable (IV) strategy in regression analysis and found that every 1,000 immigrants living in a county in 2010 created or preserved 46 manufacturing jobs there.11 We use that multiplier and apply it to the 2010 population data from the ACS to produce our estimates.
AgricultureWe access the agriculture GDP by state from Bureau of Economic Analysis, which includes GDP contributions from the agriculture, forestry, fishing, and hunting industry.12 The share of foreign-born agricultural workers is estimated using 2014 ACS 1-year sample. Additional data on agriculture output, top three crops per state, and leading agricultural exports come from United State Department of Agriculture (USDA)’s state fact sheets.13 When displayed, data on sales receipts generated by the top fresh produce items in each state come the Farm and Wealth Statistics cash receipts by commodity tables available from the USDA’s Economic Research Service.14
The agriculture section uses the Quarterly Census of Employment and Wage (QCEW) to estimate the
percentage of crop farms producing fresh fruits and vegetables, and change in real wage of agricultural workers between 2002 and 2014. The QCEW data uses the North American Industry Classification System (NAICS) to assign establishments to different industries. We identify the following farms as fresh fruits and vegetable farms: other vegetable and melon farming, orange groves, citrus, apple orchards, grape vineyards, strawberry farming, berry farming, fruit and tree nut combination farming, other non-citrus fruit farming, mushroom production, other food crops grown under cover, and sugar beet farming.
The decline in the number of field and crop workers comes from the quarterly Farm Labor Survey (FLS) administered by USDA.15 Stephen Bronars, an economist with Edgeworth Economics, previously analyzed and produced these estimates for the PNAE report, “A Vanishing Breed: How the Decline in U.S. Farm Laborers Over the Last Decade has Hurt the U.S. Economy and Slowed Production on American Farms” published in 2015. Additional information on those calculations can be found in the methodology section of that paper.16
Finally, for a small number of states, we also produce estimates showing how growers in the state are losing market share for specific produce items consumed each year by Americans, such as avocados or strawberries. Those estimates originate in a 2014 report produced by PNAE and the Agriculture Coalition for Immigration Reform.17 The author used data from the USDA’s annual
“yearbook” for fresh fruits and vegetables, among other sources, to produce those estimates. More detail can be found in the methodology of that report.
Science, Technology, Engineering, and Math We use the STEM occupation list released by U.S. Census Bureau to determine the number and share of foreign-born STEM workers as well as the number of unemployed STEM workers from 2014 ACS 1-year data.18 Per U.S. Census classification, healthcare workers such as physicians and dentists are not counted as working in
The Contributions of New Americans in West Virginia | Methodology
29

the STEM occupations. All unemployed workers who list their previous job as a STEM occupation are counted as unemployed STEM workers.
To capture the demand for STEM workers, we use the Labor Insight tool developed by Burning Glass Technologies, a leading labor market analytics firm. Burning Glass, which is used by policy researchers and academics, scours almost 40,000 online sources daily and compiles results on the number and types of jobs and skills being sought by U.S. employers. This search includes online job boards, individual employer sites, newspapers, and public agencies, among other sources. Burning Glass has an algorithm and artificial intelligence tool that identifies and eliminates duplicate listings — including ones posted to multiple job boards as part of a broad search.19
The data on STEM graduates are from the 2014 Integrated Postsecondary Education Data System (IPEDS) completion survey.20 A study by the Partnership for a New American Economy and the American Enterprise Institute found that every time a state gains 100 foreign-born STEM workers with graduate-level STEM training from a U.S. school, 262 more jobs are created for U.S.-born workers there in the seven years that follow.21 We use this multiplier and the number of STEM advanced level graduates on temporary visas to estimate the number of jobs created for U.S.-born workers.
The last part of the STEM section presents data on patents with at least one foreign-born inventor. The data is originally from a study by Partnership for a New American Economy in 2012, which relied on data from U.S. Patent and Trademark Office’s database as well as LinkedIn, direct correspondence, and online profiles to determine the nativity of individual inventors.22
HealthcareWe estimate the number of unemployed healthcare workers using the 2014 ACS 1-year sample. Healthcare workers are healthcare practitioners and technical occupations, or healthcare support occupations as defined by U.S. Census Bureau.23
Unemployed healthcare workers are individuals who report their previous job as a healthcare occupation, and their employment status as currently not working but looking for work. We took the number of job postings for healthcare workers from the Burning Glass Labor Insight tool, a database that scours online sources and identifies the number and types of job postings. We describe this resource in detail in the section on STEM methodology.
We then delve into specific occupations within the broader healthcare industry. To produce the figures on the total number of physicians and psychiatrists and the share born abroad, we use American Medical Association (AMA) Physician Masterfile data. To give a sense of the supply and demand of physicians and psychiatrists, we also calculate the physician and psychiatrist density in each state by dividing the total number of physicians or psychiatrists by the population estimates in 2015 for each state.24 As for the share of foreign-born nurses and home health aides, we use the 2014 ACS 5-year sample data because data from the 1-year sample is too small to make reliable estimates.
We estimate the shortage of psychiatrists, dentists, and occupational therapists using data from the various U.S. government offices. For example, the shortage of psychiatrists refers to the current lack of psychiatrists per the U.S. government’s official definition of a mental health shortage area (1/30,000 residents) in each county, aggregated within each state.25 The shortage of dentists is from an analysis by U.S. Department of Health and Human Services,26 and the shortage of occupational workers is from a journal article published by PM&R, the official scientific journal of the American Academy of Physical Medicine and Rehabilitation.27 For psychiatrists, we project future shortages by accounting for individuals in these occupations as they reach the retirement age of 65.
HousingThe data in the housing section comes from the 2014 ACS 1-year sample. Immigrant homeowners are defined as foreign-born householders who reported living in
The Contributions of New Americans in West Virginia | Methodology
30

their own home. We estimate the amount of housing wealth held by immigrant households by aggregating the total housing value of homes owned by immigrant–led households. We also estimate the amount of rent paid by immigrant-led households by aggregating the rent paid by such families. We then calculate the share of housing wealth and rent that immigrant households held or paid compared to the total population. For characteristics of homeowners, a foreign-born new homebuyer is defined as a household with a foreign-born household head who owned and moved to the current residence within the last five years.
Visa DemandThe data on visa demand are drawn primarily from the 2014 Annual Report produced by the Office of Foreign Labor Certification within the U.S. Department of Labor.28 Our figures on the number of visa requests authorized for each state — as well as the occupations and cities those visas are tied to — originate directly from that report.
In this section, we also present estimates on the number of jobs that would have been created if all the visas authorized in 2014 had resulted in actual visa awards. The multipliers we use to produce these estimates originate in a 2011 report released by PNAE and the American Enterprise Institute. That report, written by the economist Madeline Zavodny, used a reduced-form model to examine the relationship between the share of each state’s population that was immigrant and the employment rate of U.S. natives. More detail on Zavodny’s calculations and the multipliers produced for each visa type can be found in the methodology appendix of that report.29
For purposes of these briefs, we use Zavodny’s finding that the award of 100 additional H-1B visas in a state is tied to 183 additional jobs for natives there in the 7 years that follow. The award of 100 additional H-2B visas creates 464 additional jobs for natives in the state during that same time period. We apply these multipliers to the number of visas in those categories authorized for each state in 2014.
In many of the state reports, we also present figures showing how visa denials resulting from the 2007 and 2008 H-1B lotteries cost the tech sectors of metropolitan areas both employment and wage growth in the two years that followed. The economists Giovanni Peri, Kevin Shih, and Chad Sparber produced these estimates for a PNAE report on the H-1B visa system that was released in 2014. That report relied on Labor Condition Application and I-129 data that the authors obtained through a Freedom of Information Act request, as well as American Community Survey data from 2006 and 2011. The authors did regressions that examined the causal relationship between a “shock” in the supply of H-1B computer workers and computer employment in subsequent years for more than 200 metropolitan areas. More information on those estimates can be found in the methodology appendix of that report.30
NaturalizationUsing the ACS 2014 1-year sample, non-citizens eligible to naturalize are defined as non-citizens who are 18 years or above, can speak English, and have continuous residence in the United States for at least five years.
Researchers at the University of Southern California’s Center for the Study of Immigrant Integration published a report in 2012, “Citizen Gain: The Economic Benefits of Naturalization for Immigrants and the Economy,” which concluded that immigrants experience an 8 to 11 percent gain in their individual wages as a result of becoming naturalized. Because this earnings gain phases in over time — and we want to be conservative in our estimates — we model a wage increase of just 8 percent when discussing the possible gains that could accrue due to naturalization.31 We use this multiplier and the mean individual wages of non-citizens in each state to estimate the additional earnings that non-citizens would earn if they naturalized. Finally, we calculate the aggregate wage earnings boost by multiplying the total number of non-citizens who are eligible for naturalization by the average increase in wage income per person.
The Contributions of New Americans in West Virginia | Methodology
31

International StudentsWe obtain the size and share of postsecondary students who are international in each state from the 2014 Integrated Postsecondary Education Data System (IPEDS) fall enrollment data. Those figures are then applied to preexisting work previously done by NAFSA, an organization representing professionals employed in the international offices of colleges and universities across the United States. NAFSA has developed an economic value tool and methodology that estimates the total economic benefit and jobs created or supported by international students and their dependents in each state.32 The economic contributions include the costs of higher education along with living expenses minus U.S.-based financial support that international students receive.
Because the enrollment data from IPEDS that we use in this brief is different from the underlying data used by NAFSA, our figures differ slightly from the NAFSA estimates of the economic contributions made by international students in the 2014-2015 school year.
VotingThe estimates for the number of registered and active voters who are foreign-born are calculated from the Voter Supplement in the Current Population Survey (CPS) for the years 2008, 2010, 2012, and 2014 using the IPUMS database. The sample in CPS includes civilian non-institutional persons only. Foreign-born individuals who stated having voted between 2008 and 2014 are termed active voters.
Using data from the 2014 ACS 1-year sample, we estimate the number and share of foreign-born eligible voters. We define them as naturalized citizens aged 18 or older who live in housing units. Persons living in institutional group quarters such as correctional facilities or non- institutional group quarters such as residential treatment facilities for adults are excluded from the estimation. We also estimate the number of new foreign-born voters who will become eligible to vote in 2016 and 2020, either by turning 18 or through
naturalization, as well as the total number of foreign-born voters in these years. The estimates of newly eligible voters for 2016 include naturalized citizen ages 16 and 17 as of 2014 (thereby becoming of voting age by 2016). Those eligible to vote in 2020 include all naturalized citizens ages 12-17 in 2014. Applicable mortality rates are also applied.33 In addition, we estimate newly naturalized citizens using data from the Department of Homeland Security, which show the two-year average of new naturalized citizens by state.34 We discount from these numbers the percentage of children below 18 in households with a naturalized householder by state. Estimates of total foreign-born voters include naturalized citizens aged 18 or older in 2014, discounted by average U.S. mortality rates by age brackets, summed to the pool of newly eligible foreign-born voters.
Margin of victory in 2012 refers to President Barack Obama’s margin of victory over Republican candidate Mitt Romney in terms of popular vote. The margins are negative in states that Romney won in 2012.35
UndocumentedUsing data from the 2014 ACS, we applied the methodological approach outlined by Harvard University economist George Borjas36 to arrive at an estimate of the undocumented immigrant population in the overall United States and individual states. The foreign-born population is adjusted for misreporting in two ways. Foreign-born individuals who reported naturalization are reclassified as non-naturalized if the individual had resided in the United States for less than six years (as of 2014) or, if married to a U.S. citizen, for less than three years. We use the following criteria to code foreign-born individuals as legal U.S. residents:
• Arrived in the U.S. before 1980
• Citizens and children less than 18 year old reporting that at least one parent is native-born
• Recipients of Social Security benefits, SSI, Medicaid, Medicare, Military insurance, or public assistance
The Contributions of New Americans in West Virginia | Methodology
32

• Households with at least one citizen that received SNAP
• People in the armed forces and veterans
• People attending college and graduate school
• Refugees
• Working in occupations requiring a license
• Government employees, and people working in the public administration sector
• Any of the above conditions applies to the householder’s spouse
The remainder of the foreign-born population that do not meet this criteria is reclassified as undocumented. Estimates regarding the economic contribution of undocumented immigrants and the role they play in various industries, and tax contributions are made using the same methods used to capture this information for the broader immigrant population in the broader brief. When estimating the aggregate household income, spending power, and tax contributions, we are not able to make reliable estimates for undocumented-led households in Alaska, Maine, Montana, North Dakota, South Dakota, Vermont, and West West Virginia due to the small sample size of undocumented-led households in ACS. Finally, the variables giving a sense of the undocumented population’s level of assimilation — including their English proficiency and time in the United States — are estimated by examining the traits of the undocumented population in the 1-year sample of the ACS.
The Contributions of New Americans in West Virginia | Methodology
33

1 Robert Fairlie, “Open For Business: How Immigrants Are Driving Small Business Creation In The United States,” Partnership for a New American Economy, 2012, http://www.renewoureconomy.org/research/open-for-business-how-immigrants-are-driving-small-business-creation-in-the-united-states-2/; Vivek Wadhwa et al., “America’s New Immigrant Entrepre-neurs: Part I,” SSRN Scholarly Paper (Rochester, NY: Social Science Research Network, 2007), http://papers.ssrn.com/abstract=990152.
2 Arnobio Morelix et al., “The Kauffman Index 2015: Startup Activity | State Trends,” SSRN Scholar-ly Paper (Rochester, NY: Social Science Research Network, June 4, 2015), http://papers.ssrn.com/ab-stract=2614598.
3 David Dyssegaard Kallick, “Bringing Vitality to Main Street: How Immigrant Small Businesses Help Lo-cal Economies Grow,” New York: Fiscal Policy Insti-tute and Americas Society/Council of the Americas, 2015, http://www.as-coa.org/articles/bringing-vi-tality-main-street-how-immigrant-small-business-es-help-local-economies-grow.
4 Stuart Anderson, “Immigrants and Billion Dollar Startups,” NFAP Policy Brief March, 2016, http://nfap.com/wp-content/uploads/2016/03/Immigrants-and-Bil-lion-Dollar-Startups.NFAP-Policy-Brief.March-2016.pdf.
5 Fairlie, “Open For Business.”
6 This is the most recent year for which data on employ-ment is available.
7 Somini Sengupta, “Countries Seek Entrepreneurs From Silicon Valley,” The New York Times, 2013, http://www.nytimes.com/2013/06/06/technology/wishing-you-and-your-start-up-were-here.html?_r=0.
8 Craig Montuori, email message to author, June 23, 2016.
9 George Hohmann, “A Beacon for the Future: I-79 Tech-nology Park Helps Keep NCWV up to Date,” NCWV Life, 2016, http://wvhtf.org/wp-content/uploads/2016/04/A-Beacon-for-the-Future-Article-002-1.jpg.
10 Jacob Vigdor, “Immigration and the Revival of Ameri-can Cities,” Partnership for a New American Economy, 2013, http://www.renewoureconomy.org/issues/ameri-can-cities/.
11 “Employment Projections: 2014-24 Summary,” Bureau of Labor Statistics Economic News Release, 2015, http://www.bls.gov/news.release/ecopro.nr0.htm.
12 Madeline Zavodny, “Immigration and American Jobs,” The Partnership for a New American Economy and the American Enterprise Institute, 2011, http://www.renewoureconomy.org/sites/all/themes/pnae/img/NAE_Im-AmerJobs.pdf.
13 “Employment Projections.”
14 Katherine Grace Carman, Christine Eibner, and Susan M. Paddock, “Trends in Health Insurance Enrollment, 2013-15,” Health Affairs, 2015, http://www.rand.org/pubs/external_publications/EP50692.html.
15 Sean P. Keehan et al., “Age Estimates in the National Health Accounts,” Health Care Financing Review 26, no. 2 (2004): 1–16.
16 Vigdor, “Immigration and the Revival of American Cities.”
Endnotes
The Contributions of New Americans in West Virginia | Endnotes
34
17 “Visa Bulletin for May 2016,” U.S. Department of State, 2016, https://travel.state.gov/content/visas/en/law-and-policy/bulletin/2016/visa-bulle-tin-for-may-2016.html.
18 Zavodny, “Immigration and American Jobs.”
19 Sari Pekkala Kerr, William R. Kerr, and William F. Lincoln, “Skilled Immigration and the Employment Structures of U.S. Firms,” Working Paper (National Bureau of Economic Research, 2013), http://www.nber.org/papers/w19658.
20 Matthew J. Slaughter, “Job Clocks Backgrounder,” Hanover, NH, 2013, http://faculty.tuck.dartmouth.edu/images/uploads/faculty/matthew-slaughter/jobs_clock.pdf.
21 “NFAP Policy Brief: H-1B Visas by the Numbers,” Na-tional Foundation for American Policy, 2009, http://www.nfap.com/pdf/1003h1b.pdf.
22 Zavodny, “Immigration and American Jobs.” These positive benefits have been documented despite well-known problems regarding the H-1B visa system. The safeguards to protect American workers have not been updated since 1998, opening the door to increased use of the visa by a small number of out-sourcing firms. This has left many U.S. companies with no reliable avenue to bring in the top talent they need to grow. PNAE has long advocated for legislation that would reform the H-1B program, including the recent-ly introduced Protect and Grow American Jobs Act. Read more here: http://www.renewoureconomy.org/uncategorized/press-release-statement-of-partner-ship-for-a-new-american-economy-on-the-protect-and-grow-america-jobs-act/.
23 Jacob L. Vigdor, From Immigrants to Americans: The Rise and Fall of Fitting In (Rowman & Littlefield, 2010); Bernt Bratsberg, James F. Ragan, Jr., and Zafar M. Nasir, “The Effect of Naturalization on Wage Growth: A Panel Study of Young Male Immigrants,” Journal of Labor Economics 20, no. 3 (2002): 568–97, doi:10.1086/339616.
24 Manuel Pastor and Justin Scoggins, “Citizen Gain: The Economic Benefits of Naturalization for Immigrants and the Economy,” 2012, http://www.immigrationre-search-info.org/report/university-southern-california/citizen-gain-economic-benefits-naturalization-immi-grants-and-e.
25 Aaditya Mattoo, Gnanaraj Chellaraj, and Keith E. Maskus, “The Contribution of Skilled Immigration and International Graduate Students to U.S. Inno-vation” (The World Bank, 2005), http://documents.worldbank.org/curated/en/2005/05/5800523/contri-bution-skilled-immigration-international-graduate-stu-dents-innovation.
26 “NAFSA International Student Economic Value Tool | NAFSA,” accessed June 28, 2016, http://www.nafsa.org/Explore_International_Education/Impact/Data_And_Statistics/NAFSA_International_Student_Econom-ic_Value_Tool/.
27 George J. Borjas, “The Labor Supply of Undocumented Immigrants,” NBER Working Paper (National Bureau of Economic Research, Inc, 2016), https://ideas.repec.org/p/nbr/nberwo/22102.html.
28 Lisa Christensen Gee, Matthew Gardener, and Meg Wiehe, “Undocumented Immigrants’ State & Local Tax Contributions,” The Institute on Taxation and Economic Policy, 2016, http://www.immigrationre-search-info.org/report/other/undocumented-immi-grants%E2%80%99-state-local-tax-contributions.
29 Ryan Honeywell, “How Language Fits Into the Immi-gration Issue,” Governing, 2012, http://www.governing.com/topics/public-workforce/gov-how-language-fits-in-to-the-immigration-issue.html.
30 Thomas Hertz Zahniser Steven, “USDA Economic Re-search Service - Immigration and the Rural Workforce,” United States Department of Agriculture Economic Research Service, 2013, http://www.ers.usda.gov/top-ics/in-the-news/immigration-and-the-rural-workforce.aspx.
The Contributions of New Americans in West Virginia | Endnotes
35

31 Maria E. Enchautegui, “Immigrant and Native Work-ers Compete for Different Low-Skilled Jobs,” Urban Institute, 2015, http://www.urban.org/urban-wire/immigrant-and-native-workers-compete-different-low-skilled-jobs.
32 Scott A. Wolla, “The Economics of Immigration: A Story of Substitutes and Complements,” Page One Economics Newsletter, 2014, 1–5.
33 Borjas, “The Labor Supply of Undocumented Immi-grants.”
34 Roy Germano, “Unauthorized Immigrants Paid $100 Billion Into Social Security Over Last Decade,” VICE News, 2014, https://news.vice.com/article/unautho-rized-immigrants-paid-100-billion-into-social-secu-rity-over-last-decade.
35 Judith Gans, “Immigrants in Arizona: Fiscal and Eco-nomic Impacts” (Udall Center for Studies in Public Policy, University of Arizona, 2008), http://udallcenter.arizona.edu/immigration/publications/impactofimmi-grants08.pdf.
36 Emily Eisenhauer et al., “Immigrants in Florida: Char-acteristics and Contributions,” Research Institute on Social and Economic Policy, Florida International University, 2007, https://risep.fiu.edu/research-publi-cations/immigration/immigration-in-florida/2007/im-migrants-in-florida-characteristics-and-contributions/immigrants_spring_2007_reduced.pdf.
37 Laura E. Hill and Hans P. Johnson, “Unauthorized Im-migrants in California: Estimates for Counties,” Public Policy Institute of California, 2011, http://www.ppic.org/main/publication.asp?i=986.
38 Eduardo Porter, “Illegal Immigrants Are Bolstering So-cial Security With Billions,” The New York Times, 2005, http://www.nytimes.com/2005/04/05/business/ille-gal-immigrants-are-bolstering-social-security-with-bil-lions.html.
39 Aaron Williams and Michael Cassidy, “Undocument-ed, But Not Untaxed,” The Commonwealth Insti-tute, (2016), http://www.thecommonwealthinstitute.org/2016/01/08/undocumented-but-not-untaxed/; Leah Zallman et al., “Unauthorized Immigrants Prolong the Life of Medicare’s Trust Fund,” Journal of General Internal Medicine 31, no. 1 (2015): 122–27, doi:10.1007/s11606-015-3418-z; Gee, Gardener, and Wiehe, “Undoc-umented Immigrants’ State & Local Tax Contributions.”
40 Sherrie A. Kossoudji and Deborah A. Cobb-Clark, “Coming out of the Shadows: Learning about Legal Status and Wages from the Legalized Population,” Journal of Labor Economics 20, no. 3 (2002): 598–628; Raul Hinojosa-Ojeda, “Raising the Floor for American Workers: The Economic Benefits of Comprehensive Immigration Reform,” Center for American Progress and American Immigration Council, 2010, https://www.americanprogress.org/issues/immigration/re-port/2010/01/07/7187/raising-the-floor-for-american-workers/.
41 Barry R. Chiswick and Paul W. Miller, “Immigrant Earn-ings: Language Skills, Linguistic Concentrations and the Business Cycle,” Journal of Population Econom-ics 15, no. 1 (2002): 31–57; Hoyt Bleakley and Aimee Chin, “Age at Arrival, English Proficiency, and Social Assimilation Among U.S. Immigrants,” American Eco-nomic Journal. Applied Economics 2, no. 1 (2010): 165, doi:10.1257/app.2.1.165.
42 Jill H. Wilson, “Investing in English Skills: The Limit-ed English Proficient Workforce in U.S. Metropoli-tan Areas,” The Brookings Institution, 2014, http://www.brookings.edu/research/reports2/2014/09/en-glish-skills.
The Contributions of New Americans in West Virginia | Endnotes
36

Endnotes: Methodology1 Steven Ruggles, Katie Genadek, Ronald Goeken, Josiah
Grover, and Matthew Sobek. Integrated Public Use Microdata Series: Version 6.0 [Machine-readable data-base]. Minneapolis: University of Minnesota, 2015.
2 U.S. Census Bureau, Survey of Business Owner and Self-Employed Persons Data Sets. http://www.census.gov/programs-surveys/sbo/data/data-sets.html
3 “Fortune 500,” Fortune, 2015, http://fortune.com/for-tune500/2015/.
4 “The ‘New American’ Fortune 500,” Partnership for a New American Economy, 2011, http://www.renewou-reconomy.org/wp-content/uploads/2013/07/new-ameri-can-fortune-500-june-2011.pdf.
5 “The Power of the Purse: The Contributions of Hispan-ics to America’s Spending Power and Tax Revenues in 2013,” Partnership for a New American Economy, 2014, http://www.renewoureconomy.org/research/page/2/.
6 “Who Pays? A Distributional Analysis of the Tax Systems in All 50 States (5th edition),” Institute on Tax-ation and Economic Policy, 2014, http://www.itep.org/whopays/full_report.php.
7 “The Distribution of Household Income and Federal Taxes, 2011”, Congressional Budget Office, Washington, D.C., 2014, https://www.cbo.gov/publication/49440#ti-tle0.
8 Office of Retirement and Disability Policy U. S. Social Security Administration, “OASDI and SSI Program Rates & Limits,” 2014, https://www.ssa.gov/policy/docs/quickfacts/prog_highlights/RatesLimits2014.html.
9 Ibid.
10 Ibid.
11 Jacob Vigdor, “Immigration and the Revival of American Cities,” Partnership for a New American Economy, 2013, http://www.renewoureconomy.org/issues/american-cities/.
12 Bureau of Economic Analysis, http://www.bea.gov/re-gional/index.htm
13 United States Department of Agriculture, “State Fact Sheets, Economic Research Service” 2016, http://www.ers.usda.gov/data-products/state-fact-sheets.aspx
14 United States Department of Agriculture, Econom-ic Research Service, “Cash Receipts by Commodity, 2010-2015,” http://www.ers.usda.gov/data-prod-ucts/farm-income-and-wealth-statistics/cash-re-ceipts-by-commodity.aspx.
15 United State Department of Agriculture, “Farm Labor Survey”, https://www.nass.usda.gov/Surveys/Guide_to_NASS_Surveys/Farm_Labor/
16 Stephen Bronars, “A Vanishing Breed: How the Decline in U.S. Farm Laborers Over the Last Decade has Hurt the U.S. Economy and Slowed Production on American Farms,” Partnership for a New American Economy, 2015, http://www.renewoureconomy.org/wp-content/uploads/2015/08/PNAE_FarmLabor_August-3-3.pdf.
The Contributions of New Americans in West Virginia | Endnotes: Methodology
37

17 Stephen Bronars, “No Longer Home Grown: How Labor Shortages are Increasing America’s Reliance on Imported Fresh Produce and Slowing U.S. Economic Growth”, Partnership for a New American Economy, 2014, http://www.renewoureconomy.org/wp-content/uploads/2014/03/no-longer-home-grown.pdf.
18 U.S. Census Bureau, “STEM, STEM-related, and Non-STEM Occupation Code List 2010,” 2010, https://www.census.gov/people/io/files/STEM-Census-2010-occ-code-list.xls
19 “About Us,” Burning Glass, accessed July 1, 2016, avail-able here: http://burning-glass.com/labor-insight/.
20 National Center for Education Statistics, “Integrated Postsecondary Education Data System,” http://nces.ed.gov/ipeds/
21 Madeline Zavodny, “Immigration and American Jobs,” The Partnership for a New American Economy and the American Enterprise Institute, 2011, http://www.renewoureconomy.org/sites/all/themes/pnae/img/NAE_Im-AmerJobs.pdf.
22 “Patent Pending: How Immigrants Are Reinventing The American Economy,” Partnership for a New American Economy, 2012, http://www.renewoureconomy.org/re-search/patent-pending-how-immigrants-are-reinvent-ing-the-american-economy-2/.
23 U.S. Census Bureau. “2010 Occupation Code List,” https://www.census.gov/people/io/files/2010_Oc-cCodeswithCrosswalkfrom2002-2011nov04.xls
24 U.S. Census Bureau, “Annual Estimates of the Resident Population: April 1, 2010 to July 1, 2015,” http://factfinder.census.gov/faces/tableservices/jsf/pages/productview.xhtml?pid=PEP_2015_PEPANNRES&prodType=table
25 U.S. Department of Health and Human Services, “Shortage Designation: Health Professional Shortage Areas and Medically Underserved Areas/Populations,” http://www.hrsa.gov/shortage/
26 National Center for Health Workforce Analysis, U.S. Department of Health and Human Services, “National and State-Level Projections of Dentists and Dental Hygienists in the U.S., 2012-2025”, 2015, http://bhpr.hrsa.gov/healthworkforce/supplydemand/dentistry/nationalstatelevelprojectionsdentists.pdf.
27 Vernon Lin, Xiaoming Zhang, and Pamela Dixon, “Oc-cupational Therapy Workforce in the United States: Forecasting Nationwide Shortages,” PM & R: The Jour-nal of Injury, Function, and Rehabilitation 7, No. 9, 2015: 946–54, doi:10.1016/j.pmrj.2015.02.012.
28 “2014 Annual Report,” Office of Foreign Labor Certifica-tion, Employment and Training Administration, United States Department of Labor, 2014, https://www.foreign-laborcert.doleta.gov/pdf/oflc_annual_report_fy2014.pdf.
29 Madeline Zavodny, “Immigration and American Jobs,” The Partnership for a New American Economy and the American Enterprise Institute, 2011, http://www.renewoureconomy.org/sites/all/themes/pnae/img/NAE_Im-AmerJobs.pdf.
30 Giovanni Peri, Kevin Shih, Chad Sparber, and Angela Marek Zeitlin, “Closing Economic Windows: How H-1B Visa Denials Cost U.S.-Born Tech Workers Jobs and Wages During the Great Recession,” 2014, http://www.renewoureconomy.org/wp-content/uploads/2014/06/pnae_h1b.pdf.
31 Manuel Pastor and Justin Scoggins, “Citizen Gain: The Economic Benefits of Naturalization for Immigrants and the Economy,” 2012, http://www.immigrationre-search-info.org/report/university- southern-Ohio/citizen-gain- economic-benefits- naturalization-immi-grants- and-e.
32 NAFSA, “International Student Economic Value Tool,” http://www.nafsa.org/Explore_International_Education/Impact/Data_And_Statistics/NAFSA_International_Stu-dent_Economic_Value_Tool/#stateData
The Contributions of New Americans in West Virginia | Endnotes: Methodology
38

33 U.S. Department of Health and Human Services, “National Vital Statistics Reports, Deaths: Final Data for 2013”, 2016, http://www.cdc.gov/nchs/data/nvsr/nvsr64/nvsr64_02.pdf
34 Department of Homeland Security, “Yearbook of Immigration Statistics: 2014 Naturalizations, Table 22
- Persons Naturalized by State or Territory of Resi-dence: FY 2005 to 2014”, https://www.dhs.gov/year-book-immigration-statistics-2014-naturalizations
35 Federal Election Commission. “Federal Elections 2012: Elections for the President, the U.S. Senate and the U.S. Representatives”, 2013, http://www.fec.gov/pubrec/fe2012/federalelections2012.pdf.
36 George J. Borjas, “The Labor Supply of Undocumented Immigrants,” NBER Working Paper (National Bureau of Economic Research, Inc, 2016), https://ideas.repec.org/p/nbr/nberwo/22102.html.
The Contributions of New Americans in West Virginia | Endnotes: Methodology
39

ABOUT
The Partnership for a New American Economy brings together more than 500 Republican, Democratic and Independent mayors and business leaders who support sensible immigration reforms that will help create jobs for Americans today. Visit www.renewoureconomy.org to learn more.
New American Economy