THE COMBINED IMPACT OF SRS AND FWM PHENOMENA ON …
20
Uludağ University Journal of The Faculty of Engineering, Vol. 23, No. 2, 2018 RESEARCH DOI: 10.17482/uumfd.390531 67 THE COMBINED IMPACT OF SRS AND FWM PHENOMENA ON THE DOWNLINK CHANNEL PERFORMANCE OF DWDM-GPON SYSTEMS Faisal Ibrahim Mohamed IBRAHIM * Sait Eser KARLIK * Received: 05.02.2018; accepted: 23.05.2018 Abstract: In this paper the combined impact of stimulated Raman scattering (SRS) and four-wave mixing (FWM) on the downlink channel performance of dense wavelength division multiplexed-gigabit passive optical networks (DWDM-GPONs) has been compared with the single impact of FWM via signal-to- crosstalk ratio (SXR) simulations performed on center downlink channels of 7-, 15- and 31-channel DWDM-GPON systems. Simulation results show that SRS compensates negative impacts of FWM and compensation significance enhances with increasing channel numbers and channel spacing values. At high channel spacing values of 50 GHz and 100 GHz, variation of SXR can display a strong oscillatory behavior in very short channel length variations of 0.5 km. The combined impact of SRS and FWM enhances the maximum oscillation amplitude of SXR variation with respect to the single impact of FWM at those channel spacing values. It has been observed that Raman gain exhibits an approximately linear variation with channel input powers in 0.1-5 mW range and it increases with increasing fiber lengths, channel spacing values and channel numbers. Results of this research emphasize the significant difference between the combined impact of SRS and FWM and the single impact of FWM on DWDM-GPON systems and give important hints for current DWDM-GPON implementations. Keywords: Dense wavelength division multiplexing, Gigabit passive optical network, Four wave mixing, Stimulated Raman scattering, Amplification factor, Optical fiber SRS ve FWM Olaylarının DWDM-GPON Sistemlerin Aşağı Yönlü Kanal Performansları Üzerindeki Birleşik Etkisi Öz: Bu makalede, 7-, 15- ve 31-kanallı yoğun dalgaboyu bölmeli çoğullamalı gigabit pasif optik ağ (DWDM-GPON) sistemlerinin merkez aşağı yönlü kanalları üzerinde gerçekleştirilen işaret -çapraz karışım oranı (SXR) benzetimleri yardımıyla, uyarılmış Raman saçılması (SRS) ve dört dalga karışımının (FWM), DWDM-GPON aşağı yönlü kanal performansları üzerindeki birleşik etkisi, FWM’nin tekli etkisi ile karşılaştırılmıştır. Benzetim sonuçları, SRS’nin FWM’nin negatif etkilerini kompanze ettiğini ve kompanzasyon belirginliğinin artan kanal sayıları ve kanallar arası boşluk değerleri ile arttığını göstermektedir. 50 GHz ve 100 GHz gibi yüksek kanallar arası boşluk değerlerinde, SXR değişimi, 0.5 km’lik çok kısa kanal uzunluğu değişimlerinde güçlü bir osilasyon davranışı sergilemektedir. Bu kanallar arası boşluk değerlerinde, SRS ve FWM birleşik etkisi, SXR değişimindeki maksimum osilasyon genliğini FWM’nin tekli etkisine göre daha da arttırmaktadır. 0.1-5 mW aralığında, Raman kazancının kanal giriş güçleri ile yaklaşık olarak doğrusal değişim sergilediği gözlenmiştir ve Raman kazancı artan fiber uzunlukları, kanallar arası boşluk değerleri ve kanal sayıları ile artmaktadır. Bu çalışmanın sonuçları, DWDM-GPON sistemler üzerindeki SRS ve FWM birleşik etkisi ile FWM tekli etkisi arasındaki belirgin farkı vurgulamakta ve mevcut DWDM-GPON uygulamaları için önemli ipuçları vermektedir. * Uludağ University, Faculty of Engineering, Department of Electrical and Electronics Engineering, 16059, Görükle, Bursa, Turkey Correspondence Author: Sait Eser Karlık ([email protected])
Transcript of THE COMBINED IMPACT OF SRS AND FWM PHENOMENA ON …

Uludağ University Journal of The Faculty of Engineering, Vol. 23, No. 2, 2018 RESEARCH DOI: 10.17482/uumfd.390531
67
THE COMBINED IMPACT OF SRS AND FWM PHENOMENA ON
THE DOWNLINK CHANNEL PERFORMANCE OF DWDM-GPON
SYSTEMS
Faisal Ibrahim Mohamed IBRAHIM*
Sait Eser KARLIK*
Received: 05.02.2018; accepted: 23.05.2018
Abstract: In this paper the combined impact of stimulated Raman scattering (SRS) and four-wave mixing
(FWM) on the downlink channel performance of dense wavelength division multiplexed-gigabit passive
optical networks (DWDM-GPONs) has been compared with the single impact of FWM via signal-to-
crosstalk ratio (SXR) simulations performed on center downlink channels of 7-, 15- and 31-channel
DWDM-GPON systems. Simulation results show that SRS compensates negative impacts of FWM and
compensation significance enhances with increasing channel numbers and channel spacing values. At
high channel spacing values of 50 GHz and 100 GHz, variation of SXR can display a strong oscillatory
behavior in very short channel length variations of 0.5 km. The combined impact of SRS and FWM
enhances the maximum oscillation amplitude of SXR variation with respect to the single impact of FWM
at those channel spacing values. It has been observed that Raman gain exhibits an approximately linear
variation with channel input powers in 0.1-5 mW range and it increases with increasing fiber lengths,
channel spacing values and channel numbers. Results of this research emphasize the significant difference
between the combined impact of SRS and FWM and the single impact of FWM on DWDM-GPON
systems and give important hints for current DWDM-GPON implementations.
Keywords: Dense wavelength division multiplexing, Gigabit passive optical network, Four wave mixing,
Stimulated Raman scattering, Amplification factor, Optical fiber
SRS ve FWM Olaylarının DWDM-GPON Sistemlerin Aşağı Yönlü Kanal Performansları
Üzerindeki Birleşik Etkisi
Öz: Bu makalede, 7-, 15- ve 31-kanallı yoğun dalgaboyu bölmeli çoğullamalı gigabit pasif optik ağ
(DWDM-GPON) sistemlerinin merkez aşağı yönlü kanalları üzerinde gerçekleştirilen işaret-çapraz
karışım oranı (SXR) benzetimleri yardımıyla, uyarılmış Raman saçılması (SRS) ve dört dalga karışımının
(FWM), DWDM-GPON aşağı yönlü kanal performansları üzerindeki birleşik etkisi, FWM’nin tekli etkisi
ile karşılaştırılmıştır. Benzetim sonuçları, SRS’nin FWM’nin negatif etkilerini kompanze ettiğini ve
kompanzasyon belirginliğinin artan kanal sayıları ve kanallar arası boşluk değerleri ile arttığını
göstermektedir. 50 GHz ve 100 GHz gibi yüksek kanallar arası boşluk değerlerinde, SXR değişimi,
0.5 km’lik çok kısa kanal uzunluğu değişimlerinde güçlü bir osilasyon davranışı sergilemektedir. Bu
kanallar arası boşluk değerlerinde, SRS ve FWM birleşik etkisi, SXR değişimindeki maksimum osilasyon
genliğini FWM’nin tekli etkisine göre daha da arttırmaktadır. 0.1-5 mW aralığında, Raman kazancının
kanal giriş güçleri ile yaklaşık olarak doğrusal değişim sergilediği gözlenmiştir ve Raman kazancı artan
fiber uzunlukları, kanallar arası boşluk değerleri ve kanal sayıları ile artmaktadır. Bu çalışmanın
sonuçları, DWDM-GPON sistemler üzerindeki SRS ve FWM birleşik etkisi ile FWM tekli etkisi
arasındaki belirgin farkı vurgulamakta ve mevcut DWDM-GPON uygulamaları için önemli ipuçları
vermektedir.
* Uludağ University, Faculty of Engineering, Department of Electrical and Electronics Engineering, 16059,
Görükle, Bursa, Turkey
Correspondence Author: Sait Eser Karlık ([email protected])
Ibrahim F.I.M., Karlık S.E.: Combined Impact of SRS & FWM on Downlink Performance of DWDM-GPONs
68
Anahtar Kelimeler: Yoğun dalgaboyu bölmeli çoğullama, Gigabit pasif optik ağ, Dört dalga karışımı,
Uyarılmış Raman saçılması, Kuvvetlendirme faktörü, Optik fiber
1. INTRODUCTION
In modern optical communication systems, networks having longer lifetimes, higher speeds,
higher bandwidths and lower costs with respect to their alternatives become more important due
to ever-increasing demands of customers. Currently, passive optical network (PON) structures,
in particular gigabit passive optical networks (GPONs), promise important features for access
networks. Allowing information at different channels to be transmitted in various wavelengths
through a single fiber at the same time in both upstream and downstream directions, dense
wavelength division multiplexed-GPON (DWDM-GPON) systems have proved to be a better
choice in increasing the capacity and the flexibility in network design. Telecommunication
Standardization Sector of International Telecommunication Union (ITU-T) has standardized the
channels spacings for DWDM as 12.5 GHz, 25 GHz, 50 GHz and 100 GHz with
Recommendations G.671 (2002) and G.694.1 (2012). System specifications such as the number
of DWDM channels, channel spacings, total transmission length and the input power per
channel have important roles in overall system performance as well as the nonlinear effects
occurring on the optical fiber during system operation. Among all fiber nonlinearities, four wave
mixing (FWM) and stimulated Raman scattering (SRS) are expected to have major impacts on
performance limitations in DWDM-GPON systems. There are various papers focusing on long-
haul DWDM system performance under the impacts of FWM (Souza and Harboe, 2011; Song
and Brandt-Pearce, 2013; Sharma and Kaur, 2013; Hiçdurmaz et. al., 2013; Karlık, 2016a;
Karlık, 2016b) while analyses have been carried out for just SRS effects in some papers (Singh
and Hudiara, 2004; Kaur et. al., 2015) or for the combined effect of SRS and FWM but in the
presence of amplified spontaneous emission (ASE) noise generated by erbium-doped fiber
amplifiers (EDFAs) in some others (Kaur and Singh, 2007a; Kaur and Singh, 2007b; Kaur et.
al., 2010; Kaur et. al., 2011). However, to the best of our knowledge, there are no papers
focusing on the combined impact of SRS and FWM on the downlink channel performance of
DWDM-GPON systems. In this paper, using the signal-to-crosstalk ratio (SXR) variations, i.e.
variations in the ratio of the power of the modified signal due to SRS to the power of FWM
crosstalk, the combined impact of SRS and FWM on the downlink performance of
DWDM-GPON systems has been analyzed with Matlab 2013a simulations considering channels
spacings of 12.5 GHz, 25 GHz, 50 GHz and 100 GHz. The amplification factor of the Stokes
wave in 7-, 15- and 31-channel DWDM-GPON systems has also been analyzed. In Section 2,
the theoretical background required for FWM, SRS and PONs is given. Simulation models and
necessary system characteristics are introduced in Section 3. Simulations results and their
interpretation are presented in Section 4.
2. THEORETICAL BACKGROUND FOR FWM, SRS AND PONs
2.1. Four Wave Mixing (FWM)
During the FWM process, the interaction between three different optical waves propagating
through the optical fiber with frequencies fi, fj and fk generates a novel fourth wave with a novel
frequency fijk due to the third order susceptibility of the fiber. The above mentioned process can
be described with
𝑓𝑖𝑗𝑘 = 𝑓𝑖 + 𝑓𝑗 − 𝑓𝑘 (1)
where indices i, j and k present three different channels of DWDM system satisfying the
condition k ǂ i, j. The major impact of FWM on DWDM system occurs when novel optical

Uludağ University Journal of The Faculty of Engineering, Vol. 23, No. 2, 2018
69
signals generated by triple combinations of optical signals fall in original DWDM channels and
interact with original signals in those channels. If channels are equally spaced in DWDM
systems, a significant number of FWM products, i.e. generated optical signals, and original
channels may propagate with the same frequencies and hence result in FWM crosstalk, which
causes a significant degradation in the system performance
The total number of FWM products (M) generated in DWDM systems depends on the
number of DWDM channels (N) and can be determined with
𝑀 =𝑁2(𝑁 − 1)
2 (2)
The FWM power generated at the frequency fijk can be computed with
𝑃𝐹𝑊𝑀(𝑓𝑖𝑗𝑘) = ( 𝑑𝑖𝑗𝑘𝛾 𝐿𝑒𝑓𝑓
3)
2
𝑃𝑖𝑃𝑗𝑃𝑘 𝑒−𝛼𝐿 ƞ𝑖𝑗𝑘 (3)
where dijk indicates the degeneracy factor, where dijk = 3 for i = j ǂ k and 𝑑𝑖𝑗𝑘 = 6 for i ǂ j ǂ k,
𝛾 indicates the nonlinearity coefficient, Leff indicates the effective fiber length, Pi, Pj and Pk
indicate input powers of channels i, j, k, respectively, 𝛼 indicates the attenuation coefficient of
the fiber, 𝐿 indicates the fiber length and ƞijk indicates the FWM efficiency, which can be given
as
ƞ𝑖𝑗𝑘 =𝛼²
𝛼² + ∆𝐵𝑖𝑗𝑘2 [1 +
4𝑒−𝛼𝐿
(1 − 𝑒−𝛼𝐿)²𝑠𝑖𝑛² (
∆𝐵𝑖𝑗𝑘 𝐿
2)] (4)
where the phase mismatching factor (∆Bijk) is
∆𝐵𝑖𝑗𝑘 =2𝜋𝜆𝑘
2
𝑐 (|𝑓𝑖 − 𝑓𝑘||𝑓𝑗 − 𝑓𝑘|) [𝐷𝑐 +
𝜆𝑘2
2𝑐 𝑑𝐷𝑐
𝑑𝜆(|𝑓𝑖 − 𝑓𝑘| + |𝑓𝑗 − 𝑓𝑘|)] (5)
where 𝜆𝑘 is the wavelength of the 𝑘𝑡ℎ channel, c is the speed of light in vacuum, D𝑐 is the
chromatic dispersion coefficient and dD𝑐 dλ⁄ is the chromatic dispersion slope.
For the case of a DWDM system having equally spaced channels, the total FWM crosstalk
in a channel with a frequency fc can be expressed as (Maeda et. al., 1990)
𝑃𝐹𝑊𝑀(𝑓𝑐) = ∑ ∑ ∑ 𝑃𝐹𝑊𝑀(𝑓𝑖 + 𝑓𝑗 − 𝑓𝑘)
𝑓𝑖𝑓𝑗𝑓𝑘=𝑓𝑖+ 𝑓𝑗− 𝑓𝑐
(6)
The signal-to-crosstalk ratio (SXR) parameter, which can be used for the analysis of FWM
crosstalk impact on a specific channel of a DWDM system, can be defined as
𝑆𝑋𝑅 = 10𝑙𝑜𝑔10 (𝑃𝑜𝑢𝑡
𝑃𝐹𝑊𝑀) (7)
where Pout is the output power of the channel and is computed with 𝑃𝑜𝑢𝑡 = 𝑃𝑖𝑛. 𝑒−𝛼𝐿 for the
input power Pin.
Ibrahim F.I.M., Karlık S.E.: Combined Impact of SRS & FWM on Downlink Performance of DWDM-GPONs
70
2.2. Stimulated Raman Scattering (SRS)
In WDM fiber communication systems, SRS is one of the crucial nonlinear effects, which
degrades the system performance due to the inter-channel crosstalk and that leads to a decrease
in the SNR of the WDM system. In SRS, the incident light interacts with molecular vibrations
of the fiber medium and because of this interaction, light can be scattered. Also in SRS,
channels with higher frequencies (shorter wavelengths) transfer a part of their power to channels
with lower frequencies (higher wavelengths) (Schneider, 2004).
Modified signal powers at various wavelengths due to SRS can be evaluated as (Singh and
Hudiara, 2004)
𝑃𝑀[𝑘] = 𝑃𝑇[𝑘] − 𝑃𝑇[𝑘] ∑ 𝐷[𝑘, 𝑖]
𝑁
𝑖=𝑘+1
+ 𝑃𝑇[𝑘] ∑ 𝑃𝑇[𝑗]
𝑘−1
𝑗=1
𝐷[𝑗, 𝑘] (8)
In the right hand side of (8), the first term, i.e. 𝑃𝑇[𝑘] , indicates the total power transmitted to
the 𝑘𝑡ℎ channel, the second term, i.e. 𝑃𝑇[𝑘] ∑ 𝐷[𝑘, 𝑖]𝑁𝑖=𝑘+1 , indicates the total power depleted
from the 𝑘𝑡ℎ channel by the higher wavelength channels and the third term, i.e.
𝑃𝑇[𝑘] ∑ 𝑃𝑇[𝑗]𝑘−1𝑗=1 𝐷[𝑗, 𝑘], gives the total power depleted by the 𝑘𝑡ℎ channel from lower
wavelength channels. In (8), for k =1, 2, ....., N 𝐷[𝑘, 𝑖] = 0 for i > N and for k=1 𝐷[𝑗, 𝑘] = 0.
The fraction of power depleted from the 𝑖𝑡ℎ channel by the 𝑗𝑡ℎ channel, i.e. 𝐷[𝑖, 𝑗], can be
represented as
𝐷[𝑖, 𝑗] = {(
𝜆𝑗
𝜆𝑖) . 𝑃𝑇[𝑗]. {
(𝑓𝑖 − 𝑓𝑗)
1.5 ∗ 1013} . 𝑔𝑅𝑚𝑎𝑥 . {
(𝐿𝑒𝑓𝑓(𝜆𝑗) ∗ 105)
(𝑏. 𝐴𝑒𝑓𝑓)} , (𝑓𝑖 − 𝑓𝑗) ≤ 1.5 ∗ 1013 𝐻𝑧 𝑎𝑛𝑑 𝑗 > 𝑖
0 , (𝑓𝑖 − 𝑓𝑗) > 1.5 ∗ 1013 𝐻𝑧 𝑎𝑛𝑑 𝑗 ≤ 𝑖
(9)
where 𝜆𝑖 𝑎𝑛𝑑 𝜆𝑗 are wavelengths of 𝑖𝑡ℎ and 𝑗𝑡ℎ channels, respectively, in terms of nm; 𝑃𝑇[𝑗] is
the optical power launched in the 𝑗𝑡ℎ channel in terms of mW, 𝑔𝑅𝑚𝑎𝑥 is the peak Raman gain
coefficient in terms of cm/W; f𝑖 and f𝑗 are center frequencies of 𝑖𝑡ℎ and 𝑗𝑡ℎ channels,
respectively, in terms of Hz; 𝐿𝑒𝑓𝑓(𝜆𝑗) is the effective length of the 𝑗𝑡ℎ channel operating at the
wavelength 𝜆𝑗 in terms of km; 𝐴𝑒𝑓𝑓 is the effective core area of the optical fiber in terms of cm2
and the value b varies between 1 and 2 according to the polarization state of signals at different
wavelength channels.
The actual optical power received at the receiver side of the 𝑘𝑡ℎ channel is defined as
𝑃𝑅[𝑘] = 𝑃𝑀[𝑘]. 𝑒−𝛼𝐿 (10)
In SRS, the power transfer from channels with higher frequencies to the ones with lower
frequencies is in fact the light amplification in the channel that has a higher wavelength by the
help of the channel that has a lower wavelength. The amplification factor of the Stokes wave
(channel that has a higher wavelength), i.e. 𝐺𝑅, can be defined as the ratio of the intensity of the
Stokes wave with Raman scattering at the fiber output, i.e. 𝐼𝑆(𝐿), to the intensity it would have
without the Raman scattering at the fiber output, i.e. 𝐼𝑆(0)𝑒−𝛼𝑆𝐿 (Schneider, 2004).
𝐺𝑅 =𝐼𝑆(𝐿)
𝐼𝑆(0). 𝑒−𝛼𝑆𝐿 (11)

Uludağ University Journal of The Faculty of Engineering, Vol. 23, No. 2, 2018
71
Since the amplification of the Stokes wave causes a depletion in the pump wave (channel
that has a lower wavelength), a depletion factor can be described for the pump wave in a similar
way to the amplification factor.
Considering that 𝐼𝑆(𝐿) = 𝑃𝑆𝑅𝑆. 𝑒−𝛼𝑆𝐿 and 𝐼𝑆(0) = 𝑃𝑖𝑛, (11) can be rewritten as
𝐺𝑅 =𝑃𝑆𝑅𝑆
𝑃𝑖𝑛 (12)
where 𝑃𝑆𝑅𝑆 represents the modified power due to SRS.
The SXR given in (7) can be modified for DWDM systems under combined impacts of SRS
and FWM as
𝑆𝑋𝑅 = 10𝑙𝑜𝑔10 (𝑃𝑆𝑅𝑆
𝑃𝐹𝑊𝑀) (13)
where PSRS is the modified signal power due to SRS and PFWM is the FWM crosstalk power.
2.3. Passive Optical Networks (PONs)
PON is an optical network technology which uses a point-to-multipoint topology that means
a single fiber is used to support multiple users. It includes an Optical Line Termination (OLT), a
group of an Optical Network Units (ONUs), a passive optical device or a splitter and optical
fibers connecting those devices mentioned above. The OLT is located at the Central Office (CO)
where it has an obligation to transmit the data coming from the metropolitan network to ONUs
through the downlink stream and the data coming from ONUs to the metropolitan network via
the uplink stream. Two wavelengths are used by OLT, one is 1490 nm for the downlink and the
other is 1310 nm for the uplink. ONUs are located at customer premises. The optical splitter
exists between the OLT and the ONU and it works as a demultiplexer for the downstream
transmission and as a multiplexer for the upstream transmission. A PON architecture is shown
in Fig. 1.
Figure 1: PON architecture
PONs are important in current DWDM system applications, in particular GPONs. GPON
technology has been standardized by ITU-T with Recommendations series of G.984.x (G.984.1,
2008; G.984.2, 2003; G.984.3, 2014; G.984.4, 2008; G.984.5, 2014).

Ibrahim F.I.M., Karlık S.E.: Combined Impact of SRS & FWM on Downlink Performance of DWDM-GPONs
72
GPONs have those specifications;
A data packet or cell size of 53 to 1518 bytes.
Maximum downstream data rate of 2.4 Gbps.
Maximum upstream data rate of 1.2 Gbps.
Downstream wavelength of 1490 nm and 1550 nm.
Upstream wavelength of 1390 nm.
Max splitting ratio of 1:64 and max transmission distance of 30 km.
Recommendations G.984.x supply connections of an OLT with 64 ONUs over a distance of
15 km, 32 ONUs over a distance of 20 km and 16 ONUs over a distance of 30 km.
In DWDM-GPON applications, considering the number of end-users in both channels, i.e.
downlink and uplink channels, channels can be divided into sub-channels using the splitting
ratio (1:N) feature of the optical splitter. 1:128 splitting ratios will be available in applications in
the near future.
3. SIMULATION MODEL AND FIBER PARAMETERS
In this study, with the help of MATLAB 2013a simulation program and mathematical
equations given in Section 2, simulations have been performed for center downlink channels of
7-, 15- and 31-channel DWDM-GPON systems, which have equally spaced channels with
channel spacing values of 12.5 GHz, 25 GHz, 50 GHz and 100 GHz.
In simulations, G.652 standard single-mode fiber (SSMF) has been used for the downlink
channel operating at 1490 nm and important parameter values of this fiber are given in Table 1,
where Dc indicates the chromatic dispersion, S indicates the chromatic dispersion slope, γ
denotes the nonlinearity coefficient and 𝛼 is the attenuation coefficient.
Table 1. Parameters of SSMF
Dc
(ps/nm.km)
S
(ps/𝒏𝒎𝟐. 𝒌𝒎)
𝜸
(1/W.km)
𝜶
(dB/km)
12.72
0.086
1.35 0.22
Table 2. Channel combinations that generate FWM products in the center channel of a
7-channel DWDM-GPON system
i/j 1 2 3 4 5 6 7
1 k=2 k=3 k=4
2 k=1 k=3 k=4 k=5
3 k=2 k=4 k=5 k=6
4
5 k=6 k=7
6
7
In DWDM-GPON systems implemented with SSMFs, center channels are the most badly
impacted channels (Harboe et. al., 2008). Therefore, center channels of 7-, 15- and 31-channel
DWDM-GPON systems, i.e. 4th, 8
th and 16
th channels, respectively, are taken into account in
simulations. Tables 2-4 show the triple channel combinations that generate FWM products
falling into center channels of 7-, 15- and 31-channel systems, respectively.

Uludağ University Journal of The Faculty of Engineering, Vol. 23, No. 2, 2018
73
In Tables 2-4, i, j and k show channel numbers that construct FWM products in the center
channel of the related DWDM-GPON system, e.g. in Table 2, channel 3 (i=3), channel 5 (j=5)
and channel 4 (k=4) generate a FWM product in the center channel, i.e. the 4th channel, of
the 7-channel DWDM-GPON system. As mentioned before in Section 2, k≠ i, j and only half
spaces in Table 2-4 are considered since i and j are interchangeable.
Table 3. Channel combinations that generate FWM products in the center channel of a
15-channel DWDM-GPON system
i/j 1 2 3 4 5 6 7 8 9 10 11 12 13 14 15
1 k=2 k=3 k=4 k=5 k=6 k=7 k=8
2 k=1 k=3 k=4 k=5 k=6 k=7 k=8 k=9
3 k=1 k=2 k=4 k=5 k=6 k=7 k=8 k=9 k=10
4 k=1 k=2 k=3 k=5 k=5 k=7 k=8 k=9 k=10 k=11
5 k=2 k=3 k=4 k=6 k=7 k=8 k=9 k=10 k=11 k=12
6 k=4 k=5 k=7 k=8 k=9 k=10 k=11 k=12 k=13
7 k=6 k=8 k=9 k=10 k=11 k=12 k=11 k=14
8
9 k=10 k=11 k=12 k=13 k=14 k=15
10 k=12 k=13 k=14 k=15
11 k=14 k=15
12
13
14
15
Table 4. Channel combinations that generate FWM products in the center channel of a
31-channel DWDM-GPON system

Ibrahim F.I.M., Karlık S.E.: Combined Impact of SRS & FWM on Downlink Performance of DWDM-GPONs
74
4. SIMULATIONS
In this section, simulation results analyzing SXR variations with variations in channel input
powers, channel spacing values and channel lengths are explained and interpreted firstly under
the single impact of FWM and then under the combined impact of SRS and FWM. Furthermore,
simulation results focusing on variations of the amplification factor of the Stokes wave with
variations in input powers have also been reported.
4.1. SXR-channel input power variations
In this subsection, simulation results exhibiting variation of SXR with channel input powers
for center downlink channels of 7-, 15- and 31-channel DWDM-GPON systems have been
given in Figs. 2-5, where equal channel input powers are considered in the range of 0.1-5 mW.
The operating wavelength for the center downlink channel has been taken as 1490 nm. To
supply limits in GPON standards, the fiber length connecting the OLT and the splitter has been
taken as 15 km for all DWDM-GPON systems. Simulation results shown in Figs. 2-5 have been
determined for channel spacing values of 12.5 GHz, 25 GHz, 50 GHz and 100 GHz,
respectively.
For analyzing the impact of FWM in DWDM-based systems, appropriate minimum SXR
values like 20 dB, 23 dB or 25 dB have been considered in the literature (Nakajima et.al., 1997;
Bogoni and Poti, 2004; Harboe et.al., 2008). In this study, a minimum 23 dB SXR value has
been taken into account and shown by the green line in Figs. 2-5. Evaluating simulation results
shown in Figs. 2-5, comparative results for maximum channel input powers satisfying 23 dB
SXR condition are given in Tables 5 and 6 for the single impact of FWM and for the combined
impact of SRS and FWM, respectively.
(a) (b)
Figure 2:
SXR-channel input power variations in center downlink channels of 7-, 15- and 31-channel
DWDM-GPON systems that have 12.5 GHz channel spacing values due to the
(a) single impact of FWM (b) combined impact of SRS and FWM
0 0.5 1 1.5 2 2.5 3 3.5 4 4.5 55
10
15
20
25
30
35
40
45
50
Pin (mW)
SX
R (
dB
)
7-channel DWDM-GPON System
15-channel DWDM-GPON System
31-channel DWDM-GPON System
23 dB
0 0.5 1 1.5 2 2.5 3 3.5 4 4.5 515
20
25
30
35
40
45
50
55
60
Pin (mW)
SX
R (
dB
)
7-channel DWDM-GPON System
15-channel DWDM-GPON System
31-channel DWDM-GPON System
23 dB

Uludağ University Journal of The Faculty of Engineering, Vol. 23, No. 2, 2018
75
(a) (b)
Figure 3: SXR-channel input power variations in center downlink channels of 7-, 15- and 31-channel
DWDM-GPON systems that have 25 GHz channel spacing values due to the
(a) single impact of FWM (b) combined impact of SRS and FWM
(a) (b)
Figure 4:
SXR-channel input power variations in center downlink channels of 7-, 15- and 31-channel
DWDM-GPON systems that have 50 GHz channel spacing values due to the
(a) single impact of FWM (b) combined impact of SRS and FWM
0 0.5 1 1.5 2 2.5 3 3.5 4 4.5 520
25
30
35
40
45
50
55
60
Pin (mW)
SX
R (
dB
)
7-channel DWDM-GPON System
15-channel DWDM-GPON System
31-channel DWDM-GPON System
23 dB
0 0.5 1 1.5 2 2.5 3 3.5 4 4.5 520
30
40
50
60
70
80
Pin (mW)
SX
R (
dB
)
7-channel DWDM-GPON System
15-channel DWDM-GPON System
31-channel DWDM-GPON System
23 dB
0 0.5 1 1.5 2 2.5 3 3.5 4 4.5 520
25
30
35
40
45
50
55
60
65
70
Pin (mW)
SX
R (
dB
)
7-channel DWDM-GPON System
15-channel DWDM-GPON System
31-channel DWDM-GPON System
23 dB
0 0.5 1 1.5 2 2.5 3 3.5 4 4.5 520
30
40
50
60
70
80
90
100
Pin (mW)
SX
R (
dB
)
7-channel DWDM-GPON System
15-channel DWDM-GPON System
31-channel DWDM-GPON System
23 dB

Ibrahim F.I.M., Karlık S.E.: Combined Impact of SRS & FWM on Downlink Performance of DWDM-GPONs
76
(a) (b)
Figure 5: SXR-channel input power variations in center downlink channels of 7-, 15- and 31-channel
DWDM-GPON systems that have 100 GHz channel spacing values due to the
(a) single impact of FWM (b) combined impact of SRS and FWM
Table 5. Comparative results for maximum channel input powers satisfying 23 dB SXR
condition in center downlink channels of 7-, 15- and 31-channel DWDM-GPON systems
under the single impact of FWM
DWDM-GPON
Systems
∆𝐟
(GHz) 12.5 25 50 100
7-channel Maximum 𝐏𝐢𝐧
satisfying 23 dB SXR
(mW)
1.27 >5 >5 >5
15-channel 1.10 4.68 >5 >5
31-channel 1.04 4.42 >5 >5
Table 6. Comparative results for maximum channel input powers satisfying 23 dB SXR
condition in center downlink channels of 7-, 15- and 31-channel DWDM-GPON systems
under the combined impact of SRS and FWM
DWDM-GPON
Systems
∆𝐟
(GHz) 12.5 25 50 100
7-channel Maximum 𝐏𝐢𝐧
satisfying 23 dB SXR
(mW)
1.85 >5 >5 >5
15-channel >5 >5 >5 >5
31-channel >5 >5 >5 >5
It has been observed in Figures 2a, 3a, 4a and 5a that SXR value shows an exponential
decay with the increase in channel input powers due to the 𝑃𝑖𝑛3 dependence of PFWM for the case
of equal channel input powers as given in (3). Furthermore SXR decreases with decreasing
channel spacing values since narrower channel spacings cause degradation in the phase
mismatching factor ΔBijk and this increases the FWM efficiency ηijk and subsequently PFWM
increases as it can be easily seen from (3)-(5). SXR also decreases with increasing channel
0 0.5 1 1.5 2 2.5 3 3.5 4 4.5 520
30
40
50
60
70
80
90
Pin (mW)
SX
R (
dB
)
7-channel DWDM-GPON System
15-channel DWDM-GPON System
31-channel DWDM-GPON System
23 dB
0 0.5 1 1.5 2 2.5 3 3.5 4 4.5 520
40
60
80
100
120
140
Pin (mW)
SX
R (
dB
)
7-channel DWDM-GPON System
15-channel DWDM-GPON System
31-channel DWDM-GPON System
23 dB

Uludağ University Journal of The Faculty of Engineering, Vol. 23, No. 2, 2018
77
numbers from 7 to 31 and this is due to the increasing number of FWM products generated in
center channels as given in Tables 2-4 which enhances the PFWM. For 12.5 GHz channel spacing
value, there is a risk to have an SXR value below 23 dB in all 7-, 15- and 31-channel
DWDM-GPON systems for channel input powers exceeding 1 mW; for 25 GHz channel
spacing value, there is a risk to have an SXR value below 23 dB in only 15- and 31-channel
DWDM-GPON systems for channel input powers approaching 5 mW and there is no risk to
have an SXR value below 23 dB for all 7-, 15- and 31-channel DWDM-GPON systems for
50 GHz and 100 GHz channel spacing values in the channel input power range of 0.1-5 mW.
This is the case under the single impact of FWM.
Comparing results given in Figs. 2b, 3b, 4b and 5b with Figs. 2a, 3a, 4a and 5a respectively,
it can be easily concluded that SXR values under the combined impact of SRS and FWM are
significantly greater than those under the single impact of FWM and furthermore contrary to the
case under the single impact of FWM, SXR values increase with increasing channel numbers.
This is in fact due to the amplification factor of the Stokes wave, i.e. the Raman gain GR,
increasing with the increasing channel numbers and resulting in an increase in the modified
signal power PSRS for center channels. Therefore SXR increases with the increase in PSRS as it is
obvious in (11)-(13). Under the combined impact of SRS and FWM, the risk to have an SXR
value below 23 dB occurs for only 7-channel DWDM-GPON systems using 12.5 GHz channel
spacing values and having channel input powers approaching 2 mW. There is no other risk for
7-, 15- and 31-channel DWDM-GPON systems unless channel input powers exceed the range of
0.1-5 mW. Comparative results show that SRS compensates negative impacts of FWM in center
downlink channels of 7-, 15- and 31-channel DWDM-GPON systems and significance of
compensation enhances with increasing channel numbers and channel spacing values.
4.2. SXR-channel spacing value variations
In this subsection, simulation results displaying variations of SXR with channel spacing
values for center downlink channels of 7-, 15- and 31-channel DWDM-GPON systems have
been shown in Fig. 6, where equal channel input powers of 0.1 mW have been considered. The
operating wavelength for the center downlink channel has been taken as 1490 nm. To supply
limits in GPON standards, the fiber length connecting the OLT and the splitter has been taken as
15 km for all DWDM-GPON systems. Simulation results shown in Fig. 6 have been determined
for channel spacing value range of 12.5-100 GHz. Evaluating simulation results given in
Figs. 10 and 11, comparative results for SXR values in center downlink channels of 7-, 15- and
31-channel DWDM-GPON systems are displayed in Tables 7 and 8 under the single impact of
FWM and the combined impact of SRS and FWM, respectively.
It is clear in Fig. 6 and Tables 7-8 that at fixed channel input powers channel spacing values
have more considerable effects on SXR than channel numbers, e.g. at fixed channel numbers
SXR values at 100 GHz are greater than those at 12.5 GHz in the range of 36.09-36.14 dB in
Table 7 while in the range of 50.90-62.98 dB in Table 8 however at fixed channel spacing
values the SXR variation between 7-channel and 31-channel systems is in the rage of
1.74-2.88 dB in Table 7 while it is in 11.99-24.07 dB range in Table 8.
Results given in this subsection is in good agreement with results given in the previous
section about the compensating behavior of SRS on negative impacts of FWM in center
downlink channels of DWDM-GPON systems, i.e. all SXR values in Table 8 are greater than
related values in Table 7. Considering bold-written SXR values in Tables 7 and 8, the increasing
significance of the compensating behavior of SRS with increasing channel numbers and channel
spacing values can be easily seen.

Ibrahim F.I.M., Karlık S.E.: Combined Impact of SRS & FWM on Downlink Performance of DWDM-GPONs
78
(a) (b)
Figure 6: SXR-channel spacing value variations in center downlink channels of
7-, 15- and 31- channel DWDM-GPON systems due to the
(a) single impact of FWM (b) combined impact of SRS and FWM
Table 7. Comparative results for SXR values in center downlink channels of 7-, 15- and
31-channel DWDM-GPON systems due to the single impact of FWM
DWDM-GPON
Systems
∆𝐟
(GHz) 12.5 25 50 100
7-channel SXR values in the
center downlink channel
(dB)
45.08 58.79 68.62 81.22
15-channel 43.85 56.41 67.32 79.94
31-channel 43.34 55.91 66.88 79.43
Table 8. Comparative results for SXR values in the center downlink channels of 7-, 15-
and 31-channel DWDM-GPON systems due to the combined impact of SRS and FWM
DWDM-GPON
Systems
∆𝐟
(GHz) 12.5 25 50 100
7-channel SXR values in the
center downlink channel
(dB)
45.33 60.49 75.46 96.23
15-channel 47.48 67.00 86.60 108.20
31-channel 57.32 78.77 98.76 120.30
4.3. SXR-channel length variations
In this subsection, simulation results exhibiting variations of SXR with channel lengths for
center downlink channels of 7-, 15- and 31-channel DWDM-GPON systems have been shown
in Figs. 7-9, where equal channel input powers of 0.1 mW have been considered. The operating
10 20 30 40 50 60 70 80 90 10040
45
50
55
60
65
70
75
80
85
f (GHz)
SX
R (
dB
)
7-channel DWDM-GPON System
15-channel DWDM-GPON System
31-channel DWDM-GPON System
10 20 30 40 50 60 70 80 90 10040
50
60
70
80
90
100
110
120
130
f (GHz)
SX
R (
dB
)
7-channel DWDM-GPON System
15-channel DWDM-GPON System
31-channel DWDM-GPON System

Uludağ University Journal of The Faculty of Engineering, Vol. 23, No. 2, 2018
79
wavelength for the center downlink channel has been taken as 1490 nm. To supply limits in
GPON standards, the maximum length of the fiber connecting the OLT and the splitter has been
taken as 30 km for 7- and 15-channel DWDM-GPON systems and as 20 km for 31-channel
DWDM-GPON systems. Simulations have been performed for equally-spaced DWDM-GPON
systems. Evaluating simulation results given in Figs. 7-9, comparative results for SXR values in
center downlink channels of 7-, 15- and 31-channel DWDM-GPON systems are displayed in
Table 9 under the single impact of FWM and the combined impact of SRS and FWM for
different channel lengths and channel spacing values.
The most remarkable point about simulation results given in Figs. 7-9 is the oscillatory
behavior of the SXR variation with varying channel lengths which starts slightly in
DWDM-GPON systems having 25 GHz channel spacing values and becomes stronger as
channel spacing values reach 50 GHz and 100 GHz. Especially at 100 GHz a strong oscillation
is obvious for all 7-, 15-, 31-channel DWDM-GPON systems under single impact of FWM and
combined impact of SRS and FWM in very short channel length variations of 0.5 km. This is
due to the phase mismatching phenomenon which becomes stronger at high channel spacing
values like 50 GHz and 100 GHz, and it is very important in system implementation since SXR
performance can be significantly degraded with very short channel length variations. For
example, a 0.5 km increment in channel lengths can cause a maximum SXR degradation of
8.86 dB and 8.66 dB at 50 GHz and 100 GHz channel spacings, respectively, for 7-channel
DWDM-GPON systems under single impact of FWM while 8.69 dB and 10.24 dB at 50 GHz
and 100 GHz channel spacings, respectively, for 7-channel DWDM-GPON systems under
combined impact of SRS and FWM; 7.75 dB and 5.43 dB at 50 GHz and 100 GHz channel
spacings, respectively, for 15-channel DWDM-GPON systems under single impact of FWM
while 7.98 dB at both 50 GHz and 100 GHz channel spacings, respectively, for 15-channel
DWDM-GPON systems under combined impact of SRS and FWM; 5.54 dB and 4.41 dB at
(a) (b)
Figure 7: SXR-channel length variations in center downlink channels of 7-channel DWDM-GPON
systems for the channel length range of 1-30 km and channel spacing values of
12.5 GHz, 25 GHz, 50 GHz and 100 GHz due to the
(a) single impact of FWM (b) combined impact of SRS and FWM
0 5 10 15 20 25 3045
50
55
60
65
70
75
80
85
90
L (km)
SX
R(d
B)
f=12.5 GHz
f=25 GHz
f=50 GHz
f=100 GHz
0 5 10 15 20 25 3040
50
60
70
80
90
100
110
L (km)
SX
R(d
B)
f=12.5 GHz
f=25 GHz
f=50 GHz
f=100 GHz

Ibrahim F.I.M., Karlık S.E.: Combined Impact of SRS & FWM on Downlink Performance of DWDM-GPONs
80
(a) (b)
Figure 8:
SXR-channel length variations in center downlink channels of 15-channel DWDM-GPON
systems for the channel length range of 1-30 km and channel spacing values of
12.5 GHz, 25 GHz, 50 GHz and 100 GHz due to the
(a) single impact of FWM (b) combined impact of SRS and FWM
(a) (b)
Figure 9:
SXR-channel length variations in center downlink channels of 31-channel DWDM-GPON
systems for the channel length range of 1-20 km and channel spacing values of
12.5 GHz, 25 GHz, 50 GHz and 100 GHz due to the
(a) single impact of FWM (b) combined impact of SRS and FWM
0 5 10 15 20 25 3040
45
50
55
60
65
70
75
80
85
L (km)
SX
R(d
B)
f=12.5 GHz
f=25 GHz
f=50 GHz
f=100 GHz
0 5 10 15 20 25 3040
50
60
70
80
90
100
110
120
L (km)
SX
R(d
B)
f=12.5 GHz
f=25 GHz
f=50 GHz
f=100 GHz
0 2 4 6 8 10 12 14 16 18 2040
45
50
55
60
65
70
75
80
85
L (km)
SX
R(d
B)
f=12.5 GHz
f=25 GHz
f=50 GHz
f=100 GHz
0 2 4 6 8 10 12 14 16 18 2050
60
70
80
90
100
110
120
130
L (km)
SX
R(d
B)
f=12.5 GHz
f=25 GHz
f=50 GHz
f=100 GHz

Uludağ University Journal of The Faculty of Engineering, Vol. 23, No. 2, 2018
81
Table 9. Comparative results for SXR values in center downlink channels of 7-, 15- and
31-channel DWDM-GPON systems for different channel lengths and channel spacing
values
Lengths
(km)
DWDM-
GPON
Systems
∆𝐟
(GHz) 12.5 25 50
100
1
7-channel
SX
R v
alu
es i
n t
he
cen
ter
do
wn
lin
k c
ha
nn
el
du
e to
th
e si
ngle
im
pact
of
FW
M
(dB
)
61.04 61.77 66.28 87.00
15-channel 54.00 57.22 65.32 82.46
31-channel 50.04 55.92 64.90 80.92
5
7-channel 49.01 54.85 67.94 78.83
15-channel 44.99 53.91 66.60 78.04
31-channel 44.12 53.48 66.07 77.69
10
7-channel 45.86 55.83 67.75 80.20
15-channel 43.86 54.63 66.66 79.04
31-channel 43.32 54.21 66.25 78.58
20
7-channel 45.36 57.54 68.71 84.94
15-channel 44.15 56.16 67.70 82.65
31-channel 43.64 55.61 67.28 81.81
30 7-channel 46.29 57.52 71.26 81.77
15-channel 44.73 56.32 69.31 80.56
1
7-channel
SX
R v
alu
es i
n t
he
cen
ter
do
wn
lin
k c
han
nel
du
e to
th
e co
mb
ined
im
pact
of
SR
S a
nd
FW
M
(dB
)
61.06 61.91 67.25 91.77
15-channel 54.37 59.52 73.52 99.08
31-channel 54.20 67.35 85.08 110.10
5
7-channel 49.10 55.48 71.46 89.25
15-channel 46.57 60.45 81.24 101.60
31-channel 53.69 71.64 93.21 113.90
10
7-channel 46.04 57.01 73.20 93.44
15-channel 46.60 63.67 84.23 105.60
31-channel 55.65 75.35 96.39 117.80
20
7-channel 45.70 59.65 76.50 101.10
15-channel 48.55 67.93 88.24 112.20
31-channel 58.86 79.74 100.40 124.00
30 7-channel 46.78 60.39 80.56 99.64
15-channel 50.33 69.75 91.60 111.90

Ibrahim F.I.M., Karlık S.E.: Combined Impact of SRS & FWM on Downlink Performance of DWDM-GPONs
82
50 GHz and 100 GHz channel spacings, respectively, for 31-channel DWDM-GPON systems
under single impact of FWM while 5.72 dB and 7.00 dB at 50 GHz and 100 GHz channel
spacings, respectively, for 31-channel DWDM-GPON systems under combined impact of SRS
and FWM. It is clear that, generally, the combined impact of SRS and FWM enhances the
maximum oscillation amplitude of the SXR variation in both 50 GHz and 100 GHz channel
spacing values with respect to the case under the single impact of FWM.
4.4. Amplification factor of the Stokes wave-channel input power variations
In this subsection, simulation results displaying variation of amplification factor of the
Stokes wave, i.e. GR, with channel input powers for center downlink channels of 7-, 15- and
31-channel DWDM-GPON systems have been shown in Figs. 10-12.
(a) (b)
(c) (d)
Figure 10: GR-channel input power variations in center downlink channels of
7-channel DWDM-GPON systems at different channel lengths for channel spacing values of
(a)12.5 GHz (b) 25 GHz (c) 50 GHz (d) 100 GHz
0 0.5 1 1.5 2 2.5 3 3.5 4 4.5 51
2
3
4
5
6
7
8
Pin (mW)
GR
L=5km
L=10 Km
L=15 Km
L=20 Km
L=30 Km
0 0.5 1 1.5 2 2.5 3 3.5 4 4.5 50
5
10
15
20
25
30
35
40
45
50
Pin (mW)
GR
L=5km
L=10 Km
L=15 Km
L=20 Km
L=30 Km
0 0.5 1 1.5 2 2.5 3 3.5 4 4.5 50
50
100
150
200
250
300
350
400
Pin (mW)
GR
L=5km
L=10 Km
L=15 Km
L=20 Km
L=30 Km
0 0.5 1 1.5 2 2.5 3 3.5 4 4.5 50
500
1000
1500
2000
2500
3000
3500
Pin (mW)
GR
L=5km
L=10 Km
L=15 Km
L=20 Km
L=30 Km

Uludağ University Journal of The Faculty of Engineering, Vol. 23, No. 2, 2018
83
(a) (b)
(c) (d)
Figure 11:
GR-channel input power variations in center downlink channels of
15-channel DWDM-GPON systems at different channel lengths for channel spacing values of
(a)12.5 GHz (b) 25 GHz (c) 50 GHz (d) 100 GHz
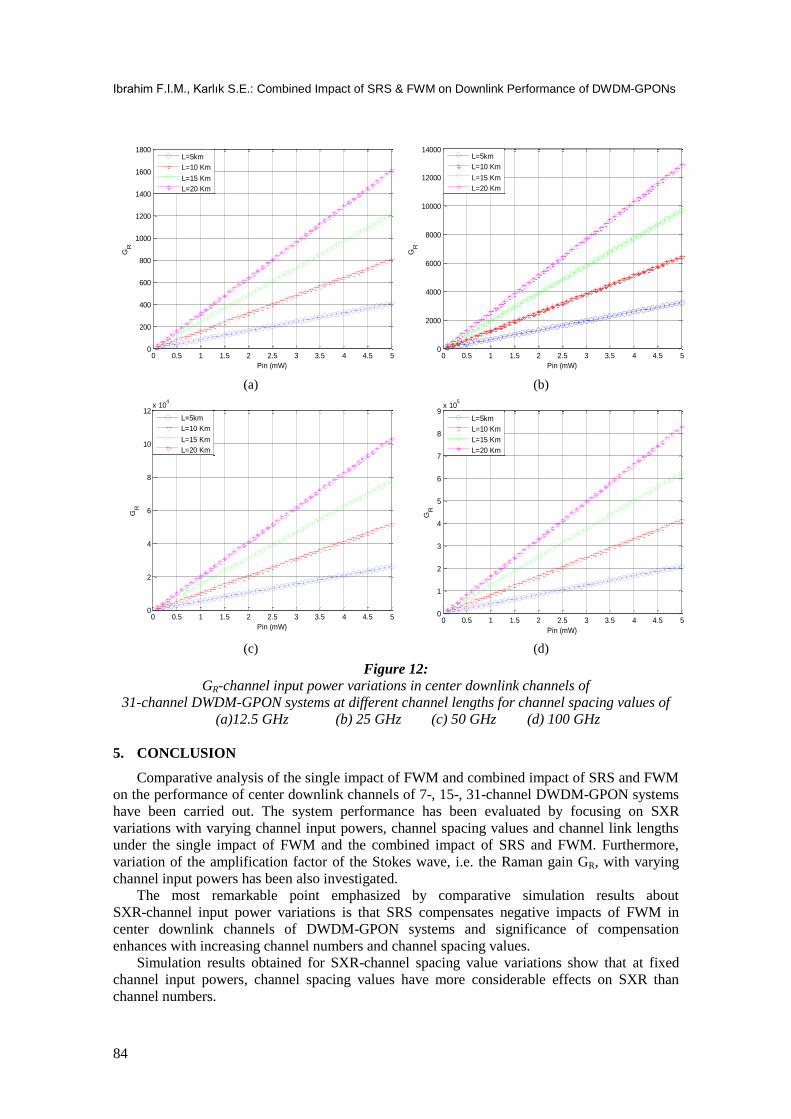
Simulations have been performed for equal channel input powers in the range of 0.1-5 mW
at channel lengths of 5 km, 10 km, 15 km, 20 km and 30 km for 7- and 15-channel
DWDM-GPON systems and at channel lengths of 5 km, 10 km, 15 km and 20 km for
31-channel DWDM-GPON systems. It has been observed in Figs. 10-12 that the amplification
factor of the Stokes wave, i.e. the Raman gain GR, shows an approximately linear variation with
the channel input power variation in the range of 0.1-5 mW. Furthermore, GR increases with
increasing fiber lengths, channel spacing values and channel numbers.
0 0.5 1 1.5 2 2.5 3 3.5 4 4.5 50
20
40
60
80
100
120
140
Pin (mW)
GR
L=5km
L=10 Km
L=15 Km
L=20 Km
L=30 Km
0 0.5 1 1.5 2 2.5 3 3.5 4 4.5 50
200
400
600
800
1000
1200
Pin (mW)
GR
L=5km
L=10 Km
L=15 Km
L=20 Km
L=30 Km
0 0.5 1 1.5 2 2.5 3 3.5 4 4.5 50
1000
2000
3000
4000
5000
6000
7000
8000
9000
Pin (mW)
GR
L=5km
L=10 Km
L=15 Km
L=20 Km
L=30 Km
0 0.5 1 1.5 2 2.5 3 3.5 4 4.5 50
1
2
3
4
5
6
7x 10
4
Pin (mW)
GR
L=5km
L=10 Km
L=15 Km
L=20 Km
L=30 Km
Ibrahim F.I.M., Karlık S.E.: Combined Impact of SRS & FWM on Downlink Performance of DWDM-GPONs
84
(a) (b)
(c) (d)
Figure 12:
GR-channel input power variations in center downlink channels of
31-channel DWDM-GPON systems at different channel lengths for channel spacing values of
(a)12.5 GHz (b) 25 GHz (c) 50 GHz (d) 100 GHz
5. CONCLUSION
Comparative analysis of the single impact of FWM and combined impact of SRS and FWM
on the performance of center downlink channels of 7-, 15-, 31-channel DWDM-GPON systems
have been carried out. The system performance has been evaluated by focusing on SXR
variations with varying channel input powers, channel spacing values and channel link lengths
under the single impact of FWM and the combined impact of SRS and FWM. Furthermore,
variation of the amplification factor of the Stokes wave, i.e. the Raman gain GR, with varying
channel input powers has been also investigated.
The most remarkable point emphasized by comparative simulation results about
SXR-channel input power variations is that SRS compensates negative impacts of FWM in
center downlink channels of DWDM-GPON systems and significance of compensation
enhances with increasing channel numbers and channel spacing values.
Simulation results obtained for SXR-channel spacing value variations show that at fixed
channel input powers, channel spacing values have more considerable effects on SXR than
channel numbers.
0 0.5 1 1.5 2 2.5 3 3.5 4 4.5 50
200
400
600
800
1000
1200
1400
1600
1800
Pin (mW)
GR
L=5km
L=10 Km
L=15 Km
L=20 Km
0 0.5 1 1.5 2 2.5 3 3.5 4 4.5 50
2000
4000
6000
8000
10000
12000
14000
Pin (mW)
GR
L=5km
L=10 Km
L=15 Km
L=20 Km
0 0.5 1 1.5 2 2.5 3 3.5 4 4.5 50
2
4
6
8
10
12x 10
4
Pin (mW)
GR
L=5km
L=10 Km
L=15 Km
L=20 Km
0 0.5 1 1.5 2 2.5 3 3.5 4 4.5 50
1
2
3
4
5
6
7
8
9x 10
5
Pin (mW)
GR
L=5km
L=10 Km
L=15 Km
L=20 Km
Uludağ University Journal of The Faculty of Engineering, Vol. 23, No. 2, 2018
85
Simulation results of SXR-channel length variations state that a strong oscillatory behavior
occurs on the SXR variation in very short channel length variations of 0.5 km especially at high
channel spacing values of 50 GHz and 100 GHz. The combined impact of SRS and FWM
enhances the maximum oscillation amplitude of the SXR variation with respect to the case
under the single impact of FWM.
Simulation results display an approximately linear variation between the Raman gain and
channel input powers in the range of 0.1-5 mW. Furthermore, the Raman gain increases with
increasing fiber lengths, channel spacing values and channel numbers.
Results of this research exhibit that the combined impact of SRS and FWM on
DWDM-GPON systems differs significantly from the single impact of FWM and give important
hints for current DWDM-GPON implementations.
REFERENCES
1. Bogoni, A. and Poti, L. (2004) Effective channel allocation to reduce inband FWM
crosstalk in DWDM transmission systems, IEEE Journal of Selected Topics in Quantum
Electronics, 10 (2), 387-392. doi:10.1109/JSTQE.2004.825952
2. Harboe, P. B., da Silva, E. and Souza, J. R. (2008) Analysis of FWM penalties in DWDM
systems based on G.652, G.653 and G.655 optical fibers, International Journal of
Electronics and Communication Engineering, 2 (12), 2674-2680.
3. Hiçdurmaz, B., Temurtaş, H., Karlık, S. E. and Yılmaz, G. (2013) A novel method
degrading the combined effect of FWM and ASE noise in WDM systems containing in-line
optical amplifiers, Optik-International Journal for Light and Electron Optics, 124 (19),
4064–4071. doi:10.1016/j.ijleo.2012.12.071
4. ITU-T Recommendation G.671 (2002) Transmission characteristics of optical components
and subsystems, International Telecommunication Union, Geneva, Switzerland.
5. ITU-T Recommendation G.694.1 (2012) Spectral grids for WDM applications: DWDM
frequency grid, International Telecommunication Union, Geneva, Switzerland.
6. ITU-T Recommendation G.984.1 (2008) Gigabit-capable passive optical networks
(GPON): General characteristics, International Telecommunication Union, Geneva,
Switzerland.
7. ITU-T Recommendation G.984.2 (2003) Gigabit-capable passive optical networks
(G-PON): Physical media dependent (PMD) layer specification, International
Telecommunication Union, Geneva, Switzerland.
8. ITU-T Recommendation G.984.3 (2004) Gigabit-capable passive optical networks
(G-PON): Transmission convergence layer specification, International Telecommunication
Union, Geneva, Switzerland.
9. ITU-T Recommendation G.984.3 (2014) Gigabit-capable passive optical networks
(G-PON): Transmission convergence layer specification, International Telecommunication
Union, Geneva, Switzerland.
10. ITU-T Recommendation G.984.4 (2008) Gigabit-capable passive optical networks
(G-PON): ONT management and control interface specification, International
Telecommunication Union, Geneva, Switzerland.
11. ITU-T Recommendation G.984.5 (2014) Gigabit-capable passive optical networks
(G-PON): Enhancement band, International Telecommunication Union, Geneva,
Switzerland.

Ibrahim F.I.M., Karlık S.E.: Combined Impact of SRS & FWM on Downlink Performance of DWDM-GPONs
86
12. Karlık, S. E. (2016a) Analysis of the four-wave mixing impact on the most heavily affected
channels of dense and ultra-dense wavelength division multiplexing systems using non-zero
dispersion shifted fibers, Optik-International Journal for Light and Electron Optics,
127 (19), 7469-7486. doi:10.1016/j.ijleo.2016.05.077
13. Karlık, S. E. (2016b) Analysis of signal-to-crosstalk ratio variations due to four-wave
mixing in dense wavelength division multiplexing systems implemented with standard
single-mode fibers, Uludağ University Journal of The Faculty of Engineering, 21 (2),
171-188. doi:0.17482/uujfe.96713
14. Kaur, G. and Singh, L. M. (2007a) Optimization of interchannel separation in WDM
transmission systems in the presence of fiber nonlinearities, International Conference on
Wireless and Optical Communications Networks WOCN’07, IEEE, Singapore.
doi: 10.1109/WOCN.2007.4284150
15. Kaur, G. and Singh, L. M. (2007b) Effect of four-wave mixing in WDM optical fiber
systems, Optik-International Journal for Light and Electron Optics, 120 (6), 268-273.
doi: 10.1016/j.ijleo.2007.08.007
16. Kaur, G., Singh, L. M. and Patterh, S. M. (2010) Impact of fiber nonlinearities in optical
DWDM transmission systems at different data rates, Optik-International Journal for Light
and Electron Optics, 121 (23), 2166-2171. doi: 10.1016/j.ijleo.2009.11.001
17. Kaur, G., Singh, L. M. and Patterh, S. M. (2011) Analytical analysis of long-haul DWDM
optical transmission systems in the presence of fiber nonlinearities, Journal of Engineering,
Design and Technology, 9 (3), 336-346. doi: 10.1108/1720531111179942
18. Kaur, H., Singh, G. and Kaur, J. (2015) Analysis of stimulated Raman scattering effect in
WDM system, International Journal of Advance Electrical and Electronics Engineering
(IJAEEE), 4 (3), 28-33.
19. Maeda, M. W., Sessa, W. B., Way, W. I., Yi-Yan, A., Curtis, L., Spicer, R. and
Laming, R. I. (1990) The effect of four-wave mixing in fibers on optical frequency-division
multiplexed systems, Journal of Lightwave Technology, 8 (9), 1402-1408.
doi:10.1109/50.59171
20. Nakajima, K., Ohashi, M., Miyajima, Y. and Shiraki, K. (1997) Assessment of dispersion
varying fibre in WDM system, Electronics Letters, 33 (12), 1059-1060.
doi:10.1049/el:19970699
21. Schneider, T. (2004) Nonlinear Optics in Telecommunications, Springer-Verlag,
Berlin Heidelberg New York.
22. Sharma, V. and Kaur, R. (2013), Implementation of DWDM system in the presence of four
wave mixing (FWM) under the impact of channel spacing, Optik-International Journal for
Light and Electron Optics, 124 (17), 3112-3114. doi: 10.1016/j.ijleo.2012.09.049
23. Singh, L. M. and Hudiara, S. I. (2004) A piece wise linear solution for nonlinear SRS effect
in DWDM fiber optic communication systems, Journal of Microwaves and Optoelectronics,
3 (4), 29-37.
24. Song, H. and Brandt-Pearce, M. (2013) Range of influence and impact of physical
impairments in long-haul DWDM systems, Journal of Lightwave Technology, 31 (6),
846-854. doi:10.1109/JLT.2012.2235409
25. Souza, J. R. and Harboe, P. B. (2011) FWM effect of channel allocation with constant
bandwidth and ultra-fine grids in DWDM systems, IEEE Latin America Transactions, 9 (1),
32-39. doi: 10.1109/TLA.2011.5876417


![[3] Neokosmidis Techniques for FWM Suppresion](https://static.fdocuments.in/doc/165x107/577cde0b1a28ab9e78ae468d/3-neokosmidis-techniques-for-fwm-suppresion.jpg)