The Characteristics of Firms that Hire Chief Risk Officers · PDF fileThe Characteristics of...
38
The Characteristics of Firms that Hire Chief Risk Officers Donald Pagach Professor of Accounting Richard Warr* Associate Professor of Finance May 2008 College of Management North Carolina State University Box 7229 Raleigh, NC 27695-7229 The authors gratefully acknowledge support from the Enterprise Risk Management Initiative at North Carolina State University and the Society of Actuaries. We also thank seminar participants at the NC State ERM Research Conference and the 2008 ERM Symposium. * Contact author: 919 513 4646, [email protected]
Transcript of The Characteristics of Firms that Hire Chief Risk Officers · PDF fileThe Characteristics of...
The Characteristics of Firms that Hire Chief Risk Officers
Donald Pagach Professor of Accounting
Richard Warr*
Associate Professor of Finance
May 2008
College of Management North Carolina State University
Box 7229 Raleigh, NC 27695-7229
The authors gratefully acknowledge support from the Enterprise Risk Management Initiative at North Carolina State University and the Society of Actuaries. We also thank seminar participants at the NC State ERM Research Conference and the 2008 ERM Symposium. * Contact author: 919 513 4646, [email protected]
The Characteristics of Firms that Hire Chief Risk Officers
Abstract
Enterprise risk management (ERM) is a holistic method of managing both
operational and strategic risks across an organization. In recent years adoption of ERM
has been increasing. We use a hazard model to examine the factors that influence the
adoption of this practice. We find that larger firms that are more levered, have more
volatile operating cash flows, and have greater institutional ownership are more likely to
initiate an ERM program. However, firms with more growth options and firms that have
experienced greater changes in market value are less likely to adopt ERM. When the
value of the CEO’s option and stock portfolio is increasing in stock volatility, the firm is
also more likely to adopt ERM. Finally we find that banks with lower levels of Tier 1
capital are more likely to adopt ERM. Our results indicate that firms adopt ERM for
reasons consistent with risk management as well as to offset CEO risk taking incentives
and to bolster performance.
JEL Classification Codes: G32.
Key Words: Enterprise Risk Management, Chief Risk Officer, Hazard Model

1
1 Introduction
In recent years, researchers have paid increasing attention to the growing
prominence of Enterprise Risk Management (ERM). In most cases this research has
focused on the process of ERM and the potential gains from adoption. For example,
Nocco and Stulz (2006) argue that the frictionless market view that a firm should not
expend resources on managing idiosyncratic risk is unreasonable in the presence of
market imperfections. Instead they argue that an integrated, holistic, approach to risk
management can be used to create shareholder value. Other papers discuss ERM in
broad terms, and mostly assume that ERM has or will be adopted. For example, Aabo,
Fraser, and Simkins (2005) provide a road map for implementation and Beasley, Clune,
and Hermanson (2005) examine the factors associated with the degree of adoption. There
has, however, been little work examining the types of firms that actually implement
ERM.
In this paper we examine factors that are hypothesized to be drivers of ERM
implementation. Our goal is to shed light on whether firms are engaging in ERM with
the goal of value maximization or whether other incentives are driving the
implementation decision. Our work is related to Liebenberg and Hoyt (2003) who use a
logistic model to examine the particular characteristics of firms adopting ERM.1
Liebenberg and Hoyt find that size and leverage are both related to the decision to
implement ERM, however, many of the other factors in their regression model are
insignificant. Their insignificant results is likely due to a small sample (n=26), and the
1 In a related study, Beasley, Pagach, and Warr (2007) examine the impact of ERM implementation on short-term stock returns and find that firm specific characteristics are important determinants of the stock market reaction to ERM adoption.

2
use of the logistic model. In this application, a logistic model is not necessarily the
appropriate method for testing the significance of a one-time event that can occur through
time. We improve upon the method of Liebenberg and Hoyt (2003) in three ways. First
we use a larger sample of ERM adopters. Second, we measure a wider range of
variables, including the stock and option holdings of managers. And third, we use a Cox
proportional hazard model to measure the importance of the variables in the regression
analysis. The hazard model allows us to examine a large sample of companies, of which
only a proportion choose to adopt ERM, and generates more reliable standard errors than
a logit model.
Our research builds on the existing risk management literature that suggests a
range of factors that may influence the decision to employ traditional risk management.
As ERM is a broader process than traditional risk management, it is unclear whether the
factors that drive traditional risk management also influence ERM adoption. For
example, ERM may be adopted by poorly performing firms in order to signal to investors
that they are attempting to prevent future instances of poor performance. Likewise, if
ERM is being adopted due to regulatory or industry pressures it is doubtful that firms
implementing ERM will differ from non-implementing firms with respect to financial
characteristics, after controlling for industry membership.
The factors that we examine cover a broad range of variables that measure
financial, asset, market and managerial characteristics. Financial characteristics represent
indirect measures of the likelihood of financial distress. Firms that face greater risk of
financial distress and the implicit and explicit costs contained therein may benefit from
ERM when ERM reduces the chance of costly lower tail cash flow outcomes. Asset
3
characteristics measure the potential costs of financial distress, such as the inability to
pursue growth options. Market characteristics measure the potential costs associated with
volatile security performance, such as a higher cost of capital. Finally managerial
characteristics measure the degree to which the CEO’s stock and option based
compensation encourages risk taking or risk avoiding behavior. In addition to examining
industrial and financial firms in general, we also look at the subset of banks in our sample
and examine industry specific variables such as Tier 1 capital ratios.
As a preview of our results, we find that larger firms that have greater risk of
financial distress, i.e. those with more leverage, and more volatile operating cash flows
are more likely to adopt ERM, as proxied by hiring a Chief Risk Officer (CRO). We find
that firms with more growth options, as proxied by a firm’s market-to-book ratio, are less
likely to hire a CRO. This finding may reflect a preoccupation with ERM in firms that
have lower quality growth options and are trying to create value by focusing more
attention on business opportunities currently in place, and believing that ERM will boost
the bottom line (a commonly touted claim by ERM proponents).
We find that firms with CEOs that have incentives to take risk, based on option
compensation, are also more likely to hire a CRO. This result appears counterintuitive,
but is consistent with boards making the CRO appointment to provide a control against
the CEO’s risk taking incentives.
Look at our banking sub sample, we find that banks with lower capital ratios are
more likely to pursue ERM, consistent with them focusing on managing operational risk
in the presence of greater leverage risk.

4
Our paper proceeds as follows; Section 2 presents a literature review and develops
our hypothesis. Section 3 presents the data. Section 4 presents the univariate results and
Section 5 presents the multivariate hazard model results. Section 6 concludes.
2 Literature Review and Hypothesis Development
Risk management has evolved from a narrow view that focused on corporate
insurance and hedging to a holistic, all risk encompassing view, commonly termed
Enterprise Risk Management (ERM).2 ERM is a management process that requires a
firm’s management to identify and assess the collective risks that affect firm value and
apply an enterprise wide strategy to manage those risks (Meulbrock, 2002). The
Committee of Sponsoring Organizations of the Treadway Commission (COSO) in its
ERM framework defines ERM as
(A) process, effected by an entity’s board of directors, management and other
personnel, applied in a strategy setting and across the enterprise, designed to
identify potential events that may affect the entity, and manage risk to be
within its risk appetite, to provide reasonable assurance regarding the
achievement of entity objectives (COSO, 2004).
Although there is little empirical research on ERM there have been a number of
case studies and surveys that have examined the implementation process and explored the
benefits of ERM. For example, Aabo, Fraser, and Simkins, (2005) discuss ERM
implementation at Hydro One (a Canadian utility). The conclusions of their study
provide a useful framework for understanding the ERM process. In Hydro One’s case,
the primary goal of ERM is not risk reduction. Instead the firm focuses on using ERM to
2 See Tufano, (1996); Liebenberg and Hoyt, (2003); Beasley et. al. (2005); and Slywotzky and Dzik (2005) for discussions of the development and adoption of ERM.

5
achieve a balance between operational risks and returns and to control the risk from lower
left tail cash flow events (essentially big losses). The ERM process starts with first
identifying all of the risks facing its business, and then assessing the consequences of
these risks along with the controls in place to respond to the risks. Management then
decides whether to tolerate a risk or mitigate a risk. While this process is consistent with
traditional management of risks such as interest rate risk, ERM differs in that it attempts
to manage all risks, including operational and reputational risks that normally can not be
hedged. It is this examination of all risks facing the firm and the attempt to manage the
risks in a holistic manner that separates ERM from traditional silo based risk
management.
Despite increased adoption, the realized benefits of ERM are subject to debate, as
in a frictionless capital market, risk management is a negative NPV project.3 The key to
value creation by ERM thus depends on the presence of capital market frictions. Several
researchers have examined this issue. For example, Guay and Kothari, (2003) find that
hedging can be beneficial to the firm in the presence of such frictions and Nocco and
Stulz (2006) and Stulz (1996, 2003) argue that risk management activities could be value
increasing for shareholders in the presence of agency costs and market imperfections.
ERM could be value creating if it reduces the probability of large negative cash
flows (or “costly lower tail outcomes”) through the coordination of risks across the
enterprise and ensures that no single project risk has an adverse effect on the firm overall
(Stulz, 1996, 2003). But it is only firms that face these lower tail outcomes that will
3 Beasley, Pagach and Warr (2007) find no significant stock price reaction (positive or negative) to ERM adoption.
6
benefit from ERM, as other firms will see no benefit and could destroy value by spending
corporate resources on ERM.
Lower tail outcomes have direct and indirect costs. Events such as bankruptcy
and financial distress involve direct outlays to creditors, lawyers and courts. Indirect
costs include the inability to pursue profitable growth options, the loss of customer
confidence, and the inability to realize the full value of intangible assets upon liquidation.
A decline in debt ratings and the resulting increase in borrowing costs can also be costly
for shareholders.
Managers who own stock in their company will have an undiversified equity
portfolio and will bear a greater proportion of the cost of a lower tail event than a fully
diversified shareholder. In an efficient labor market, these managers will demand higher
compensation for bearing this idiosyncratic risk. Other stakeholders, such as suppliers,
may be reluctant to enter into long term contracts with the firm if the potential for future
payment is uncertain. All of these problems can result from the possibility of costly
lower tail outcomes and represent value creating opportunities for a risk management
program. The market imperfections that we examine are the result of lower-tail outcomes
that produce costs associated with financial distress, external financing and managerial
risk aversion. Our study complements Nance, Smith and Smithson (1993) who examine
firms’ use of hedging instruments and Guay and Kothari (2003) who examine the
hedging activities of non-financial firms.
In our study, we proxy for ERM adoption with the hiring of a Chief Risk Officer
because corporations tend only to disclose minimal details of their risk management
programs (Tufano, 1996). There are, however, good reasons to believe that CRO hiring

7
coincides with the decision to follow an ERM program. For example, The Economist
Intelligence Unit, (2005) reports that many organizations appoint a member of the senior
executive team, often referred to as the chief risk officer or CRO, to oversee the
enterprise’s risk management process. Walker, et. al. (2002) note that because of its
scope and impact, ERM requires strong support from senior management. Beasley et al.
(2005) show that the presence of a CRO is associated with a greater stage of ERM
adoption.
We examine firm-specific variables that reflect the likelihood and cost of a firm
experiencing a lower-tailed event either through increasing the chance of financial
distress or increasing the costs associated with such distress. We also attempt to shed
light on the impact of managerial incentives on ERM implementation. These variables
are grouped into four broad categories. The first; financial characteristics, represent
indirect measures of the likelihood of financial distress. Firms that face greater risk of
financial distress and the implicit and explicit costs contained therein may benefit from
ERM. These variables include leverage, financial slack and operating cash flow
volatility. We hypothesize that firms with more leverage and less financial slack will be
more likely to implement ERM. Firms with greater operating cash flow volatility are
more likely to experience lower tail earnings outcomes.
The second category measures asset characteristics and proxies for the potential
costs of financial distress – such as the inability to pursue risky but profitable future
projects. These variables include, asset opacity, Research and Development intensity and
growth options. We hypothesize that firms with more opaque assets, greater R&D
expense and more growth options are more likely to benefit from ERM.

8
The third category measures market performance and the volatility of the firm’s
stock returns. We hypothesize that firms with more volatile stock prices are more likely
to benefit from ERM. Furthermore, firms that have seen a reduction in value, either as a
result of poor stock performance or capital structure changes may implement ERM as a
means to convince investors that they are addressing operational issues in order to avoid
future poor performance.
The final category measures managerial incentives to protect their own
undiversified investment portfolios, or the degree to which their incentives are aligned
with those of investors. We compute the partial derivatives of the CEO’s stock and
option holdings with respect to the stock volatility and the stock price (as in Rogers,
2002). The ratio of these measures captures the risk taking incentives of the CEO. We
hypothesize that those CEOs who have compensation portfolios that are more sensitive to
volatility (such as close to the money options) will avoid ERM and programs that might
try to reduce risk.
Our remaining variables control for industry membership, operating segments and
institutional ownership. Later in the paper we include additional bank specific variables
when we examine the bank sub sample.
3 Data and Method
Our study starts with 138 announcements of senior risk officer appointments
made from 1992-2005 for which we are able to obtain all the necessary data for our tests.
Announcements are obtained by searching the business library of LEXIS-NEXIS for
announcements containing the words “announced”, “named”, or “appointed”, in
conjunction with position descriptions such as “chief risk officer” or “Vice-President -

9
Enterprise Risk Management”.4 Only announcements for publicly traded companies
were retained and in the case of multiple announcements for the same company we
selected only the first announcement on the assumption that this represented the initiation
of the risk management program.
By using the LEXIS-NEXIS database we hope to capture each firm’s first
appointment of an executive overseeing an enterprise level risk management program
however, it is possible that some appointments, although being the first announcements,
are not actually the first appointments. These announcements will add noise to our
sample and reduce the power of our tests. It is also possible that we have excluded
executives from our sample that oversee an enterprise risk management program but have
titles that are excluded from our search. Lam (1999) points out that some risk
management executives have titles such as Chief Market and Credit Officer, but these
positions may not be primarily focused on ERM. This will result in a misclassification of
firms in our model and again reduce the power of our tests.
We collect data for all firms listed in Compustat from 1990 to 2005. We
supplement the data with stock price data from CRSP and 13-F ownership data. In a
subset of tests we include a variable to measure the sensitivity of the CEO’s
compensation to the volatility of the stock price. The data for this variable comes from
ExecuComp, but is only available for the S&P 1500 firms, and thus reduces the number
of CRO hire firms in our sub sample to 77. The full data set is an unbalanced panel in
which CRO hirings are indicated by a dummy variable that takes the value 1 in the year
that they are made, and zero otherwise.
4 We searched for the following titles: Director, Vice-President, Chief, Senior, Executive, Head, Manager, and Managing Director.

10
Table 1 presents the distribution of the announcements through time as well as the
distribution across industries. Most CRO hires tend to be in the later part of the sample
period, clustered around 1999 through 2002. A substantial portion of the appointments
are located in the financial and utility industries. These are defined in our sample as
having SIC codes in the 6000s for financial firms and in the 4900s for utilities.
In our multivariate analysis we examine variables that are either hypothesized
determinants of the CRO hire decision or are control variables. These variables are
grouped together and defined as follows:5
3.1 Financial Characteristics
3.1.1 Leverage
Firms with greater leverage are more likely to suffer from financial distress than
firms with low leverage.
Leverage= Total Liabilities/Total Assets = (d6 – d60)/d6 (1)
3.1.2 Cash ratio
Cash Ratio measures the amount of highly liquid assets that the firm has on hand
that could be used to make up a short fall in operating cash flows.
Cash Ratio = Cash and Marketable Securities/Total Assets = d1/d6 (2)
3.1.3 Operating cash flow volatility
Firms with more volatile operating cash flows are more likely to benefit from
ERM if the goal of ERM is to smooth cash flows. Smoothing cash flows reduces the
5 Where applicable, the Compustat data items (d#) used to compute the variables are shown.

11
probability of experiencing a lower tail cash flow outcome SDCF is the standard
deviation of the error term from a regression of the firm’s quarterly operating cash flow
on the prior quarter’s operating cash flow. This regression is run for eight quarters.6
3.1.4 Size
We control for size using the log of the market value of equity of the firm at the
fiscal year end prior to the CRO hire announcement.
3.2 Asset Characteristics
Asset characteristics measure the potential costs of financial distress, and proxy
for the potential unrecoverable losses that may be incurred in financial distress.
3.2.1 Opacity
Firms that have opaque assets may have difficulty selling these assets at purchase
cost to avert financial distress, as opaque assets are associated with more information
asymmetry thus and thus are more likely to be undervalued. Opacity is computed as:
Opacity = Intangibles/ Total Assets = d33/d6 (3)
3.2.2 Growth options
Firms with growth options have much of the firm’s value tied to future, and as
yet, unrealized cash flows. Because of the uncertain nature of the payoff from such
expenditures, the value of these investments are unlikely to be fully realized in
bankruptcy, thus ERM may be favored by firms with higher growth options. We proxy
6 Our results are quantitatively unchanged if we use the standard deviation of EPS as the volatility measure.

12
for growth options using market-to-book (MB) and Research and Development expense
(RD). These variables are computed as:
MB = Market Value of Equity/ Book Value of Equity = (d199*d25)/d60 (4)
RD = Research and Development Expense / Total Assets = d46/d6 (5)
3.3 Market Characteristics
Market characteristics measure the volatility of the firm and the stock price
performance. SDRET is the standard deviation of the firm’s daily returns over the year
prior to the hiring of the CRO.
Firms that have experienced significant growth in size, either due to stock price
performance or acquisitions, may see a need for greater enterprise risk management
oversight. Therefore we compute the value change (Value Change) as the percentage
change in market value of the firm over the year prior to the hiring of the CRO.
3.4 Managerial incentives
Executive stock and option based compensation can affect the incentives of
executives by altering their risk preferences. CEOs that have a large proportion of option
based compensation are more likely to prefer strategies that increase the volatility of the
firm’s stock – thus increasing the value of their option holdings. Conversely, CEOs with
larger stock holdings hold undiversified portfolios which are overweighted in their
company’s stock. These CEOs may prefer strategies that reduce overall stock
idiosyncratic risk. The distinction between option and stock compensation is further
complicated by the degree to which the option is in the money. Very in the money
options provide stock-like incentives compared to at the money or underwater options.
13
Therefore, measuring option and stock based compensation requires more than just
summing the value of the CEO’s holdings.
We use the approach of Rogers (2002) who builds upon Core and Guay (2002).
Rogers computes a proxy that incorporates CEO incentives to increase risk relative to
incentives to increase stock price. This proxy combines the partial derivative of the
dividend adjusted Black-Scholes equation with respect to the standard deviation of stock
returns and the partial derivative of the Black Scholes equation with respect to the level
of the stock price. The first measure, Vega, measures the incentive to take risk and the
second measure, Delta, measures the incentive to increase stock price. We compute Vega
and Delta for each CEO’s stock and option portfolio and use the ratio (as in Rogers,
2002) of the two variables – Vega to Delta as our proxy for the CEO’s risk taking
incentives.7 The full details of the comp of Vega and Delta are contained in the
appendix.
3.5 Controls
Firms with more operating segments (Numseg) are likely to be able to diversify
operating and financial risks within the firm and may have less need of ERM. However,
as the number of operating segments increase the range of businesses and risks that the
firm is involved in could increase the need for an overall holistic view of risk
management. Firms with greater institutional ownership may have greater pressure to
install controls associated with ERM. We measure institutional ownership as the
percentage of the firm’s stock held by institutional investors as recorded in 13-F filings.
This variable is designated as PINST. The number of institutional investors is designated
7 For the stock holdings, vega = 0 and delta = 1.

14
as NINST. Finally, we control for industry membership – specifically whether the firm is
a financial firm or a utility and firm size.
4 Univariate Results
Table 2 presents summary statistics for the main variables. In addition to
providing means and medians of the CRO sample and the sample as a whole, the table
presents results of tests of the means (t-tests) and medians (sign-rank tests). Note that
CRO firms are in the main sample until the year in which they hire a CRO.
The CRO hiring firms tend to have more volatile cash flows and tend to be larger,
more levered and have lower cash ratios than the non-hiring firms. These results are to
be expected in that CRO hires tend to be more prevalent among financial firms. CRO
hiring firms tend to be less opaque than non-hiring firms in that they have lower Opacity,
Market-to-Book and Research and Development expenses. These findings are counter to
our hypothesis that firms with more opaque assets and more growth options will tend to
try and protect those future revenue sources through risk management. These results are
most likely being heavily influenced by large number of financial firms in the hiring
sample. The multivariate results will allow us to separate out these affects after
controlling for industry. CRO hiring firms tend to have less volatile stock prices. The
hiring firms have also seen poorer stock performance in the period before the hiring
announcement (as evidenced by the value change variable).
In examining compensation, Vega to Delta for the hiring firms is higher than for
the non-hiring firms, a result that runs counter to our expectation that firms with volatility
preferring CEOs will not choose ERM. Finally we find that the hiring firms have more

15
segments and more institutional ownership than the non-hiring firms, but again these
results may be picking up other effects, such as size.
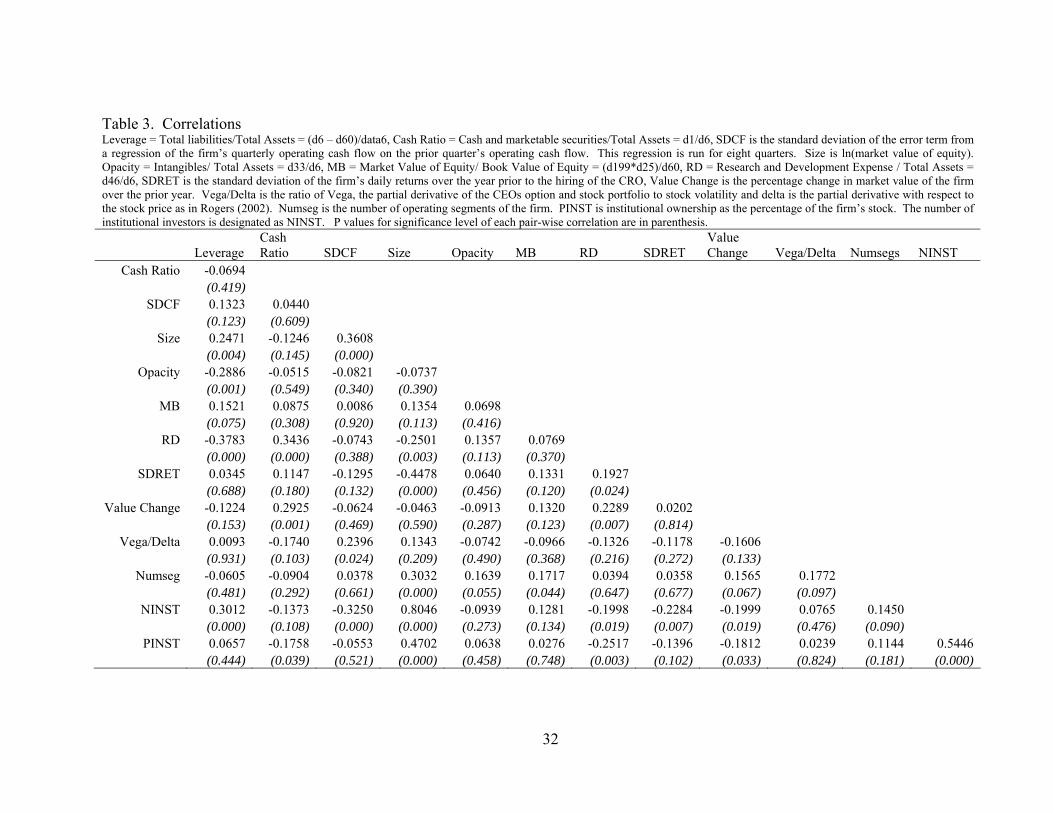
In Table 3 we examine correlations between our key variables. Somewhat
unsurprisingly, size is correlated with many of the other variables in manners which
might be expected. For example, larger firms tend to have less earnings and stock
volatility (SDEBIT and SDRET). Vega to Delta shows little correlation with most of the
other variables of interest.
5 Multivariate Determinants of CRO Hiring Announcements
In this section we focus on the multivariate determinants of the CRO hire
decision. An important contribution of this paper is the econometric approach that we
use to model the relation between the CRO appointment decision and firm characteristics.
Typically, binary decisions of this type are modeled using a “static model”, so called by
Shumway (2001), in which a logit regression is run on a data set that is comprised of the
dates on which CROs are hired. On each of these dates, a “hire” dummy variable is
created and coded 1 for the firms that have hires, while the other non-hire firms are coded
zero. This approach ignores information contained in the time periods on which there are
no CRO hires.
An alternative approach is to use the full time series of data, including those
periods during which no hiring event occurs. For the periods with no hirings, the
dependent binary variable is zero for every firm in the data set. The data set is not a
traditional panel data set but more correctly termed an event history data set, which
reduces in observations each time a firm hires a CRO and thus exits from the data set.
This approach has been used by other authors including Pagano, Panetta and Zingales

16
(1998) to model the IPO decision and Denis, Denis and Sarin (1997) to model executive
turnover.
Using a logit model to estimate the parameters of an event history data set will
produce incorrect test statistics because of the assumption that all the observations for a
firm are independent. To see this lack of independence, consider that an event on day t=1
can only be preceded by a non event on day t=-1. A hazard model overcomes this
problem, and can incorporate the impact of time on the hiring decision. Hazard models,
commonly used in medical research, model an event (in this case a CRO hire) as a
function of the determinants of the event.8 The hazard model approach takes account of
the evolution of a firm’s characteristics and computes a hazard ratio of the firm hiring a
CRO, whether or not the firm actually hires. The parameter estimates of the hazard
model should be similar to those of the logit model (using a full event history data set),
but the hazard model produces superior test statistics. We estimate the following hazard
model:
CROHIREit = f(Financial Characteristicsit, Asset Characteristicsit, Market
Characteristicsit, Managerial Characteristicsit, Controls) + eit (6)
We use a Cox proportional hazard function to estimate equation 6. The Cox
model is a semi parametric model in which the likelihood of the event is not related to
elapsed time. The subscript i represents each firm in the data set that could have a CRO
hiring announcement, but has not yet had one. The subscript t represents every year from
1990 to 2005. The dependent variable, CROHIRE is a binary variable that takes the
8 In addition to those cited, several other authors use hazard models in finance research, for example Johnson (2004), Ongena and Smith (2001) , McQueen and Thorley (1994), Deshmukh (2003) and Danielsen, Van Ness and Warr (2007).
17
value of 1 if the firm announces the appointment of a CRO, and zero otherwise. For the
years prior to a CRO hiring, CROHIRE=0. Once a CRO is hired, the observation drops
out of the data set. Therefore, a firm can have a maximum of one observation with
CROHIRE=1. The independent variables are estimated as of the beginning of the fiscal
year in which the CRO is hired.
5.1 Hazard Model Results
Table 4 presents the results of our basic hazard model estimation. Interpreting the
economic significance of the coefficients requires estimating the increase in the
likelihood of the event, in this case a CRO hire, given a change in the independent
variable of interest. Commonly, standardized hazard ratios are computed by calculating
the effect of a one standard deviation shift for each independent variable. However,
several of the variables in our study are right-tail skewed, and consequently have large
standard deviations, which may make cross-sectional comparisons misleading. We
therefore closely follow the approach of Danielsen, Van Ness and Warr (2007) and
consider a change in each right-hand-side variable equal to 10% of the variable’s mean
value. This measure is referred to as a 10%-of-mean-standardized hazard ratio to avoid
confusion with a ratio based on standard deviations. Because hazard ratios are easier to
interpret when the coefficient estimates are positive, we use the absolute value of each
coefficient to estimate our 10%-of-mean-standardized hazard ratio. The 10%-of-mean-
standardized hazard ratio (Std HR) is computed as:
meancoefeHRStd ××=
1.0 (7)
Table 4 presents our base model for the full sample. The first column “HR” is the
hazard ratio, the second “Coef” is the coefficient and the third column “Std HR” is the

18
“10%-of-mean-standardized hazard ratio”. The last column of the table labeled “mean”
is the mean of the variable and is used in the computation of the “Std HR” column.
We find that leverage and size are positively related to the likelihood of hiring a
CRO. A 10% increase in leverage will result in a 7.1% increase in the likelihood of a
hire.9 This result is consistent with firms that are more levered are at a greater risk of
financial distress. The economic significance of the size variable is particularly large,
indicating a 10% increase in size will increase the likelihood of a hire by 22.6%.
Furthermore, for the standard deviation of cash flows, SDCF, a 10% increase will result
in a 1.0% increase in the likelihood of a hire. We find no relation for the Cash Ratio
variable.
Of the variables that proxy for the asset characteristics, RD and MB are both
significant and negative (the HR is less than 1, resulting in a negative coefficient which is
the log of HR).10 This result is counter to our hypothesis that firms with more growth
options and RD investments will seek to protect these through ERM. It is possible that
higher growth firms are less concerned with overall enterprise risk management because
they are focusing on growth opportunities. Conversely, stable and mature growth firms
are looking to improvements (through ERM) in their day-to-day management of
operations.
Examining the market variables, we find that only Value Change is significant.
The Value Change variable is negative and significant, indicating that the probability of a
hire is negatively related to recent change in market value of the firm. In unreported
regressions, we replace the value change variable with the year on year price change and
9 This magnitude is obtained from the Std HR value of 1.071 which implies that an increase of the mean of the independent variable by 10% will increase the hazard likelihood l.071 times or 7.1%. 10 For example, a 10% decline in R&D will result in a 3.7% increase in the probability of hiring a CRO.

19
find that the price change variable is insignificant. The value change variable therefore
appears to be picking up changes in the size of the firm, rather than just stock market
performance. That the value change variable is negative suggests that firms that have
experienced recent rapid growth either due to acquisitions or capital structure changes are
less likely to appoint a CRO. This result runs counter to the size variable which
indicates that larger firms are more likely to appoint CROs.
Looking at our control variables we find that the number of segments is negative,
yet insignificant. This result may reflect the dual effects of diversification on risk
management. On one hand we would expect more diversified firms to have less need for
ERM as these firms have more opportunity to engage in operational hedges.11 That firms
appear to use diversification instead of risk management is supported by other authors.
For example, Hankins (2008) reports evidence that firms use operational hedges as
substitutes for financial hedging, and Thomas (2002) finds that diversified firms have
more predictable earnings. Alternatively, we might expect a larger more diverse
organization to be a good candidate for ERM given the wide range of uncoordinated risks
that it faces.
PINST (the percentage of shares held by institutions) is positive and significant,
consistent with an institutional desire for greater risk management. Finally, both the
financial firm and utility firm dummy variables are positive and highly significant
consistent with a preference among these firms for implementing ERM. The significance
of these two industries is consistent with previous research (see for example Beasley, et
al, 2007). These industries may be implementing ERM earlier for a number of reasons.
11 As we stated earlier, we might expect firms that have more segments will have a greater need for risk management in order for them to coordinate a broader range of risk exposures.
20
Both industries are highly regulated with compliance with government regulators being
an important issue. In both industries traditional risk management practices are more
entrenched and the move to examine risks in a holistic manner may be more easily
implemented.
As a robustness check to determine if the results are being driven by regulated
firms, we re-ran the table 4 regression model on the non-financial, non-utility firms in the
sample. In unreported results we find that size and operating cash flow volatility remain
significant predictors of CRO appointments. Furthermore, we find that the negative
relation between appointments and the value change variable and the RD variable persist
in this sub sample.
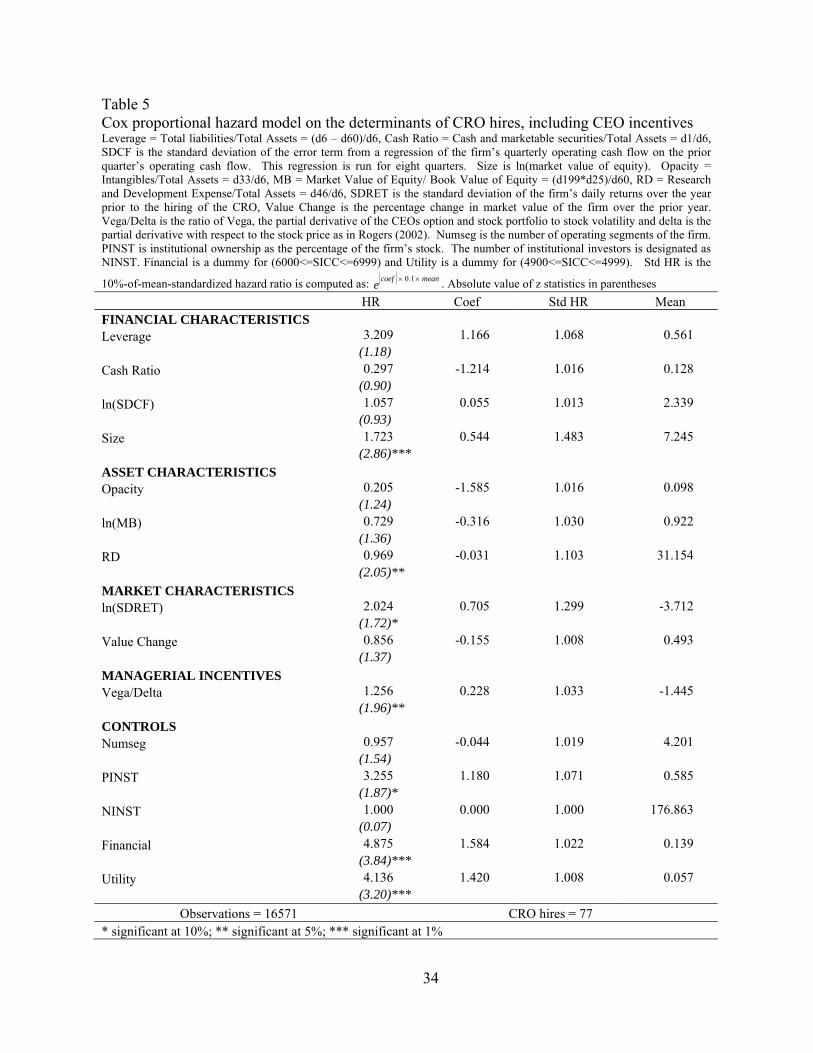
5.2 CEO incentives
In Table 5 we explore the effect of CEO compensation on the CRO hire decision.
As we stated earlier, data on CEO compensation is only available for a sub set of our
firms, and hence we have a reduced sample size. We measure CEO incentives using the
ratio of Vega to Delta, as in Rogers (2002). A higher value of this ratio indicates that the
value of the manager’s compensation is more sensitive to stock volatility.12 In Table 5,
the coefficient on Vega to Delta is positive and significant indicating that as CEOs
compensation packages become more sensitive to stock volatility, the likelihood of hiring
a CRO increases. This result appears to be at odds with the incentives of a CEO to
maximize his/her own personal wealth, as one would expect a rational CEO who has
much of his/her compensation in the form of at the money options to prefer that the firm
12 This variable does not include cash based bonus compensation. In unreported results we included the bonus as a percentage of total compensation, but found it to be insignificant. One problem with using bonus as part of this variable is that it is very difficult to estimate the delta for bonus, i.e. the sensitivity of the bonus to stock price performance.

21
be more risky. If, however, ERM reduces downside risk without impacting upside risk,
the CEO should rationally embrace ERM even if the CEO has an incentive to take risks
and gets rewarded in the upside.13
It is generally not the CEO that makes the decision to implement ERM; indeed it
is the board of directors that usually leads this initiative (Lam, 2001), although during this
time period, quite a few CEOs also held the board chairman position. Thus a possible
explanation for this result is that the board recognizes that the CEO has an incentive to
increase risk and therefore by implementing a risk management program controls the risk
that is expected to be taken on by the CEO. From the board’s point of view this is a
rational strategy – to effectively encourage risk taking by the CEO and at the same time
implement a program to actively manage, coordinate and understand these risks.
We also note that the value change variable in this regression specification
becomes insignificant. In unreported tests, we re-run this regression on the smaller
sample, caused by the data limitations of the vega to delta variable, but without vega to
delta and find that the value change variable remains insignificant. We are forced to
conclude therefore that the value change variable is quite sensitive to the sample size
employed in the regressions.
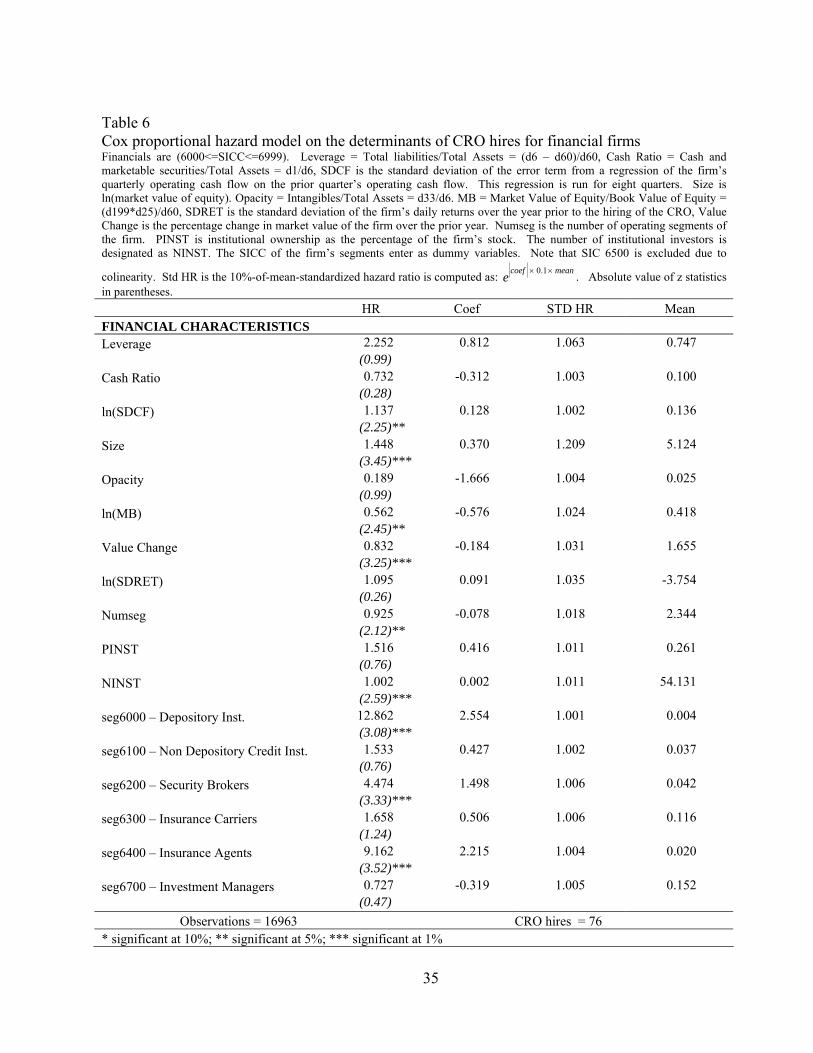
5.3 Financial Firms
The financial firm dummy in table 4 is highly significant indicating the
importance of ERM to this industry group. To explore this result in more detail, we
restrict our analysis to financial firms (SICC: 6000-6999) alone. Table 6 repeats the
13 We thank the referee for suggesting this explanation.

22
analysis from Table 4 for our sub sample of financial firms.14 In this regression
specification we add dummy variables for the major financial sub-industries in which the
firm’s segments operate.15 The results show that the coefficients on operating cash flow
volatility, size, market-to-book, number of institutions, and value change and number of
segments are significant. These results are largely consistent with the main results from
Table 4. We also find that segments with SICC 6000 (depository institutions), 6200
(brokers) and 6400 (insurance agents) are significantly positive. Thus, the adoption of
ERM is not uniform throughout the financial industry.
Table 7 investigates banking institutions (SICC 6000 and 6099) in more detail.
We add three new variables to the analysis; Tier 1 Capital ratio (Compustat item 337),
provision for loan losses (item 342) as a percentage of assets, and a proxy for duration
gap. Duration gap requires computation of the duration of the bank’s assets and
liabilities. Given data restrictions we adopt a more simple approach and compare the
annual change in the bank’s assets to the change in the bank’s liabilities as in Choi
(2007).
AssetsAssetsDUR RATIO Liabilities
Liabilities
Δ
= Δ (8)
Table 7 presents the results of this regression. Notably, operating cash flow
volatility remains a significant determinant of the CRO hire. We also find that Tier 1
Capital is negatively related to the CRO hire decision. Thus firms with lower Tier 1
Capital are more likely to employ a CRO and manage risk. This result is consistent with
14 In unreported tests we repeat the analysis for utility stocks and find that size and cash flow volatility remain important determinants of CRO hiring for these firms. 15 In this regression we exclude R&D.

23
our hypothesis that the firms with high costs of financial distress, or operate in a highly
leveraged state are the greatest beneficiaries of ERM. The loan loss or duration variables
are insignificant.
6 Conclusion
We use a hazard model to examine the determinants of the firm’s decision to
adopt enterprise risk management (ERM) which we proxy for with the hiring of a Chief
Risk Officer (CRO). The hazard model generates reliable test statistics when a time-
series panel data set is used. This approach, coupled with a larger sample, and more
explanatory variables, represents an important contribution over previous work in this
area.
We find that firms adopting ERM are doing so for some reasons that are
consistent with the hypothesized benefits of ERM. For example we find that firms
appear to implement ERM when they are larger, have more volatile cash flows, and
greater leverage. We also find evidence consistent with firms implementing ERM for
what might be considered to be non-risk management reasons. We find a negative
relation between CRO hiring and the change in the size of the firm. This result does not
appear when we examine the change in the stock price. Thus we conclude that firms that
have grown rapidly are less likely to adopt ERM – this result could be a result of the
firms naturally diversifying through growth. We also find that firms that hire CROs tend
to have fewer growth options. We suspect that this result may be due to ERM being
favored by more stable firms, who, in the absence of high growth projects, implement
ERM in the belief that it will boost their bottom line.

24
Other authors find a direct relation between CEO risk taking incentives (option
versus stock compensation) and hedging activity. This relation is normally negative in
that the more risk taking incentives that the CEO has, the less likely the firm is to hedge.
In our tests, the correlation is positive as we find that the likelihood of ERM adoption is
increasing in the risk taking incentives of the CEO. A possible explanation for this result
is that boards are implementing ERM to offset the risk taking incentives that they have
granted to the CEO. This explanation is consistent with ERM being implemented at the
direction of the board, whereas day to day hedging may be driven more by management.
When we consider financial firms alone we find that ERM adoption is more
prevalent among depository institutions and brokers. Furthermore we find that banks
with lower Tier 1 Capital are more likely to hire a CRO, consistent with these highly
levered banks needing to have greater awareness of the portfolio of risks facing them.
While our study provides detail into the decision of firms to implement ERM
there are limitations. Due to the lack of disclosure by firms about their risk management
programs we proxy the decision to adopt ERM by the hiring of a Chief Risk Officer.
Further study of the implementation process is needed to understand the evolution of
firms’ ERM programs. Additionally, further research is needed to understand the Chief
Risk Officer’s role within the firm; ideally this research should focus on the hiring
process and the reporting relationship. The evolution and inner details of firms’ ERM
programs are an important topic for further study.

25
Appendix: Computing Vega and Delta for the CEO’s Stock and Option
Holdings
We follow Rogers (2002), who in turn follows Core and Guay (2002) in
computing the option sensitivities to volatility and price. Delta measures the option
value’s sensitivity with respect to a 1% change in stock price and Vega measures the
option value’s sensitivity to a 0.01 change in standard deviation. These values are
computed as:
Delta: { }100
)(exp100
SZNdTSS
Value−=
∂∂ (A.1)
Vega: { }[ ]TSZNdTValue )(exp01.001.0 ′−=×∂
∂σ
(A.2)
where:
TdrTXSZ
σσ )2/()/ln( 2+−+
=
N(·) is the cumulative probability function for the normal distribution, N′(·) is the
normal probability density function, S is the share price of the stock at the fiscal year-
end, d is the dividend yield as of fiscal year-end, X is the exercise price of the option, r is
the risk free rate. We use the risk free rate provided in ExecuComp. σ is the annualized
standard derivation of daily stock returns measured over 120 days prior to fiscal year-end
and T is remaining years to maturity of option.
The data for estimation is from ExecuComp (and originally from the proxy
statements), however, the exercise price and maturity are only available for current years
option grants. Therefore to estimate prior years exercise prices and maturities we follow
the Core and Guay (2002) algorithm, which is detailed on page 617 of their paper. The

26
proxy statement provides realizable values of options grants (i.e. the excess of the stock
price over the exercise price). Because X and T are computed separately for new options,
the number and fiscal year-end realizable value of new options must be deducted from
the number and realizable value of unexercisable options. Dividing unexercisable
(excluding new grants) and exercisable realized values by the number of unexercisable
and exercisable options held by the executive, respectively, yields estimates of, on
average, how far each of the groups of options are in the money. Subtracting this number
from the stock price yields the average exercise price. The exercise price is computed for
exercisable and unexercisable options. The time to maturity for the exercisable options is
the maturity of the new grants less one year (or nine years if no new grant is made). For
the unexercisable options, the time to maturity is the maturity of the new grants less three
years (or six years if no grant is made).
We treat the stock holdings of the CEO as having a vega of zero and a delta of
one and include them in the computation of vega to delta.
27
References
Aabo, T., J. Fraser, and B. Simkins, (2005). The rise and evolution of the chief risk officer: Enterprise risk management at Hydro One. Journal of Applied Corporate Finance 17 (3), 62-75.
Beasley, M., R. Clune, and D. Hermanson, (2005). Enterprise risk management: An
empirical analysis of factors associated with the extent of implementation. Journal of Accounting and Public Policy, 24 (6), 521-531.
Beasley, M., D. Pagach and R. Warr (2007). The information conveyed in hiring
announcements of senior executives overseeing enterprise-wide risk management processes. Journal of Accounting, Auditing and Finance, forthcoming.
Choi, Y., (2007) “Duration Ratio” as a New Risk Measure in Bank Risk Management.
University of Central Florida working paper. Committee on Sponsoring Organizations (COSO) (2004). Enterprise Risk Management-
Integrated Framework. COSO, New York. Core, J., and W. Guay, (2002). Estimating the value of employee stock option portfolios
and their sensitivities to price and volatility. Journal of Accounting Research, 40, 613-630.
Danielsen, D., B. Van Ness and R Warr, (2007). Reassessing the impact of option
introductions on market quality: A less restrictive test for event-date effects. Journal of Financial and Quantitative Analysis, forthcoming.
Denis, D., D. Denis and A. Sarin. (1997). Agency problems, equity ownership, and
corporate diversification. Journal of Finance, 52, 135-160. Deshmukh, S. (2003). Dividend initiations and asymmetric information: A hazard model.
Financial Review, 38, 351-368. Economist Intelligence Unit. (2005). The evolving role of the CRO, The Economist
Intelligence Unit, London/New York/Hong Kong (May). Guay, W., and S. Kothari. (2003). How much do firms hedge with derivatives? Journal
of Financial Economics, 70, 423-461. Hankins, K., (2008) “How Do Firms Manage Risk? The Interaction of Financial &
Operational Hedging”, University of Kentucky working paper. Johnson, T., (2004). Forecast dispersion and the cross section of expected returns.
Journal of Finance, 59, 1957-1978.

28
Lam, J., (1999) Enterprise-wide risk management and the role of the chief risk officer. ERisk, March25, 1999 [online]. Available from http://www.erisk.com/Learning/Research/011_lamriskoff.pdf; accessed March 28, 2008.
Lam, J., (2001). The CRO is here to stay. Risk Management, 48 (4) (April), 16-22. Liebenberg, A., and R. Hoyt, (2003). The determinants of enterprise risk management:
Evidence from the appointment of chief risk officers. Risk Management and Insurance Review 6 (1), 37-52.
McQueen, G. and S. Thorley, (1994). Bubbles, stock returns, and duration dependence.
Journal of Financial and Quantitative Analysis, 29, 379-401. Meulbrock, L., (2002) A Senior Manager’s Guide to Integrated Risk Management,
Journal of Applied Corporate Finance, 14 (4), 56-70. Nance, D., C. Smith, Jr., and C. Smithson, (1993) On the determinants of corporate
hedging, Journal of Finance 48, 267-284. Nocco., B. and R. Stulz, (2006). Enterprise risk management: Theory and practice. Ohio
State University working paper Onega S. and D. Smith., (2001). The duration of bank relationships. Journal of Financial
Economics, 61, 449-475. Pagano, M., F. Panetta and L. Zingales., (1998) Why do companies go public? An
empirical analysis. Journal of Finance, 53, 27-64. Rogers, D., (2002). Does executive portfolio structure affect risk management? CEO
risk-taking incentives and corporate derivatives usage. Journal of Banking and Finance, 26, 271-295
Shumway, T., (2001). Forecasting bankruptcy more accurately: A simple hazard model.
Journal of Business, 74, 101-124. Slywotzky, A. and J. Drzik, (2005). Countering the biggest risk of all, Harvard Business
Review, (April), 78-88. Stulz, R., (1996). Rethinking risk management, Journal of Applied Corporate Finance, 9,
3, 8 Stulz, R, (2003). Rethinking risk management, The Revolution in Corporate Finance, 4th
Edition, Blackwell Publishing, 367-384.

29
Thomas, S., (2002). “Firm Diversification and Asymmetric Information: Evidence from Analysts’ Forecasts and Earnings Announcements,” Journal of Financial Economics, 2002, Vol. 64, pp. 373-396
Tufano, P., (1996). Who manages risk? An empirical examination of risk management
practices in the gold mining industry. Journal of Finance, 51 (4), 1097-1137. Walker, P.L., (2003). “ERM in practice,” Internal Auditor, (August), 51-55.

30
Table 1. CRO appointments by year This table presents CRO appointments by year. The totals are broken out by financial firms (6000<= SICC<=6999) and utilities (4900 <= SICC<=4999).
Year All Firms Financial Firms Utilities 1992 7 4 0 1993 9 2 0 1994 8 3 1 1995 9 3 1 1996 11 6 3 1997 5 4 1 1998 6 4 0 1999 9 5 1 2000 13 8 1 2001 23 14 5 2002 14 6 4 2003 12 8 1 2004 9 7 0 2005 3 3 0
138 77 18

31
Table 2. Summary Statistics and Sample Comparisons Leverage = Total liabilities/Total Assets = (d6 – d60)/d6, Cash Ratio = Cash and marketable securities/Total Assets = d1/d6, SDCF is the standard deviation of the error term from a regression of the firm’s quarterly operating cash flow on the prior quarter’s operating cash flow. This regression is run for eight quarters. Size is ln(market value of equity). Opacity = Intangibles/ Total Assets = d33/d6, MB = Market Value of Equity/ Book Value of Equity = (d199*d25)/d60, RD = Research and Development Expense / Total Assets = d46/d6, SDRET is the standard deviation of the firm’s daily returns over the year prior to the hiring of the CRO, Value Change is the percentage change in market value of the firm over the prior year. Vega/Delta is the ratio of Vega, the partial derivative of the CEOs option and stock portfolio to stock volatility and delta is the partial derivative with respect to the stock price as in Rogers (2002). Numseg is the number of operating segments of the firm. PINST is institutional ownership as the percentage of the firm’s stock. The number of institutional investors is designated as NINST. The means test is a two sided t-test. The medians test is a Wilcoxon Sign Rank test. CRO Hire firms Non CRO Hire firms Means Medians
Mean Median SD Mean Median SD Difference T- Test Difference Rank Sum Financial Characteristics
Leverage 0.744 0.812 0.217 0.530 0.538 0.260 -0.214 -11.548*** -0.274 -9.772*** Cash Ratio 0.088 0.052 0.110 0.170 0.072 0.218 0.082 8.798*** 0.020 3.437***
SDCF 136.224 23.564 357.770 21.862 1.714 165.767 -114.362 -3.741*** -21.85 -10.159*** Asset Characteristics
Opacity 0.054 0.013 0.105 0.074 0.003 0.138 0.019 2.148** -0.010 -0.435 MB 2.447 1.820 3.064 4.844 1.849 79.482 2.396 6.349*** 0.029 0.556 RD 0.005 0.000 0.017 0.045 0.000 0.135 0.040 26.870*** 0.000 5.828***
Market Characteristics SDRET 0.026 0.021 0.017 0.040 0.033 0.028 0.015 10.133*** 0.012 8.239***
Value Change 0.657 0.083 2.219 1.644 0.190 3.482 0.987 5.213*** 0.107 2.086** Managerial Characteristics
Vega/Delta 0.503 0.405 0.529 0.358 0.244 0.519 -0.145 -2.583** -0.160 -2.752*** Controls
Numseg 4.957 3.000 5.083 3.086 2.000 3.464 -1.871 -4.321*** -1.000 -3.478*** NINST 196.507 148.000 175.678 61.240 23.000 104.929 -135.267 -9.043*** -125.000 -11.037*** PINST 0.454 0.476 0.250 0.308 0.242 0.264 -0.145 -6.828*** -0.234 -6.531***
Size 7.521 7.742 2.117 5.068 4.916 2.111 -2.453 -13.604*** -2.826 -11.973*** ***, **, *: Significant at the 1%, 5%, 10% level respectively
32
Table 3. Correlations Leverage = Total liabilities/Total Assets = (d6 – d60)/data6, Cash Ratio = Cash and marketable securities/Total Assets = d1/d6, SDCF is the standard deviation of the error term from a regression of the firm’s quarterly operating cash flow on the prior quarter’s operating cash flow. This regression is run for eight quarters. Size is ln(market value of equity). Opacity = Intangibles/ Total Assets = d33/d6, MB = Market Value of Equity/ Book Value of Equity = (d199*d25)/d60, RD = Research and Development Expense / Total Assets = d46/d6, SDRET is the standard deviation of the firm’s daily returns over the year prior to the hiring of the CRO, Value Change is the percentage change in market value of the firm over the prior year. Vega/Delta is the ratio of Vega, the partial derivative of the CEOs option and stock portfolio to stock volatility and delta is the partial derivative with respect to the stock price as in Rogers (2002). Numseg is the number of operating segments of the firm. PINST is institutional ownership as the percentage of the firm’s stock. The number of institutional investors is designated as NINST. P values for significance level of each pair-wise correlation are in parenthesis.
Leverage Cash Ratio SDCF Size Opacity MB RD SDRET
Value Change Vega/Delta Numsegs NINST
Cash Ratio -0.0694 (0.419)
SDCF 0.1323 0.0440 (0.123) (0.609)
Size 0.2471 -0.1246 0.3608 (0.004) (0.145) (0.000)
Opacity -0.2886 -0.0515 -0.0821 -0.0737 (0.001) (0.549) (0.340) (0.390)
MB 0.1521 0.0875 0.0086 0.1354 0.0698 (0.075) (0.308) (0.920) (0.113) (0.416)
RD -0.3783 0.3436 -0.0743 -0.2501 0.1357 0.0769 (0.000) (0.000) (0.388) (0.003) (0.113) (0.370)
SDRET 0.0345 0.1147 -0.1295 -0.4478 0.0640 0.1331 0.1927 (0.688) (0.180) (0.132) (0.000) (0.456) (0.120) (0.024)
Value Change -0.1224 0.2925 -0.0624 -0.0463 -0.0913 0.1320 0.2289 0.0202 (0.153) (0.001) (0.469) (0.590) (0.287) (0.123) (0.007) (0.814)
Vega/Delta 0.0093 -0.1740 0.2396 0.1343 -0.0742 -0.0966 -0.1326 -0.1178 -0.1606 (0.931) (0.103) (0.024) (0.209) (0.490) (0.368) (0.216) (0.272) (0.133)
Numseg -0.0605 -0.0904 0.0378 0.3032 0.1639 0.1717 0.0394 0.0358 0.1565 0.1772 (0.481) (0.292) (0.661) (0.000) (0.055) (0.044) (0.647) (0.677) (0.067) (0.097)
NINST 0.3012 -0.1373 -0.3250 0.8046 -0.0939 0.1281 -0.1998 -0.2284 -0.1999 0.0765 0.1450 (0.000) (0.108) (0.000) (0.000) (0.273) (0.134) (0.019) (0.007) (0.019) (0.476) (0.090)
PINST 0.0657 -0.1758 -0.0553 0.4702 0.0638 0.0276 -0.2517 -0.1396 -0.1812 0.0239 0.1144 0.5446 (0.444) (0.039) (0.521) (0.000) (0.458) (0.748) (0.003) (0.102) (0.033) (0.824) (0.181) (0.000)

33
Table 4 Cox proportional hazard model on the determinants of CRO hires for the full sample Leverage = Total liabilities/Total Assets = (d6 – d60)/d6, Cash Ratio = Cash and marketable securities/Total Assets = d1/d6, SDCF is the standard deviation of the error term from a regression of the firm’s quarterly operating cash flow on the prior quarter’s operating cash flow. This regression is run for eight quarters. Size is ln(market value of equity). Opacity = Intangibles/Total Assets = d33/d6, MB = Market Value of Equity/Book Value of Equity = (d199*d25)/d60, RD = Research and Development Expense/Total Assets = d46/d6, SDRET is the standard deviation of the firm’s daily returns over the year prior to the hiring of the CRO, Value Change is the percentage change in market value of the firm over the prior year. Numseg is the number of operating segments of the firm. PINST is institutional ownership as the percentage of the firm’s stock. Financial is a dummy for (6000<=SICC<=6999) and Utility is a dummy for (4900<=SICC<=4999). Std HR is the
10%-of-mean-standardized hazard ratio is computed as: meancoefe ×× 1.0 .Absolute value of z statistics in parentheses HR Coef Std HR Mean
FINANCIAL CHARACTERISTICS Leverage 3.650 1.295 1.071 0.531 (2.26)** Cash Ratio 1.040 0.039 1.001 0.170 (0.05) ln(SDCF) 1.154 0.143 1.010 0.665 (2.83)*** Size 1.494 0.401 1.226 5.072 (4.84)*** ASSET CHARACTERISTICS Opacity 0.606 -0.501 1.004 0.075 (0.61) ln(MB) 0.737 -0.305 1.022 0.702 (1.99)** RD 0.992 -0.008 1.037 45.103 (1.77)* MARKET CHARACTERISTICS ln(SDRET) 1.454 0.374 1.136 -3.402 (1.59) Value Change 0.825 -0.192 1.032 1.643 (4.62)*** CONTROLS Numseg 0.991 -0.009 1.003 2.948 (0.45) PINST 2.179 0.779 1.024 0.309 (2.15)** NINST 1.001 0.001 1.006 61.460 (1.07) Financial 4.602 1.526 1.032 0.203 (5.71)*** Utility 4.336 1.467 1.005 0.036 (4.63)***
Observations = 84362 CRO hires = 137 * significant at 10%; ** significant at 5%; *** significant at 1%
34
Table 5 Cox proportional hazard model on the determinants of CRO hires, including CEO incentives Leverage = Total liabilities/Total Assets = (d6 – d60)/d6, Cash Ratio = Cash and marketable securities/Total Assets = d1/d6, SDCF is the standard deviation of the error term from a regression of the firm’s quarterly operating cash flow on the prior quarter’s operating cash flow. This regression is run for eight quarters. Size is ln(market value of equity). Opacity = Intangibles/Total Assets = d33/d6, MB = Market Value of Equity/ Book Value of Equity = (d199*d25)/d60, RD = Research and Development Expense/Total Assets = d46/d6, SDRET is the standard deviation of the firm’s daily returns over the year prior to the hiring of the CRO, Value Change is the percentage change in market value of the firm over the prior year. Vega/Delta is the ratio of Vega, the partial derivative of the CEOs option and stock portfolio to stock volatility and delta is the partial derivative with respect to the stock price as in Rogers (2002). Numseg is the number of operating segments of the firm. PINST is institutional ownership as the percentage of the firm’s stock. The number of institutional investors is designated as NINST. Financial is a dummy for (6000<=SICC<=6999) and Utility is a dummy for (4900<=SICC<=4999). Std HR is the
10%-of-mean-standardized hazard ratio is computed as: meancoefe ×× 1.0 . Absolute value of z statistics in parentheses HR Coef Std HR Mean
FINANCIAL CHARACTERISTICS Leverage 3.209 1.166 1.068 0.561 (1.18) Cash Ratio 0.297 -1.214 1.016 0.128 (0.90) ln(SDCF) 1.057 0.055 1.013 2.339 (0.93) Size 1.723 0.544 1.483 7.245 (2.86)*** ASSET CHARACTERISTICS Opacity 0.205 -1.585 1.016 0.098 (1.24) ln(MB) 0.729 -0.316 1.030 0.922 (1.36) RD 0.969 -0.031 1.103 31.154 (2.05)** MARKET CHARACTERISTICS ln(SDRET) 2.024 0.705 1.299 -3.712 (1.72)* Value Change 0.856 -0.155 1.008 0.493 (1.37) MANAGERIAL INCENTIVES Vega/Delta 1.256 0.228 1.033 -1.445 (1.96)** CONTROLS Numseg 0.957 -0.044 1.019 4.201 (1.54) PINST 3.255 1.180 1.071 0.585 (1.87)* NINST 1.000 0.000 1.000 176.863 (0.07) Financial 4.875 1.584 1.022 0.139 (3.84)*** Utility 4.136 1.420 1.008 0.057 (3.20)***
Observations = 16571 CRO hires = 77 * significant at 10%; ** significant at 5%; *** significant at 1%
35
Table 6 Cox proportional hazard model on the determinants of CRO hires for financial firms Financials are (6000<=SICC<=6999). Leverage = Total liabilities/Total Assets = (d6 – d60)/d60, Cash Ratio = Cash and marketable securities/Total Assets = d1/d6, SDCF is the standard deviation of the error term from a regression of the firm’s quarterly operating cash flow on the prior quarter’s operating cash flow. This regression is run for eight quarters. Size is ln(market value of equity). Opacity = Intangibles/Total Assets = d33/d6. MB = Market Value of Equity/Book Value of Equity = (d199*d25)/d60, SDRET is the standard deviation of the firm’s daily returns over the year prior to the hiring of the CRO, Value Change is the percentage change in market value of the firm over the prior year. Numseg is the number of operating segments of the firm. PINST is institutional ownership as the percentage of the firm’s stock. The number of institutional investors is designated as NINST. The SICC of the firm’s segments enter as dummy variables. Note that SIC 6500 is excluded due to
colinearity. Std HR is the 10%-of-mean-standardized hazard ratio is computed as: meancoefe ×× 1.0 . Absolute value of z statistics in parentheses.
HR Coef STD HR Mean FINANCIAL CHARACTERISTICS Leverage 2.252 0.812 1.063 0.747 (0.99) Cash Ratio 0.732 -0.312 1.003 0.100 (0.28) ln(SDCF) 1.137 0.128 1.002 0.136 (2.25)** Size 1.448 0.370 1.209 5.124 (3.45)*** Opacity 0.189 -1.666 1.004 0.025 (0.99) ln(MB) 0.562 -0.576 1.024 0.418 (2.45)** Value Change 0.832 -0.184 1.031 1.655 (3.25)*** ln(SDRET) 1.095 0.091 1.035 -3.754 (0.26) Numseg 0.925 -0.078 1.018 2.344 (2.12)** PINST 1.516 0.416 1.011 0.261 (0.76) NINST 1.002 0.002 1.011 54.131 (2.59)*** seg6000 – Depository Inst. 12.862 2.554 1.001 0.004 (3.08)*** seg6100 – Non Depository Credit Inst. 1.533 0.427 1.002 0.037 (0.76) seg6200 – Security Brokers 4.474 1.498 1.006 0.042 (3.33)*** seg6300 – Insurance Carriers 1.658 0.506 1.006 0.116 (1.24) seg6400 – Insurance Agents 9.162 2.215 1.004 0.020 (3.52)*** seg6700 – Investment Managers 0.727 -0.319 1.005 0.152 (0.47)
Observations = 16963 CRO hires = 76 * significant at 10%; ** significant at 5%; *** significant at 1%

36
Table 7 Cox proportional hazard model on the determinants of CRO hires for banks only Banks are (6000<=SICC<=6199). SDCF is the standard deviation of the error term from a regression of the firm’s quarterly operating cash flow on the prior quarter’s operating cash flow. This regression is run for eight quarters. Size is ln(market value of equity). Opacity = Intangibles/Total Assets = d33/d6. MB = Market Value of Equity/Book Value of Equity = (d199*d25)/d60, SDRET is the standard deviation of the firm’s daily returns over the year prior to the hiring of the CRO, Value Change is the percentage change in market value of the firm over the prior year. Numseg is the number of operating segments of the firm. PINST is institutional ownership as the percentage of the firm’s stock. The number of institutional investors is designated as NINST. Tier 1 Capital is d337, Loan loss provision is d342/d6, duration ratio is Assets Liabilities
Assets LiabilitiesΔ Δ Std HR is the
10%-of-mean-standardized hazard ratio is computed as: meancoefe ×× 1.0 . Absolute value of z statistics in parentheses. HR Coef STD HR Mean
ln(SDCF) 1.681 0.519 1.006 0.121 (2.73)*** Size 0.825 -0.192 1.099 4.898 (0.75) Opacity 0.004 -5.521 1.003 0.006 (0.45) Ln(MB) 0.794 -0.231 1.009 0.378 (0.42) Value Change 0.859 -0.152 1.023 1.507 (1.27) ln(SDRET) 0.571 -0.560 1.239 -3.829 (0.80) PINST 3.577 1.275 1.024 0.188 (1.29) NINST 1.004 0.004 1.017 43.060 (2.74)*** Tier 1 Capital 0.852 -0.160 1.200 11.409 (2.04)** Loan Loss Provision 0.541 -0.614 1.000 0.003 (0.02) Duration Ratio 0.844 -0.170 1.016 0.952 (0.87)
Observations = 7176 CRO hires = 32 * significant at 10%; ** significant at 5%; *** significant at 1%