The Changing U.S. Labor Force and Occupational Differentiation by Sex
15
DEMOGRAPHY@ Volume 16, Number 1 February 1979 THE CHANGING U. S. lABOR FORCE AND OCCUPATIONAL DIFFERENTIATION BY SEX Gregory Williams Department of Sociology, University of North Carolina, Chapel Hill, North Carolina 27514 Abstract-The degree of occupational differentiation by sex in the U.S. labor force is examined utilizing various measures and occupational classifications over the period 1900-1970. A consideration of comparable occupations over time indicates that while occupational differentiation by sex is still sub- stantial, an irregular, measurable decline in that differentiation has occurred during this century. Existing labor force structure seems relatively unimpor- tant in explaining this ongoing change. Apparently more significant are social and historical factors as they have influenced specific occupations in certain decades. While female labor force participation and its determinants have been studied extensively, little attention has been de- voted to the changing distribution of women in the labor force and the relation- ship of that distribution to changing struc- ture of the labor force. The work done to date has left unanswered many questions regarding the amount of occupational dif- ferentiation by sex and its trends; further- more, the relationship of the change in the proportions of women in occupations to other labor force characteristics such as size and growth is uncertain. Perhaps the most often cited study of occupational differentiation by sex is that of Gross (1968). Using crude and stan- dardized measures of differentiation on detailed occupational categories for the period 1900-1960, Gross concluded that the labor force was highly segregated by sex and that there had been no noticeable change in occupational differentiation by sex during this century. His data, how- ever, consisted of detailed occupations as listed by the Census Bureau for each dec- ade. Because of the changing number of occupational categories and the changing definitions of detailed occupations, his data were not comparable from one dec- ade to the next. Consequently, his mea- 73 sures cannot be properly analyzed in terms of trends in occupational differenti- ation by sex. In spite of this difficulty, his data do give a conservative estimate of the level of sexual segregation in detailed oc- cupations for 1960, where his occupa- tional detail is the finest (see Williams, 1976). Oppenheimer's work (1970) on the fe- male labor force in the United States, while not directly dealing with occupa- tional differentiation by sex, provides in- formation relevant to this topic. Her main concern was the degree to which large numbers of women are concentrated in a relatively few female-dominated occupa- tions. Using comparable occupational data for the period 1900-1960, she con- cluded not only that female workers are concentrated in occupations which are predominantly female but that this pat- tern of concentration remained much the same for the entire period of her study. While her research suggests that there may have been little change in the dis- persion of women in the occupational structure, it must be remembered that Op- penheimer focused on the number of women in occupations, not on the propor- tion. More recently, Treiman and Terrell
-
Upload
gregory-williams -
Category
Documents
-
view
215 -
download
3
Transcript of The Changing U.S. Labor Force and Occupational Differentiation by Sex
DEMOGRAPHY@ Volume 16, Number 1 February 1979
THE CHANGING U. S. lABOR FORCE AND OCCUPATIONALDIFFERENTIATION BY SEX
Gregory WilliamsDepartment of Sociology, University of North Carolina, Chapel Hill, North Carolina 27514
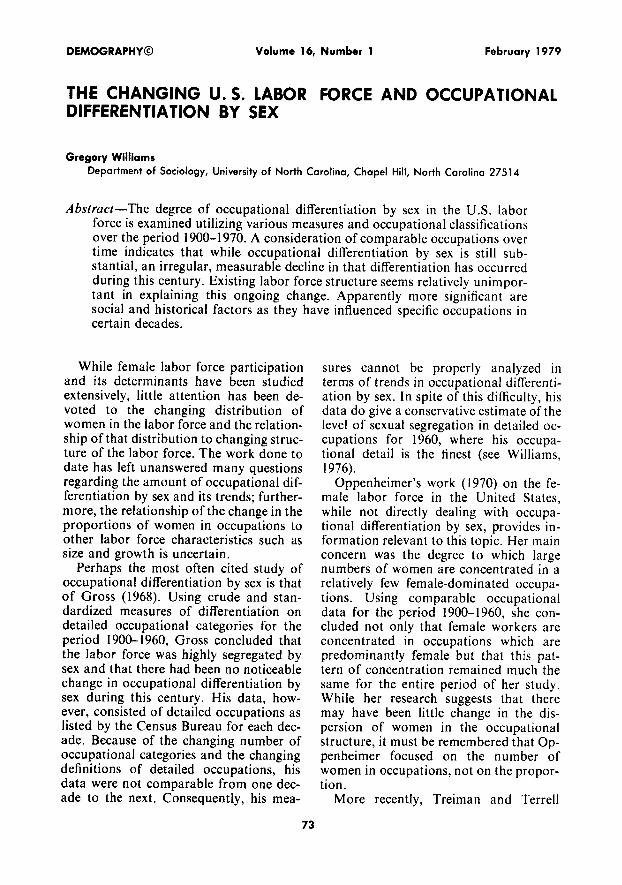
Abstract-The degree of occupational differentiation by sex in the U.S. laborforce is examined utilizing various measures and occupational classificationsover the period 1900-1970. A consideration of comparable occupations overtime indicates that while occupational differentiation by sex is still substantial, an irregular, measurable decline in that differentiation has occurredduring this century. Existing labor force structure seems relatively unimportant in explaining this ongoing change. Apparently more significant aresocial and historical factors as they have influenced specific occupations incertain decades.
While female labor force participationand its determinants have been studiedextensively, little attention has been devoted to the changing distribution ofwomen in the labor force and the relationship of that distribution to changing structure of the labor force. The work done todate has left unanswered many questionsregarding the amount of occupational differentiation by sex and its trends; furthermore, the relationship of the change in theproportions of women in occupations toother labor force characteristics such assize and growth is uncertain.
Perhaps the most often cited study ofoccupational differentiation by sex is thatof Gross (1968). Using crude and standardized measures of differentiation ondetailed occupational categories for theperiod 1900-1960, Gross concluded thatthe labor force was highly segregated bysex and that there had been no noticeablechange in occupational differentiation bysex during this century. His data, however, consisted of detailed occupations aslisted by the Census Bureau for each decade. Because of the changing number ofoccupational categories and the changingdefinitions of detailed occupations, hisdata were not comparable from one decade to the next. Consequently, his mea-
73
sures cannot be properly analyzed interms of trends in occupational differentiation by sex. In spite of this difficulty, hisdata do give a conservative estimate of thelevel of sexual segregation in detailed occupations for 1960, where his occupational detail is the finest (see Williams,1976).
Oppenheimer's work (1970) on the female labor force in the United States,while not directly dealing with occupational differentiation by sex, provides information relevant to this topic. Her mainconcern was the degree to which largenumbers of women are concentrated in arelatively few female-dominated occupations. Using comparable occupationaldata for the period 1900-1960, she concluded not only that female workers areconcentrated in occupations which arepredominantly female but that this pattern of concentration remained much thesame for the entire period of her study.While her research suggests that theremay have been little change in the dispersion of women in the occupationalstructure, it must be remembered that Oppenheimer focused on the number ofwomen in occupations, not on the proportion.
More recently, Treiman and Terrell

74 DEMOGRAPHY, volume 16, number 1, February 1979
(I975), using comparable occupationaldata for the period 1940- I960, consideredthe changing number and percentage ofwomen in detailed occupational categories. Their conclusions are tantalizing.They found substantial stability in sexcomposition in both number and percentover the twenty-year period. Their interpretation of intercensal regressions suggests that the 1940-1950 period was one inwhich occupations having smaller proportions of women in 1940 increased in percent female more than did those occupations with higher proportions of women in1940. The 1950-1960 period, on the otherhand, was found to be a period of stabilityin the proportions of women but not inthe numbers of women entering detailedoccupations. Thus, during the latter period, the occupations which had morewomen gained in numbers while thosewith fewer women lost women workers.
The findings of these studies still leaveunanswered questions about what hashappened to the numbers and proportionsof women in detailed occupations in theUnited States during this century. We donot know, for example, what the actuallevels of occupational segregation by sexhave been-whether those levels havechanged over time and whether thatchange, if any, has been consistent. Further, we do not know if the existing size ofan occupation or the proportion ofwomen in that occupation has any systematic effect upon its future growth orchange in proportion female. Nor do weknow whether the dynamics of growththemselves play a part in any changeswhich may occur in occupational differentiation by sex. This paper will attempt toimprove our understanding of the dynamics of the changing distribution of womenin detailed occupations over the past 70years.
THEORETICAL CONSIDERATIONS
One of the overriding considerations indealing with occupational differentiationby sex is whether there is any reason tobelieve that we should observe change in
the sexual division of labor over time.From a macro standpoint, one of the mostwidely accepted theories of social changesuggests that changes in the character oftechnology affect the division of laborwhich, in turn, ultimately affects almostevery aspect of the social structure (seeWilliams, 1976).
More specifically, a number of sociologists have suggested that ascription andachievement as modes of differentiationare influenced by the underlying technological base of the society. Thus, thegreater the division of labor in societies,the greater the emphasis placed uponachievement rather than ascription as ameans of differentiation (Davis, 1948, pp.114-115; Moore, 1951, pp. 436ff.; Hawley,1950, pp. 180-183; Parsons, 1951, pp.182-199). If these theories hold, the implications for change in occupational differentiation by sex are clear. The more complex the technology and the division oflabor, the more rational the use of laborshould become-skill and achievementgradually replacing ascription as the primary criterion for selecting persons to fillpositions in the work force.
Sexual ascription, however, is one ofthe most firmly rooted forms of differentiation within human societies. Since deeplyingrained patterns of behavior changeslowly, it is quite probable that the replacement of ascription by achievement asa dominant principle in assigning workwould be a slow process. Indeed, the division of the labor force along the lines of"women's work" and "men's work," eachcategory containing a number of occupations representing a wide range of skilllevels, suggests that the principle of ascription and the criterion of achievementare simultaneously at work. How close wemay ultimately come to the elimination ofascription from work is debatable andmay depend to a great degree on the evolution of work itself. It is clear, however,that the process of transformation as theoretically stated is far from complete inreality. Further, from the point of view ofmiddle range theory, the specific mecha-

U.S. Labor Force and Occupational Differences by Sex 75
nisms affecting occupational differentiation are likely to be highly complex.Trends in the supply of and demand forparticular types of labor, trends in cultural patterns of discrimination, and discontinuous historical events such as depressions, wars, and radical shifts intechnology all may influence the hypothesized tendency for occupational differentiation to decrease over time. We are onlybeginning to understand the roles whichthese individual mechanisms play inchanging the patterns of sexual ascriptionin work.
One final point relating to technologicalchange should be mentioned here. Obviously, increased technological complexityhas reduced the physical character ofwork and increased the demand for skilledlabor. So long as the increase in the demand for that skilled labor is rapid andthe demographic characteristics of thepopulation are such that "suitable," ascriptively defined workers, properlytrained or trainable, are in short supply,then the trained or trainable "marginal"labor should be increasingly in demand.Such a pattern is consistent with Oppenheimer's (1970) evidence that increases infemale labor force participation have occurred in occupations where suitable,cheap labor with comparable levels ofeducation was scarce. On the other hand,a reduction in the pace of technologicalchange or in its application (as one mightexpect during a depression) or a change inthe demographic characteristics of asociety which increases the numbers oftraditionally "suitable" labor relative tothe supply of jobs could undermine thedemand for "marginal" labor. Whateverthe specific mechanisms involved, andthey are complex (see Oppenheimer,1973), it seems reasonable that the changeimplied by the larger theory is not onewhich can be expected to take the form ofa smooth trend, but rather one much influenced by the state of an economy, bythe demographic characteristics of thepopulation, and to some degree by criticalhistorical events.
DATA AND METHODS
One of the greatest barriers to the longitudinal analysis of detailed occupationshas been the constant redefinition of occupations and the resulting change in thenumber of occupational categories overtime, a problem compounded by the failure of the Census Bureau to undertakemajor efforts to improve the comparability of occupational data. Over theyears, four attempts have been made toimprove the comparability of occupational data. The first, undertaken by AlbaEdwards (1943) and later updated byKaplan and Casey (1958), provided whatare to date the best estimates of occupational comparability for the period 19001950. More recent work by Priebe (1968)and Priebe, Heinkel, and Greene (1972),based on samples of the labor force, haveallowed a means for making adjustmentsin detailed occupational data for the periods 1950-1960 and 1960-1970. The dataset used in the present research consists ofthe Kaplan and Casey estimates for 19001940 which are based on the 1950 classification of detailed occupations and a set ofestimates for the period 1950-1970 generated by the author, utilizing the work ofPriebe, Heinkel, and Greene and CensusBureau data (Bureau of the Census, 1953,1964, 1973). Creating a data set for thislatter period which would be roughlycomparable with the earlier data requiredthe reassignment and aggregation of occupational segments back to the 1950 occupational definitions. While great care wastaken in generating these estimates, oneshould not presume that they are exact.Whatever the limitations of the data, theyare, nevertheless, what we must workwith. To provide a check on the influenceof these adjustments upon the measuresused in this study, the various measureswere applied to estimates of detailed occupations for 1950, 1960, and 1970, classified according to each of these three setsof occupational definitions. These checksproduced substantially similar results. Ithas been assumed, therefore, that theprocess followed in creating the com-

76 DEMOGRAPHY, volume 16, number 1, February 1979
parable estimates based upon the 1950classification of occupations has not resulted in any substantial misrepresentation of the data.
It should be noted that while the comparable data set employed here for theperiod 1900-1970 includes virtually all ofthe labor force, it does exclude a few occupations for which no comparable occupation existed in 1900 (e.g., Airline Pilots,and Operatives in the synthetic fiber industry). The comparable data set basedupon the 1910 occupational definitions,however, includes all but five small occupations.
In the discussion of the findings theterm "comparable occupations" will referto the set of 246 detailed occupations defined according to the 1900 occupationalclassification. Whenever a set of occupations based on the occupational classification of a different year is used, the year ofthat occupational definition will followthe term "comparable." For example,"Comparable (1910)" refers to a set ofcomparable occupations classified according to the 1910 occupational definition.Finally, the term "total occupations" willbe used to refer to sets of detailed occupations classified in each year according tothe occupational definitions used by theCensus Bureau in that year.
THE CHANGING CHARACTER OF THELABOR FORCE
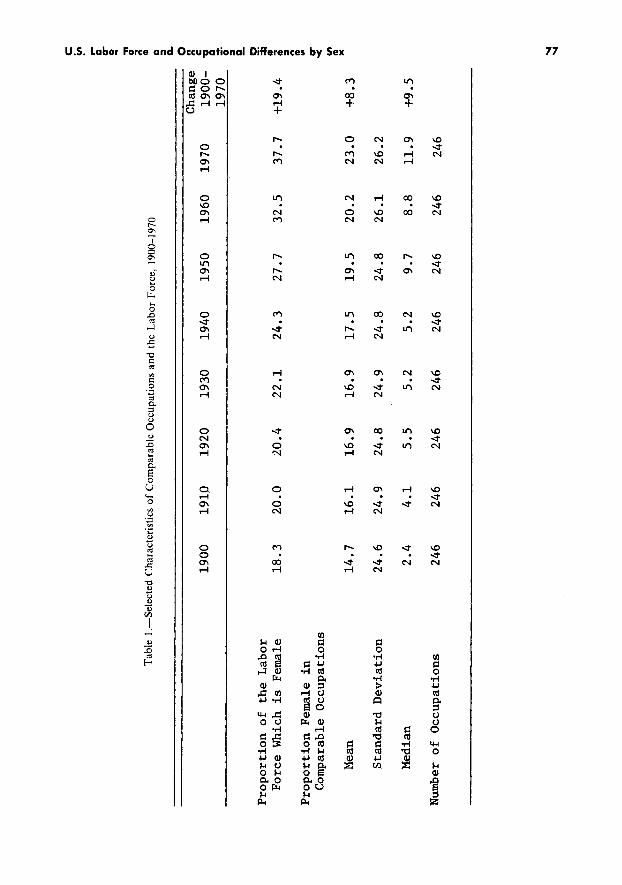
In order to provide a context for theanalysis, a brief summary of the broadchanges in the labor force- which this research has defined follows. As is wellknown, there have been tremendouschanges in female labor force participation in the United States during this century. Table 1 shows these trends alongwith the characteristics of the distributionof women in comparable occupations for1900-1970. The proportion of the laborforce which is female has increased from alow of 18.3 percent in 1900 to a high of37.7 percent in 1970, a total increase of19.4 percentage points over the 70 years.Thus, the proportion of the labor force
which is female has more than doubled,over two-thirds of that change occurringsince 1940.
The distribution of the proportion ofeach occupation which is female is, ofcourse, far from normal, but both themean and the median proportion femalein occupations have risen each year. Themean has risen from a low of 14.7 percentfemale to a high of23.0 percent female, anincrease of 8.3 percentage points. The median, which in this case is a better statement of the trend in the proportion femalein each occupation, has risen from a lowof 2.4 percent in 1900 to a high of 11.9percent in 1970, increasing 9.5 percentagepoints over 70 years. The change in boththe mean and median proportion femalein occupations, then, is about half thechange in the proportion of women in thelabor force, indicating that as womenhave entered the labor force there hasbeen a strong tendency to enter occupations which already have large percentages of women. The growth of Secretariesand Clerical Workers is a clear example ofthis well-known trend. More importantly,the trend in the growing numbers ofwomen in female-dominated occupationsappears to be separate from the trend inthe dispersion of women across the broadrange of occupations.
MEASURES OF OCCUPATIONALDIFFERENTIATION BY SEX
The most commonly used technique formeasuring segregation is the index of dissimilarity. This index may take a varietyof forms. As used here, the index takes theform of a crude measure of differentiation(delta) and an absolute standardized measure of differentiation (standardized delta)which controls for the effect of the occupational structure by treating all occupations as if they were of equal size. Asindicators of occupational differentiationby sex, these measures may be interpretedas the proportion of women who wouldhave to change occupations in order forthe sex ratio of each occupation to be the
c !" ... D IT ~ "'II
0 ~
Tab
leI.
-Sel
ecte
dC
hara
cter
isti
csof
Com
para
ble
Occ
upat
ions
and
the
Lab
orFo
rce,
1900
-197
0el
l
D :::I
A. 0
Cha
nge
n n
1900
1910
1920
1930
1940
1950
1960
1970
19
00
-c ~ D
1970
- ii" :::I a
Pro
po
rtio
no
fth
eL
abo
rPo ~ el
lF
orc
eW
hich
isF
emal
e1
8.3
20
.02
0.4
22
.12
4.3
27
.73
2.5
37
.7+
19
.4.. el
l:::
In el
l
Pro
po
rtio
nF
emal
ein
.. ITC
ompa
rabl
eO
ccu
pat
ion
s'< '"ell lC
Mea
n1
4.7
16
.11
6.9
16
.917
.51
9.5
20
.22
3.0
+8
.3
Sta
nd
ard
Dev
iati
on
24
.62
4.9
24
.82
4.9
24
.82
4.8
26
.12
6.2
Med
ian
2.4
4.1
5.5
5.2
5.2
9.7
8.8
11
.9+
9.5
Num
ber
of
Occ
up
atio
ns
246
246
246
246
246
246
246
246
"" ""

78 DEMOGRAPHY, volume 16, number 1, February 1979
same as the sex ratio of the labor force asa whole.'
There are characteristics of these measures which must, however, be kept inmind when they are used with occupational data over time. First, as shown byDuncan and Duncan (1955), Taeuber andTaeuber (1965) and most recently by Cortese, Falk, and Cohen (1976), measures ofdifferentiation are sensitive to the numberof categories used. Thus, when measuresof occupational differentiation are computed on broad categories such as Professionals, they are likely to show less differentiation than if the same measures werecomputed on detailed occupations withinthis category-that is, unless each of thedetailed categories had the same proportion of women as the broad category.Consequently, the broader the occupational classification, the more likely one isto underestimate the existing amount ofoccupational differentiation by sex; conversely, the more refined the classification,the more likely one is to estimate accurately the existing level of occupationaldifferentiation by sex. This fact is particularly relevant to longitudinal analysis because if the number of occupations employed differs over time, succeedinglyfiner occupational breakdowns are likelyto reveal increasing amounts of differentiation.
Second, as the same authors show, thecrude measure of differentiation is particularly sensitive to the size of the unit used.
1 The formulas for the crude and absolute measureofdifferentiation as used in this study are as follows:
LI~ -.l!!-IIOOVa LYa,;l = 2
Lj [[Xa/Ta] (1000) _ [Ya/Ta] (1000)JIDXa/Ta] DYa/Ta]
A Std. = 2 100,where Xa ~ the number of males in an occupation,Ya ~ the number of females in an occupation, andT = the total number of individuals in an occupation(See Williams, 1976, p. 47.)
In this case, occupations affect delta indirect proportion to their size. This characteristic may create a problem similar tothat experienced with increasing numbersof categories. For some large occupational categories, such as Farmers, incumbents generally are performing essentially the same work; however, a greatmany of the detailed occupational categories employed by the Census Bureau aremade up of many types of work. Thus, if alarge occupation is concealing existing differentiation, it will artificially lower thevalues of delta.
The only measure of differentiationwhich controls for these effects is a sizestandardized measure of differentiation(standardized delta) calculated with afixed number of comparable occupationalcategories so that both the size and thenumber of occupations are controlled.Therefore, standardized delta is the bestfor assessing differentiation by sex for occupations over time, while delta probablygives the most realistic cross-sectional indications of occupational differentiationby sex as experienced by persons in thelabor force. When using this latter measure, however, one should be aware thatcomparison of delta's over time for noncomparable occupational categories isprone to error as is the comparison ofdelta's over time for comparable occupations. The first procedure is likely to hidedifferentiation for the early years of thecentury; the latter procedure is likely tohide differentiation for the later years. Tables 2 and 3 show the results of the computation of crude and size standardizedmeasures of differentiation respectivelyfor total occupations and sets of comparable occupations for the period 19001970.
ANALYSIS OF MEASURES OFDIFFERENTIATION
Total Occupations
As stated earlier, "total occupations"refers to the occupations as defined by theCensus Bureau for each decade. As the
U.S. Labor Force and Occupational Differences by Sex 79
Table 2.-Crude Measures of Occupational Differentiation and Decennial Change by Sex for Types ofOccupational Data. 1900-1970
Types of Data
Total Occupations
N •
Delta
Change
1900 - 1910 - 1920 - 1930 - 1940 - 1950 - 1960 - 1970
252 307 311 315 370 434 470 670
64.3 66.4 65.7 68.4 68.9 67.3 64.9 61.6
+2.1 -0.7 +2.7 +0.5 -1.6 -2.4 -3.3
Comparable Occupations (1900) N • 246
Delta 64.2 60.1 57.9 59.1 43.9 34.2 32.7 32.0
Change -4.1 -2.2 +1.2 -15.2 -9.7 -1.5 -0.7
Comparable Occupations (1910) N • 301
Delta 64.4 63.1 64.5 49.0 38.2 36.5 35.5
Change -1. 3 +1.4 -15.5 -10.8 -1. 7 -1.0
Comparable Occupations (1950) N - 434
Delta
Change
67.3 68.5 65.2
+ 1. 2 -3.3
Comparable Occupations (Technical Paper 26 Segments) N = 1980
Delta
Change
65.0 63.8
-1.2
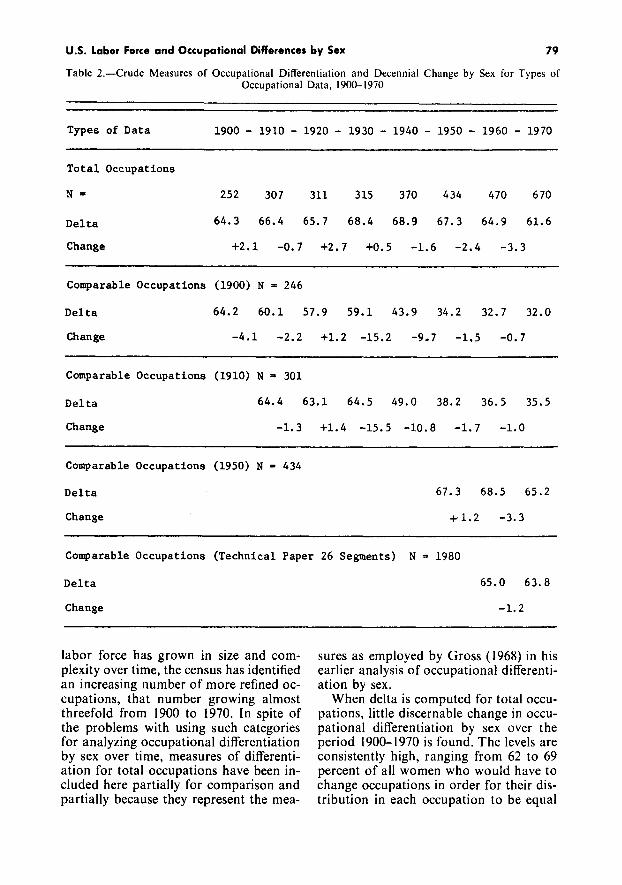
labor force has grown in size and complexity over time, the census has identifiedan increasing number of more refined occupations, that number growing almostthreefold from 1900 to 1970. In spite ofthe problems with using such categoriesfor analyzing occupational differentiationby sex over time, measures of differentiation for total occupations have been included here partially for comparison andpartially because they represent the mea-
sures as employed by Gross (1968) in hisearlier analysis of occupational differentiation by sex.
When delta is computed for total occupations, little discernable change in occupational differentiation by sex over theperiod 1900-1970 is found. The levels areconsistently high, ranging from 62 to 69percent of all women who would have tochange occupations in order for their distribution in each occupation to be equal

80 DEMOGRAPHY, volume 16, number 1, February 1979
Table 3.-AbsoJute Standardized Measure of Occupational Differentiation and Decennial Change by Sex forTypes of Occupational Data, 1900-1970
Types of Data 1900 - 1910 - 1920 - 1930 - 1940 - 1950 - 1960 - 1970
Total Occupations
N .. 252 307 311 315 370 434 470 670
Standard ized Delta 70.5 68.5 66.2 66.9 64.1 61. 3 62.2 54.9
Change -2.0 -2.3 +0.7 -2.8 -2.8 +0.9 -7.3
Comparable Occupations (1900) N .. 246
Standardized Delta 70.2 64.9 62.7 63.2 55.3 46.7 48.1 44.8
Change -5.3 -2.2 +0.5 -7.9 -8.6 +1.4 -3.3
Comparable Occupations (1910) N .. 301
Standardized Delta 65.9 63.8 64.5 57.5 49.4 50.8 47.7
Change -2.1 +1. 7 -7.0 -8.1 +1.4 -3.1
Comparable Occupations (1950) N .. 434
Standardized Delta
Change
61.3 62.8 59.4
+1.5 -3.4
Comparable Occupations (Technical Paper 26 Segments) N .. 1980
Standardized Delta
Change
76.0 73.0
-3.0
to their distribution in the labor force as awhole each decade. However, it must beremembered that both the number and thesize of occupations are varying over timefor this set of measures. If we control forthe size of each occupation but let thenumber of occupations vary over time byapplying the standardized delta to totaloccupations, a more discernable trend inthe values emerges. With the exception ofthe decades 1920-1930 and 1950-1960,
there is a slow decline in the level of occupational differentiation over the 70 yearsfrom a high of 70.5 percent in 1900 to alow of 54.9 percent in 1970. Since the controlling for size increased the measure for1900 through 1920, we may assume thatduring this period smaller occupationswere somewhat more segregated thanwere larger ones. The reverse seems to betrue for 1930-1940. In this case, the factthat values are lowered when size is con-
U.S. Labor Force and Occupational Differences by Sex 81
trolled for would suggest that the largeroccupations were somewhat more segregated than the smaller ones during thisperiod.
Comparable Occupations
An analysis of the longitudinal trendsrequires a consideration of comparabledata. Delta as computed for comparableoccupations holds the number of occupations constant and allows the size of eachoccupation to vary over time. Under theseconditions, there is a substantial decline inoccupational differentiation by sex overthe 70 years. The value of delta shows aparticularly large drop between 1930 and1950, with less decline apparent between1900 and 1910. Further, with the exception of a slight increase for the 19201930 decade, all other decades reveal decline. When comparable (19 I0) data areused, the pattern is virtually the same,although the level of differentiation isgreater because of the increased numberof occupations.
The overall amount of this decline,however, is clearly unrealistic. Because ofthe aggregation necessary to create comparable occupations, the effect of occupational size on the measure has been exaggerated. The degree to which size affectsthe measure can be seen by comparingthese results with those obtained whendelta is applied to comparable (1950)data: the increased number of occupationsalmost doubles the level of differentiation.
Since increasing the number of comparable categories seems to reveal increasing differentiation, one wonders whatwould happen if the number of categoriesgrew dramatically. Interestingly enough,there is an opportunity to test this possibility. Technical Paper 26 (Priebe, Heinkel, and Greene, 1972), designed to estimate comparability between the 1960 and1970 classifications of occupations, produces estimates for 1,980 detailed occupations and occupational segments. The occupational detail here is about three timesthat found in the 1970 census. Nevertheless, when delta is computed for this
data set, the results are virtually the sameand the small decline between 1960 and1970 remains. The implication of thisfinding seems to be that values in therange of 64-65 percent may possibly comeclose to representing the actual level ofoccupational differentiation by sex, if occupations are weighted according to theirrelative sizes.
Clearly the most instructive set of measures is generated when both number andsize of occupations are controlled throughthe use of standardized delta. This set ofmeasures is shown in Table 3 for comparable (1900) and comparable (1910) occupations. The overall pattern whichemerges from this set of measures indicates that the occupational differentiation for 1900 definition occupations declines from a high of 70.2 percent to a lowof 44.8 percent, with the exceptions ofslight reversals for the decades 1920- I930and 1950-1960.
Virtually the same pattern appearswhen comparable (1910) occupations areemployed. However, the greater numberof occupations here slightly raises the levelof differentiation. As was apparent in theapplication of delta, increasing the number of occupations has the effect of increasing the amount of occupational differentiation revealed, the use of the 1,980occupations and segments from the Technical Paper 26 data set producing thehighest level. Thus, when one looks atoccupations that begin to approach thelevel of specific jobs, considering each asan equal unit, it becomes apparent that 73percent of all women would have tochange occupations in order for the proportion of women in each occupation tobe equal to the proportion of women inthe labor force as a whole. If this value isinaccurate, it is, more likely than not, aconservative estimate. It seems reasonable, however, to assume that it may wellbe approaching an accurate estimate ofthe amount of differentiation by sex foroccupations.
In addition to considering these overall trends revealed by the standardized

82 DEMOGRAPHY, volume 16, number 1, February 1979
delta's, it is interesting to note the decennial changes found in Table 3. They areremarkable in their consistency. For1950-1960 and 1960-1970 the figures arealmost the same regardless of the numberof occupations used. Moreover, the overall pattern of percentage point change isvery similar for the 1900 and 1910 comparable data sets. In relative terms, thereappears to have been a 25.4 percentagepoint decline in occupational differentiation by sex over the 70 years. Theamount observed for most decades, however, is relatively small and the pattern isnot entirely consistent. Most outstandingis the decline for 1940-1950 of 8.6 percentage points and the decline for 1930-1940of 7.9 percentage points. Together, thesetwo decades account for 65 percent of thetotal observed decline. The next most noticeable decline of 5.3 percentage pointsoccurred between 1900 and 1910, followedby a 3.3 percentage point decline for the1960-1970 decade and a 2.2 percentagepoint decline for the 1910-1920 decade.Both post-war decades-the 1920s and the1950s-were, on the other hand, periodsof slight increases in occupational differentiation by sex.
Some additional information is gainedby a comparison of delta and standardized delta values for each decade. For thedecades 1900-1910 and 1960-1970 the values of the standardized delta declinedslightly more than the delta values, suggesting that small occupations may havedecreased in differentiation more than didlarger occupations. On the other hand,during the decades between 1930 and 1960the declines appear to have been greater inthe large occupations. In contrast to thesedecades of decline, the period 1920-1930reveals an increase for both small andlarge occupations, these large occupationsaccounting for more of that increase. Thedecade 1950- I960 shows a contrary trendof increases in differentiation in smalleroccupations, perhaps the result of womenwithdrawing from war-time employment,and slight decreases in differentiation inthe larger occupations.
These applications of the measures ofdifferentiation to comparable occupationsreveal a pattern essentially consistent withwhat might be expected. They indicatethat the current level of occupational differentiation by sex is still very high. Thetrend in that differentiation, however, suggests that change has occurred, althoughirregularly and slowly.
From the measures, it is possible tospeculate on what the actual trends in occupational differentiation by sex may havepossibly been during this century if onehad been able to measure differentiationat a level comparable to the level of measurement obtained for 1970. If one were toassume that the actual current levels ofoccupational differentiation by sex areclose to being correct and if one were toassume that the patterns of change in occupational differentiation by sex reflectfairly accurately the long-term trends,then hypothetical values of either delta orstandardized delta would suggest that occupational segregation at the turn of thecentury could well have been near 95 percent. While these figures are speculative,they do not seem unreasonable. Obviously, the accurate estimation of the absolute level of occupational segregation willprobably be forever elusive; the relativetrend, on the other hand, is a differentmatter. The evidence presented here seemsto indicate progress in the direction oflower differentiation by sex in occupationsover time. This should be taken to meanthat while women are represented in increasing proportions in more types of employment now than at the turn of the century, they are, nevertheless, stillsubstantially underrepresented relative totheir rates of labor force participation.
STRUCTURAL CORRELATES OF THENUMBER AND PROPORTION OF WOMEN
IN OCCUPATIONS
This change in occupational differentiation by sex, to the degree that it hasoccurred, still requires explanationwhether by social, demographic, economic, and/or historical variables. Unfor-
U.S. Labor Force and Occupational Differences by Sex 83
tunately, the nature of the occupationaldata covering the period of this study doesnot allow the association of social variables with the detailed occupations. However, it is possible to examine whether certain characteristics of occupations-thesize of the occupation, the proportion ofwomen in the occupation, or the pace atwhich change is occurring in an occupation-are related to the degree of changein occupational differentiation by sex.
It is to be expected that under conditions of gradual social change there wouldbe substantial consistency in the numberor proportion of women in an occupationover short periods of time (e.g., a decade)but less consistency over the long term.Thus, while the number of women in thelabor force grew at a faster rate than thenumber of men over this century, males inthe labor force increased 98 percent andfemales 435 percent between 1900-1970,nevertheless there was a strong tendencyfor women to enter occupations in numbers relative to the numbers of womenalready in those occupations. The correlation between the number of women in anoccupation at the beginning of a decadeand at the end is above .90 for every decade. However, because of the changingcharacter of the labor force for women aswell as for men, the number of women inoccupations in 1970 correlates only .292with the number of women in occupationsin 1900.
We have already shown that change inthe proportion of women in occupationsover the decades has been slow: The remarkable stability in the proportion ofwomen in occupations noted by Treimanand Terrell (1975) for the period 19401960 can be observed on a larger scale inthe present study. Tee correlations of theproportion of each occupation which isfemale at the beginning of each decadewith the proportion of an occupationwhich is female at the end of each decadeare consistently above .98 for every decade from 1900-1970. Knowing the proportion of women in an occupation in1900 wiII explain 71 percent of the vari-
ance in the proportion of women in thatoccupation in 1970. While this stability issubstantial, it is consistent with the slowchange during the period.
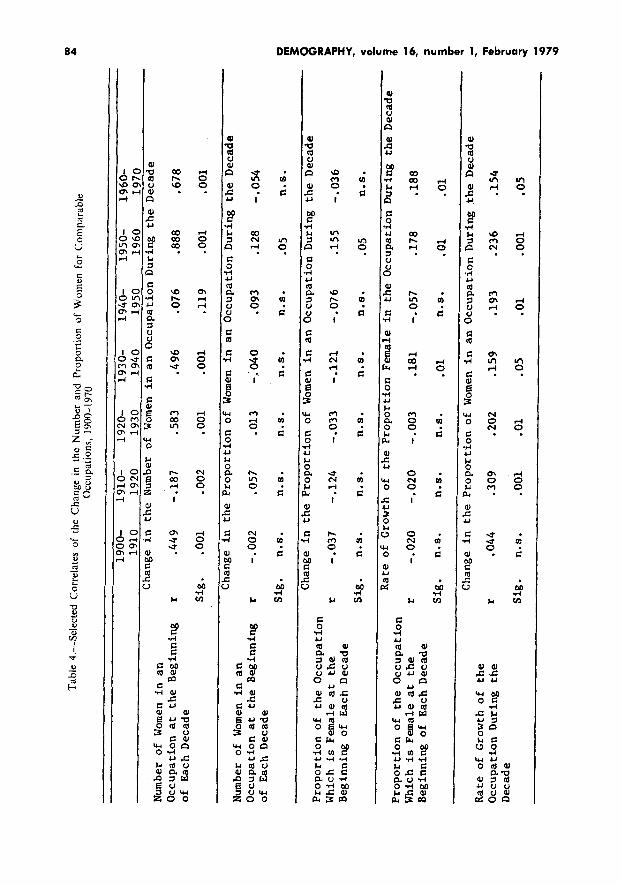
In order to evaluate further the ways inwhich the size of an occupation, the existing sex composition of an occupation, orthe rate of growth of an occupation mightdifferentially affect change in the sexualcomposition of that occupation, five propositions have been considered.
Proposition I: The greater the numberof women in an occupation at the beginning of a period of time, the greater thechange in the number of women duringthat period of time.
This proposition tests whether the number, and thus the visibility, of women inan occupation contributes to disproportionate female entry into an occupation.In theory, the more women in an occupation, the more visible that occupationshould be as a model for women and,therefore, women could be attracted tothat occupation disproportionately whenentering the labor force. The data wouldindicate that while such is not consistentlythe case, for certain decades there hasbeen a tendency for the number of womenin an occupation to be associated with itsgrowth in number in the succeeding decade.
The top panel of Table 4 shows thesecorrelations. Here, the decade 1950-1960is exceptional. During this decade occupations with small numbers of women grewlittle, while the female-dominated occupations expanded the most dramatically. Although there was some tendency duringthe I960s, 1920s, and the first decade ofthe century for occupations with largenumbers of women to change more intheir numbers, at no time is the association as strong as that for the 1950s. Incontrast, this pattern does not hold at allfor the 1940s or 1910-1920. For these decades there is no noticeable association between the number of women in occupations at the beginning of the decade andtheir change in number over the rest of thedecade. In fact, for 1910-1920 there was a
Tab
le4
.-S
elec
ted
Cor
rela
tes
ofth
eC
hang
ein
the
Num
ber
and
Pro
port
ion
ofW
omen
for
Com
para
ble
Occ
upat
ions
,19
00-1
970
1900
-1
91
0-
1920
-1
93
0-
1940
-19
50-
1.96
0-19
1019
2019
3019
4019
5019
6019
70C
hang
ein
the
Num
ber
of
Wom
enin
anO
ccu
pat
ion
Du
rin
gth
eD
ecad
eN
umbe
ro
fW
omen
inan
Occ
up
atio
nat
the
Beg
inn
ing
r.4
49
-.1
87
.583
.49
6.0
76.8
88.6
78
of
Eac
hD
ecad
eS
ig.
.001
.002
.001
.001
.119
.001
.001
Cha
nge
inth
eP
rop
ort
ion
of
Wom
enin
anO
ccu
pat
ion
Du
rin
gth
eD
ecad
eN
umbe
ro
fW
omen
inan
Occ
up
atio
nat
the
Beg
inn
ing
r-.
00
2.0
57.0
13-:
04
0.0
93.1
28-.
05
4o
fE
ach
Dec
ade
Sig
.n
.s.
n.s
.n
cs
,n
.s.
n.s
..0
5n
.s.
Cha
nge
inth
eP
rop
ort
ion
of
Wom
enin
anO
ccu
pat
ion
Du
rin
gth
eD
ecad
eP
rop
ort
ion
of
the
Occ
up
atio
nW
hich
isF
emal
eat
the
r-.
03
7-.
12
4-.
03
3-.
12
1-.
07
6.1
55-.
03
6B
egin
nin
go
fE
ach
Dec
ade
Sig
.n
.s.
nvs
,n
ss
,n
.s.
n.s
..0
5n
.s.
Rat
eo
fG
row
tho
fth
eP
rop
ort
ion
Fem
ale
inth
eO
ccu
pat
ion
Du
rin
gth
eD
ecad
eP
rop
ort
ion
of
the
Occ
up
atio
nW
hich
isF
emal
eat
the
r-.
02
0-.
02
0-.
00
3.1
81-.
05
7.1
78.1
88
Beg
inn
ing
of
Eac
hD
ecad
eS
ig.
n.s
.n
.s.
n.s
..0
10
.8.
.01
.01
Cha
nge
inth
eP
rop
ort
ion
of
Wom
enin
anO
ccu
pat
ion
Du
rin
g~he
Dec
ade
Rat
eo
fG
row
tho
fth
eO
ccu
pat
ion
Du
rin
gth
er
.044
.309
.202
.15
9.1
93.2
36.1
54
Dec
ade
Sig
.n
.s.
.001
.Ol
.05
.01
.001
.05
CX
l.eo
. c ~ 8 :lIII
)10
'V ::r .:< < o C 3 ID !1'
::l C 3 IT !t -- Oft
ID IT 2 D < 0() ..... 0()

U.S. Labor Force and Occupational Differences by Sex 85
very slight tendency for the occupationswith fewer women to grow more than occupations with large numbers of women.
Proposition 1/: The greater the number of women in an occupation at thebeginning of a time period, the greater thechange in the proportion of women in thatoccupation over time.
While there is an association betweenthe number of women in an occupation atthe beginning of a decade and the changein that number over time, the relationshipbetween occupational size and change inproportion of women does not hold. Asshown in the second panel of Table 4,there is no support for the idea that largeoccupations are more or less likely to decrease in occupational differentiation bysex over time than are small occupations.
Proposition 1/1: The greater the proportion of women in an occupation, thegreater the change in the proportion ofwomen in an occupation over time.
Proposition IV: The greater the proportion of women in an occupation, thegreater the rate of change in proportion ofwomen over time.
Propositions III and IV are both basedon the idea that the degree or the pace ofchange in occupational differentiation depends on the existing proportion ofwomen in the occupation. If occupationswith relatively small proportions ofwomen tend to change their proportionsmore rapidly than do occupations withrelatively large proportions of women,then one would expect a substantial negative correlation to emerge. However, asshown in Table 4, there is little or noassociation between the proportion ofwomen in an occupation at the beginningof a decade and either the change in thatproportion over the succeeding decade orthe rate of change in that proportion overthe succeeding decade. There is a slightbut insignificant tendency for occupationswith smaller proportions of women to increase their proportion more than femaledominated occupations. However, thisobservation may well be due to the ceilingon further increases in occupations whichare strongly female-dominated.
Proposition V: The faster the rate ofgrowth of an occupation during a periodof time, the greater the rate of change inthe proportion of women in the occupation.
Underlying this last proposition is theidea that if an occupation is growing at arapid rate, skilled labor is likely to be inshort supply. Thus, one could hypothesizethat because of this shortage of skilledlabor, employers may tend to rely lessupon sex stereotyping when selecting employees, thereby providing more opportunities for women in the occupation. Thecorrelations in the bottom panel of Table4 show the relationship between the rateof growth of occupations over each decade and the change in the proportion offemales in the occupations during the decade. All the correlations, with the exception of the one for the decade 19001910, are significant but low. Thus, whilethere appears to be a slight tendency foroccupations which are rapidly growing toexperience more change in their proportion female than occupations which aregrowing slowly or declining, there is notenough of a correlation in any given decade to support this hypothesis. This finding, then, suggests that dynamic and expanding occupations may be essentiallyno more advantageous to women than themore stable occupations. The implicationmay be that an increasing demand for labor in general in an occupation does notnecessarily mean an increasing demandfor female labor relative to male labor.These results might add some support toOppenheimer's (1970) contention thatmales and females are in two different labor markets, each having its own demandstructure.
CONCLUSIONS
If one considers comparable occupations over the last 70 years, there has beena slow, irregular decline in occupationaldifferentiation by sex. This finding in noway suggests that women are somehowsubstantially better off in the workplacetoday than 70 years ago. The best estimates of the current level of occupational

86 DEMOGRAPHY, volume 16, number 1, February 1979
segregation suggest that even in 1970 verylikely close to 70 percent of all womenwould have to change occupations in order for their proportion in each occupation to be the same as their proportion inthe labor force as a whole. As high as thispercentage is, the data do suggest that itwas even greater at the turn of the centurywhen it may have been as high as 95 percent. Thus, while the findings presentedhere suggest that a modest decline hasoccurred over the last 70 years, it is clearthat a great deal more change will be required if achievement is, in fact, to replaceascription as the key mode of differentiation in work.
An analysis of individual decades hasrevealed that those decades between 19301950 and, to a respectively decreasing extent, the first decade of the century andthe 1960s were the key periods for declinesin sexual segregation in occupations. Onthe other hand, the 1950s and to a lesserextent the 1920s appear to be decades inwhich sexual segregation in occupationsincreased.
Additionally, it has been observed thatthe number and the proportion of womenin comparable occupations are highlyconsistent from one decade to the nextover the century. The data, however, showlittle or no association between the changein the proportion of women over a decadeand either the number or the proportionof women in that occupation at the beginning of the decade. The indication is thatneither the proportion of the female laborforce in an occupation or the degree ofsexual segregation is related to the trendin the changing proportion of women inoccupations. Further, little or no association was found between the change in theproportion of women and the rate ofgrowth of the occupation over time. Finally, the data show that the proportionof women in an occupation at the beginning of a decade is unrelated to the rate atwhich the proportion of women in thatoccupation changed during the succeedingdecade. The fact that these structural variables turn out to be so relatively unimpor-
tant in explaining trends in the changes inthe proportion of women in occupationsover time is instructive; it clearly suggeststhat future research should be focused onidentifying the specific occupations whichhave accounted most for the change inoccupational differentiation by sex overthe last 70 years as well as the social andeconomic forces at work during specificdecades upon these occupations accounting for the change.
REFERENCES
Cortese, D. F., R. F. Falk, and J. K. Cohen. 1976.Further Considerations on the MethodologicalAnalysis of Segregation Indexes. American Sociological Review 41:630-637.
Davis, Kingsley. 1948. Human Society. New York:Macmillan.
Duncan, O. D., and B. Duncan. 1955. ResidentialDistribution and Occupational Stratification.American Journal of Sociology 60:493-503.
Edwards, A. 1943. Comparative Occupational Statistics in the United States, 1870-1940. Washington, D.C.: U.S. Government Printing Office.
Gross, E. 1968. Plus ca Change ... ? The SexualStructure of Occupations Over Time. Social Problems 16:198-208.
Hawley, Amos H. 1950. Human Ecology. NewYork: Roland Press.
Kaplan, D. L., and M. C. Casey. 1958.OccupationalTrends in the United States, 1900-1950. U.S. Bureau of the Census, Working Paper No.5. Washington, D.C.: U.S. Government Printing Office.
Moore, W. E. 1951. Industrial Relations and theSocial Order. New York: Macmillan.
Oppenheimer, Valerie K. 1970. The Female LaborForce in the United States. Berkeley: Universityof California, Population Mongraph Series, No.5.
--. 1973. Demographic Influence on FemaleEmployment and the Status of Women. In JoanHuber (ed.), Changing Women in a ChangingSociety. Chicago: University of Chicago Press.
Priebe, John A. 1968. Changes Between the 1950and1960 Occupation and Industry Classifications.Technical Paper 18. Washington, D.C.: U.S. Government Printing Office.
--, J.Heinkel, and S. Greene. 1972. 1970 Occupation and Industry Classification System inTerms of Their 1960 Occupation and IndustryElements. Technical Paper 26. Washington, D.C.:U.S. Government Printing Office.
Taeuber, Karl E., and Alma F. Taeuber. 1965. Negroes in Cities. Chicago: Aldine.
Treiman, D. J., and K. Terrell. 1975. Women, Work,and Wages-Trends in the Female Occupational

U.S. Labor Force and Occupational Differences by Sex 87
Structure Since 1940. In K. C. Land and S. Spilerman, Social Indicator Models. New York: RussellSage Foundation.
U.S. Bureau of the Census. 1953. U.S. Census ofPopulation, 1950. Vol. II, Part I: Chapter C-I,Table 124; Chapter C-51, Table 46; Chapter C-52,Table 52. Washington, D.C.: U.S. GovernmentPrinting Office.
---. 1964. U.S. Census of Population, 1960. Vol.
I, Characteristics of the Population: Part II Table201, U.S. Summary. Washington, D.C.: U.S.Government Printing Office.
---. 1973. 1970 Census of Population. Vol. PC(1)-01, Table 221. Washington, D.C.: U.S. Government Printing Office.
Williams, G. 1976. Trends in Occupational Differentiation by Sex. Sociology of Work and Occupations 3:38-62.