The Changing Face of Development Finance Amar Bhattacharya G24 Secretariat February, 2008 The...
57
The Changing Face of Development Finance Amar Bhattacharya G24 Secretariat February, 2008 The Changing Face of Development Finance Amar Bhattacharya G24 Secretariat February, 2008
-
Upload
elwin-hodge -
Category
Documents
-
view
217 -
download
1
Transcript of The Changing Face of Development Finance Amar Bhattacharya G24 Secretariat February, 2008 The...

The Changing Face of Development Finance
Amar BhattacharyaG24 SecretariatFebruary, 2008
The Changing Face of Development Finance
Amar BhattacharyaG24 SecretariatFebruary, 2008

I. From Divergence………….to
Convergence
But many challenges remain…
-2
0
2
4
6
8
1981 82 83 84 85 86 87 88 89
1990 91 92 93 94 95 96 97 98 99
2000 1 2 3 4
2005 6 7 8 9
Accelerating growth in developing economiesAccelerating growth in developing economies
Real GDP, percent changeReal GDP, percent change
Early 1980s debt crisis
1990s recession Transition countries
East Asia financial crisis
2001 global downturn
ForecastForecast
Source: World Bank.
Developing economies

-2
0
2
4
6
8
1981 82 83 84 85 86 87 88 89
1990 91 92 93 94 95 96 97 98 99
2000 1 2 3 4
2005 6 7 8 9
Growth has far-exceeded that of high-Growth has far-exceeded that of high-income countries for an extended periodincome countries for an extended period
Real GDP, percent changeReal GDP, percent change
High-income
Source: World Bank.
Developing economies
ForecastForecast
-2
0
2
4
6
8
1981 82 83 84 85 86 87 88 89
1990 91 92 93 94 95 96 97 98 99
2000 1 2 3 4
2005 6 7 8 9
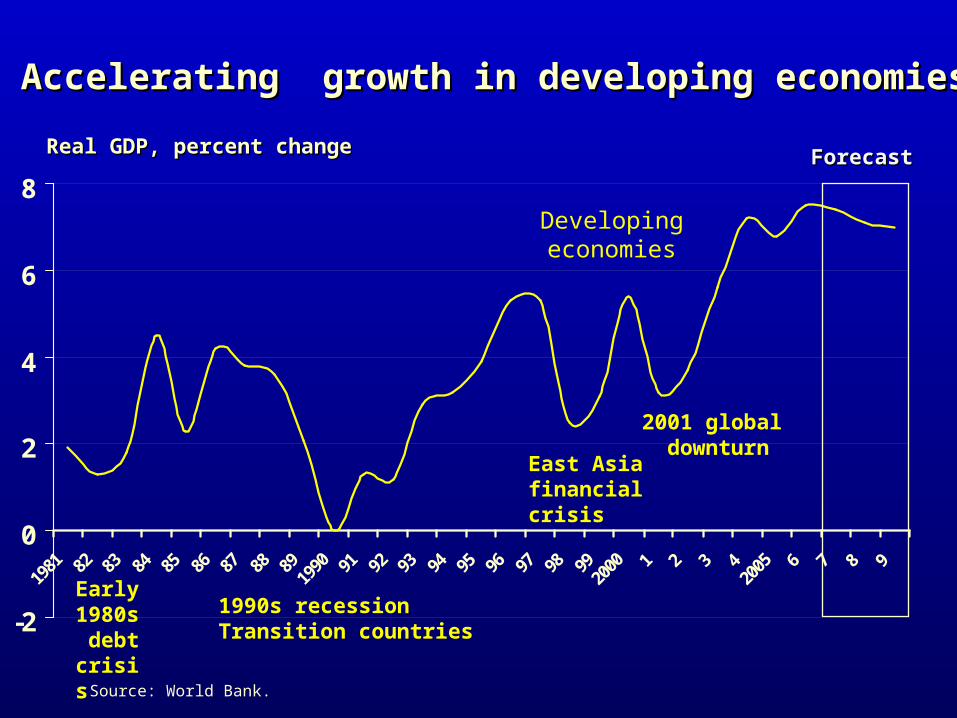
Positive developments in Sub-Saharan Positive developments in Sub-Saharan Africa are of particular noteAfrica are of particular note
Real GDP, percent changeReal GDP, percent change
Sub-Saharan Africa
Source: World Bank.
Developing economies
ForecastForecast
High-income
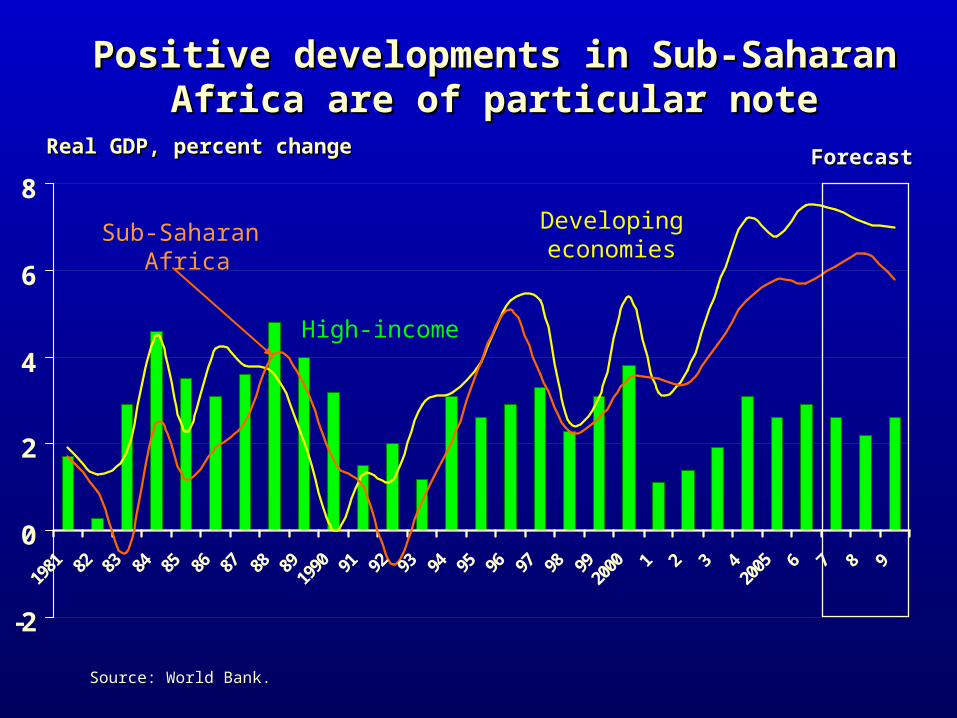
But Many Challenges Remain
Many low-income countries are lagging behind
Mixed progress on MDGs Regional disparities and growing
inequality Environmental sustainability and global
commons
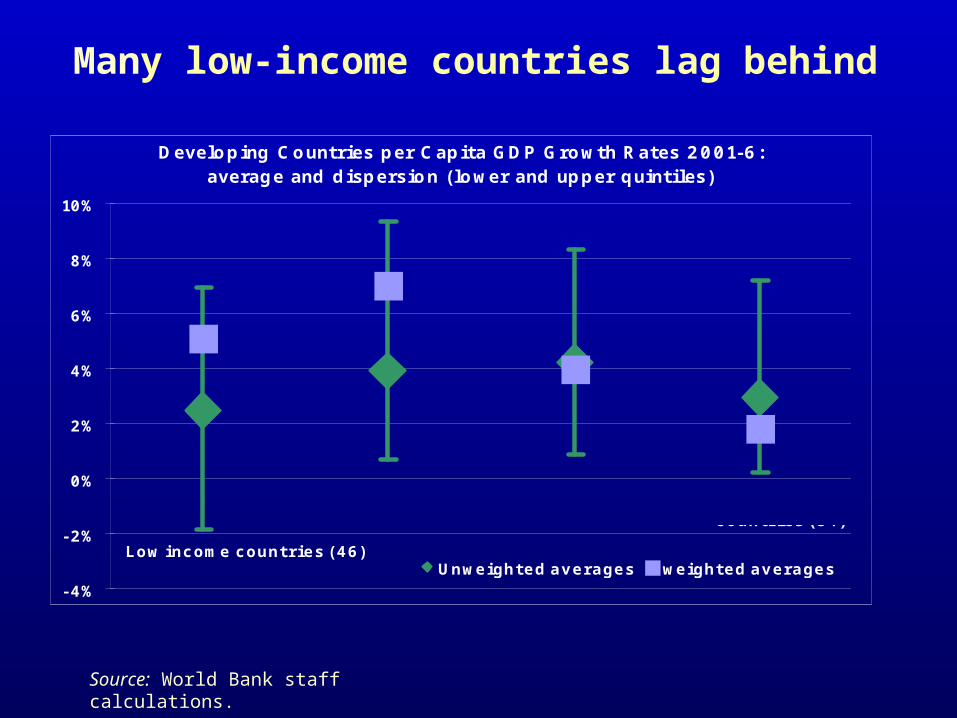
Many low-income countries lag behind
Developing Countries per Capita GDP Growth Rates 2001-6: average and dispersion (lower and upper quintiles)
-4%
-2%
0%
2%
4%
6%
8%
10%
Unweighted averages weighted averagesLow income countries (46)
Lower middle
income countries (48)
Upper middle
income countries (34)
High income
countries (34)
Source: World Bank staff calculations.
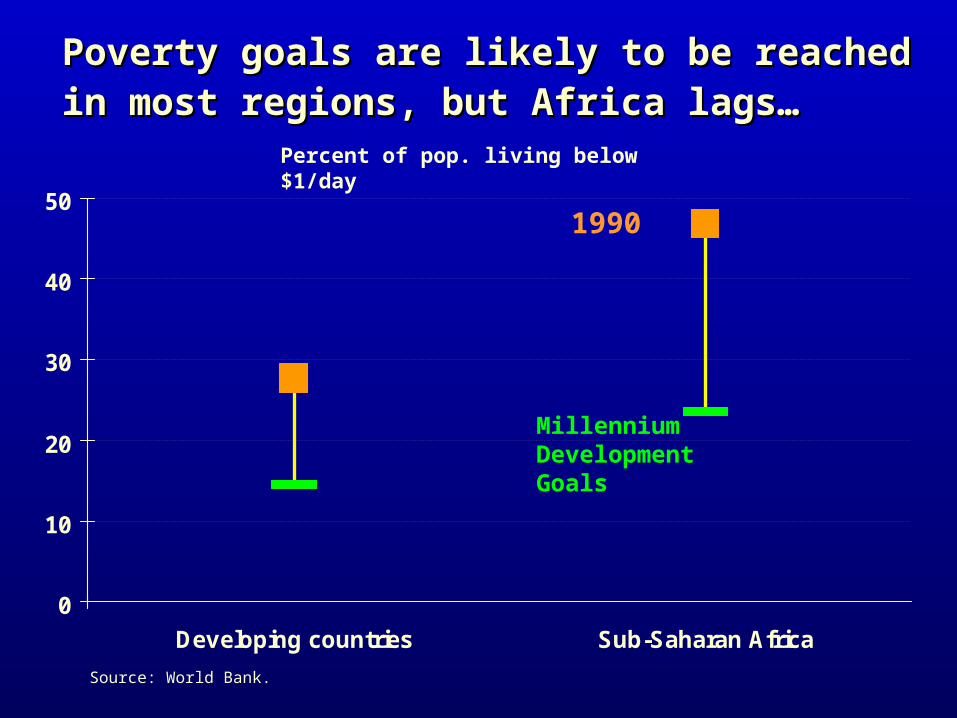
Poverty goals are likely to be reached in Poverty goals are likely to be reached in most regions, but Africa lags…most regions, but Africa lags…
0
10
20
30
40
50
Developing countries Sub-Saharan Africa
Percent of pop. living below $1/day
Millennium Development Goals
Source: World Bank.
1990
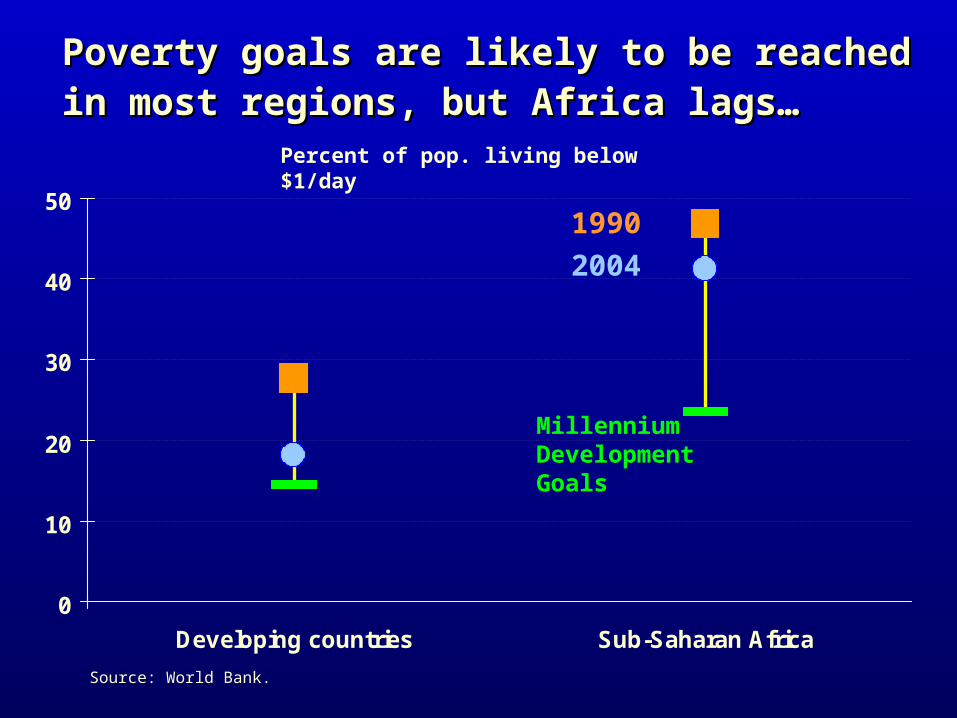
Poverty goals are likely to be reached in Poverty goals are likely to be reached in most regions, but Africa lags…most regions, but Africa lags…
0
10
20
30
40
50
Developing countries Sub-Saharan Africa
Percent of pop. living below $1/day
1990
Source: World Bank.
2004
Millennium Development Goals

Poverty goals are likely to be reached in Poverty goals are likely to be reached in most regions, but Africa lags…most regions, but Africa lags…
0
10
20
30
40
50
Developing countries Sub-Saharan Africa
Percent of pop. living below $1/day
Source: World Bank.
Forecast 2015
1990
2004
Millennium Development Goals
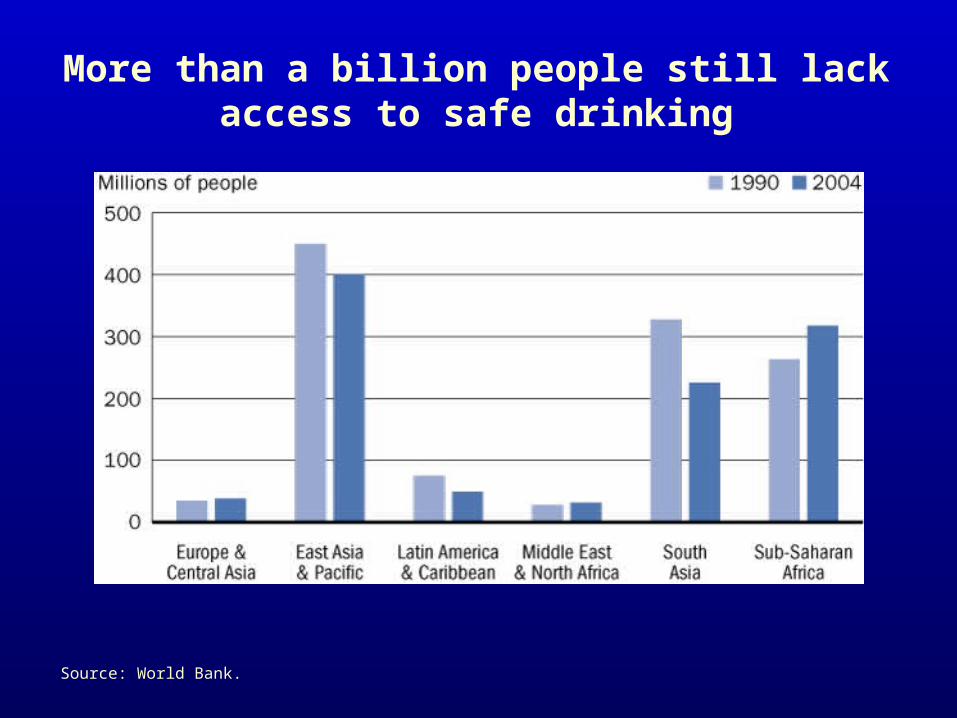
More than a billion people still lack access to safe drinking
Source: World Bank.
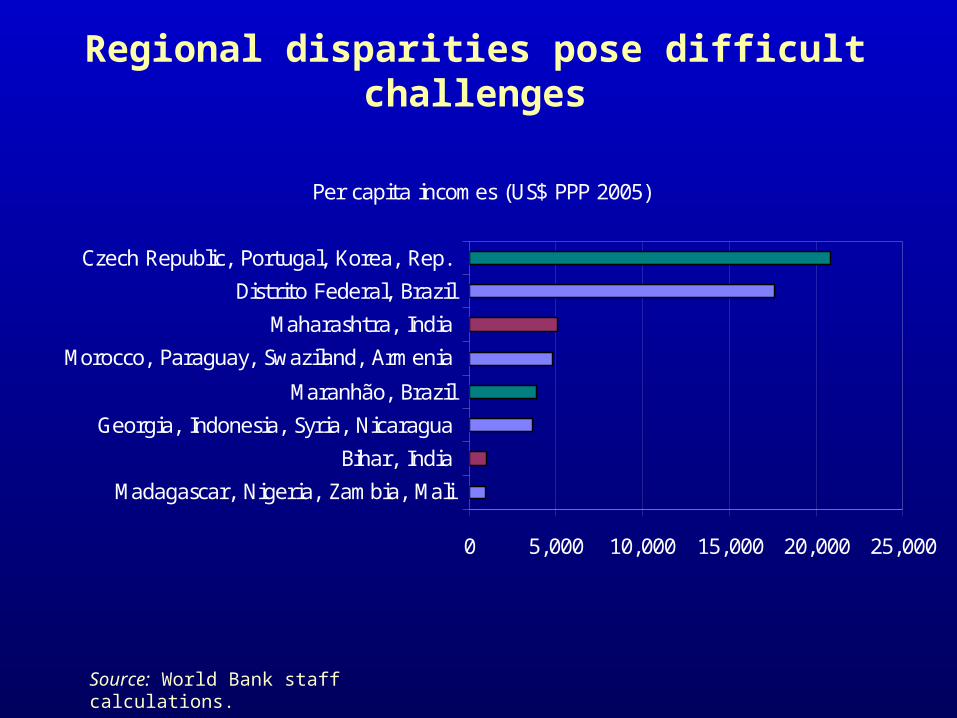
Regional disparities pose difficult challenges
Per capita incomes (US$ PPP 2005)
0 5,000 10,000 15,000 20,000 25,000
Madagascar, Nigeria, Zambia, Mali
Bihar, India
Georgia, Indonesia, Syria, Nicaragua
Maranhão, Brazil
Morocco, Paraguay, Swaziland, Armenia
Maharashtra, India
Distrito Federal, Brazil
Czech Republic, Portugal, Korea, Rep.
Source: World Bank staff calculations.
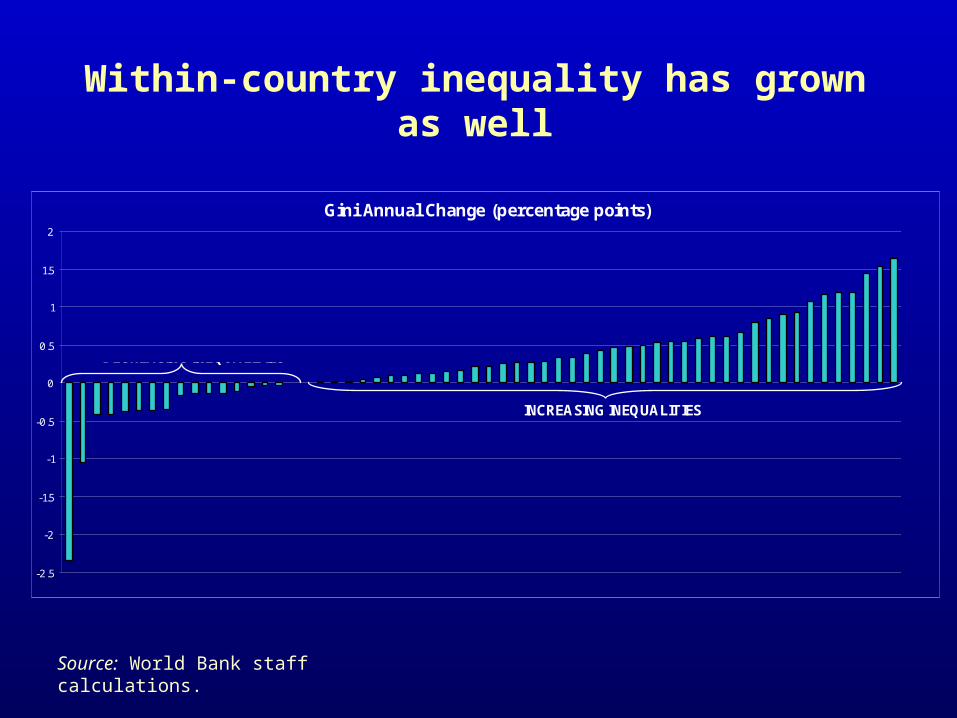
Gini Annual Change (percentage points)
-2.5
-2
-1.5
-1
-0.5
0
0.5
1
1.5
2
INCREASING INEQUALITIES
DECREASING INEQUALITIES
Within-country inequality has grown as well
Source: World Bank staff calculations.

Carbon dioxide emissions are mounting and accumulating in the atmosphere
Source: World Bank.
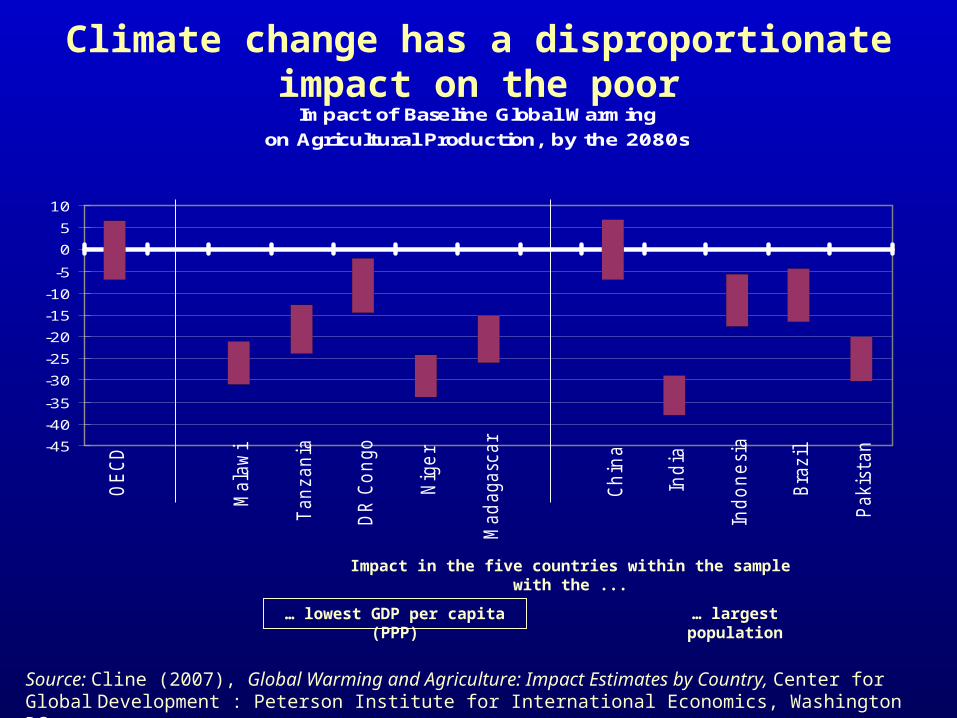
Source: Cline (2007), Global Warming and Agriculture: Impact Estimates by Country, Center for Global Development : Peterson Institute for International Economics, Washington DC.
Climate change has a disproportionate impact on the poor
Impact of Baseline Global Warming
on Agricultural Production, by the 2080s
-45
-40
-35
-30
-25
-20
-15
-10
-5
0
5
10
OECD
Mala
wi
Tanzania
DR C
ongo
Nig
er
Madagasc
ar
Chin
a
India
Indonesi
a
Bra
zil
Pakis
tan
%change in output (range with and without fertilization effect)
… lowest GDP per capita (PPP)
… largest population
Impact in the five countries within the sample with the ...
II. The Changing Context of Development Finance
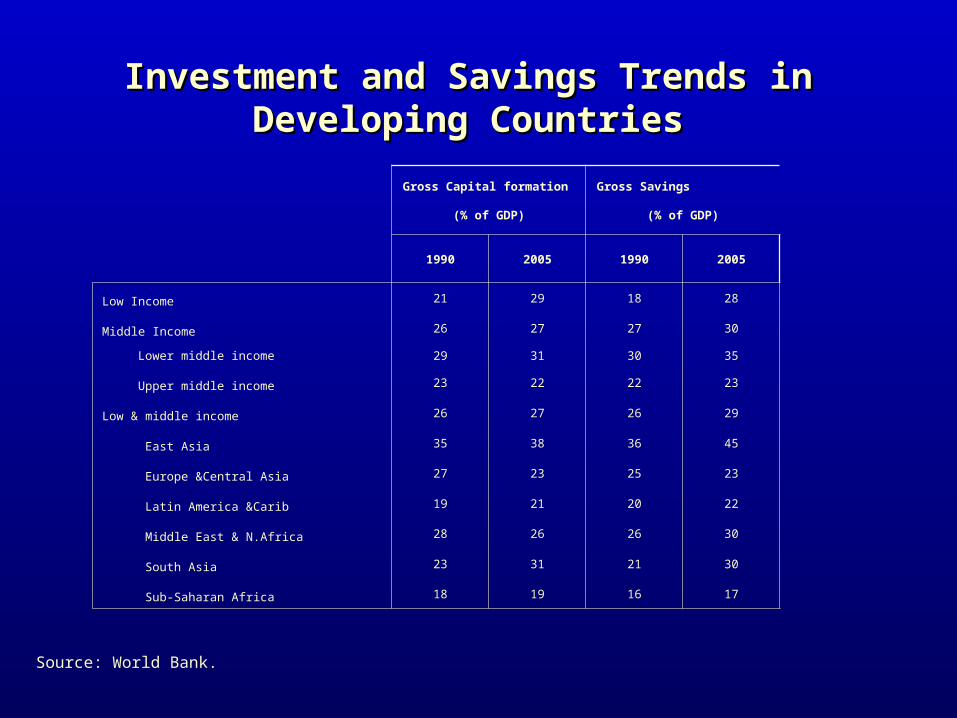
Investment and SavingsInvestment and Savings Trends in Trends in Developing CountriesDeveloping Countries
Gross Capital formation (% of GDP)
Gross Savings
(% of GDP)
1990 2005 1990 2005
Low Income 21 29 18 28
Middle Income 26 27 27 30
Lower middle income 29 31 30 35
Upper middle income 23 22 22 23
Low & middle income 26 27 26 29
East Asia 35 38 36 45
Europe &Central Asia 27 23 25 23
Latin America &Carib 19 21 20 22
Middle East & N.Africa 28 26 26 30
South Asia 23 31 21 30
Sub-Saharan Africa 18 19 16 17
Source: World Bank.
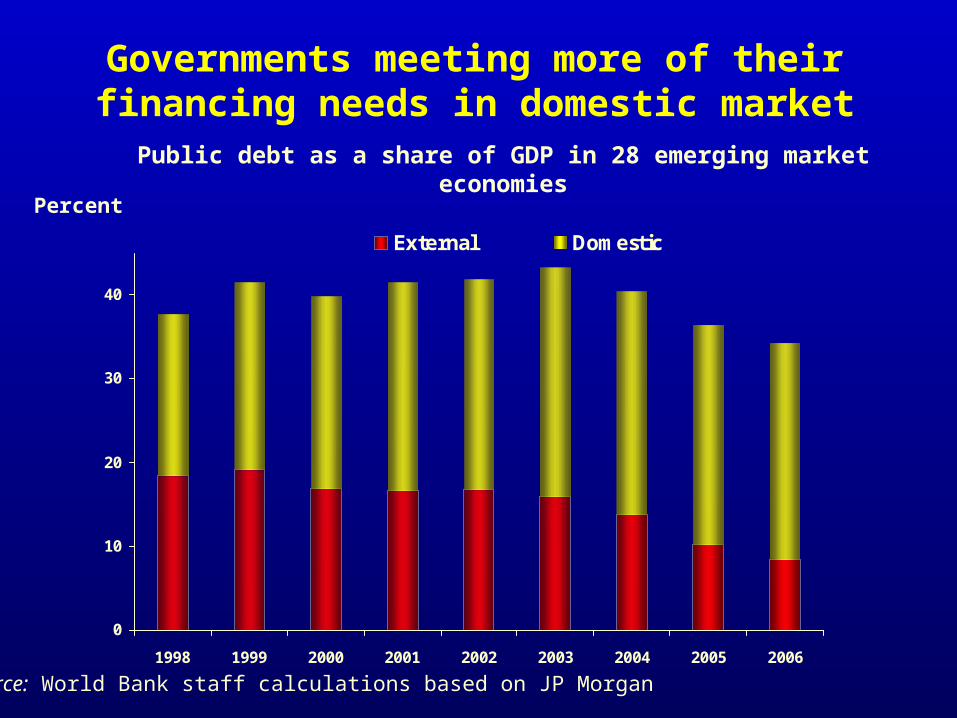
Governments meeting more of their financing needs in domestic market
Source: World Bank staff calculations based on JP Morgan
0
10
20
30
40
1998 1999 2000 2001 2002 2003 2004 2005 2006
External Domestic
Percent
Public debt as a share of GDP in 28 emerging market economies
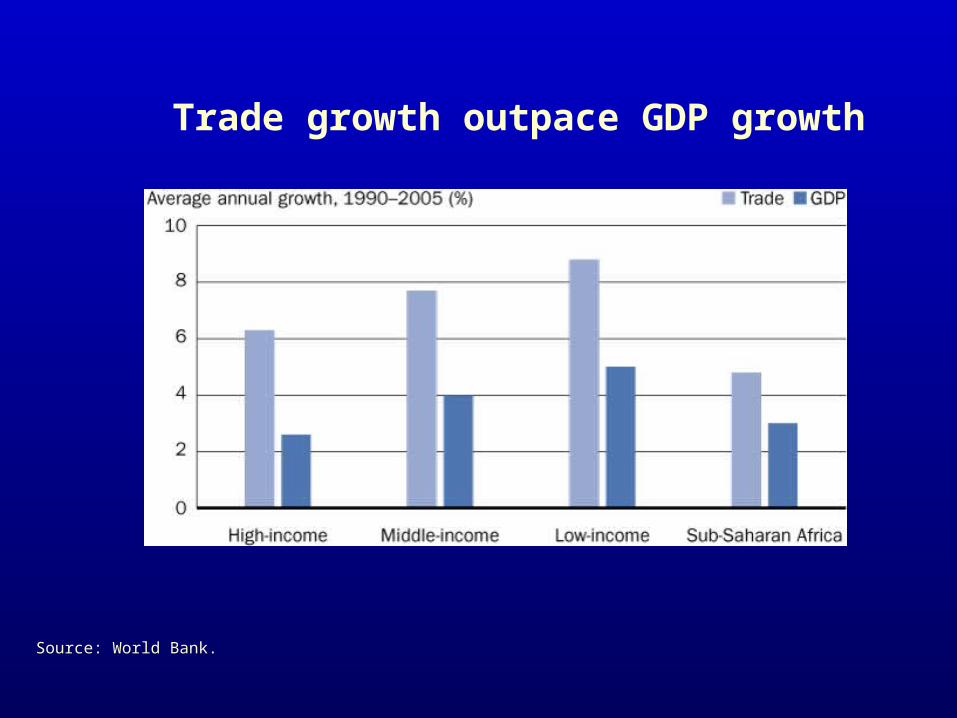
Trade growth outpace GDP growth
Source: World Bank.
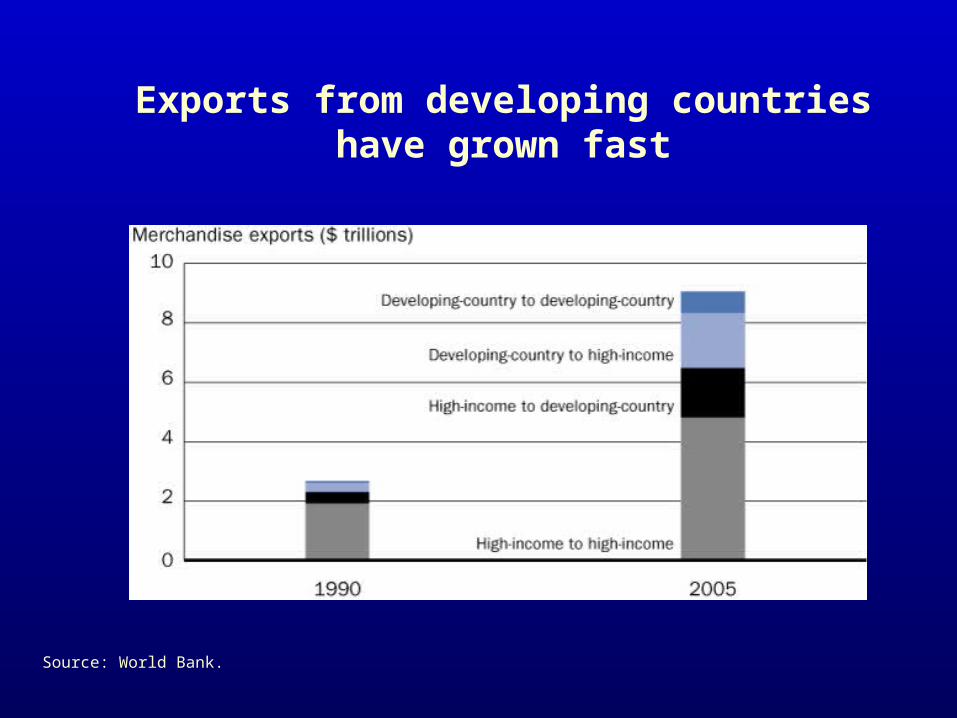
Exports from developing countries have grown fast
Source: World Bank.
$ billions
0
1
2
3
4
2000 2001 2002 2003 2004 2005 2006
Percent
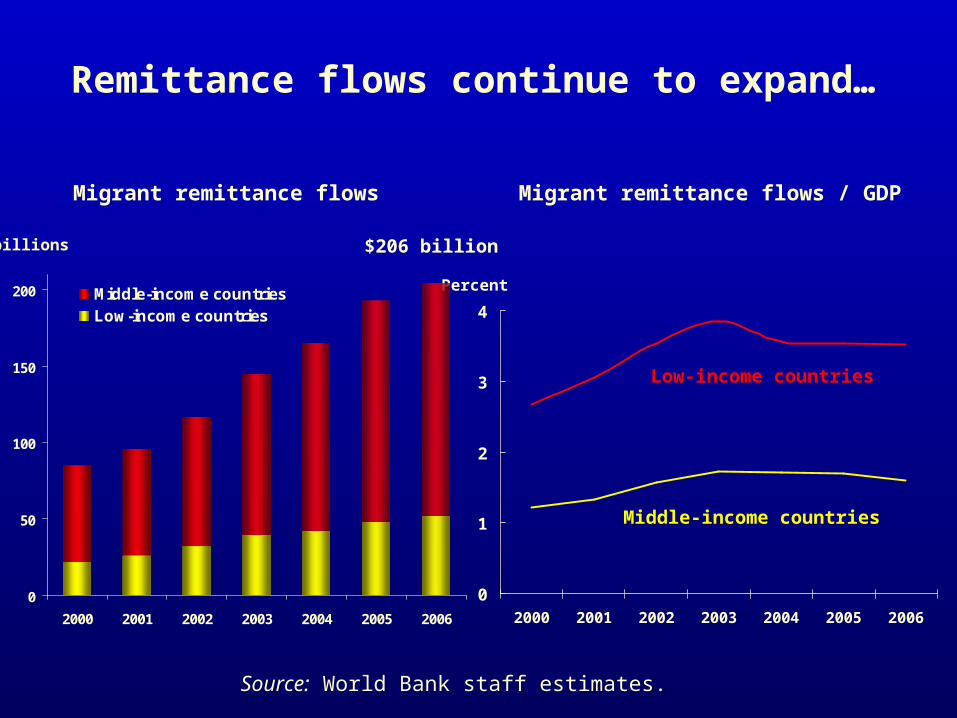
Migrant remittance flows Migrant remittance flows / GDP
Remittance flows continue to expand…
0
50
100
150
200
2000 2001 2002 2003 2004 2005 2006
Middle-income countriesLow-income countries
Low-income countries
Middle-income countries
$206 billion
Source: World Bank staff estimates.
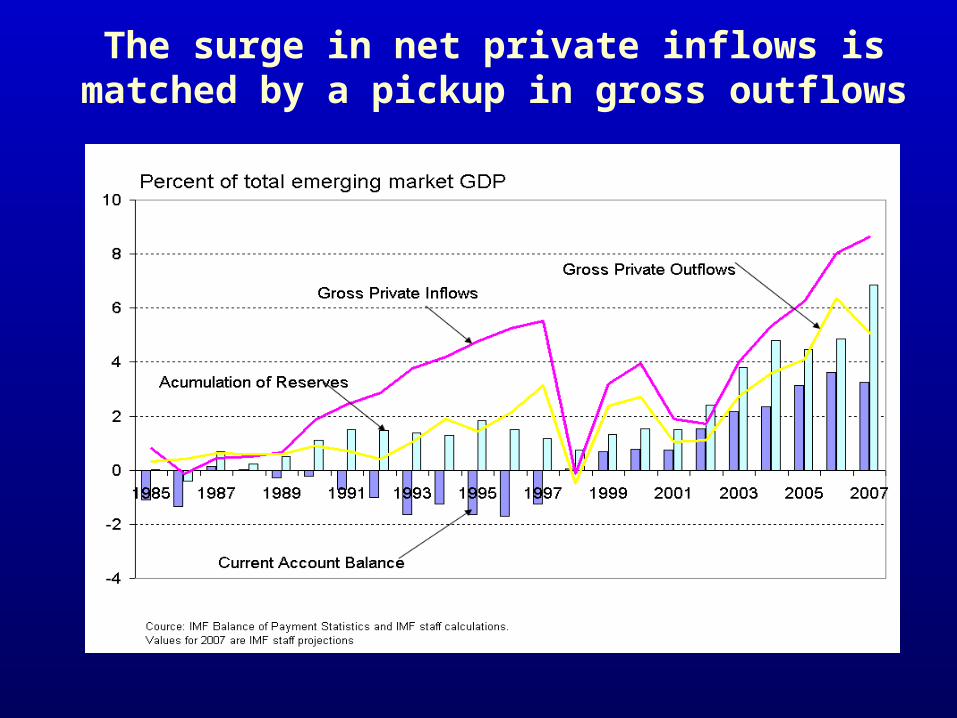
The surge in net private inflows is matched by a pickup in gross outflows
$ billions
0
100
200
300
400
500
600
700
1990 1992 1994 1996 1998 2000 2002 2004 2006
0
1
2
3
4
5
6
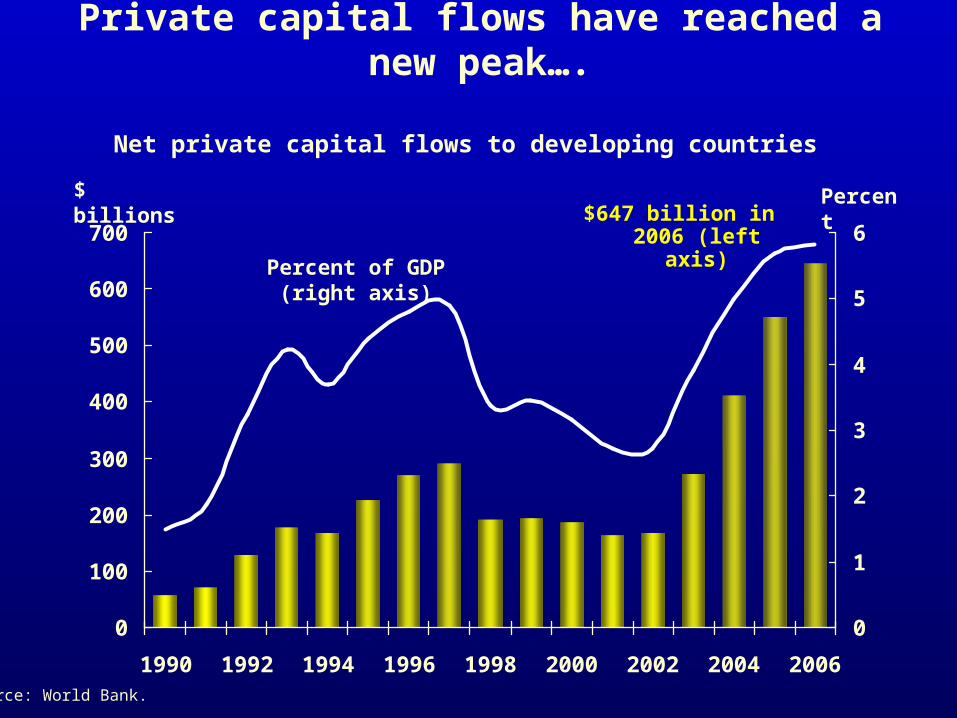
Net private capital flows to developing countries
Percent of GDP (right axis)
Percent$647 billion in
2006 (left axis)
Private capital flows have reached a new peak….
Source: World Bank.
-100
0
100
200
300
400
500
600
700
1990 1992 1994 1996 1998 2000 2002 2004 2006
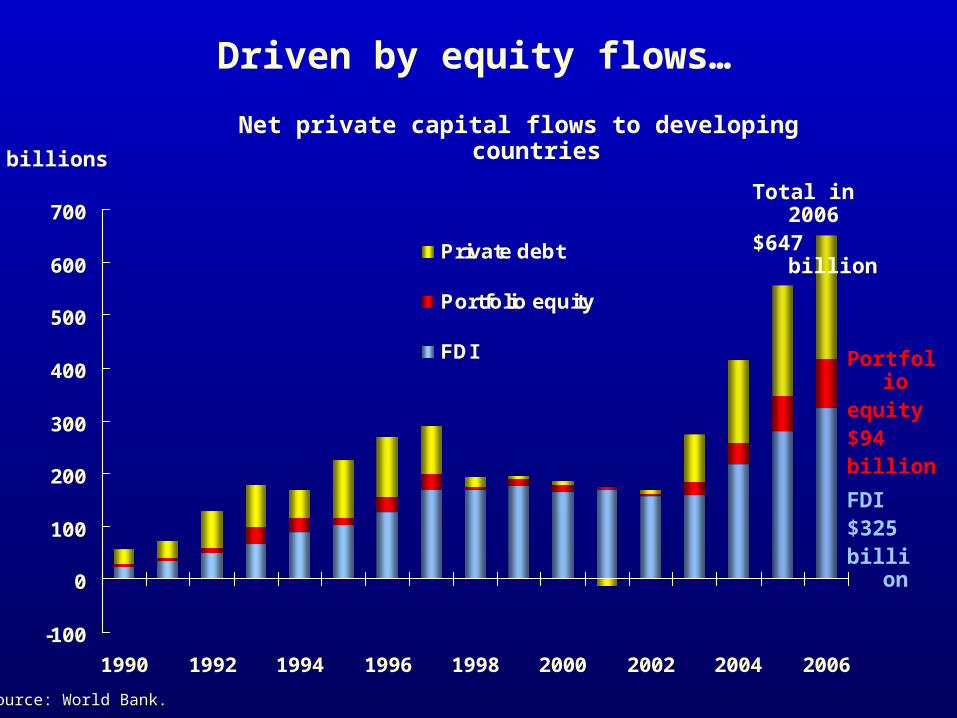
Private debt
Portfolio equity
FDI
$ billions
Total in 2006
$647 billion
FDI$325billio
n
Net private capital flows to developing countries
Driven by equity flows…
Portfolio
equity$94billion
Source: World Bank.
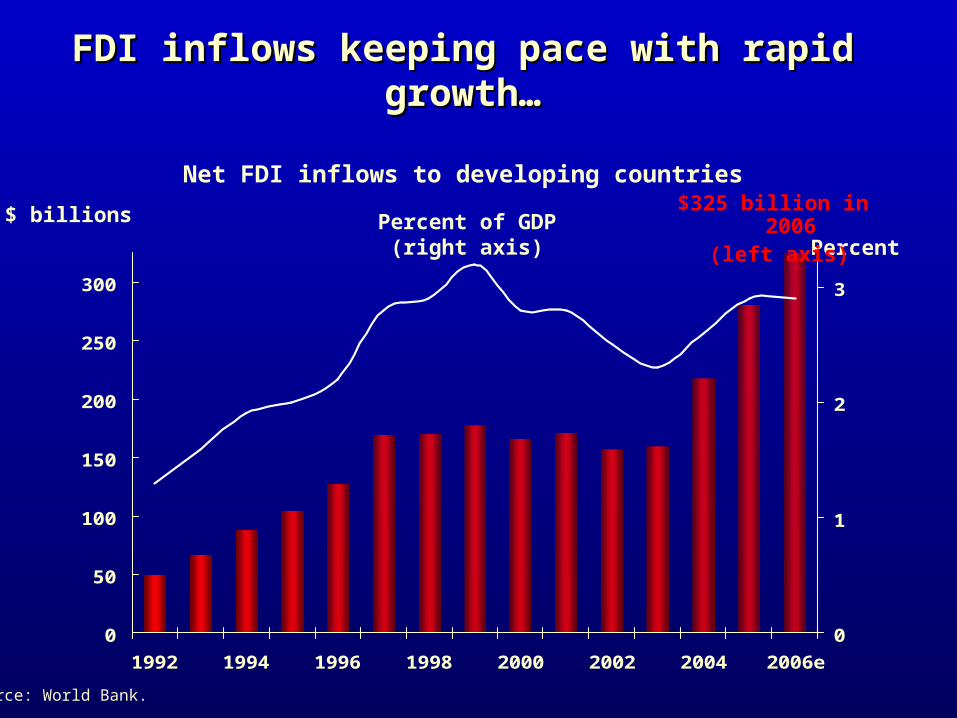
0
50
100
150
200
250
300
1992 1994 1996 1998 2000 2002 2004 2006e
0
1
2
3
$ billions
FDI inflows keeping pace with rapid FDI inflows keeping pace with rapid growth…growth…
Net FDI inflows to developing countries
PercentPercent of GDP
(right axis)
$325 billion in 2006
(left axis)
Source: World Bank.
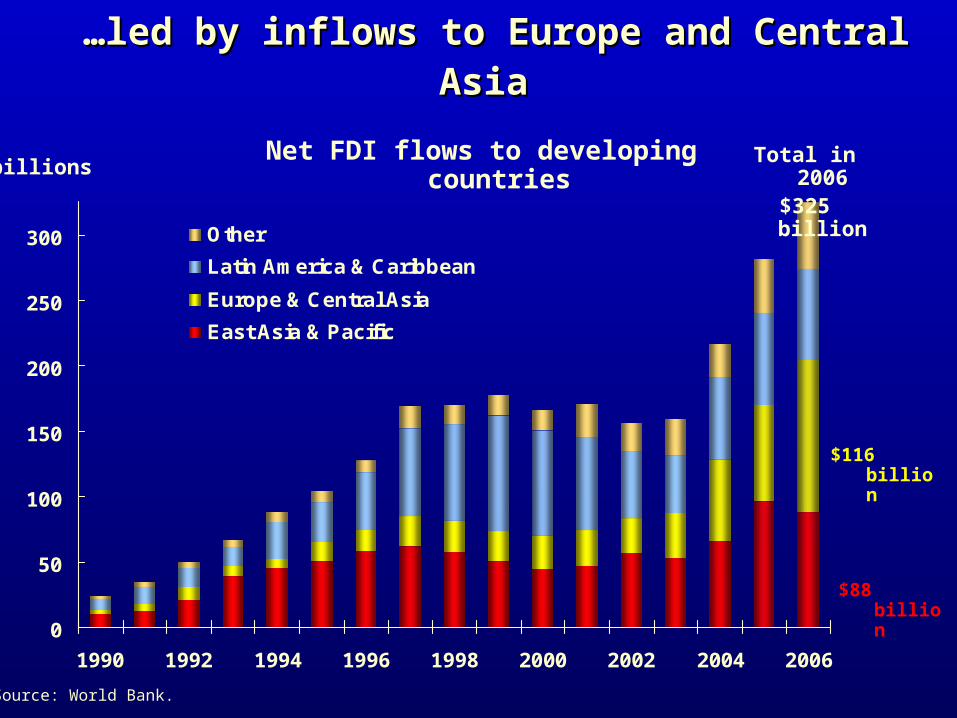
0
50
100
150
200
250
300
1990 1992 1994 1996 1998 2000 2002 2004 2006
Other
Latin America & Caribbean
Europe & Central Asia
East Asia & Pacific
$ billionsTotal in
2006$325 billion
$88 billion
Net FDI flows to developing countries
……ledled byby inflows to Europe and Central inflows to Europe and Central AsiaAsia
$116 billion
Source: World Bank.
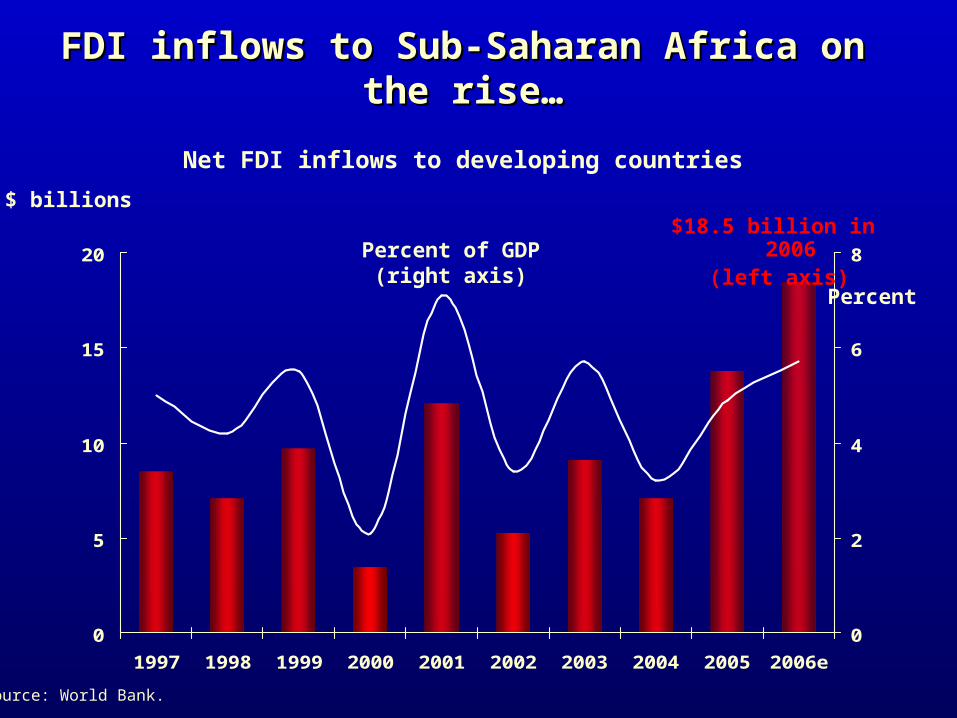
0
5
10
15
20
1997 1998 1999 2000 2001 2002 2003 2004 2005 2006e
0
2
4
6
8
$ billions
FDI inflows to Sub-Saharan Africa on the FDI inflows to Sub-Saharan Africa on the rise…rise…
Net FDI inflows to developing countries
Percent
Percent of GDP (right axis)
$18.5 billion in 2006
(left axis)
Source: World Bank.
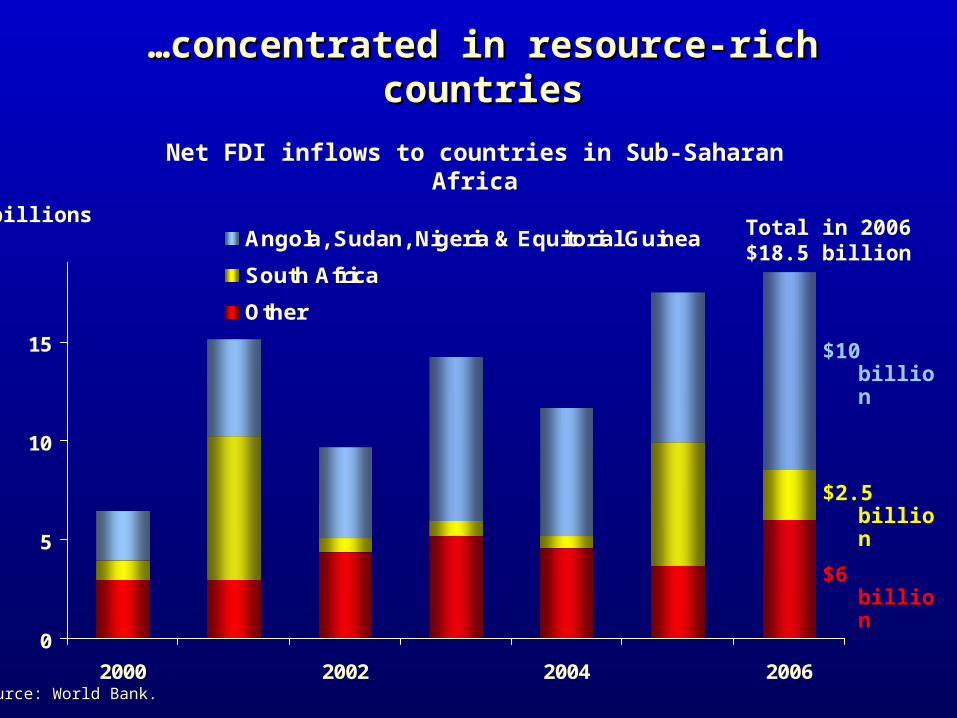
0
5
10
15
2000 2002 2004 2006
Angola, Sudan, Nigeria & Equitorial Guinea
South Africa
Other
$ billions
……concentrated in resource-rich concentrated in resource-rich countriescountries
$6 billion
Net FDI inflows to countries in Sub-Saharan Africa
Total in 2006$18.5 billion
$2.5 billion
$10 billion
Source: World Bank.
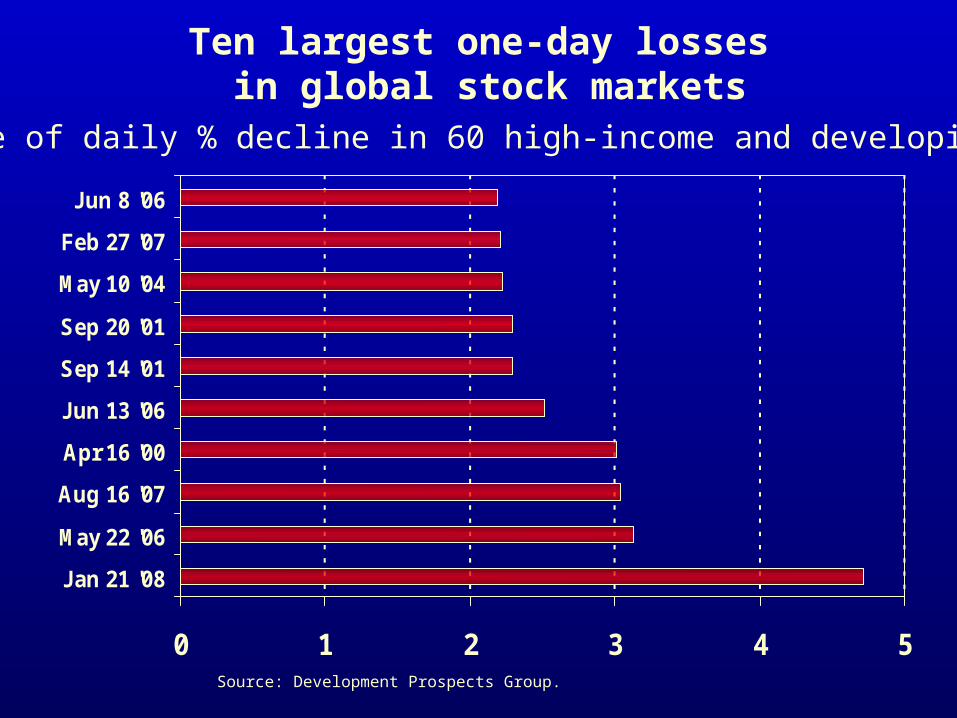
Ten largest one-day losses in global stock markets
0 1 2 3 4 5
Jan 21 '08
May 22 '06
Aug 16 '07
Apr 16 '00
Jun 13 '06
Sep 14 '01
Sep 20 '01
May 10 '04
Feb 27 '07
Jun 8 '06
Simple average of daily % decline in 60 high-income and developing stock markets
Source: Development Prospects Group.
80
90
100
110
120
130
140
150
160
Jan-07
Jan-07
Feb-07
Mar-07
Apr-07
May-07
Jun-07
Jul-07
Aug-07
Sep-07
Oct-07
Nov-07
Dec-07
Jan-08
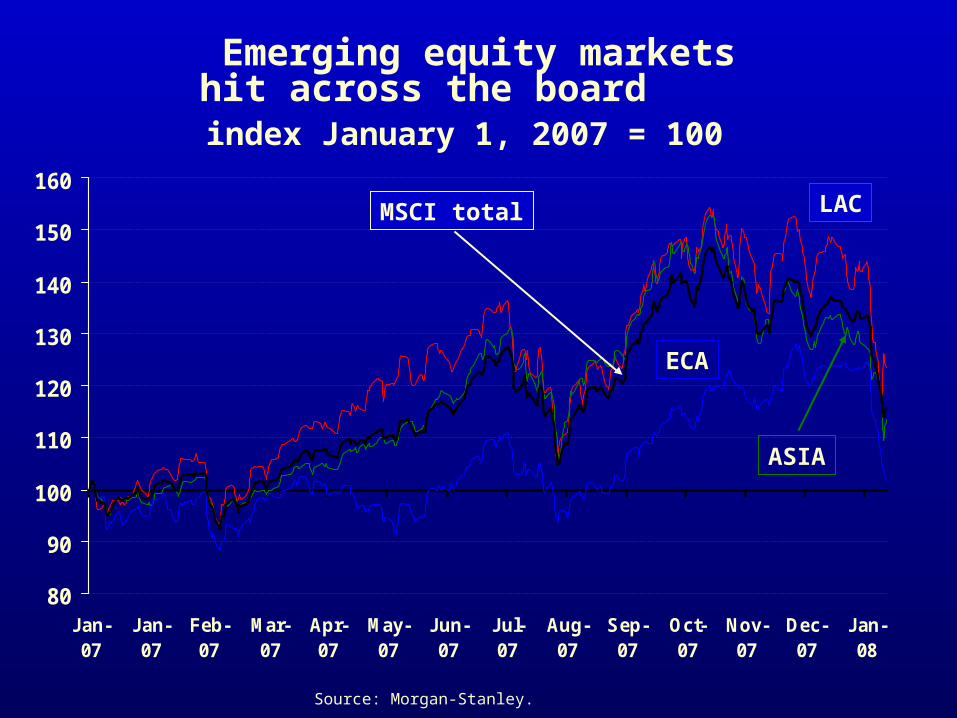
Source: Morgan-Stanley.
Emerging equity markets hit across the board
index January 1, 2007 = 100
ASIA
LACMSCI total
ECA
110
130
150
170
190
210
230
250
270
290
310
Jan-07
Jan-07
Feb-07
Mar-07
Apr-07
May-07
Jun-07
Jul-07
Aug-07
Sep-07
Oct-07
Nov-07
Dec-07
Jan-08
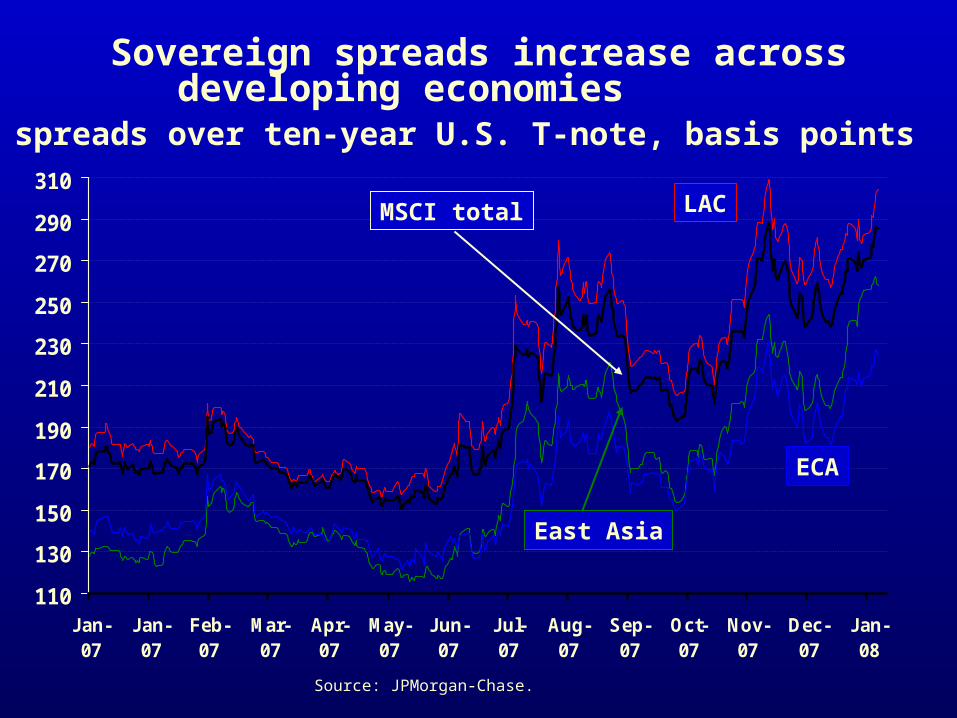
Source: JPMorgan-Chase.
Sovereign spreads increase across developing economies
spreads over ten-year U.S. T-note, basis points
East Asia
LACMSCI total
ECA
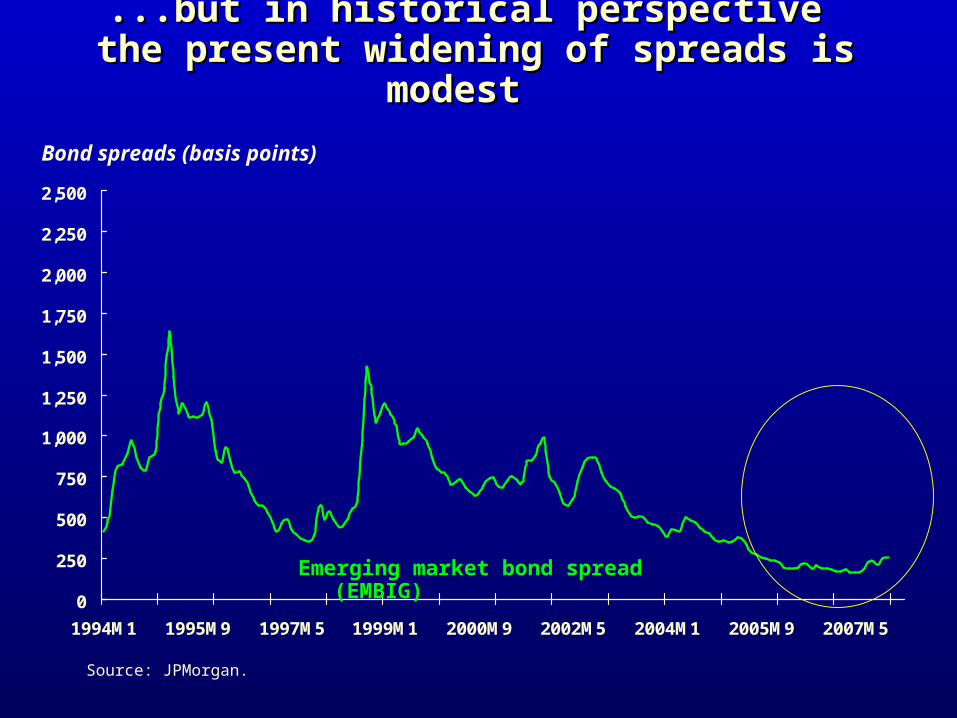
...but in historical perspective ...but in historical perspective the present widening of spreads is the present widening of spreads is
modestmodest
0
250
500
750
1,000
1,250
1,500
1,750
2,000
2,250
2,500
1994M1 1995M9 1997M5 1999M1 2000M9 2002M5 2004M1 2005M9 2007M5
Bond spreads (basis points)
Emerging market bond spread (EMBIG)
Source: JPMorgan.

Developing Country Multinationals are becoming global investors
Source: UNDP
-100
-50
0
50
100
150
200
250
1995 1996 1997 1998 1999 2000 2001 2002 2003 2004 2005 2006
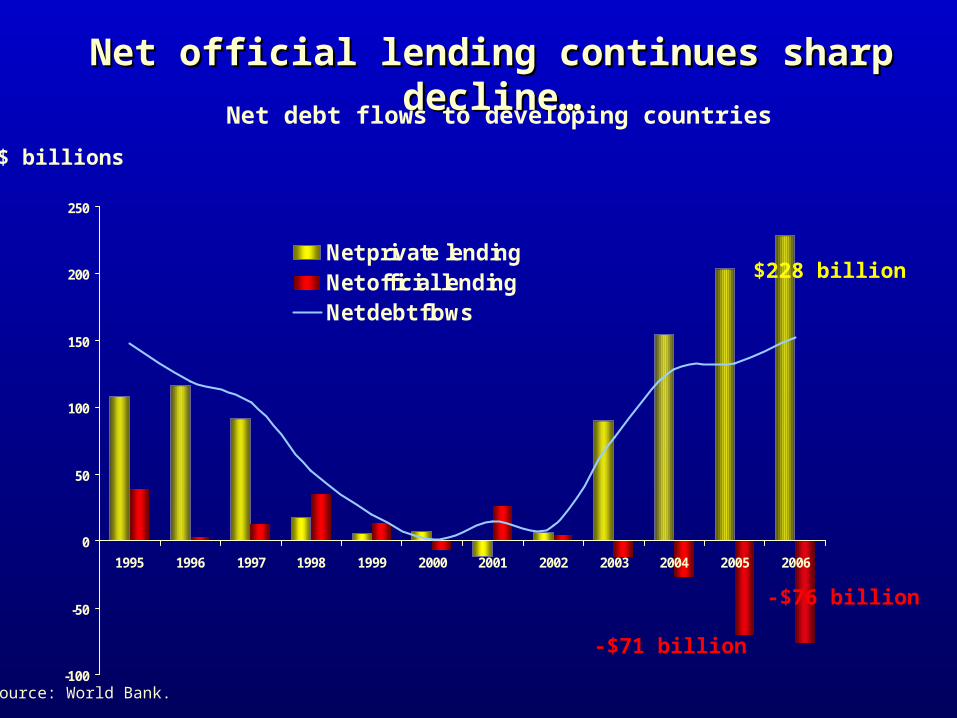
Net private lendingNet official lendingNet debt flows
$ billions
Net official lending continues sharp decline…Net official lending continues sharp decline…
Net debt flows to developing countries
-$76 billion
$228 billion
-$71 billion
Source: World Bank.
-50
-40
-30
-20
-10
0
10
20
30
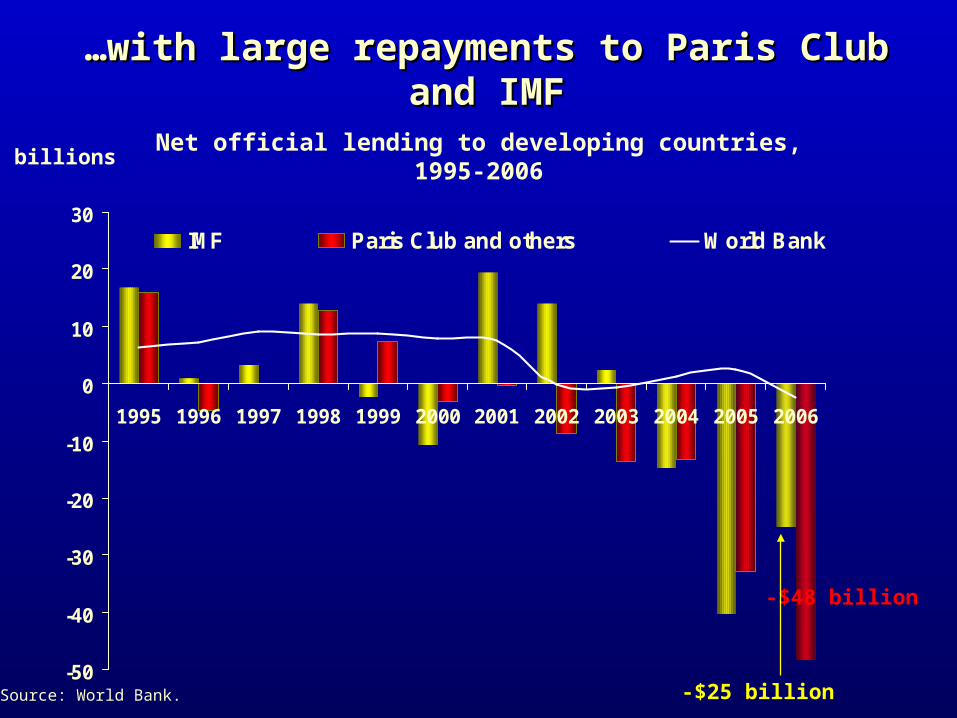
1995 1996 1997 1998 1999 2000 2001 2002 2003 2004 2005 2006
IMF Paris Club and others World Bank
$ billions
……with large repayments to Paris Club and with large repayments to Paris Club and IMFIMF
Net official lending to developing countries, 1995-2006
-$48 billion
-$25 billionSource: World Bank.

Reserve AccumulationReserve Accumulation
Source: IMF, International Financial Statistics, and IMF staff calculations

III. Towards a New Aid Architecture
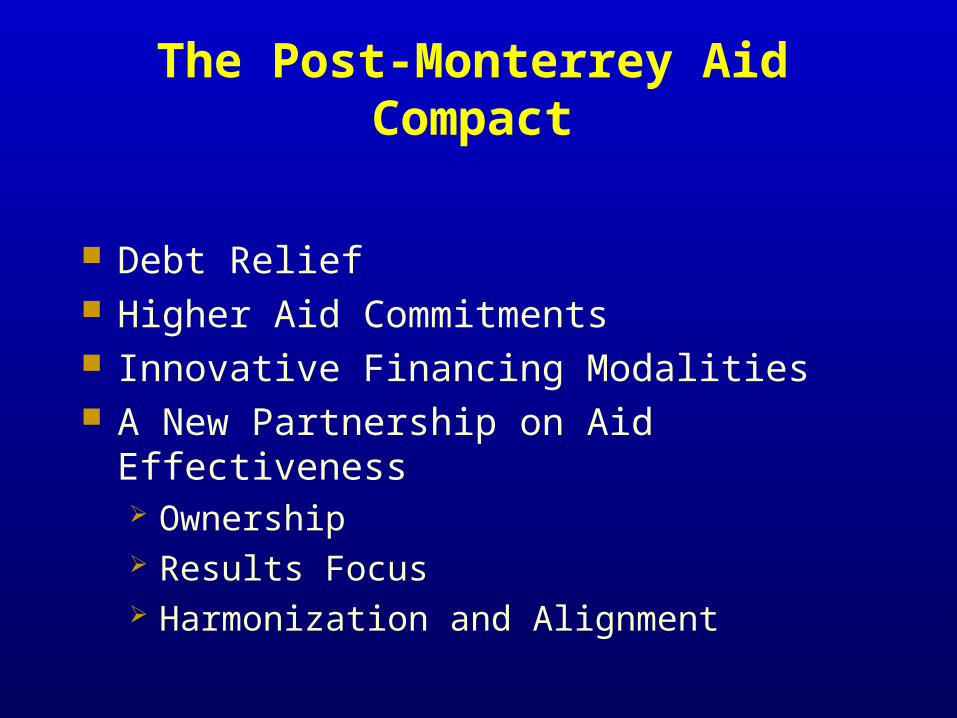
The Post-Monterrey Aid Compact
Debt Relief Higher Aid Commitments Innovative Financing Modalities A New Partnership on Aid Effectiveness
Ownership Results Focus Harmonization and Alignment
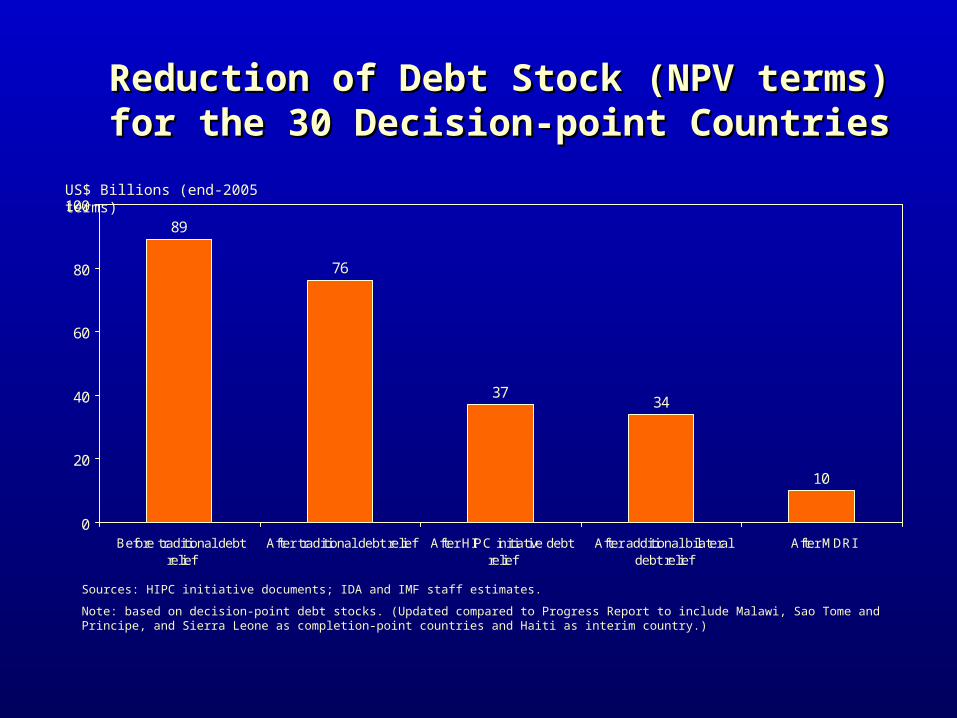
Reduction of Debt Stock (NPV terms) Reduction of Debt Stock (NPV terms) for the 30 Decision-point Countriesfor the 30 Decision-point Countries
89
76
3734
10
0
20
40
60
80
100
Before traditional debtrelief
After traditional debt relief After HIPC initiative debtrelief
After additional bilateraldebt relief
After MDRI
US$ Billions (end-2005 terms)
Sources: HIPC initiative documents; IDA and IMF staff estimates.
Note: based on decision-point debt stocks. (Updated compared to Progress Report to include Malawi, Sao Tome and Principe, and Sierra Leone as completion-point countries and Haiti as interim country.)
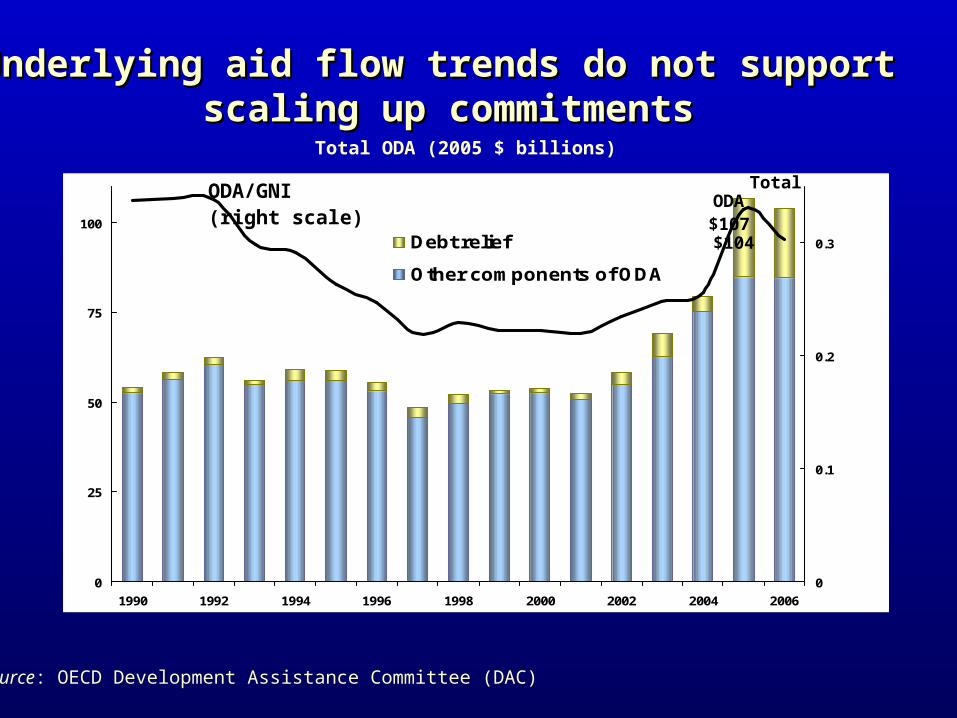
0
25
50
75
100
1990 1992 1994 1996 1998 2000 2002 2004 2006
0
0.1
0.2
0.3Debt relief
Other components of ODA
Total ODA (2005 $ billions)
Percent
Source: OECD Development Assistance Committee (DAC)
ODA/GNI (right scale)
Underlying aid flow trends do not support Underlying aid flow trends do not support scaling up commitmentsscaling up commitments
Total ODA $107 $104
0
25
50
75
100
1990 1992 1994 1996 1998 2000 2002 2004 2006
0
0.1
0.2
0.3Debt relief
Other components of ODA
ODA/GNI (right scale)
Total ODA $107 $104
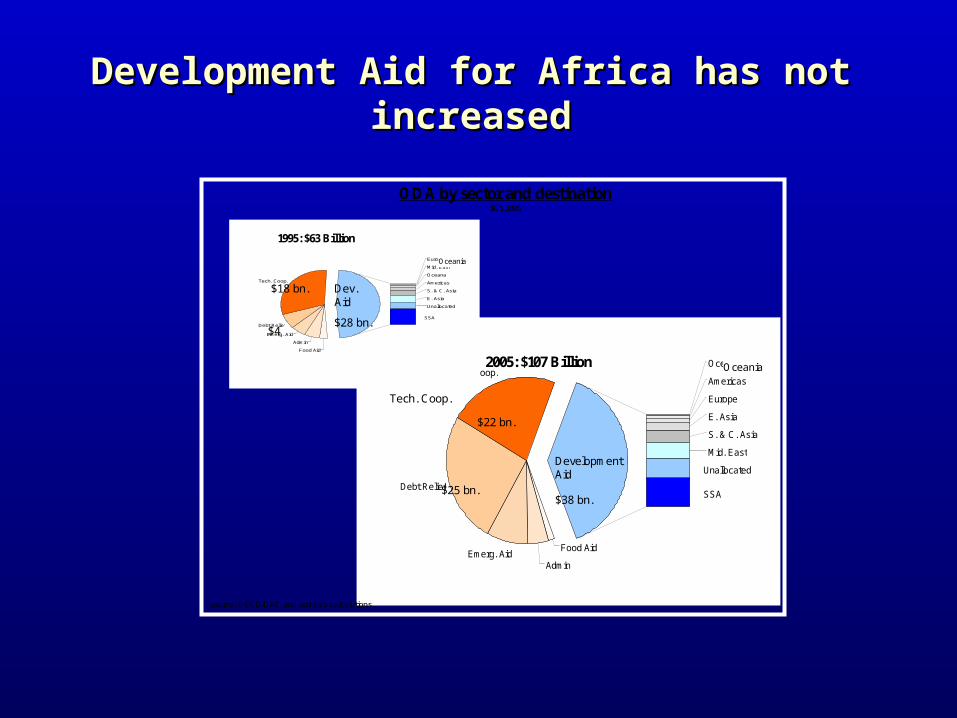
Development Aid for Africa has not Development Aid for Africa has not increasedincreased
Emerg. Aid
Debt Relief
Tech. Coop.Oceana
Americas
Europe
E. Asia
S. & C. Asia
Mid. East
Unallocated
SSA
Food Aid
Admin
Food Aid
Admin
Emerg. Aid
Debt Relief
Tech. Coop.
Europe
Mid. East
Oceana
Americas
S. & C. Asia
E. Asia
Unallocated
SSA
1995: $63 Billion
2005: $107 Billion
$12 bn.
$12 bn.
$38 bn.
$28 bn.
$22 bn.
$18 bn.
$4
$25 bn.
Dev.Aid
Development Aid
source: OECD/DAC and author’s calculations.
Tech. Coop.
ODA by sector and destination$US 2005
Oceania
Oceania
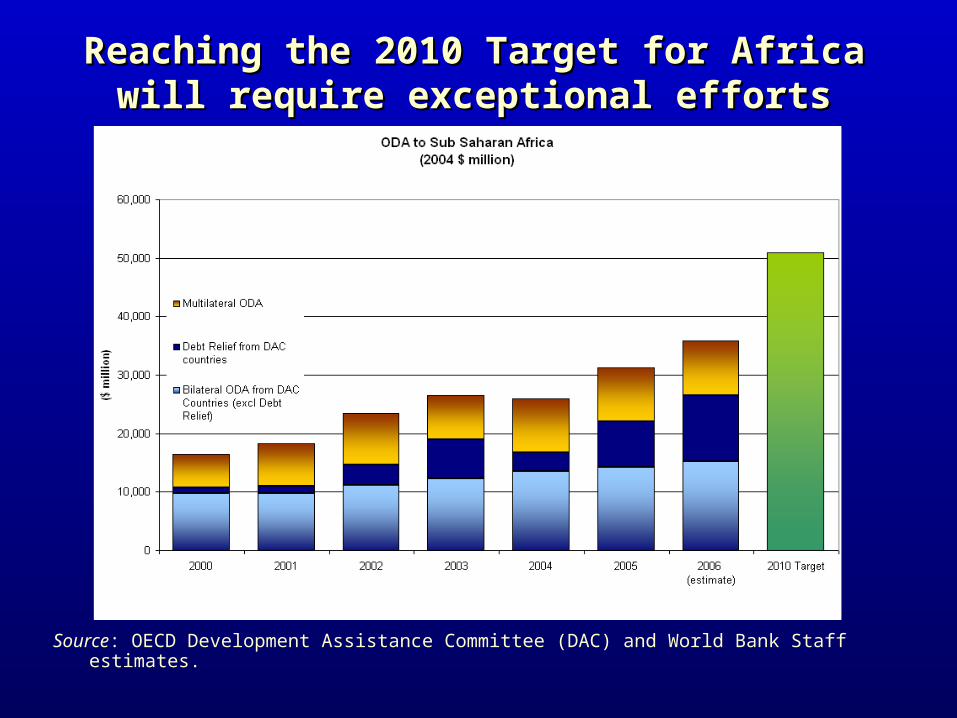
Reaching the 2010 Target for Africa Reaching the 2010 Target for Africa will require exceptional effortswill require exceptional efforts
Source: OECD Development Assistance Committee (DAC) and World Bank Staff estimates.
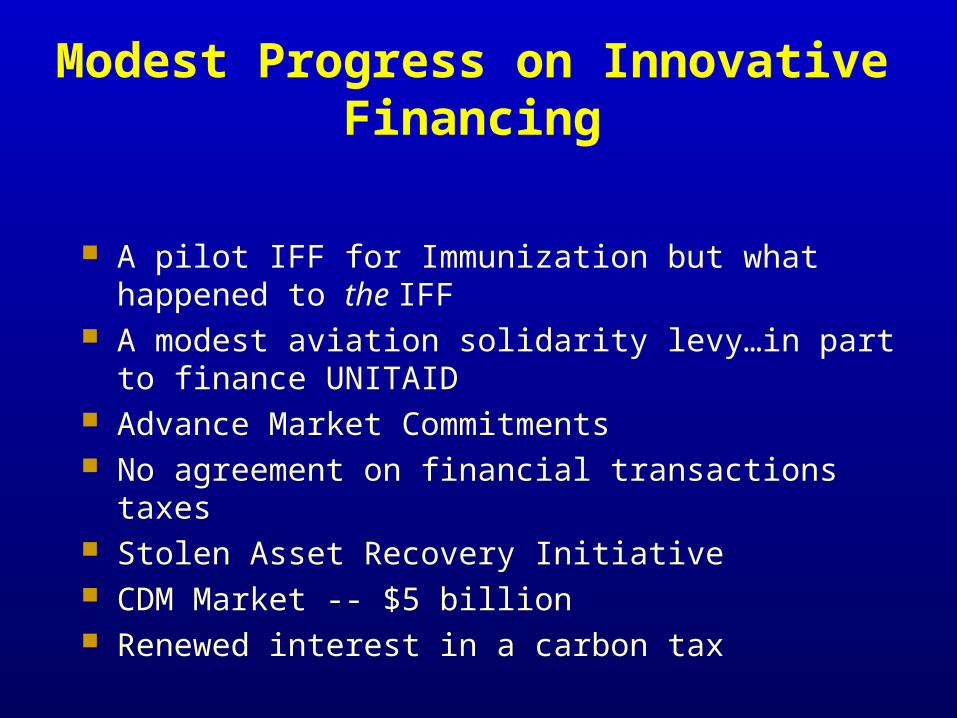
Modest Progress on Innovative Financing
A pilot IFF for Immunization but what happened to the IFF
A modest aviation solidarity levy…in part to finance UNITAID
Advance Market Commitments No agreement on financial transactions taxes Stolen Asset Recovery Initiative CDM Market -- $5 billion Renewed interest in a carbon tax
Limited Progress on Aid Effectiveness
Adoption of PRSPs but... Reduced conditions but... Greater alignment but... Continued volatility and lack of
predictability Increased fragmentation

Harmonisation and alignment
Source: OECD/DAC, 2004
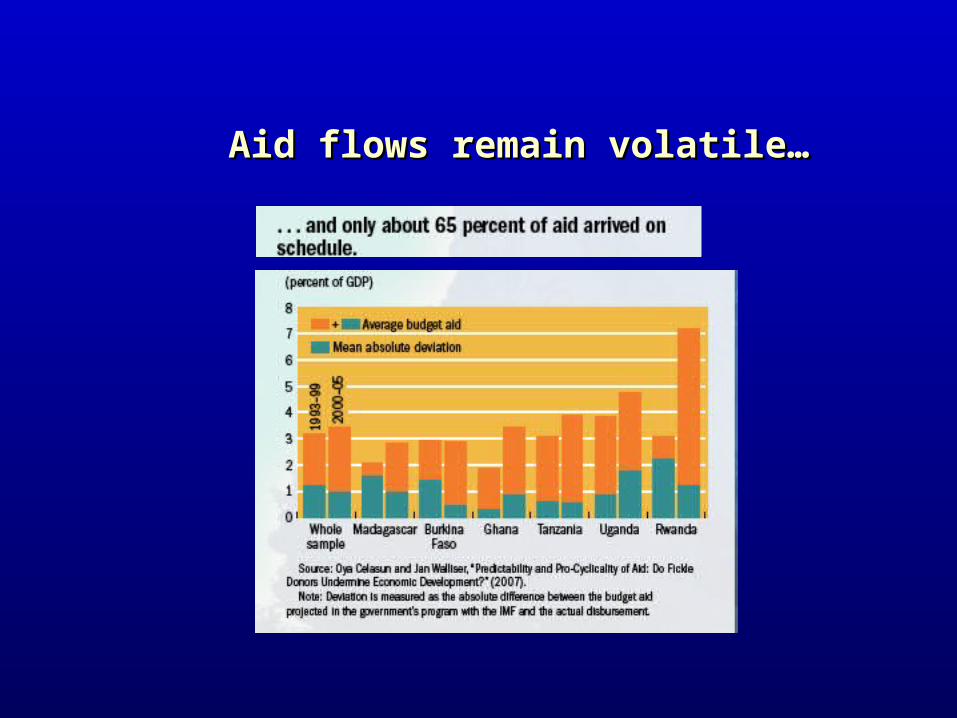
Aid flows remain volatile…Aid flows remain volatile…

Proliferation of donor activity
Emergence of New Players
Proliferation of multilateral channels often in the form of vertical funds
New non-DAC donors including from the South
Growing role of Private Foundations Proliferation of private philanthropic
channels
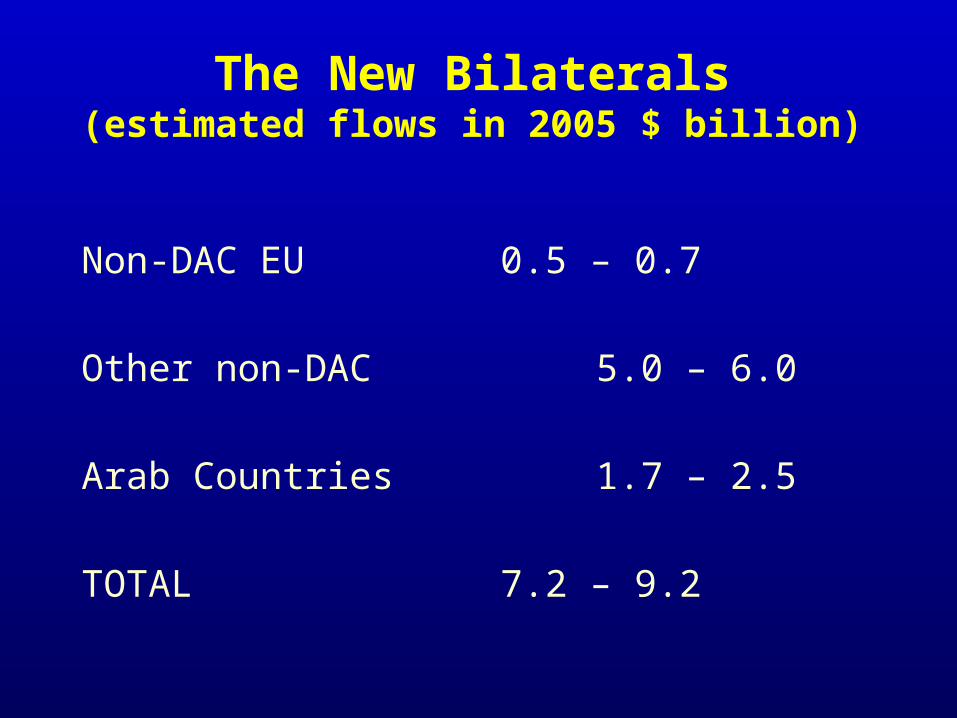
The New Bilaterals(estimated flows in 2005 $ billion)
Non-DAC EU 0.5 – 0.7
Other non-DAC 5.0 – 6.0
Arab Countries 1.7 – 2.5
TOTAL 7.2 – 9.2
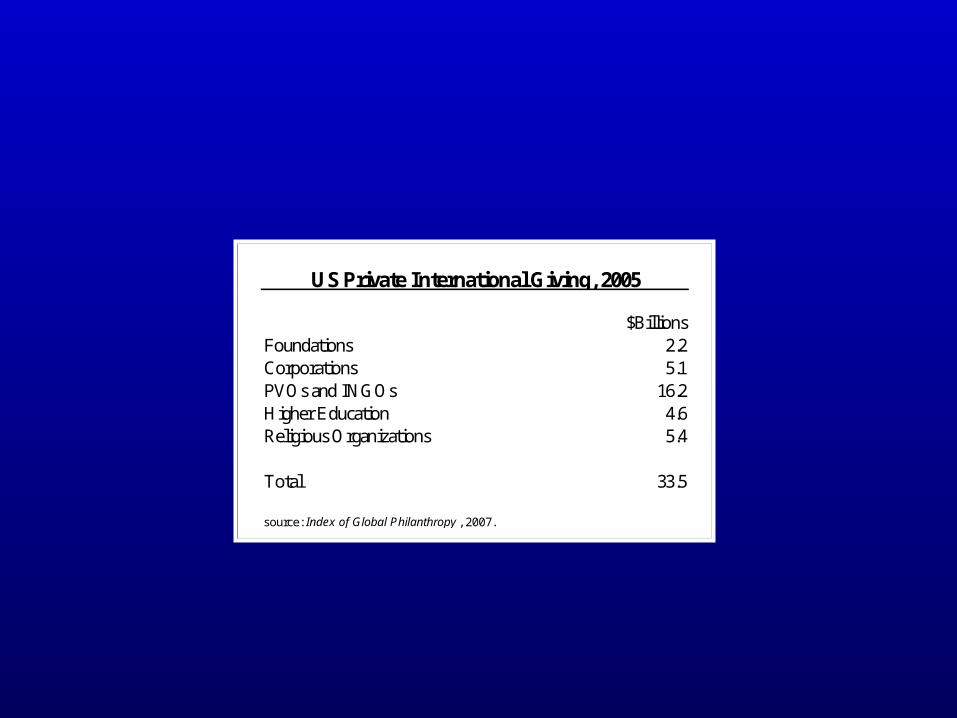
$BillionsFoundations 2.2Corporations 5.1PVOs and INGOs 16.2Higher Education 4.6Religious Organizations 5.4
Total 33.5
source: Index of Global Philanthropy , 2007.
US Private International Giving, 2005
Development Aid
Technical Cooperation
Emergency and Food Aid
Adminstrative Costs
Debt Relief and Interest
Development Aid and TC
Emergency and Food Aid
Adminstrative Costs
0
20
40
60
80
100
US
$2
00
5,
bill
ion
s
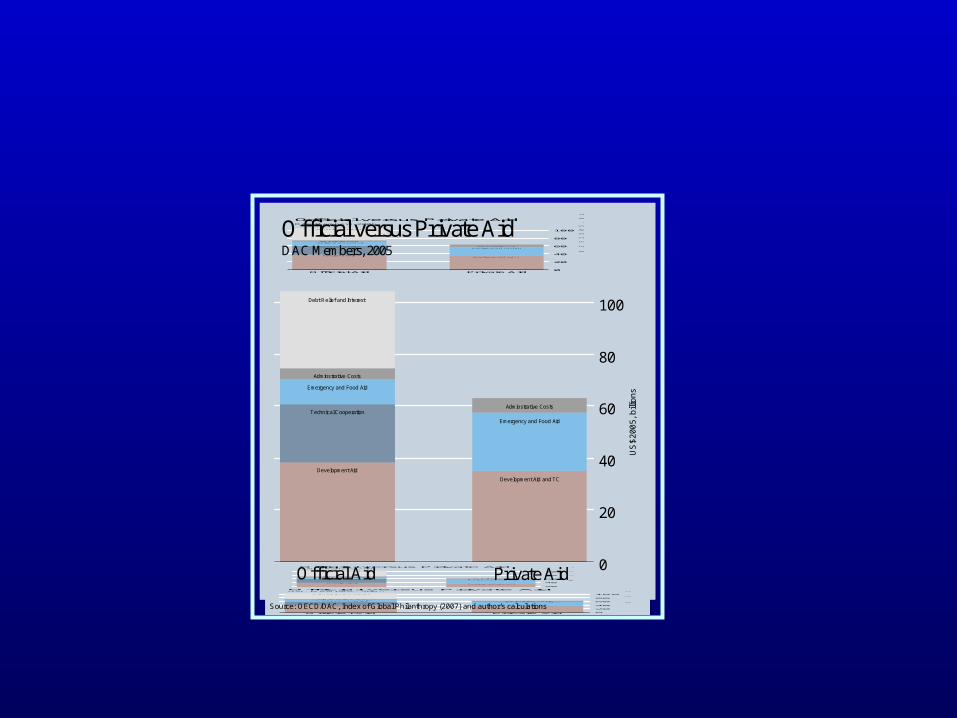
Official Aid Private Aid
DAC Members, 2005
Official versus Private AidDevelopment Aid
Technical Cooperation
Emergency and Food Aid
Adminstrative Costs
Debt Relief and Interest
Development Aid and TC
Emergency and Food Aid
Adminstrative Costs
0
20
40
60
80
100
U
S$2005, billion
s
Official Aid Private Aid
DAC Members, 2005
Official versus Private Aid
Official versus Private AidDAC Members, 2005
Development Aid
Technical Cooperation
Emergency and Food Aid
Adminstrative Costs
Debt Relief and Interest
Development Aid and TC
Emergency and Food Aid
Adminstrative Costs
0
20
40
60
80
100
U
S$
20
05
, b
illio
ns
Official Aid Private Aid
DAC Members, 2005
Official versus Private Aid
Official Aid Private Aid
Development Aid
Technical Cooperation
Emergency and Food Aid
Adminstrative Costs
Debt Relief and Interest
Development Aid and TC
Emergency and Food Aid
Adminstrative Costs
0
20
40
60
80
100
U
S$
20
05
, b
illio
ns
Official Aid Private Aid
DAC Members, 2005
Official versus Private Aid
Source: OECD/DAC, Index of Global Philanthropy (2007) and author’s calculations
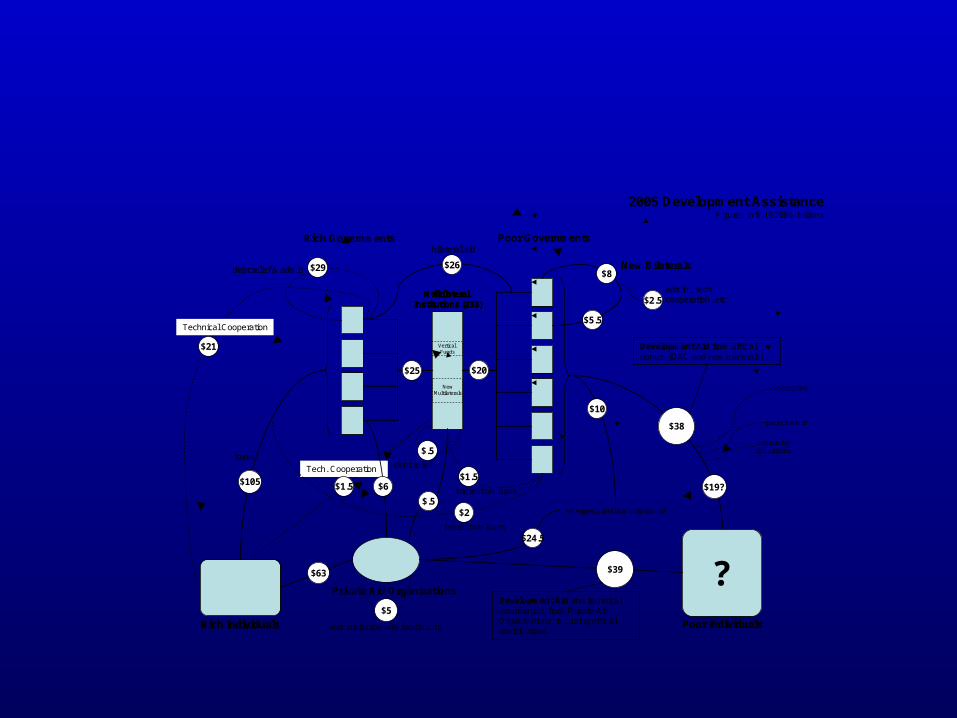
Rich Governments Poor Governments
?Poor Individuals
?Poor Individuals
Private Aid Organizations
corruption
Technical Cooperation
debt relief & admin. New Bilaterals
Rich IndividualsRich IndividualsRich Individuals
Multilateral Institutions (233)
NewMultilaterals
Multilateral Institutions (233)
Multilateral Institutions (233)
Multilateral Institutions (233)
NewMultilaterals
$21
bilateral aid
project admin.
capture byrich citizens
Tech. Cooperation
interest on loans
interest on loans
2005 Development AssistanceFigures in $ US2005, billions
administration and fundraising
debt relief
Vertical Funds
$29 $26
$25 $20
$.5
$105 $1.5 $6
$2
$1.5
$63
$5
$39
$19?
$5.5
$2.5
$8
admin., tech. cooperation, etc.
taxes
$.5
$10
emergency and humanitarian aid
$24.5
$38
Development Aid and technical cooperation, from Private Aid Organizations, including official contributions
Development Aid from official donors (DAC and new bilaterals)
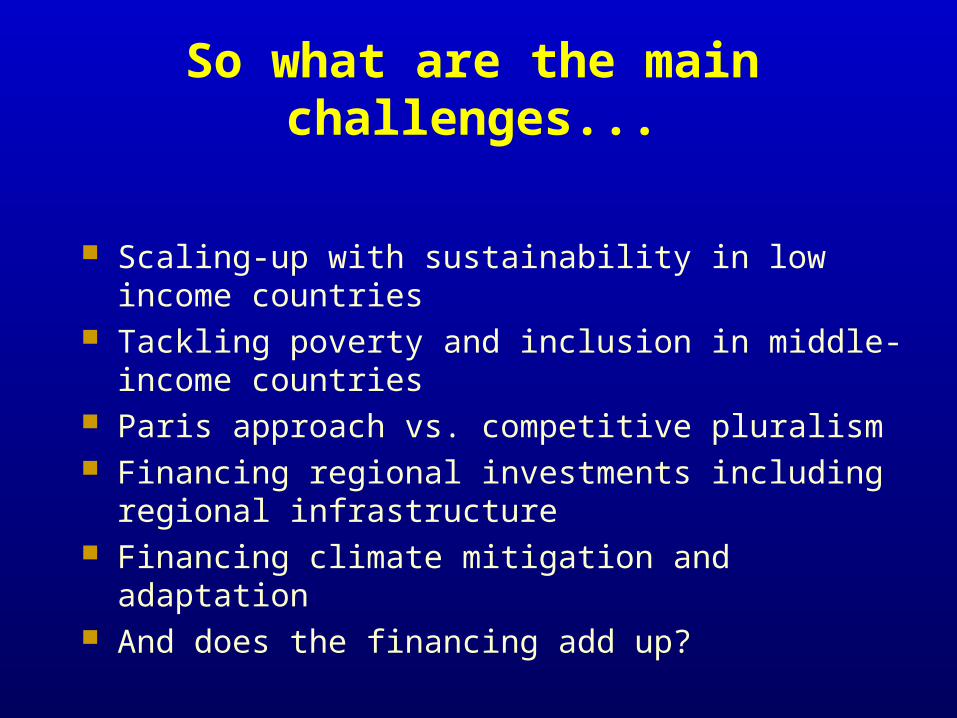
So what are the main challenges...
Scaling-up with sustainability in low income countries
Tackling poverty and inclusion in middle-income countries
Paris approach vs. competitive pluralism Financing regional investments including
regional infrastructure Financing climate mitigation and adaptation And does the financing add up?
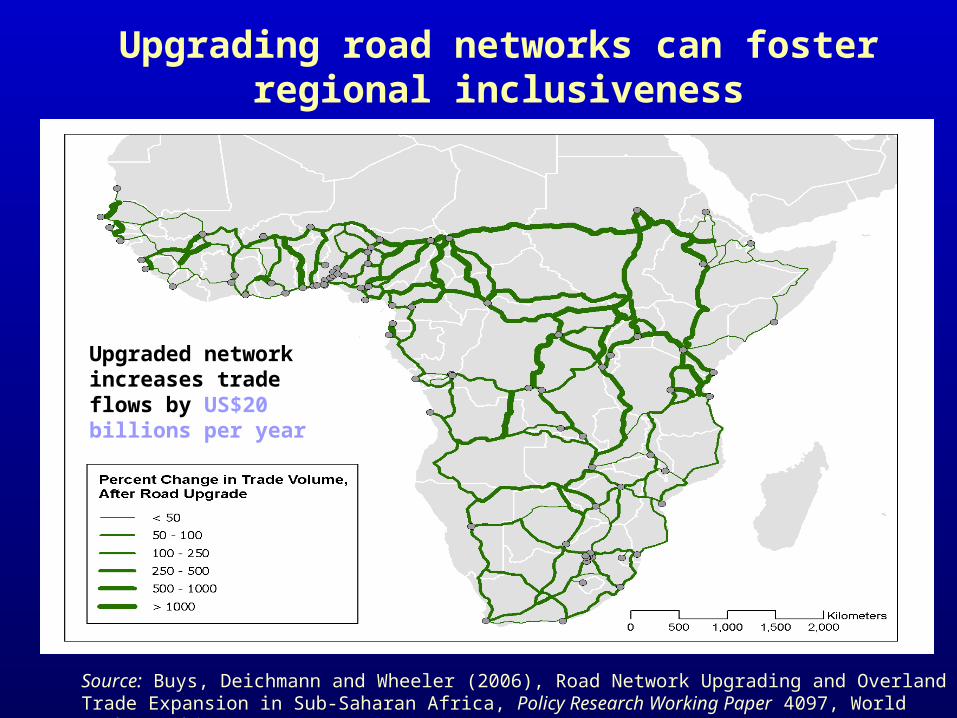
Upgrading road networks can foster regional inclusiveness
Source: Buys, Deichmann and Wheeler (2006), Road Network Upgrading and Overland Trade Expansion in Sub-Saharan Africa, Policy Research Working Paper 4097, World Bank, Washington DC.
Upgraded network increases trade flows by US$20 billions per year

Carbon emissions are linked to coal plant technology
Approx. CO2
emissions (g/kWh)
Reduction from Chinese
average (%)
Lifetime CO2
saving (Mt CO2) a
Coal-fired plants:
Chinese coal-fired fleet average, 2006 1140 - -
Global standard 892 22 73.3
Advanced cleaner coal 733 36 120.5
Supercritical coal with carbon capture 94 92 310.8
a. Lifetime savings assume a 1GW plant running for 40 years at an average capacity factor of 85 percent in comparison with a similar plant with Chinese average efficiency (currently 29 percent).
Source: Watson et al. 2007
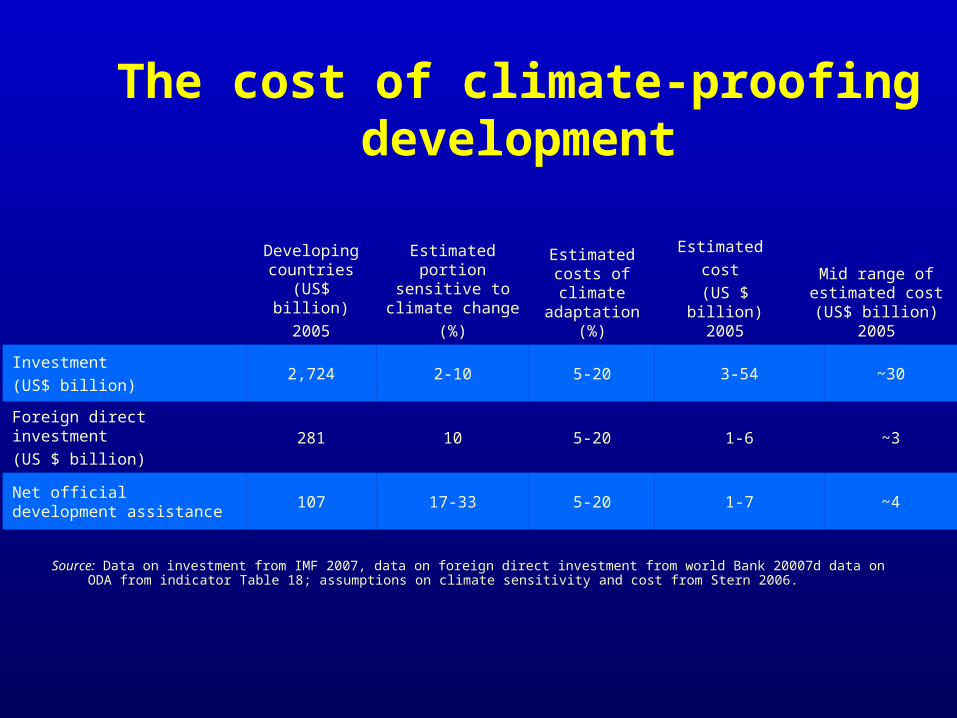
The cost of climate-proofing development
Developing countries
(US$ billion)2005
Estimated portion sensitive
to climate change
(%)
Estimated costs of climate
adaptation (%)
Estimated cost
(US $ billion) 2005
Mid range of estimated cost
(US$ billion) 2005
Investment (US$ billion)
2,724 2-10 5-20 3-54 ~30
Foreign direct investment (US $ billion)
281 10 5-20 1-6 ~3
Net official development assistance
107 17-33 5-20 1-7 ~4
Source: Data on investment from IMF 2007, data on foreign direct investment from world Bank 20007d data on ODA from indicator Table 18; assumptions on climate sensitivity and cost from Stern 2006.
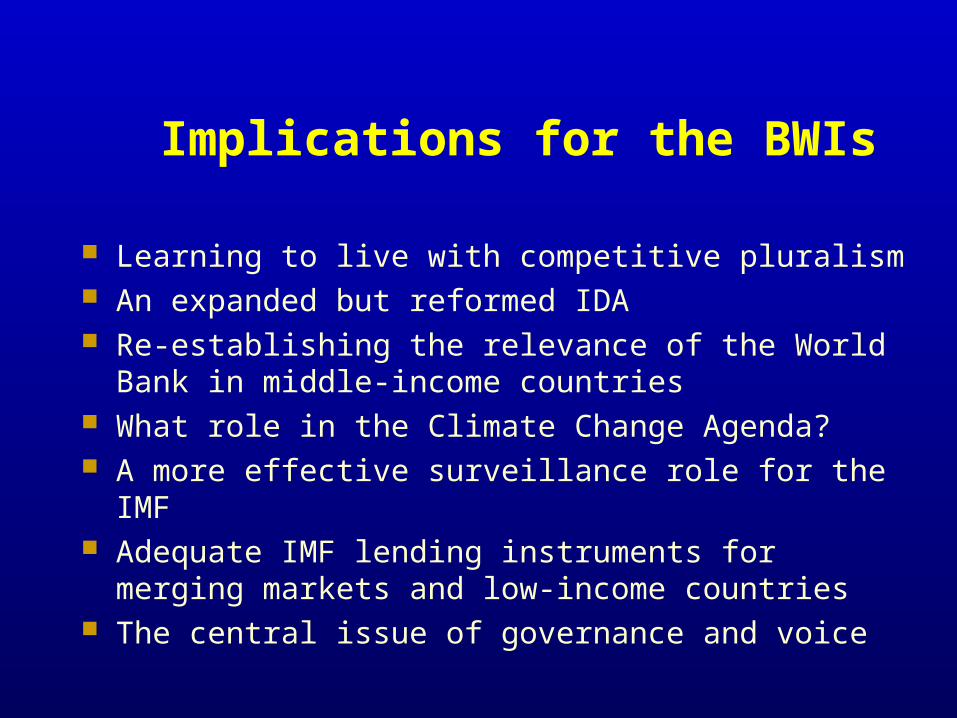
Implications for the BWIs
Learning to live with competitive pluralism An expanded but reformed IDA Re-establishing the relevance of the World Bank
in middle-income countries What role in the Climate Change Agenda? A more effective surveillance role for the IMF Adequate IMF lending instruments for merging
markets and low-income countries The central issue of governance and voice