1 Blending Grants and Loans Getting the Most out of the Global Financing Architecture Amar...
15
1 Blending Grants and Blending Grants and Loans Loans Getting the Most out of the Global Financing Getting the Most out of the Global Financing Architecture Architecture Amar Bhattacharya Amar Bhattacharya Conference on Marketplace on Innovative Financial Conference on Marketplace on Innovative Financial Solutions for Development Solutions for Development Blending Grants and Loans Session Blending Grants and Loans Session Thursday, March 4 Thursday, March 4 Paris, France Paris, France
-
Upload
bertha-randall -
Category
Documents
-
view
215 -
download
2
Transcript of 1 Blending Grants and Loans Getting the Most out of the Global Financing Architecture Amar...
1
Blending Grants and Blending Grants and LoansLoans
Getting the Most out of the Global Getting the Most out of the Global Financing ArchitectureFinancing Architecture
Amar BhattacharyaAmar BhattacharyaConference on Marketplace on Innovative Financial Conference on Marketplace on Innovative Financial
Solutions for DevelopmentSolutions for DevelopmentBlending Grants and Loans Session Blending Grants and Loans Session
Thursday, March 4 Thursday, March 4 Paris, FranceParis, France
2
ContextContext
Improved growth performance and Improved growth performance and debt sustainability across both debt sustainability across both middle and low-income countriesmiddle and low-income countries
Persistence of development gaps Persistence of development gaps some warranting concessional some warranting concessional financingfinancing
Unmet global public goods linked Unmet global public goods linked often to domestic public goodsoften to domestic public goods
3
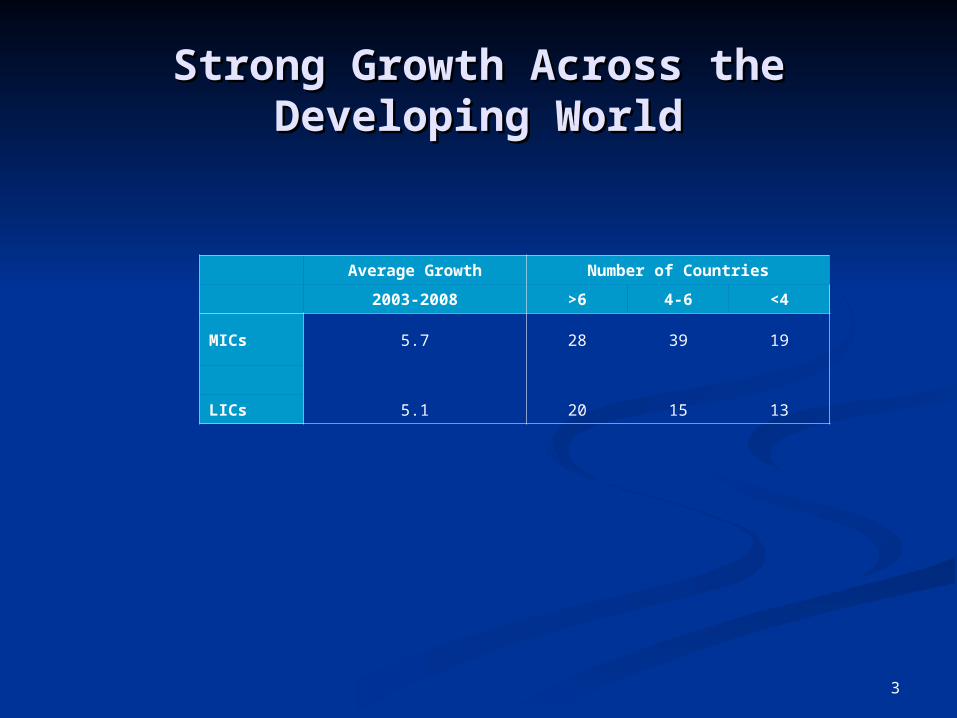
Strong Growth Across the Strong Growth Across the Developing WorldDeveloping World
Average Growth Number of Countries
2003-2008 >6 4-6 <4
MICs 5.7 28 39 19
LICs 5.1 20 15 13

4
Average Annual GDP Growth in sub-Average Annual GDP Growth in sub-Saharan, 1996-2005Saharan, 1996-2005
(Percent)(Percent)
-5 0 5 10 15 20 25
Zimbabwe
Guinea-Bissau
Central African Republic
Cote d'Ivoire
Eritrea
Kenya
South Africa
Madagascar
Malawi
Zambia
Guinea
Gambia, The
Ghana
Mauritania
Mauritius
Tanzania
Mali
Uganda
Mozambique
Congo, Rep
Cameroon
Angola
Equatorial Guinea
Source:: WDI, WB
5
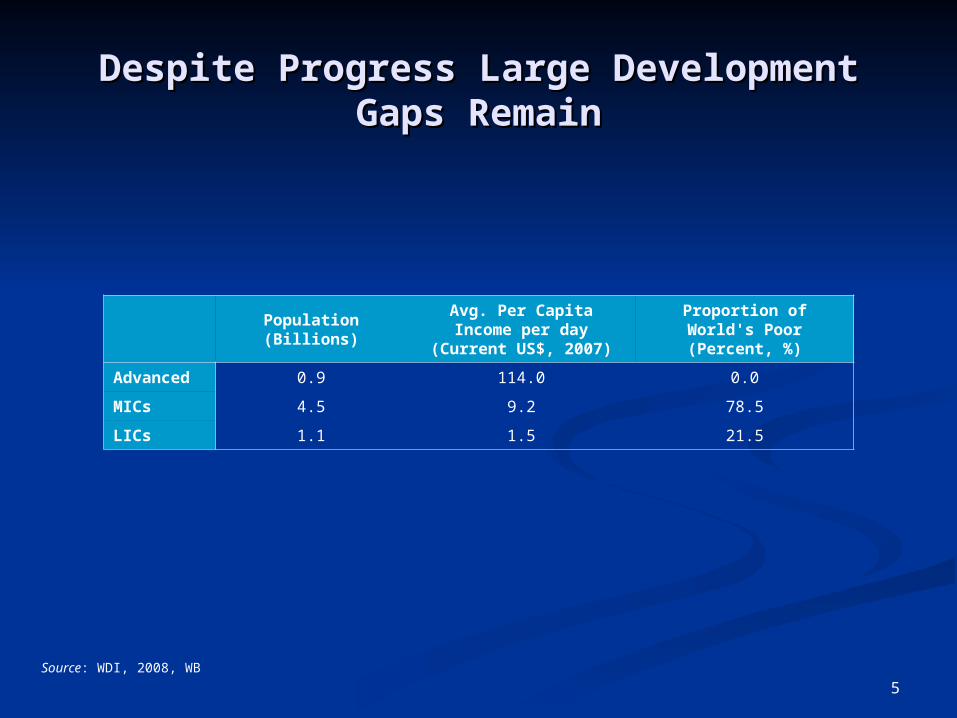
Despite Progress Large Development Despite Progress Large Development Gaps RemainGaps Remain
Population (Billions)
Avg. Per Capita Income per day
(Current US$, 2007)
Proportion of World's Poor (Percent, %)
Advanced 0.9 114.0 0.0
MICs 4.5 9.2 78.5
LICs 1.1 1.5 21.5
Source: WDI, 2008, WB
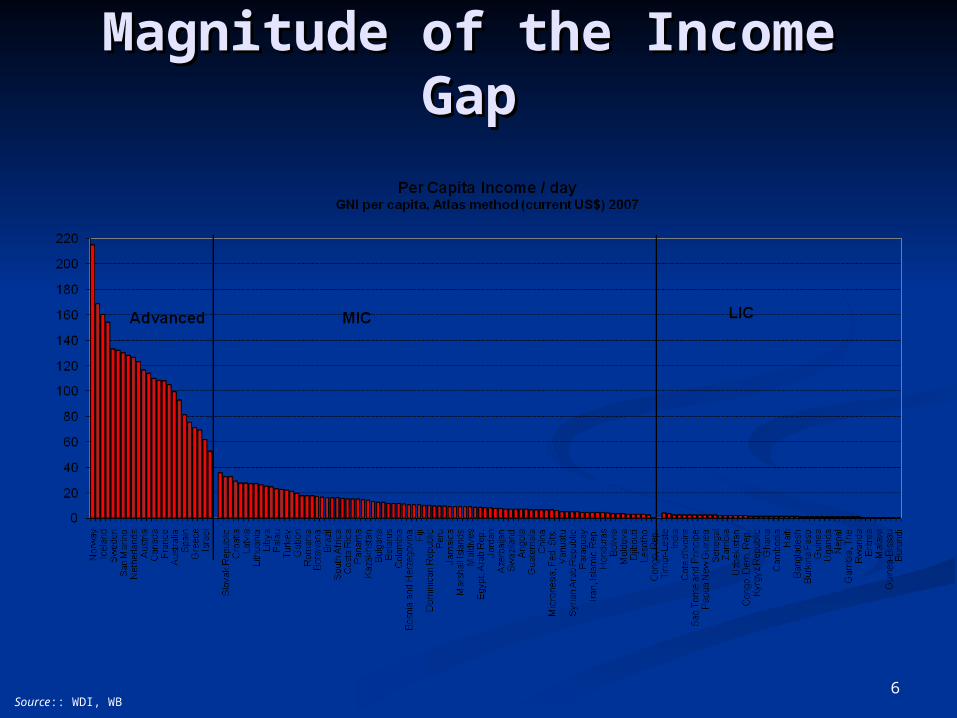
6
Magnitude of the Income Magnitude of the Income GapGap
Source:: WDI, WB
7
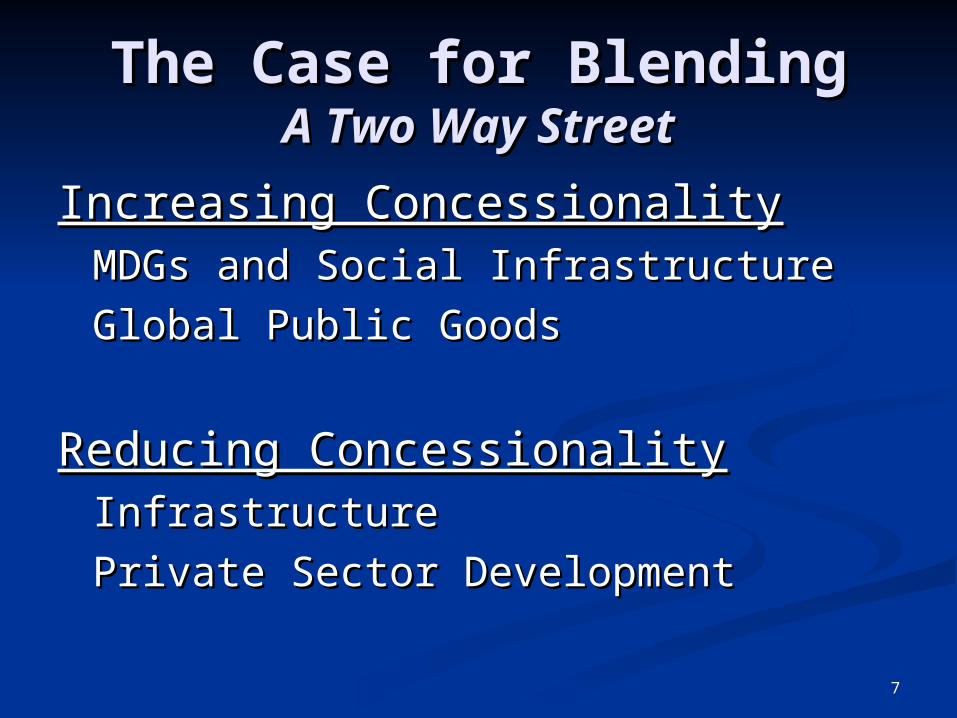
The Case for BlendingThe Case for BlendingA Two Way StreetA Two Way Street
Increasing ConcessionalityIncreasing ConcessionalityMDGs and Social InfrastructureMDGs and Social Infrastructure
Global Public GoodsGlobal Public Goods
Reducing ConcessionalityReducing ConcessionalityInfrastructureInfrastructure
Private Sector DevelopmentPrivate Sector Development
8
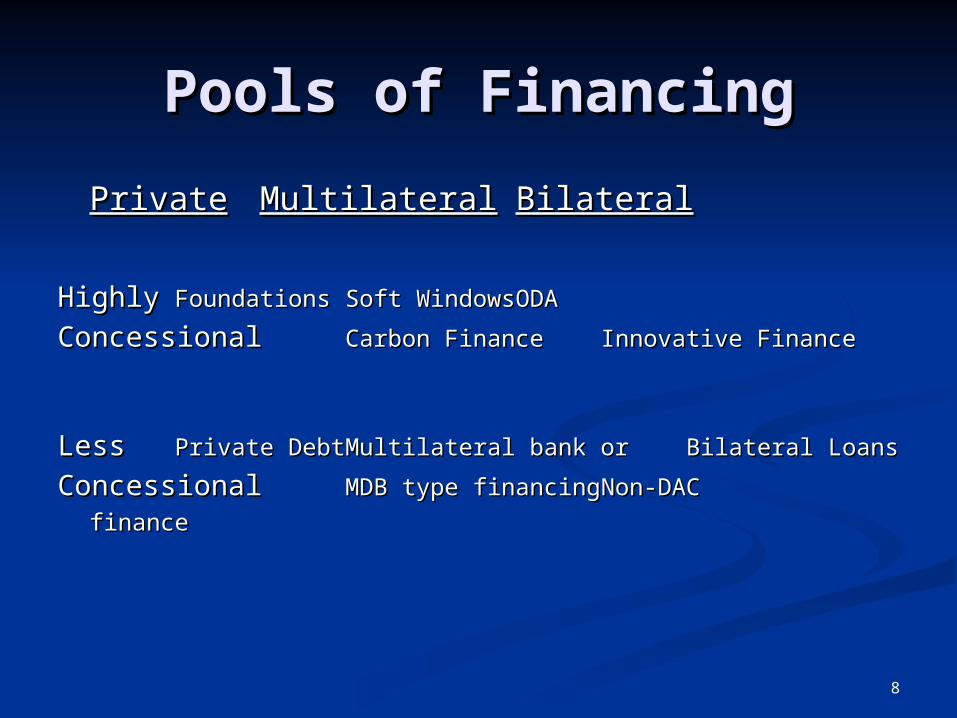
Pools of FinancingPools of Financing
PrivatePrivate MultilateralMultilateralBilateralBilateral
HighlyHighly FoundationsFoundations Soft WindowsSoft Windows ODAODA
ConcessionalConcessional Carbon FinanceCarbon Finance Innovative FinanceInnovative Finance
LessLess Private DebtPrivate Debt Multilateral bank orMultilateral bank or Bilateral Bilateral LoansLoans
ConcessionalConcessional MDB type financingMDB type financing Non-DAC Non-DAC
financefinance
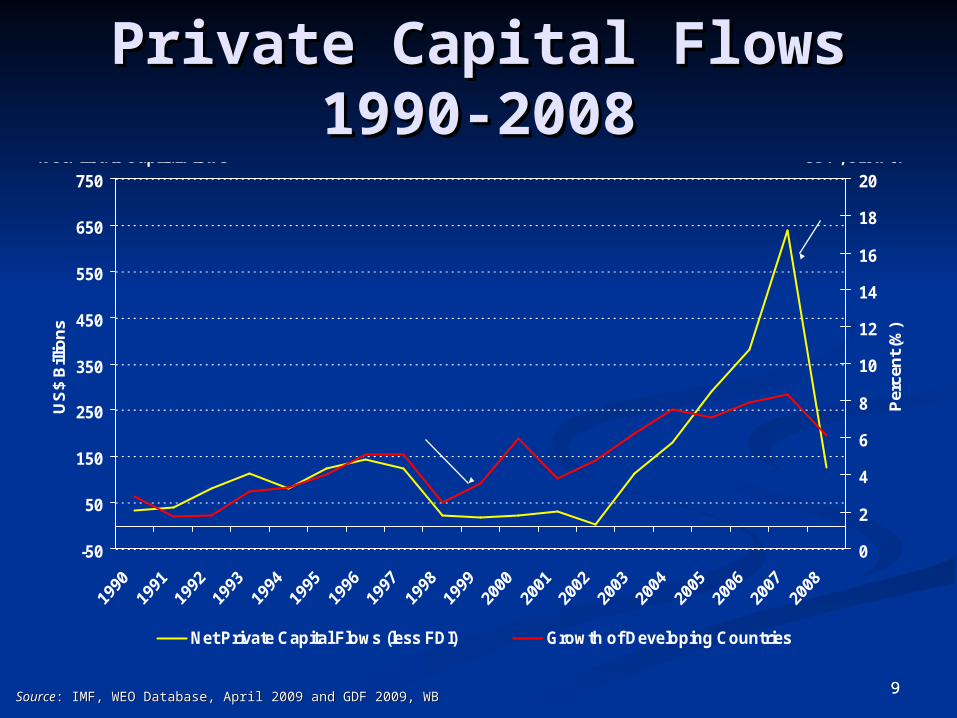
99
Private Capital FlowsPrivate Capital Flows1990-20081990-2008
-50
50
150
250
350
450
550
650
750
US
$ B
illio
ns
0
2
4
6
8
10
12
14
16
18
20
Per
cen
t (%
)
Net Private Capital Flows (less FDI) Growth of Developing Countries
Net Private Capital Flows GDP, Growth
2008 Financial Crisis
Asian/DotCom Crisis
SourceSource: IMF, WEO Database, April 2009 and GDF 2009, WB: IMF, WEO Database, April 2009 and GDF 2009, WB
1010
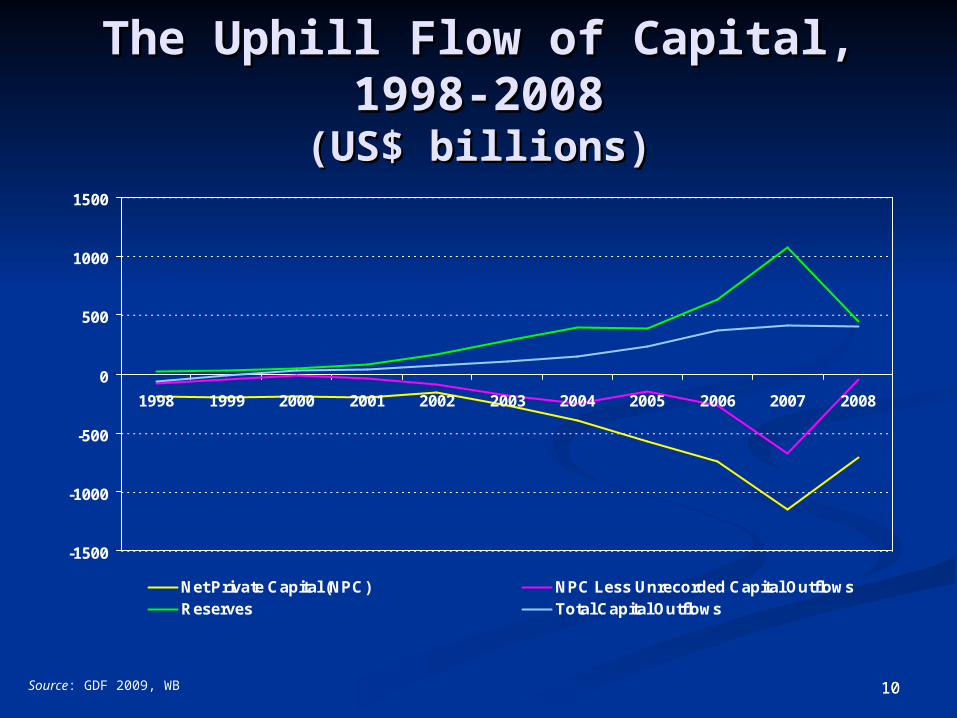
The Uphill Flow of Capital, The Uphill Flow of Capital, 1998-20081998-2008
(US$ billions)(US$ billions)
-1500
-1000
-500
0
500
1000
1500
1998 1999 2000 2001 2002 2003 2004 2005 2006 2007 2008
Net Private Capital (NPC) NPC Less Unrecorded Capital OutflowsReserves Total Capital Outflows
Source: GDF 2009, WB
11
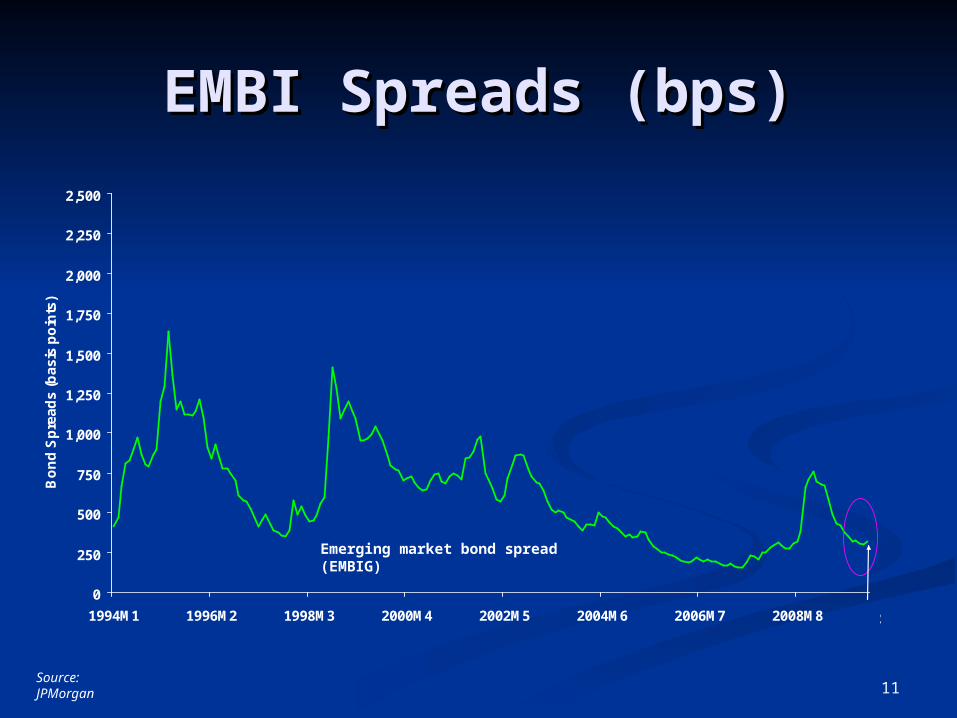
EMBI Spreads (bps)EMBI Spreads (bps)
Source: JPMorgan
0
250
500
750
1,000
1,250
1,500
1,750
2,000
2,250
2,500
1994M1 1996M2 1998M3 2000M4 2002M5 2004M6 2006M7 2008M8
Bo
nd
Sp
rea
ds
(b
as
is p
oin
ts)
2010M2
Emerging market bond spread (EMBIG)
12
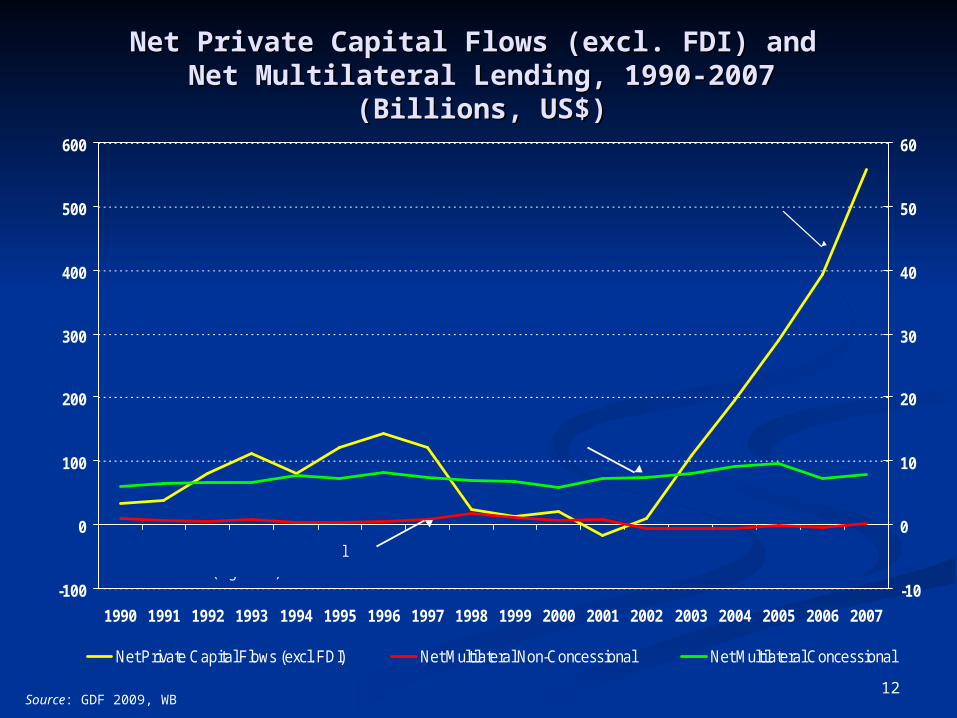
Net Private Capital Flows (excl. FDI) and Net Private Capital Flows (excl. FDI) and Net Multilateral Lending, 1990-2007Net Multilateral Lending, 1990-2007
(Billions, US$)(Billions, US$)
-100
0
100
200
300
400
500
600
1990 1991 1992 1993 1994 1995 1996 1997 1998 1999 2000 2001 2002 2003 2004 2005 2006 2007
-10
0
10
20
30
40
50
60
Net Private Capital Flows (excl. FDI) Net Multilateral Non-Concessional Net Multilateral Concessional
Net private Capital Flows(Left axis)
Net Multilateral Concessional(Right axis)
Net Multilateral Non-Concessional (Right axis)
Source: GDF 2009, WB
13
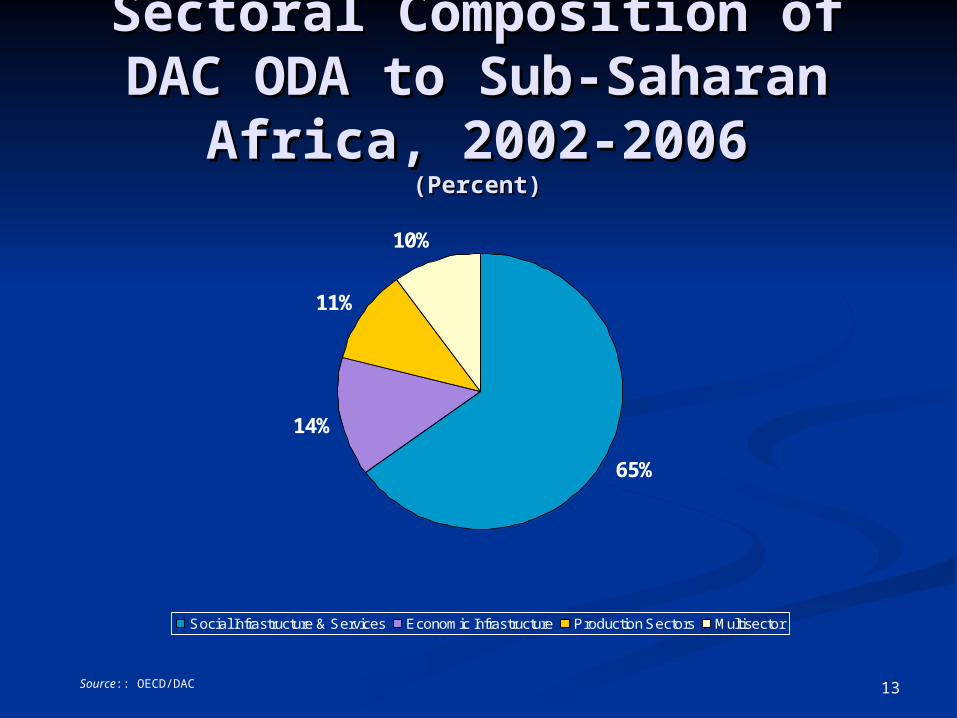
Sectoral Composition of Sectoral Composition of DAC ODA to Sub-Saharan DAC ODA to Sub-Saharan
Africa, 2002-2006Africa, 2002-2006(Percent)(Percent)
65%
14%
11%
10%
Social Infrastructure & Services Economic Infrastructure Production Sectors Multisector
Source:: OECD/DAC
14
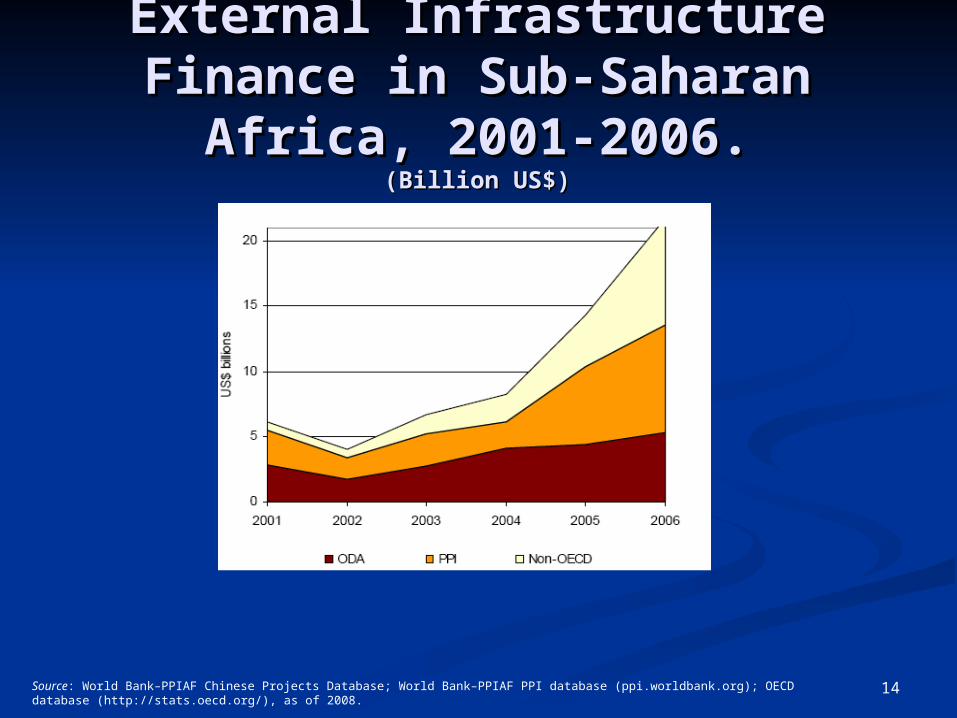
ExternalExternal Infrastructure Infrastructure Finance in Finance in SubSub--SaharanSaharan
AfricaAfrica, 2001-2006., 2001-2006.(Billion US$)(Billion US$)
Source: World Bank–PPIAF Chinese Projects Database; World Bank–PPIAF PPI database (ppi.worldbank.org); OECD database (http://stats.oecd.org/), as of 2008.

15
Concluding ThoughtsConcluding Thoughts Private debt flows can make important development Private debt flows can make important development
contribution but tend to be concentrated, volatile and contribution but tend to be concentrated, volatile and subject to high risk premiasubject to high risk premia
MDB model provides arguably the most important MDB model provides arguably the most important means for harnessing stable market based finance for means for harnessing stable market based finance for development but has been greatly under-utlized in development but has been greatly under-utlized in recent yearsrecent years
Lessons from Climate Investment FundsLessons from Climate Investment Funds Complementarities between DAC and non-DAC Complementarities between DAC and non-DAC
financingfinancing Time to resuccitate bilateral loans?Time to resuccitate bilateral loans? Synergies extend beyond leverage and concessionalitySynergies extend beyond leverage and concessionality