THE CATALAN FUNDING MECHANISM - Ramon Tremosatremosa.cat/sites/default/files/llibres/39164.pdf ·...
59
THE CATALAN FUNDING MECHANISM Ramon TREMOSA I BALCELLS Director of the Economic Theory Department University of Barcelona
Transcript of THE CATALAN FUNDING MECHANISM - Ramon Tremosatremosa.cat/sites/default/files/llibres/39164.pdf ·...
THE CATALAN FUNDING MECHANISM
Ramon TREMOSA I BALCELLS Director of the Economic Theory Department
University of Barcelona

2
Contents
Summary and introduction
1.- Economic growth and fiscal flows
2. Autonomous Spain: decentralising spending and
centralising power
3.- An unchanged financing model
4.- Solidarity determined solely by the State
5.- Conditional tax office
6.- Central government investment not guaranteed
7.- Imprecise legal principle
Conclusion: New Catalan financing? Too many unknowns
Appendix: macroeconomic effects of the Catalan fiscal deficit
with the Spanish State (2002-2010).
Tables
Bibliography
3
Abstract
This paper sets out to analyse the Catalan Generalitat
government’s autonomous financing model, which is the product of the
new Catalan Statute of 2006. Rather than a change in the region’s
financing model, this new Statute defines a cluster or series of financing
models that are open to a broad array of possible interpretations, which
range from a soft approach to several fiscal federalism mechanisms (in
the case of a generous interpretation by the Spanish central
government) to the reinforcement of the central government’s
discretionary powers to allocate the resources of the common regime
autonomous communities (in the case of a stricter interpretation by the
Spanish central government).
Thus, the improvement or even deterioration of the Generalitat’s
autonomous financing in the future depends on the play of political
majorities in the State and regional parliaments in Madrid and Barcelona,
respectively. The hopes invested in the new Catalan Statute’s ability to
insulate the region’s financing in the future from possible hostile absolute
majorities in Madrid’s Chamber of Deputies (the most popular
justification among Catalan political parties and social forces for a new
autonomy statute) seem to fade in view of the final text.
“Carlism is not a pure dynastic and regressive movement, as well-paid Liberal historians have claimed. It is a free and popular
4
movement in defence of traditions, much more liberal and regionalist than the official absorbing liberalism copied from the French revolution. The Carlists defended the finest Spanish legal traditions: the “Foral” systems. They represented the great homeland as the sum of local homelands, with their own peculiarities and traditions. There is no other country in Europe like Spain, which has so many vestiges of ancient populations and popular forms that History has destroyed. In France they were the Bretons and in Spain, in a much broader and national manner, the defenders of King Carlos.
The Carlist tradition had several authentically popular, national, country, small landowner and clerical bases, while liberalism was personified in militarism, capitalism (the new merchants and speculators), the land-owning aristocrats, and secular interests.”
Karl Marx, Revolutionary Spain (1868-1873), Editorial Zenit, 1929
“Where, as was, for example, true in Germany as early as 1928, the central and local authorities directly control the use of more than half the national income (according to an official German estimate then, 53 per cent) they control indirectly almost the whole economic life of the nation.”
Friedrich A. Hayek, “Road to Serfdom” (1944)
When the State makes huge transfers among territories, the poor of the rich regions wind up paying the rich of the poor regions.”
Finn Poschmann (1998)
“Government fiscal transfers are ineffective in stimulating economic growth: because of their structural character and large amount, the less developed regions rationally accept being permanently underdeveloped, for as long as the subsidies are permanent.”
5
Desmet, K. and Ortuño, I (2001). “Rational underdevelopment”, Banco de España
1.- Economic growth and fiscal flows
As a professor of economic theory, my interest in government
financing issues, such as those we are examining here, stems from the
growing importance and the impact on economic growth wielded by
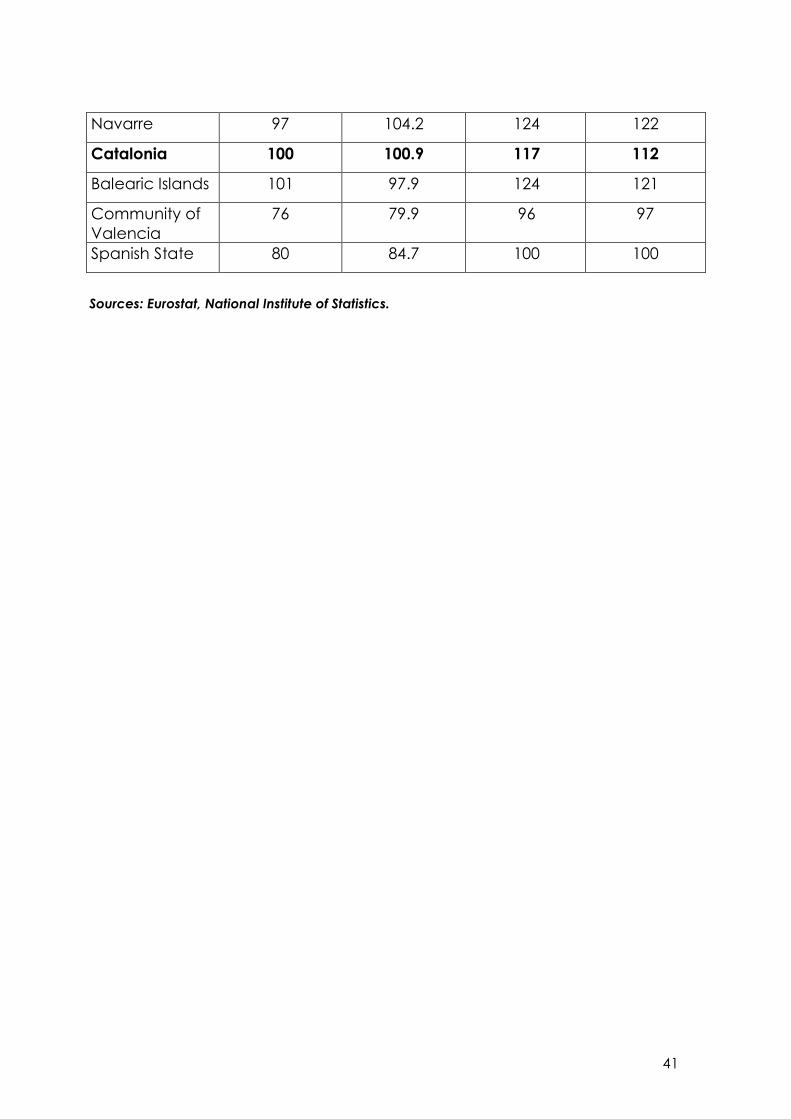
fiscal flows from central governments to regions. In this regard, Tables 1
and 4 show several economic indicators for a number of Spanish
autonomous communities related to the creation and distribution of
wealth in recent years: GDP per capita, worker productivity and
disposable income per capita have grown at a slower pace in the
Catalan economy than in Spain as a whole.
Many Catalan economists attribute this slower growth to the
unequal contributions the Catalan economy makes to the rest of Spain,
in accordance with what is commonly called “the Catalan fiscal deficit
with the Spanish State” (Table 11). The widening gap between taxes the
central government (the State and Social Security) collects each year in
Catalonia and the monies Catalonia receives from the central
government has become a source of capital outflow from the Catalan
economy that has been acknowledged by practically all the political,
economic and social forces in the region today. Hence, the need to
review the region’s relationship with Spain, i.e. bring it up to date through
a new autonomy statute.
In the past ten years, Spain’s common regime autonomy model
has displayed several features of regional growth more characteristic of
a unitary State than a decentralised one: official Eurostat statistics on

6
GDP per capita in Europe’s 166 regions in 2002 (diagram 1) confirm the
leading role Spain’s autonomous communities play in the country’s
convergence with the EU. Yet, only Madrid, the Basque Country and
Navarre have consolidated this speedy growth in recent years, while the
other communities lag behind and some are even diverging from the
European average. Thus, only the country’s capital and the two
autonomous communities with “foral” systems clearly converge within
the European context, while Mediterranean communities have achieved
almost zero convergence with Europe.
An analysis of GDP per capita in EU regions reveals clear
differences in the larger States’ models of regional convergence.
Germany and Italy also display marked regional disparities, although
their higher-income regions show quite a bit of uniformity: the bulk of
their developed regions report levels 25% to 50% above the European
average, while their political capitals do not rank particularly high in the
standings, trailing behind the leading regions. In contrast, the results in
France reflect its centralist State model par excellence: by 2001, the Paris
region was already scored 165 on the index (from 153 in 1997), while all
the remaining departments ranged from 103 to 83.
Although voices in Madrid declare in unison that Spain “is the most
decentralised country in the world” and consequently attempt to block
any movement towards revising the regional organisational model,
Eurostat results clearly show that the country’s regional convergence has
been veering towards the French model in recent years, instead of
showing results more typical of a federal State, such as Germany. A clear
relationship between economic convergence and the regional fiscal
balance with the Spanish central government can be inferred, yet the
7
absence of data on regional fiscal balances after 1996 makes this
impossible to prove empirically.
According to the only publication on fiscal balances based on
official data issued by the State (Las balanzas fiscales de las CCAA,
Castells et al, Ariel, 2000), the three communities that made the most
progress in convergence between 1991 and 1996 either ran no fiscal
deficit with the State (Madrid had a zero fiscal deficit with the State
during this period) or had reasonably low deficits (the regions with
autonomous tax systems known as the Concierto Económico, in which
the fiscal deficit is 2% to 4% of the regional GDP), if cash flow criteria - the
most appropriate kind, according to international economic literature –
is taken into account during calculation. In contrast, the Catalan
economy ran an overheated 7% GDP fiscal deficit during the same
period, which has already been previously mentioned as a cumbersome
burden on economic growth (chart 1).The fact that the Catalan fiscal
deficit soared to 10.5% of its GDP (2001) between 1996 and 2001, the last
year for which official data is available, allows us to observe a more than
reasonable cause and effect relationship between higher fiscal deficits
and slower economic growth.
2. Autonomous Spain: decentralising expenditure and centralising power
As recommended by the most basic literature on fiscal federalism,
the easy way to ascertain or quantify a country’s “federalness” is by
examining whether the country is truly federal: observing the degree to
which fiscal sovereignty is concentrated at the central or highest tier of
government. Federalist countries are formed from the bottom up, not
top down. The formation of the European Union and the US are
8
examples of this, since they are higher political unions whose sovereignty
is based on two core areas: fiscal and legal aspects, e.g., the
Constitution of the State of Texas recognises its right to self-determination.
The Catalan Statute has followed the exact opposite path of
amendments to major legal texts in federal states. An amendment of the
federal constitution in the US requires the approval of each and every
one of the 50 states, whereas the federal government has no say in the
matter should Oklahoma or Tennessee wish to reform their own
constitutions; this is why some states can levy or abolish taxes and
establish the death penalty, for example. The EU constitution is going
down a similar road, detained for a spell by its rejection in the French
and Dutch referendums. In contrast, although the Catalan Parliament
has already passed an amendment of its regional Statute, the final word
belongs to the Spanish Chamber of Deputies, which may alter it as it sees
fit.
Proof of federalism in Spain’s case lies in the percentage of
decentralised government revenue, i.e., the level of government that
collects taxes. The central government’s very able propaganda
notwithstanding, federal intensity is not measured by the tier of
government that winds up allocating public spending, a large portion of
which may already be earmarked from the start. Like Spain, other more
or less regionalised, unitary countries may end up transferring major
amounts of current expenditure (civil servants wages, acquisition of
current goods and services), however tax functions are reserved
exclusively for the central government, which thus monopolises the
management, collection, liquidation and inspection of each and every
major tax.
9
The new Catalan Statute of 2006 does not greatly alter Catalan
self-governance and financing. What I call the Moncloa Statute of 2006
(after the site where the final text was cobbled together) applies and
follows the logic of the Catalan Statute of 1979: it expands a few
symbolic issues and achieves a few new areas of jurisdiction, yet fails to
change the financing system, which is still constrained, and well
constrained, within an common regime autonomy statute.
Despite what is often parroted, common regime Spain is not
among the world’s most decentralised States, at least insofar as three
features are concerned: 1) the autonomous communities’ areas of
jurisdiction and thus, power to implement their own policies with sufficient
economic resources; 2) power-sharing with the State, since Spain lacks
mechanisms, such as a regional senate or inter-governmental
commissions, that are usually found in federations; and 3) guarantees for
the legal defence of self-government, too often prey to the political
vicissitudes that result in the wake of general elections.
In this regard, common regime Spain has not efficiently settled into
the asymmetric patterns typical of pluri-national federations such as
Belgium and Canada, or the patterns of Anglo-Saxon federalism, which
tend to assign legislative and executive functions in matching areas to
the same tiers of government, as Australia and Canada do. Neither has it
established the cooperation and execution mechanisms of central
European federalist states, such as Germany and Austria (Requejo, 2003).
When Spain is said to be “the most decentralised country in the
world today”, the real purpose is to prevent the autonomy model from
developing and expanding. In fact, International Monetary Fund reports
do not classify Spain as a federal state and instead include it in the
10
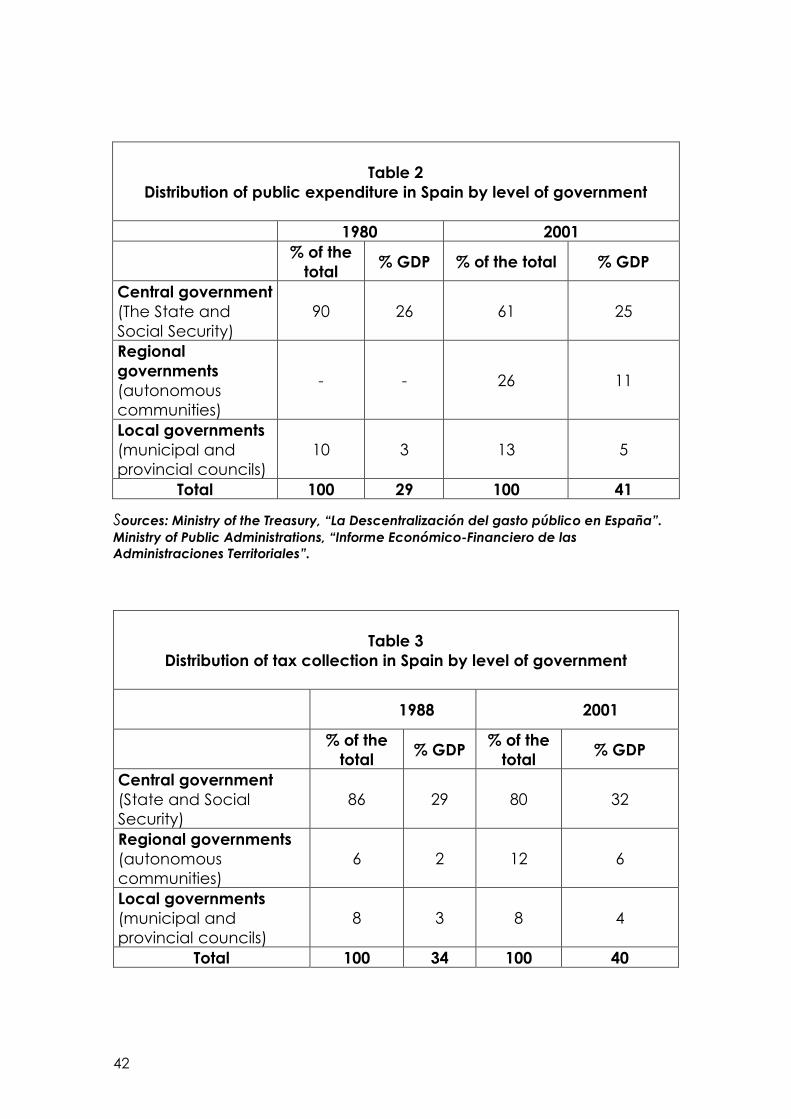
group of unitary States “with a few federal traits”. Table 2 shows the
distribution of public spending by government level in Spain between
1980 and 2001. The ratio of public spending to GDP rose from 29% to 41%,
in line with the clear trend of the government sector’s increasing weight
in the economy, typical of other developed countries as well. This hike
allowed Spain’s central government to maintain a steady level of
economic intervention between 1980 and 2001, which only slipped from
26% to 25% of the GDP, thus offsetting the costs of the political
decentralisation stemming from the transition to democracy, which
plummeted from 90% of all public spending in 1980 to 60% in 2001.
The regional level of government did not yet exist in 1980, while in
2001, it was executing 26% of all public spending, the equivalent of 11%
of Spain’s GDP that year. Lastly, local governments were responsible for
10% of total public spending in 1980 (3% of the year’s GDP) and 13% in
2001 (5% of the year’s GDP). Local government spending/GDP ratios are
much lower in Spain than in other federal States.
While in 2001, subnational (local and regional) government levels
executed 39% of the country’s total expenditure according to the
Spanish Ministry of Finance, the OECD attributed only 32% of total
expenditure to these two subnational levels (Jourmard and Kongsrud,
2003), based on data released by the governments themselves. This 32%
is far from Denmark’s 58%, Canada’s 57%, Sweden’s 44%, Japan’s 41%,
the US’ 40%, Norway’s 39%, and Germany’s 37%, all for 2001. On page 49,
the report’s two authors recommend that the Spanish public sector
improve official transparency, since time lags in releasing official data on
public spending and tax collection obstruct the drafting of consolidated
financial statements.
11
Spain’s heavily centralised structure stands out even more clearly
when examined from the point of view of tax collection by government
level. Table 3 shows that the central government collected 86% of all
taxes in Spain in 1998, the equivalent of 29% of Spain’s GDP that year,
and was still collecting 80% of all taxes in 2001, or 32% of the GDP. As
noted, 2001’s 32% is an even higher percentage of Spanish GDP than
1998’s 29% was. Meanwhile, regional governments - the autonomous
communities - collected 6% of all State taxes in 1988, or 2% of the year’s
GDP, and 12% of all taxes in 2001, or 6% of the year’s GDP. Lastly, the
percentage of total collection by local governments held steady - 8%
between 1988 and 2001.
Hence, according to the Spanish Treasury, the two subnational
(local and regional) levels of tax collection in Spain accounted for 20%
of all collection in 2001. However, the OECD reports that these two tiers
collected 18% of all taxes that year (Jourmard and Kongsrud, 2003), still
lagging far behind Canada’s 50%, the US’ 40%, Denmark’s and Ireland’s
35% and Germany’s 33%, for the same year.
3.- An unchanged financing model
The Moncloa financing model established in January 2006, which
was not altered during the parliamentary process in Madrid in spring of
that year, does not contain any structural changes in the fiscal relations
between Catalonia and the Spanish State. Paragraph 1 of Article 206 in
the new Catalan Statute states that the region’s resources for financing
its services and areas of jurisdiction are to be based on spending needs
criteria, which assumes that Catalonia will follow the central
government’s lead in determining these needs within the framework of
12
the General Council for Fiscal and Financial Policy and in accordance
with the General Law on Autonomous Communities Financing (the
LOFCA in Spanish) of 1980.
Catalonia had hoped the new statute would allow it to break with
the multilateral negotiating framework, which the recently declared
autonomous cities of Ceuta and Melilla have just joined. Historically, this
negotiating framework has been quicksand for Catalonia’s financial
interests. According to Professor Guillem López-Casasnovas from
Pompeu Fabra University (PFU), “It is impossible for Catalan criteria to
prevail over this 17-member table: the central government of the day
always forges a front against Catalan aspirations through the
autonomous communities it controls."
On the other hand, several autonomous communities, e.g.,
Andalusia, waited for the conclusion of the Catalan reform process so as
to be able to copy and counter-plan a good part of the new statute’s
financing articles. This is especially distressing, since the Popular Party (PP)
has appealed a number of articles in the Catalan statute which it voted
for in the Andalusian statute.
Javier Arenas, chairman of PP’s Andalusian chapter, asserted that
the Andalusian statute is totally constitutional and an "antidote to selfish
nationalism". PFU law professor Albert Lamarca has compared the two
statutes and analysed the articles the PP appealed before the
Constitutional Court (CC).
Lamarca asserts that after stripping away all the articles referring to
language, culture, historical rights and several other areas not covered in
the Andalusian statute, 80% of the articles the PP appealed before the
13
CC were approved by the Chamber of Deputies in the Andalusian
Statute of 2 November 2006. Most of these articles were modelled after
the Catalan Statute, in many cases copied word-for-word, especially in
the areas of justice and financing. The Catalan statute provides more
detail in the area of jurisdiction, but the Andalusian statute contains even
more articles than the Catalan statute does: 250 vs. 223.
The following are some of the almost 50 articles appealed before
the CC that were copied word for word from the Catalan Statute: the
first number refers to the Catalan text and the corresponding article in
the Andalusian text comes after the dash: 7-5, 20.1-20.2, 21.2-21.2, 80.1-
30.1, 82-131, 95-140 and 143.1 and 2, 96-143.4 and 5, 97.98 and 99-144,
101-146, 103-147, 105-149, 107-151, 122-78, 126.2-75.7, 127.2-68.2, 132.1-66,
135-76.3, 140.2.3.4 and 7-64.4.5.6 and 9, 141.2-81.2, 144.5-57.5, 146.1.a
and b-69.1 and 4, 148.2-56.8, 149.2-56.9, 152-58, 154.2-58.4.5è, 157-70,
158.3-54.3, 160-60, 162-55, 169.2 and 3-64.7 and 8, 166-61, 170.1. and -
63.1.1r, 170.2-63.2, 171.c-71, 172-53, 180-224, 182-87, 183-220, 185-233,
186-231, 187-234, 189-235, 191.1-238.1, 195-241, 204.1-181.2, 205-182, 210-
184, 222-248, DA2-231.3, DA7-178, DF1-DF1, DF3-DF2.
Thus, for example, the Andalusian Statute requires the central
government to prioritise population criteria when distributing public
investment, in contrast to the Catalan Statute, which uses the ratio of
regional GDP to State GDP. The State General Budgets of 2007 and 2008,
which still allocate 25% of all public investment to regions, implement the
Andalusian Statute (Andalusia receives 18.5%, which corresponds to its
percentage of Spain’s total population) and do not implement the
Catalan Statute (Catalonia receives 14% of all public investment,
although it generates 18.5% of the national GDP). And this is budgeted,
not actual investment: from 2001 to 2006, only 70% of its budgeted
14
investment was executed in Catalonia, while 125% of the Community of
Madrid’s budgeted investment was executed in 2006 (El Periodico,
November 5, 2007).
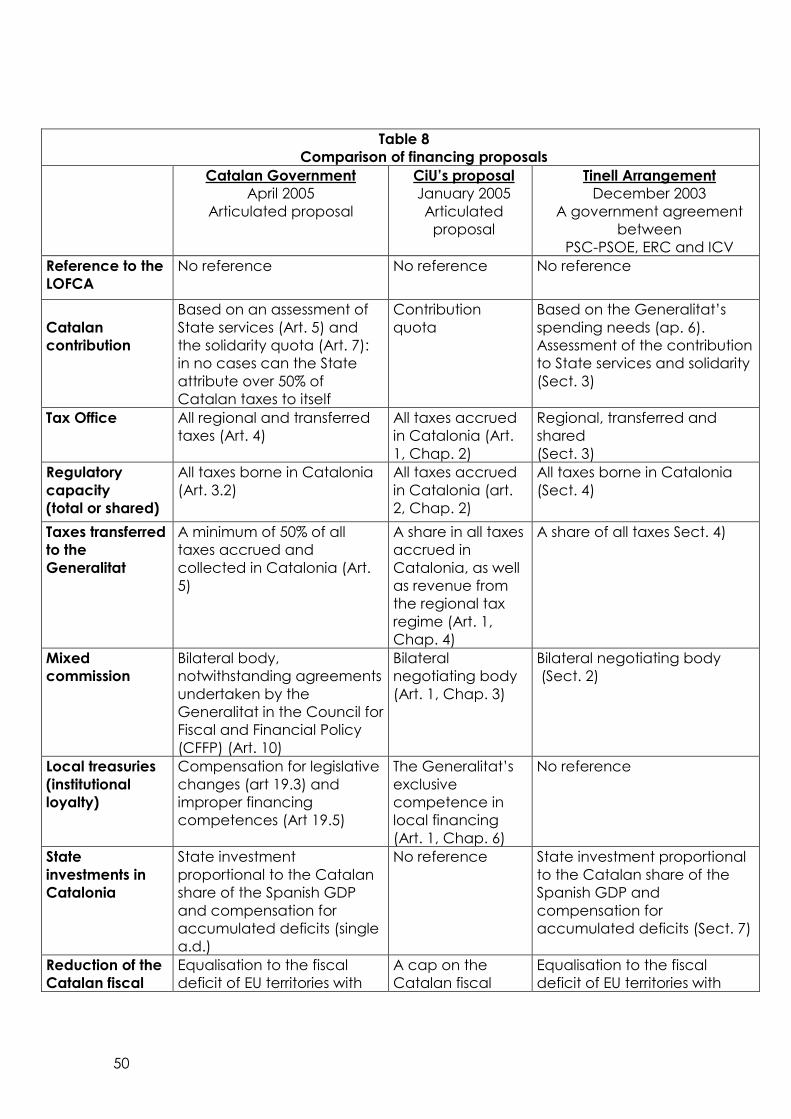
Table 8 shows a comparison between Title VI on the region’s
financing in the new Catalan Statute and the major fiscal items
budgeted in the Tinell Agreement of December 2003, the CiU’s financial
budget of January 2005 and the tripartite government budget of April
2005. Table 9 compares these same items with the Sau Statute of 1979,
which was approved by 89% of the Catalan Parliament on September
30, 2005, and lastly, with the Moncloa Statute, approved in the
referendum of June 18, 2006.
Of all the budgets shown in Table 8, the CiU budget, dubbed the
Acuerdo Económico, is the one that most closely resembles the "foral"
model, which has produced such good results in the Basque Country
and Navarre in terms of both economic growth and expansion of social
services. The Tinell Agreement contained several ambiguities in the
section on finance, but was a decided step forward, compared with the
model in effect at the time. Table 8 assesses the influence of the Socialist
Party (PSOE) on financing, given that several basic issues were not
resolved, such as the reduction in State transfers for the same amount as
the increase in the share of State taxes (as in 2001) or in local financing.
Nonetheless, this budget still contained elements that signalled a
change in financing model: the most interesting element explicitly set the
cap for all taxes borne in Catalonia (including corporate income taxes)
that the State tax office could appropriate at 50%. This quantitative
measure was put forward in the hopes of effectively reducing the
Catalan fiscal deficit, which the CiU’s proposal for an economic
15
agreement aspired to cap at 4% of Catalonia’s annual GDP in the
future. But pressure from the PSOE and its regional counterpart, the PSC,
eliminated these two concrete numerical measures in the final stretch of
statute negotiations in September 2005, in deference to the supposed
"constitutionality of the text". We should bear in mind that in Germany,
e.g., the federal constitution itself, not Länder constitutions, is
empowered to set the criteria and percentages for distributing
corporate income taxes, thus protecting the federal states’ interests from
possible centralising temptations by the central government.
As a result, Article 201.1 of the final draft of the Moncloa Statute
contained an explicit reference to the LOFCA, while no such reference
was included in the statute passed by the Catalan parliament: it would
be too much to assume that there is a hierarchy in the new Catalan
statute over the LOFCA in the drafting of the cited article, which
establishes that "fiscal and financial relations between the State and
Catalonia are regulated by the Constitution, by this Statute and by the
Organic Law to which Article 157 of the Constitution refers”.
It is hard to compare the 2006 Moncloa Statute with the 1979 Sau
Statute on this point: the Sau text was very generic in the area of
financing, because of the lack of experience in regional self-government
at the time, which contrasts with the precise nature of the new statute’s
financing articles. The final gains are impossible to ascertain, since in the
last resort, they depend on the sufficiency fund unilaterally established
by the State, a sufficiency fund that several highly-placed State officials
very soon claimed (just a few days after Artur Mas’ collaboration in La
Moncloa in late January 2006) would make Catalonia a net contributor
in the end and not the net receiver it had always been (Miguel Ángel
Fernández Ordóñez, Expansión, 26/01/2006).
16
4.- Solidarity determined solely by the State
Catalan President Jordi Pujol compared absolute majorities in
Madrid’s Chamber of Deputies to ice on the Baltic Sea: boats cannot sail
when the sea freezes, in the same way that CiU cannot secure a larger
share of self-government when it is not a decisive force in forming
majorities in the Chamber, as it was between 1982 and 1993 and again
between 2000 and 2004. When the ice melts, boats can go to sea and
CiU can then add fish to its basket, as Pujol put it, which was possible
when CiU paired with PSOE between 1993 and 1996 and with PP
between 1996 and 2000.
Article 206.3 states that the Catalan Generalitat’s resources from its
tax income "could be adjusted upward or downward" depending on its
participation in adjustment and solidarity mechanisms. This definition is
typical of the current financing model, in which the central government
in power determines the common regime communities' spending needs.
The central government’s exclusive power to define the sufficiency fund
means that it ends up determining the resources of the different
communities: the Catalan Generalitat should have had a larger budget
than the Andalusian Junta, judging by economic activity and taxes
collected; this has always been the case and will not change in the
future. Table 5 presents the relationship between the Generalitat’s
“basket” of taxes and the State sufficiency fund.
It would be very interesting and enlightening if the minutes of the
Council for Fiscal and Financial Policy meetings were made public to see
the arguments used to define regional spending needs; again, one runs
17
into a lack of transparency here, as is the case with fiscal balances,
profits from Catalan airports and State tax office inspections by territory.
For example, the central government cited an increase from 40% to 58%
in special taxes for the Generalitat, while the State tax office claimed the
collection of these taxes in Catalonia fell 21%, from 977 to 777 million
euros from 2003 to 2004 (www.mineco.es): how can this reduction be
verified without a Catalan tax office with access to all the data
collected?
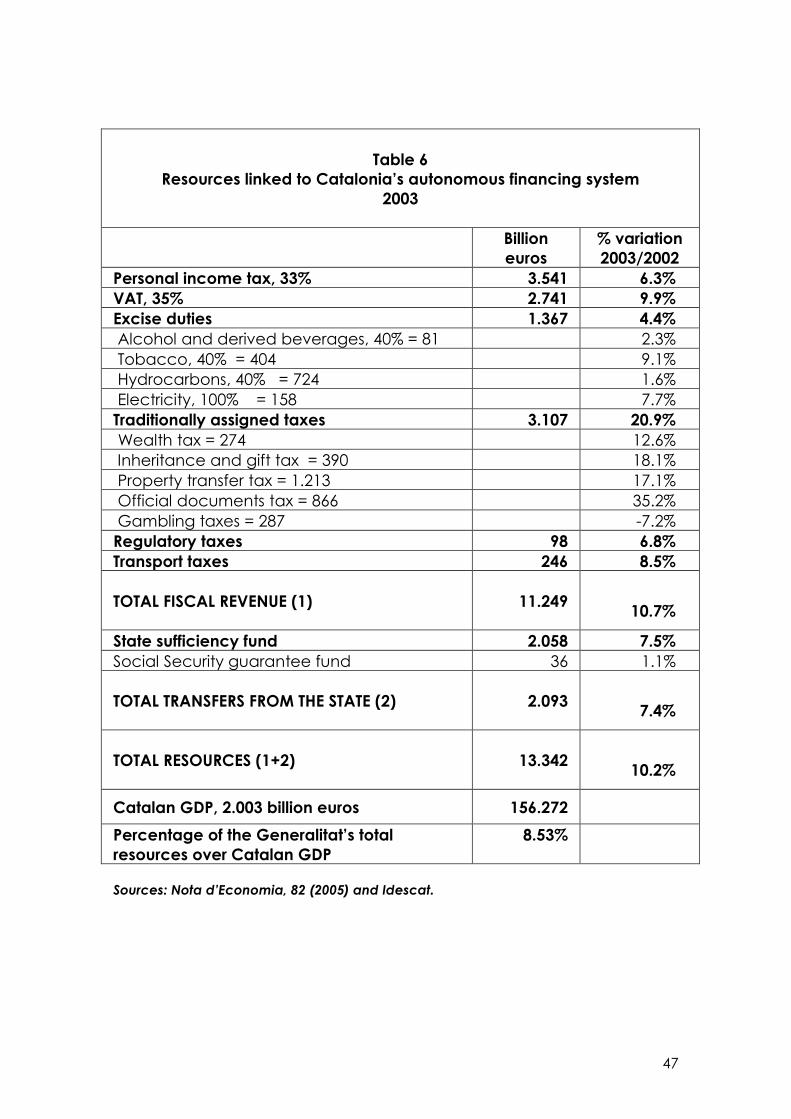
Table 6 shows the resources linked to the Catalan financing system
in 2003 and Table 7 the resources linked to the common regime
financing system. The table does not include the inter-territorial
compensation fund, sufficiency fund or European funds, nor does it
include the central government’s public investments and expenditure
broken down by territory.
In 2002, e.g., Extremadura’s fiscal capacity (taxes collected) per
capita was almost half of Catalonia’s: 40 as opposed to 77, with 100
representing the State average (Graph 2). The central government’s
intense redistribution process reached the extreme of turning the final
status of per capita resources on its head, with Extremadura at 104 on
the index, compared with Catalonia’s 84 (the State average equalling
100). When the inter-territorial compensation fund (ICF), sufficiency fund
and European funds are added, the index shows 144 for Extremadura in
the end, compared with Catalonia’s 84, since the latter has no share in
any of these funds. As for Madrid, its insufficient autonomous financing is
compensated year after year by State investments in its territory and the
effect of the 400,000 central administration civil employees employed in
the capital to such a degree that it has allowed the Madrilenian regional
government to lower some of its inhabitants’ taxes.
18
Point 3 of Article 206 in the new statute explicitly specifies that the
State has the sole power to establish adjustment and solidarity levels,
effectively eliminating any chance of bilateral relations between the
State and the Generalitat, although this is envisaged in the Statute
approved by the Catalan Parliament. Within the context of the Council
for Fiscal and Financial Policy, the central government will continue to
have the final say in determining the resources available to the
Generalitat.
Point 5 of Article 206 of the new statute states that population and
its density will be taken into account as the main variables in determining
the spending needs in Paragraph 1, as has been the case until now. This
means a slight improvement that now includes rectification by
differential costs (higher inflation in Catalonia) and cites immigration,
which is also higher in Catalonia. Unfortunately, however, only equity
criteria are only explicitly considered and all the economic efficiency
criteria Catalonia has always vindicated, such as the GDP or exports, are
excluded. Hence, the model has stayed the same.
At any rate, the key question in assessing the value of the final text
is whether the new statute shields the Generalitat’s financing from a
possible absolute majority in Madrid. If the Baltic Sea freezes over again,
the Generalitat will once again find itself in short straits in terms of
economic resources, despite the new Statute.
5.- Conditional tax office
19
Article 204 of the new Statute refers to the Catalan tax office. Point
1 assigns the management, collection, liquidation and inspection of all
the Generalitat’s regional taxes to a future Catalan tax office. Until now,
the Directorate General of Taxes has been exercising these functions
over regional taxes (inheritance tax, gifts tax, property transfer tax,
gambling tax and property taxes) in the Generalitat, thus a simple
change in address was effected shortly after the new statute entered
into force - from the previously mentioned main directorate to a brand-
new Catalan tax office.
Point 1 of Article 204 also establishes that by delegation the
Catalan tax office will have the power to exercise the functions of
administrating, collecting, liquidating and inspecting State taxes (VAT,
personal income tax and special taxes; the corporate tax was again
excluded from the basket of taxes assigned in the end), whenever the
central government assigns the totality of these taxes to the Generalitat
(100% assignment of the tax).
Although the door is not shut to the Catalan tax office exercising
these functions over state taxes, this transcendental aspect of Catalan
government financing will remain unchanged in the medium term, since
the proposed new Catalan statute does not envisage assigning 100% of
any of these taxes’ collection to the Catalan government (although it
seemed that the personal income tax would be completely assigned to
the Generalitat in December 2005). Yet again, the unsalvageable
restriction of having to duplicate the Catalan “basket” of taxes in all the
other common regime communities (primarily owing to the frontal
opposition of Andalusia’s President Chaves) has made it impossible for
the Catalan tax office to be created with a first major tax to help it
along.

20
Although the personal income tax is a very expensive to manage,
it is also the most unpopular, cumbersome and laborious to file and the
most visible to taxpayers, much more so than the VAT, and the new
statute does not allow the brand-new Catalan tax office to start out with
a larger organisation than the General Directorate of Taxes had under
the old statute. As was true for the almost 30 years of the old Sau Statute,
the 100% assignment of a major tax’s collection to the Generalitat
someday will depend on the Catalan political parties’ capacity to exert
pressure on the Chamber of Deputies in Madrid.
Furthermore, point 2 of Article 204 consecrates the State tax office
in Catalonia by explicitly and exclusively reserving the above functions of
administrating, collecting, liquidating and inspecting state taxes for it.
There is no variation or improvement in this article compared with Article
46.3 of the 1979 Sau Statute. However, Article 205.1 in the new Catalan
Statute assigns the collection, liquidation and inspection of all major
taxes borne in Catalonia to the Catalan tax office, with the exception of
local taxes.
Article 204.2 also refers to the constitution of a joint partnership
between State and Catalan tax agencies in a two-year period, a
partnership that "may eventually be" transformed into a single Catalan
tax administration if the central government magnanimously deems it
appropriate. It states that the partnership "may become" a single tax
administration, not that "it will become" a single tax administration. It also
states that the Catalan tax office "may eventually" participate only jointly
in a partnership with the State tax office, a partnership that may become
the tax administration "in" (and not "of") Catalonia in the future. The new
21
statute neither specifics concrete periods nor spells out the detailed
function of this possible future partnership.
There are no international precedents for joint tax partnerships
between central and regional governments with these traits, since
regional governments in federal countries are accustomed to collecting
most major taxes, as they do in Germany, where the regional Länder
governments collect all major taxes, while the Berlin government only
exclusively collects the special beer tax. In Quebec, all taxpayers submit
two income tax declarations each year, one for the Canadian
government and another for the Quebec government.
Regulatory capacity is a similar case. Article 203 of the Moncloa
Statute reserves regulatory capacity for the State, which has the power
to cede it to the Generalitat for partially assigned taxes. The 1979 Statute
makes no reference to regulatory capacity, whereas the Statute
approved last September 30 establishes the Generalitat’s regulatory
capacity over all state taxes borne by Catalonia. Even Antoni Zabalza,
the PSOE government’s former Secretary of the Treasury, criticised the
timid final version of the new Catalan Statute in the area of fiscal
responsibility, which made no significant progress on this crucial issue (El
País, 06.03.2006).
6.- State public investment not guaranteed
Public investment is a cornerstone of a territory’s economic growth,
given the public sector’s pronounced weight in the economy nowadays.
Several years ago, the journal Revista Econòmica de Catalunya
published an article on the economic impact of the 1992 Olympic

22
Games (n.18): public investments of 0.5 trillion PTA in infrastructures, along
with the same amount of private investment, which generated a growth
of 3.4 trillions pesetas in the Catalan GDP (through multiplier effects) in
the years that followed.
The new Catalan Statute’s third additional provision states that
State infrastructure investments in Catalonia must be equal to the weight
of the Catalan economy in the State GDP as a whole (18.5%), excluding
the inter-territorial compensation fund (ICF). The new statute establishes
a commitment period of only seven years, whereas this commitment was
indefinite in the Catalan Parliament’s Statute. Furthermore, the final draft
eliminates any reference to compensation for the State’s historical
investment deficits in Catalonia, which the Catalan Chambers of
Commerce has estimated to be more than 7.5 billion euros.
This additional provision contains another substantial modification
of the text approved by the Catalan parliament: this 18.5% will be
applied to the base of state investments only after the ICF is excluded. In
2006, the central government was slated to invest 12.467 billion euros in
infrastructures, of which 2.306 (18.5%) would correspond to Catalonia if
the new statute were rigorously applied. The ICF must be subtracted from
this figure and in 2006, the ICF was small: only 1.159 billion euros. In
Catalonia, 18.5% would be applied to the difference between
investments and ICF: 11.308 billion in 2006, which would correspond to
2.091 billion.
On February 7, 2006, El País published an article commenting that
the central government was considering multiplying the ICF in the
coming years. President Zapatero now considers that "more weight must
be given to the ICF because it is slated to become the solidarity fund par
23
excellence". If the ICF is multiplied by three or four in the next few years,
the chasm between State investments in Catalan infrastructures and the
weight of the Catalan GDP in the state total will be formidable.
Although the new Catalan statute is already in force, Catalonia
only received 13.9% of the State’s regional investments in autonomous
communities in 2007, the equivalent of 2.958 billion euros, according to
the State General Budgets (SGB). Thus, in the first year of the Statute’s
application, direct State investments in Catalonia declined in
comparison with 2006 (with a budgeted investment of 14.6% in
Catalonia), the lowest amount in the past six years. Despite these figures,
when the State Ministry of the Economy and the Treasury and the
Catalan Ministry of Economy and Finance presented the project for the
2007 SGB in October 2006, they contended that the new statute had
been scrupulously fulfilled. However, other voices protested that the third
additional provision had not been fulfilled, since they do not agree with
the State-proposed definition of infrastructure investment (Barcelona
Chamber of Commerce). Minister Antoni Castells ended up recognising
this publicly in July 2007.
If the concept of investment that appears in the third additional
provision is interpreted literally, i.e., the potential region investments that
figure in the SGB, Catalonia should have received a total of 4.012 billion
(18.5%) in 2007. However, the SGB only envisages infrastructure
investments by the Ministries of Public Works and the Environment and
capital transfers to finance transport and environmental infrastructures
(excluding the ICF). According to this restrictive definition of infrastructure
investment, Catalonia received 3.195 billion, however, only 2.604 billion,
almost the same amount as in 2006, corresponded to infrastructure
investments by the Ministries of Public Works and the Environment, since
24
the remaining 591 million was included in different entries that can hardly
be considered infrastructure investment.
The State concluded that it lived up to the Statute’s third
additional provision under this restrictive definition of infrastructures,
which overlooks energy, telecommunications, logistical, cultural, social,
health, scientific, technological telecommunications and housing
infrastructures. It is totally arbitrary to consider only transport and
environmental infrastructure investments and thus, the difference
between the two interpretations represented a loss of 1.054 billion in
infrastructure investments for Catalonia in 2007, part of which could have
been allocated to improve Catalan railways, which would alleviate the
suffering of the many people who customarily use them in their daily
commutes.
On the other hand, the State is committed to investing in Andalusia
according to its population. The definition that has been applied to
Catalonia will not be used in this case and all potential regional
investments will be taken into account. Different criteria will be applied in
Andalusia (population) than in Catalonia (GDP) and calculations will be
made on two different bases: Andalusia will receive all the State’s
potential regional investments, whereas Catalonia will only receive
potential regional investments by the Ministries of Public Works and the
Environment, aggravated by the different treatment given to capital
transfers and the ICF. One might rather cruelly say that the Catalans
would have been better off with the Andalusian provision. Instead of
receiving 13.9% of the State’s total investments, Catalonia would have
received 16% (the weight of the Catalan population within the State),
which would have meant an additional 456 million.
25
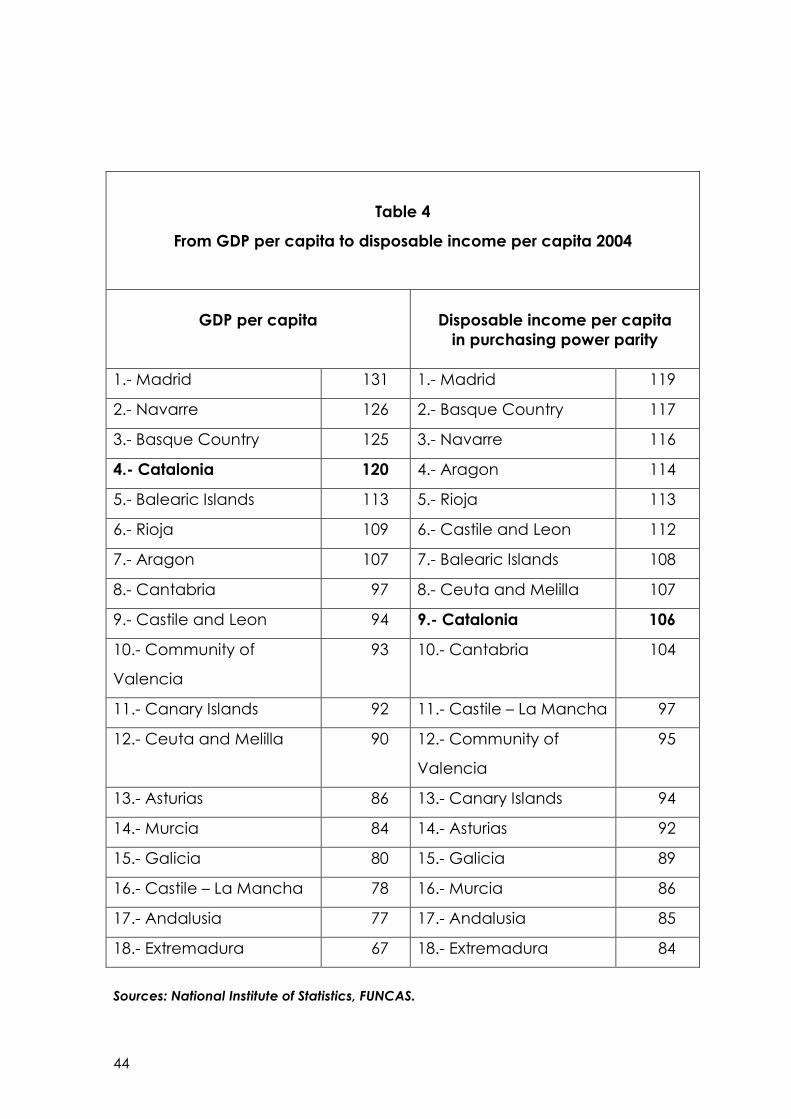
7.- The imprecise ordinality principle
The German Constitutional Court’s 2004 ruling on the principles
governing fiscal flows related to territorial solidarity between federal
states sheds light on the debate over the new autonomous financing
model. In effect, the Court said that the German federal states "should
implement the distribution system they wish, but should not alter the
existing order between the states before and after the redistribution
process", i.e., if Bavaria contributes more to the common treasury one
year, no other payer or payee state should surpasses it in volume of
resources available after the distribution process. Table 4 shows how
Catalonia dropped from the fourth-ranked generator of wealth (GDP
per capita) to ninth-ranked in distribution of wealth in 2004 when
purchasing power parity (disposable income per capita) is taken into
consideration.
Article 206.5 introduced an ordinality principle that attempted to
limit excess Catalan inter-territorial solidarity in practice: "The State must
ensure that the application of adjustment mechanisms does not alter, in
any case, Catalonia’s position in the income per capita ranking of
autonomous communities before adjustment."
However, in February 2006, Guillem López warned of a slight but
decisive correction of this article during its journey through Moncloa: that
this ordinality principle must be defined in real terms, i.e., taking all the
communities’ price levels into account. If per capita income is not
expressed in purchasing power parity (e.g., taking into account that
prices in Barcelona are 30% higher than in Badajoz, according to the
FUNCAS), then the "dike of containment" for financing the Generalitat
26
this article was intended to be will no longer act as an effective
safeguard, since by not considering Catalonia’s price differential within
the context of the country as a whole, the drop in the ranking is less
drastic: from fourth to fifth place instead of fourth to ninth place.
Conclusion: New financing for Catalonia? Too many unknowns
The evolution of the Spanish autonomous state in upcoming years
will be shaped by the concrete deployment of the new autonomy
statutes that have already been approved. The development of the new
Catalan statute, as has been the case historically in autonomous Spain,
will set the standard for future developments in the common regime
communities, both the so-called historical communities as well as the
others, the most enthusiastic defenders of "coffee for everyone".
Furthermore, the deliberately long and winding process that drafting the
new Catalan statute entailed proved fatal to an enhanced level of self-
government: pressure and costs mounted during each day of delay in its
approval and in the end, it was rejected in favour of insufficient progress.
It is hard to venture an accurate opinion on the possibilities
awaiting the Generalitat’s autonomous financing: academics can only
point out the sketchy details on the following points to date:
• The regulatory prevalence of statutory articles over what should be the new autonomous communities’ financing law (the LOFCA).
• The highly interpretative ambiguity in the details of a number of
provisions inserted into the statutes, such as the one in the ordinality clause.
27
• The constitutionality - or unconstitutionality - of foreseeable demands for minimum conditions for direct state investment in some territories, e.g., Catalonia.
• The definition of adjustment mechanisms and limits to solidarity, in
order to reduce the central government’s traditional degree of discretion in this area.
The foregoing explains why judging the potential progress of the
new autonomy statutes is risky and demonstrates how little progress has
been made towards the grand federal arrangement that was meant to
provide stability to the Spanish autonomous state, contrary to what some
voices assert. The fact that open conflicts over the new Catalan Statute
exist in the heart of the Constitutional Court, a court with few federalising
tendencies, demonstrates how very little value the new Catalan statute
may eventually have.
Furthermore, contrary to the case of competential frameworks,
there are far fewer specifics on the financing question in the new
Catalan Statute: the exhaustive definitive breakdown of the
Generalitat’s competences does not correspond to a clear specification
of the contents on new financing, many points of which can be
interpreted differently according to respective positions of political
strength.
This is especially serious as regards the State’s on-going discretion
in the area of territorial redistribution and the existing confusion between
greater fiscal co-responsibility and simple percentage increases in the
share of state taxes: since no regional tax agencies exist to collect these
taxes, the regional share of the VAT or personal income tax is completely
virtual, which may lead to a scenario in which these percentages rise
and regional budgets are cut, according to declarations by Miguel
Angel Fernández Ordóñez, Secretary of the Treasury, shortly after the
28
Moncloa negotiations between the PSOE and the CiU of January 2006,
which concluded the long statutory debate: "The state sufficiency fund
will turn negative for Catalonia" (Expansión, 26.01.2006).
According to the Generalitat’s consultative body, the Consell
Consultiu (by a majority 4 to 3 vote in early September 2005: PSC-
PSOE+PP+ICV vs. CiU+ERC), fiscal flows between territories are the State’s
exclusive and excluding competence. Logically, the central government
does not wish to discuss these fiscal flows with a historical community in
bilateral negotiations, but would rather prefer to frame its discussions
multilaterally, in order to dilute the hypothetical commitments acquired.
In the most frequent fiscal federalism schemes, citizens are the
ones who pay taxes of course, yet they do so in two jurisdictions - central
and territorial - each one of which holds originary taxation powers not
derived from an ad hoc transfer regime granted on the basis of
assumed, fictitious shares of taxes collected by a sole unitary, centralized
fiscal power.
A federal arrangement has an a priori bilateral content and all
generalisations to other territories must be effected a posteriori; the
former arrangement is not usually subordinated to the latter. One knows
beforehand that not everything depends on redistributive mechanisms
not defined by the Senate as a territorial chamber, but rather by the
Council for Fiscal and Financial Policy’s executive power, over which the
central government prevails by virtue of an absolute majority. The
financing envisaged in the new Catalan Statute continues in the vein of
the earlier model, which is closer to decentralised public spending and
further from an effective distribution of tax revenue that can be
considered minimally federal.
29
Catalonia has had many negative encounters with the central
government’s arbitrary use of its discretionary powers in the past 25
years: regardless of party in power, the State has always promulgated all
types of modulating rules to suit its own interests at all times, a
deliberately complex machine behind an assumed territorial
redistribution that is extremely opaque and whose goals are hard to
evaluate. The truth is that more public monies end up being invested in
current expenditure than in infrastructure investments and job creation,
instead of stimulating private employment.
In Guillem López’s opinion, the LOFCA is "the reflection of a Big
Brother who centrally estimates peripheral spending needs according to
his discretion, with a marketed objectivity formulated on the basis of a
series of variables defined by pressure from each region (from
orographic to rural conditions, including dispersion) and measured by
doubtful empirical approaches". As he contended in 2006, "In the
absence of a previous pact on the LOFCA, autonomous financing in the
new Catalan Statute is only window dressing".
Lastly, I agree with Antoni Zabalaza (2007), who considers that
rather than changing the Generalitat’s financing model, the new
Catalan Statute defines a cluster or series of financing models wide open
to a very broad array of possible interpretations that range from a loose
approach to fiscal federalism mechanisms (in case of a generous
interpretation by the central government) to a reinforcement of the
central government’s discretional powers over the distribution of the
common regime communities’ resources (in the case of a more
restrictive interpretation).
30
Thus, depending on how political majorities in the parliaments of
Madrid and Barcelona play out, the Generalitat’s autonomous financing
may improve or even deteriorate in the future. The new Catalan
Statute’s hopes to shield the Generalitat’s financing from possible hostile
absolute majorities in Madrid’s Chamber of Deputies (this being the most
common justification among Catalan political parties and social agents
for drafting a new autonomy statute) have amounted to very little, in
view of the final text.
Appendix: the macroeconomic effects of the Catalan fiscal deficit with
the Spanish State
The years between 1997 and 2003 were characterised by a dearth
of official statistical data on State investment and public spending by
territory. If we consider the principle "transparency equals democracy" to
be basic, the PP did very little honour to its self-proclaimed status as a
liberal party; adding fuel to the fire is the fact that the central tax office
(which boasts one of the world’s finest software systems) does indeed
control taxpayers’ wages, interests, dividends and rents down to the last
penny; however, anyone visiting the Ministry’s website to see where 259
billion euros were spent last year will discover that this information is not
available.
Harvard University publishes the fiscal balances between all 50 US
states and the federal government each year, an excellent, 120-page
booklet that includes a 15-year time series, specifies the amounts
collected and breaks down federal government spending and
investment in each state by type. A basic, preliminary step even before
publishing fiscal balances would consist in obliging State ministries to
31
release a territorialised report on actual, rather than budgeted
investment and public spending each year based on information about
its recognised obligations. This information should be available on the
Internet and its publication date announced in advance: e.g., the
Eurostat scrupulously fulfils its publication schedule for official statistics.
There is a century-old tradition of studies in Catalonia on the
region’s fiscal relations with the Spanish State1: Francesc Flos (1896),
Guillem Graell (1902), Joan Crexells (1923), Josep Llord (1927), Carles Pi
Sunyer (1929-1959), Ramon Trias Fargas (1960), Jacint Ros Hombravella
(1966 and 1974 with Joan Sardà), Josep Maria Bricall (1978), Antoni
Castells and Martí Parellada (1983), Arcadi Oliveres (1991), Montserrat
Colldeforns (1995), Esther Martínez and Guillem López-Casasnovas (2000)
among others, all tried to estimate Catalonia’s contribution to the
Spanish State. This question is much more pressing nowadays since, if
public spending scarcely reached 10% of the Spanish GDP in 1975, today
the Spanish public sector controls a major part of the wealth generated
in this developed country (40% of the GDP in 2003). By the same token,
the public sector also has enormous regulatory powers, to the point in
which its complicity or indifference can favour or harm entire economic
sectors and territories (Tremosa, 2004a).
However, these types of studies are much more recent in the rest
of Spain, the most rigorous work to date being Las balanzas fiscales de
las CCAA, 1991-1996 (Castells et al, 2000). The first PSOE government
commissioned the Institute for Fiscal Studies to conduct this voluminous
study, which released all the public information needed to calculate
fiscal balances based on different general interventions. However, the
1 For a historical view of Catalonia’s fiscal deficit with the Spanish State during the
twentienth century, see Francesc Roca’s article in Revista Econòmica de Catalunya (2000).
32
Institute would decline to publish it under the PP government and it
would be put out by the Ariel publishing house in the end.
It is curious to observe how institutions in Madrid (the press, private
foundations and ministries) never refer to this rigorous study, since it is the
only one that uses liquidated information from the central government’s
general interventions. Furthermore, it is also the only study that uses the
two internationally accepted criteria for calculating fiscal balances
related to the distribution of central government expenditure and public
investment in the community that houses the State capital, i.e., the so-
called monetary flow and benefit criteria or approaches. Strangely
enough, Madrid only releases fiscal balances based on benefit criteria,
which always results in a much more favourable outcome for the
country’s capital than monetary flow criteria does.
In calculating the fiscal balance of the Autonomous Community of
Madrid (ACM) with the State, we must first purify the "host effect" on
taxes collected: many companies have factories in other autonomous
communities, yet their fiscal headquarters are in Madrid and their taxes
allocated to that autonomous government. For example, the tax office
collected 57.372 billion euros from Madrid in 2003 or 45% of the total
127.963 billion collected; this percentage is much higher than the 17.53%
the ACM contributed to the Spanish GDP in 2003, according to the
Spanish National Institute of Statistics. Hence, the risk exists that more
taxes may be allocated to the ACM than those actually contributed.
But the main source of discrepancy in the ACM’s fiscal balances
derives from the methodology used to calculate them and refers to the
State’s allocation of public spending in Madrid. According to monetary
flow criteria, public expenditure is assigned to the territory where it is
33
effectively spent: e.g., if the Teatro Real is constructed in Madrid, its cost
must be integrally assigned to the ACM. However, according to benefit
criteria, public spending is distributed among the territories of all citizens
who benefit from it: if the Teatro Real is for all Spaniards, its cost must be
shared by all autonomous communities.
Therefore, the ACM’s fiscal deficit with the central public sector is
calculated solely on the basis of benefit criteria, which involves
"centrifuging" a large part of the public expenditure actually spent within
its territory to the other communities. This brings to mind the major public
infrastructure investments in the capital and the cost of wages for
Madrid’s 400,000 civil employees. Not assigning a larger part of all this
public spending to the ACM (where most of it is actually spent) and
sharing it out among other communities is what allows Madrid to achieve
a fiscal deficit, one, strangely enough, always slightly higher than
Catalonia’s (Alcaide and Alcaide, 2001, 2002, 2003). We should also
bear in mind that using benefit criteria call for hypotheses on the
beneficiaries of public spending in the capital. And both Castells (2000)
as well as De la Fuente (2001) respectively warned that "establishing
hypotheses on beneficiaries can be a perilous task" and that "an overly-
eager application of benefit criteria is highly counter-productive, since it
makes fiscal balances hard to interpret and dangerously heightens
subjectivity".
In the midst of methodological debates on the best criteria or
approach to use in calculating fiscal balances, it is interesting to note the
stance of a group of academics summoned by the Catalan Generalitat
in January 2005 (Generalitat de Catalunya, 2005:) La balança fiscal de
34
Catalunya amb l’Administració Central)2, which issued its opinion on the
matter. The use of one or the other approach depends on the goals of
the analysis one wishes to conduct: the monetary flow approach
attempts to measure the economic impact generated by public sector
activity in a territory, whereas the benefit flow approach attempts to
calculate how spending policies affect individual well-being. Therefore,
monetary flow criteria is more correct, accurate and rigorous in
analysing the influence of public sector action on a region’s economic
growth, whereas benefit flow criteria would be used to attempt to
analyse public sector action in redistributive terms.
How can Catalonia interpret the total opacity of the PP
government in this context during the past eight years, with respect to
data on different general interventions, even though individual
mandates for calculating and releasing public fiscal balance were
included in the State of the Nation resolutions issued by the Chamber of
Deputies in 1998 and 1999? How can Catalonia interpret the assignment
of information solely and eternally to private foundations in Madrid (the
FUNCAS), which concocts it in such a way that Madrid always figures as
the "champion of inter-territorial solidarity", without even specifying the
calculation methodology? Guillem López-Casasnovas was right (2004)
when he said, “Tell me why you want to know fiscal balances and I will
tell you the most convenient methodology".
However, if we analyse the autonomous communities’ fiscal
balances with the central public sector on the basis of the monetary flow
2 “Grup de treball per a l’actualització de la balança fiscal de Catalunya. Part Catalana de la Comissió Mixta de Valoracions Administració de l’Estat-Generalitat de Catalunya”. The members of this group are: Núria Bosch, Joan F. Corona, Joan Carles Costas, Marta Espasa, Guillem López, Eduard Rius, Joan Ramon Rovira, Xavier Sala-i-Martín, Joaquim Solé Vilanova, Ramon Tremosa, Maite Vilalta, Maties Vives amd Antoni
Zabalza.
35
method of calculation, Castells, Bosch, Barberán, Ruiz-Huerta et al’s
work, cited earlier, presents a balance more compatible with Spain’s
unequal regional evolution in recent years: from 1991 to 1996, the EURAM
(the Mediterranean Euroregion that includes Catalonia, the Community
of Valencia and the Balearics) figured as the main net contributor of
resources (Catalonia with -7% of its annual average GDP, the Balearics
with -7.5% and the Community of Valencia with -2.5%); Navarre and the
Basque Country were also net contributors during the entire period (-3.5%
and -1.5% respectively); and Madrid’s fiscal deficit with the central public
sector was only -0.09%. Antoni Castells, the Generalitat’s current Minister
of the Economy, estimates the Catalan fiscal deficit to be between 8
and 9% of the annual Catalan GDP, whereas Alcaide and Alcaide (2003,
2004) put it between 10% and 10.5% of the Catalan GDP for 2002 and
2003. Regardless of who is right, is there not a clear relationship between
the excess drainage and economic stagnation?
In Spain, however, the only fiscal balances for the years between
1995 and 2003 were published by the FUNCAS and the authors never
describe the methodology used for calculating the regional fiscal
balances they present, a question especially relevant in Madrid’s case.
As the authors themselves affirmed in the 2002 edition, their imputations
of State expenditures were based on provincial and autonomous GAV,
"a debatable, yet necessary method, because of the lack of information
from the Office of the State Comptroller, which only publishes liquidated
data at the aggregated State level" (page 30).
Thus, in the FUNCAS’ 2003 edition, the authors cut their own
estimations of the Catalan fiscal deficit in comparison with the 2002
edition without offering any justification. Likewise, references to the
Office of the State Comptroller and the lack of available official data
36
were dropped from the brief methodological note furnished, asserting
that FUNCAS’ regional statistics team, which was responsible for this
research, assumes that several estimations made to complete the
closing of the regional economic balance have components of personal
opinion" (page 5). The denial of official liquidated information on the
central government’s investment performance by territory will keep
feeding the Catalan belief that fiscal balances are the best-kept secret
in the Kingdom.
Table 10 shows the projected results of a reduction of the Catalan
fiscal deficit with the Spanish State for 2010. Economic literature suggests
different techniques for quantifying the impact of public spending
programmes: e.g., Nordhaus’ study (2002) quantified the economic cost
to the US of the war with Iraq, Abadie and Gardeazábal’s (2001) studied
the impact of terrorism on the Basque economy, Sosvilla et al’s (2001)
examined the impact of EU aid on the Aragonese economy, Sosvilla and
Herce (1998 and 1999) studied the impact of subsidies from EU funds on
the Spanish economy and finally, Herce and Sosvilla’s (2002) quantified
the economic effects of railway investments in Spain for 2007.
This section summarises the contents of a recently published article
in the journal Applied Economics (Pons and Tremosa, 2005), which
presented a simulation of growth for the prospective Catalan economy,
completing the previously conducted analysis of the Catalan fiscal
deficit’s impact. If the volume of the Catalan deficit from 1995 to 1998
had been invested in infrastructures, the Catalan GDP in 2000 would
have been 32% higher (Ros, Tremosa and Pons, 2003); furthermore, the
Catalan economy reached a fiscal pressure of 39% of the Catalan GDP
in 1998, whereas public expenditure only amounted to 30.5% of the
37
Catalan GDP, which allows the Catalan public sector’s situation to be
defined as "persistent atrophy" (Ros, Tremosa and Pons, 2002).
In the late 1980s, a series of studies began to surface in economic
literature that analysed the importance of public infrastructures in
national and regional productivity. Most of these studies were based on
calculating production elasticity with respect to public capital by means
of a production function, normally a Cobb-Douglas. However, studies
that obtain production elasticity with respect to public capital via a uni-
equational production function estimation have been subject to a
barrage of methodological criticism. One of the main limitations to this
approach is that it excludes the possible presence of feedback effects
among the variables it considers, which may be important in the long
run, since it overlooks the possible existence of a simultaneous
relationship between growth in production and growth in public capital.
To overcome this limitation, economic literature suggests the use of
multi-equation time series techniques (VAR models) that incorporate the
GDP, use, private capital and public capital. These models successfully
capture the relationships produced over time among these variables by
means of impulse-response functions. Dynamic feedback effects are
essential to estimating the relationships between public capital and the
model’s other variables, since they allow us to consider the effects of
public capital on the GDP, employment and private capital; by the
same token it also allows us to estimate these variables’ effect on the
growth of public capital in a feedback process.
Different methodologies can be used to calculate elasticity in the
impact of rising public investment on the GDP. The methodology used in
this section, based on VAR models, provides higher elasticities than those
38
obtained by other methodologies. Even so, many authors believe it is the
best methodology for conducting these types of simulations of
economic growth, since it takes feedback effects among the model’s
variables into consideration. This effect may be considerable and this
elasticity might be underestimated, if not taken in account.
Therefore, this study has considered gross GDP variables at
constant prices, employment, private capital and public capital. The
statistical information refers to the Catalan economy and the period
between 1965 and 1999 was used to estimate the model. Information on
product and employment was obtained from the Renta Nacional de
España y su distribución provincial, published by the BBVA Foundation.
The private and public capital series are based on El stock de capital en
España y sus comunidades autónomas, by the same source. In the latter
case, the values for public and private capital in the Catalan economy
for 1999 were extrapolated on the basis of these variables’ values for
Spain as a whole.
This is not an overly lengthy time series, a circumstance
aggravated by the fact that the BBVA Foundation’s production and
employment data is biennial in nature. However, most studies used in this
kind of research refer to the Spanish economy and as mentioned
previously, also feature this limitation and use time series similar to those
used here (both in terms of the period considered as well as the way in
which they refer to the availability of observations). Therefore, once the
VAR model was estimated, a series of simulations were conducted on
the growth of the Catalan economy and the series on the GDP at
39
constant prices and employment devised by the Catalan Statistics
Institute were used to conduct them3.
The Catalan economy would probably come a step closer to the
more developed regions of the European Union in terms of GDP per
capita (expressed in terms of purchasing power parity, (PPP)) in the case
of the optimistic scenario, take a step backward in the case of the
pessimistic scenario and stay the same as now, matching the current
average GDP per capita of the UE-15, in the case of the intermediate
scenario (according to the EUROSTAT, Catalonia’s GDP per capita in PPP
was rated 99 in 2000, when 100 is considered the UE-15 average). Yet, if a
substantial reduction of the fiscal deficit were to take place each year in
the 2002-2010 period, the previously mentioned VAR model estimates
indicate that the Catalan economy would be in a much better position
by the end of the period, in terms of production (Table 8), employment
(Table 9), and productivity.
In the case of the intermediate scenario, if the Catalan fiscal
deficit with the Spanish State were reduced by 1% of the GDP each year
in the 2002-2010 period, Catalonia’s GDP per capita would be 9.8%
higher in 2010; if reduced by 3%, the GDP per capita would be 32.1%
higher; and if reduced by 5%, the GDP per capita would be 58.3%
higher.
In short, should there be no reduction of the fiscal deficit, the
Catalan economy would grow in accordance with the intermediate
scenario and this growth would not be very far from the average growth
of UE-15 countries. Catalonia will only be able to make considerable
3 This statistical infomration on the Catalan economy was obtained from the http://www.idescat.es website.
40
progress in closing the gap with more dynamic EU regions if it can
substantially reduce the fiscal deficit with the Spanish State.
Thus, given the above assumptions, if the fiscal deficit were
reduced by 1% of the GDP each year (bearing in mind that the fiscal
deficit has oscillated between 8% and 10% in recent years), Catalonia
might score 108 and 112 on the GDP per capita index in 2010, compared
to 100 as the UE-15 average. If the fiscal deficit were reduced by 3% of
the annual GDP, the Catalan GDP per inhabitant would be around 120-
130 (20%-30% above the UE-15 average). Finally, if the reduction
equalled 5% of the GDP, GDP per inhabitant would be between 135 and
150 on the index. The greater growth in the Catalan economy that
would result from a reduced fiscal deficit would allow the region to
reach GDP per capita (PPP) levels similar to higher European regions’.
Table 9 shows several of the regions Catalonia might approach, and in
some cases surpass, in each one of the three scenarios of a reduced
Catalan fiscal deficit with the Spanish State.
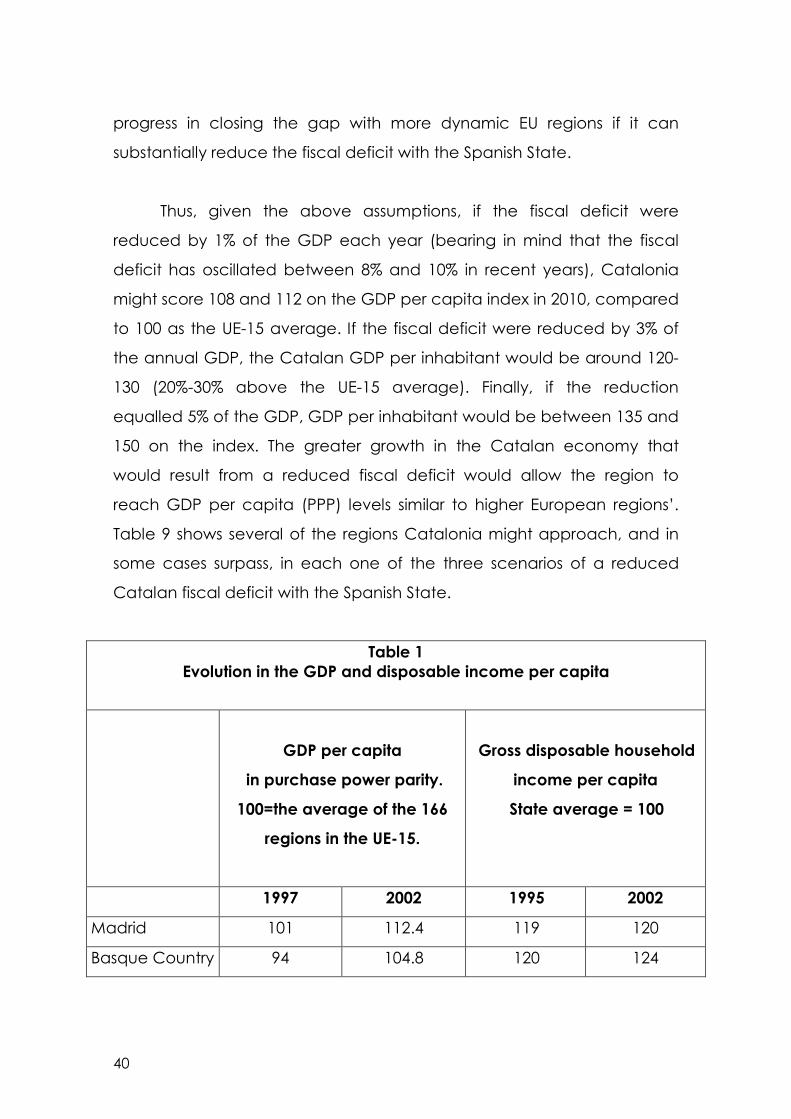
Table 1
Evolution in the GDP and disposable income per capita
GDP per capita
in purchase power parity.
100=the average of the 166
regions in the UE-15.
Gross disposable household
income per capita
State average = 100
1997 2002 1995 2002
Madrid 101 112.4 119 120
Basque Country 94 104.8 120 124
41
Navarre 97 104.2 124 122
Catalonia 100 100.9 117 112
Balearic Islands 101 97.9 124 121
Community of Valencia
76 79.9 96 97
Spanish State 80 84.7 100 100
Sources: Eurostat, National Institute of Statistics.
42
Table 2
Distribution of public expenditure in Spain by level of government
1980 2001
% of the
total % GDP % of the total % GDP
Central government
(The State and Social Security)
90 26 61 25
Regional
governments
(autonomous communities)
- - 26 11
Local governments (municipal and provincial councils)
10 3 13 5
Total 100 29 100 41
Sources: Ministry of the Treasury, “La Descentralización del gasto público en España”. Ministry of Public Administrations, “Informe Económico-Financiero de las Administraciones Territoriales”.
Table 3
Distribution of tax collection in Spain by level of government
1988 2001
% of the
total % GDP
% of the
total % GDP
Central government
(State and Social Security)
86 29 80 32
Regional governments
(autonomous communities)
6 2 12 6
Local governments (municipal and provincial councils)
8 3 8 4
Total 100 34 100 40

43
Sources: Ministry of the Treasury, “La Descentralización del gasto público en España”. Ministry of Public Administrations, “Informe Económico-Financiero de las Administraciones Territoriales”.
44
Table 4
From GDP per capita to disposable income per capita 2004
GDP per capita
Disposable income per capita
in purchasing power parity
1.- Madrid 131 1.- Madrid 119
2.- Navarre 126 2.- Basque Country 117
3.- Basque Country 125 3.- Navarre 116
4.- Catalonia 120 4.- Aragon 114
5.- Balearic Islands 113 5.- Rioja 113
6.- Rioja 109 6.- Castile and Leon 112
7.- Aragon 107 7.- Balearic Islands 108
8.- Cantabria 97 8.- Ceuta and Melilla 107
9.- Castile and Leon 94 9.- Catalonia 106
10.- Community of
Valencia
93 10.- Cantabria 104
11.- Canary Islands 92 11.- Castile – La Mancha 97
12.- Ceuta and Melilla 90 12.- Community of
Valencia
95
13.- Asturias 86 13.- Canary Islands 94
14.- Murcia 84 14.- Asturias 92
15.- Galicia 80 15.- Galicia 89
16.- Castile – La Mancha 78 16.- Murcia 86
17.- Andalusia 77 17.- Andalusia 85
18.- Extremadura 67 18.- Extremadura 84
Sources: National Institute of Statistics, FUNCAS.

45

46
Table 5
Resources of the Catalan Generalitat:
its share of the State sufficiency fund and taxes
Sau Statute (1979)
LOFCA Revision (2001)
Moncloa Statute (2006)
VAT: 35% VAT: 50% Personal income tax: 33% Personal income tax: 50%
Excise duties: 40% Excise duties: 58%
NEGATIVE STATE SUFFICIENCY
FUND*
“There will be more than enough
money” to cover the Generalitat’s budget with the percentage of its share of taxes in 2006. Catalonia will become a net
contributor to the State sufficiency fund
Most likely final outcome: similar economic resources for the Generalitat
POSITIVE STATE SUFFICIENCY FUND
Money is always lacking to cover the Generalitat’s budget with the percentage of its share of taxes. Catalonia had always been a net
receptor of the State sufficiency fund
Source: “Estatut, aeroports i ports de peix al cove” (2006), Ramon Tremosa i Balcells
* Miguel Ángel Fernández Ordóñez, Secretary of the Treasury: “El fondo de suficiencia estatal pasará a ser negativo para Cataluña” (Expansión, 26.01.2006)
47
Table 6
Resources linked to Catalonia’s autonomous financing system
2003
Billion
euros
% variation
2003/2002
Personal income tax, 33% 3.541 6.3%
VAT, 35% 2.741 9.9%
Excise duties 1.367 4.4%
Alcohol and derived beverages, 40% = 81 2.3% Tobacco, 40% = 404 9.1% Hydrocarbons, 40% = 724 1.6% Electricity, 100% = 158 7.7% Traditionally assigned taxes 3.107 20.9%
Wealth tax = 274 12.6% Inheritance and gift tax = 390 18.1% Property transfer tax = 1.213 17.1% Official documents tax = 866 35.2% Gambling taxes = 287 -7.2% Regulatory taxes 98 6.8%
Transport taxes 246 8.5%
TOTAL FISCAL REVENUE (1)
11.249
10.7%
State sufficiency fund 2.058 7.5%
Social Security guarantee fund 36 1.1%
TOTAL TRANSFERS FROM THE STATE (2)
2.093
7.4%
TOTAL RESOURCES (1+2)
13.342
10.2%
Catalan GDP, 2.003 billion euros 156.272
Percentage of the Generalitat’s total
resources over Catalan GDP
8.53%
Sources: Nota d’Economia, 82 (2005) and Idescat.

48
Table 7
Resources linked to the common regime autonomous financing system*
2003
Billion € € / inhabitant Index = 100
State
average
1.- Extremadura 2.336 2,175 123
2.- Castile and Leon 5.163 2,075 118
3.- La Rioja 605 2,105 116
4.- Cantabria 1.124 2,045 116
5.- Aragon 2.503 2,035 115
6.- Asturias 2.140 1,990 113
7.- Galicia 5.445 1,979 112
8.- Castile-la Mancha 3.510 1,933 110
9.- Andalusia 13.489 1,773 101
10.- Canary Islands 3.245 1,713 97
11.- Catalonia 11.355 1,694 96
12.- Murcia 2.051 1,616 92
13.- Community of
Valencia
7.187 1,608 91
14.- Madrid 8.739 1,528 87
15.- Balearic Islands 1.414 1,492 85
Total 70.306 1,763 100
* The inter-territorial compensation fund, sufficiency fund, and European funds, which raised Extremadura’s index to 142 in 2002, are not included in these resources.
* These resources also exclude State investment or public expenditure by territory, which accentuates the differences in favour of some territories and compensates several insufficiencies in autonomous financing per capita (Madrid).

49
Source: Nota d’Economia, 82 (2005).
50
Table 8
Comparison of financing proposals
Catalan Government
April 2005 Articulated proposal
CiU’s proposal
January 2005 Articulated proposal
Tinell Arrangement
December 2003 A government agreement
between PSC-PSOE, ERC and ICV
Reference to the
LOFCA
No reference No reference No reference
Catalan
contribution
Based on an assessment of State services (Art. 5) and the solidarity quota (Art. 7): in no cases can the State attribute over 50% of Catalan taxes to itself
Contribution quota
Based on the Generalitat’s spending needs (ap. 6). Assessment of the contribution to State services and solidarity (Sect. 3)
Tax Office All regional and transferred taxes (Art. 4)
All taxes accrued in Catalonia (Art. 1, Chap. 2)
Regional, transferred and shared (Sect. 3)
Regulatory
capacity
(total or shared)
All taxes borne in Catalonia (Art. 3.2)
All taxes accrued in Catalonia (art. 2, Chap. 2)
All taxes borne in Catalonia (Sect. 4)
Taxes transferred
to the
Generalitat
A minimum of 50% of all taxes accrued and collected in Catalonia (Art. 5)
A share in all taxes accrued in Catalonia, as well as revenue from the regional tax regime (Art. 1, Chap. 4)
A share of all taxes Sect. 4)
Mixed
commission
Bilateral body, notwithstanding agreements undertaken by the Generalitat in the Council for Fiscal and Financial Policy (CFFP) (Art. 10)
Bilateral negotiating body (Art. 1, Chap. 3)
Bilateral negotiating body (Sect. 2)
Local treasuries
(institutional
loyalty)
Compensation for legislative changes (art 19.3) and improper financing competences (Art 19.5)
The Generalitat’s exclusive competence in local financing (Art. 1, Chap. 6)
No reference
State
investments in
Catalonia
State investment proportional to the Catalan share of the Spanish GDP and compensation for accumulated deficits (single a.d.)
No reference State investment proportional to the Catalan share of the Spanish GDP and compensation for accumulated deficits (Sect. 7)
Reduction of the
Catalan fiscal
Equalisation to the fiscal deficit of EU territories with
A cap on the Catalan fiscal
Equalisation to the fiscal deficit of EU territories with
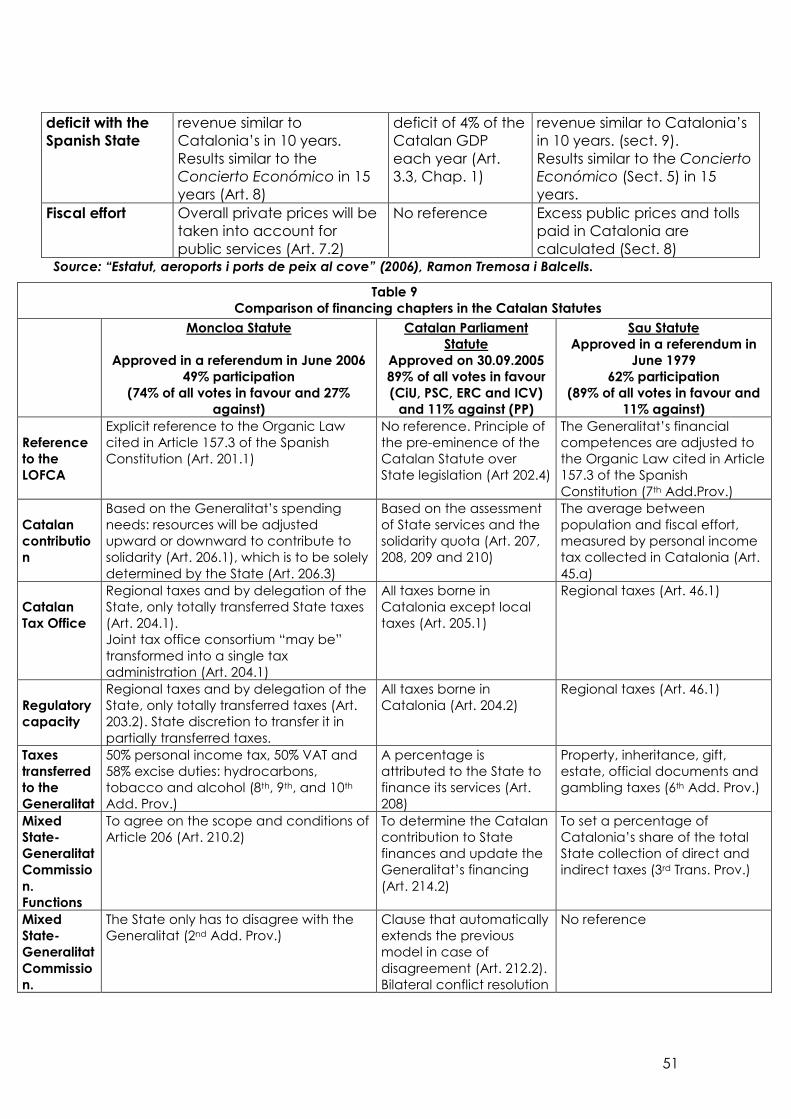
51
deficit with the
Spanish State
revenue similar to Catalonia’s in 10 years. Results similar to the Concierto Económico in 15 years (Art. 8)
deficit of 4% of the Catalan GDP each year (Art. 3.3, Chap. 1)
revenue similar to Catalonia’s in 10 years. (sect. 9). Results similar to the Concierto Económico (Sect. 5) in 15 years.
Fiscal effort Overall private prices will be taken into account for public services (Art. 7.2)
No reference Excess public prices and tolls paid in Catalonia are calculated (Sect. 8)
Source: “Estatut, aeroports i ports de peix al cove” (2006), Ramon Tremosa i Balcells.
Table 9
Comparison of financing chapters in the Catalan Statutes
Moncloa Statute
Approved in a referendum in June 2006
49% participation
(74% of all votes in favour and 27%
against)
Catalan Parliament
Statute
Approved on 30.09.2005
89% of all votes in favour
(CiU, PSC, ERC and ICV)
and 11% against (PP)
Sau Statute
Approved in a referendum in
June 1979
62% participation
(89% of all votes in favour and
11% against)
Reference
to the
LOFCA
Explicit reference to the Organic Law cited in Article 157.3 of the Spanish Constitution (Art. 201.1)
No reference. Principle of the pre-eminence of the Catalan Statute over State legislation (Art 202.4)
The Generalitat’s financial competences are adjusted to the Organic Law cited in Article 157.3 of the Spanish Constitution (7th Add.Prov.)
Catalan
contributio
n
Based on the Generalitat’s spending needs: resources will be adjusted upward or downward to contribute to solidarity (Art. 206.1), which is to be solely determined by the State (Art. 206.3)
Based on the assessment of State services and the solidarity quota (Art. 207, 208, 209 and 210)
The average between population and fiscal effort, measured by personal income tax collected in Catalonia (Art. 45.a)
Catalan
Tax Office
Regional taxes and by delegation of the State, only totally transferred State taxes (Art. 204.1). Joint tax office consortium “may be” transformed into a single tax administration (Art. 204.1)
All taxes borne in Catalonia except local taxes (Art. 205.1)
Regional taxes (Art. 46.1)
Regulatory
capacity
Regional taxes and by delegation of the State, only totally transferred taxes (Art. 203.2). State discretion to transfer it in partially transferred taxes.
All taxes borne in Catalonia (Art. 204.2)
Regional taxes (Art. 46.1)
Taxes
transferred
to the
Generalitat
50% personal income tax, 50% VAT and 58% excise duties: hydrocarbons, tobacco and alcohol (8th, 9th, and 10th Add. Prov.)
A percentage is attributed to the State to finance its services (Art. 208)
Property, inheritance, gift, estate, official documents and gambling taxes (6th Add. Prov.)
Mixed
State-
Generalitat
Commissio
n.
Functions
To agree on the scope and conditions of Article 206 (Art. 210.2)
To determine the Catalan contribution to State finances and update the Generalitat’s financing (Art. 214.2)
To set a percentage of Catalonia’s share of the total State collection of direct and indirect taxes (3rd Trans. Prov.)
Mixed
State-
Generalitat
Commissio
n.
The State only has to disagree with the Generalitat (2nd Add. Prov.)
Clause that automatically extends the previous model in case of disagreement (Art. 212.2). Bilateral conflict resolution
No reference
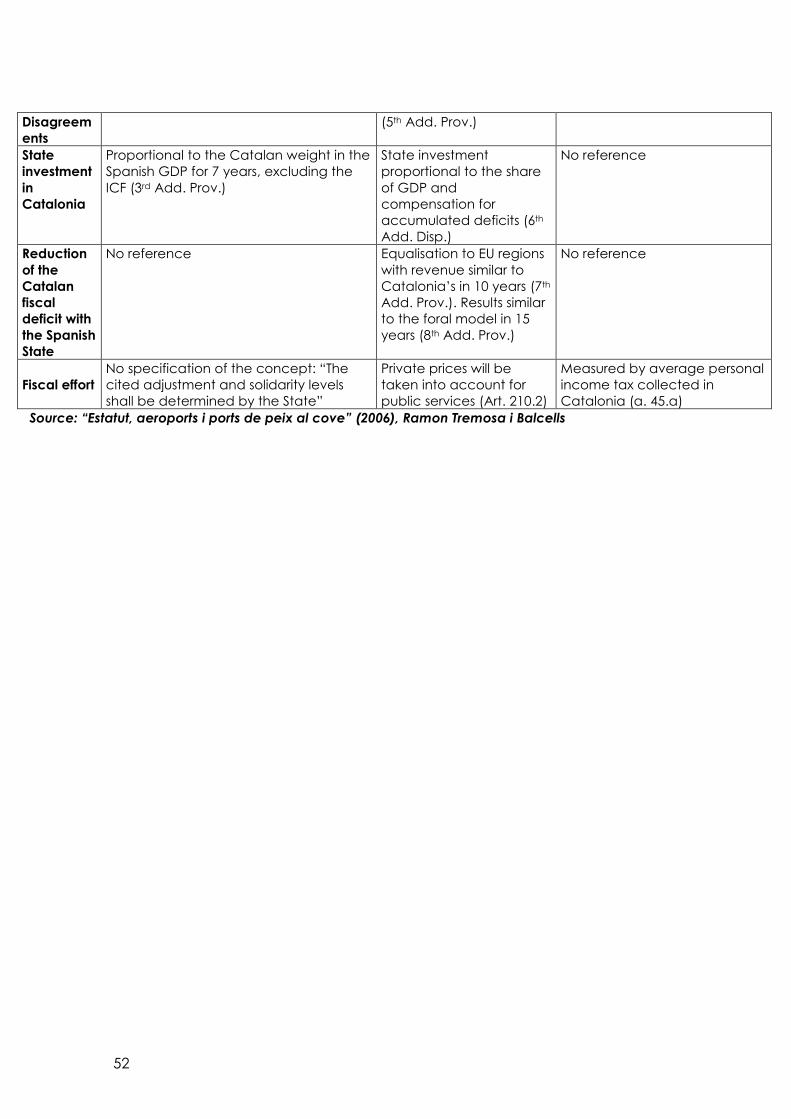
52
Disagreem
ents
(5th Add. Prov.)
State
investment
in
Catalonia
Proportional to the Catalan weight in the Spanish GDP for 7 years, excluding the ICF (3rd Add. Prov.)
State investment proportional to the share of GDP and compensation for accumulated deficits (6th Add. Disp.)
No reference
Reduction
of the
Catalan
fiscal
deficit with
the Spanish
State
No reference Equalisation to EU regions with revenue similar to Catalonia’s in 10 years (7th Add. Prov.). Results similar to the foral model in 15 years (8th Add. Prov.)
No reference
Fiscal effort
No specification of the concept: “The cited adjustment and solidarity levels shall be determined by the State”
Private prices will be taken into account for public services (Art. 210.2)
Measured by average personal income tax collected in Catalonia (a. 45.a)
Source: “Estatut, aeroports i ports de peix al cove” (2006), Ramon Tremosa i Balcells
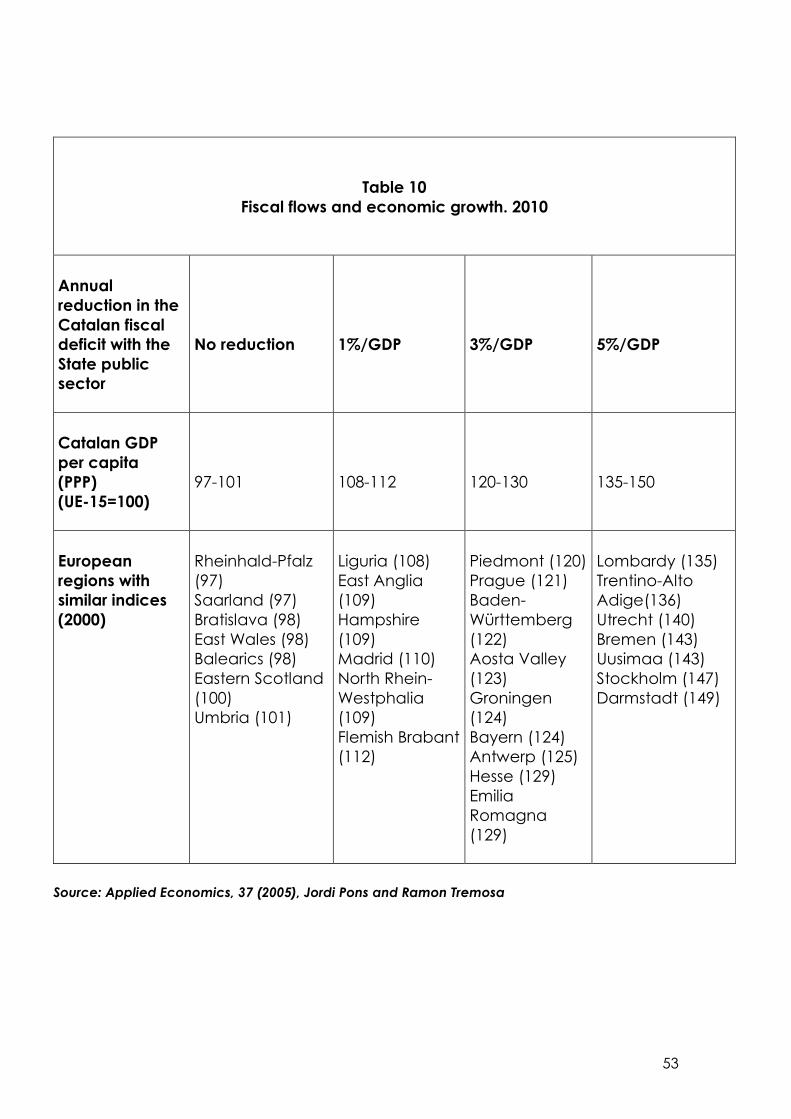
53
Table 10
Fiscal flows and economic growth. 2010
Annual
reduction in the
Catalan fiscal
deficit with the
State public
sector
No reduction
1%/GDP
3%/GDP
5%/GDP
Catalan GDP
per capita
(PPP)
(UE-15=100)
97-101
108-112
120-130
135-150
European
regions with
similar indices
(2000)
Rheinhald-Pfalz (97) Saarland (97) Bratislava (98) East Wales (98) Balearics (98) Eastern Scotland (100) Umbria (101)
Liguria (108) East Anglia (109) Hampshire (109) Madrid (110) North Rhein-Westphalia (109) Flemish Brabant (112)
Piedmont (120) Prague (121) Baden-Württemberg (122) Aosta Valley (123) Groningen (124) Bayern (124) Antwerp (125) Hesse (129) Emilia Romagna (129)
Lombardy (135) Trentino-Alto Adige(136) Utrecht (140) Bremen (143) Uusimaa (143) Stockholm (147) Darmstadt (149)
Source: Applied Economics, 37 (2005), Jordi Pons and Ramon Tremosa
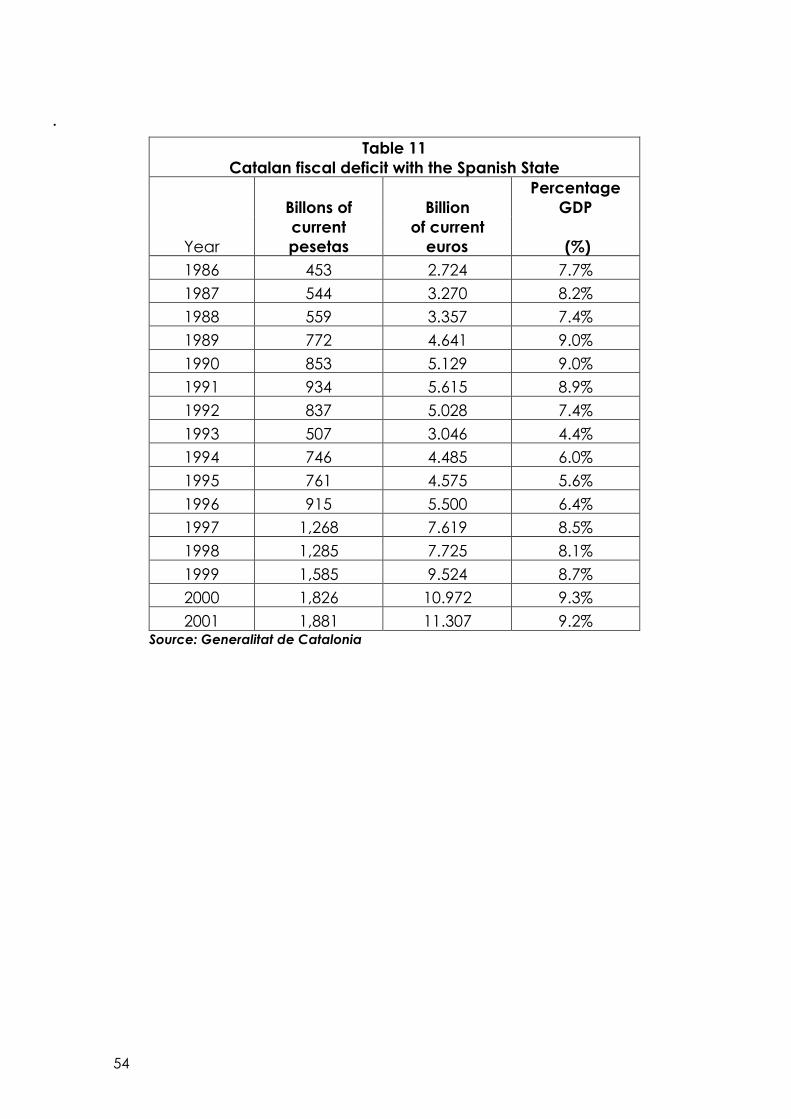
54
.
Table 11 Catalan fiscal deficit with the Spanish State
Billons of Billion
Percentage
GDP
Year current
pesetas
of current
euros (%)
1986 453 2.724 7.7%
1987 544 3.270 8.2%
1988 559 3.357 7.4%
1989 772 4.641 9.0%
1990 853 5.129 9.0%
1991 934 5.615 8.9%
1992 837 5.028 7.4%
1993 507 3.046 4.4%
1994 746 4.485 6.0%
1995 761 4.575 5.6%
1996 915 5.500 6.4%
1997 1,268 7.619 8.5%
1998 1,285 7.725 8.1%
1999 1,585 9.524 8.7%
2000 1,826 10.972 9.3%
2001 1,881 11.307 9.2% Source: Generalitat de Catalonia
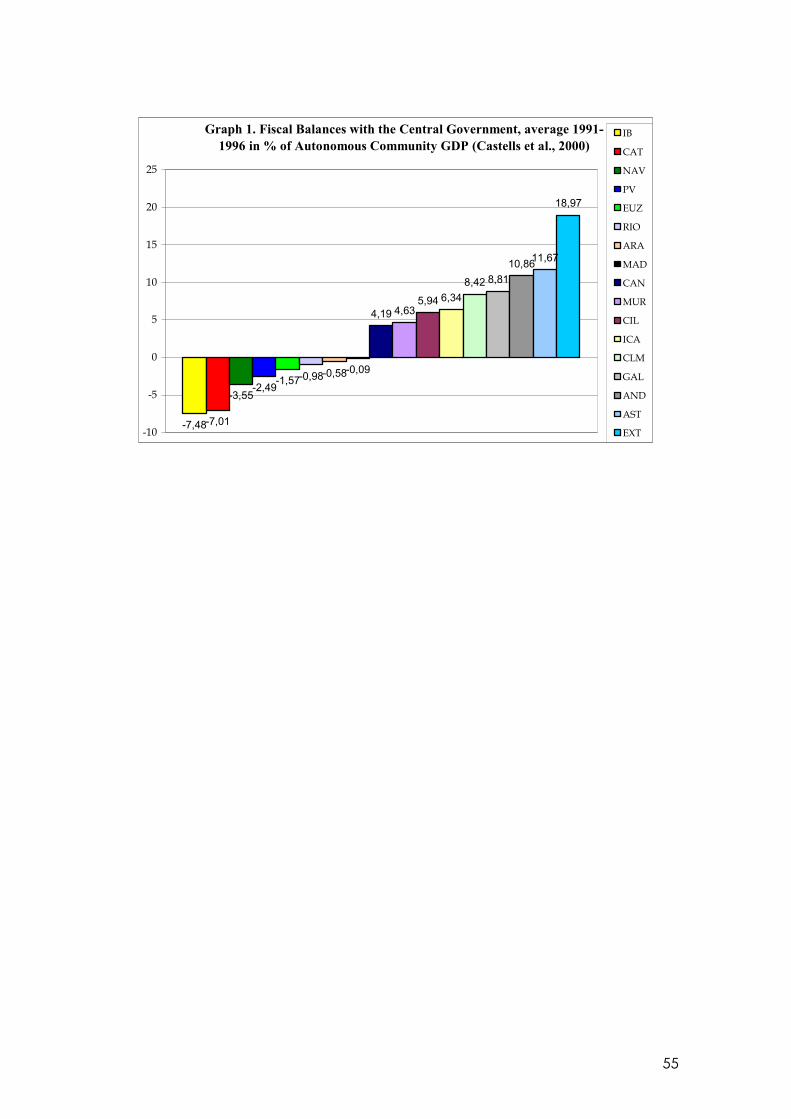
55
Graph 1. Fiscal Balances with the Central Government, average 1991-
1996 in % of Autonomous Community GDP (Castells et al., 2000)
-7,48-7,01
-3,55-2,49
-1,57-0,98-0,58-0,09
4,19 4,635,94 6,34
8,42 8,81
10,8611,67
18,97
-10
-5
0
5
10
15
20
25
IB
CAT
NAV
PV
EUZ
RIO
ARA
MAD
CAN
MUR
CIL
ICA
CLM
GAL
AND
AST
EXT
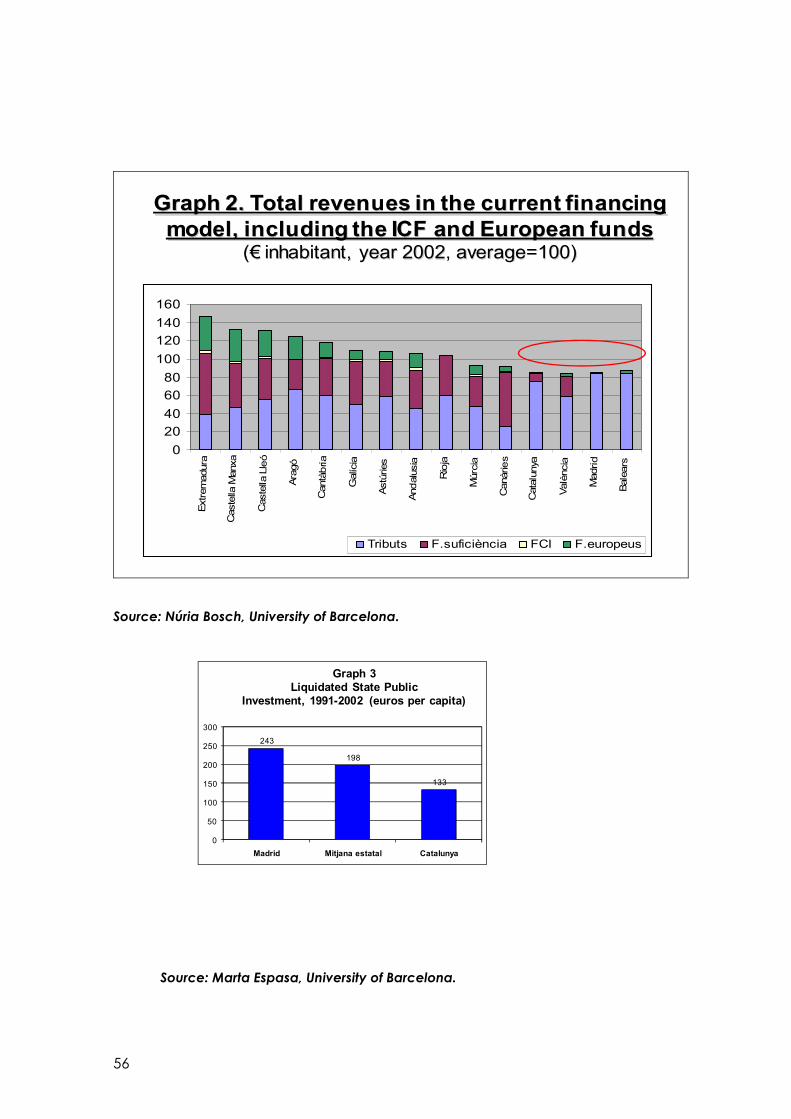
56
0
20
40
60
80
100
120
140
160
Ext remadura
Castella Manxa
Castell a Ll eó
Aragó
Cantàbria
Gal íci a
Astúries
Andal usi a
Rioja
Múrcia
Canàries
Catal unya
Val ència
Madrid
Balears
Tributs F.suficiència FCI F.europeus
Graph 2. Total revenues in the current financing
model, including the ICF and European funds(€ inhabitant, year 2002, average=100)
Source: Núria Bosch, University of Barcelona.
243
198
133
0
50
100
150
200
250
300
Madrid Mitjana estatal Catalunya
Graph 3
Liquidated State Public
Investment, 1991-2002 (euros per capita)
Source: Marta Espasa, University of Barcelona.
57
Bibliography
ALCAIDE, J. and ALCAIDE, P. (2004): Balance económico regional (autonomías y provincias). Años 1995 a 2003. Fundación de las Cajas de Ahorro, Madrid. BOSCH, N. and ESPASA, M. (1999): ¿Con qué criterios invierte el sector público central? En Desequilibrios territoriales en España y Europa. Ariel, Barcelona. CAIXA DE CATALUNYA (2004): La despesa per habitant en les CCAA, 1996-2003: convergència o divergència regional? Consum i Economia Familiar, 34, 40-42. CAIXA DE CATALUNYA (2004): Productivitat aparent del treball a Catalunya: comparació amb la resta de CC.AA., 1995-2002: Informe sobre la conjuntura econòmica, 96, 65-73. CASTELLS, A.; BARBERÁN, R.; BOSCH, N.; ESPASA, M; RODRIGO, F. y RUIZ-HUERTA, J. (2000): Las balanzas fiscales de las Comunidades Autónomas (1991-1996): Análisis de los fiscal flows de las Comunidades Autónomas con la Administración Central. Ariel i Fundació Carles Pi i Sunyer d’estudis autonòmics i locals, Barcelona. COSTA, J. y TREMOSA, R. (2003): Spanish regions and the macroeconomic benefits of the European Monetary Union (EMU). Regional Studies, 37, 217-226. DE LA FUENTE, A. (2001): “Un poco de aritmética territorial: Anatomía de una balanza fiscal para las regiones españolas”. FEDEA, Estudios sobre la Economía Española (EEE91), Madrid. DESMET, K. y ORTUÑO, I. (2001): “Rational underdevelopment”, Banco de España, Servicio de Estudios, Document de Treball número 0114. EUROSTAT (2004): news release, 21. http://www.europa.eu.int/comm/eurostat EUROSTAT (2000): news release, 18. http://www.europa.eu.int/comm/eurostat GENERALITAT DE CATALUNYA: La balança fiscal de Catalunya amb l’Admisnitració Central. Grup de treball per a l’actualització de la
58
balança fiscal de Catalunya. Part Catalana de la Comissió Mixta de Valoracions Administració de l’Estat-Generalitat de Catalunya. HERCE, J.A. y SOSVILLA-RIVERO, S. (1996): Efectos macroeconómicos del Marco de Apoyo Comunitario 1994-1999: Un análisis basado en el modelo JOUMARD, I. i KONGSRUD, M. (2003): Fiscal relations across governments levels. Working Paper, 375. Economics Departament OECD. LEONARD, H. y WALDER, J. (2000): The Federal Budget and the States, fiscal year 1999 (retrospective issue 1983-1999). Taubman Center for State and Local Government, John F. Kennedy School of Government, Harvard University (disponible web http://www.ksg.harvard.edu/taubmancenter). LÓPEZ-CASASNOVAS, G. (2003): La distribució de despesa pública per nivells d’administració. L’estat espanyol en el panorama internacional. Presentació a la 6a Jornada del Col·legi d’Economistes de Catalunya. LÓPEZ-CASASNOVAS, G. (2004): El Déficit Fiscal de una Comunidad Autónoma con la Administración Central: ¿de qué estamos hablando?. Papeles de Economía Española, 99, 182-197. LÓPEZ-CASASNOVAS, G. y MARTÍNEZ, E. (2000): La balança fiscal de Catalunya amb l’Administració central (1995-1998). Institut d’Estudis Autonòmics, Generalitat de Catalunya, Barcelona. PONS, J. y TREMOSA, R. (2005): “Macroeconomic effects of Catalan fiscal déficit with the Spanish State, 2002-2010”. Applied Economics, 37, 1455-1463, Routlegde, Taylor and Francis Group.. PONS, J. y TREMOSA, R. (2004): L’espoli fiscal: una asfíxia premeditada. 4ª edición. Editorial 3 i 4, València. POSCHMANN, F. (1998): Where the money goes: The distribution of taxes and benefits in Canada. Commentary 105. C.D. Howe Institute, Ottawa. REQUEJO, F. (2003): Federalisme plurinacional i Estat de les autonomies. Proa, Barcelona. ROCA, F. (2000): Cent anys d’estudis sobre el dèficit fiscal català. Revista Econòmica de Catalunya, 39, 98-108.
59
ROS, J., TREMOSA, R. y PONS, J. (2003): “Capital públic i dèficit fiscal: l’impacte sobre l’economia catalana”, Nota d’Economia, 75, 103-120. ROS, J.; TREMOSA, R. y PONS, J. (2002): El Sector Públic a Catalunya 1985-1998. Institut d’Estudis Autonòmics, Barcelona. TREMOSA, R. (2007): Catalunya serà logística o no serà. Editorial 3 i 4, València. TREMOSA, R. (2006): Estatut, aeroports i ports de peix al cove. Editorial 3 i 4, València. TREMOSA, R. (2005): Estatut, veritats contra mentides. Editorial 3 i 4, València. TREMOSA, R. (2005): “Solidaridad contra crecimiento”. La financiación de las comunidades autónomas, 263-285. Publicacions i Edicions de la UB. TREMOSA, R. (2004): L’intervencionisme liberal del PP: vers el canvi de locomotora. A L’Espanya d’Aznar. Dotze visions del projectes polític del PP, 95- 109. Editorial Proa, Barcelona. ZABALZA, A. (2007): “La financiación autonómica en el Estatuto de Cataluña”, Hacienda Pública Española, Instituto de Estudios Fiscales (Ministerio de Economía y Hacienda), 181, 119-161.