THE BIGHORN WILDLAND RECREATIONAL TRAIL MONITORING PROJECT€¦ · · 2015-09-04Red Deer River...
76
THE BIGHORN WILDLAND RECREATIONAL TRAIL MONITORING PROJECT AN INTERIM RESEARCH SUMMARY FROM 2004 – 2006
Transcript of THE BIGHORN WILDLAND RECREATIONAL TRAIL MONITORING PROJECT€¦ · · 2015-09-04Red Deer River...

THE BIGHORN WILDLAND
RECREATIONAL TRAIL MONITORING PROJECT
AN INTERIM RESEARCH SUMMARY FROM 2004 – 2006


Prepared by:
Alberta Wilderness Association
March 23, 2007
ALBERTA WILDERNESS ASSOCIATION Box 6398, Station D
Calgary, AB T2P 2E1 www.AlbertaWilderness.ca
Phone (403) 283-2025


2007-03-23
i
ACKNOWLEDGEMENTS
AWA is grateful for the support received from Wilburforce Foundation and the LaSalle Adams
Foundation, and from a number of private donors who make our work in the Eastern Slopes
possible. The Suncor Energy Foundation, Shell Canada, Alberta Ecotrust, Alberta Conservation
Association, and Mountain Equipment Coop have contributed to this specific research project.
Without the professional staff, volunteers, and members of AWA, our work would not continue.
So many individuals have been instrumental in many different aspects of this project.
AWA Staff Adam Ford
Tamaini Snaith Lara Smandych
Laurie Wein David Samson Sean Nichols Shirley Bray
Christyann Olson
AWA Board Members Heinz Unger Ian Urquhart Vivian Pharis
AWA Volunteers Rod Burns
Cheryl Smyth Steve Swettenham
Dana Pearson Dave Argument
Darren Bezushko Arin MacFarland Sarada Eastham Richard Irwin
Rod Keller

2007-03-23
ii

2007-03-23
iii
EXECUTIVE SUMMARY Since the 1970s, when the Bighorn Backcountry was identified as a provincially significant
wilderness area, management priorities have focused on watershed protection, wildlife habitat
conservation, and dispersed non-motorized recreation activities. AWA has actively supported
these priorities and, for more than 30 years, has sought protected area designation for the
Bighorn area (Bighorn Wildland). In 2002, through the Bighorn Backcountry Access
Management Plan, the Alberta Ministry of Sustainable Resource Development (SRD) formally
permitted motorized recreation in areas where these activities were formerly illegal and where
they may cause long-term deleterious impacts on water quality, vegetation, historical trails, and
wildlife. It is our opinion that these activities may also exclude many non-motorized
recreationists from using the same trails as motorized users.
AWA monitored the impacts of recreational use in the Bighorn Backcountry from 2004
through 2006. Our goal was to assess the efficacy of management in the area with respect to the
objectives of Forest Land Use Zone (FLUZ) planning, which includes the protection of areas
“containing sensitive resources such as fish and wildlife and their habitats, vegetation, soils and
watershed” (SRD 2002b: 10). We evaluated three main criteria that will provide an indication of
management efficacy in the FLUZ: 1) willingness of backcountry users to abide by FLUZ
regulations, 2) extent of landscape damage present, and 3) trends in motorized vehicle activity.
Our study focused on a 76-km network of motorized and non-motorized trails in the Upper
Clearwater-Ram FLUZ.

2007-03-23
iv
1) Willingness of backcountry users to abide by FLUZ regulations
The total number of illegal passes by motorized vehicles during non-designated periods
increased from 0.37 Passes Per Day (PPD) in 2004 to 0.63 PPD in 2006. The proportion of
illegal passes relative to the total number of passes recorded increased by 7% from 2004 to 2006.
2) Extent of damage present
The amount of area damaged along all trails is approximately 20% of the total length of all trails.
These damaged areas include 244 instances of trail braiding or widening. Trail damage was most
common along trail sections farthest from the Hummingbird Provincial Recreation Area. The
number of Erosion Events (EEs), a measure of trail degradation used by SRD, was as high as
5.58 per kilometre on some trails. The number of EEs associated with OHV use was
proportionally higher than the number of EEs associated with equestrian use on six of seven
trails. The combined footprint from random backcountry campsites in the study area was 50,574
m2. This area is roughly equivalent to 32 NHL ice surfaces. Garbage was found and removed
from 54% of campsites. We found more than one non-designated trail junction for every
kilometre of designated trail in the trail network. We documented 89 trail water crossings
throughout the network. Only 7% of these water crossings had formal crossing structures
present, and 72% of the 89 water crossings went through a permanent water body.
3) Trends in motorized vehicle activity
Sixty-eight percent more motorized traffic was recorded in 2006 than in 2004. On four trails with
summer traffic counts, we found a 39% to 227% increase in vehicle passes over three years.
Winter traffic counts increased on two trails by 46% and 163% respectively, and declined on

2007-03-23
v
another trail by 95% over two winter seasons.
These three lines of evidence strongly suggest that current management in the Bighorn
Backcountry will not protect the environment from degradation caused by recreational impacts:
1) neither regulated use nor voluntary compliance is reducing the amount of illegal use, 2)
current levels of recreational activity are causing severe environmental degradation, and 3) there
is an increasing trend in user density. AWA is advocating for changes to current access
management policies and FLUZ regulations in the Bighorn Backcountry that will improve
SRD’s ability to meet the environmental objectives of the FLUZ. It is the opinion of AWA that
protection of watershed, native vegetation, and wildlife habitat must take management
precedence over all other uses of this sensitive foothills and alpine area, as was recognized by the
1977 Eastern Slopes Policy (Government of Alberta 1984) and reiterated in the 1986 Nordegg-
Red Deer River Sub-regional Integrated Resource Plan (Alberta Forestry 1986).

2007-03-23
vi

2007-03-23
vii
TABLE OF CONTENTS
Introduction..................................................................................................................................... 1
Methods........................................................................................................................................... 4
Data Collection ........................................................................................................................... 6
Trend in illegal activity ............................................................................................................... 6
Extent, intensity, and distribution of trail degradation .............................................................. 9
Overall trend in traffic volume ................................................................................................. 12
Error handling in traffic counts ................................................................................................ 13
Results........................................................................................................................................... 14
Trend in illegal activity ............................................................................................................. 14
Extent, intensity, and distribution of trail degradation ............................................................ 16
Overall trend in traffic volume ................................................................................................. 22
Discussion..................................................................................................................................... 23
Trend in illegal activity ............................................................................................................. 23
Extent, intensity, and distribution of trail degradation ............................................................ 24
Overall trend in traffic volume ................................................................................................. 28
Recommendations and Future Research Objectives..................................................................... 30
Conclusion .................................................................................................................................... 35
References..................................................................................................................................... 36

2007-03-23
viii
LIST OF FIGURES Figure 1. General location of study area ........................................................................................ 5
Figure 2. Location of trails monitored during this study ............................................................... 7
Figure 3. Measuring the depth of an Erosion Event along RNG ................................................. 11
Figure 4. Percentage of illegal passes per day per year out of the total number of passes.
Data from designated trails only ................................................................................................... 15
Figure 5. Erosion Event distribution within the trail network; view looking southeast from
above the North Ram River headwaters ....................................................................................... 18
Figure 6. Non-designated trail distribution within the trail network; view looking southeast
from above the North Ram River headwaters............................................................................... 20
Figure 7. A water crossing on BTN ............................................................................................. 21
Figure 8. SRD has placed beside the trail a sign that states no motorized vehicles are
permitted ....................................................................................................................................... 25
Figure 9. Trail degradation due to a combination of poor water drainage and excessive
motorized traffic............................................................................................................................ 26
Figure 10. Trail network showing disturbance area to elk (Cervus elaphus) .............................. 29

2007-03-23
ix
LIST OF TABLES
Table 1. Proportion of illegal passes recorded out of the total number of passes recorded for
designated trails ............................................................................................................................ 15
Table 2. Damage site summary by trail........................................................................................ 17 Table 3. Erosion Event summary by trail and user group association ......................................... 19 Table 4. Other recreational impacts, summarized by trail ........................................................... 19 Table 5. Non-designated trail use by user group association....................................................... 21 Table 6. Summer traffic trend on designated trails, 2004-2006.……...………........................... 22 Table 7. Winter traffic trend on designated trails, 2004-2006 ..................................................... 23
2007-03-23
x
LIST OF APPENDICES Appendix A. Reporting periods for traffic counters, 2004-2006................................................. 41
Appendix B. Photo documentation of selected recreational impacts in the Bighorn
Backcountry .................................................................................................................................. 43
Appendix C. History of the Alberta Wilderness Association’s interest in the Bighorn
Backcountry .................................................................................................................................. 47
Appendix D. Annotated bibliography on the impacts of motorized recreation on various
environmental features.................................................................................................................. 53
Appendix E. Project summary: Bighorn Wildland Recreational Impact Monitoring Study ....... 55
Appendix F. Inconsistencies in official statements with respect to access management in the
Bighorn Wildland ......................................................................................................................... 57

2007-03-23
1
INTRODUCTION Recreational trail use is growing in Alberta as more people become engaged in backcountry
activities and as unregulated access to wilderness areas increases with new infrastructure
development (Canada West Foundation 2006). Alberta’s backcountry users include naturalists,
hunters and anglers, hikers, cross country skiers, mountain bikers, trappers, ranchers, rock
climbers, rafters, commercial outfitters, and equestrian, off-highway vehicle (OHV) and
snowmobile riders. These backcountry users come from a variety of communities with equally
varying values and opinions about wilderness protection and management. These myriad views
can lead to severe challenges for consensus-based land-use management under the Alberta
government’s “multi-use” paradigm (Canada West Foundation 2006). The Alberta Ministry of
Sustainable Resource Development (SRD) is responsible for meeting the often competing
demands for new recreational opportunities from these user groups. SRD must also address
human impacts on water quality, forest maintenance and regeneration, wildlife habitat, and other
backcountry services. Given the severity of cutbacks to government departments through the
1990s, it is not surprising that government agencies responsible for overseeing recreation access
are ill-equipped to plan, manage, and enforce recreational activities in backcountry areas.
This report is intended to provide complementary data and analysis for government
agencies responsible for access management decisions in the Bighorn Backcountry1 area, which
lies approximately 90 km southwest of Rocky Mountain House. The public and the government
have long recognized the Bighorn Backcountry as a provincially significant water catchment area
and wildlife habitat supply falling under the Prime Protection Zone of both the Eastern Slopes
1AWA prefers the use of the term Bighorn Wildland. Refer to Appendix C for information on the history of the area and related name changes to the region.

2007-03-23
2
Policy (Government of Alberta 1977, revised 1984) and the Nordegg-Red Deer River Sub-
regional Integrated Resource Plan (IRP) (Alberta Forestry 1986). These policies met water and
wildlife habitat objectives by, among other means, limiting motorized access and industrial
development in the Prime Protection Zone. In 2002 the Bighorn Backcountry was placed under
new access management regulations through the designation of six Forest Land Use Zones
(FLUZ). The FLUZ regulations enabled the government to legally designate recreational trails
for specific uses and seasons. The government also publicized access to the Bighorn area with a
map, brochure, and website (SRD 2006a) and officially permitted motorized (mixed-use) trails in
some areas through the Bighorn Backcountry Access Management Plan (AMP) (SRD 2002a).
The overall effect of these actions may have led to adverse recreational impacts in an area
previously considered by the government and the public as provincially significant for wildlife,
water, and non-motorized recreational opportunities.
In recognition of the sensitivity of the Bighorn Backcountry to potential impacts
associated with recreation, SRD’s Land and Forest Division (LFD) created a trail impact
monitoring program (SRD 2003) based on the recommendations of the Bighorn Advisory Group
(SRD 2002b), a multi-stakeholder group designed to provide access management advice to SRD.
Through this monitoring program, LFD aims to manage the Bighorn Backcountry “to ensure the
protection of the environment, while allowing responsible and sustainable recreational use”
(SRD 2006b). Similarly, the Alberta Wilderness Association (AWA) felt that adverse
environmental impacts to the Bighorn Backcountry may occur following the changes made to
access regulations in 2002. In this way, SRD (2003), the Bighorn Advisory Group (SRD 2002b),
and AWA recognize that access management regulations can be improved through monitoring
studies that address changes to environmental conditions as a result of recreational activity.

2007-03-23
3
The purpose of this study is to evaluate key indicators of management success in the
Bighorn Backcountry five years after the implementation of the Access Management Plan. Five
years is adequate time to gather data on trends, and it coincides with LFD’s scheduled reporting
of the government’s own recreational monitoring project (SRD 2003), due out in 2007. We felt
that SRD’s ability to ensure that the Bighorn Backcountry’s environment is protected (sensu
SRD 2006b) may be jeopardized by 1) an inadequate effort to ensure user compliance with
FLUZ regulations; 2) inadequate trail location, construction, and maintenance with respect to
local terrain conditions and acceptable intensities and types of permitted recreation activity; and
3) targeted publicity of the area to particular user groups and facility upgrading at Hummingbird
Forest Recreation Area.
First, we predicted that if efforts to ensure user compliance with FLUZ regulations are
inadequate, then illegal traffic (both during the off-season and on undesignated trails) will
increase relative to the total amount of traffic present. At the same time, we may expect a short-
term increase in illegal activity because of an overall trend in increasing trail use and a lag-time
in the adoption or awareness of new regulations. Second, we predicted that if trails are poorly
located, constructed, or maintained, 1) there will be high amounts of trail degradation throughout
the area, 2) sections of individual trails will have higher amounts of degradation than other
sections, and 3) there will be unequal attribution of trail damage among user groups since trails
are not designed for their particular uses. Third, we predicted that the manner in which access to
this area has been publicized will lead to an overall increase in off-highway vehicle traffic during
the study period.
At this point we wish to clarify that this study was not intended to single out any
particular user group that recreates in the Bighorn Backcountry. Due to resource constraints,

2007-03-23
4
AWA has limited access to technological and logistical opportunities for data gathering, and this
is reflected in our reporting. For example, our traffic counters can not reliably detect passes by
equestrian users, thereby excluding some information from an important recreational user group
in the study area. Nonetheless, as the goal of this study is to highlight the importance of the
Bighorn Backcountry as a wilderness resource and the potential ease with which environmental
conditions in this area can degrade due to inappropriate recreational use, we feel justified in
recommending the best possible management solutions for the area. In this way, both motorized
and non-motorized access issues are addressed in this report in so much as these activities are
each contributing to environmental degradation.
METHODS Study area
This study took place in the Ram-Clearwater FLUZ within the Bighorn Backcountry, which is
located approximately 90 km southwest of Rocky Mountain House (Figure 1). The Bighorn
Backcountry is adjacent to Banff and Jasper National Parks and consists of approximately 5,000
km2 of public lands. Within the Bighorn Backcountry, the Ram-Clearwater FLUZ is the largest
of the six FLUZs, with an area of approximately 2,000 km2. The Upper Clearwater/Ram FLUZ
consists of Alpine and Subalpine subregions of the Rocky Mountain Natural Region. Most of the
trails we focused on occur within the Subalpine, an area characterized by forests of lodgepole
pine (Pinus contorta), Engelmann spruce (Picea engelmannii), and subalpine fir (Abies
lasiocarpa); high elevation meadows comprising hairy wild rye (Elymus villosus), June grass
(Koeleria cristata), and bearberry (Arctostaphylos uva-ursi); wetlands; and shrub areas. Large
carnivores (e.g., bears, wolves, cougars), ungulates (e.g., deer, elk, and bighorn sheep),

2007-03-23
5
songbirds, and cutthroat and bull trout are also prevalent here. Since the 1970s, there has been no
industrial activity in the Upper Clearwater/Ram FLUZ, in contrast to adjacent lands on the
Bighorn’s eastern boundary.
Figure 1. General location of study area. The specific study area is indicated by the cross-
hatched square near the centre of the figure (see Figure 2). Legal land survey coordinates are
shown along the right and top margins of the map.

2007-03-23
6
Data Collection
We chose to focus this study on designated trails that provide year-round access to recreation in a
relatively pristine landscape within the Upper Clearwater/Ram FLUZ. The trails are identified on
the FLUZ map published by SRD (2006b; revised from 2003). We divided the trail network into
seven research sections based on SRD’s naming scheme, and where designated trails were not
named, we added complementary names to specific stretches (Figure 2). Four of these seven
trails are former resource exploration roads dating to before 1970; these include the Onion Lake
Trail (ONC), Hummingbird Creek Trail (HUM), Canary Creek Trail (CAN), and Ranger
Creek/South Ram River Trail (RNG). The three trails unnamed by LFD include Back Trail North
(BTN), Back Trail South (BTS) and Back Trail Ranger (BTR). These three sections appear to be
former equestrian trails that are now designated for motorized access and, for the most part, are
more remote and less developed than ONI, HUM, CAN, and RNG. For classification purposes,
we combined the lower portion of the Ranger Creek Trail with the South Ram River Trail to its
junction with BTR (Figure 2). This classification allowed us to efficiently survey the trail
network as well as incorporate a variety of trail regulations, such as temporal restrictions and
equestrian versus OHV, into the study.
Trend in illegal activity
To address our first prediction relating to trends in motorized vehicle use in non-designated times
or places, we recorded motorized vehicle traffic, year-round, using traffic counters (supplied by
TRAFx Research Ltd., Canmore, AB). These counters sense disturbances to the electromagnetic
field caused by a large passing metal object and record the direction of travel and frequency of
passes of motorized vehicles within a 2-m range. Passes by equestrian and other non-motorized

2007-03-23
7
users, including mountain bikes, are not detected by these counters. We placed each traffic
counter near a trail and about 20 cm below ground surface to enable detection of passing vehicles
and to minimize disturbance of the device by animals and people. Before burial, the recording
devices were placed inside waterproof containers. Each container was then placed inside two
plastic freezer-proof food storage bags and sealed.
Figure 2. Location of trails monitored during this study.
The data recorded by these units were uploaded in the field – typically in late June/early July and
again in late summer/early fall – to a handheld pocket PC unit (Dell Axim X5, Dell Inc., North

2007-03-23
8
York, ON) and later uploaded to a PC for analysis. After uploading data to the handheld device,
traffic counter batteries were changed and the devices were reburied in their original locations.
Eight traffic counters were used in this study, although one was later found to be
defective; we are therefore only reporting the results of seven. One traffic counter was placed on
each of ONC, HUM, CAN, BTN, and RNG near the most likely access point of the trail (see
Figure 2). Two traffic counters were placed on non-designated trails near Onion Lake to capture
potential illegal use of non-designated trails in those areas. The vehicle counters were in place
from 2004 to 2006 and were not moved during the course of this study, with the exception of
Counter #1. Counter #1 was moved to the opposite side of the trail in 2005, as it failed to register
passes in July/August 2005 due to the construction of a partial barrier to motorized traffic that
diverted vehicles beyond the 2-m detection range of the counter (D. Samson, pers. comm.).
We used regulations published in SRD (2006a), with corresponding seasonal access
changes made in 2005 to indicate when a trail section was open or closed. We then assessed the
number of vehicle passes that fell inside and outside the regulated period.2 All trails except RNG
are designated for OHV access from July 1 to March 15 (2005-2006) or July 1 to April 30
(2004). OHV access is permitted on RNG from December 1 to March 15 (2005-2006) or
December 1 to April 30 (2004). Snowmobile access is permitted on all trails, expect RNG, from
July 1 to April 30. Snowmobile access is permitted on RNG from December 1 to April 30.
We divided the number of passes recorded during closed periods by the total number of
passes recorded for each traffic counter within each year (2004-2006). We excluded days when
the traffic counters were not functioning due to battery failure. For the two traffic counters
2We recognize that backcountry patrols by the LFD officials, as well as trappers, may be included within these counts.

2007-03-23
9
monitoring permanently closed trails, we included information on the total number of passes
counted, since all passes by motorized vehicles along these trails are considered illegal.
Extent, intensity, and distribution of trail degradation
In order to determine if our second prediction was correct – that trail degradation throughout the
system is common, severe, and associated with certain vulnerable sites and with specific user
groups – we surveyed the trail network for four types of recreational activity impact: 1) damage
sites, 2) water crossings, 3) campsites, and 4) non-designated trails. Damage sites were defined
as part of a designated trail where the rutted depth exceeds 0.05 m and where vegetation damage
exceeds a width of 3 m. We chose this depth as it signifies enough soil loss or compaction to
affect plant regeneration (Godefroid et al. 2003). The 3-m width we chose is similar to trail
design guidelines in British Columbia (2.2 m; BCMoF 2000), Newfoundland (4 m; ECGNL
2004); and Ontario (2.5 m; CDCSSMA 2003), and it is also reflected in SRD’s definition of a
designated trail (3 m; SRD 2002a). Note, however, that SRD guidelines for monitoring trail
damage (SRD 2003) are inconsistent with these measures.3 On hardened sections of some trails
(i.e., ONC, CAN, HUM, RNG), we were less strict in these definitions to account for the
presence of historical roads, which in many cases were already more than 3 m wide. In these
3The Access Management Plan (SRD 2002b:10) defines a designated trail as “that part of the route to a width of three metres (9.8 feet) or less as approved by a Forest Officer, and a parking zone of 10 metres or less on either side of the trail.” This equates to 23 m in width for a designated trail. In the Recreation Trail Monitoring Guidelines, trails are considered 10 m wide: e.g., “any tracks or obvious evidence of use beyond the 10 m wide established trail will be considered a trespass” (SRD 2003:3) and “the cross-sectional area is measured by placing a rope or rigid bar across the trail (all 10 meters)” (SRD 2003:2). It is unclear if SRD considers a designated trail 23 m or 10 m wide; however, neither of these widths is considered acceptable for a backcountry recreation area by AWA and several North American jurisdictions.

2007-03-23
10
cases, damage was assessed as obvious vegetation trampling or trail widening beyond the main
“road”.
Once a damage site was identified, we 1) geo-referenced the site with a handheld GPS
unit (10 m± accuracy; Garmin or Magellan), 2) photographed the area, 3) measured the depth of
the rut at the deepest point with a tape measure, 4) measured the width of the site at its widest
point with a tape measure, and 5) pace-counted the length of the damaged site. When measuring
the depth of ruts, we noted when a site was deeper than 25 cm for a distance of 3 m, which
qualifies the site as an Erosion Event (EE) (Figure 3). The EE designation is based on LFD
standards for trail integrity and, under current objectives, the number of EEs per kilometre of
trail is expected to stay the same or decrease over time (SRD 2003). We also classified each
damage site and EE by the type of tracks present: motorized, equestrian, or mixed. Motorized
vehicle tracks are characterized by two parallel ruts formed by the wheels, approximately 1.0 to
1.6 m wide, with tire tread marks showing in moist soil conditions. Equestrian tracks are
characterized by a single track, roughly 45 cm wide, with crescent-shaped marks from
horseshoes present in moist soil conditions. Mixed tracks are characterized by the presence of
both motorized and equestrian tracks. We also looked for evidence of hikers, mountain bikers,
and horse-drawn wagon tracks at all sites. Interpretation of user group association at a site by the
presence of tracks is most indicative of recent use rather than total use of that trail. We are most
likely underestimating the amount of equestrian use on mixed-used trails since OHV tracks can
easily mask horse tracks. This underestimation is perhaps increased because horses may avoid
hard-surfaced trails (and wet crossings) and take an alternate route.
Water crossings were defined as areas along designated trails where at least one of the
following features was found: a physical crossing structure (e.g., a bridge or ford), water in a

2007-03-23
11
visibly permanent stream bed, water running on the trail, or an impermanent stream bed (e.g.,
ephemeral stream). At each water crossing, we photo-documented the site and geo-referenced the
coordinates with a handheld GPS unit.
Figure 3. Measuring the depth of an Erosion Event along RNG.
Campsites were defined as areas where overnight camping activities likely occurred and
where at least one of the following was found: one or more fire pits, tree-cutting, camping
furniture (e.g., tables, chairs, storage, latrines), tielines or corrals for horses. We photographed,
geo-referenced, collected garbage if present, and pace-measured the length and width of each
site.

2007-03-23
12
Non-designated trails were defined as spur lines from the main trail with evidence of
recent activity by hikers, bikers, equestrians, or OHVs that extend beyond 10 m from the
junction of the main trail. We assigned recreational activity association based on track evidence
(see above) for the first 10 m of each non-designated trail, as measured from the junction of the
non-designated trail and the designated trail. We chose 10 m as the minimum length of a spur
trail because this length exceeds the area regulated by the “parking zone” (SRD 2003) used by
the LFD monitoring program. Furthermore, this classification allows us to quantitatively
differentiate between a trail braiding or widening (i.e., a damage site) and a non-designated trail.
At each junction of the main trail and the non-designated trail, we photographed and geo-
referenced the site using handheld GPS units.
We summarized the total number of damage sites, water crossings, random campsites,
and non-designated trails for each trail. Using GIS (ArcGIS 9.2, Environment Systems Research
Incorporated, Redlands, CA), we divided each of the seven trails into unit lengths of 500 m and
summed the total number of EEs within each section. This information was then mapped to
provide a qualitative assessment for the location of environmental degradation throughout the
trail network. We then repeated the mapping analysis but showed the distribution of non-
designated trail junctions within each 500 m section.
Overall trend in traffic volume
For our third prediction, that the overall amount of traffic in the area is increasing, we analyzed
data from the digital traffic counters placed on designated trails. We compared the number of
passes at each counter during a replicable window over a two- or three-year period, depending on
the availability of data. One window was established for summer use (approximately July 1 to

2007-03-23
13
September 30) and one for winter use (December 1 to January 31). We used replicable recording
windows specific to each traffic counter, rather than complete years, because of different
operating periods among individual devices (see Appendix A).
Error handling in traffic counts
The TRAFx traffic counters did have some errors in data recording that may have either
underestimated or exaggerated the actual number of vehicle passes. The traffic counters may
have underestimated the actual number of vehicle passes if they missed vehicles passing beyond
the 2-m detection range or because two or more vehicles were driving close together and were
counted as a single pass. Traffic counters were known to be non-functioning during certain
periods due to battery failure, thus missing some recordings. Each period where the traffic
counters did not report data are shown in Appendix A. All analyses relating to temporal trends in
traffic volume are adjusted by the number of reporting days for each individual traffic counter.
The traffic counter may have exaggerated the actual number of vehicles due to recording
errors. To find and address these errors, we executed the following protocol once data were
uploaded to the PC. First, we removed counts that appeared to be repeated: that is, if there was a
second (or more) pass at the exact same recorded time and date, then the additional pass(es) were
deleted. Second, we removed counts associated with counters being unearthed for reviewing.
Lastly, we removed extra counts that may have been associated with a slow-moving vehicle.
Slow-moving vehicles can trigger extra counts at exactly two-second intervals but will record
these passes as if they were moving from opposite directions. The traffic counter is equipped
with a two-second buffer, meaning that no additional passes will be recorded within two seconds
of one another. By excluding these counts, we reduce the likelihood that a slow-moving vehicle
2007-03-23
14
will trigger more than one count for a single slow-moving vehicle, but we also exclude those
situations where two vehicles may have passed one another at the traffic counter within a two-
second interval. Overall, traffic counts reported in this study are conservative estimates of the
actual number of vehicle passes.
RESULTS
Trend in illegal activity
We found that the total number of passes by motorized vehicles during non-designated periods
increased from 0.37 Passes Per Day (PPD) in 2004 to 0.63 PPD in 2006. The total number of
passes made during non-designated periods also increased by 7% relative to the total amount of
traffic recorded in the trail network (Figure 5). All trails showed increases in the proportion of
motorized traffic during non-designated periods except for RNG, where use decreased during
this period (Table 1). We found that the number of illegal passes made on two non-designated
trails peaked in 2005 and was lower in 2006 than in 2004. These two trails represent 2% of the
non-designated trails encountered during this survey.

2007-03-23
15
0%
5%
10%
15%
20%
25%
2004 2005 2006
Year
Figure 4. Percentage of illegal Passes Per Day per year out of the total number of passes. Data
from designated trails only.
Table 1. Ratio of illegal passes to the total number of passes recorded for designated trails.
Trail 2004 2005 2006
ONC 0.04 0.19 0.18
CAN 0.05 0.17 0.37
RNG 1.00 0.66 0.33
BTN 0.00 0.11 0.14
HUM n/a n/a 2.03
TOTAL 0.13* 0.19* 0.20*
*Total excludes values from HUM due to limited overlapping data collection window.
Prop
ortio
n of
ille
gal p
asse
s to
tota
l pas
ses

2007-03-23
16
Extent, intensity, and distribution of trail degradation
We surveyed over 76 km of designated trails and found 453 features of concern. These features
were not distributed equally among trails (Tables 2, 3 and 4) or sections of trails (Figure 5). The
sum length of damaged trail sections varied from 7% of the BTN to 64% of the BTR, for an
overall length of 20% of the 76-km trail network. The number of Erosion Events (EEs) was
highest on BTR (5.58 EE/km) followed by BTS (3.13 EE/km), while CAN (0.93 EE/km) and
HUM (0.91 EE/km) had the lowest density of EEs. Overall, we found roughly one EE for every
600 m of trail in the network. The number of EEs associated with OHV tracks was
proportionally higher than the number of EEs associated with equestrian tracks on every trail
except for RNG. On RNG, equestrian tracks were associated with 86% of the EEs (see Figure 3).
The maximum width of damage sites on all trails was an average of 8.87 m (n=223), with the
two widest damage sites on ONI (50 m) and RNG (50 m). The mean maximum depth was
greatest on BTR (0.45 m) and BTN (0.44 m) and the deepest site we found was 1.6 m on BTR.
More than one non-designated trail junction was found for every kilometre of designated
trail in the trail network, and most of these occurred along RNG and were associated with
equestrian trail use (Figure 6). Non-designated trails found along BTN, BTR, BTS, and ONC
were most often associated with OHV use (Table 5).
The density of campsites was similar among trails, with one site for every 2 km of trail
throughout the study area (Table 4). Campsites ranged in size from 25 m2 to 12,000 m2 (both on
RNG), for a combined footprint from all campsites of 50,574 m2 in the study area. For a familiar
comparison, this area is roughly equivalent to 32 NHL ice surfaces. Additionally, we found
garbage left behind at 54% of campsites, with the majority of these sites occurring along RNG.

2007-03-23
17
Table 2. Damage site summary by trail.
Trail Length (km)
Damage sites per km
Total length of damage sites (m)
Percent of trail damaged
BTN 11.04 1.54 826 7
BTR 3.77 8.50 2,421 64
BTS 5.12 4.69 1,188 23
CAN 9.68 2.17 2,983 31
HUM 13.15 1.06 1,684 13
ONC 15.34 3.78 5,882 38
RNG 18.10 3.43 6,565 36
We documented 89 water crossings throughout the network with the highest water
crossing densities along CAN, HUM, and BTS (Table 4). Of these 89 water crossings, 7% had
formal crossing structures present while 72% had permanent water moving through them. Of the
six crossing structures we found, two were on ONI and two were on BTN. In many cases vehicle
tracks were found adjacent to crossing structures indicating that some riders are avoiding their
use (Figure 7).

2007-03-23
18
Figure 5. Erosion Event (EE) distribution within the trail network, view looking southeast from
above the North Ram River headwaters. Height and colour of 500-m trail sections is related to
the number of EEs within each section: 0 EEs=green; 1 EE=yellow; 2 EEs=orange; 3 EEs=dark
orange; 4-6 EEs=red. Scale is variable on this projection, but the length of individual trail
sections is 500 m. See Figure 2 for names of individual trails.
Onion Lake
Hummingbird F.R.A.
500 m
North

2007-03-23
19
Table 3. Erosion Event summary by trail and user group association.
Trail Length (km)
EE per km
% of damage sites with an
EE Motorized
EE Equestrian
EE Multi-user
EE
BTN 11.04 1.18 76% 13 1 1
BTR 3.77 5.58 66% 20 4 3
BTS 5.12 3.13 67% 11 7 2
CAN 9.68 0.93 43% 7 4 2
HUM 13.15 0.91 86% 11 0 0
ONC 15.34 1.24 33% 19 0 0
RNG 18.10 1.93 56% 3 35 3
Table 4. Other recreational impacts, summarized by trail.
Trail Length (km)
Random campsites per km
Non-designated trails per km
Water crossings per km
BTN 11.04 0.45 1.18 1.09
BTR 3.77 0.00 2.12 0.53
BTS 5.12 0.59 0.59 1.17
CAN 9.68 0.62 0.52 2.58
HUM 13.15 0.23 1.14 1.75
ONC 15.34 0.72 0.65 0.59
RNG 18.10 0.55 2.38 0.72

2007-03-23
20
Figure 6. Non-designated trail distribution within the trail network; view looking southeast from
above the North Ram River headwaters. Height and colour of 500-m trail sections is related to
the number of non-designated trail junctions within each section: 0=green; 1=yellow; 2=orange;
3-5=dark orange; 6-9=red. The length of individual trail sections is 500 m, but the scale is
variable on this projection. See Figure 2 for names of individual trails.
Onion Lake
Hummingbird F.R.A.
North

2007-03-23
21
Table 5. Non-designated trail use by user group association.
Trail Motorized* Equestrian* Mixed–use* BTN 10 3 0 BTR 3 3 1 BTS 2 1 0 CAN 1 3 1 HUM 5 9 1 ONC 3 0 7 RNG 0 34 4
*Refer to text for explanation of how impacts were assigned to each activity.
Figure 7. A water crossing on BTN. The bridge was placed on the main trail, but users continue
to drive OHVs through the creek on the left side of the photo.

2007-03-23
22
Overall trend in traffic volume
We found a 68% increase in the overall number of vehicle passes on designated trails during the
summer period from 2004 to 2006, with the most dramatic increases at HUM and ONC (Table
6). RNG was excluded from this table because motorized recreation is not permitted on this trail
during the summer.4 Summer motorized activity along CAN was highest in 2005, and higher in
2006 than 2004, suggesting an overall increase in traffic volume. We found an increase in the
number of vehicle passes (Table 7) for two (ONC, CAN) of three traffic recorders operating
during the winter recording window (December 1 to January 30). Motorized traffic along BTN
appears to have been sporadic in the winter of 2005-2006.
Table 6. Summer traffic trend on designated trails, 2004-2006.
Total number of vehicle counts
Traffic recorder Trail Trend
3-year change 2004 2005 2006 Dates
1 ONC INCR 137% 382 n/a 906 Jul 1- Sep 30
4 CAN INCR 39% 236 379 327 Jul 1- Sep 10
7 BTN INCR 81% 210 343 381 Jul 1- Sep 11
8 HUM INCR 227%* 134 438 n/a Jul 11- Aug 30
*Trend reported for 2004-2005 only, due to traffic recorder malfunction in 2006.
4Incidentally, we found a declining trend in (illegal) motorized traffic volume during the summer months on RNG, coinciding with results presented in Figure 4.

2007-03-23
23
Table 7. Winter traffic trend on designated trails, 2004-2006.
Total number of vehicle counts
Traffic recorder Trail Trend
2-year change 2004-2005 2005-2006 Dates
1 ONC INCR 46% 24 35 Dec 1-Jan 30
4 CAN INCR 163% 8 21 Dec 1-Jan 30
7 BTN DECR 95% 38 2 Dec 1-Jan 30
8 HUM n/a n/a n/a n/a n/a
DISCUSSION
The wilderness environment in the Bighorn Backcountry is being negatively affected by
recreational activities. We found that the amount of illegal activity is increasing, that trail
damage is severe and common, and that the overall use of the area is growing. We will first
discuss the implications of our main findings and then present management recommendations for
addressing these issues. We evaluate our findings based on the first of three objectives of the
AMP, which states that the intention of the FLUZ is to “protect areas containing sensitive
resources such as fish and wildlife and their habitats, vegetation, soils and watershed” (SRD
2002a:10).
Trend in illegal activity
We found an overall increase in the amount of OHV traffic during non-designated periods,
suggesting that 1) enforcement efforts during the closed period are inadequate, and/or 2) a

2007-03-23
24
growing number of OHV users are unwilling to abide by FLUZ regulations. Our results do not
support commonly used statements like “5% of the rowdy users ruin it for the 95% of the
compliant users” (SRD 2006c). Instead, we found that approximately 20% of motorized users are
violating FLUZ regulations, and this number is growing annually. An exception to the increase
in out-of-season trail use was found on RNG, where motorized traffic is decreasing.
We found that the number of illegal passes made on two non-designated trails decreased
over the course of the study; however, these two trails represent 5% of the non-designated trails
we found that had evidence of use by motorized vehicles. If traffic trends on these two trails are
indicative of network-wide use patterns, then there may be an increasing willingness among
OHV riders to abide by, or become aware of, some FLUZ regulations. At the same time, further
research is warranted to determine the extent of non-designated trail use, as our sample size is
limited in this regard. Anecdotal evidence documented during this study suggests that signs or
barriers placed at the junction of non-designated and designated trails can reduce the frequency
of illegal use (Figure 9).
Extent, intensity, and distribution of trail degradation
We found extensive damage (≈20% of all trails) and intensive erosion (1 EE for every 600 m of
trail) throughout the trail network. There were particularly high levels of damage on BTS and
BTR (Figure 10). In most cases, this damage was associated with OHV use, except on RNG,
where 93% of the 41 EEs was associated with equestrian use. Both equestrian and motorized
users appear capable of causing similar levels of trail damage in the area; however, we do not
have data on the relationship between equestrian-user density and associated levels of trail
damage. Anecdotal evidence suggests that the hardened conditions of the eastern portion of the

2007-03-23
25
ONI trail are at least partly responsible for the relative absence of OHV- and equestrian-related
damage here. The relatively flat slope along some sections of ONI, CAN, and HUM may also
contribute to the durability of these sites to trail activities (Coleman 1981).
Figure 8. SRD has placed a sign beside the trail stating that no motorized vehicles are permitted.
Illegal activity persists but is declining at this site. The sign states: “Forest Land Use Zone. No
motorized vehicles permitted.”

2007-03-23
26
Figure 9. Trail degradation due to a combination of poor water drainage and excessive
motorized traffic. Pooling water in one section of the trail leads to trail braiding and exacerbates
vegetation loss and soil erosion.
We found that trail widths in damaged areas (i.e., mean=8.87 m) vastly exceed the width
required for two passing OHVs or horses. SRD (2002a) defines an OHV as having a wheel-base
of 1.86 m or less. A trail designed for vehicles with this width would have a theoretical
maximum width of 5.6 m for two-way traffic, which includes a 1.86-m safety buffer between
oncoming traffic. In other jurisdictions, trail widths are even less than this 5.6-m theoretical
maximum. For instance, the standard width used for two-way OHV trails is 2.2 m in British
Columbia (BCMoF 2001), 2.5 m in Ontario (CDCSSMA 2003), 2.4 m in Wisconsin (WDNR
2005), 3 m in Nebraska (NGPC 2006), 2.1 m in Iowa (IDoT 2000), and 2.4 m for the United
States Forest Service (USFS 2005). Similarly, equestrian trails are generally 0.5 m wide and
possibly 3 to 4 m wide in some places for passing (BCMoF 2001; USFS 2005). Dale and Weaver

2007-03-23
27
(1974) found that equestrian trails with 10,000 human visits per year ranged in width from 0.75
to 2.0 m. By comparison, we commonly found trail widths near 9 m, with the busiest trail in our
study (ONI) having only approximately 1,000 vehicle passes per year over a three-year period.
The results of our study and others (e.g., Snyder et al. 1976; Griggs & Walsh 1981; Iverson et al.
1981; Payne & Leninger 1983; Trunkle & Fay 1991) indicate that recreational trail use causes
soil degradation and vegetation loss due to soil compaction and trampling. Thus, if SRD is
unwilling to address environmental damage within the 23-m-wide swath of a “designated trail”
(SRD 2002a), then the areal extent of tolerated vegetation and soil loss could be up to 175 ha
within our study area.
In 93% of cases where designated trails encounter streams, there are no crossing
structures present to help minimize the effects of OHVs or horses on water quality and fisheries.
Even though we found that most water crossings occurred at permanent streams, we found few
cases where bridges or fords have been established to achieve water management objectives.
Without these structures, people using OHVs and horses to cross streams are causing increased
bank erosion and sedimentation of the stream bed (Brown 1994; Baayens & Brewin 2002),
which can in turn affect fish populations (reviewed in Baayens & Brewin 2002). Furthermore,
streams in the study area are designated as Class C under Alberta’s Water Act (Water Act, R.S.A.
2000, c. W-3). This designation means that from May 16 to August 31 (which partly coincides
with the permitted season for OHV use on designated trails), pipeline or telecommunications
construction must operate using “isolation” techniques to protect water quality while crossing
streams (Alberta Environment 2000). Alberta’s Water Act (Water Act, R.S.A. 2000, c. W-3)
states that for a Class C stream, “any accumulations of silt and sediment within the isolation area
resulting from the works in the trench must be removed to a location where the materials will not

2007-03-23
28
enter a water body” (Schedule 3, Part 3, Section f). Allowing recreational trail damage on the
scale we document here seems wholly in violation of the Act’s guidelines, which were
established to protect wildlife and water resources.
Overall, trail sections further away from the Hummingbird Forest Recreation Area (BTN,
BTS, BTR) suffered greater amounts of damage than the hardened, flat sections of ONI, CAN,
and HUM. Interestingly, these latter three trails had the highest motorized traffic densities in our
study. In other words, we found relatively low amounts of damage on highly traveled trails. The
discrepancy between traffic density and trail damage strongly supports the notion that many
trails in the Bighorn Backcountry are not properly designed and sited for their currently regulated
use.
Overall trend in traffic volume
We found a substantial increase (68%) in the number of vehicle passes recorded during the
summer months between 2004 and 2006. These numbers are likely underestimates of the actual
amount of traffic on the trail network due to limitations in data recording by the traffic counters
and because of SRD management intervention during 2005. In 2005 portions of the trail network
were closed due to abnormally high amounts of precipitation (D. Samson pers. comm.);
nonetheless, it is clear that motorized vehicle use is increasing on ONC and BTN. These results
support our prediction that trail use in the area will increase following the establishment of the
AMP and that the AMP was not merely regulating established, “long-term” users. In this way,
problems associated with motorized recreation (see Appendix D) can be expected to increase in
the future. For example, higher traffic volumes along designated trails (see Figure 11) can lead to
a loss of effective habitat amount for elk (Preisler et al. 2006).

2007-03-23
29
Figure 10. Trail network showing disturbance area to elk (Cervus elaphus), an area
approximately equal to 14,355 ha (see Figure 2 for map metadata). This map is based on the
results of Preisler et al. (2006), who found that probability of a flight response by an elk to an
approaching OHV was ≈0.2 when the elk was 500 m from a trail and an OHV was 1,000 m
away. The probability of disturbance increases both as elk are closer to the trail and as OHVs are
closer to the elk. For example, the probability of response was closer to ≈0.6 when the elk was
20 m from the trail and the OHV was 1,000 m away. Likewise, the probability of response was
as high as 0.4 for elk 20 m from a trail when an OHV was 3,000 m away.
Given the increasing lack of compliance with FLUZ regulations, the extensive damage to
the trail network, and the trend in increasing traffic density, current management efforts in the

2007-03-23
30
Bighorn Backcountry are failing to meet the goal of the FLUZ regulations to protect “areas
containing sensitive resources such as fish and wildlife and their habitats, vegetation, soils and
watershed” (SRD 2002a:10). The extent and intensity of impacts reported here jeopardize the
very possibility of a quality backcountry recreation experience in the future for all users and are
inconsistent with wildlife habitat and watershed protection objectives.
RECOMMENDATIONS AND FUTURE RESEARCH OBJECTIVES Issue: Protection of the Bighorn Backcountry’s environment is long overdue.
1.0) Honour the commitments made by previous government officials to protect the
Bighorn area as a Wildland Park and fulfill the objectives of long-standing, publicly
supported land management policies by restricting motorized recreation in the
Prime Protection Zone. If the primary goal of the FLUZ – which is under the guiding
principles of the Eastern Slopes Policy (Government of Alberta 1984; Alberta Forestry
1986) – is to protect watersheds and wildlife habitat, then management of recreation must
align with these priorities. The structure of the Bighorn Backcountry (specifically the
Upper Clearwater/Ram FLUZ) ecosystem is typical of high elevation areas along the
Eastern Slopes of the Rocky Mountains: thin, light soils along with high precipitation.
These areas are very susceptible to damage caused by high levels of human activity. As
industrial activity intensifies elsewhere in the province, the Bighorn Backcountry will
become increasingly valued for its pristine wilderness condition to meet recreation,
watershed, and wildlife habitat objectives. Prudent management intervention is needed as
soon as possible to prevent further, and possibly unrecoverable, damage from occurring
in this area.

2007-03-23
31
Issue: Illegal use of trails is increasing.
2.1) Increase enforcement patrols in backcountry areas, especially along BTN, BTS,
and BTR trails.
2.2) Ensure that all secondary trails are physically blocked and signed at the
junction, with language indicating that motorized users proceeding off of the main
trail are in violation of FLUZ regulations. We sampled traffic along a small portion of
the non-designated trails in the area, and while we found somewhat decreased use on
certain trails, others showed a lot of illegal traffic. Well-placed signs appear to reduce the
use of non-designated trails. However, signs have often been vandalized (e.g., removed
or shot through), which reinforces the need for more enforcement. Such behaviour is an
indication of the animosity some users have toward backcountry regulation.
2.3) Redesign elements of the trail network to facilitate safety and enforcement
patrols. Some trails (especially along the border of the Kiska-Wilson FLUZ and the
Ram-Clearwater FLUZ, on the north end of the Job-Cline FLUZ, and in the Dormer-
Sheep FLUZ) and Random Sledding Areas are not clearly marked, so users may not
know what areas are legal or illegal for OHV use. Furthermore, the many non-looping
trails disperse an already scarce enforcement presence. Looping network trail designs
would help alleviate some of these issues.

2007-03-23
32
Issue: Trail location and design is inappropriate for the types of use permitted in the FLUZ.
3.1) Ensure that amateur stewardship efforts to repair damaged trail sections are
overseen by professional engineer and construction personnel. We found evidence of
trail stewardship by local clubs, as encouraged by SRD, but in some situations these
efforts will only temporarily address the problem. For example, in many cases, water
movement near or across the trail is not adequately addressed by the drainage methods
used (H. Unger, pers. comm.). Attempts by stewardship groups to reduce the impact of
their own activities within the Bighorn Backcountry are commendable; however,
additional expertise is needed in these endeavours and a more systematic approach to trail
improvement must be implemented.
3.2) Address water quality and fisheries objectives by improving water crossings
along designated trails through the construction of bridges for permanent streams
and hardened fords for ephemeral streams. Approaches to streams should be hardened
with gravel to reduce bank erosion and fenced to encourage their use. Evidence of driver
avoidance of crossing structures suggests that many users are unaware of the impacts of
OHVs on water quality.
3.3) Monitor random campsites along trails, especially along ONI and RNG, for
presence of garbage and semi-permanent facilities. Close sites to further use where
reclamation is necessary.

2007-03-23
33
3.4) Increase management responsiveness to changing trail conditions by closing
areas until repairs are made or the area naturally regenerates. SRD has shown
willingness to adjust trail regulations based on local conditions in 2005 and, specifically,
on BTN in 2006. We encourage these efforts and urge LFD officers to more closely
examine other trail sections based on our results. We also point out that the damage
leading to these trail closures was anticipated at the earliest meetings of the Bighorn
Advisory Group (SRD 2002b). We recommend initiating a pilot project to measure the
recovery of damaged areas and to project recovery times. This would allow managers to
move forward with restoration projects throughout the area.
3.5) Enforce a 3-m-wide trail designation. The 10-m or 23-m designated trail width
(SRD 2002b) in the Bighorn is far wider than in many jurisdictions in North America
where OHV use is common. Having more reasonable and enforceable trail widths will
help minimize environmental degradation as well as improve the efficiency of
stewardship efforts. This may require revision of the FLUZ regulation.
Issue: Density of motorized traffic is increasing in the area.
4.1) Conduct a survey of users in the area with the goal to determine
i) how the area is being used by each user group,
ii) how to avoid multi-user conflict, and
iii) how to minimize environmental degradation and develop a more
comprehensive and sustainable management vision for the area.

2007-03-23
34
4.2) Incorporate broader perspectives on the Bighorn Backcountry Access
Management Plan Standing Committee by including representatives from the
conservation sector on this committee. Currently there is no conservation group or non-
motorized recreation group representation on the committee. While some may have the
view that “all participants are concerned with the environment” and therefore a dedicated
conservation position is unnecessary, this argument defies the logic of a stakeholder
committee. For example, hikers do not represent horseback riders and snowmobilers are
not represented by quadders. A dedicated environmental perspective is clearly under-
represented on this committee, given the Prime Protection Zone designation for many
areas in the Bighorn Backcountry and the increasing intensification of recreational
activity.
Future action for the Alberta Wilderness Association in the Bighorn Backcountry
1) Conduct a trailhead survey of all different users.
2) Conduct a focal group survey with recreation organizations.
3) Continue monitoring efforts using traffic counters.
4) Spot-check severely disturbed areas for management intervention and update the
photo-database of areas, where appropriate, to compare with baseline data.
5) Continue to bring management/enforcement issues to the attention of authorities.

2007-03-23
35
CONCLUSION
Our study provides evidence of severe impacts to the environment caused by recreational
activities in the Bighorn Backcountry. These impacts violate the intent of the Bighorn
Backcountry Access Management Plan and the FLUZ regulations. Allowing recreational
activities to continue at current levels is wholly inconsistent with the vision of the Prime
Protection Zone designation under the Eastern Slopes Policy.
The recreational impacts in the Bighorn Backcountry described here underscore the sort
of access management issues that are becoming common throughout the province (Canada West
Foundation 2006). Similar issues are apparent in the Castle-Crown, the southeast slopes,
Kananaskis Country, the Ghost-Waiparous, and areas further north along the Eastern Slopes. As
access management issues continue to dominate backcountry land management, the need to
develop comprehensive policy and management plans that accommodate all user groups is
increasingly apparent. Within these, our government must establish clear and enforceable
regulations that will ensure the protection of wildlife, watersheds, and all ecosystem services.
Recreational access issues in the Bighorn Backcountry represent both a challenge and an
opportunity for users and governments. The challenge will be to meet the concerns expressed by
individual user groups while ensuring that the value of the land is not depreciated for others. The
opportunity before us is to bring traditionally disparate users together to become actively
engaged in the resolution of these issues. The first step toward reaching this goal is for the
provincial government to resume an active leadership role in public land stewardship.

2007-03-23
36

2007-03-23
37
REFERENCES
Alberta Forestry. (1986). The Nordegg-Red Deer River Sub-regional Integrated Resource Plan.
Energy and Natural Resources Library, Edmonton, AB.
Baayens, D., and K. Brewin. (2002). Turbidity Monitoring in Howard Creek, Elbow River
Watershed 2001. Alberta Council, Trout Unlimited Canada.
BCMoF. (2000). Recreation Trail Management. Chapter 10 of Recreation Manual.
http://www.tsa.gov.bc.ca/publicrec/manual/chap10/chap10.htm (last accessed March 14,
2007).
Brown, K. (1994). River-bed Sedimentation Caused by Off-road Vehicles at River Fords in the
Victorian Highlands, Australia. Water Resources Bulletin 30(2): 239-50.
Canada West Foundation. (2006). Provincial Land-use Framework Initiative Cross-sector
Forum. Summary Report.
http://www.landuse.gov.ab.ca/docs/RD%20Summary_screen.pdf (last accessed May 30,
2007).
CDCSSMA. (2003). Appendix VI: Algoma Trails, Guidelines and Standards. A Business Case
Study for Trail Development in the Algoma & Area District: Final Report. Quadra
Consulting Group, EDA Collaborative, The Economic Planning Group.
http://www.ssmcdc.com/pdfs/AT_appendix_5.pdf (last accessed March 14, 2007).
Coleman, R. (1981). Footpath Erosion in the English Lake District. Applied Geography 1: 121-
31.
Dale, D., and T. Weaver. (1974). Trampling effects on vegetation of the trail corridors of north
Rocky Mountain forests. J. Applied Ecology 11:767-72.

2007-03-23
38
ECGNL. (2004). Environmental Assessment.
http://www.env.gov.nl.ca/env/Env/EA%202001/pdf%20files%202/1150%20-
%20Registration..PDF (last accessed March 14, 2007).
Godefroid, S., W. Massant, G. Weyembergh, and N. Koedam. (2003). Impact of Fencing on the
Recovery of Ground Flora on Heavily Eroded Slopes of a Deciduous Forest.
Environmental Management 32(1): 62-76.
Government of Alberta. (1984). A Policy for Resource Management of the Eastern Slopes.
Revised 1984. Alberta Energy and Natural Resources, Edmonton, AB.
Government of Alberta. (1999). Alberta Water Act. Alberta Queen’s Printer.
Griggs, G., and B. Walsh. (1981). The Impact, Control and Mitigation of Off-road Vehicle
Activity in Hungry Valley, California. Environmental Geology 3(4): 229-43.
IDoT. (2000). Iowa Trails 2000. http://www.iowabikes.com/trails/CHPT04-3.html (last accessed
March 14, 2007).
Iverson, R., B. Hinckley, R. Webb, and B. Hallet. (1981). Physical Effects of Vehicular
Disturbances on Arid Landscapes. Science 212: 915-16.
NGPC. (2006). Trail Constituencies and Development Criteria.
http://www.ngpc.state.ne.us/parks/programs/trailplan/05CHAPTER.pdf (last accessed
March 14, 2007).
Payne, G., J. Foster, and W. Leninger. (1983). Vehicle Impacts on Northern Great Plains Range
Vegetation. Journal of Range Management 36(3): 327-31.

2007-03-23
39
Preisler, H., A. Ager, and M. Wisdom. (2006). Statistical Methods for Analysing Responses of
Wildlife to Human Disturbance. Journal of Applied Ecology 43: 164–72.
Snyder, C. T., D. G. Frickel, R. E. Hadley, and R. F. Miller. (1976). Effects of Off-road Vehicle
Use on the Hydrology and Landscape of Arid Environments in Central and Southern
California. U.S. Geological Survey Water-Resources Investigations 76-99, 45 pp.
SRD. (2006a). http://www.srd.gov.ab.ca/areas/clearwater/bighorn/ (last accessed March 14,
2007).
http://www.srd.gov.ab.ca/fieldoffices/clearwater/bighornbackcountry/monitoring.aspx
(last accessed May, 2007)
SRD. (2006b). Forest Land Use Zones of the Bighorn Backcountry. Brochure, revised 2005.
SRD. (2006c). Summary notes from Bighorn Access Management Plan Standing Committee
www.srd.gov.ab.ca/areas/clearwater/bighorn/pdf/summary%20notes%20Oct%202006.pd
f (last accessed March 17, 2007);
http://www.srd.gov.ab.ca/fieldoffices/clearwater/bighornbackcountry/monitoring.aspx
(last accessed May 2007).
SRD. (2003). Bighorn Access Management Plan Recreational Trail Monitoring.
http://srd.alberta.ca/fieldoffices/clearwater/bighornbackcountry/pdf/recreational_trail_mo
nitoring.pdf (last accessed March 14, 2007).
SRD. (2002a). Bighorn Backcountry Access Management Plan. Sustainable Resource
Development, Clearwater Area Office, Rocky Mountain House, AB.
http://www.srd.gov.ab.ca/fieldoffices/clearwater/bighornbackcountry/pdf/access_manage
ment_plan.pdf (last accessed March 14, 2007).

2007-03-23
40
SRD. (2002b). Recreational Access Management Recommendations for the Bighorn Area, May
2002. Bighorn Advisory Group.
Trunkle, T., and P. Fay. (1991). Transportation of Spotted Knapweed Seeds by Vehicles.
Proceedings, Montana Weed Control Association Annual Conference. Jan 14-16, Butte,
MT.
USFS. (2005). National Trail Design Parameters.
www.fs.fed.us/r3/measures/Inventory/trails%20files/National_
Design_Parameters_1_31_2005.doc (last accessed March 14, 2007);
http://www.fs.fed.us/r2/trails/cdnst/management/cdt_trail_design_parameters_060805_dr
aft.doc (last accessed May 2007).
WDNR. (2005). So You Want to Build an ATV Trail.
http://www.dnr.state.wi.us/org/caer/cfa/LR/ATV/BuildATVTrail.pdf (last accessed
March 17, 2007).

2007-03-23
41
Appendix A. Reporting periods for traffic counters, 2004-2006.
*Non-designated trails
Periods when the recorders were deemed malfunctioning are highlighted in grey. Bold numbers
indicate the day when the traffic recorder was not recording.
Year 2004 2005 2006
Month 9 10 11 12 1 2 3 4 5 6 7 8 9 10 11 12 1 2 3 4 5 6 7 8 9
1 (ONC) 11 1
2 (ONC)*
3 (ONC)*
4 (CAN)
5 (ONC)* 31
6 (RNG) 5 12
7 (BTN)
Traf
fic c
ount
er (T
rail)
8 (HUM) 31 11 21 11

2007-03-23
42

2007-03-23
43
Appendix B. Photo documentation of selected recreational impacts in the Bighorn Backcountry.
1) An undesignated “frolic area” on Onion Lake. The tracks in the lakebed on the left side of the
photo are from OHVs and have been found in this location every year since at least 2003.
2) A poorly designed water crossing along HUM. Sites like these are contributing to water
quality degradation and fish habitat loss.
2007-03-23
44
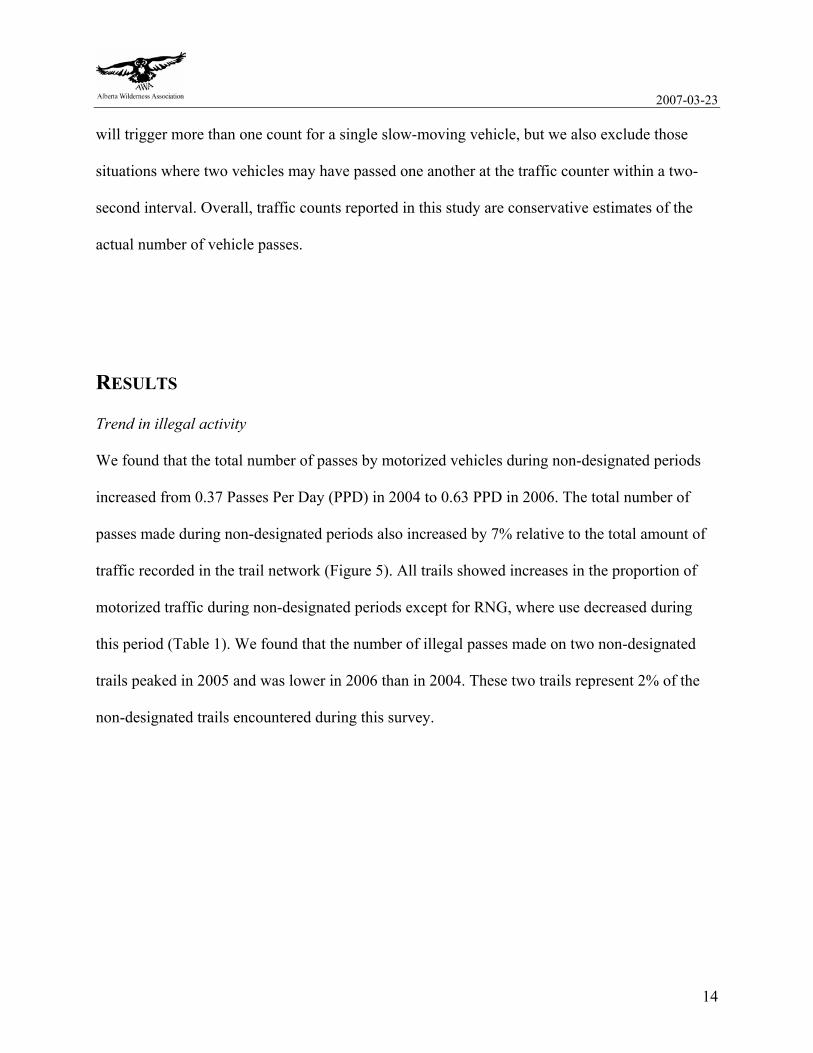
3) Use of a non-designated trail by at least one OHV rider near traffic counter 3 in the Onion
Lake area.
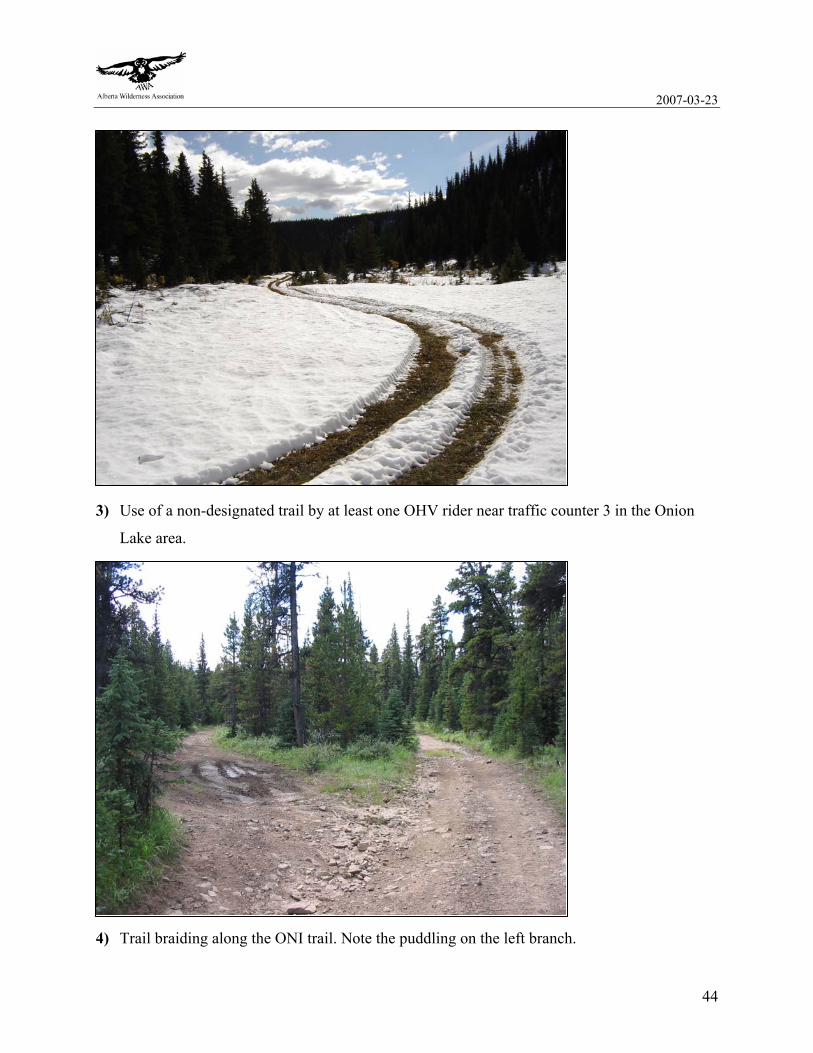
4) Trail braiding along the ONI trail. Note the puddling on the left branch.

2007-03-23
45
5) A section of damaged trail along HUM. Poor trail construction is leading to water pooling
and rutting along this OHV track.
6) Reclamation efforts along BTS by SRD. Costs of reclaiming damaged areas, as well as
additional enforcement personnel needed for backcountry patrols, need to be included in any
cost-benefit evaluation of managing this wilderness resource.

2007-03-23
46
7) Backcountry campsite along RNG.
8) Garbage gathered from one backcountry campsite along RNG.

2007-03-23
47
Appendix C. History of the Alberta Wilderness Association’s interest in the Bighorn Backcountry. 1972 – AWA begins clean-up in Bighorn Area – Pinto Lake.
1973 to 1974 – Province-wide public hearings include a review of the AWA’s proposed
Wildland Recreation Areas (areas proposed for wilderness preservation like Willmore
Wilderness Park). Included is what the Alberta government later names the Bighorn
Wildland Recreation Area (proposed Panther Corners, Ram-Whiterabbit and White Goat
Wildland Recreation Areas).
1975 – Alberta government announces that it accepts the protection recommendations of the
1974 Environment Conservation Authority report into the future of the Eastern Slopes:
“This will ensure that while some carefully selected projects will proceed in certain
areas, vast tracts of land will be kept in a natural and wilderness state. A conservative
estimate is that a minimum of 70% of the Eastern Slopes Region will be maintained in
present natural or wilderness areas.”
(Government of Alberta, Policy Statement on the Eastern Slopes)
1979 – Eastern Slopes Policy designates most of Bighorn as Prime Protection Zone, off-
limits to industry and OHV use.
1981 – Following the establishment of Kananaskis Country in 1977, the Alberta government
proposes to establish a second country, David Thompson Country – a large area in west-
central Alberta including the currently proposed Bighorn Country.
1982 to 1984 – AWA is a full public consultant to the Nordegg-Red Deer River and the
Rocky-North Saskatchewan Sub-Regional Integrated Resource Plans.
1984 to 1994 – AWA conducts a yearly trail clean-up blitz in the Bighorn Area.

2007-03-23
48
1986 – At the AWA’s annual meeting, the Minister of Forestry announces completion of the
Nordegg-Red Deer River Integrated Resource Plan and names the Bighorn Wildland
Recreation Area in response to the AWA’s proposal. The government releases a park-like
brochure, and the Wildland Area goes onto government maps.
1992 – In a letter to the AWA, the Minister of Tourism, Parks and Recreation states his belief
that the Bighorn Wildland Recreation Area “could be legislated in a manner that would
provide both an appropriate level of protection and facilitate opportunities such as hiking,
cross-country skiing and equestrian use.… It is our hope that imminent decisions will result
in an opportunity for this positive strategy to get underway.”
1993 – The government appoints an Advisory Committee on Special Places 2000 and
recommends that areas already managed as wildlands, including Bighorn Wildland
Recreation Area, be formally designated as protected areas by the end of 1994.
1994 – AWA adopts the Bighorn Historic Trail through Alberta Land and Forest Services.
Located in the Rocky-Clearwater Forest, the trail starts at Crescent Falls and goes to Wapiabi
Gap and on to the Blackstone Gap. In addition, AWA asks to adopt an extension of this trail,
from the Blackstone, over the Chungo Gap to the FLUZ boundary on the east.
1996 – An Alberta government report, Parks and Protected Areas: Their Contribution to the
Alberta Economy, finds the economic contribution of provincial parks and other legally
protected areas to be comparable to that of other resource-based sectors and, in particular,
similar to the agricultural and forestry sectors. The report calculates only the recreation and
tourism values, noting that there are also social, environmental, and other economic values
from parks. In terms of employment, parks are similar to the forestry and energy sectors.
1998 – The “Bighorn Country” Wildlands Coalition is established, with members consisting
of provincial organizations, local citizens, outdoor recreationists, ecotourism operators, and

2007-03-23
49
guides and outfitters from the Sundre, Nordegg, Rocky Mountain House, and Red Deer
areas. The Coalition’s goal is the following:
To encourage the establishment of “Bighorn Country” as a means of ensuring the
protection of this outstanding wildland for present and future generations while
providing for heritage appreciation and a range of recreation and eco-tourism
opportunities which are dependent on undeveloped, natural environments.
1998 to 2001 – AWA participates in the Alberta Forest Service–Friends of the West
Country–Sunpine regular meetings in Rocky Mountain House.
2000 – AWA undertakes extensive discussions with Talisman Energy Inc. and the EUB
regarding drilling and pipeline plans for Bighorn Country.
2001 – AWA withdraws from the “Bighorn Country” Wildlands Coalition due to board
change in direction. Government denies existence of Bighorn Wildland. AWA demands that
promised Bighorn Wildland Recreation Area be protected by legislation. Alberta
government sells gas leases under Bighorn Range and within Bighorn Country, in the
Wapiabi-Blackstone valleys.
2001-2002 – AWA participates in Bighorn Access Management Advisory Group.
2002 – AWA initiates public forums to discuss the future of the Bighorn Wildland. AWA
declines to sign off on the Bighorn Access Management recommendations. AWA gives a
presentation to Standing Policy Committee. Bighorn Backcountry Access Management Plan
is endorsed by Alberta Cabinet. The plan goes to Caucus for final approval. The plan allows
motorized access into Prime Protection Zone in violation of the Eastern Slopes Policy.
2003 – AWA launches the Bighorn Recreation and Impact Monitoring Program. AWA
publishes a new book, Bighorn Wildland, and begins a book tour through Alberta
communities to educate Albertans about the Bighorn and conservation, and to re-launch the

2007-03-23
50
Bighorn campaign. AWA meets with Mike Cardinal and representatives to demand
Wildland Park designation for the Bighorn and the prohibition of motorized and industrial
access.
2004 – The tenth anniversary of AWA’s stewardship of the Bighorn Historic Trail.
2005 – AWA meets with Minister of Community Development Gary Mar to discuss, among
other items, designating Bighorn as a Wildland Park in celebration of Alberta’s centennial
year. Mar indicates that with the current government, it is extremely difficult to get any new
protected areas in Alberta. Although Mar says that he wants Alberta’s parks to be the “lens
through which the world sees Alberta,” he says his focus is to maintain existing parks in
Alberta with upgrades to infrastructure and programming. This is backed up in following
months with the release of the budget allocating approximately $60 million to parks for
infrastructure, staffing, and fire prevention. Unfortunately, there is no mention of the
creation of any new parks or protected areas.
2006 – AWA continues community outreach efforts and meets with members of the Alberta
Equestrian Federation to review concerns of common interest, including trail damage and
overuse. Restoration efforts and plans to work together are discussed. AWA completes the
2006 field season (five field trips) and interim report for the Bighorn Wildland Recreation
Monitoring Project (BWRMP) 2005 season. An executive summary of 2005 BWRMP
interim report is sent to SRD, Clearwater Area. The report contains 10 recommendations on
policy and management of the Hummingbird Recreation Area. AWA discusses some points
at a meeting with SRD, Clearwater Area and requests a written response to our
recommendations. AWA holds an additional meeting with SRD, Clearwater Area to discuss
TRAFx data in detail, as well as locations of damage, etc. AWA receives acknowledgement
from SRD, Clearwater Area on the 2005 Interim Report; they note that AWA concerns and
many recommendations have been included in their work plans for this year. An Executive
Summary of BWRMP, covering letter, and copy of the Bighorn Wildland book are sent to
all MLAs. AWA participates in government-led meetings and processes regarding R11

2007-03-23
51
FireSmart and the Ya Ha Tinda Environmental Assessment related to elk management ideas
and plans. AWA participates in meetings and open house sessions in Sundre with SRD
Forest Service, individuals, and local interests in response to development plans submitted
by Panther River Adventures under the ATRL process. Oil and gas development in the
Bighorn area are reviewed routinely throughout the year with the major companies
operating in the area. AWA continues its commitment to the Bighorn Historic Trail with the
completion of a successful trail-clearing trip. Concerns with trail conditions and usage
report are filed with SRD, Clearwater Area.
2007 - AWA completes the first phase of The Bighorn Wildland Recreational Trail
Monitoring Project: An Interim Research Summary from 2004 – 2006. The report is
officially released in a meeting with SRD Minister Ted Morton. Presentations are made to
SRD staff from Clearwater Area; discussions and collaboration with field staff are ongoing.
A recreational user survey is developed and organized user groups as well as individual
users are surveyed to learn more about recreational user interests and values for the Bighorn
area.

2007-03-23
52

2007-03-23
53
Appendix D. Annotated bibliography on the impacts of motorized recreation on various environmental features.
Feature Impact Effect Jurisdiction Source* Soil Toxins Lead contamination from exhaust. Wisconsin, USA Collins & Sell
1982 Soil Erosion Soil loss 8 times greater in areas with
vegetation loss caused by recreation. California, USA Snyder et al.
1976 Soil Erosion OHV caused cracks 24 cm deep within 1
season on wet soils. California, USA Griggs & Walsh
1981 Soil Erosion Sediment transport was 196 times greater
and 80 times greater in heavy and moderate OHV-use areas, respectively, compared to no-use areas.
California, USA Griggs & Walsh 1981
Soil Compaction Vegetation loss, water surface runoff increases, decreased sub-surface infiltration capacity.
California, USA Iverson et al. 1981
Vegetation Loss Up to 99% of vegetation loss occurred after 32 passes by an OHV.
Northern Great Plains, USA
Payne et al. 1983
Vegetation Weeds 2,000 knapweed seeds spread over 10 miles in 1 pass by a vehicle.
Montana, USA Trunkle & Fay 1991
Water Habitat Sediment deposition in streams increases with OHV traffic volume and stream velocity.
Victoria, Australia
Brown 1994
Water Toxins Brook trout showed lead and hydrocarbon uptake from winter OHV use; fingerling stamina decreased in polluted areas.
Maine, USA Adams 1975
Wildlife Various Decreased population size (45-80%) and biomass of reptiles, songbirds, and mammals in OHV areas.
California, USA Bury et al. 1977
Wildlife Bighorn sheep
Use of a watering site was 50% less when OHVs were in the area.
California, USA Jorgensen 1974
Wildlife Grizzly bear
Avoid areas with >10 vehicles per day. Montana, USA Mace et al. 1996
Wildlife Elk Flushed from areas near trails when a OHV approached at 3,000 m.
Oregon, USA Preisler et al. 2006
Wildlife Trout Sedimentation of stream water by OHV crossing upstream was at levels high enough to affect behaviour and growth of trout.
Alberta, Canada Baayens & Brewin 2002
Wildlife Mule deer Harassment by OHVs caused changes in behaviour, increased energy expenditure, and decreased reproductive success compared to un-harassed deer.
Alberta, Canada Yarmoloy et al. 1988
Aesthetic Wilderness features
85% of OHV trails were visible one year after impact.
Northern Great Plains, USA
Payne et al. 1983
Safety Wildland fire
An average of 6.5 forest fires per year have been caused by OHVs between 1990 and 2001, with 4 caused by OHVs in 1990 and 12 caused by OHVs in 2002.
Alberta, Canada Baxter 2002
*Complete reference information available on request.

2007-03-23
54

2007-03-23
55

2007-03-23
56
Appendix E. Project summary: Bighorn Wildland Recreational Impact Monitoring Study
Inputs
Field work
Personnel: 990 staff hours
1,650 volunteer hours
Capital costs: $64,000 staff costs
$20,000 Bighorn Wildland book
$9,000 expedition costs (e.g., food, transportation)
$7,000 traffic recorders
$4,000 video documentary
$2,000 equipment (GPS, camping, safety, tools)
5 donated reconnaissance flights
Outputs
Baseline documentation of recreational impacts on 76 km of trail, including photographs,
geo-referencing, and measurements of illegal trails, water crossings, damage sites, and
random campsites.
Interim report presented to Hon. Ted Morton, Minister of Sustainable Resource
Development (March 23, 2007).
Meeting with AEF (Alberta Equestrian Federation) (November 14, 2005).
Meeting with Hon. Gary Mar, Minister of Community Development, to discuss, among
other items, designating Bighorn as a Wildland Park in celebration of Alberta’s
centennial year (February 2005).

2007-03-23
57
Poster presentation at the Interdisciplinary Research and Management in Mountain Areas
Conference. Banff, AB. “Monitoring the Impact of Recreational Activities for Long-term
Management in the Bighorn Wildland, Alberta” (September 24, 2004).
Meeting with Hon. Mike Cardinal, Minister of Sustainable Resource Development, and
representatives to discuss Wildland designation for the Bighorn and the prohibition of
motorized and industrial access (November 2003).
Meetings with various Alberta MLAs regarding issues concerning the Bighorn (starting
in October 2003).
Publication of the Bighorn Wildland book (September 2003).
Production of the documentary Broken Promises, with assistance from George Sibley of
Gale Force Films (2003).
Various letters, meetings, and phone conversations between AWA and
SRD officials in the Rocky Mountain House office (2003-2007).
Commencement of the Recreational Impact Monitoring Project (May 2003).

2007-03-23
58
Appendix F. Inconsistencies in official statements with respect to access management in the Bighorn Wildland
Statement Source Contradiction: field evidence Contradiction: policy
The widening and development of new trails requires written approval from a Forest Officer. Avoid wet, soft and sensitive areas.
Guidelines for Enjoying the Bighorn Backcountry (SRD 2006)
91 non-designated trails established as of 2006, with OHV tracks on 41% of these. 125 Erosion Events along trails. Mean width of damaged trail sections is ≈9 m, maximum =50 m. 244 cases of trail braiding and widening (AWA 2007).
The Bighorn Backcountry is managed to ensure the protection of the environment, while allowing responsible and sustainable recreational use.
Introduction: Bighorn Backcountry (SRD 2006)
Illegal use of trails is increased by 7% from 2004 to 2006. Approximately 20% of motorized vehicle traffic was recorded during non-designated (illegal) periods. Trail degradation was found on 20% of the trail network and motorized traffic in the area is increasing (AWA 2007).
The area was included in the 1977 (revised 1984) Policy for Resource Management of the Eastern Slopes and also in the Nordegg-Red Deer River Sub-Regional Integrated Resource Plan of 1986. These plans remain in place, and are now (as of 2002) supported further by a Bighorn Backcountry Access Management Plan, developed with input from an Advisory Group and from the public at large.
Bighorn Backcountry Access Management Plan (SRD 2002)
The Nordegg-Red Deer River Sub-Regional Integrated Resource Plan of 1986 explicitly prohibits motorized recreation in areas now approved for these activities by the Access Management Plan, especially in the Ram-Clearwater FLUZ.
Alberta implemented regulations in 2002 around camping, trail riding, and OHVs to protect Bighorn Backcountry’s wilderness environment.
Bighorn Backcountry Access Management Plan (SRD 2002)
91 non-designated trails established as of 2006, with OHV tracks on 41% of these. 125 Erosion Events along trails. Mean width of damaged trail sections is ≈9 m, maximum=50 m. 244 cases of trail braiding and widening (AWA 2007).
The Nordegg-Red Deer River Sub-Regional Integrated Resource Plan of 1986 explicitly prohibits motorized recreation in areas now approved for these activities by the Access Management Plan, especially in the Ram-Clearwater FLUZ.

2007-03-23
59
Designated Trail: A road, trail or seismic line designated by signage and on maps for use by Off-Highway Vehicles (OHVs) and snowmobiles. The route may or may not be open for use by other forms of access. The OHV trail includes that part of the route to a width of three metres (9.8 feet) or less as approved by a Forest Officer, and a parking zone of 10 metres or less on either side of the trail. Within Forest Land Use Zones, OHVs and snowmobiles must remain on the trail.
Bighorn Backcountry Access Management Plan (SRD 2002)
91 non-designated trails established as of 2006, with OHV tracks on 41% of these. 125 Erosion Events along trails. Mean width of damaged trail sections is ≈9 m, maximum=50 m. 244 cases of trail braiding and widening (AWA 2007).
A 23-m trail width wherein damage to water, soil, and vegetation is allowed to occur is inconsistent with environmental protection objectives.
A Forest Land Use Zone can be used to: Protect areas containing sensitive resources such as fish & wildlife and their habitats, vegetation, soils and watershed.
Bighorn Backcountry Access Management Plan (SRD 2002)
91 non-designated trails established as of 2006, with OHV tracks on 41% of these. 125 Erosion Events along trails. Mean width of damaged trail sections is ≈9 m, maximum=50 m. 244 cases of trail braiding and widening (AWA 2007).
No-Go Zone: An area where OHV or other form of access (as posted) is not permitted, including any lands off the designated trails other than parking areas; any lands within 100 metres of a lake, pond or non-flowing body of water; any meadows, swampland, marsh, stream, grassed slope or other area off the designated trail.
Bighorn Backcountry Access Management Plan (SRD 2002)
Water crossings over 89 streams, of which 7% had bridges (AWA 2007). 91 non-designated trails established as of 2006, with OHV tracks on 41% of these. 125 Erosion Events along trails. Mean width of damaged trail sections is ≈9 m, maximum=50 m. 244 cases of trail braiding and widening (AWA 2007).
There must be adequate resources to ensure that regulations can be effectively enforced.
Recreational Access Recommen-dations for the Bighorn Area (Bighorn Advisory Group 2002)
Illegal use of trails is increased by 7% from 2004 to 2006. Approximately 20% of motorized vehicle traffic was recorded during non-designated (illegal) periods.

2007-03-23
60
Activities allowed in this area will be restricted or delayed if present levels of activity are shown to compromise environmental integrity.
Recreational Access Recommen-dations for the Bighorn Area (Bighorn Advisory Group 2002)
Water crossings over 89 streams, of which 7% had bridges (AWA 2007). 91 non-designated trails established as of 2006, with OHV tracks on 41% of these. 125 Erosion Events along trails. Mean width of damaged trail sections is ≈9 m, maximum=50 m. 244 cases of trail braiding and widening (AWA 2007).
The Nordegg-Red Deer River Sub-Regional Integrated Resource Plan of 1986 explicitly prohibits motorized recreation in areas now approved for these activities by the Access Management Plan, especially in the Ram-Clearwater FLUZ.
User groups should be engaged directly in stewardship programs, giving them more responsibility for facility improvements and maintenance, but cautioned that the provincial government must also have adequate resources in place.
Recreational Access Recommen-dations for the Bighorn Area (Bighorn Advisory Group 2002)
Stewardship efforts are poorly engineered to address water drainage issues near trails with OHV and high density equestrian traffic (AWA 2007).
Temporary or permanent closures should be implemented in areas where continued use of those areas will have negative effects on fish and wildlife populations, natural habitat conditions, watershed integrity or traditional aboriginal sites.
Recreational Access Recommen-dations for the Bighorn Area (Bighorn Advisory Group 2002)
Water crossings over 89 streams, of which 7% had bridges (AWA 2007). 91 non-designated trails established as of 2006, with OHV tracks on 41% of these. 125 Erosion Events along trails. Mean width of damaged trail sections is ≈9 m, maximum=50 m. 244 cases of trail braiding and widening (AWA 2007).
Where areas have deteriorated from overuse, these areas should be restored to natural conditions. This is especially true of areas around alpine lakes. Appropriate measures must be taken to ensure that the damage will not re-occur.
Recreational Access Recommen-dations for the Bighorn Area (Bighorn Advisory Group 2002)
The lakebed of Onion Lake had new OHV track marks every year from 2004-2006 (AWA 2007). Water crossings over 89 streams, of which 7% had bridges (AWA 2007). 91 non-designated trails established as of 2006, with OHV tracks on 41% of these. 125 Erosion Events along trails. Mean width of damaged trail sections is ≈9 m, maximum=50 m. 244 cases of trail braiding and widening (AWA 2007).

2007-03-23
61
Some members believe that OHV use in the prime protection zone is specifically prohibited by existing policy. Other members believe that designated trails would be consistent with existing policy.
Recreational Access Recommen-dations for the Bighorn Area (Bighorn Advisory Group 2002)
The Nordegg-Red Deer River Sub-Regional Integrated Resource Plan of 1986 explicitly prohibits motorized recreation in areas now approved for these activities by the Access Management Plan, especially in the Ram-Clearwater FLUZ.
Some members believe that OHV use causes damage to terrain and disruption to wildlife and people in areas they access. Others believe that OHV users will be highly responsible and will be positive contributors to the protection of the area, and the maintenance of trails and facilities.
Recreational Access Recommen-dations for the Bighorn Area (Bighorn Advisory Group 2002)
Illegal use of trails is increased by 7% from 2004 to 2006. Approximately 20% of motorized vehicle traffic was recorded during non-designated (illegal) periods. Trail degradation was found on 20% of the trail network and motorized traffic in the area is increasing (AWA 2007).
Uncontrolled vehicle access and lack of maintenance on roads leading up … Onion Creek … have resulted in terrain damage and erosion (Alberta Forestry 1986)
Where trails or campsites are too close to sites habitually used by ungulates or carnivores, these facilities should be moved or closed. In some cases, it may be necessary to restrict backcountry camping to designated campsites.
Recreational Access Recommen-dations for the Bighorn Area (Bighorn Advisory Group 2002)
Figure 11 (AWA 2007).
The intent of the Prime Protection Zone is to preserve environmentally sensitive terrain and valuable ecological and aesthetic resources. Regional objectives which are considered compatible with the intent of this zone include those of watershed, fisheries and wildlife management, and extensive recreational activities such as hunting, trail use (non-motorized) and primitive camping.
A Policy for Resource Management of the Eastern Slopes, revised 1984 (Government of Alberta 1984)
Water crossings over 89 streams, of which 7% had bridges (AWA 2007). 91 non-designated trails established as of 2006, with OHV tracks on 41% of these. 125 Erosion Events along trails. Mean width of damaged trail sections is ≈9 m, maximum=50 m. 244 cases of trail braiding and widening (AWA 2007).
Bighorn Backcountry Access Management Plan (SRD 2002)

2007-03-23
62
The main land use in this Resource Management Area is back-country recreation. Uncontrolled vehicle access and lack of maintenance on roads leading up … Onion Creek … have resulted in terrain damage and erosion.
Nordegg-Red Deer River Subregional Integrated Resource Plan (Alberta Forestry 1986)
Bighorn Backcountry Access Management Plan (SRD 2002)
As motorized vehicle use is generally not compatible with resource values in this Resource Management Area, restrictions are required.
Nordegg-Red Deer River Subregional Integrated Resource Plan (Alberta Forestry 1986)
1,629 motorized vehicle passes were recorded on 5 trails in the summer of 2006, an increase of 68% from 2004 (AWA 2007).
Bighorn Backcountry Access Management Plan (SRD 2002)
Objectives and guidelines: To provide access appropriate to non-motorized back-country recreational activities, including reclamation of existing motorized access.
Nordegg-Red Deer River Subregional Integrated Resource Plan (Alberta Forestry 1986)
1,629 motorized vehicle passes were recorded on 5 trails in the summer of 2006, an increase of 68% from 2004 (AWA 2007).
Bighorn Backcountry Access Management Plan (SRD 2002)
A staging area will be developed at the confluence of Canary and Hummingbird creeks for equestrian and hiking users in the Ram River drainage.
Nordegg-Red Deer River Subregional Integrated Resource Plan (Alberta Forestry 1986)
1,629 motorized vehicle passes were recorded on 5 trails in the summer of 2006, an increase of 68% from 2004 (AWA 2007).
Bighorn Backcountry Access Management Plan (SRD 2002)