The Benefits of Social Media Use Among Wine Resellers · The Benefits of Social Media Use ......
102
Erasmus University MC&S Master’s Thesis June 22, 2012 Student: Brittany Ryan 364073 Supervisor: Jeroen Jansz The Benefits of Social Media Use Among Wine Resellers A quantitative study on Dutch wine resellers’ use of social media as marketing tools.
Transcript of The Benefits of Social Media Use Among Wine Resellers · The Benefits of Social Media Use ......

Erasmus University MC&S Master’s Thesis June 22, 2012
Student: Brittany Ryan 364073 Supervisor: Jeroen Jansz
The Benefits of Social Media Use Among Wine Resellers A quantitative study on Dutch wine resellers’ use of social media as marketing tools.

THE BENEFITS OF SOCIAL MEDIA USE
AMONG WINE RESELLERS
A quantitative study on Dutch wine resellers’ use of social media as marketing tools
Erasmus University Rotterdam Erasmus School of History, Communication and Culture
Master thesis New Media in Society and Culture
Author: Brittany Ryan Student number: 364073
Email address: [email protected] Mobile: 06 16622187
Supervisor: Jeroen Jansz
June 2012

i
ABSTRACT
Within the context of both academic and practitioner speculating on if, how, why
businesses are adopting Web 2.0 applications to benefit their business operations,
communications or marketing, this thesis uses the Dutch wine market to examines
these questions. Dutch wine reselling businesses are often run and managed by the
entrepreneur who began the business and employ few if any additional staff. With
limited resources, they are challenged in marketing their products and themselves.
These challenges align with the opportunities presented by Web 2.0 phenomena.
This research examines to what extent these resellers are utilizing social networking
sites to benefit their business. An exploratory, online survey was distributed
nationally to owner/managers of on-trade businesses to gather demographic
information about the owner/managers and their businesses as well as perceived
benefits and frequency of using social networking sites for their businesses. The
survey also explored barriers to social media use for business among non-users.
Data collected from 99 respondents revealed that 76% of respondents are using
social media to benefit their business to some extent. From this a profile of both user
businesses and non-user businesses could be developed. Twitter was found to be
the most popular network among business users across most activity types.
Following that, perceptions of the benefits of using social media to conduct various
business activities were calculated. Statistically significant relationships between age
and perceived benefits as well as usage intensity and perceived benefits were found.
Additionally, factors to non-use, or barriers to use, were ranked. It was found that
time and not knowing where to begin are the two strongest barriers to using social
media among non-user respondents. In summary, findings reveal that businesses
are using social media to conduct various business-related activities and users cite
various direct and indirect benefits to using the tools. Findings also suggest that non-
users are open to using the tools they simply need guidance on where and how to
begin.

ii
ACKNOWLEDGEMENTS First and foremost, I would consider these more an expression of sincere
appreciation rather than simply an acknowledgment. To begin, I would like to express
genuine thanks for the support and guidance of my supervisor, Jeroen Jansz.
Consistent with my convictions based on his EUR bio (over a year ago) that he was
destined to be my thesis supervisor, his confidence and humorous comments
throughout this process have been like fuel for an engine, sometimes running on low.
Next, I extend a bedankt to the management and on-trade sales team at Groupe
LFE. Without the LFE passion, I may never have embarked down this path of
curiosity into the realm of wine and social media. And without the support and
feedback from such wonderful colleagues, this research would not have been nearly
as fruitful.
On a more personal note, I don’t know how to begin “acknowledging” my
family, friends and boyfriend who were with me along this crazy mission to relocate to
the Netherlands that culminated in a beastly Master’s thesis (and the rollercoaster
accompanying that process). To my family, thank you for your support (and
skepticism at times) and letting me occupy the basement in preparation for earning
this degree. To my friend, Marine I would never have stepped foot in the Netherlands
if it weren’t for your Dutch heritage, and without your unconditional hospitality I would
not have managed. Bori, I needed a handlebar to grab onto several times over the
past year, and you certainly have been there. To Becca and Britt, your international
visits in spring just the pick-me-up I needed to conquer the final stages of this
process. And to Alistair, my guidepost, reality check, reassurance, confidence and
encouragement through virtually every step of the way. A heartfelt thanks is
extended to each of you.
And finally to Argentine Malbecs, without my first handful of fresh-from-the-
vine Malbec grapes followed by a glass of remarkable Tomero—I may never have
fallen in love with wine.

iii
TABLE OF CONTENTS
Abstract i Acknowledgements ii Table of Contents iii List of Tables and Figures iv List of Acronyms v List of Key Terms and Definitions vi
I. Introduction.......................................................................................................................... 1 II. Profiling Dutch On-Trade Wine Businesses………………………………………................... 3 Introduction 2.1 The Dutch Wine Market 3 2.2 On-Trade Businesses in NL 5 2.3 Marketing and Selling Wine 7 2.4 On-Trade Firms as SMEs 11 III. Web 2.0 and Marketing Opportunities……………………………………………................. 18 Introduction
3.1 New Media Technologies 18 3.2 Marketing in a Web 2.0 Environment 24 3.3 Research Questions 29
IV. Methodology…………………………………………………………………………................. 31 Introduction 4.1 Unstructured Interviews 31 4.2 Survey Development 32 4.3 Survey Design 33 4.4 Data Collection 37 V. Results…………………………………………………………………………………................ 40 Introduction 5.1 The Sample 40 5.2 User Characteristics 46 5.3 Non-User Characteristics 48 The How, Why and Why Not of Social Media Use 49 6.1 How? 49 6.2 Why? 52 6.3 Why Not? 57 VI. Conclusions & Discussion................................................................................................. 60 Introduction 7.1 Overview of Conclusions 60 7.2 Relevance & Implications 64 7.3 Limitations & Suggestions for Further Research 67 VII. References....................................................................................................................... 69
APPENDIX 1: Survey

iv
LIST OF TABLES AND FIGURES
Table 2.1: Dutch on and off-trade breakdown 5
Figure 2.1: On-Trade Sub Categories 7
Figure 4.1 Structure of Survey Branching 34
Table 4.1: Perceived benefits by grouping and activity 35
Figure 5.1: Type of business representation 40
Figure 5.2: Size of business by staff size 42
Table 5.1: Spearman rank order correlation between age and size of business and business performance in 2011
43
Table 5.2: Comparing users’ and non-users’ preferences in communicating with customers
44
Figure 5.3: Personal account frequency of use 45
Figure 5.4: Social media use/non-use for business 46
Figure 5.5: Use/non-use by type of business 47
Figure 6.1: How businesses use social media by SNS 50
Table 6.1: Frequency of use for business operation-related activities 51
Table 6.2: Frequency of use for customer-related activities 51
Table 6.3: Frequency of use for wine market-related activities 52
Table 6.4: Total benefit scores by use/non-use 53
Figure 6.2: Differences in mean scores across use intensity 55
Table 6.5: Results from Tukey HST post-hoc test exploring impact of age on benefit perceptions
56
Figure 6.3: Age and perceived benefits 57
Table 6.6: Non-user barrier frequencies 58

v
LIST OF ACRONYMS
B2B business to business
B2C business to consumer
CRM customer relationship marketing
ESF entrepreneurial small firm
eWOM electronic word of mouth
Horeca hotel, restaurant, cafe
ICT information communication technologies
NU non-users
NL Netherlands
RM relationship marketing
ROI return on investment
SME small to medium enterprises
SNS social networking sites
SST social shaping theory
U users
WOM word-of-mouth

vi
LIST OF KEY TERMS AND DEFINITIONS The following key terms and definitions are used to guide this research. This list is meant to serve as a collection of abbreviated explanations to assist and ensure reader clarity. Please note that these are abbreviated definitions and many of these terms are embedded in academic theory and are presented more extensively in the body of this paper. Key Terms and Definitions 90-9-1 rule a theory presented by Jakob Nielsen in 2006 that
states that online participation occurs unequally, with 90% of population observing and absorbing information, 9% participate occasionally, and 1% contributing heavily
cash & carry a type of on-trade business; large stores that aim to
compete with supermarkets sell to the Horeca industry or individuals with business-related membership
Christmas specialty type of on-trade business; businesses that sell wine or
gift baskets during holiday seasons throughout the year
collective intelligence interactive exchange and collection of information from
various nodes, or users, within a network electronic word of mouth statements made by existing or potential customers,
about a product or service which is made available to other people via the internet
entrepreneurial small firms small to medium enterprises with a strong orientation
toward entrepreneurship, characterized by commitment to growth as strategic goal
entrepreneur an individual who manages and owns the risk
associated with a business or enterprise microenterprise a business that employs less than 10 people off-trade supermarkets and chain liquor stores owned by a
large supermarket parent company on-trade businesses that purchase wine from a distributer or
producer with the intent to resell to either Horeca businesses or end consumers
relationship marketing a form of marketing by a company, product or service,
that seeks to establish, maintain and enhance customer relationships in a mutually beneficial manner
small to medium enterprise a business that employs less than fifty people

vii
social media an all-encompassing term used to describe internet-based applications designed to facilitate user interaction and to enable the collection and exchange user generated content
social networking the act of establishing social and relational
connections on and offline social networking sites websites and internet-based applications that facilitate
the social networking online non-users respondents of the survey tool used in this study who
indicated that they are not users of social media for their business
users respondents of the survey tool used in this study who
indicated that they are users of social media for their business
Web 2.0 part business revolution and part philosophy on
Internet development, design structure and use. Often characterized by traits like collective intelligence, hackability and its evolutionary nature
online/web shop type of on-trade business; includes all resellers who
strictly sell their wines via e-commerce wholesaler type of on-trade business; range in size and type and
may sell to consumers or Horeca businesses wine shop type of on-trade business; include businesses that sell
wine with a physical-location store or shop, may include exclusive wine products, or be a liquor, cheese or gourmet shop
word-of-mouth marketing unpaid marketing or promotion of products that results
from discussions or conversations among consumers regarding a product or service

Introduction | 1
I. INTRODUCTION “A bottle of wine begs to be shared; I have never met a miserly wine lover”
–Clifton Paul Fadiman For wine producers a bottle of wine represents a careful balance of nature’s harvest,
patience and passion. For wine drinkers, a bottle of wine may mean sharing in an
experience, unwinding from a long day or complimenting a well-cooked meal. But
before a carefully created, aged, distilled and bottled wine can make it into the glass
of a consumer it is the responsibility of wine resellers to bridge the connection from
the grape to the glass.
Wine resellers, or businesses in the on-trade market, are small, flexible and
attune to their customers’ needs and tastes. They are run by owner/managers who
juggle the various aspects of running and maintaining a business. They must strike a
delicate balance between offering a wide variety of products at a reasonable price for
their customers while maintaining profitable margins. Entrepreneurial
owner/managers are tasked with the challenge of navigating turbulent market
fluctuations and marketing their business in a way that proves profitable for their
business. In today’s highly saturated market and challenging economic times it is
becoming increasingly important for small to medium businesses in all industries to
distinguish themselves among their competitors in order to gain or maintain market
share—especially on-trade businesses in the Dutch wine market.
In a separate environment, seemingly inconsequential to the wine industry,
there is a major evolution taking place online. A shift in which online platforms and
applications are increasingly representative of a trend in service offerings,
information sharing, user behavior and user data collection culminating in
phenomena known as Web 2.0. This phenomenon is impacting the way individuals
connect, interact, exchange information, and individuals are impacting the organic
and ever-changing characteristics of the phenomena. The line between online and
offline is becoming blurred and the professional sphere and the personal sphere are
being merged. This phenomenon has many implications for businesses of all sizes
and simultaneously offers great opportunity and great challenge, especially for
SMEs. Individuals, customers, consumers and companies are using tools like social
networking sites alike in countless ways that present opportunity for marketers and
businesses to listen, engage, and respond with their target audiences. And it is here
that we begin to see how the challenges facing a wine reselling business intersect
with the opportunities and impacts of Web 2.0.

Introduction | 2
This paper seeks to explore this intersection point for further insight on
practical business applications and use of social networking tools in a business
environment. By researching the if, how, why and why not of social media use
among Dutch wine resellers, or on-trade businesses this research looks to answer,
To what extent are Dutch on-trade wine businesses using social media for their
business? An exploratory, nationally distributed, online survey was conducted to gain
further insight into this question.
The paper begins this exploration by first building a profile of Dutch on-trade
wine businesses to identify the characteristics of the businesses, their product and
their owner/managers. Then using this profile to demonstrate how these
characteristics impact the marketing behavior of these small to medium businesses.
Next, the paper places this profile in the context of Web 2.0 and an increasing trend
in marketing and communications toward relationship and word-of-mouth marketing.
This review of literature leads up to identifying the research questions guiding this
study.
Next, the methodology used to answer these research questions is outlined
and the results of the nationally distributed survey are presented. Finally, conclusions
and implications are discussed as well as the shortcomings of the study and
suggestions for further research.
Profiling On-Trade Wine Businesses | 3
II. PROFILING ON-TRADE WINE BUSINESSES
Introduction
With a central location in Europe, increasing wine consumption trends and a large
importing role in the global wine industry, The Netherlands’ complex wine market is
unlike other heavy wine-producing countries. Understanding the distribution channel
in the NL and the various businesses that move wine along the pipeline from
producer to consumer will lay the groundwork for exploring one segment of
businesses in the channel. This literature review relies on extensive bodies of
research in the areas of wine marketing, and small to medium enterprise (SME)
theories to build a profile of Dutch wine on-trade businesses. This will provide a
framework through which to explore the marketing and communication approaches
among them. The first section attempts to provide a structural understanding of the
complex Dutch Wine market as it currently functions. Then it outlines the various
subcategories of on-trade businesses, which are also small to medium and
microenterprises. After outlining the on-trade businesses and the market, it draws
from SME literature to explain the differentiating factors of SMEs from large firms and
using these to illustrate how they impact the marketing practices of SMEs. Lastly, it
uses e-business adoption models and competencies established in previous
research to better understand the factors influencing e-marketing adoption among
SMEs.
2.1 | The Dutch Wine Market
The size of the Netherlands (NL), its climate, and its proximity to old world wine hubs
like France, Italy and Spain, are major factors contributing to its status as a major
wine importing country. In 2008, the Netherlands held high ranks as the 6th largest
wine import market in the world at 420m liters (O.I.V., 2010). In order to be
considered an industry, the economic activity is often expected to involve the actual
production or manufacturing of goods (“industry”, Collins English Dictionary), and due
to the lack of major production of wine in the NL, the economic activity surrounding
wine products in the NL will be described throughout this research as a wine market.
Dutch wine consumption increased 7.1 liters per head from 1990 to 2007 and is
gradually increasing. It is clear that the Dutch affinity for wine is growing.
Unlike most wine-producing countries, and especially the US with a highly
regulated wine and spirits distribution system, the NL wine market is fragmented and
rather complex. In the US and in many other larger countries there is a three-tier

Profiling On-Trade Wine Businesses | 4
distribution system that is comprised of: producers, distributers and retailers.
Typically in this arrangement, with the exception of small but growing percentage of
direct wine sales, consumers purchase their wine from resellers who purchase wine
from distributers. However, the wine distribution channel in the NL is a more complex
in nature, and the market could be described at best as highly fragmented and
oversaturated. In the NL for example, you find a handful of large distributors, dozens
of agents who may sell on behalf of a producer or group of producers, and importers
who specialize in a particular region or varietal. In other words, instead of a slightly
cleaner three-tier distribution system like that of the US, there are dozens of ways a
wine can make its way from the vine, into a Dutch consumer’s glass. For example, a
consumer can purchase their wine in the supermarket, which may have imported the
wine itself or may have been supplied by a major distributer in the NL. Or, a
consumer can visit a specialty wine store in their village and purchase a product that
was purchased from a reseller who got it from a distributer. There are so many
variations in how you may sell wine and to whom along the distribution channel, and
businesses are not required to register all of their product offerings with the NL
Chamber of Commerce, or Kamer van Koophandle, this makes it difficult to even
quantify the number of businesses who sell wine at all levels of the channel. For
some insight, Productschap Wijn, the wine-market department associated with the
Dutch Chamber of Commerce, reports there are around 800 importers throughout the
country (Productschap Wijn, 2011). This complexity and variation in distribution
channels combined with the various opportunities for a consumer to purchase wine
yields an oversaturated market and high levels of competition among businesses that
sell wine. And, as with any highly saturated market, identifying sustainable
competitive advantage for every company becomes increasingly important in
maintaining or growing the business. This is especially true for businesses toward the
end of the distribution pipeline that sell to consumers or to the hospitality, restaurant
and cafes sector, which is generally referred to as Horeca (hotel, restaurant and
café) establishments. This group represents a broad range of businesses that can
be divided into subcategories.
It is important to differentiate how these businesses subdivided in the NL from
how other countries may divide them. In the US for example, they are divided into
two general groups: on-premise and off-premise (Thach, 2011). On-premise, or on-
trade, are all businesses where the wine is consumed at the location in which it is
sold. This includes bars, restaurants, clubs, hotels. Off-premise or off-trade is all
retail stores or shops where wine is sold and then consumed off the premise. In the
Netherlands however, large distributers group these categories differently. This

Profiling On-Trade Wine Businesses | 5
research regarding the Dutch wine market will rely on the categories as major
distributors in the country divide them; this approach was chosen in order to be more
comprehensive and consistent with industry structure and terms.
In the NL, off-trade retailers represent all supermarkets and some liquor
stores that are owned by a larger, supermarket parent company. For example, in the
Netherlands off-trade businesses include Albert Heijn and Gall & Gall, owned by
Ahold; and C1000. On-trade businesses represent virtually anything that is not off-
trade. This is a very broad group that can be further divided into the following
subcategories: wholesalers, wine shops, cash & carry, online shops, Horeca and
Christmas specialty. Typically, for large importers/distributers, on-trade customers
are characterized by smaller shipments, which are sold with much higher margins.
Whereas, off-trade customers yield large-quantity shipments on low margins; in other
words, the profit from off-trade customers lies in the volume of wine sold.
These businesses that sell wine to consumers and the Horeca sector, as
described above are summarized in Table 2.1.
Table 2.1: Dutch on and off-trade breakdown
Businesses That Sell Wine in NL Off-Trade On-Trade Supermarkets and chain liquor stores owned by large supermarket parent company
All other businesses that purchase wine from a distributer with the intent to resell
High Volume/Low Margin Low Volume/High Margin
2.2 | On-Trade Businesses in NL
Wine resellers, or “on-trade” wine businesses, represent the largest number
of individual (non-chain) businesses in the Dutch wine market, and together, they
represent one of the largest opportunities for large wine distributers to drive profit
from higher margins. Understanding the dynamics of these businesses and the
factors affecting their decision-making is vital to sales and marketing efforts of the
other firms along the distribution channel. In order to further explain the goals of this
research, it is important to profile these on-trade subcategories in more detail. These
categories are used to help group these business types. However, keeping in mind
that these are not exclusive descriptions and there are on-trade businesses that may
blur the lines between each category.
Profiling On-Trade Wine Businesses | 6
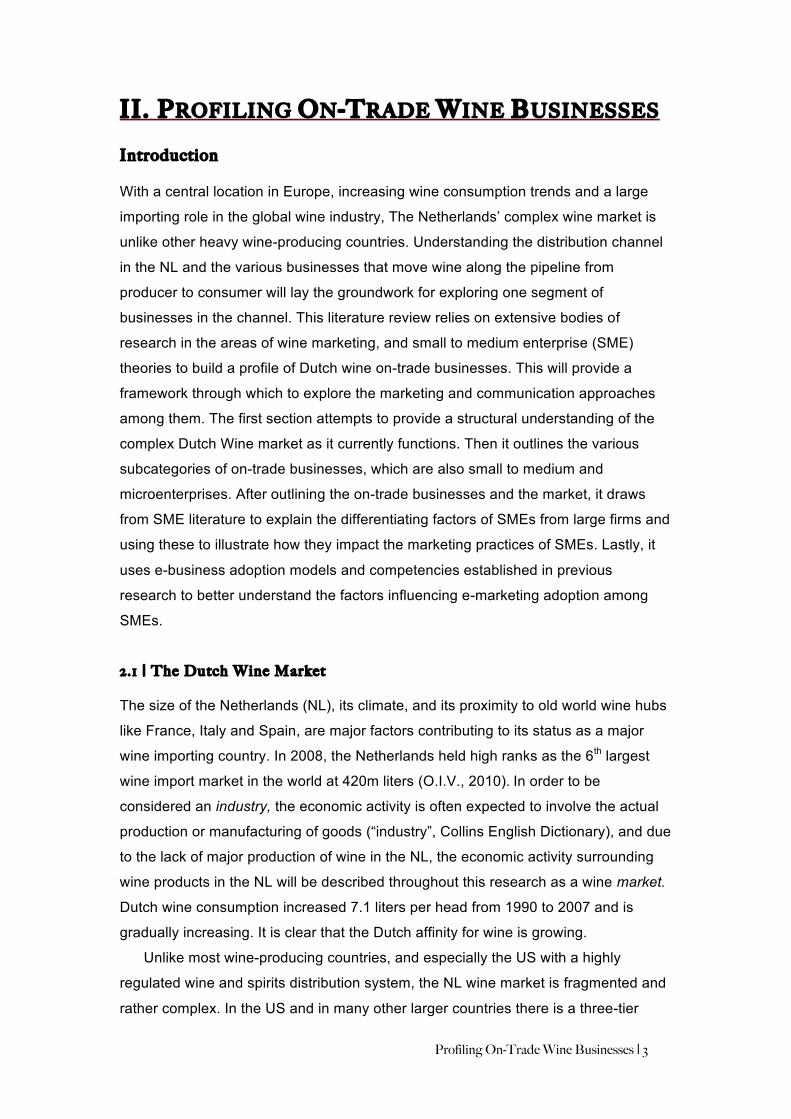
Wholesalers range in size and type and include individuals who have a
storage space and sell to regional customers like small specialty shops or Horeca
businesses. Decision makers in these businesses are also the ones directly selling
this wine to their customers, and over half of their customers are in the Horeca
industry.
Wine Shops include physical-location stores and shops sometimes with a
small staff, but more likely operated by one or two owner/managers. These can
range from a general liquor store or a specialty wine shop to a gourmet food shop
with a selection of wines. Like wholesalers, retail decision makers are often the
individuals directly selling to their customers, however in contrast; the majority of their
business is directly to consumers with some Horeca customers.
Cash & Carry businesses are a unique group of stores that could almost be
grouped with off-trade supermarkets. These are large stores that sell to the Horeca
industry or to individuals with a business-related membership. Makro and Hanos are
examples of a cash & carry in the Netherlands. The customer orientation depends on
the chain but they have a heavy focus on the Horeca. Decision makers in this
category are much like those in off-trade, they are buying managers who aim to
compete in pricing with supermarkets. For this reason, this group of businesses will
not be included in the discussion and results of this research.
Web Shops include all resellers who strictly sell their wines via e-commerce,
through a website or series of websites. This is a small but growing group of resellers
in the Netherlands and they focus their efforts on selling directly to the consumer.
The Horeca groups are often not strongly connected to large importers or
distributers in the Netherlands, however selling wines to some Horeca groups can
yield strong margins and recent market conditions of higher logistical costs and
economic downturns have impacted large importers’ willingness to conduct business
with this section of the industry. These groups are connected to a logistics partner
that supplies Horeca establishments with food products in addition to wine. Decision
makers in the Horeca groups that have relationships with large importers are usually
a few individuals who work with a group of restaurants or hotels and may or may not
own any Horeca business themselves.
Christmas Specialty businesses are a small group that sells wine or gift
baskets including wine products during holiday seasons throughout the year. Their
primary customers are other groups in the on-trade category and also corporations or
companies purchasing holiday hampers for employees. Decision makers for these
businesses are buyers who set price categories and seek wine products to fit within
these packages.
Profiling On-Trade Wine Businesses | 7
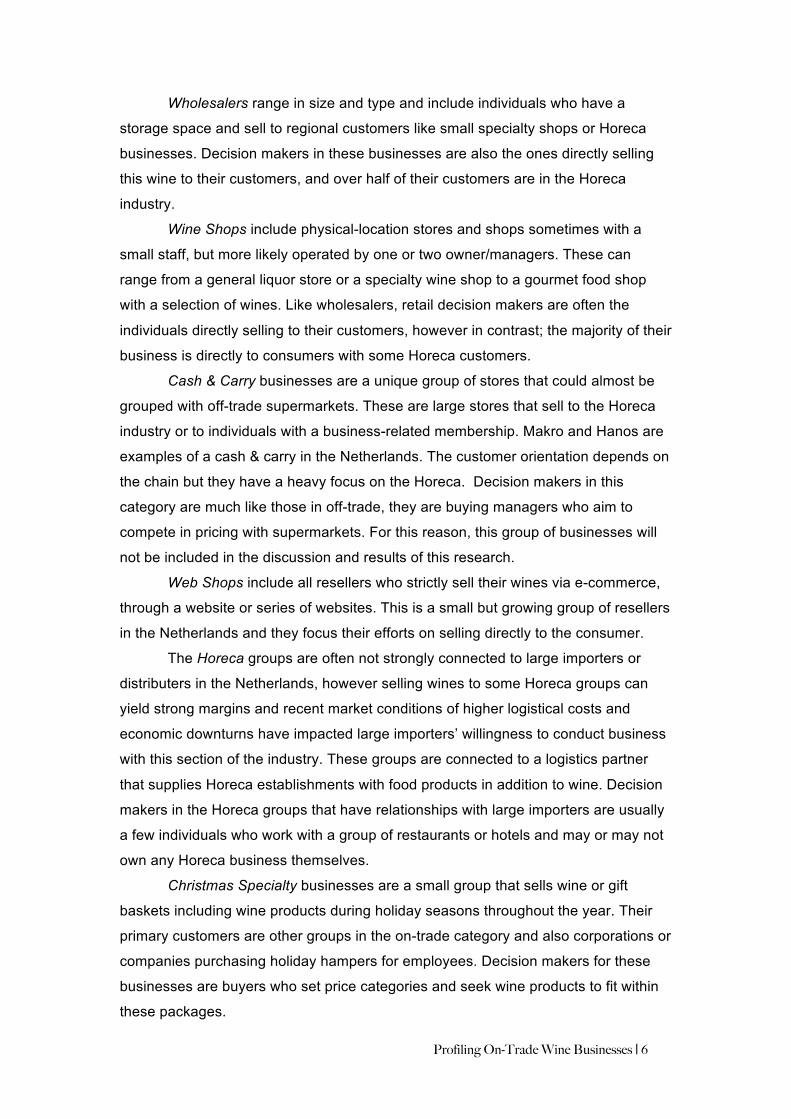
Figure 2.1 displays the different subcategories of Dutch On-Trade wine
businesses and their customer focus, as described above.
Figure 2.1: On-Trade Subcategories
Despite the variations in these on-trade businesses, the fundamentals of selling and
consuming wine greatly impact the marketing and communicating approaches they
take with their customers.
2 .3 | Marketing and Sell ing Wine
Before getting into the unique characteristics of selling and marketing wine and wine
brands, this discussion should begin with an understanding of marketing
fundamentals. Marketing is “Marketing is an organizational function and a set of
processes for creating, communicating, and delivering value to customers and for
managing customer relationships in ways that benefit the organization and its
stakeholders,” (American Marketing Association, n.d.).
The Dutch wine industry is highly fragmented (Arno, 2002) and
multidimensional, this presents various challenges to marketing practitioners and
wine business owners alike. Wine is a complex product category with a myriad of

Profiling On-Trade Wine Businesses | 8
products with a large number of criteria used to evaluate each one (Vrontis, 2011).
The dynamic set of cues for marketing wine includes extrinsic cues such as region,
label, price and brand, and intrinsic cues, which are attributes of the product like
aroma, alcohol content and taste (Cohen, 2009). In addition to these cues, there is
an added dimension of differentiation in vintage dated wines, meaning to some
consumers, a new year brings a new product. On top of these layers of complexity,
wine is unlike other packaged goods, in that there is virtually no brand loyalty among
consumers (Thach, Olsen & Wagner, 2011) making it even more challenging for
marketers in all levels of the distribution channel. And, unlike a strong wine-producing
country such as the US, France or Australia, the Netherlands is additionally unique
because virtually all wine products are imported, in fact, there are over 41,500
different wines from around the world available to Dutch consumers (Productschap
Wijn, 2011). Consider the challenge this presents to the average consumer, when
choosing a wine in such a saturated market.
Referring back to the Dutch wine distribution channel, marketing wines means
something different to each group in the pipeline. From the producer level, it is first
and foremost their responsibility to develop and identify marketing strategies for their
products. Not only is the producer responsible for developing and establishing this
strategy, but also it must then be explicitly communicated down the distribution chain
in order to be successful. This involves importers, distributers, suppliers, resellers
and retailers. Ultimately, as Thach (2011) explains, it is the marketing strategy—
developed at the producer level and consistently communicated at each stage of the
channel that will result in the success of that brand. This leaves an interesting
responsibility on the shoulders of the end stages of the distribution pipeline, the on-
trade businesses that place the products in the hands of consumers or the Horeca.
Consider that each business in the on-trade category as previously described,
has anywhere from a dozen to a few hundred wines on their shelf, in their menu or in
their portfolio. In most cases, each of these wines comes with a marketing strategy
unique to that brand, region, producer, varietal or vintage. Here, from the perspective
of a reseller it is not only important for them to distinguish their portfolio of wines from
others’ but they must also distinguish their business from local or regional
competitors. Put differently, marketing wine from the producer level is about
distinguishing each product or brand from other products and brands in the market.
Marketing at the retailer level is about selling wines to meet customer preferences
and needs, meanwhile distinguishing their wine portfolio, their business or their wine
buying experience from their competitors’. As a result, it is in their best interest to
develop any value-added characteristics in the minds of consumers wherever or
Profiling On-Trade Wine Businesses | 9
however possible. This may take the form of business strategies that are: customer
relationship-oriented, specialized in a particular wine category or region, or concept
stores selling wines by occasion for example. Whatever the approach, this multi-
dimensional need to distinguish ones business and products from competitors’
serves as a breeding ground for innovative marketing and communication strategies.
Types of Wine Consumer
While the focus of this research is not on consumer behavior and motivations for
wine buying, consumer segmentation is on the periphery of understanding the target
audiences of on-trade businesses. Understanding the target audiences of these
businesses provides insight to what drives their communication efforts.
Previous researchers have identified various ways to segment wine consumer
groups. One-way of segmenting audiences, is by their level of involvement with the
product (Lockshin & Spawton, 1997). As Thach (2011) illustrates in her discussion on
market research, wine drinkers can be segmented according to their level of
involvement into the following three groups: Connoisseurs who are highly involved
with wine and enjoy learning about it; Aspirational Drinkers who feel that wine suits
their self image; and Beverage Drinkers who see wine as a beverage and have little
to no involvement with their product choices. Another way of segmenting wine
drinkers is by their motivation to drink wine based on the occasion. Questar and
Smart (1998) identified five categories based on motivations, which include: Social
Wine Drinkers, Image-Oriented Wine Drinkers, Ritual-Oriented Wine Drinkers,
Premium Wine Drinkers and Basic Weekend Wine Drinkers. Wine consumers have
also been segmented into groups according to their shopping behaviors (Wines &
Vines, 2008). Some groups included in this segmentation are: Enthusiasts, those
who enjoy shopping for and researching wines; Savvy Shoppers who are those
purchasing based on discounts or promotions; and Overwhelmed Shoppers who find
it difficult to navigate the numbers of product offerings, and seek guidance from
others. We see that these different approaches to segmenting wine consumers do
contain some overlap. Additionally, these segmentations are general ways of
segmenting wine consumers and are used as a point of reference for Dutch wine
consumers’ behavior.
Traditional Wine Marketing Tactics
There are various traditional approaches that on-trade establishments use to sell
wines to their customers, whether they are end-consumers or businesses in the

Profiling On-Trade Wine Businesses | 10
Horeca industry. Some of the more traditional approaches include: discounts and
promotions, store layout, point-of-sale (POS) and shelf-talkers, in-store tasting,
private tasting parties, personal sommelier services and educational seminars.
Discounts and promotions; or in the Netherlands, price-offs, are used by
virtually all types of on-trade establishments. Simply put, they reduce the price of a
product with the goal of selling more or reducing inventory. These come in various
forms depending on the business but can range in a percentage-off discount or a
“buy one get one free” deal.
Retailers with brick-and-mortar shops selling directly to the consumer often
pay great attention to detail in their store layout. It is established in-store practice
reflects that more wine is sold if it is placed on a separate stand or at the end of an
aisle (Thach, 2011). Also, products placed at floor level do not get the same level of
attention as those placed at eye-level. These details in the placement of wines are
used as a way to feature products and to increase awareness among store’s foot
traffic.
Point-of-sale (POS) also referred to as ‘shelf-talkers’, like neck hangers on
wine bottles are more characteristic of off-trade businesses, but larger wine shops
also use them to gain attention and distinguish one product from others on the shelf.
The POS tactics are typically provided by the wine producer or distributor and are at
the discretion of the shop-owner to use.
In-store tastings, private tasting parties and educational seminars are
common tactics used by retailers targeting end-consumers. This approach generates
interest in wine and allows the customer to get acquainted with the product before
committing to the purchase. In addition to selling wine, these tastings can generate
buzz around specific products, regions or varietals of wine. This approach is also
used among on-trade businesses targeting the Horeca industry; though with a
slightly different approach of bringing the wines to the prospective customer to pitch
new products.
Finally, higher-end resellers may offer personal sommelier services to their
customers. This tactic is employed when retailers have wine-collector customers, or
those who are passionate about
wines and adding new wines to
their collection. Offering this type
of service positions the on-trade
establishment or sales person as
a personal advisor, to their

Profiling On-Trade Wine Businesses | 11
customers further strengthening the trust and customer relationship. Furthermore,
positioning the owner as a thought leader or well-respected wine advisor enables the
bu siness to develop additional marketing tactics from a “Owner’s Choice” or “Hand-
picked by…” perspective.
Offering a personal sommelier service or similar offerings for customers of an
on-trade business is perhaps one of the biggest areas of opportunity for adoption of
social media and other online marketing tools. These tools enable on-trade
owner/managers to communicate show their value to their immediate network and
also peripheral network.
2.4 | On-Trade Firms as SMEs
Classifying a business as a “small” business or as a small to medium-sized
enterprise (SME) varies depending various factors including the country and industry
of the business. This research will rely on the European Union definition of a small
business which is one that employs less than fifty people (Enterprise and Industry,
2003). The majority of these small businesses are actually companies that employ
less than ten people; which are classed as a “micro” businesses (Enterprise and
Industry, 2003) or microenterprises. It is important to mention that microenterprises
dominate the population of small firms (Fillis, Johannson & Wagner, 2004), and
typically, research focusing on these businesses has a high likelihood of larger
proportion being microenterprise-focused (Storey, 1997; Gummesson, 2002). This is
particularly true for wine selling, on-trade businesses, many of which employ less
than ten people. Though, due to their vast numbers and various classifications, it is
difficult to quantify what portion of Dutch wine on-trade businesses fall into which of
these categories, as a result, the on-trade wine businesses which are the focus of
this research will be more generally referred to as SMEs.
Traditional economists from the early 1990’s present skepticism of the overall
economic value or impact of SMEs, even going so far as to disregard them in
conventional economic studies (Julien, 1993). But Julien proposed that despite being
overlooked by many economists, small firms would increasingly take on a more
important economic role, breaching a new equilibrium between small and large firms.
This is congruent with recent literature regarding innovation theories, which cites that
due to their high flexibility, fluidity and efficient decision-making, small firms and
project-based organizations are better equipped to navigate highly turbulent and
rapidly changing environments that we see today (Küng, 2008). Considering that the
vast majority of on-trade businesses in the Netherlands are SMEs, when combined,

Profiling On-Trade Wine Businesses | 12
they have an arguably, a stronger impact on the national industry than that of large
firms.
Julien (1993) also argues that SMEs must be studied separately from big
firms, citing that in comparison to larger firms SMEs have: “…a strong concentration of management with typically relatively intuitive strategies giving them a quick and effective decision-making process; second, a low specialization of production factors; and third, less formalized internal (with no or few hierarchical levels) and external information systems (the external system being based on very direct consumer relations, with fast reactions to new or changing wishes).” (Julien, 1990 as cited in Julien,1993).
Understanding these differences and how they impact the way SMEs conduct
business is a necessary component to developing exploratory research on the
adoption of social media among SMEs like Dutch wine on-trade business. Drawing a
connection between the differentiating characteristics of SMEs, the importance and
proximity of customer relationships reveals the area of opportunity for SMEs to adopt
social media marketing practices.
Differentiators of SMEs
SMEs are distinguishable from large firms in many ways lending to a vast body of
research unto their own. Literature from various fields of economic, management and
marketing theories regarding SMEs has revealed various differentiating
characteristics. These include differentiation from larger firms with regard to the
nature of ownership-management and their entrepreneurial characteristics (Fillis,
Johannson & Wagner, 2004; Thrassou & Vrontis 2006; Julien, 1993; Alvarez &
Busenitz, 2001; Longenecker, Moore, & Petty, 2003), the availability of their
resources (Carson, 1985; Weinrauch, Man, Robinson & Pharr, 1991) and their
customers.
SMEs have varying levels of entrepreneurial nature, some affecting their
business strategies and market orientation more than others. Some scholars
(McGowan, Durkin, Allen, Dougan & Nixon, 2001) more narrowly describe SMEs with
slight differentiation based on their orientation toward entrepreneurship, these are
called entrepreneurial small firms (ESFs). ESFs and SMEs have much in common
but have a distinguished difference in that ESFs are, “committed to growth as a
fundamental strategic aim,” (McGowan et al., 2001, p. 127). Whatever the level of
entrepreneurial, strategic orientation, SMEs are typically run by the entrepreneur who
started the business. An entrepreneur is defined as “one who organizes, manages
and assumes the risks of a business or enterprise,” (“entrepreneur”, Merriam-

Profiling On-Trade Wine Businesses | 13
Webster Dictionary). Thus, by their very nature, SMEs enter a market with ownership
or management that possess an ability to bring new ideas or creating new
opportunities within the market. In this way, the managerial characteristics of a
microenterprise are such that the owner/manager of the establishment, often the
entrepreneur, is the one who controls the business strategy and future direction of
the business (Fillis et al.. 2004). With a limited number of staff, this individual is likely
to hold various roles and responsibilities in addition to being the owner/manager.
Unlike a large firm where an individual will hold a single role that is reflective of their
specialized skills or expertise, the owner/manager and other personnel operating in a
SME likely hold several roles across various aspects of the business. This requires
the owner/manager to possess a more heterogeneous skill set, this is also
characteristic of many entrepreneurs. In an on-trade setting this may mean the
owner/manager has wine knowledge and has learned business administration skills
and marketing skills through owning a business. Or, it could mean that an
owner/manager is trained in business administration but is passionate about wine
products.
In addition to limited human resources, small firms are also characterized by
their limited financial resources. Small businesses tend to have geographic
concentration of customers with whom they do business (Curran & Blackburn, 1990).
This is characteristic of most on-trade wine businesses in the NL with the exception
of those that operate an online shop, which enables customer access without
geographical constraints. This geographical focus consequently ties these SME’s
revenue to the local economic fluctuations, and again, having limited resources to
compensate in the case of a downturn (Storey, 1982). Being at the mercy of local
economies is a major contributing factor to the high closure rates of small firms in
comparison to large firms. Two-thirds of small firms close within ten years of opening,
also due to dependence on a small customer base (Zotanos and Anderson, 2004).
With these odds, it is vital that any SME wishing to survive in their market must
maintain a strategic advantage wherever possible.
McGowan et al. (2001) propose that small businesses whose market-
orientation is based on building and maintaining relationships are equipped with a
strong strategic advantage. Furthermore, the relationship between an entrepreneur
and their customer is invaluable to the firm’s innovation activities (Ravald and
Gronroos, 1996). A study on SME owner/manager by O’Donnell and Cummins
(1999) found that informal socializing at trade events is where most networking
between SMEs and their competitors occurs. In their research, SME
owner/managers acknowledge and recognize the importance of developing personal

Profiling On-Trade Wine Businesses | 14
relationships, and that personal interaction and regular contact are key facilitators of
these relationships. As a result, SMEs often rely on social interaction and personal
networks to develop trust and credibility among their networks. This socializing and
trust enables the owner/manager to maintain market awareness both via their close
interaction with customers, and with their competitors.
This body of research demonstrates the difference in behavior and
capabilities of small firms compared to those of large firms. These distinguishing
characteristics of SMEs also have a culminating impact on their marketing and
communication efforts.
Marketing for SMEs
It has been widely criticized that the marketing, or non-marketing practices of small
firms greatly differs from those of larger firms. Coviello, Brodie and Munro (2000)
found that the types of marketing practiced by both large and small firms (e.g.
transactional, networking, database and interaction marketing) are fundamentally the
same. Yet, despite the fundamentally similar marketing approaches, they maintain
that managers should consider the relevance of marketing performance measures to
their particular firm, rather than adopt formal, large firm tools and that marketing in
small firms must be viewed with a more contemporary perspective.
If using the 4P’s of marketing introduced by McCarthy in 1960: product,
placement, pricing and promotion as a framework for measuring microenterprise
marketing performance, it is no question why there is much criticism of SME
marketing efforts. These 4P’s draw upon resources that are limited to SMEs
(Weinrauch et al., 1991) and these resource limitations put constraints on the
marketing capabilities and activities of small firms. This invariably results in marketing
efforts that are uniquely fitted to the small firm, its customers and its products. Vrontis
(2011) affirms this by explaining that due to limited resources, SMEs require a
marketing strategy, or marketing practices that are geared toward the capabilities of
the firm rather than the other way around. And Carson, Cromie, McGowan and Hill
(1995) described these constraints as leading to marketing practices that are
reflective of the owner-managers experience and the firm’s needs and evolve over
time.
Zotanos and Anderson (2004) also explain how the 4P’s; arguably archaic 4
even for large firms, are not applicable to small firms citing that the entrepreneurs
who own-manage these small firms prefer interactive marketing approaches. They
proceed to articulate the interconnectedness of relationship marketing and

Profiling On-Trade Wine Businesses | 15
entrepreneurial networking. Entrepreneurs specialize in, and have stronger
preference toward personal interaction and customer contact rather than mass media
marketing tactics (Day, Dean & Reynolds, 1998). Naturally then, they orient
themselves toward customer relationships that involve contact and conversations,
thus enabling them to respond to customer needs and wants accordingly (Carter &
Jones-Evans, 2000). And given the high level of adaptability and responsiveness of
relationship marketing, it can be seen as a vital aspect of entrepreneurship (Zotanos
& Anderson, 2004). Due to the importance of relationships to SMEs it follows that
SMEs would organically take on a relationship-marketing orientation. Relationship
marketing is addressed in more detail in the following chapter.
SME Adoption of E-Business Strategies
The vast body of SME-focused research combined with the rapidly evolving
technological environment over the last two decades has led to an additional series
of studies exploring and developing conceptual models for the adoption of Internet
business strategies among SMEs (McGowan et al., 2001; Fillis et al., 2004; Martin &
Matlay, 2001; Broderick, Dhaliwal & Jutla, 2002; Jones, Hecker & Holland, 2003;
Simpson & Docherty, 2004). Much of this literature is focused on the adoption of e-
commerce models or e-business communication tools including websites, emails and
intranets. However at the core, these studies explore the factors influencing a small
firms’ ability, likelihood, or attitude toward conducting some aspect of their business,
online. Therefore literature surrounding the adoption of other internet-based business
models or strategies, including e-commerce and e-marketing, offers some insight into
the factors influencing the adoption of social media as a communication tool for small
firms.
Some researchers have identified various core competencies affecting the
adoption of e-business or Internet business strategies among SMEs (Poon &
Swatman, 1999; Fillis et al., 2004; Martin & Matlay, 2003; McGowan et al., 2001 and
Slater & Narver, 1995). One of the key competencies necessary for e-business and
e-commerce adoption among SMEs as outlined by these scholars is knowledge of
the medium. Rogers (1995) expands this competency to needing of a knowledge
base of the medium that extends beyond a general awareness of the perceived
benefits. Drawing from Jones et al.’s (2003) first stage of web-based commerce
adoption, the general awareness of perceived benefits of a medium can stem from
the buzz surrounding the medium.

Profiling On-Trade Wine Businesses | 16
This is particularly applicable to social media and Web 2.0 and their rapidly
growing popularity in both the personal and professional spheres. Rogers (1995) also
argues that general practical implementation “how to” and “principles” knowledge is
required. This knowledge is also applicable to social media, especially social
networking sites that are often independently adopted for personal use before the
owner/manager uses the tools for their business. Therefore, one may assume;
especially since the Netherlands is ranked number one in the world in penetration for
Twitter and Linkedin (ComScore Inc., 2010) that in most owner/managers of Dutch
wine on-trade businesses are already equipped with this basic general knowledge
that Rogers (1995) describes. But are they using their personal accounts to benefit
their business?
Additionally, Jones et al. (2003) notes that this knowledge also may reduce
the possibility of misuse in the professional sphere. In the case of social media,
personal use and professional use present distinctly different approaches in some
aspects, mostly regarding the use of these tools for marketing purposes. Put
differently, these owner/managers may have basic knowledge of how to utilize
Facebook to keep in touch with their friends and family, but they may not intuitively
know how to use Facebook to stimulate customer interaction and influence
purchasing behavior. When viewed this way, it could present a common
misconception from an entrepreneur’s perspective, and therefore resulting in low
long-term adoption rates, that they already possess this basic “how to” knowledge,
when really they may lack the strategic, marketing-minded tools necessary to utilize
social media to benefit their business.
An additional key competency influencing e-business adoption as listed by
Fillis et al. (2004) is the ability of the business to envision the usefulness of the new
medium. This is slightly intertwined with the buzz or hype surrounding the new
medium and in the case of social media this arguably creates a dual-level of vision of
usefulness. On one level, the buzz surrounding the new medium may be
communicated through other entrepreneurs’ or owner/managers’ success and use of
social media for their business, which may or may not have the same market
orientation, or even be in the same industry. This presents another opportunity for
disconnect in the mind of the owner/manager-adopter and result in a “bandwagon”
effect, where everyone joins, but does not develop a strategy or have an established
direction in mind. Without a vision for what success may look like, those
owner/managers who adopt under these circumstances may lose enthusiasm or lack
drive to integrate the tools into their business.

Profiling On-Trade Wine Businesses | 17
The second level of envisage of usefulness stems from the more inherent,
psychological nature of entrepreneur in identifying an opportunity and adapting
market orientation accordingly (Slater and Narver, 1995). This is a more complex
layer which presents a stronger promise for successful adoption of new media
because this vision of usefulness extends beyond the hype, to a direct perceived
benefit and role within that entrepreneur’s own business.
And lastly, the adoption of the Internet into a business strategy is often based
on the interest and ideas of the entrepreneurial owner-manager (Martin & Matlay,
2003; Quinton & Harridge-March, 2006). In other words, an additional core
competency important in the adoption of Internet business practices is sheer interest
in the medium.
Web 2.0 & Marketing Opportunities | 18
III. WEB 2.0 & MARKETING OPPORTUNITIES
Introduction
Scholars and professionals from various backgrounds and industries agree, the
characteristics of websites, user behavior and internet platforms have shifted and are
shifting (O’Reilly, 2005; Anderson & Wolff, 2010; Thach, 2009). A buzz term, used to
describe everything from user behavior to website characteristics, Web 2.0 is a way
to generally characterize the changing trends in online behavior, business models
and platforms. Web 2.0 websites, platforms or online services are often characterized
by their interactivity, their ability to “harness the collective intelligence”, and to collect
and control rich pools of data about their users (O’Reilly, 2005). With these Web 2.0
changes have come a range of social and economic implications for individuals,
businesses and developers and have had a major impact on how, when and to
whom marketing communications are targeted.
This chapter takes a closer look at new media technologies and their social
consequences as well as the characteristics of Web 2.0 and social networking sites.
Then examines how these characteristics have impacted marketing and
communications practices of all companies, while focusing on the areas of word-of-
mouth and relationship marketing. Then leads to the research questions guiding this
research.
3.1 | New Media Technologies
Early new media research often took the technological deterministic perspective that
information communication technologies (ICTs) drive user behavior and social
change (Lievrouw & Livingstone, 2006). However as ITCs have evolved, so have
their characteristics, their features and their users. Considering that a key pinnacle of
Web 2.0 as identified by O’Reilly (2005) is its hackability, or openness to user
manipulations, improvements and adjustments; and its trust in users as co-
developers, we have seen that the technologies themselves have become more
open to being shaped and expanded by their users. In this way, so too have research
perspectives on ICTs that now air more to the side of social shaping theories (SST)
that the users continuously drive technological adaptations and changes (Lievrouw &
Livingstone, 2006). Without getting into a cyclical discussion over which influences
which and in what order, it is undeniable that these phenomena are becoming

Web 2.0 & Marketing Opportunities | 19
increasingly interrelated and technologies are impacting individuals and businesses,
who are in turn impacting the technologies.
Lievrouw and Livingstone (2006) discuss the various social consequences of
new media technologies available today; for example, the level of interactivity
available. In contrast to traditional mass media, new media offer a means to
selectively seek, generate and share information and interact with others in a way
that was not possible before.
Another characteristic of ICTs with a great social impact is their ubiquity. As
Lievrouw and Livingstone explain, not all members of a society may use new media
technologies, but they do impact everyone in the societies in which they are
integrated. This is especially true for the Netherlands and social media, as 53% of
the Dutch population in 2011 reported they had been active on a social network site
in the previous three months (New Media Trend Watch, 2012). It is ranked first in the
world for penetration of major networks Twitter and LinkedIn (ComScore, 2011).
Also, in 2011 80% of internet users in the Netherlands purchased goods online (New
Media Trend Watch, 2012). These statistics indicate that even if these users are not
using these tools in connection with their wine purchases, there is a pool of wine
consumers interacting online waiting to be tapped into.
Web 2.0
Tim O’Reilly who coined the term “Web 2.0” (2005) to encapsulate the evolution of
the World Wide Web, described it as a core of characteristics reflective of this new
wave of interactivity, accessibility and information-based Internet. Further defining
Web 2.0 seems to be a bit of a challenge for academics and practitioners alike, there
are many variations and perspectives on what it exactly encompasses. Despite the
complexity and variety of Web 2.0 definitions, there were even scholars diving into a
Web 3.0 definition as early as 2006 (Wahlster, Schwarzkopf, Sauermann, Roth-
Berghofer, Pfalzgraf, Kiesel, Heckmann, et al., 2006). Nevertheless, Web 2.0
definitions have been more thoroughly explored in both academic and practitioner
discourse, as a result this research relies more on the term Web 2.0.
As a testament to the complex and broad generalized use of the “Web 2.0”
concept, O’Reilly made an effort to establish a compact definition of Web 2.0 in a
blog post aptly titled “Web 2.0 Compact Definition: Trying Again”; it reads:
“Web 2.0 is the business revolution in the computer industry caused
by the move to the Internet as platform and an attempt to
understand the rules for success on that new platform. Chief among

Web 2.0 & Marketing Opportunities | 20
those rules is this: Build applications that harness network effects to
get better the more people use them. (this is what I’ve elsewhere
called ‘harnessing collective intelligence’),” (O’Reilly, 2006).
O’Reilly (2005) explains that Web 2.0 companies/platforms/applications are
characterized by their interactivity, their ability to “harness the collective intelligence”,
and to collect and control rich pools of data about their users. Mrkwicka, Kiessling
and Kolbe (2009) lists interactivity and integration as pivotal functions of 2.0
technologies. Castelluccio (2008) and Beer and Burrows (2010) mention the
dependence on user created content and user participation and collaboration as
defining characteristics. Segaran (2007) explains that, “building new conclusions
from independent contributors” (p. 2) is the core concept of collective intelligence,
and of Web 2.0. And Alexander and Levine (2008) discuss the findability of
information across platforms and applications as a key characteristic. This further
contributes to the concept of collective intelligence and networked information by
enabling the collection of many elements of microcontent related to a single subject,
issue, product or user to yield insight.
These definitions attempt to pin down or identify key characteristics of a
concept that is evolutionary and organic, making Web 2.0 by nature—difficult to
create a fixed definition. In an effort to provide a more tangible and concrete
definition, Högg, Meckel, Stanoevska, Slabeva & Martignoni (2006) conducted case
studies on 40 different Web 2.0 applications to find commonalities and components
among them. In aggregating their findings, they ultimately define Web 2.0 as, “the
philosophy of mutually maximizing collective intelligence and added value for each
participant by formalized and dynamic information sharing and creation,” (p. 12), and
further describe it as a philosophy on information management. They also define
collective intelligence as, “the interactive exchange of information and the continuous
development and maintenance of a group opinion,” (p. 13) which can result in the
formation of generally accepted content or group opinions.
While there are many singing the praises of this new wave of collaboration,
co-creation and interactivity, some scholars take a more critical perspective on Web
2.0 phenomena and characteristics. As Van Dijk and Nieborg (2009) demonstrate,
the hype and buzzwords associated with Web 2.0 are increasingly reminiscent of
revolutionary or counter-culture language, they describe this as manifesto rhetoric.
Ultimately they unravel these buzz words and the assumptions associated with Web
2.0 and call for practitioners and academics alike to be more critical of manifesto
rhetoric and dig for a deeper more evaluative understanding of the implications of

Web 2.0 & Marketing Opportunities | 21
Web 2.0 in business, personal and economic spheres. One assumption they identify
is that of “co-creation” and user participation, they illustrate that in fact, not all users
are participating equally. This is congruent with an earlier theory called the
“participation inequality rule” or the “90-9-1” rule (Nielsen, 2006). The theory states
that online participation follows a rule that 90% of online users are lurkers or users
who observe and absorb online content but do not contribute, 9% are intermittent
contributors who participate and contribute occasionally and only 1% are heavy
contributors to online content generation and account for most contributions. Due to
the highly turbulent online environment and widely available portable devices like
smart phones and tablets, this percentage distribution may a bit strong, out dated
and reflective of the ubiquity and accessibility of Web 2.0 applications in 2006.
However recent research reflects, less slanted but similar distribution. Forrester
research on American consumers created six levels of user participation on a scale
from ‘inactives’ to ‘actual creators’ (Li, 2007). Here the distribution is more of a 50-30-
13 distribution where 52% are inactive, 33% are passive and 13 percent actually
create content. While at the time of conducting this research, the author is unable to
find any data reflective of 2011-2012 distribution of participation, this gradual, but
distinctly more evenly-distributed level of participation in comparison to research from
2006 suggests movement toward a more equal and collaborative Web 2.0
environment. This also would not be surprising due to the increasingly low entry
barriers to platforms, applications and devices that enable access to participatory
applications and user generated content-driven sites.
Much of the discourse surrounding Web 2.0 phenomena is viewed,
researched or discussed from the perspective of the user, user participation or from
the implications on users, however more recent studies exploring the impact of these
technologies on business models. Lim, Trimi and Lee (2010) list improved decision
cycle times, innovation and organizational effectiveness as reasons why companies
are deploying social networking and other Web 2.0 technologies. They articulate that
these technologies allow a consumer to simultaneously also be a producer, and for
this reason the historical perceptions on clearly defined roles between producers and
consumers can no longer be used to analyze value chains.
In their study on the implications of Web 2.0 on business model types, Wirtz,
Schilke and Ullrich (2010) call attention to the lack of literature that includes a
systematic analysis of Web 2.0 characteristics and trends for business use, despite
the high value this could offer to Internet-oriented businesses. As a result, they take a
different approach to defining Web 2.0 by proposing four broad, fundamental factors
of the Web 2.0 phenomenon. These factors are social networking; interaction

Web 2.0 & Marketing Opportunities | 22
orientation; personalization/customization and user-added value. They then further
define these factors by describing key sub-factors. Not all of these are relevant to this
research however, their description of social networking and interaction orientation
offer some further insight to the Web 2.0 phenomena from a business’ perspective.
Their study found that social networking was the most important Web 2.0 factor to
managers of Internet companies, with managers mentioning that social networking is
no longer a “fun tool” but rather an instrument for business networking. Their
exploratory study calls our attention to the characteristics, growing popularity and
increasing ubiquity of social networking sites.
Social Networking Sites
Social networking sites like Facebook, Twitter and Linkedin exemplify the Web 2.0
principles as previously described in many ways including their seemingly
exponential room for adaptation and development, collection of massive pools of
user data, and open-source features. Before going further, it is important to define
and distinguish the difference between the terms social media, social networking,
and social networking sites, as it is easy to use these interchangeably and may result
in lack of clarity.
Social Media is an all-encompassing term that describes, “a group of Internet-
based applications that build on the ideological and technological foundations of Web
2.0, and that allow the creation and exchange of user generated content” (Kaplan &
Haenlein, 2010). Social networking is the act of establishing social and relational
connections both online and offline. And social networking sites (SNS)1 are websites,
applications or platforms that facilitate the act of social networking online. The
characteristics and ubiquity of social media have major implications in both the
personal sphere and professional sphere. In the personal sphere, they enable
people to reach out to old friends, connect with colleagues, share their wedding
pictures, or find the best café in town. In the professional sphere, social media enable
the expansion of recruitment horizons; and facilitate customer relationship nurturing
and gathering consumer behavior information. Online communities connected across
social networking platforms, serve as forums for exchanging ideas and thoughts
(Hennig-Tharau et al., 2009). Continued mainstream acceptance and adoption in
1 boyd and Ellison (2007) articulate a difference between social network sites and social networking sites, in that they are used primarily to display one’s social network, not to initiate new relationships. For the purposes of this study, these sites will be referred to social networking sites because in the context of business use, they are being used for both initiating new relationships and displaying social connections.

Web 2.0 & Marketing Opportunities | 23
both personal and professional sphere has led social networking sites to the spotlight
of both practitioner and academic research.
In their previously mentioned study on Web 2.0 and business model types,
Wirtz et al. (2010) describe social networking as structures of human online
interactions with services, which aim at connecting friends, or assessing products
and services. The sub-factors they identify are four trends associated with social
networking, which are: social identity, social trust, virtual word-of-mouth (also known
as electronic word-of-mouth, discussed later in this chapter) and increased consumer
power. The concept of interaction orientation, derived from prior study by Rayport,
Jaworski and Kyung (2005) is related to the ability of a firm to effectively manage
increased customer demands for dialogue between customer and firm. The four sub-
factors of interaction orientation they identify are: customer centricity, interaction
configuration, customer response and cooperative value generation. In interviewing
managers of Internet companies, one interviewee stated:
“Social networks have become crucial tools to stay in touch on the Web
2.0. Using those social networks, Internet users connect to other
people in fundamentally different and more intensive ways,” (p. 281).
One way of illustrating these “fundamentally different and more intensive ways” is by
examining how SNS are increasingly moving in a direction in which they are the
portal to connecting with various other applications. What this means, is if a user
wants to get involved in a new social network, they were often given the option to
build that network on top of an existing network, typically from Facebook. For
example, if a user wants to join the CouchSurfing network (couchsurfing.com), a
network of travelers, or “surfers”, and hosts offering their spare beds and couches to
fellow travelers, the user must first create an account. When the user visits
couchsurfing.com, they are given the option to either register with their existing
Facebook account or to create a new account independently. The former option
automatically extends their network of social relationships on one platform,
Facebook, to a new platform, CouchSurfing. This is generally more appealing to the
user because it enables them to build a network on existing relationships rather than
starting from scratch, it also saves time for the user.
This screenshot from major wine-specific social network, Snooth
(snooth.com) illustrates how easy it is for a user to build their wine social network, on
top of their existing Facebook social network. In this way, social networks are
increasingly becoming intertwined and expansive across users’ interests, whether

Web 2.0 & Marketing Opportunities | 24
those be in meeting others while traveling abroad, or sharing their thoughts on the
wines they taste.
3.2 | Marketing in a Web 2.0 environment
Social networking sites are increasingly serving dual purposes of platforms for social
facilitation on one hand and tools geared for marketers to reach narrowly defined
target audiences thus generating revenue for the platform. The mainstream adoption
of social networking sites have had a major impact on the way consumers interact,
evaluate and understand the brands, products and services in their daily lives. Social
networking sites like Facebook and Twitter enable businesses to connect with
individuals and groups of customers on an individualized level. Another way of
describing their marketing value is that they display consumer intentions (Casteleyn,
Mottart and Rutten, 2009). They also provide marketers insight into consumers’
preferences, allegiances, recommendations and conversations surrounding products
and services (Cuddeford-Jones, 2009). On the one hand, these characteristics
position social networking sites as a new tool for a marketer’s toolbox. On the other
hand, at an areal view, an undeterminable number of nodes in an online network and
various communities and information pools associated with just one brand is almost
as overwhelming as the classic pondering-question “How big is outer space?”. And
one major challenge facing marketers in this data-rich environment, is how to extract
meaningful insights into consumer behavior from activities and communications
generated in online communities (Henning-Thurau et al., 2010).
This has major implications on the marketing practices of companies and
organizations in any industry or market. The important role of social media tools

Web 2.0 & Marketing Opportunities | 25
available to marketers and consumers calls for marketers to reconsider how, when,
what and where to communicate with their target audiences (Wakolbinger, Denk &
Obrecker, 2009). The transformation in marketing communications has, and will
continue to result in, a vastly different approach to connecting and communicating
with consumers and brands (Mulhern, 2009). A pool of scholars and professionals
agree that with the technological developments and distinct changes in user behavior
online, personal, long-term business-to-consumer (B2C) relationships are key to
marketing online and in a Web 2.0 era (Eastlick, Lotz & Warrington, 2006). Building
an online professional community upon a preexisting offline community enables a
business to expand its reach through relationships (Andersen, 2005). Similarly,
Daugherty, Eastin and Bright (2008) stated that the key to marketing in a Web 2.0
environment is to use social experiences and interactions to develop brand
relationships. These communities and development of these relationships is
important in both business-to-business (B2B) (Andersen, 2005) and B2C (Eastlick et
al, 2006) interactions. With the wide variety of social media, particularly social
networking sites available, wine consumers locally, nationally and internationally are
sharing their thoughts and opinions on the wines they love and hate, but who is
engaged? And more importantly, who is engaging?
Web 2.0 Marketing Adoption
There is somewhat conflicting research on to what extent companies are utilizing
social networking sites as marketing tools. Some research has found social
networking sites have become so conducive to connecting brands and organizations
with their consumers that they have begun to attract more traffic than a brand’s
website. Neff (2010) cites that it is by marketing design that companies with strong
fan followings on Facebook have seen a decrease in traffic to their website.
Contrastingly, in a content analysis of Fortune 50 corporations’ Facebook pages,
McCorkindale (2010) found that only few companies were utilizing the two-way
communication, relationship-centered capabilities available on Facebook pages. One
explanation is the result of the previously mentioned divide in perceived benefits.
Meaning that if a business perceives benefits of social networking sites for their
company because of all the hype among other businesses and industries, they may
want to test out the tools but not really invest too heavily in developing strategies for
them or allocating too many resources to them. Another explanation for large and
small firms who are not utilizing the engagement capabilities of SNS could be related
to the strength of the brand personality. If the product or service is less ‘branded’

Web 2.0 & Marketing Opportunities | 26
then their online practices will be different; this is especially reflective of B2B
environments.
Relationship Marketing
In its more traditional role, marketing responsibilities were assigned to specialized
individuals in a department of a firm; the rest of the firm responsible for their area of
expertise with little to no marketing training or responsibilities. Ironically, managing
operations, customer contacts and externally facing communications are the
responsibility of non-marketing departments. Gronroos (1990) aptly observes that
service encounters occurring in various departments of an organization are a driving
force behind future customer behavior, including word-of-mouth, and thus should be
considered marketing activities. Gummesson (1987) views the marketing function as
that which permeates the organization and where customers play a latent but active
role in the production process in that buyer-seller and service interactions have a
large impact on customer behavior and WOM, and should be considered resources
for marketing insights. Berry (1983) observed the increasing importance and value of
a service firms’ customer base as the key contrast to that of transaction marketing.
These observations, and the body of scholarly research stemming from them,
represent the early development of relationship-based approach to marketing, now
known as relationship marketing (RM). Gronroos (1990) offers the following definition
of relationship marketing:
“Marketing is to establish, maintain, enhance and commercialize customer relationships (often but not necessarily long term relationships) so that the objectives of the parties involved are met. This is done by mutual exchange and fulfillment of promises” (p. 5).
In the early 1990’s Morgan and Hunt (1994) suggested RM would be the next
dominating marketing paradigm. In light of ICT developments that have led to a more
information-driven and arguably, consumer-driven market, this may have been an
understatement. Today, academics and practitioners alike have grown to recognize
the increasing importance of customer relationships. In the early stages of RM theory
development, one of the major pitfalls was the time and space constraint on
businesses and brands interacting with their customers and consumers. Not only
have ICTs jettisoned the time and space that were once barriers (Henning-Thurau et
al., 2010), in today’s environment, consumers are encouraged, empowered and
enabled to overcome them.
Web 2.0 & Marketing Opportunities | 27
Connecting these empirical observations with those related to the
characteristics of SMEs and of Web 2.0; McGowan, Durkin, Allen, Dougan and Nixon
(2001) observe that the “evident personal and social bias in small firm business
activity” which historically was dependant upon face-to-face interactions, can now
occur in remote contexts like those characteristic of the Internet. In their study on the
implications of Web 2.0 on customer relationships, Henning-Thurau, Gwinner, Walsh,
and Gremler (2004) demonstrate how managing customer relationships in a Web 2.0
environment is much like playing pinball in the sense that marketers serve a
marketing message or brand, a pinball, and it accelerates through a “cacophonous
environment” of extensive information on products and brands and can multiply and
bounce from new media “bumper” or information source to the next. This makes it
difficult for marketers to control a brand image or relationship outcomes.
Word-of-Mouth Marketing
Word-of-mouth (WOM) marketing is unpaid marketing or promotion of products and
services derived from the discussions or conversations among consumers regarding
a specific product or service. Also described as electronic word-of-mouth (eWOM) in
online context, eWOM is defined by Henning-Thurau et al. (2004) as “any positive or
negative statement made by potential, actual, or former customers about a product or
company which is made available to a multitude of the people and institutes via the
internet,” (p.29) It is common to see viral marketing and eWOM used
interchangeably, for example Leskovec, Adamic and Huberman (2007) describe viral
marketing as, “a diffusion of information about a product and its adoption over the
network,” (p. 4). This sounds similar to eWOM in concept but viral marketing differs
slightly. As Ferguson (2008) puts it viral marketing is the cause and eWOM is the
effect. A video that grabs attention or an image or scene that is ‘buzzworthy’ can
serve as the cause of eWOM spreading throughout online communities.
In the business and economic sphere, especially online, one of the most
common forms eWOM marketing is that of user generated reviews or critiques of
products. And congruent with the growing forms of interactivity in ICTs and Web 2.0,
many websites offer some form of feedback related interactivity on their site or via
their pages/profiles on social networking sites. Meaning, Web 2.0, companies
facilitate and enable consumers/customers/users to get involved in the discussion
and follow the discussions involving their products or services.
One recent example of how turbulent viral content online can be is a recent
campaign, “Stop Kony” more widely known as Kony2012. Kony2012 is a video

Web 2.0 & Marketing Opportunities | 28
released by San Diego-based non-profit, Invisible Children, Inc.
as part of their campaign to raise awareness of Joseph Kony, a
Ugandan war lord criminal. The video was posted to Vimeo, a
video sharing network, on March 5, 2012 and shortly made its
way to YouTube. In the final thirty seconds of the 30-minute
video, Invisible Children urges viewers to help in their mission by
identifying three clear calls to action, and stating, “Above all,
share this movie online, it’s free.” (Kony 2012, 2012). In the first
week the video reached a record-breaking 112 million views,
making it the most successful viral video ever created (Carbone,
2012). In the three days after the story made it to Twitter, there
were an average of 1,380,900 statements per day about Kony
2012 (Pew Research Center, 2012 as cited in Kanczula, 2012).
Research conducted by the Pew Research Center also indicates that WOM was a
noteworthy source for those under the age of 65, as 9% of young adults and 7% of
adults aged 30-60 heard about it during a conversation (Rainie, Hitlin, Jurkowitz,
Dimock & Neidorf, 2012). This video is a testament not only to the potential for rapid
spread of online content but, also to how online content can supplement offline
conversations and awareness through WOM.
It is widely accepted that WOM marketing is invaluable to any brand or
company and researchers have studied why it is so powerful and even the level of
effectiveness. In one study for example, Walther, Van Der Heide, Hamel and
Shulman (2009) used the warranting principle (Walther & Parks, 2002) to explore the
perceived level of credence self-generated versus friend-generated statements in
social networks. According to Walther and Parks the warranting principle states that
observers perceive information generated by others with regard to one subject,
carries greater credence than that which is generated by the subject. Put more
simply, when an independent third party creates content it is perceived as more
credible than if the subject created it about themself. This principle provides insight
into why word-of-mouth communications prove to be among the most powerful
marketing tools. This is further reflected in the belief that consumers do not have a
vested interest in recommending or reviewing a product or service and this
independence leads to higher credibility than that of marketers (Bickart & Schindler,
2001; Ha, 2002). In essence, eWOM broadens customers’ options for gathering
information about products and services from other customers (Jeong & Jang, 2011).
Other powerful aspects of eWOM that impact products and services include
generation of feelings of empowerment for consumers (Cova & Pace, 2006) and the
Web 2.0 & Marketing Opportunities | 29
affinity and bond creation among brand communities with a shared interest (De
Vlack, Van Bruggen & Wierenga, 2009). Researchers have also observed the
significance of eWOM among virtual brand communities due to zero hard cost to the
brand/company and the ability to spread rapidly within and beyond that brand
community (De Vlack et al. 2009). Additionally, referrals in online communities can
result in increased customer acquisition (Trusov, Bucklin & Pauwels, 2009).
Leskovec et al. (2007) found that recommendations among small, special interest
communities result in purchases more often. Some researchers have gone down a
path of exploring what makes a good consumer review, a main type of eWOM.
Findings suggest the perceived usefulness of a review can be a strong predictor of
consumers’ intent to comply with the review (Cheung, Lee, & Rabojohn, 2008).
Drawing from this school of research, Willemsen, Neijens, Bronner and Ridder (2011)
explored what makes a review a useful source of information and found that the
content of a review is more related to the perceived usefulness of a review than a
star rating system, the characteristics of a reviewer or the price of the product.
Two studies have even brought their focus to the effects of WOM on wine
purchasing behavior. In a study on purchasing behavior offline, in Northern Ireland,
Keown and Casey (1995) found that WOM is most likely to influence customers’
choice in the type of wine they purchase. Thompson and Vourachis (1993) use a few
principles from the theory of reasoned action to understand the intention to drink
wine. The theory states that intention is determined by two components: attitude and
subjective norm. Subjective norm is related to WOM in that it measures other
people’s influence over an individuals’ intention to behave. In this study, they
concluded that using the influence of other people could be an effective approach to
influencing wine drinking and purchase behavior. A study in Norway found that wine
sales are significantly influenced by published wine reviews from critics (Horverak,
2009). This small but growing body of research supports the value that lies within
WOM regarding wine purchase behavior. There distinct commonalities between the
characteristics of eWOM and relationship marketing that overlap with the
characteristics of social media that distinctly facilitate these phenomena. This begs
the question, are entrepreneurial owner/managers of wine businesses harnessing
the power of social media for their business?
3.3 | The Research Question
The characteristics of Web 2.0, particularly of social media offer great opportunity for
growth in the areas of RM and eWOM especially among SMEs. Align this opportunity

Web 2.0 & Marketing Opportunities | 30
with the limited resources, high value of customer relationships and basic-knowledge
of social networking sites expected among SME owner/managers, and we begin to
see an even larger area of opportunity for these small firms. But, scholars have
shown that the wine industry; including producers, distributers and resellers, has not
been as quick to capitalize on the opportunity to utilize the social media resources
available to them.
Web 2.0, particularly social networking sites are perfectly positioned to offer
SMEs like on-trade businesses in the wine market an opportunity to connect with
consumers, producers and distributers and ultimately to focus their marketing efforts.
But are Dutch wine resellers already utilizing these tools? If so, are they seeing direct
benefits to their businesses? If they are not using these tools, it is important to
understand the concerns or barriers preventing them from incorporating these tools
into their business models.
These are the areas that this research seeks to explore. In order to do so, the
guiding research questions for this project are as follows:
RQ: To what extent are Dutch wine resellers using social media for their business?
Sub RQ A: How and why are resellers using social media for their business?
Sub RQ B: If they are not, what are the perceived threats, barriers or consequences?

Methodology | 31
IV. METHODOLOGY
Introduction
The purpose of this quantitative research is to conduct a cross-sectional survey of
owner/managers and decision makers for on-trade wine businesses in the Netherlands. The
survey will gather data on the respondent and the business the respondent owns/manages or
works for, and will pose a series of branched questions oriented toward the respondent’s
current use or non-use of social media for their business.
Due to the exploratory nature of this research and the specificity to the Dutch wine
market, there were virtually no pre-existing studies to draw many of these questions from.
Additionally, this research targets owner/managers of a small to medium enterprise, which as
discussed in chapter 1 means these individuals fill many roles in running their own business
and often have little spare time. This methodological framework, will describe these
challenges and barriers, and how they were addressed based on wine industry professionals’
input. Then, it will demonstrate how addressing these challenges resulted in carefully thought-
out survey development process that began with unstructured interviews.
4.1 | Unstructured Interviews
These interviews involved the owner/managers of four different types of on-trade businesses
with varying levels of social media involvement. The goal of these interviews was to gain
insights into the perceptions and attitudes toward social media use for wine businesses from
both users and non-users of various on-trade business types. Then to use these insights to
guide the statements included in the final survey tool.
Of the four owner/managers interviewed, one interviewee was a non-believer and
non-user of social media, two were somewhat active in engaging and generating content but
looking for further direction in their communication efforts, and one was very active in
generating content but less actively engaging their audiences.
Lasting anywhere from 1-2.5 hours, the interviews provided meaningful information to
guide the development of this research. In most cases, information gathered during the
interviews aligned with previous research on e-business adoption indicators and field
experience reflected in the perceived benefits of use. The interviews also offered greater
insight into possible barriers to using social media.
The questionnaire is reflective of a compilation of insights gained from the feedback
and observations collected during these interviews, past research findings and field
experience. The survey was then pre-tested with 15 wine industry colleagues and academic
supervisors. These pre-tests resulted in minor revisions to language to ensure clarity, and
ordering of questions to ensure logical progression of questioning. A closer examination of
some of these revisions is elaborated on below.

Methodology | 32
4.2 | Survey Development
There were several aspects that required special attention during the development and
testing of this survey. First and foremost, careful consideration in the wording of the questions
and answers was necessary due the Dutch-English language barrier. While the Netherlands
ranks second world wide on the English proficiency index (“Multilingual Population”, 2012),
the respondents are not native English speakers and complexly worded questions may result
in a higher drop out rate or invalid response entry and therefore needed to be treated with
great sensitivity. Due to the limited time and resources, translating the survey into Dutch was
not possible. As a measure to address this concern, all 15 pre-test respondents were Dutch-
natives with varying levels of non-native English language proficiency. Additionally, the
researcher sat alongside the respondents in the first 5 pre-tests to observe any hesitations or
delays related to the wording of a question. These observations were noted, and once the
respondent was finished with the survey, the researcher discussed each instance, and
adjusted the wording to ensure clarity and ease of understanding for any problem areas. This
process ensured clarity of language and smooth progression of question development.
This research aims to explore if and how businesses in the Dutch wine industry are
communicating using social media tools. The findings of this research could likely have
industry implications relevant not only to the on-trade businesses that are the focus of this
research, but also on journalists, producers and distributers. It was vital to ensure that the
demographic data collected on the businesses is reflective of the indicators used in business
valuations and will be of value to industry professionals. As a result, 10 of the 15 pre-tests
were run with respondents from a wine industry including general manager, on-trade sales
manager and representatives, and inside sales representatives of a major Dutch wine
distributor.
One area of discussion that arose in these pre-tests was the size of a business.
When considering the size of an on-trade business, in any industry this could mean number
of employees, estimated sales in years past, or size of physical location for example. But in
the case of wine and these on-trade businesses it was decided to define size and
performance measures in three different ways. First by the number of employees, next by the
estimated sales from the previous year (2011) and lastly by the estimated volume of bottles
sold the previous year. While it was recognized that sharing the estimated sales of a business
might be a sensitive matter, respondents were not forced to answer. But also when
considering the estimated volume of bottles sold the previous year, that from an industry
perspective, to understand the value of a business this could be even further classified into
the value of the wine inventory. In other words, it is insightful to know the volume a business
sells in a year, but is that volume representative of entry-level wines or high-end wines? In an
effort to maintain a short and manageable response time, it was decided not to incorporate
this additional level of segmentation.

Methodology | 33
4 .3 | Survey Design
General Characteristics
The electronic survey was designed using Qualtrics, an online high quality survey software
tool2 (Qualtrics.com). The survey was made up of three branches and a total of 52 questions.
The questionnaire used a “screen-by-screen” design (Fan & Yan, 2009) in which there were 3
questions within one screen and the respondent clicked a “next” button to proceed.
Respondents were given the option of going “back” to adjust any of their answers at any
point. And all questions with categorical statement answers were set with randomized
answers to prevent order biases. All questions were forced response with the exception of the
estimated sales and the open response questions.
Every respondent was presented with a series of 12 demographic questions 3
questions on their personal use of social media and one qualifying question. Then,
respondents were routed down a series of questions based on their answer to the qualifying
question.
The demographic questions were designed to collect thorough information about the
respondent (e.g. age, sex and role within the business) and the business they work for. The
questions selected to collect information about the business were chosen with wine industry
interests in mind. Initial questions include categorizing business activity, or type of business
(e.g. wholesaler, specialty store, horeca supplier). These groups reflect each of the types of
on-trade businesses discussed in chapter 1. Each categorical question included an other
option that included an area for open response that were later grouped and coded
accordingly.
The question on the respondent’s primary role within the business focused on the
target respondents for this survey as established earlier in this research, the goal is to
understand the activity, perceptions and attitudes of decision-making individuals in a SME.
This is likely the owner/manager, sometimes a buying manager or a sales representative of
the business, as a result, these were the categories chosen.
The qualifying questions serves as the determinant of which branch of the survey the
respondent will be taken through. The question is, “Which of the following best describes your
use of social media for your business” with the optional answers:
• I do not use social media for my business • I have at least one account specifically for my business on a social networking site • I sometimes use my personal social networking accounts for business purposes
This structure of the survey flow as described above is illustrated in Figure 4.1.
2 Subscription paid for by Erasmus University Rotterdam

Methodology | 34
Figure 4.1: Structure of Survey Branching
Non-User Branch
Stemming from the 5 unstructured interviews conducted prior to the development of
the survey, the commonly established barriers to e-business adoption and
practitioner experience in the field, the non-user (NU) branch was designed to
explore why these businesses are not using social media for their business, and what
perceptions they have of the benefits of doing so. The first point of interest is whether
or not the respondent has ever even considered using social networking sites for
their business. This allows the researcher to connect their openness to using SNS for
their business with their perceived benefits, to see if they differ greatly from those
who have not considered it for example. Next, non-users were presented with a
series of 3 groupings of questions asking what their perceived benefit of using SNS
to conduct a particular activity.
Drawing from past research by Poon and Strom (1997) and Poon and
Swatman, (1999) and a proposed model for e-commerce adoption drivers (Jones et
al., 2003) it was decided to measure the perceptions of benefits of using social media
for one’s business to explore the extent to which they are using the tools, and to
gauge market perceptions of these media. Fifteen activities related to social media
use for an on-trade business were identified. These fifteen activities were further
grouped into 3 groups consisting of 5 items (or activities) each, related running and
maintaining an on-trade business. These five items were assumed on theoretical
grounds to measure the underlying constructs for perceived benefits of social media
use related these areas of running and maintaining an on-trade business. The three
groups benefit groups are: business operations, customers, and wine market.
Benefits related to business operations include activities related to general business

Methodology | 35
operations like purchasing, selling, and business happenings. Benefits related to
customers include activities directly targeting or interacting with existing and
prospective customers of the business. And benefits related to wine market are
derived from B2B activities related to general market information, information about
competitors, and interactions with other industry professionals. These benefits by
activity are listed in Table 4.1 below.
Table 4.1: Perceived benefits by grouping and activity
Group Activity
Gather information about existing products
Get deals on products from suppliers
Build brand awareness for your products
Find new products
Business Operations
Communicate information about your business (example: events, products, business hours)
Maintain relationships with customers
Hear what consumers are saying
Find and connect with new customers
Build name recognition for your business
Customers
Communicate deals and promotions to your customers
Maintain relationships with partners in the wine industry
Learn what promotions competitors are offering
Learn how competitors are interacting with their customers
Hear what consumers are saying about products
Knowledge of the wine market
Gather market information
For response, users were presented with a 3-point Likert scale with verbal
labels of Not at all, Somewhat, and Very. These labels were used to clarify the
meaning of the points on the scale, which has been found to significantly improve
reliability and validity (Krosnik & Berentm, 1993). A 3-point scale was chosen to
minimize the level of complexity for the respondent in effort to maintain attention.
Reliability of both the user and non-user benefits perceptions and the non-user
barrier 3-point scales was calculated using Chronbach’s alpha. Cronbach’s alpha
coefficient reported .944 for user benefit perception scale and .961 for non-user

Methodology | 36
benefit perception scale. Both alpha scores indicate a strong internal consistency (α
≥ .70), for each of the scales used to measure perceptions of benefits (Pallant,
2005).
Next, using a similar structure, non-users were asked to indicate how strongly
a series of factor, or barriers, influenced why they do not currently use SNS for their
business. This question operationalizes the perceived barriers preventing these
business owner/managers and the degree of strength that factor is influencing them.
These seven factors were drawn from the insights gained in the preliminary
interviews and included factors such as I haven’t had time, I don’t think my customers
are using it, and I have concerns about how to maintain it. Responses were ranked
on a scale of Not at all (1), Somewhat (2) and Strongly (3). This scale was also
tested for reliability and found to have a strong internal consistency with a .725 alpha
coefficient.
Lastly, in the form of an open response question, respondents were given the
opportunity to add any additional factors that may have not been included, that
influence why they do not use SNS for their business.
User Branch
First users were asked which accounts they use for their business, or which personal
accounts they sometimes use for their business. It was important to separate these
two types of users for initial questions in the U branch as the users who have
specifically set up business accounts are likely to use these tools differently than
those who use their personal accounts for professional communications at times.
Next, much like the general, personal use question every respondent was
asked, users were asked which networks and how frequently they log-in to their
accounts. Then, users were asked general information about their use of social
networking sites. These questions included, how long the business has been using
social media, how much time each week the business spends on social media and
which networks they use to engage in certain activities. This question enable a
deeper understanding of which networks are used for six different key activities like
connecting with existing customers, and sending information about products and
events. The four networks chosen for this research are Facebook, Twitter, LinkedIn,
and Foursquare. Facebook, Twitter and LinkedIn were included because they are
among the top five most used social networks in the Netherlands (New Media Trend
Watch, 2012). Foursquare was selected because there is an increasing trend in the
US of businesses utilizing this SNS to offer discounts and to collect reviews and

Methodology | 37
feedback on their products and services, it is curious to explore if this trend is also
occurring in the NL.
After completing general information questions, respondents on the U branch
of the survey were presented with a series of three side-by-side, 3-point Likert scale
questions with 5 statements pertaining to their frequency of use and perceived
benefits of using social media for that purpose. So, one “side”, or column of the table
containing the 5 activity statements, of the Likert scale set, users were asked how
strong they feel the benefit of using social media is for that activity (See Appendix 1
for survey questions and side-by-side layout). This side is identical to the series
described previously for the NU branch of the survey. The other side of the Likert
attitudinal scale set asked users how often they engage in that same activity (not at
all, sometimes and regularly). These questions were presented as coupled set
question, one per webpage.
Finally, users were presented with an open response question asking them to
list any clear examples of direct results they have seen from their use of social
networking sites. Respondents were encouraged to write in Dutch.
4.4 | Data Collection
Phase I
The data collection process took place in two phases. The initial phase was the
distribution of the questionnaire to an existing email database to 438 customers of a
major wine distributor in the Netherlands. This phase of the data collection included
individualized links with unique identifiers embedded into each URL that
corresponded to each of the email addresses in the database. This enabled the
researcher to send follow-up reminder or thank-you emails to respondents at later
times. It also ensured that the survey remained closed to any un-targeted
respondents. The email was sent out with a personal letter of support, written in
Dutch, from the general manager of a major Dutch wine distributor, to customers of
his company encouraging them to participate in the research. The letter included two
explicit calls to action, a clearly stated expected length of time to take the survey (8
minutes) and that it was anonymous. The letter also offered a white paper on “Social
Media in the Dutch Wine Industry” derived from the research, in exchange for
completing the survey. This email was sent at 11:15 am on Monday, April 16 2011.
One week later, a reminder email was sent to those who had not taken or completed
the survey, and the following Thursday, the researcher sent personal emails to the

Methodology | 38
top 50 customers of the distribution company, asking once again for their
participation in the survey.
It was decided not to send a prenotification with this survey for three reasons.
First, related to the aforementioned concern and increasing issue with inboxes is that
of junk mail and spam. Second, sending an email asking for someone’s time and
participation without providing the link to act upon that request could be seen as a
waste of someone’s time rather than a courtesy notification. And third, a more recent
study on prenotification in email surveys found virtually no statistical difference in
response rates from respondents who were prenotified and those who were not
(Hart, Brennan, Sym & Larson, 2009).
Phase II
After leaving the survey open to these respondents for two weeks, it became
apparent that response rate of 9.5% was rather low and in order to collect sufficient
data, it was necessary to consider alternative approaches to collecting the data.
As a result, the researcher began requesting the support of well-connected
thought-leaders in the wine industry who were strongly positioned to reach on-trade
businesses and influence their participation. This included wine business owners,
leading journalist and distributors who were active on social networks Twitter and
Facebook. This phase of the data collection was done using an anonymous survey
link and a series of tweets on Twitter, posts on Facebook, personal emails from sales
representatives and a widely distributed email to 1500 wine professionals in a
database from the Wijn Instituut in the Netherlands.
Because this approach allowed anyone who sees the link to participate, three
cautionary steps were taken to maintain quality of the responses. First, in each
request, post, tweet or email, it was asked that the sender ensure that the survey
was specifically for those who work in the Dutch wine market. This was to eliminate
or prevent consumers participating. Next, it was asked that any message with the
survey link should clearly state the amount of time it would take to complete the
survey and that it was anonymous. Finally, slight adjustments were made to the
survey that routed irrelevant respondents, or those who identified their primary role in
the wine business as “other” to the end of the survey after answering the first few
basic demographic questions.
Because of this two-phase, closed and open distribution approach, it is
difficult to provide a firm response rate for the overall distribution. That being said,
Eysenbach (2004) suggests that view rate, participation rate, and completion rate are
better metrics for reporting web surveys than response rate. For this survey, it is

Methodology | 39
impossible to identify the number of people who actually received the invitation, or
the view rate, of the survey because there were no tracking methods in place to
determine if someone opened an email or viewed a tweet. However, the
participation rate, or the percentage of people who began the survey, or clicked on
the link provided is 6.3% based solely on the email distribution total of 1,938 email
addresses. And there were a total of 85 completed surveys, yielding a completion
rate, or the percentage of completed surveys, of 69.1%.
While this total number of responses moderately low in comparison to the
number who may have received it, it can be said that the fully completed surveys are
those of high value, the majority of these responses are reflective of the target
respondents of owner-managers of SME on-trade businesses. Additionally, despite
prevailing perceptions toward low response rates on survey research, it is not
sensible to assume a low response rate results in low representativeness of a
population (Krosnik, 1999).

Results | 40
V. RESULTS
Introduction
The primary research question guiding this study is: RQ: To what extent are Dutch on-trade wine businesses using social media for their business? And the sub-questions derived from this question are two-fold:
Sub RQ A: How and why are resellers using social media for their business?
Sub RQ B: If they are not, what are the perceived threats, barriers or consequences?
Essentially, these sub-questions sought to explore the how, the why and the why not
of social media use for these Dutch, SME, on-trade wine businesses. The following
two chapters report the results of this survey in order to address these questions.
First, Chapter 5 describes the general characteristics of the sample to begin to
illustrate to what extent social media is being used. Then, Chapter 6 addresses the
sub-questions.
Data reported in these chapters was analyzed using both Qualtrics and SPSS
statistical analysis software. Qualtrics, the online survey tool used to build and
distribute the survey, also includes a comprehensive reporting tool that provided
descriptive statistics reports. All additional analyses were completed using SPSS.
Due to some non-response items and survey branching characteristics, the sample
size (N) available for data-analysis fluctuates and may vary from analysis to analysis.
5.1 | The Sample
There were a total of (N) 99
respondents, 85 male and 14 female.
Respondents ranged in age from 23 to
73 with a mean of 47.12 and standard
deviation of 11.45 indicating a wide
range in the age of respondents.
These respondents represent a wide
range of types of on-trade businesses
(see Figure 5.1). Wholesalers
represent 8% of the sample, 32% are
Wholesaler 8%
Wine/liquor/specialty
33%
Horeca Supplier
29%
Web Shops 16%
Other 14%
Figure 5.1: Type of business representation
Results | 41
wine, liquor, cheese or specialty stores, 29% are horeca suppliers, 16% are
online/webshops and 14% classified themselves as other. According to open
responses to those who selected ‘other’, this category includes importers, journalists
and companies that fall into multiple categories listed.
The geographic distribution of respondents can be of importance to sales
representatives of distributors and producers. It is worth noting that each of the
twelve provinces are represented in the sample with at least one respondent from
each. The highest frequency of respondents’ businesses are located in Noord
Holland (N=22) and Noord Brabant (N=17). The least represented province among
respondents is Groningen (N=1).
It was imperative to target owner managers and decision makers for these
on-trade businesses for the survey in order to understand their communication
practices for their business. With 86% of respondents identifying themselves as
owner/manager we can assume that the findings of this research are from those who
make decisions for their businesses. Also, as Fillis et al. (2004) highlighted the
entrepreneurial nature of owner/managers of their own businesses, we can also
assume that the findings of this research reflect, to some degree, entrepreneurial
oriented respondents. An additional 12% of respondents identify themselves as
holding Sales or Marketing roles, also relevant to decision making with regards to
communication activities for a business. The remaining two percent identified
themselves as journalists, buying managers or other. As the number of respondents
in this area was small and the sample size is already limited, it was decided to still
include these groups in the analysis. Only individuals who identified themselves as
having an other role that was not a decision maker role for the business (ex. intern)
were excluded for analysis.
The businesses represented in the sample range in size. There were three
criteria used to measure size; one primary, number of employees, and two secondary
criteria that can also be indicators of size, these are total estimated sales in the
previous year, and estimated volume of bottles sold in the previous year. Sales and
volume sold also indicate the performance of the business overall, as a result they
are considered to be indicators of both performance and size for the purpose of this
research.
As described in the discussion of SMEs, most SMEs included in research are
in fact microenterprises with less than 10 employees. These assumptions are
congruent with the representation in this sample size. Over 82% of the respondents
work for businesses with 5 or less employees, and over half of the total sample
(59%) have 1-2 employees. These businesses are also surprisingly mature, with

Results | 42
almost half (49.5%) indicating that they have been open for 11+ years, and 15%
indicating they have been open for less than 2 years. The distribution of size by
employees is demonstrated in Figure 5.2.
When examining the estimated 2011 sales of the participating on-trade
businesses, most (40.2%) report less than €100.000. The second highest percentage
(16.3%) reported estimated sales figures of €500.000-1 million, and following closely
behind this (15.2%) reported €251.000-500.000.
Lastly in considering the performance of the business, respondents were
asked the estimated volume of bottles sold in 2011. Most businesses (36.6%)
reported 0-10.000 bottles; (23.7%) reported 50.000-100.000 bottles, (22.6%)
reported 10.000-50.000 bottles and lastly (17.2%) reported more than 100.000
bottles sold in 2011.
Respondents were also asked the average growth rate of their business.
Almost half (42.2%) of businesses indicate an average growth rate of 5% or more.
This is relatively surprising considering the economic circumstances have had a large
impact on the growth of the wine market both nationally and internationally.
In summary, the majority of this sample population of on-trade businesses
can be described as: microenterprises, employing 1-2 people that have been open
for 11+ years that sold an estimated 0-10.000 bottles and earned less than €100.000
in 2011.
0
10
20
30
40
50
60
70
1 to 2 3 to 5 6 to 10 11+
Num
ber o
f Res
pond
ents
(N)
Number of Employees
Figure 5.2: Size of business by staff size

Results | 43
Size and Business Performance
It is commercially interesting to examine any potential relationships between the
number of employees and the performance of the business in 2011, or the estimated
sales and volume of bottles sold in 2011.
The relationship between the number of employees and estimated sales from
2011 was explored using a Spearman Rank Order Correlation. There was a strong,
positive correlation between the two variables [rho=.55, n=92] with larger staff
(number of employees) associated with higher estimated sales from 2011. Table 5.1
illustrates the positive correlation between each of the variables indicating the age
and size of the business with the performance of the business. This shows that there
are medium to strong, positive relationships between the age and number of
employees has, and their performance in 2011.
Table 5.1: Spearman rank order correlation between age and size of business and business performance in 2011
Years in Operation Estimated Sales
Number of Employees
Estimated Volume
Years in Operation 1.00
Estimated Sales .624a 1.00
Number of Employees .362 .548 a 1.00
Estimated Volume .479 .891 a .425 1.00
a Indicates a strong relationship
Communications
Social media as a communication tool for a business is only one of many ways a
business may prefer to interact with their customers. Understanding the preferred
ways of conducting business for these owner/managers is an important component
to the broader goal of building a profile for users and non-users of social media for
business. To address this, respondents were asked to rank the ways in which they
interact with their customers in order of preference. The most preferred way of
communicating with customers across the survey sample was face-to-face inside the
shop or office of the respondent. The second most preferred was face-to-face outside
the office, closely behind face-to-face communications ranked email followed by
phone, then social media, then other means of communication.
When splitting the sample by users and non-users of social media, and
examining preferred communication activities we see a slight difference in the order
of preferred ways of communicating with customers. Table 5.2 was constructed using

Results | 44
mean scores on rankings of each category and comparing user and non-user
groups. Here we can see that on average, non-users preferred phone over face-to-
face outside the office, whereas users preferred them in the opposite order. And for
non-users, other means of communication like mail and website ranked 5th over
social media in 6th. Table 5.2: Comparing users’ and non-users’ preferences in communicating
with customers
1
(Most Preferred) 2 3 4 5
6
(Least Preferred)
Users Face-to-face in Office (M=4.40)
(M=4.26)
Face-to-face outside office (M=4.11)
Phone (M=3.80)
Social Media (M=3.45)
Other (M=2.05)
Non-Users Face-to-face in Office (M=5.00)
Email (M=4.48)
Phone (M=4.41)
Face-to-face outside office (M=4.29)
Other (M=2.42)
Social Media (M=2.36)
While this is only a slight difference in rank ordered preference among the groups, it
could be a subtle indication in the customer-orientation of a business and how the
owner/managers prefer to conduct business. As social media, are in fact social; they
enable businesses and individuals to communicate, logic would follow that
businesses which prefer more direct forms of communication like face-to-face, would
be more likely to adopt the use of social media for their business.
Personal Social Media Use
Respondents were asked to report if they have a personal account on a social
networking site, and if so, with which network/s and how frequently do they log in.
76% of respondents (N=69) reported that they have at least one personal account on
a social networking site.The most popular network for personal use among
respondents was Facebook, followed by LinkedIn and Twitter. 8.4% of personal SNS
users have an account with Foursquare and an additional 7.6% have an account on
an other site, Pinterest and Dutch social network, Hyves were the most frequently
cited other networks. Additionally, 75% of people who have an account with a SNS
indicated they login to at least one of these accounts daily. Assuming that frequency
of logins is a reflection of frequency of use, this reveals those who use social media
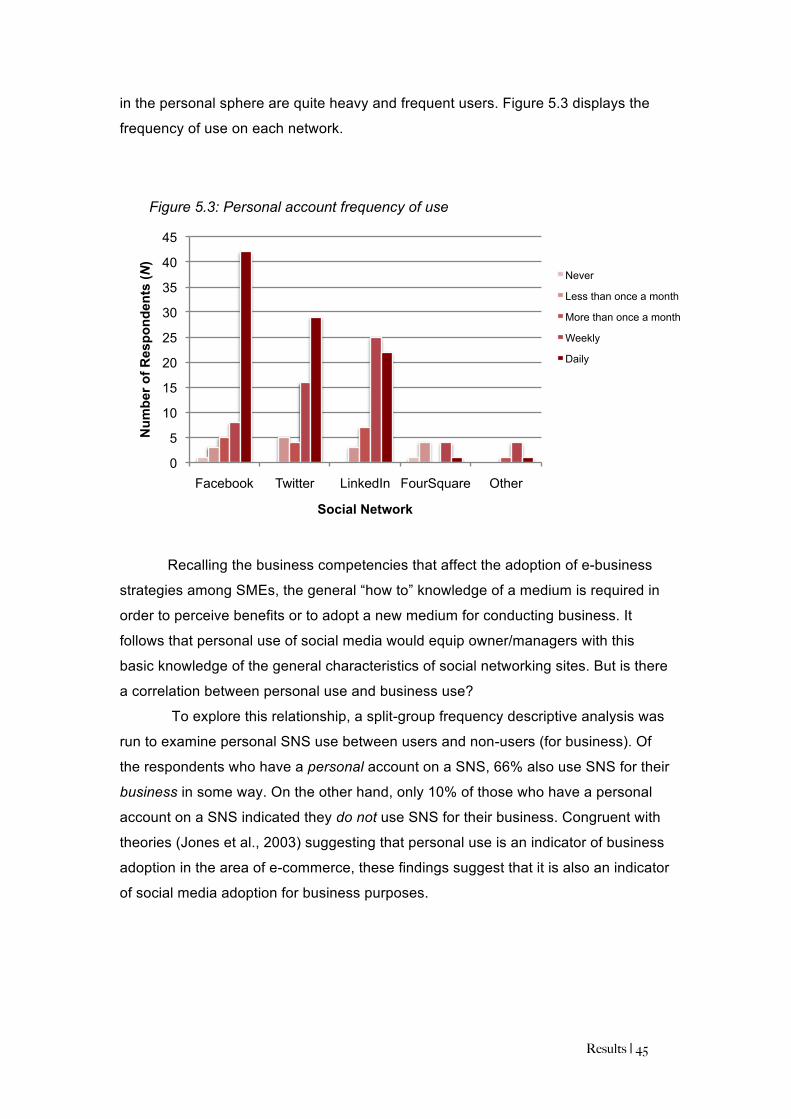
Results | 45
in the personal sphere are quite heavy and frequent users. Figure 5.3 displays the
frequency of use on each network.
Recalling the business competencies that affect the adoption of e-business
strategies among SMEs, the general “how to” knowledge of a medium is required in
order to perceive benefits or to adopt a new medium for conducting business. It
follows that personal use of social media would equip owner/managers with this
basic knowledge of the general characteristics of social networking sites. But is there
a correlation between personal use and business use?
To explore this relationship, a split-group frequency descriptive analysis was
run to examine personal SNS use between users and non-users (for business). Of
the respondents who have a personal account on a SNS, 66% also use SNS for their
business in some way. On the other hand, only 10% of those who have a personal
account on a SNS indicated they do not use SNS for their business. Congruent with
theories (Jones et al., 2003) suggesting that personal use is an indicator of business
adoption in the area of e-commerce, these findings suggest that it is also an indicator
of social media adoption for business purposes.
0
5
10
15
20
25
30
35
40
45
Facebook Twitter LinkedIn FourSquare Other
Num
ber o
f Res
pond
ents
(N)
Social Network
Figure 5.3: Personal account frequency of use
Never
Less than once a month
More than once a month
Weekly
Daily

Results | 46
5 .2 | User Characterist ics
Of the total sample, 69
respondents use social media for
their business in some way, and
22 respondents do not.
Respondents were divided, into
two general groups, users and
non-users based upon their use of
social media for their business.
Users were further divided into
those who have accounts
specifically for their business, and
those who use their personal
accounts for their business. These
proportions are displayed in Figure 5.4.
These two groups will be generally referred to users and non-users
throughout these chapters. The following sections take a closer look at profiles of
users and non-users.
Users
As mentioned, 76% of respondents indicated they use social media for their
business. Of these respondents, 67% (N=46) have at least one social networking
account specifically for their business. This is a large portion of social media for
business-users who are using social media to the extent that they have invested the
time to establish a profile uniquely for their business and distinguish this from their
social networking in the personal sphere. While the remaining 33% (N=23) of users
indicate that they sometimes use their personal social networking account for
business purposes. In this group we see owner/managers of SMEs using SNS as a
communication tool for both personal and professional purposes. If an
owner/manager is using their personal account for their business at times, this could
suggest a limited perception of the benefits of establishing a separate business-only
account. It could also reflect characteristics of the owner/managers of 1 to 2-man
businesses where their work and their personal relationships overlap a great deal.
There is a relationship between age and social media use as well. In fact,
almost all (95.5%) respondents under the age of 40 use social media for their
Non-users 24%
Users: business-specific account
51%
Users: personal account
25%
Figure 5.4: Social media use/non-use for business

Results | 47
business. This supports assumptions that younger owner/managers are more likely
to use social media for their business than those who are older.
Looking at the use of social media the number of years a business has been
in operation, 47.8% of users represent businesses that have been open for 11+
years. Perhaps most interestingly, all businesses that have opened in the past three
years (N=14) use social media for their business to some extent.
Use and Business Characteristics
Respondents were asked to indicate which type of on-trade business they work for
(i.e. wholesaler, horeca supplier, online shop etc.). If we divide these business types
into their market orientation, either B2B (business to business) or B2C (), we see that
49.5% of B2C-oriented businesses are users of social media for their business, while
39% of B2B-oriented businesses (wholesalers and horeca suppliers) use social
media for their business. This can be further broken down by business type and into
the use and non groups as illustrated in Figure 5.5. By type of business, 72%
wine/liquor/cheese/specialty stores (B2C), 81% of online webshops (B2C) and 85%
of horeca suppliers (B2B) use social media to benefit their business. However, a chi-
square analysis indicated that there were no statistically significant differences
between social media usage and business orientation (B2B vs B2C).
Last but not least, lets examine the size and performance of businesses who
use social media. Looking to the staff size as it relates to social media use for on-
trade businesses, 60% of users employ 1 to 2 people, 25% of users employ 3 to 5,
0 5 10 15 20 25 30 35
Wholesalers
Wine/Liquor/Specialty
Horeca Supplier
Online/Web Shop
Other
Number of Respondents (N)
Type
of B
usin
ess
Figure 5.5: Use/non-use by type of business
Users
Non-Users

Results | 48
only 6% of users employ 6 to 10 and 10.1% employ 11+ people. While a chi-square
analysis indicated that there is no statistically significant relationship between the
staff size and social media use for a business, it is worth noting that only 3 of the 14
businesses that employ 6 or more people do not use social media. This is suggestive
of an underlying relationship that reveals that with business that have a larger staff,
the amount of time needed to invest in developing social media is not as much of a
barrier.
Now turning to sales figures and volume, 93% of businesses that did
€500.000-€1million in sales in 2011 use social media for their business. There was
no statistically significant difference found between usage of social media and sales,
or in volume of bottles sold in 2011.
5.3 | Non-User Characterist ics
A brief discussion of the characteristics of the non-users group (N=22) will highlight any
notable differences between users and nonusers. First, we see 47.4% of non-users are over
55 years old and only 1 respondent under 40 is not using social media for their business. This
is again congruent with assumptions that age impacts use of social media for one’s business.
Considering that exposure and widespread use of Internet largely impacted younger
generations, logic would follow that this could be due in large part to familiarity with the
medium. And while research suggests that older generations are using internet for personal
activities like sending email, gathering health information and visiting government websites
(“Generations Online”, 2010) they may not be as comfortable incorporating these activities
into their business models.
Most (68.2%) non-users, or businesses that do not use SM, employ only 1-2 people.
Again, congruent with assumptions from SME theories that limited resources largely impacts
the marketing activities and e-business adoption among SMEs. And looking at the trends in
use among types of businesses, most non-users (71.8%) are either B2B wholesalers or
“other”. And finally, when exploring non-use and sales performance, 41% of non-users
estimated less than 100.000 in sales in 2011, and only 24% of non-users reported over
50.000 bottles sold in 2011.
In summary, non-users tend to be B2B oriented businesses that employ only 1 or 2
people, likely doing less than 50.000 bottles in sales and run by an owner/manager who is
over 40 years old.
Conclusions & Discussion | 49
6 | The How , Why, and Why Not of Social Media Use
At the core of this study are the questions regarding who, why, and why not to social media
use among on-trade businesses. First, to address how, users were asked to identify which
SNS they are using to conduct certain activities, and later they were asked to indicate how
often they are conducting more specific types of activities in the three benefit areas. Then
both users and non-user were presented with the items related to the three benefit constructs
in order to address the why resellers are using social media and in a peripheral way, they
also inversely address the perceived threats and/or consequences to use by non-users. And
lastly, factors influencing non-use help us understand the why not. This section covers the
insights gained from these areas of the questionnaire.
6.1 | How?
Network Specific
User-respondents were asked to identify which SNS they used to conduct six general
types of activities. These activities are among the more common ways to use social
media and are put in more general terms of business use. The results of this
question reveal which networks are being utilized more or less to perform certain
business-related activities. As Figure 6.1 illustrates, there is much information to be
gleaned from this data but for the purposes of keeping this discussion to a
manageable length, only some more notable observations are mentioned.
To begin, it is apparent at first glance that some networks are clearly
preferred over others to perform certain tasks. One of the most notable observations
is that Twitter is used the most for all activities except for connecting with
professionals in the wine industry and reading reviews and articles on specific
products.
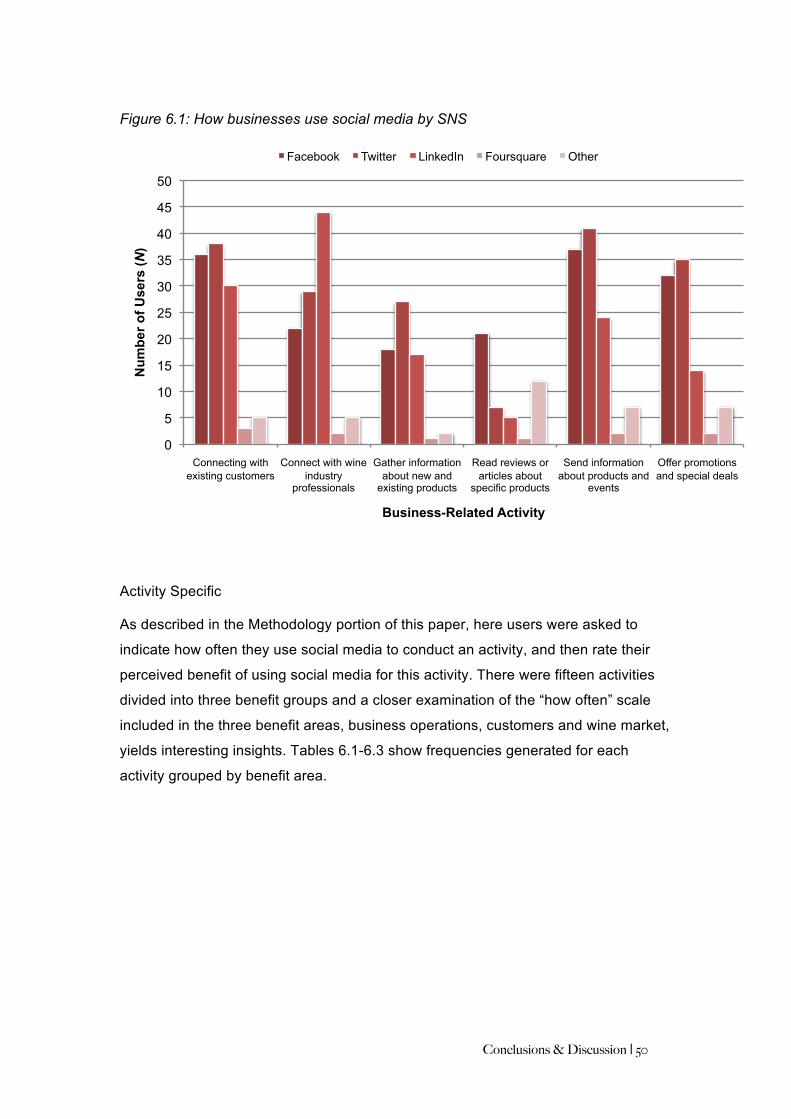
Conclusions & Discussion | 50
Activity Specific
As described in the Methodology portion of this paper, here users were asked to
indicate how often they use social media to conduct an activity, and then rate their
perceived benefit of using social media for this activity. There were fifteen activities
divided into three benefit groups and a closer examination of the “how often” scale
included in the three benefit areas, business operations, customers and wine market,
yields interesting insights. Tables 6.1-6.3 show frequencies generated for each
activity grouped by benefit area.
0
5
10
15
20
25
30
35
40
45
50
Connecting with existing customers
Connect with wine industry
professionals
Gather information about new and
existing products
Read reviews or articles about
specific products
Send information about products and
events
Offer promotions and special deals
Num
ber o
f Use
rs (N
)
Business-Related Activity
Figure 6.1: How businesses use social media by SNS
Facebook Twitter LinkedIn Foursquare Other

Conclusions & Discussion | 51
Table 6.1: Frequency of use for business operation-related activities
N Valid Missing Mean
Std. Deviation
Gather information about existing products 62 7 1.90 .694
Get deals on products from suppliers 62 7 1.44 .692
Build brand awareness for your products 62 7 2.23a .818
Find new products 62 7 1.71 .710
Communicate information about your business (example: events, products, business hours)
62 7 2.35a .749
aIndicates the 2 activities with the highest mean across benefit group.
First, examining the benefits of using social media for activities related to business
operations, we see that this group had higher means than the other two benefit groups on
average. It also contained two of the highest means across all activity statements included in
the survey. Additionally, this benefit group is the only group in which “Regularly” (or 3 on the
rating scale) was the most frequently recorded value, or the mode. This indicates that two of
the activities for which social media are most regularly used by on-trade businesses
participating in this research are to build brand awareness for their products (M=2.23) and to
communicate information about their business (M=2.35).
Table 6.2: Frequency of use for customer-related activities
N Valid Missing Mean
Std. Deviation
Maintain relationships with customers 62 7 2.15a .698
Hear what consumers are saying 62 7 2.15 a .698
Find and connect with new customers 62 7 2.03 .724
Build name recognition for your business 62 7 2.31 a .667
Communicate deals on promotions to your customers 62 7 2.13 .713
a Indicates the 2 activities with the highest mean across benefit group.
Now looking to the activities related to customers, we see the second highest mean
frequency rating across all activities in each benefit area is for build name recognition for your
business (M=2.31). This means that like building brand awareness for products and
communicating information about businesses, social media are also regularly used to build
name recognition for these on-trade businesses.

Conclusions & Discussion | 52
Table 6.3: Frequency of use for wine market-related activities
N Valid Missing Mean
Std. Deviation
Maintain relationships with partners in the wine industry 62 7 1.90 .718
Learn what promotions competitors are offering 62 7 1.97 .701
Learn how competitors are interacting with their customers
62 7 1.98 a .665
Hear what consumers are saying about products 62 7 2.03 a .701
Gather market information 62 7 1.97 .724
a Indicates the 2 activities with the highest mean across benefit group
Lastly, a closer look at the reported frequencies of using social media for wine market related
activities. Here we see that these activities show on average, lower means than the other two
benefit categories with the highest being hearing what consumers are saying about products
(M=2.03). Interestingly, the activity in this benefit area with second highest mean frequency of
use is learn how competitors are interacting with their customers. This is an interesting
dynamic when considering facets of economic competition.
6.2 | Why?
Relying on previous research indicating that perception of the benefits of usage, or the ability
to envision the usefulness, of a new medium are among the strongest indicators of adoption
of that medium (Fillis et al., 2004), we look to the level of perceived benefits in three business
areas. Since each of the benefit areas was made up of five activities each with 3-point scales,
the compute variable feature of SPSS was used to calculate the total scores in each benefit
area. Three new variables of total benefit perception scores in each benefit area was
calculated by adding the scores for the 5 activities in each benefit area, and dividing by the
number of activities. Again, we can assume based on the high alpha levels that these
grouped activities reliably reflect a single underlying benefit construct in each group. For the
purposes of keeping these results at a digestible length, only the total benefit perception
scores in each of the three benefit areas will be discussed.
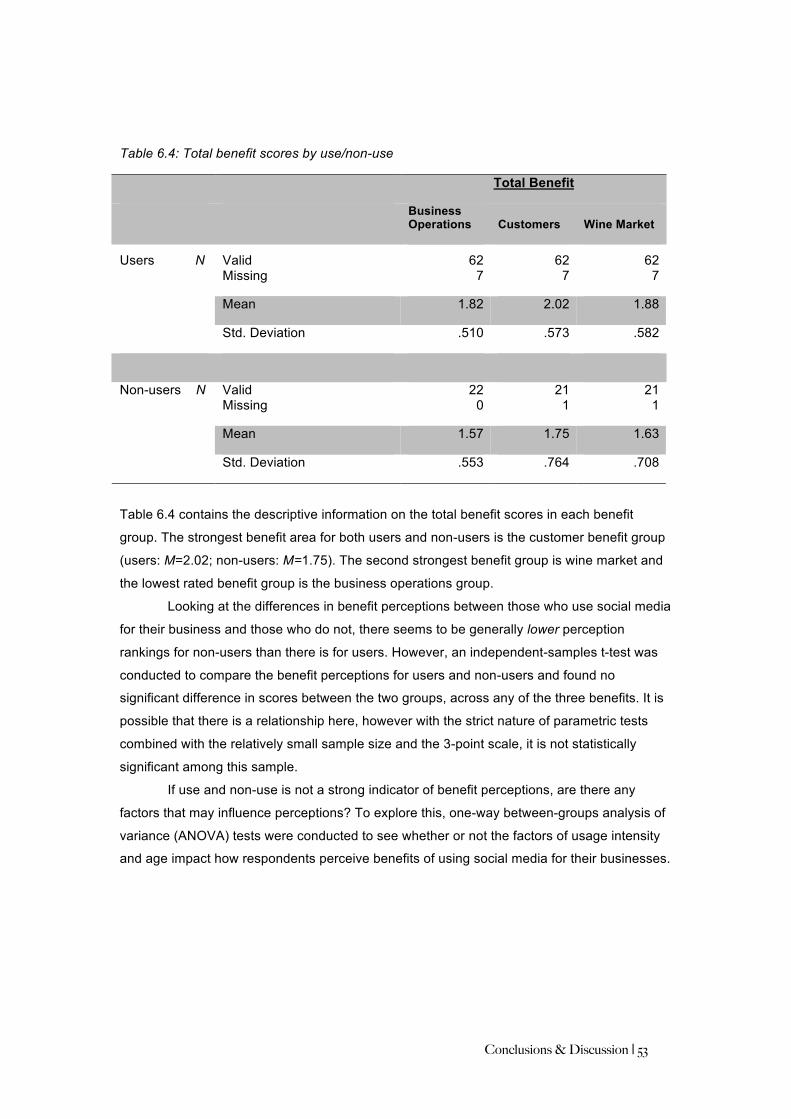
Conclusions & Discussion | 53
Table 6.4: Total benefit scores by use/non-use
Total Benefit
Business Operations Customers Wine Market
Valid Missing
62 7
62 7
62 7
Mean 1.82 2.02 1.88
Users N
Std. Deviation .510 .573 .582
Non-users N Valid Missing
22 0
21 1
21 1
Mean 1.57 1.75 1.63 Std. Deviation .553 .764 .708
Table 6.4 contains the descriptive information on the total benefit scores in each benefit
group. The strongest benefit area for both users and non-users is the customer benefit group
(users: M=2.02; non-users: M=1.75). The second strongest benefit group is wine market and
the lowest rated benefit group is the business operations group.
Looking at the differences in benefit perceptions between those who use social media
for their business and those who do not, there seems to be generally lower perception
rankings for non-users than there is for users. However, an independent-samples t-test was
conducted to compare the benefit perceptions for users and non-users and found no
significant difference in scores between the two groups, across any of the three benefits. It is
possible that there is a relationship here, however with the strict nature of parametric tests
combined with the relatively small sample size and the 3-point scale, it is not statistically
significant among this sample.
If use and non-use is not a strong indicator of benefit perceptions, are there any
factors that may influence perceptions? To explore this, one-way between-groups analysis of
variance (ANOVA) tests were conducted to see whether or not the factors of usage intensity
and age impact how respondents perceive benefits of using social media for their businesses.

Conclusions & Discussion | 54
Usage and Perceived Benefits
It is likely that the amount of time a user is investing in social media for their business would
impact the benefits they gain from using the tools. Therefore, it was decided to explore this
relationship further using a one-way between-groups ANOVA. Users were divided into three
groups, casual, moderate and intensive, according to their indicated amount of time spent on
social media per week (casual: less than 2 hours per week; moderate: 2-5 hours per week;
intensive: more than 6 hours per week). There was a statistically significant difference at the
p<.05 level in all three benefit scores for the levels of user intensity [Business Operations:
F(2, 59)=6.9, p=.002; Customers: F(2,59)=6.8, p=002; Wine Market: F(2, 59)= 5.5, p=.006].
Despite the small differences between mean scores due to the 3-point scales, the effect size
calculated using eta squared, in each case was larger than .14 reflecting a large effect
(Cohen, 1988). Tukey HSD tests were run for post-hoc comparisons on each of the three
benefits areas in order to identify where these significant differences occurred.
For perceived benefits related to business operations, results indicated significant
differences in mean scores of casual users (M= 1.6, SD=.462), and those of moderate (M=
1.99, SD=.332) and intensive (M=2.12, SD=.688) users. For perceived benefits related to
customers, results indicated that the mean score for casual users (M=1.78 , SD=.552 ) was
significantly different from both moderate (M= 2.18, SD=.513 ) and intensive (M=2.4 ,
SD=.452 ) users. The negative mean differences for business operations and customer
benefits suggests that both moderate and intensive users have stronger perception of
benefits of using social media for their business when it comes to their business operations
and their customers than casual users.
For perceived benefits related to the general wine market, the significant difference
occurred between the mean scores for casual users (M=1.65, SD=.501) and moderate users
(M=2.1, SD=.557). The negative difference in mean scores indicates that moderate users
have stronger perception of benefits of using social media for their business when it comes to
their customers than casual users. These correlations are illustrated in Figure 6.2 below.
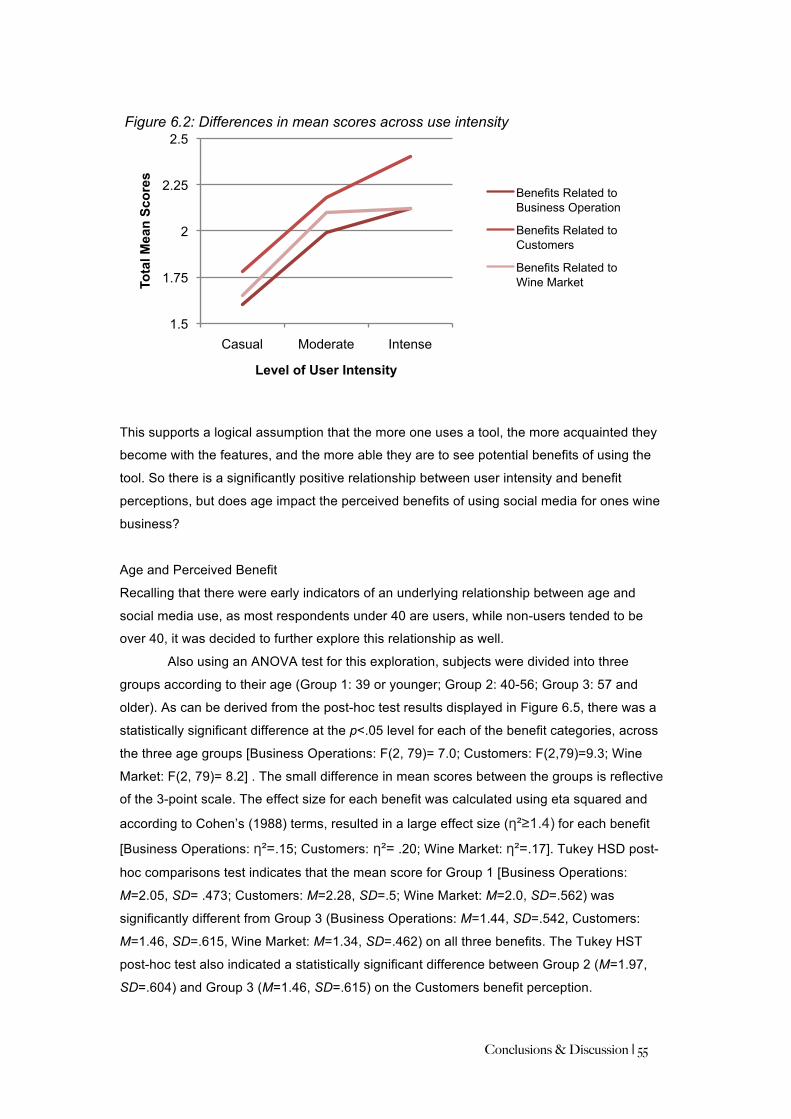
Conclusions & Discussion | 55
This supports a logical assumption that the more one uses a tool, the more acquainted they
become with the features, and the more able they are to see potential benefits of using the
tool. So there is a significantly positive relationship between user intensity and benefit
perceptions, but does age impact the perceived benefits of using social media for ones wine
business?
Age and Perceived Benefit
Recalling that there were early indicators of an underlying relationship between age and
social media use, as most respondents under 40 are users, while non-users tended to be
over 40, it was decided to further explore this relationship as well.
Also using an ANOVA test for this exploration, subjects were divided into three
groups according to their age (Group 1: 39 or younger; Group 2: 40-56; Group 3: 57 and
older). As can be derived from the post-hoc test results displayed in Figure 6.5, there was a
statistically significant difference at the p<.05 level for each of the benefit categories, across
the three age groups [Business Operations: F(2, 79)= 7.0; Customers: F(2,79)=9.3; Wine
Market: F(2, 79)= 8.2] . The small difference in mean scores between the groups is reflective
of the 3-point scale. The effect size for each benefit was calculated using eta squared and
according to Cohen’s (1988) terms, resulted in a large effect size (η²≥1.4) for each benefit
[Business Operations: η²=.15; Customers: η²= .20; Wine Market: η²=.17]. Tukey HSD post-
hoc comparisons test indicates that the mean score for Group 1 [Business Operations:
M=2.05, SD= .473; Customers: M=2.28, SD=.5; Wine Market: M=2.0, SD=.562) was
significantly different from Group 3 (Business Operations: M=1.44, SD=.542, Customers:
M=1.46, SD=.615, Wine Market: M=1.34, SD=.462) on all three benefits. The Tukey HST
post-hoc test also indicated a statistically significant difference between Group 2 (M=1.97,
SD=.604) and Group 3 (M=1.46, SD=.615) on the Customers benefit perception.
1.5
1.75
2
2.25
2.5
Casual Moderate Intense
Tota
l Mea
n Sc
ores
Level of User Intensity
Figure 6.2: Differences in mean scores across use intensity
Benefits Related to Business Operation
Benefits Related to Customers
Benefits Related to Wine Market

Conclusions & Discussion | 56
Table 6.5: Results from Tukey HST post-hoc test exploring impact of age on benefit perceptions
Age In Years (I)
Age In Years (J)
Mean Difference Sig.
40-56 .314 .058 <= 39
57+ .612* .001*
<= 39 -.314 .058
Benefits Related to Business Operations
40-56
57+ .298 .107
40-56 .310 .121 <= 39
57+ .817* .000*
<= 39 -.310 .121
Benefits Related to Customers
40-56
57+ .508* .009*
40-56 .048 .948 <= 39
57+ .659* .002*
<= 39 -.048 .948
Benefits Related to the Wine Market
40-56
57+ .611* .001*
*Indicates a significant relationship at the p≤.05 level.
Thus, there is consistently a statistically significant difference in all three perceived benefits of
using social media for one’s business, between those who are younger than 40, and those
who are 57 and older. In other words, respondents under 40 years old perceive social media
as more beneficial to their business in the areas of business operations, customers and the
wine market, than those who are over 57 years old. Additionally, there is also a statistically
significant difference across each of the three age groups in the perceived benefit of using
social media as it relates to a business’ customers.
Figure 6.3 visually displays the negative relationship between age and perceived
benefits. Here we can see that the older the respondent, the lower their average perceived
benefits of social media use for business. Recalling the frequencies of age among users and
non-users, this test has offered further insight into an underlying relationship between use
and age. While users tend to be younger, younger respondents also have higher perception
of the benefits of using social media for business. And the corollary of this is that older
respondents have lower perception of the benefits of using social media for business
purposes.

Conclusions & Discussion | 57
Direct Results
Lastly, respondents were given an opportunity to share any direct results they have seen from
using social media for their business. Many respondents shared compelling examples, in
different benefit areas. Some users reported direct results impacting their events and in store
visitors, for example, one said “10% more participants at wine tasting events,” and another
shared, “50% of visitors are linked to social media”. Some say social media use directly
impacts sales, like one respondent who explained “Customers who are very content with a
particular wine Facebook and Twitter about it. This results sometimes in other customers
ordering the same wine,”-52, owner/manager of an online store. And a 38-year-old
owner/manager of an online shop shared more PR related benefit related to an event, they
explained their “…BSOCIAL campaign where we gave three minutes of working for
Voedselbank, a Dutch charity for every Facebook like.”
So we’ve seen that users do see direct and indirect benefits of using social media for
their business, but there are still businesses who do not use it. This begs the question, why
not? In addressing this part of the research questions guiding this research, we look to the
reports on non-user barriers.
6.3 | Why Not?
First, to gauge openness to social media, non-users (N=22) were asked if they have even
considered using social media for their business. This would give some indication of how
closed or open SME decision makers are to adopting these media for their business. Of non-
users, 59% (N=13) indicated that yes they have considered it. This, combined with the high
percentage of respondents who are users, is indicative of the current relevance of this subject
to the industry. In a sense, if on-trade businesses aren’t using social media yet, they are likely
considering it. So what’s stopping owner/managers from getting on the bandwagon?
1
1.25
1.5
1.75
2
2.25
2.5
<39 40-56 57+
Tota
l Mea
n Sc
ores
Age in Years
Figure 6.3: Age and perceived benefits
Business Operations
Customers
Wine Market

Conclusions & Discussion | 58
To address barriers to use non-users were asked how strongly a series of potential
barriers impact why they do not use social media. Seven barrier statements were tested on a
scale of Not at all (1), Somewhat (2) and Strongly (3). Table 6.6 displays the results.
Table 6.6: Non-user barrier frequencies
N Valid Missing Mean
Std. Deviation
I don’t know where to begin 21 1 2.10a .889
I haven’t had time 21 1 2.00a .775
I’m not sure how it will benefit my business 21 1 1.90a .831
I have heard negative opinions about it 21 1 1.71 .644
I don’t think my customers are using it 21 1 1.57 .598
I have concerns about how to maintain it 21 1 1.86 .293
I am not interested in changing how I do business 21 1 1.57 .676
a Indicates three highest mean frequencies.
Most non-users (66.7%) indicated to some extent that not having enough time is a barrier to
social media use. Other barrier statements that were among the strongest reported by non-
users include I don’t know where to begin (M=2.10) and I’m not sure how it will benefit my
business (M=1.90). As noted in the table, the barrier with the most frequently reported a
“strongly” impacting their reason for not using do not know where to begin.
It is also interesting to note the two lowest reported barriers to social media use for
owner/managers, these are I don’t think my customers are using it and I’m not interested in
changing how I do business. Here we see that these reasons do not strongly impact why
owner/managers are not using social media for their SME.
Additional Barriers
Non-user respondents were given the opportunity to share any additional factors that
influence why they do not currently use SNS for their business. Like the user open response
question, this question also yielded some interesting and additionally insightful information.
Some more general reasons non-users gave include, “We are not working on the private

Conclusions & Discussion | 59
market” an expansion of customer related concerns as tested in the barrier-scale questions. A
65-year-old owner/manager of an “other” type of business elaborated on the time barrier by
explaining “I have to do everything by myself and to find time for all the new systems is a big
problem for me”. Another 55-year-old owner/manager of an online/web shop simply said
“Cost (in time)”.
Others describe concerns like “There is not enough privacy”-44, owner/manager of
wine/specialty store; and “Exclusivity within wine business makes it difficult for me to
communicate via social media”-42, sales director of “other” business type. One perhaps more
wine and media traditionalist, reaction from a 57-year-old owner/manager of a wine/specialty
store was “too much bla bla, negative reactions from those who know not much or nothing
about the product.” This brushes upon a very common trend particular to the wine industry in
that, it is an industry deeply rooted in complex knowledge and familiarity with the product, in
which years of experience or education leads knowledge or understanding the product. This
particular non-user highlights a possible annoyance with the wine-consumer noise online.
On the other hand, some respondents are more open to social media use for their
business and say, “I just have to take the step!”- 40, owner/manager of wine/specialty store,
or seem open but overwhelmed “I don’t know how to start”-56, owner/manager of
wine/specialty store.

Conclusions & Discussion | 60
VI. CONCLUSIONS & DISCUSSION
Introduction
The purpose of this thesis was to explore how small to medium wine enterprises are using
social media tools for their business. This research relied on theories and practices from the
areas of small to medium enterprises (SMEs), e-business adoption competencies, wine
marketing and Web 2.0 to develop an exploratory survey. The online survey targeted on-trade
wine businesses in the Netherlands, asking owner/managers and other decision makers
about various aspects of their business and their personal and professional use of social
media as it relates to their business. In this conclusion and discussion of the findings, results
will be put into context in order to answer the research questions guiding this research. Then
relevance and implications and limitations of this study will be discussed. And finally,
suggestions for further research will be made.
7.1 | Overview of Conclusions
Beginning with a solid framework for understanding the nature of the Dutch wine market and
the complexity of the wine product category this research sought to explore the marketing and
communication efforts of on-trade businesses in the Netherlands. By drawing a connection
between the challenges and characteristics unique to SMEs and their entrepreneurial
owner/managers and the ongoing developments and increased impact and participation of
Web 2.0, we begin to have a context within which to align social media tools with the needs of
SMEs.
As demonstrated, past research has explored the areas of e-business adoption
competencies, SME theories explain the unique characteristics of owner/managers of SMEs
and the challenges they are faced with. These challenges for SMEs also have an impact on
their marketing and communications efforts. Combining bodies of research in these areas to
place these challenges within the context of Web 2.0 we begin to see alignment with the
increased shift toward word-of-mouth marketing and customers relationship marketing, and
the capabilities and characteristics of Web 2.0. When viewed this way, it would be expected
that SMEs especially, would move toward these types of marketing efforts and be inclined to
adopt easily accessible tools with low entry barriers and minimal hard costs.
Ultimately, this research drew from a segment of the wine industry and targeted
SMEs Dutch wine market to explore if and how SMEs in this market are adapting to these
changes.

Conclusions & Discussion | 61
To what extent are Dutch on-trade wine businesses using social media for their business?
The results of this survey, containing 99 individual cases predominantly reflect
owner/managers of wholesale, horeca supply and wine, liquor, cheese and specialty
businesses. Overall, the findings of this research suggest that if on-trade businesses are not
yet using social media for their business, they are considering it. Taken further, the findings
suggest that not only are most on-trade businesses already using social media to some
extent, but most are using it somewhat or regularly to perform various activities related to
running a business. And those who are using it intensively (6+ hours per week) see much
stronger benefits of using these tools than those who use it casually (less than 2 hours per
week).
Also, the demographic questions related to the businesses and the respondents have
provided a general profile for both users and non-users of social media for Dutch on-trade
wine businesses. By using the largest percentage representations in each business area, on-
trade businesses that use social media for their business can be summarized as:
microenterprises that have been open for 11+ years, that employ 1 or 2 people and sold
under 10.000 bottles last year and earned less than €100.000 in 2011. Those businesses that
do not use social media for their business can be described as: B2B-oriented businesses that
employ only 1 or 2 people, sold less than 50.000 bottles last year and have an
owner/manager or primary decision maker who is over 40 years old.
The results also indicated that some SNS are being used more to conduct activities
than other networks. Generally, Twitter is the most used network across most of the activities
with the exception of professional networking and reading reviews on products. In these
areas, it is logical that LinkedIn, a network for professional networking, would be preferred
over Twitter for connecting with other industry professionals. Considering that Twitter is a
microblogging site with a maximum 140-character length on each post, it is also logical that
users would not be reading extended reviews or articles on products using this SNS. It is
surprising however, that Twitter surpassed Facebook on all other activities. This would
indicate that Twitter is generally, the most preferred network among on-trade businesses
participating in this survey.
Recalling that an increasing shift toward word of mouth (WOM) and customer
relationship marketing (CRM) among businesses is complimentary and in a marketing an
communications context, parallel with the characteristics of Web 2.0 phenomena, we
expected to see on-trade SMEs utilizing social media tools to facilitate these activities.
Results from the frequency of use reports on the 15 types of activities, provide some early
insights in this area. In the areas of building brand awareness for products and name
recognition for the business as well as hearing what customers are saying results indicate
higher frequencies of use. In marketing terms, these are all aspects of WOM, therefore we

Conclusions & Discussion | 62
can deduce that SMEs are using the Web 2.0 characteristics exemplified by SNS in an effort
to influence word-of-mouth surrounding their business and products.
That being said, in the area of CRM, the activity tested frequency of use to find and
connect with new customers and yielded a moderate average. While this is still among the
higher mean scores across all activities it is not as strong as the WOM-related activities. This
is a surprising indication and is certainly worth further exploration.
Another point for discussion stems from the results regarding the benefits of using
social media for activities related to competitors in the wine market. These results are an
indication that some, perhaps more savvy on-trade businesses are using social media as a
peephole into their competitor’s activities then using these observations to gauge and
consider their own activities. On one hand, an on-trade business concerned about the
exposure and transparency elements of social media use for business could view this as a
major threat to their business. On the other hand, an opportunistic, more entrepreneurially
oriented owner/manager may see social media as low-cost, easily accessible tools to help
them gain greater insights into the market. And surely an economist would support this
perspective by highlighting that this is an added dynamic of economic competition in which
some businesses are now using social media tools to assist in the pursuit of a greater market
share.
Additionally, recalling that all businesses that have opened in the past three years are
using social media for their business to some extent is a significant finding suggestive of an
underlying trend in new business strategies. Congruent with many of the cited advantages of
using social media tools, especially the low-entry barriers and zero hard costs, it is logical that
new businesses would utilize these tools given the challenges and limited resources available
them. That being said, there were no statistically significant indications that social media use
has a strong relationship with sales performance from 2011.
If businesses are using social media, how and why are they using it?
Of the 15 activities tested across three business areas respondents indicated that
they are most frequently using social media for their business to: build brand recognition for
their products, build name recognition for their business, and to communicate information
about their business (ex. events, products, business hours). Recalling the challenges that
SMEs, like on-trade wine businesses are faced with, not only do they need to differentiate
themselves from their competitors, but they also must distinguish their products as well. Here
we see that these are two areas in which social media are regularly being used to benefit
these businesses. This is a significant finding and supports that where social media tools can
be very useful to SMEs, they are being used in these areas.
Regarding business operations, on-trade businesses participating in this survey indicated
they are to some extent, also using social media to learn how their competitors are interacting
with customers and what promotions they are offering.

Conclusions & Discussion | 63
There was a surprisingly low frequency in benefits related to business operations on
the activity finding new products. However, considering that this is survey asked about the
use of social media to perform these activities, it is likely that some combination of search
engines and distributor and producer websites are more utilized to seek new products. Then
once a product has been found of interest to an owner/manager, it is logical that they would
then use social media to see what consumers are saying about that product, how they are
rating the product or what feedback there is on the product.
Assuming that benefits of using social media are indicators of why they are using,
perceptions of benefits were tested across three business benefit areas, that is, benefits
related to business operations, those related to customers and those related to the general
wine market. The strongest reported benefit group for users was the benefits related to
customers, followed by benefits related to the wine market, and then those related to
business operations. In pursuing possible indicators of benefit perceptions, statistical
analysis revealed that intensity of use and age are strong indicators of benefit perceptions.
This revealed that the more owner/managers are using social media tools for their business,
the stronger their perception of the benefits is. Additionally, the older an individual is, the less
likely they are to have positive perception of the benefits of using social media for their
business. It was also found that use and non-use had a statistically insignificant impact.
Open responses regarding direct benefits of using social media for these businesses
included many clear examples connected to ROI, brand recognition and PR. These
responses provided concrete information regarding how these businesses are gaining from
using these tools that could have a positive impact on the opinions and concerns of non-
users. The direct benefits they provided are really compelling examples of the various direct
and indirect ways social media can impact the business, some resulting in direct return on
investment (ROI) which, in many marketing activities is difficult, sometimes impossible, to
track.
If businesses are not using it, what are the perceived threats, barriers or consequences?
A large percentage of non-users are either B2B
wholesalers or an “other” type of business. This is
indicative of a broader challenge for marketing in
communications to identify the best strategies and
approaches to using SNS as a B2B communications
medium. It comes as no surprise that if marketers and
communications professionals find this challenging,
that so too would SME owner/managers. Seven
barriers to social media use for SMEs in the Dutch
on-trade wine market were tested among non-
users. Owner/managers indicated that the two

Conclusions & Discussion | 64
strongest factors impacting why they are not using social media are not having time, not
knowing where to begin, and being unsure how it will benefit their business. The two factors
weakest factors impacting non-use are I don’t think my customers are using it and I’m not
interested in changing how I do business.
Open responses regarding any additional factors impacting non-use revealed
additional concerns about using social media for their business. One 44 year old
owner/manager of a wine, specialty store said there is “not enough privacy”. Another
respondent, 65 owner/manager of a small operation selling “only few boxes of wine to horeca
and consumers” elaborated on time commitment concerns by expressing that they feel
overwhelmed by “all the new systems”. Results indicate that non-users are relatively open-
minded toward using social media, and that they do perceive benefits to using it for their
business. They simply are unsure how to start, what to do and have concerns about how
much time it can take.
The results on reported barriers to use revealed that I don’t think my customers are
using it and I’m not interested in changing how I do business were ranked among the factors
least influencing non-use. From this we can deduce that even non-users recognize that their
customers are likely using social media, and they are not closed off to changing how they do
business. This has interesting implications on marketers in this industry and highlights an
area of opportunity in that, it seems that if owner/managers were equipped with basic
knowledge, insights and information regarding how to begin, the benefits others’ are seeing
there is a high likelihood for increased social media adoption among them.
This information contains many implications both for owner/managers of Dutch on-
trade businesses and for marketers, particularly in the wine industry.
7 .2 | Relevance & Implications
There is currently a lot of buzz surrounding Web 2.0 and social media in most industries,
including the wine industry. This research brings empirical findings to a pool of academic and
practitioner speculations on the impact of Web 2.0 and social networking sites in the
professional sphere, as well as the value of social media for SMEs, and the traditional wine
industry. This research is a leading step toward integrating an industry embedded in traditions
and product knowledge with new, low-cost, easily accessible Web 2.0 platforms and
applications.
The findings reflect a major shift in the way small to medium wine businesses are
marketing and communicating about their business and their products. This shift is
representative of a larger phenomena in which we see an industry which is heavily embedded
in traditional communication and marketing tactics and largely run by older, wine-educated
professionals intersecting with a wave of young, new business owners utilizing
communication tools in a way that could dramatically impact the market. These results can be

Conclusions & Discussion | 65
used as a launch board for wine-educators and marketers looking to help these on-trade
businesses thrive or to help owner/managers see the potential value of social media tools.
Implications for Current Users
Depending on what level of user intensity the business may be, the results of this study
suggest that the more intensively a business uses social media, the stronger the benefits they
may yield. And in questioning whether it is worth the investment of additional time or
personnel, the direct responses reported by fellow users reveal that direct ROI results are not
only possible, but thanks to the characteristics of Web 2.0 and social networking sites, they
are also track-able and easily adjustable unlike more traditional wine marketing tactics like
shelf-talkers. This means that if your page views or shared tweets aren’t getting the results
you would like, it is simply a matter of changing the approach whether that means sharing
different types of content or connecting with different types of consumers.
Implications for Current Non-users
If these results and current research is any indicator—social media is now a part of
conducting business affecting all areas from customer relationships, product information
gathering to buying and selling products. As previously mentioned, if on-trade
owner/managers aren’t using social media yet, they are considering it. Most notable among
the benefits of use, relevant to the general market is this element of using social media tools
to learn what competitors are doing. While this can be intimidating to non-users, or even
casual users, social media should be considered a new challenge among on-trade
businesses and it is likely that it will increase in its impact in all areas of business operations,
customer relationships and gathering of general wine market information. Many practitioners
believe that transparency in conducting business and care with customer relationships are the
key to success in a Web 2.0 market and social media tools are very well positioned to help
SMEs engage. Knowing the type of consumers that are the primary customers of your
business can help guide the type of content you share via social media, and give you a place
to start. And remember, getting started is as simple as thinking of what your business has to
offer your customers who are online, then choosing the social media tool best suited to help
you share that information.
Implications for Marketers
The results from this research, particularly in the area of non-user barriers reveal that there’s
hope for marketers looking to help SMEs reach their business and communication goals. If
prospective or current clients or decision makers have hesitations about adopting social
media for their business, the findings of this research regarding non-use barriers provide
actionable insights to address these hesitations. With the strongest factors indicated as time

Conclusions & Discussion | 66
concerns and not knowing where to begin, as marketers this is a clearly identifiable and easy-
to-address and hopefully ease these concerns by offering services and tactics in such a way
that directly ease these pain-points.
Also, the lower ranking benefits perceptions among the 15 activities can serve as
guides for to marketers help current users boost their existing online efforts. Perhaps they are
naturally strong in using the tools to benefit their business in some areas but struggle to
understand how the tools can be utilized to impact other areas of benefits. As marketers this
offers great room for development of more complex communication strategies and evaluation
of currently used social media tools.
Implications for Producers and Distributors
The high percentage of existing users is an indication that the businesses selling your
products are likely easy to reach and connect with online. Also, the results suggest that these
resellers are looking for content to share about the products they offer. As a producer or
distributer this is an opportunity for you to engage and inform the businesses responsible for
putting your product in the hands of the consumer. As a sales representative working for
producer or distributor, your existing and prospective customers are likely active online both
personally and professionally. Considering that you can’t be everywhere at once to cultivate
each of your client relationships, social media tools offer you an easy, manageable
supplement to maintaining your offline relationships by interacting with your customers online.

Conclusions & Discussion | 67
7.3 | Limitations and Suggestions for Further Research
This exploratory study is the first of its kind in both market relevance and media
studies. It is a first step to exploring how social media can and are being utilized as
tools for SMEs to conduct various business-related activities. It is also, to the
researcher’s best knowledge, a first of its kind in exploring potential barriers for non-
users of social media for business. However, there are some shortcomings to the
method and the research.
First, it was known that conducting an online survey targeting individuals who
run their own business would present challenges however the sample size was lower
than expected. One possible explanation for this is the language barrier. As
mentioned, it was not within the resources or scope of this project to conduct the
survey in the Dutch language however if this survey were to be redistributed, it would
be suggested to do so. Another explanation is the natural constraints of conducting
an online survey like lower response and completion rates. Additionally, the nature of
an online distributed survey yields some likelihood that the sample is biased toward
owner/managers who are using email to conduct business. Nonetheless, the insights
gleaned from the results of the survey provided interesting, practical and relevant
information. It is recognized that due to the distribution method in the second phase
of data collection, it is likely that the data will reflect more social media users than
non-users. The results may not be reflective of the overall market social media use
and non-use.
This study also leads to indications that this area offers fertile grounds for
further research. One area worth further exploration is that of staff size and social
media use. One way this could be approached is to ask who is actually generating
content and monitoring activity for businesses using the tools. Exploring whether
there is a relationship between additional staff have been hired specifically to run
social media for SMEs or if it is the owner/manager and comparing this to the level of
engagement, activity and direct results the business sees can be very insightful for
both business users and marketers moving forward.
Another area that this study did not touch on, is the area of identifying and
addressing challenges of social media use for users. Do users struggle getting
results after a certain amount of use? Is it difficult to know what to do when a
customer publically complains about a product or service received? This is an
important aspect on the periphery of PR and crisis communications in a way, yet it is
expected that this area will become of increasing significance as adoption levels
increase among SMEs.

Conclusions & Discussion | 68
One final area for further research is a more in-depth examination of the
users category. A closer look at what tools they are using, if and how they are
engaging their network and to what degree they are monitoring or tracking results
can be very interesting. Particularly a qualitative analysis of the activity occurring on
social network profiles of SMEs would reveal a great deal more about how users are
using these tools.

References | 69
VII. REFERENCES Alexander, B., & Levine, A. (2008). Web 2.0 Storytelling, Emergence of a New
Genre. EDUCAUSE Review, 43(6). Retrieved from: http://net.educause.edu/ir/library/pdf/ERM0865.pdf
Alvarez, A. A., & Busenitz, L. W. (2001). A resource-based theory of
entrepreneurship. Journal of Management, 27(6), 755–775. Andersen, P. H. (2005). “Relationship marketing and brand involvement of
professionals through web-enhanced brand communities: The case of Coloplast.” Industrial Marketing Management, 34, 285-297.
Anderson, C. & Wolff, M. (2010, Sept.). The Web Is Dead. Long Live the Internet.
Wired. Retrieved from http://www.wired.com/magazine/2010/08/ff_webrip/all/1 Beer, D. & Burrows, R. (2010). Consumption, prosumption and participatory web
cultures. Journal of Consumer Culture, 10(1), 3-12. Berry, L. L. (1983). Relationship marketing. In Berry, L. L., Shostack, G. L. and Upah,
G. D. (Eds). Emerging Perspectives on Service Marketing, 25-38. American Marketing Association, Chicago, IL.
Bickart, B., & Schindler, R. M. (2001). Internet forums as influential sources of
consumer information. Journal of Interactive Marketing, 15(3), 31–40. Boyd, d. m. & Ellison, N. B. (2007). Social network sites: Definition, history, and
scholarship. Journal of Computer-Mediated Communication, 13(1), 210-230. Broderick, P., Dhaliwal, J., & Jutla, D. (2002). Supporting the e-business readiness of
small and medium sized enterprises: approaches and metrics. Internet Research: Electronic Networking Applications and Policy, 12(2), 139–164.
Carbone, N. (2012, April 16). “Kony 2012 Sequel was a dud online.” Time News Feed. Retrieved from: http://newsfeed.time.com/2012/04/16/kony-2012-sequel-was-a-comparative-dud-online/
Carson, D. (1985). The evolution of marketing in small firms. European Journal of
Marketing, 19(5), 7-16.
Carson, D., Cromie, S., McGowan, P. & Hill, J. (1995). Marketing and
Entrepreneurship in SMEs: An Innovative Approach. Englewood Cliffs: Prentice-Hall International.
Carter, S. & Jones-Evans, D. (2000). Enterprise and Small Business: Principles,
Practice and Policy. Edinburgh: Pearson Education. Casteleyn, J., Mottart, A., & Rutten, K. (2009). FORUM – How to use Facebook in
your market research. International Journal of Market Research, 51(4), 439. Retrieved from http://www.warc.com/Articles/10.2501/S1470785309200669
Castelluccio, M. (2008). A new year, a new Internet. Strategic Finance, 89(7):59–60.
References | 70
Cheung, C. M. K., Lee, M. K. O., & Rabjohn, N. (2008). The impact of electronic
word-of-mouth: The adoption of online opinions in online customer communities. Internet Research, 18, 229–247.
ComScore, Inc. (2010, April 26). The Netherlands Ranks #1 Worldwide in
Penetration for Twitter and Linkedin [Press Release]. Retrieved from http://www.comscore.com/Press_Events/Press_Releases/2011/ 4/The_Netherlands_Ranks_number_one_Worldwide_in_Penetration_for_Twitter_and_LinkedIn
Cova B, & Pace S. (2006). Brand community of convenience products: new forms of customer empowerment — the case “My Nutella” community. European Journal of Marketing. 40(9/10),1087–1105. doi: 10.1108/03090560610681023 Coviello, N.E., Brodie, R.J. & Munro, H.J. (2000), “An investigation of marketing
practice by firm size”, Journal of Business Venturing, 15, 523-45. Cohen, J.W. (1988). Statistical power analysis for the behavioral sciences (2nd ed.).
Hillsdale, NJ: Lawrence Erlbaum Associates. Cohen, E. (2009). Applying best-worst scaling to wine marketing. International
Journal of Wine Business Research, 21(1), 8-23. Cuddeford-Jones, M. (2009, May 7). Social media breathes life into research.
Marketing Week, 25-26. Curran, J. & Blackburn, R. (1990, December). Small Firms and Local Economic
Networks: A Report to Midland Bank. Small Business Research Centre.
Databank Wijnimport. (n.d.). Productschap Wijn. Retrieved on March 15, 2012 from
http://wijn.nl/site/databankwijnimport/index.php?grp=4788 Daugherty, T., Eastin, M. S., & Bright, L. (2008). Exploring Consumer Motivations for
Creating User-Generated Content. Journal Of Interactive Advertising, 8(2), 1-24.
Day, J., Dean, A. A., & Reynolds, P. L. (1998). Relationship marketing: its key role in
entrepreneurship. Journal of Long Range Planning, 31(6), 828-37. De Valck, K., Van Bruggen, G., & Wierenga, B. (2009). Virtual communities: a
marketing perspective. Decision Support Systems, 47, 185–203. Eastlick, M. A., Lotz, S. L. & Warrington, P. (2006). Understanding online B-to-C
relationships: An integrated model of privacy concerns, trust, and commitment. Journal of Business Research, 59(8), 877-886.
Enterprise and Industry. (2003). Small and medium-sized enterprises (SMEs).
European Commission. Retrieved from http://ec.europa.eu/enterprise/policies/sme/facts-figures-analysis/sme-definition/index_en.htm
Entrepreneur. (n.d.) In Merriam-Webster’s online dictionary. Retrieved from
http://www.merriam-webster.com/dictionary/entrepreneur\
References | 71
Eysenbach, G. (2004). Improving the quality of web surveys: The checklist of
reporting results of Internet e-surveys (CHERRIES). Journal of Medical Internet Research, 6(3). Retrieved from http://www.jmir.org/2004/3/e34
Fan, W. & Yan, Z. (2010). Factors affecting response rates of the web survey: A systematic review. Computers in Human Behavior, 26(2), 132-139.
Ferguson, R. (2008). Word of mouth and viral marketing: taking the temperature of the hottest trends in marketing. Journal of Consumer Marketing, 25(3), 179-182.
Fillis, I., Johannson, U. & Wagner, B. (2004). Factors impacting on e-business
adoption and development in the smaller firm. International Journal of Entrepreneurial Behaviour & Research, 10(3), 178-191.
Generations Online in 2010. (2010, Dec. 16). Pew Internet and American Life
Project. Retrieved from http://pewinternet.org/Reports/2010/Generations-2010/Overview/Findings.aspx
Gummesson, E. (1987). The new marketing-developing long-term interactive
relationships. Long Range Planning, 20(4), 10-20. Gummesson, E. (2002), Practical value of adequate marketing management theory.
European Journal of Marketing, 36(3), 325-49. Gronroos, C. (1990). Relationship approach to marketing in service contexts: The
marketing and organizational behavior interface. Journal of Business Research, 20, 3-11.
Ha, H.-Y. (2002). The effects of consumer risk perception on pre-purchase
information in online auctions: Brand, word-of-mouth, and customized information. Journal of Computer-Mediated Communication, 8(1). Retrieved from http://www3.interscience.wiley.com/cgi-bin/fulltext/1208 37861/HTMLSTART.
Hart, A.M., Brennan, C.W., Sym, D. & Larson, E. (2009). The impact of personalized
prenotification on response rates to an electronic survey. Western Journal of Nursing Research, 31(1), 17-23.
Hennig-Thurau, T., Gwinner, K. P., Walsh, G., & Gremler, D. D. (2004). Electronic
word-of-mouth via consumer-opinion platforms: What motivates consumers to articulate themselves on the internet? Journal of Interactive Marketing, 18(1), 38–52.
Hennig-Thurau, T., Malthouse, E.C., Friege, C., Gensler, S., Lobschat, L.,
Rangaswamy, A., & Skiera, B. (2010). The Impact of New Media on Customer Relationships. Journal of Service Research, 13(3), 311-330. doi: 10.1177/1094670510375460
Högg, R., Meckel, M., Stanoevska-Slabeva, K., & Martignoni, R. (2006). Overview of
business models for Web 2.0 communities. Proceedings of GeNeMe 2006, 1-17, Dresden.

References | 72
Horverak, Ø. (2009). Wine journalism--marketing or consumers' guide? Marketing Science, 28(3), 573-579.
Industry. (n.d.). In Collins English Dictionary-Complete & Unabridged (10th ed.) online. Retrieved from http://dictionary.reference.com/browse/industry?s=t
Jeong, E. & Jang, S. (2011). Restaurant experiences triggering positive electronic
word-of-mouth (eWOM) motivations. International Journal of Hospitality Management, 30(2), 356-366.
Jones, C., Hecker, R., & Holland, P. (2003). Small firm Internet adoption: Opportunities forgone, a journey not begun. Journal of Small Business and Enterprise Development, 10(3), 287-287. Retrieved from http://search.proquest.com/docview/219316690?accountid=13598
Julien, P. A. (1993). Small business as a research subject: Some reflections on
knowledge of small business and its effects on economic theory. Small Business Economics, 5(2), 157–166.
Kanczula, A. (April 20, 2012). Kony 2012 in numbers. The Guardian: Datablog.
Retrieved from: http://www.guardian.co.uk/news/datablog/2012/apr/20/kony-2012-facts-numbers#zoomed-picture
Kaplan, A.M. & Haenlein, M. (2010). Users of the world, unite! The challenges and
opportunities of social media. Business Horizons, 53(1), 59-68. Keown, C., & Casey, M. (1995). Purchasing behaviour in the Northern Ireland wine
market. British Food Journal, 97(1), 17-20. Kony 2012. (2012, March 5). Kony 2012 [Video File]. Retrieved from
http://www.youtube.com/watch?v=Y4MnpzG5Sqc Krosnick J.A., & Berent, M.K. (1993). Comparisons of party identification and policy
preferences: the impact of survey question format. American Journal of Political Science, 37(3), 941-964.
Krosnick, J.A. (1999). Survey research. Annual Review of Psychology, 50, 537–567. Küng, L. (2008). Strategic Management in the Media. London: SAGE. Leskovec, J., Adamic, L. A., & Huberman, B. A. (2007). The dynamics of viral
marketing. ACM Transactions on the Web, 1(1), Article 5. doi: 10.1145/1232722.1232727
Li, C. (2007). Social technographics trends report- Mapping participation in activities
forms the foundation of a social strategy. Retrieved from http://forrester.com/go?docid=42057
Lievrouw, L., & Livingstone, S. (Eds.) (2006). Handbook of new media. Social
shaping and social consequences of ICTs. Updated Student edition. London: SAGE Publications.

References | 73
Lim, S., Trimi, S. & Lee, H. (2010). Web 2.0 service adoption and entrepreneurial orientation. Service Business, 4(3-4), 197-207. doi: 10.1007/s11628-010-0097-z
Lockshin, L. S., Spawton, A. L. & Macintosh, G. (1997). Using product, brand and
purchasing involvement for retail segmentation. Journal of Retailing and Consumer Services, 4(3), 171-183.
Longenecker, J. C ., Moore, C. W., & Petty, J. W. (2003). Small Business
Management – An Entrepreneurial Emphasis. USA: Thomson – South-Western.
Marketing. (2007, October). American Marketing Association. Retrieved from
http://www.marketingpower.com/AboutAMA/Pages/DefinitionofMarketing.aspx Martin, L. & Matlay, H. (2001). Blanked approaches to promoting ICT in small firms:
some lessons from the DTI ladder adoption model in the UK. Internet Research: Electronic Networking Applications and Policy, 11(5), 399-410.
McCorkindale, T. (2010). Can you see the writing on my wall? Public Relations
Journal, 4(3). Retrieved from http://www.prsa.org/intelligence/prjournal/documents/content_ analysis_of_the_fortune_50s_facebook.pdf
McGowan, P., Durkin, M. G., Allen, L., Dougan, C., & Nixon, S. (2001). Developing
competencies in the entrepreneurial small firm for use of the internet in the management of customer relationships. Journal of European Industrial Training, 25(2), 126-136. Retrieved from http://search.proquest.com/docview/215388563?accountid=13598
Morgan, R. M., & Hunt, S. D. (1994). The commitment–trust theory of relationship
marketing. Journal of Marketing, 58, 20–38. Mrkwicka, K., Kiessling, M., & Kolbe, L. (2009). Potential of Web 2.0 application for
viewer retention. Proceedings: Americas conference on information systems, San Francisco, California. Retrieved from: http://aisel.aisnet.org/amcis2009/485
Mulhern, F. (2009). Integrated marketing communications: From media channels to
digital connectivity. Journal of Marketing Communications, 15(2-3), 85-101. “Multilingual Population”. (2012). Iamsterdam. Retrieved on May 8, 2012 from
http://www.iamsterdam.com/en/business/news-features/netherlands/multilingual-population
Neff, J. (2010, Aug. 23). What happens when Facebook trumps your brand site? Ad
Age Digital. Retrieved from http://adage.com/article/digital/advertising-facebook-biggest-crmprovider/145502/
New Media Trend Watch. (2012). Netherlands. European Travel Commission.
Retrieved on April 16, 2012 from http://www.newmediatrendwatch.com/markets-by-country/10-europe/76-netherlands
Nielsen, J. (2006). Participation Inequality: Lurkers vs. Contributors in Internet

References | 74
Communities. Retrieved on May 23, 2012 from http://www.useit.com/alertbox/participation_inequality.html.
O.I.V. (2010, June 21). OIV’s summary on the global situation of the wine and vine
industry in 2009. Retrieved from http://www.diariodelvino.com/notas6/OIV_EN_2009.doc
O'Donnell, A. & Cummins, D. (1999), The use of qualitative methods to research
networking in SMEs. Qualitative Marketing Research: an International Journal, 2(2), 82-91.
O’Reilly, T. (2005). What is web 2.0? Design patterns and business models for the
next generation of software. Retrieved from http://www.oreilly.com/pub/a/oreilly/tim/news/2005/09/30/what-is-web-20.html
O’ Reilly, T. (2006, Dec. 10). Web 2.0 Compact Definition: Trying again. O’Reilly
Radar. Retrieved from http://radar.oreilly.com/2006/12/web-20-compact-definition-tryi.html
Pallant, J. F. (2005). SPSS Survival manual: a step by step guide to data analysis
using SPSS, Version 12. Crows Nest: Allen & Unwin. Poon, S. & Swatman, P. M. C. (1999). An Exploratory study of small business
Internet commerce issues. Information & Management, 35, 9-18. Poul, H.A. (2005). Relationship marketing and brand involvement of professionals
through web-enhanced brand communities: The case of coloplast. Industrial Marketing Management, 34(3), 285-297.
Quester, P. G. & Smart, J. (1998). The Influence of Consumption Situation and
Product Involvement Over Consumers’ Use of Product Attribute. Journal of Consumer Marketing, 15(3), 220-238.
Quinton, S. & Harridge-March, S. (2006). The interaction of technology in
entrepreneurial marketing: An illustrative case from a wine merchant. Strategic Change, 15(2), 85-102.
Rainie, L., Hitlin, P., Jurkowitz, M., Dimock, M., Neidorf, S. (2012, March 25). The
Viral Kony 2012 Video. Pew Research Center. Retrieved from: http://pewinternet.org/Reports/2012/Kony-2012-Video/Main-report.aspx
Ravald, A. & Gronroos, C. (1996), The value concept and relationship marketing.
European Journal of Marketing, 30(2), 19-30.
Rayport, J. F., Jaworski, B. J. & Kyung, E. J. (2005). Best face forward: Improving companies’ service interfaces with customers. Journal of Interactive Marketing 19(4), 67-80.
Rogers, E. M. (1995). Diffusion of Innovations (4th ed.). New York: Free Press. Segaran, T. (2007). What is Collective Intelligence? Programming Collective
Intelligence (pp.1-5). Sebastopol, CA: O’Reilly Media, Inc.

References | 75
Simpson, M., & Docherty, A. (2004). e-Commerce adoption, support and advice for UK small firms. Journal of Small Business and Enterprise Development, 11(3), 315–328.
Slater, S. F., & Narver, J. C. (1995). Market orientation and the learning organization. Journal of Marketing, 59(3), 63–75.
Storey, D. J. (1982). Entrepreneurship and the Small Firm. London : Croom Helm.
Storey, D. J. (1997). Understanding the Small Business Sector. London: International
Thomson Business Press. Thach, L. (2009). Wine 2.0--the next phase of wine marketing? Exploring US winery
adoption of wine 2.0 components. Journal of Wine Research, 20(2), 143-157. Thach, L., Olsen, J., & Wagner, P. (2011). Wine Marketing and Sales: Success
Strategies for a Saturated Market (2nd ed). San Francisco: Wine Appreciation Guild.
Thompson, K.E. & Vourvachis, A. (1993). Social and attitudinal influences on the
intention to drink wine. International Journal of Wine Marketing, 7(2), 35-45. Thrassou , A. & Vrontis , D. (2006). A small services firm marketing communications
model for SME-dominated environments. Journal of Marketing Communications, 12(4): 1352–7266.
Trusov, M., Bucklin, R. E., & Pauwels, K. (2009). ‘Estimating the Dynamic Effects of
Online Word-of-Mouth on Member Growth of a Social Network Site’. Journal of Marketing, 73, 90-102.
Van Dijck, J. & Nieborg, D. (2009). Wikinomics and its discontents: A critical analysis
of web 2.0 business manifestos. New Media & Society, 11(5), 855-874. Vrontis, D., Thrassou, A. & Czinkota, M. R. (2011). Wine marketing: A framework for
consumer-centred planning. Journal of Brand Management, 18(4-5), 245-263. Wahlster, W., Schwarzkopf, E., Sauermann, L., Roth-Berghofer, T., Pfalzgraf, A.,
Kiesel, M., Heckmann, D., et al. (2006). Web 3.0: Convergence of Web 2.0 and the Semantic Web. Deutsche Telekom Technology Radar.
Wakolbinger, L.M., Denk, M., & Oberecker, K. (2009). The Effectiveness of
Combining Online and Print Advertisements. Journal of Advertising Research, 49(3), 360-372.
Walther, J. B. & Parks, M. R. (2002). Cues filtered out, cues filtered in: Computer-
mediated communication and relationships. In M. L. Knapp & J. A. Daly (Eds.), Handbook of interpersonal communication (pp. 529–563). Thousand Oaks, CA: Sage.
Walther, J. B., Van Der Heide, B., Hamel, L. M. & Shulman, H. C. (2009). Self-generated versus other-generated statements and impressions in computer-mediated communication. Communication Research, 36(2), 229-253.

References | 76
Weinrauch, J. D., Man, K., Robinson, P. A. & Pharr, J. (1991). Dealing with limited financial resources: a marketing challenge for small business. Journal of Small Business Management, 29(4), 4-54.
Willemsen, L. M., Neijens, P. C., Bronner, F., & Ridder, J. A. (2011). “Highly
Recommended!” The Content Characteristics and Perceived Usefullness of Online Consumer Reveiws. Journal of Computer-Mediated Communication, 17, 19-38.
Wirtz, B.W., Schilke, O. & Ullrich, S. (2010). Strategic development of business
models: Implications of the web 2.0 for creating value on the internet. Long Range Planning, 43(2–3), 272-290.
Zotanos, G., Anderson, A.R. (2004). Relationships, marketing and small business: an
exploration of links in theory and practice. Qualitative Market Research: An International Journal, 7(3), 228-236.

APPENDIX 1

FINAL SURVEY3 On‐Trade Businesses and Social Media
This survey seeks to understand your opinions and use of social media for your wine business. Throughout this survey you will be asked about your use of social networking sites or social networks. Facebook, Twitter and LinkedIn are examples of social networks. The survey should take approximately 10 minutes to complete, please complete the survey in full. In exchange for your time, you will receive by email "Social Media: Insights to the Dutch Wine Market", derived from the findings of this research. Thank you.
1. What is your age?
2. What is your sex?
Male
Female
3. How would you classify your primary business activity? (Choose the most important area of your business)
Wholesaler (business to business, not horeca)
Wine/Liquor/Cheese/Specialty Store (business to consumer)
Horeca Supplier (business to business, focusing on horeca)
Online/Web Shop
Cash & Carry
Other ____________________
4. What is your primary role in this business?
Owner/Manager
Buying Manager
Sales Representative
Other ____________________
1 Please note this was an online survey and the formatting of some questions may appear differently than it was displayed in the user interface of Qualtrics.

5. In what province is this business located?
Drenthe
Flevoland
Friesland
Gelderland
Groningen
Limburgh
North Brabant
North Holland
Overijssel
South Holland
Utrecht 6. How many people work for this business?
1‐2
3‐5
6‐10
11+
7. How long has this business been in operation or selling wine?
Less than a year
1‐2 years
3‐5 years
6‐10 years
11+ years 8. What is your estimated sales from 2011?
Less than 100.000€
100.000‐250.000€
251.000‐500.000€

500.000‐1€ million
More than 1€ million 9. What is your estimated volume of bottles sold in 2011?
0‐10.000 bottles
10.000‐50.000 bottles
50.000‐100.000 bottles
More than 100.000 bottles

9. What is the average growth rate of this business?
Decrease
No Change
1‐2%
2‐3%
3‐5%
5%+
10. Please rank the following ways you communicate with your customers in order of preference: 1 (most preferred) to 6 (least preferred).
______ Phone
______ Email
______ Face‐to‐face in your shop/office
______ Face‐to‐face, outside your shop/office
______ Social Media
______ Other

11. What type of marketing activities does this business use? Please click all the ones that you use.
Price‐offs
Point‐of‐Sale (example: neck hangers)
Advertisements in local publications
Sponsorships
Tradeshows
Wine Tastings
E‐Newsletter
Direct Mail
Social Media
Other ____________________
Thank you for your time, your answers will provide valuable insight into what extent Dutch wine industry is using social media to conduct business. 4
12. Do you have a personal account on a social networking site?
Yes
No
If No Is Selected, Then Skip To End of Block
4 This is the end of the survey for those who identified their type of business as Cash & Carry.

12a. Please mark all of the social networking sites you personal account with
Foursquare
Other ____________________
12b. How often do you log‐in to these accounts? Only carried forward selected choices.
Not at all
Every couple of weeks
Weekly
More than once a week
Daily
13. Which of the following best describes your use of social media for your business:
I do not use social media for my business
I have at least one account specifically for my business on a social networking site
I sometimes use my personal social networking accounts for business purposes
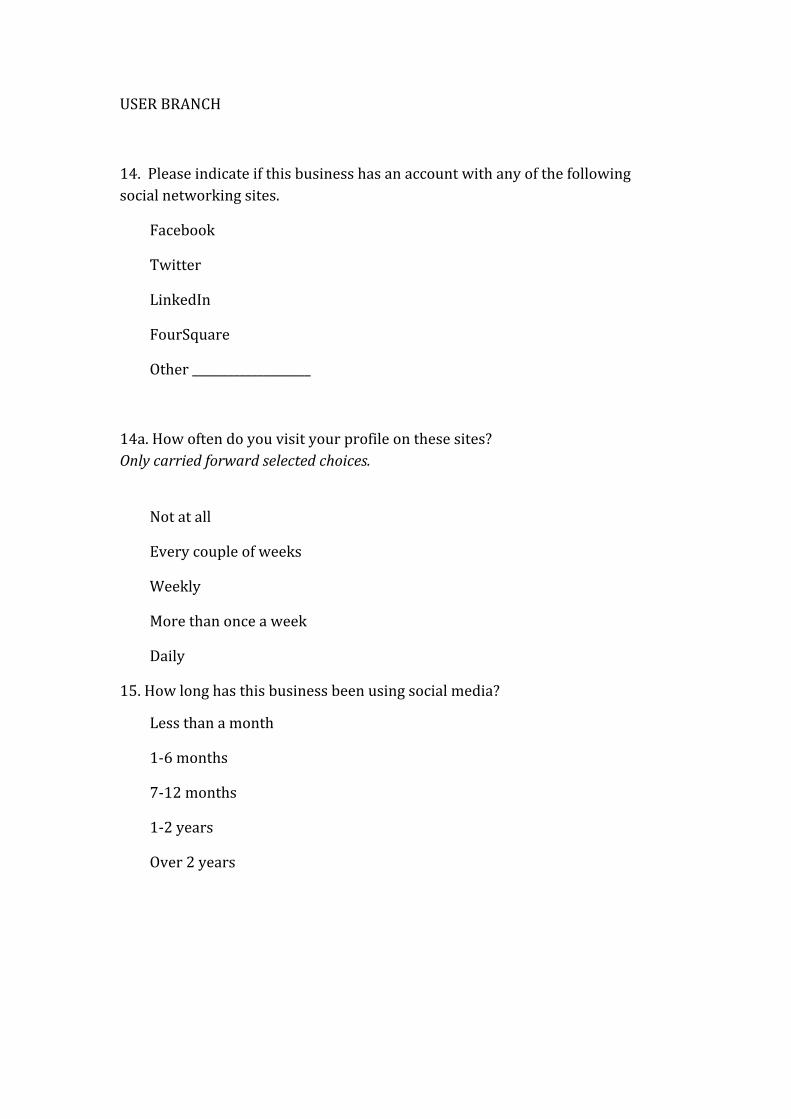
USER BRANCH
14. Please indicate if this business has an account with any of the following social networking sites.
FourSquare
Other ____________________
14a. How often do you visit your profile on these sites? Only carried forward selected choices.
Not at all
Every couple of weeks
Weekly
More than once a week
Daily
15. How long has this business been using social media?
Less than a month
1‐6 months
7‐12 months
1‐2 years
Over 2 years

16. Which social networking sites do you currently use to do the following (Select all that apply):
Facebook Twitter LinkedIn Foursquare Other Not Applicable
Connect with existing customers
Connect with other professionals in the wine industry
Gather information about new and existing products
Read reviews or articles about specific products
Send information about products and events
Offer promotions and special deals (6)

17. How much time do you spend on social media for your business?
<1 hour per week
1‐2 hours per week
2‐5 hours per week
6‐10 hours per week
11+

The following blocks will give you an opportunity to tell us about how you use social media. It consists of two‐part questions. The first part asks how often you use social media to conduct different activities. The second part asks you how strong of a benefit you see from using social media to conduct that activity in comparison to traditional ways of communication. Please take time to answer
these questions fully.
18. Please rate the following benefits of using social media as they relate to your business operations:
How often do you use social media to do this?
How strong is the benefit of using social media to do this?
Not at all
Sometimes
Regularly
Not at all Somewhat
Very
Gather information about existing products
Get deals on products from suppliers
Build brand awareness for your products
Find new products
Communicate information about your business (example: events, products, business hours)
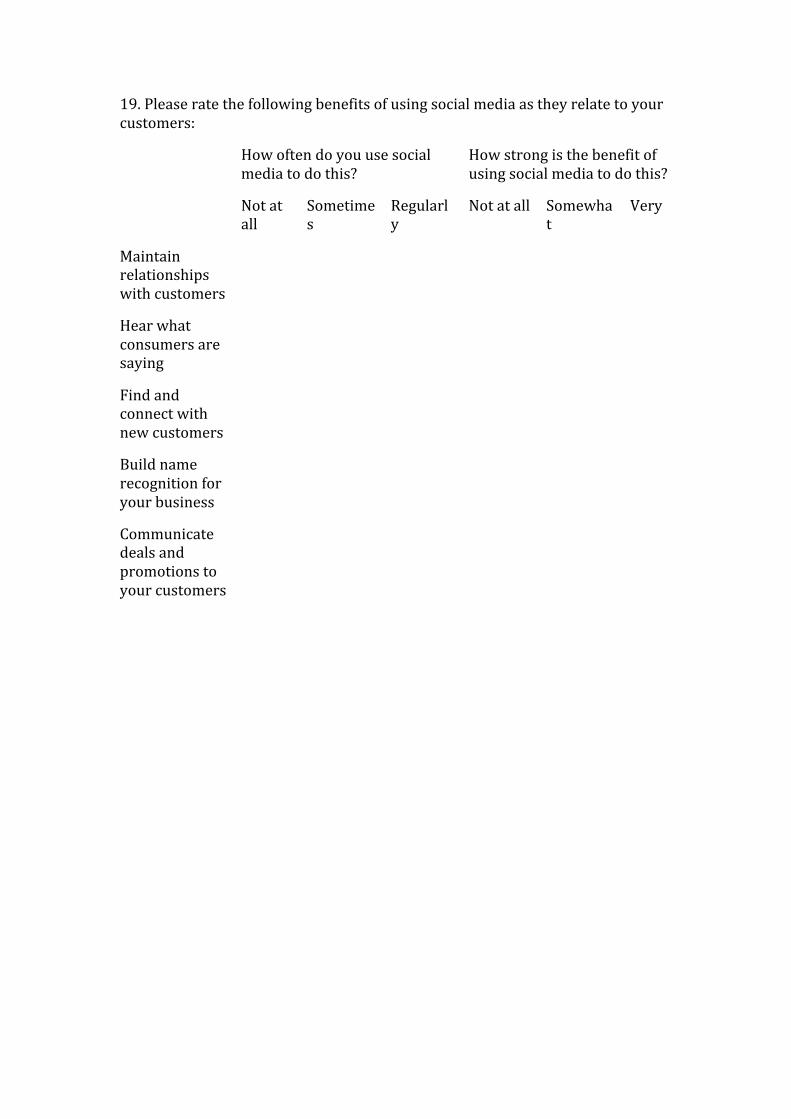
19. Please rate the following benefits of using social media as they relate to your customers:
How often do you use social media to do this?
How strong is the benefit of using social media to do this?
Not at all
Sometimes
Regularly
Not at all Somewhat
Very
Maintain relationships with customers
Hear what consumers are saying
Find and connect with new customers
Build name recognition for your business
Communicate deals and promotions to your customers
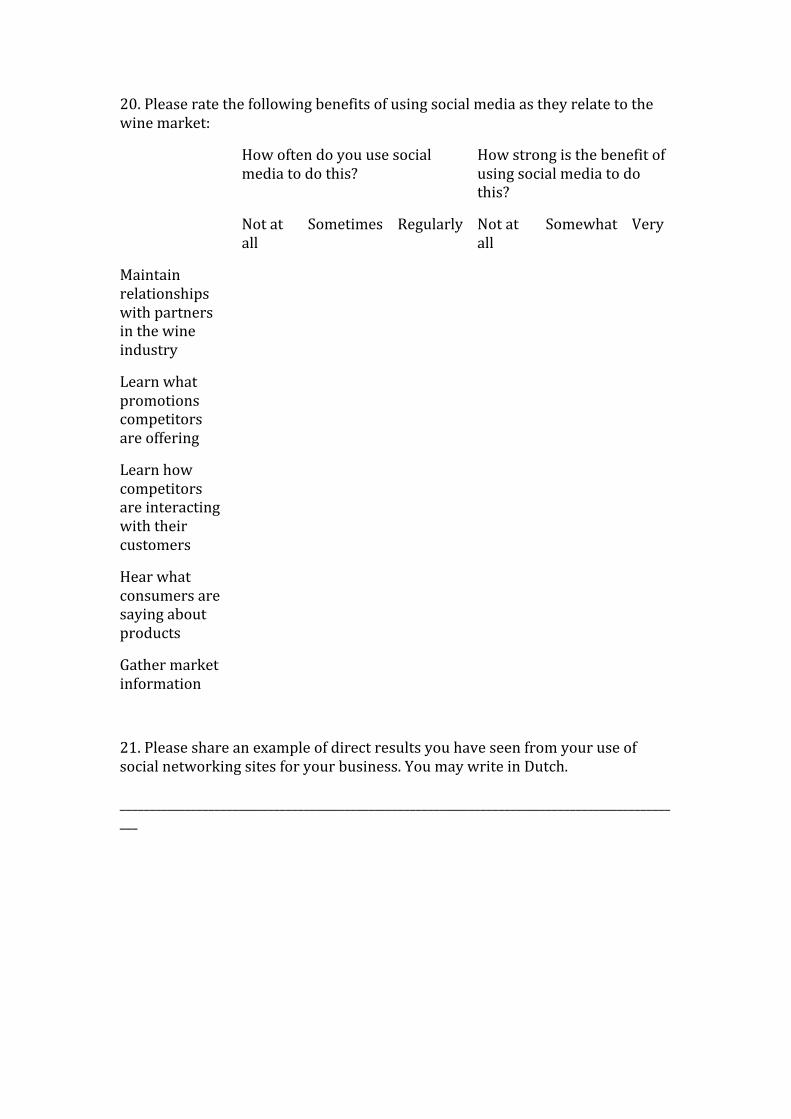
20. Please rate the following benefits of using social media as they relate to the wine market:
How often do you use social media to do this?
How strong is the benefit of using social media to do this?
Not at all
Sometimes Regularly Not at all
Somewhat Very
Maintain relationships with partners in the wine industry
Learn what promotions competitors are offering
Learn how competitors are interacting with their customers
Hear what consumers are saying about products
Gather market information
21. Please share an example of direct results you have seen from your use of social networking sites for your business. You may write in Dutch. ________________________________________________________________________________________________

PERSONAL USERS
14. Please indicate if you use a personal account on any of the following social networking sites to communicate information about your business.
Foursquare
Other ____________________ 14a. Please rate the frequency of use on each of these networks for your business.
Only carried forward selected choices.
Not at all
Every couple of weeks
Weekly
More than once a week
Daily 15. How long has this business been using social media?
Less than a month
1‐6 months
7‐12 months
1‐2 years
Over 2 years
SEE USER BRANCH QUESTIONS 16‐21

NON‐USER BRANCH
The following questions will give you an opportunity to express your thoughts about using social media for business. Please answer these questions fully.
14. Have you ever considered using social networking sites for your business?
Yes
No
15. Please rate your opinion of using social networking sites to benefit your business operations in the following ways:
How strong is the benefit of using social media to do this?
Not at all Somewhat Very
Gather information about existing products
Get deals on products from suppliers
Build brand awareness for your products
Find new products
Communicate information about your business (example: events, products, business hours)

16. Please rate your opinion of using social networking sites to benefit your customers in the following ways:
How strong is the benefit of using social media to do this?
Not at all Somewhat Very
Maintain relationships with customers
Hear what consumers are saying
Find and connecting with new customers
Build name recognition for your business
Communicate deals and promotions to your customers
17. Please rate your opinion of using social networking sites to benefit your knowledge of the wine market in the following ways:
How strong is the benefit of using social media to do this?
Not at all Somewhat Very
Maintain relationships with partners in the wine industry
Learn what promotions competitors are offering
Learn how competitors are interacting with their customers
Hear what consumers are saying about products
Gather market information

18. How strongly do these factors influence why you are not currently using social networking sites for your business?
Not at all Somewhat Strongly
I don't know where to begin
I haven't had time
I'm not sure how it will benefit my business
I have heard negative opinions about it
I don't think my customers are using it
I have concerns about how to maintain it
I am not interested in changing how I do business
19. Please share any additional factors that influence why you do not currently use social networking sites for your business.
_____________________________________________________________________________________________