
The Benefits and Problems of Linking Micro and Macro ... · economic indicators (e.g. employment,...
36
8 Andreas Peichl Institute for the Study of Labor (IZA), Germany Research Associate, ISER, University of Essex No. 2009-02 January 2009 ISER Working Paper Series www.iser.essex.ac.uk The Benefits and Problems of Linking Micro and Macro Models – Evidence from a Flat Tax Analysis
Transcript of The Benefits and Problems of Linking Micro and Macro ... · economic indicators (e.g. employment,...

8
Andreas Peichl Institute for the Study of Labor (IZA), Germany Research Associate, ISER, University of Essex
No. 2009-02 January 2009
ISER
Working Paper Series
ww
w.iser.essex.ac.uk
The Benefits and Problems of Linking Micro and Macro Models – Evidence from a Flat Tax Analysis

Non-Technical Summary
In general, simulation models are tools which are designed to answer “what if”
questions about different policy reform options. In the run-up of the implementation
of a specific reform proposal, it is crucial to predict the expected consequences on
individuals (gains and losses, income distribution), the government budget and key
economic indicators (e.g. employment, prices, consumption) to provide policymakers
with well-founded decision guidance. Other than in the natural sciences, it is seldom
possible in economics to construct natural experiments for the analysis of a given
treatment (policy). Policy simulations can be interpreted as quasi-experiments which
allow the economist to ex-ante analyse a reform proposal controlling for behavioural
responses of different agents in the economy. Simulation models are frequently used
by economists, policy-consultants and policy-makers to predict the impacts of
changes in fiscal policies
Several different types of simulation models can be used depending on the research
question in mind. Mircrosimulation models (MSM) and Computable General
Equilibrium models (CGE) have both been widely used in policy analysis. The
combination of these two model types allows the utilisation of the advantages of both
types. The aim of this paper is to describe the state-of-the-art in simulation and to
illustrate the benefits and problems of linking micro and macro models by analysing
flat tax reform proposals for Germany. Applying the linked model to a not revenue
neutral flat tax proposal shows that taking the general equilibrium effects into account
indeed increases the expected efficiency gains in the long-run. The overall
employment effects are larger than the labour supply reactions because of reduced
costs of labour and capital resulting in increasing labour and investment demand.
Therefore, a personal flat income tax can indeed overcome the fundamental equity-
efficiency trade-off. However, combining this flat tax with a cash flow flat tax on
business income still increases inequality due to the large gains at the top of the
distribution. Therefore, we conclude that due to their limited efficiency effects and
their problematic short-term distributional impact, flat tax reforms are unlikely to spill
over to the grown-up democracies of Western Europe.

The Benefits and Problems of Linking Micro and Macro Models -
Evidence from a Flat Tax Analysis
by
Andreas Peichl∗
ISER Research Associate and IZA
This version: 28th January 2009
Abstract
The aim of this paper is to describe the state-of-the-art in simulation and to illustrate benefits
and problems of linking micro and macro models by analysing flat tax proposals for Germany.
The analysis shows that a personal income flat tax can indeed overcome the fundamental equity
efficiency trade-off while simultaneously increasing the tax revenue. However, this result does
not hold for a flat tax combining a personal income flat tax with a corporate cash flow flat tax,
even when allowing for an ex-post loss in revenue as the top of the distribution still gains the
most.
JEL Codes: D58, H2, J22
Keywords: Microsimulation, CGE, linked micro macro models, flat tax
∗ISER Research Associate, IZA - Institute for the Study of Labor P.O. Box 7240, 53072 Bonn, Germany,[email protected]. I would like to thank Christian Bergs, Stefan Boeters, Markus Clauss, Michael Feil, ClemensFuest, Nicolas Herault, Erling Holmøy, Thilo Schaefer, seminar participants in Bonn, Cologne, Leuven andNurnberg as well as participants of the EcoMod conference in Berlin for their helpful contributions. The usualdisclaimer applies.
1 Introduction
The recent success of the flat rate income tax in Eastern Europe suggests that this concept could
also be a model for countries of Western Europe. The introduction of a flat tax system is widely
seen as a reform which may boost efficiency, employment and growth through simplification
and higher incentives. However, inequality is expected to increase as a consequence of a flat
tax reform. In the discussion of the flat tax “a notable and troubling feature [...] is that it
has been marked more by rhetoric and assertion than by analysis and evidence“.1 Given that
flat taxes have not yet been implemented in Western European countries, the effects of flat tax
reforms in these countries can only be studied on the basis of simulation models. The method of
simulation analysis aims at analysing and quantifying the economic effects of different policies
based on the given institutional background to compare and evaluate different reform proposals
with respect to equity and efficiency effects.
For the analysis of fiscal reforms, microsimulation (MSM) and computable general equilib-
rium (CGE) models have been widely used in the literature. CGE models consider various
interdependencies and facilitate simulating behavioural responses and adjustments on several
markets. In contrast, microsimulation models consider only the household side of the economy,
which allows for more heterogeneity and a much more detailed mapping of the complex tax
benefit system. Combining these two model types enables the utilisation of the complementary
advantages. The aim of this paper is twofold. First, possibilities of linking microsimulation
and CGE models are shown. Second, the benefits and problems of the linking approach are
illustrated using a flat tax example for Germany.
The most popular flat rate tax proposal is the ”Flat Tax“ of Hall and Rabushka (1985)
(HR), which combines a cash flow taxation on corporate incomes with the same single marginal
tax rate on labour income. This proposal, however, has not been implemented in its pure form
in any country yet. Previous reforms considered a flat rate personal income tax as an indirect
progressive tax schedule with a basic tax allowance and a uniform marginal tax rate. In the
literature, there are several simulation studies on efficiency and equity aspects of such (revenue
neutral) flat income tax reforms. One focus of these studies is the impact on employment and
growth using CGE models.2 A second group of studies focuses on the distributional effects of
flat tax reforms using MSM.3 In summary, all previous studies support the existence of a trade-
off between equity and efficiency, i.e. it is not possible to decrease inequality while increasing
1Keen et al. (2007), p. 3.2See e.g. Heer and Trede (2003) for Germany, Cajner et al. (2006) for Slovenia or Jacobs et al. (2007) for
the Netherlands.3See e.g. Caminada and Goudswaard (2001) for the Netherlands, Aaberge et al. (2000) for Italy, Norway
and Sweden, Decoster and Orsini (2007) for Belgium, Gonzlez-Torrabadella and Pijoan-Mas (2006) for Spain,Fuest et al. (2008) for Germany and Paulus and Peichl (2008) for a cross country study of 10 EU countries.
1

employment. However, a HR-type flat tax may lead to further efficiency gains due to more
investment and labour demand as it is also likely to reduce tax distortions in the corporate
sector. These outcomes, however, can only be analysed taking the general equilibrium effects
into account.
The introduction of a HR-type flat tax reform has been analysed before, especially for the
U.S. using CGE models. Browning and Browning (1985) estimate an increase in labour supply
by 5%. Stokey and Rebelo (1995) conclude that a flat tax reform would have little effect on
the growth rate. Gale et al. (1996), Ho and Stiroh (1998) and Dunbar and Pogue (1998) show
that high income households gain whereas low and especially middle income households are
burdened. Ventura (1999) finds an increase in capital accumulation and redistribution in favour
of the top of the distribution. Altig et al. (2001) show that output, labour supply and wages
increase and that the lowest income households lose. Cassou and Lansing (2004) find that a flat
tax reduces growth in the short run if revenue-neutrality is maintained, but increases capital
accumulation and growth in the long run. Daz Gimenez and Pijoan-Mas (2006) conclude that
the reform proposal with the lower (higher) marginal rate increases (decreases) output and
inequality, but decreases (increases) aggregate welfare. Nielsen et al. (1999) find significant
efficiency gains but negative distributional effects for a flat tax in Denmark. So far, none of
these studies has used a linked MSM-CGE model.
This paper contributes to the literature by analysing a HR-type flat tax reform proposal of
the German tax system using a linked MSM-CGE simulation model for the German tax and
transfer system (FiFoSiM). With its socio-economic and demographic structure, Germany can
be seen as a typical Western European democracy. Therefore, the qualitative results of our
analysis should be of interest to a wider range of countries.4 Applying the linked model to
a not revenue neutral flat tax proposal shows that taking the general equilibrium effects into
account indeed increases the expected efficiency gains in the long-run. The overall employment
effects are larger than the labour supply reactions because of reduced costs of labour and capital
resulting in increasing labour and investment demand. Therefore, a personal flat income tax
can indeed overcome the fundamental equity-efficiency trade-off. However, combining this flat
tax with a cash flow flat tax on business income still increases inequality due to the large gains
at the top of the distribution. Therefore, we conclude that due to their limited efficiency effects
and their problematic short-term distributional impact, flat tax reforms are unlikely to spill
over to the grown-up democracies of Western Europe.
We proceed as follows. Section 2 describes stand-alone micro and macro simulation models.
Section 3 introduces methods to link them and Section 4 briefly discusses potential problems.
4It has to be taken into account, though, that the structures of the tax benefit systems do vary considerablyamong the countries of Western Europe.
2

Section 5 describes the linked model model used for the application. In section 6, the flat tax
reform proposal for Germany is described, which is analysed in section 7. Section 8 concludes.
2 Micro and macro simulation models
Before discussing possibilities to link micro and macro models, it is important to introduce
the main features of the stand-alone models. In general, simulation models are tools which
are designed to answer “what if” questions about different policy reform options. In the run-
up of the implementation of a specific reform proposal, it is crucial to predict the expected
consequences on individuals (gains and losses, income distribution), the government budget
and key economic indicators (e.g. employment, prices, consumption) to provide policymakers
with well-founded decision guidance. The complexity of existing welfare states requires the
usage of simplified models for the evaluation of reform proposals. Theoretical models allow
to point out a single argument in a simplified framework and to construct hypotheses which
can be tested empirically. Empirical models allow for an econometric evaluation of a given
reform and are especially useful whenever the magnitude, and thus not only the sign, of the
effects are to be estimated. If the reform already has been implemented (and data is available),
an ex-post analysis is possible using standard econometric procedures. On the other hand, if
the reform has not been implemented, only simulation models can provide information for an
ex-ante analysis of different reform proposals. Other than in the natural sciences, it is seldom
possible in economics to construct natural experiments for the analysis of a given treatment
(policy). Policy simulations can be interpreted as quasi-experiments which allow the economist
to ex-ante analyse a reform proposal controlling for behavioural responses of different agents in
the economy.
2.1 Computable general equilibrium (CGE) models
General equilibrium theory has provided important insights about mechanisms that determine
the allocation of resources on mutually interdependent markets. CGE5 models use as realistic
values as possible of exogenous variables (e.g. elasticities, tax rates) to numerically compute the
values of the endogenous variables (e.g. prices, quantities) with the aim of quantifying economic
equilibria to compare the impact of policy measures on these equilibria. Although CGE models
are based on the microeconomic general equilibrium theory, they usually use aggregated macro
5This class of numerical economic models is also called Applied General Equilibrium (AGE) models. Intro-ductions to CGE models can be found in Kehoe and Prescott (1995) or Bergman (2005).
3
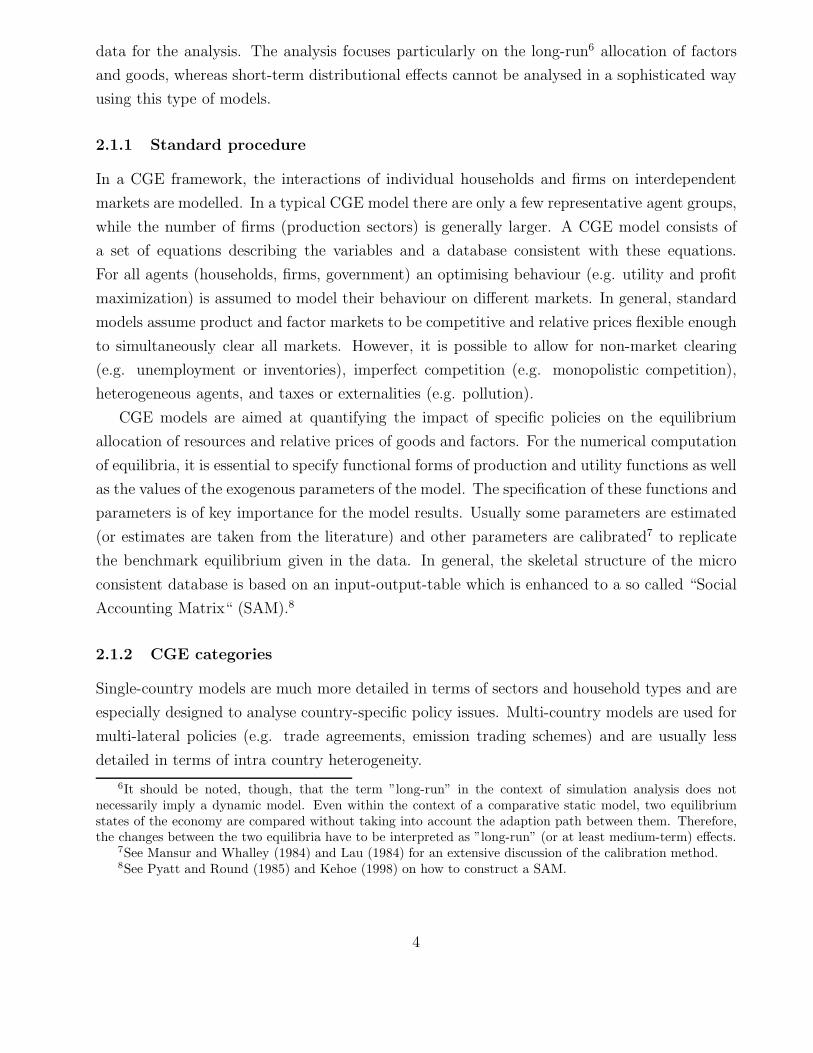
data for the analysis. The analysis focuses particularly on the long-run6 allocation of factors
and goods, whereas short-term distributional effects cannot be analysed in a sophisticated way
using this type of models.
2.1.1 Standard procedure
In a CGE framework, the interactions of individual households and firms on interdependent
markets are modelled. In a typical CGE model there are only a few representative agent groups,
while the number of firms (production sectors) is generally larger. A CGE model consists of
a set of equations describing the variables and a database consistent with these equations.
For all agents (households, firms, government) an optimising behaviour (e.g. utility and profit
maximization) is assumed to model their behaviour on different markets. In general, standard
models assume product and factor markets to be competitive and relative prices flexible enough
to simultaneously clear all markets. However, it is possible to allow for non-market clearing
(e.g. unemployment or inventories), imperfect competition (e.g. monopolistic competition),
heterogeneous agents, and taxes or externalities (e.g. pollution).
CGE models are aimed at quantifying the impact of specific policies on the equilibrium
allocation of resources and relative prices of goods and factors. For the numerical computation
of equilibria, it is essential to specify functional forms of production and utility functions as well
as the values of the exogenous parameters of the model. The specification of these functions and
parameters is of key importance for the model results. Usually some parameters are estimated
(or estimates are taken from the literature) and other parameters are calibrated7 to replicate
the benchmark equilibrium given in the data. In general, the skeletal structure of the micro
consistent database is based on an input-output-table which is enhanced to a so called “Social
Accounting Matrix“ (SAM).8
2.1.2 CGE categories
Single-country models are much more detailed in terms of sectors and household types and are
especially designed to analyse country-specific policy issues. Multi-country models are used for
multi-lateral policies (e.g. trade agreements, emission trading schemes) and are usually less
detailed in terms of intra country heterogeneity.
6It should be noted, though, that the term ”long-run” in the context of simulation analysis does notnecessarily imply a dynamic model. Even within the context of a comparative static model, two equilibriumstates of the economy are compared without taking into account the adaption path between them. Therefore,the changes between the two equilibria have to be interpreted as ”long-run” (or at least medium-term) effects.
7See Mansur and Whalley (1984) and Lau (1984) for an extensive discussion of the calibration method.8See Pyatt and Round (1985) and Kehoe (1998) on how to construct a SAM.
4

Comparative-static models are by far the most common class of CGE models. The econ-
omy is modelled at two given points in time only: the status quo benchmark and the future
counterfactual equilibrium. These models compare the differences (usually reported in percent
changes) between the benchmark equilibrium and the future equilibrium to which the economy
converges after a given exogenous shock. The transition path towards this new equilibrium is
not explicitly modelled. This, however, allows for a more detailed specification of the single-
period economy in terms of numbers of agents, sectors and commodities.
Dynamic CGE models, by contrast, explicitly model the transition path. These models are
far more challenging to design, maintain and solve but allow a more realistic representation
of the adjustment process of a policy change. However, the increasing complexity of dynamic
models often reduces the heterogeneity of the agents. Dynamic models assume rational expec-
tations of agents, i.e. they use all available information for the best guess of the future. This
makes it necessary to simultaneously solve for all periods. In contrast, recursive-dynamic CGE
models assume that behaviour depends only on current and past states of the economy (assum-
ing myopic expectations, see Ballard et al. (1985)). These models can be solved sequentially
(one period at a time).
2.2 Microsimulation models (MSM)
2.2.1 Standard procedure
Microsimulation models are microanalytic partial equilibrium models focusing on one side (e.g.
the household side) of markets and do not consider the broader economic environment in which
the micro units are acting.9 Tax benefit models usually only simulate first round effects where
the behavioural response of the agents (to the change imposed on the system) is not captured.
These tax benefit models can be combined with a labour supply model allowing the simulation
of (partial) second round effects in terms of behavioural responses on the labour market.
MSM are based on micro data which offer great flexibility regarding a detailed mapping
of the complex tax benefit system including non-convex budget sets. Micro data allow the
modelling of structural characteristics of micro units (persons, households, firms) within a
particular tax benefit system. Therefore, MSM reflect the considerable heterogeneity within
the population by taking into account the characteristics and circumstances of each individual.
2.2.2 Static vs. dynamic MSM
Static MSM use cross-sectional data at a given point in time to mimic the tax law by applying
the (current or an alternative set of) tax benefit rules to individual units. These models are
9See, e.g., Gupta and Kapur (2000), Harding (1996) or Bourguignon and Spadaro (2006) for MSM surveys.
5

essential tax benefit calculators that compute the budget set for every point of the income
distribution. This allows the user to simulate the instantaneous first-round effects (in terms
of the fiscal and distributional effects, i.e. the gains and losses in different variables at the
individual or aggregated level) of policy changes. They allow for a comparative-static analysis
of the pre- and post-reform state of the economy without looking at the adjustment process.
Dynamic MSM endogenously explain this process of adaptation through the incorporation
of dynamic ageing of individual records over time based on the probabilities of the happening
of different real life events (e.g. marriage, divorce, birth of a child). The relevant life processes
are simulated and the individual characteristics are recalculated at each period in time which
allows moving the micro units forward through time. On the one hand, dynamic MSM allow
the modelling of demographic changes over time, but on the other hand, dynamic models have a
higher demand regarding the modelling, the data requirements and the computational resources
than static models. Therefore, often static models which are easier to build and maintain are
used in combination with a behavioural model.
2.2.3 Behavioural responses
Non-behavioural models10 do not allow the individuals to change their behaviour as a conse-
quence of a given policy reform. These models are used to estimate the immediate fiscal and
distributional effects for ”the day after” the reform. This is done by generating income profiles
for various groups of individuals to highlight discontinuities in the tax benefit rules which in
turn can be modified by policy-makers.
Behavioural models simulate some kind of behavioural response to a policy change. These
responses can include the supply and demand of factors and goods. The most common applica-
tions are models of labour supply. Microeconometric labour supply models allow the modelling
of both the extensive (participation) and the intensive (hours worked) labour supply decision.
The labour supply model can be either integrated into the microsimulation model or it can be
linked to a MSM as an external module. There are several possibilities of how to model the
labour supply of a tax unit (e.g. individual vs. household labour supply, discrete vs. continuous
working hours, selection of utility functions).
2.3 Summarising comparison of model types
The method of simulation analysis can be seen as an economic quasi-experiment for the ex-ante
evaluation of policy reforms to analyse and compare the impacts of different reform scenarios
10Note that behavioural responses can be simulated with both static and dynamic models. Sometimesbehavioural models are labelled dynamic. Although dynamic models often include behavioural responses, theydo not necessarily have to include them.
6

before they are implemented in real life. The main research questions of the different model
types are presented in Table 1.
CGE MSM Micro-Macro
Framework total partial totalData macro micro bothResearch questions:- Growth / GDP X X
- Allocation / Efficiency X (X) X
- Labour supply (X) X X
- Labour demand X X
- Revenue X X
- Distribution X X
Table 1: Comparison of model types
CGE models excel through their outstanding theoretical foundation and the consideration
of various interdependencies. They allow estimating behavioural responses and adjustments on
several markets, e.g. modelling labour supply and demand on the labour market. In contrast,
MSM are partial equilibrium models focusing on one side (e.g. the household side) of markets
and do not consider the broader economic environment in which the micro units are acting.
Nevertheless, these models allow for a much more detailed mapping of the complex rules of
the tax benefit system and account for a much greater heterogeneity than CGE models could
ever do because of the aggregated data they are based on. The need to specify and calibrate
functional forms and parameters for all agents on all markets reduces the number of agents
to be modelled dramatically. Therefore, in general, few representative agents are used which
reduces flexibility and the possibilities of a detailed modelling of the tax-benefit system. In
consequence, CGE models give no insight into how aggregate changes in the economy and the
new equilibrium solution affect different individuals as the distribution within representative
agent groups is assumed to be exogenous.
Despite these advantages there are some limitations. Every empirical analysis relies on
high quality data. If such data is not available, simplifying assumptions are necessary which
lead to biased estimations. If, e.g., in a MSM key information necessary for some (minor)
tax rules is not available, it is not possible to include these rules into the mapping of the tax
benefit system. Further on, simulation models - as all models do - obviously rest upon strong
simplifying assumptions about optimising behaviour, competitive markets and flexible prices.
CGE models rely on the calibration method, which is to some extent rather arbitrary as it is
not based on a solid econometric foundation. This issue give rise to general critiques against
CGE (and other calibrated) models. However, the usefulness of a CGE model depends on
the aims and purposes it was designed for and what the alternatives are. If a model cannot
7

be solved analytically, a numerical solution can help to identify general equilibrium effects of
policy changes and the role of (exogenous) parameters for the results can be explained using
extensive sensitivity analyses. Furthermore, even if the precise magnitude of the effects remains
uncertain, it still might be possible to identify if the effects are small or large or at least to
compare and rank different scenarios. The possibility of linking micro and macro models enables
the researcher to overcome these limitations and to utilise the complementary advantages of
both models.
3 Linking micro and macro models
During the last years, a tendency of linking micro and macro models has emerged in computa-
tional economics to utilise the complementary advantages of MSM and CGE models. A linked
model can provide a more powerful tool for policy analysis than using results from two stand-
alone MSM and CGE models (Anderson (1990)). Outputs from the macro model can be used
to align the predictions of the micro model and to enable general equilibrium feedbacks and
interactions among variables in the micro model. Outputs from the micro model can be used to
calibrate the macro model and provide a microeconomic basis for aggregate behaviour. Hence,
the key advantage of a linked micro macro model is the feedback which is used to resolve the
model corresponding to a revised set of parameters. This in turn will then enable to analyse
the complex interdependence of various policy measures with respect to fiscal, distributional,
employment and growth effects within the same econometric framework. However, achieving
these feedback effects through linking MSM and CGE models is not a trivial task.
The idea of linking micro- and macroeconomic simulation models is almost as old as the
stand-alone models themselves. Orcutt (1967) suggests to link models operating at different
levels of aggregation through intermediate variables. However, the number of researchers de-
veloping linked micro macro models is still very small worldwide (see Davies (2004)). Nonethe-
less, recent progress in information technology and advances in computational and econometric
methods are leading to a growing interest in combining these modelling techniques.
3.1 Linkage possibilities
There are two general possibilities for linking the models. On the one hand, one can completely
integrate both models into a joint model11 or on the other hand, one could combine two sep-
arated models via interfaces (layered approach12). The first approach requires the complete
11Cf. Cogneau and Robilliard (2000) or Cororaton et al. (2005). See also Arntz et al. (2006) for descriptionof how to integrate a discrete choice labour supply into a CGE model.
12Cf. Bourguignon et al. (2003).
8

micro model to be included in the CGE model which demands high standards for the database
and the construction of the integrated model.
Figure 1: Top-down and bottom-up
The layered approach can be differentiated into “top-down“ (see Figure 1, left-hand side),
“bottom-up“ (see Figure 1, right-hand side) or “top-down bottom-up“ (see Figure 2) ap-
proaches.13 The top-down approach computes the macroeconomic variables (price level, growth
rates) in a CGE model as input for the micro model which is adjusted to match an exogenous
macro aggregate. The bottom-up approach works the other way around and information from
the micro model (elasticities, tax rates) is used in the macro model (e.g. for calibration of
the representative agents). Both approaches suffer from the drawback that not all feedback
is used. The top-down bottom-up approach combines both methods to a recursive approach.
In an iterative process one model is solved, information is sent to the other model, which is
solved and gives feedback to the first model. This iterative process continues until the two
models converge. Bohringer and Rutherford (2006) describe an algorithm for the sequential
calibration of a CGE model to use the top-down bottom-up approach with a micro model with
large numbers of households.
13Cf. Savard (2003) or Bohringer and Rutherford (2006).
9

Figure 2: Top-down bottom-up
3.2 Practical issues
Choosing the appropriate approach for the analysis of a given policy reform depends on the
specific research question. If one is interested in both micro and macro level variables and
the shock induces a complex feedback effect which is quantitatively relevant, then a top-down
bottom-up model is the right choice. If not, it depends on the level of the initial shock. If
the shock occurs on a different level than the variables one is interested in, either a top-down
or a bottom-up approach is suitable. If you are only interested in variables of the level where
the shock occurs, a stand-alone model - maybe with simple extensions (e.g. labour demand
constraints in a MSM model or micro consistent aggregated elasticities in a CGE model) - can
do the job. Further on, in practical considerations, the availability of micro consistent data
(especially in developing countries) as well as time requirements and human resources have to
be taken into account. Fortunately, information technology is no longer the bottle-neck for
these kind of models.
To be able to successfully link MSM and CGE models, common variables through which the
two models interact are needed. On the one hand, information from the MSM is aggregated to
10

calibrate the representative agent(s) of the CGE model. Typical variables and parameters used
in this bottom-up linkage include labour supply elasticities, income components, average and
marginal tax rates, consumption patterns, income levels and tax revenues. On the other hand,
information from the CGE model is given to the MSM model. For the top-down linkage changes
of the wage or price level are used to adjust the (real) disposable incomes and consumption
levels for the labour supply estimations. When linking the two levels, it has to be assured that
the individual functions from the micro model can be aggregated to macro level functions and
the macro level information disaggregated to the micro level in a consistent way. For example,
a (nested) multinominal logit specification of the individual direct utility function (which is
usually used in discrete choice labour supply models) can be aggregated to a global CES utility
function (which is usually used in CGE models, see, e.g., Verboven (1996)). If the top-down
bottom-up approach is used, convergence criteria for the end of the iteration process have to
be defined. Convergence is typically achieved when the changes in the exchange variables are
(close to) zero.
So far, the linked micro macro models which have been used for the analysis of tax benefit
reforms do not sufficiently use all the possibilities stand-alone MSM and CGE models offer. The
further development of computational power and more powerful algorithms (see e.g. Rausch
and Rutherford (2007)) should allow for a complete integration of both types of models. Further
development on the microsimulation modelling of the corporate sector is also desirable. This,
of course, crucially depends on the availability of corporate micro data. Such a corporate MSM
could then be linked with a household MSM and integrated into a CGE model which would
then be based on micro behaviour for both sides of the economy.
3.3 Applications
The application of linked micro macro models to analyse tax reforms is rather limited.14 Boeters
et al. (2005) use the bottom-up approach to calibrate the three representative households of a
CGE model to analyse different hypothetical reform proposals of the social assistance benefit
system in Germany.15 A similar approach is chosen by Fuest et al. (2005a) to evaluate a tax
reform proposal for Germany with respect to fiscal, employment and growth effects. Arntz et al.
(2008) use the recursive top-down bottom-up approach to analyse reform proposals designed
to encourage labour supply at the lower end of the wage distribution in Germany. However,
various simplifying assumptions regarding the aggregation and disaggregation of information
14There are, however, more applications to trade reforms in developing countries (see e.g. Davies (2004)for a survey). More recent applications include Herault (2007) and Bourguignon and Savard (2008). An earlyexample for a linked model for Germany is Conrad (1991).
15The same model and approach is also used by Boeters et al. (2006) and Franz et al. (2008).
11

on labour supply responses that is passed between the models have to be made.
Aaberge et al. (2007) use an integrated micro macro model of Norway to analyse the impact
of population ageing on fiscal sustainability with endogenous labour supply. Although their
model is integrated, they use an iterative approach. Labour supply responses are computed
using the MSM model and are then used in the CGE model to estimate changes in wage rates.
Rutherford et al. (2005) link a CGE model to the Russian Household Budget Survey (rep-
resenting 55,000 households) in order to analyse the distributional effects of Russia’s WTO
accession. They use the information of the micro model to calibrate the representative agent
of the CGE model and iterate both models until they converge in terms of price changes and
aggregate demand equalling aggregate supply.
4 Potential problems of simulation analyses
When conducting a simulation analysis or interpreting its results one should be aware of po-
tential errors or biases (see Betson (1990)). Sampling errors can always occur when subsamples
from the whole population are used in an empirical analysis which can increase or decrease the
variation in the data. Thus, estimates from the simulation model might differ from estimation
based on the whole population. If the sample was not drawn randomly, the assumptions of
statistical procedures might be violated and special corrections have to be used in the analysis.
Furthermore, there might be also “non-sampling errors“ in the dataset, resulting e.g. from non-
response and reporting or data processing mistakes. The weighting of the individual records
with population weights to estimate aggregated values for the whole population can reduce
these errors, as the weighting factors are chosen to ensure that the sample estimates conform to
macroeconomic indicators of the whole population. However, when these population factors are
modified, e.g. using static ageing techniques of reweighting, this can give rise to ageing errors
if the modification itself is biased. Imputation errors arise when data from different sources
are used for the imputation of missing values or variables. As a consequence, distributional
assumptions might be violated leading to biased estimations. But not only the data is error-
prone but also the modelling of the benchmark or the counterfactual scenario itself gives rise
to potential mistakes. Individual response errors can arise from simplifying and/or behavioural
assumptions in the model. Simplifying assumptions are always subject to errors, but have to
be used to overcome data limitations or to make the model operational. Behavioural assump-
tions are necessary for the estimation of behavioural responses. To do so, functional forms and
co-variables of the econometric model have to be specified based on beliefs of the underlying
behaviour of the individuals. Incomplete or imperfect beliefs can lead to misspecifications and
biased results. Environmental errors can e.g. arise from the negligence of the broader economic
12

environment or individual reactions to policy changes.
When conducting a micro-macro linkage, several specific potential problems arise. The
main problem is the lack of theoretical and empirical consistency between the micro and the
macro parts which can give rise to (dis)aggregation errors. To be able to successfully link
MSM and CGE models there have to be some common variables through which the two models
can exchange information. Usually, it is necessary to aggregate or disaggregate these variables
to be comparable with the variables in the other model. Of course, the less variables have
to be (dis)aggregated the more of the underlying heterogeneity in the data will be retained.
Furthermore, it has to be checked if the same variable in both models represents the same
population (e.g. household consumption in the micro model vs. aggregated total consumption
including government in the macro model). Functional forms (e.g. the preference functions in
the labour supply model and the aggregated utility in the CGE model) have to be specified in
a consistent way. In addition, it has to be checked if one run of each model represents the same
time horizon. However, despite the best efforts, there is no guarantee of coherence between the
two models which can be complex and technically challenging to achieve.
When building and using a simulation model, a researcher should be aware of these potential
errors and should try to avoid them if possible or at least to document the possible biases in
the analysis. Extensive sensitivity analyses should be conducted when building a model or
simulating a new scenario. When interpreting the results of a simulation study, one has to be
aware of these potential errors and has to take a closer look at the underlying data, methods
and assumptions. Furthermore, estimations from simulation models should not be used as an
exact forecast of a single number but to compare and rank different scenarios according to
various dimensions. Despite all these potential errors, simulation models nevertheless provide
a powerful tool for the ex-ante evaluation of fiscal policy reform proposals.
5 Database and model
5.1 General layout
Our analysis is based on a behavioural simulation model for the German tax and transfer system
(FiFoSiM) using income tax and household survey microdata.16 The approach of FiFoSiM is
innovative insofar as it creates a dual database using two micro data sets for Germany: FAST01
and GSOEP.17 FAST01 is a microdataset from the German federal income tax statistics 2001
16This section is based on the English documentation of FiFoSiM (see Peichl and Schaefer (2006, 2008) ),which is a short version of the detailed German description (see Fuest et al. (2005b)).
17In the last years several tax benefit microsimulation models for Germany have been developed (see Wa-genhals (2004)). Most of these models use either GSOEP or FAST data. FiFoSiM is so far the first model tocombine these two databases.
13

containing the relevant income tax data of nearly 3 million households in Germany. Our
second data source, the German Socio-Economic Panel (GSOEP), is a representative panel
study of private households in Germany. The simultaneous use of both databases allows for
the imputation of missing values or variables in the other dataset using techniques of statistical
matching.
Figure 3: Basic setup FiFoSiM
Figure 3 shows the basic setup of FiFoSiM. The layout of the tax benefit module follows
several steps: First, the database is updated using the static ageing technique which allows
controlling for changes in global structural variables (through reweighting of the sample) and a
differentiated adjustment for different income components of the households (through uprating
of various income components). Second, we simulate the tax and benefit system in 2008 using
the uprated data. This allows us to compute the disposable incomes for each person and
14

household taking into account the detailed rules of the complex tax benefit system. The basic
steps for the calculation of the personal income tax under German tax law are as follows.
The income of a taxpayer from different sources is allocated to the seven forms of income
defined in the German income tax law. For each type of income, the tax law allows for certain
specific income related expenses. Then, general deductions like contributions to pension plans
or charitable donations are taken into account and subtracted from the sum of incomes, which
gives taxable income as a result. Finally, the income tax is calculated by applying the tax rate
schedule to taxable income. To derive the disposable income Y from gross income G, received
benefits (like unemployment benefit, social assistance, child benefits, etc.) are added and taxes
T and social insurance contributions S are subtracted:
Y = G + B − T − S (1)
Third, the individual results are multiplied by individual sample weights to extrapolate the
fiscal effects of the reform with respect to the whole population.
5.2 Labour supply module
Based on the disposable incomes, we estimate the distributional and the labour supply effects of
the analysed tax reforms. For the econometric estimation of labour supply elasticities, we apply
a structural discrete choice household labour supply model. In the standard continuous model
(see Hausman (1985)), labour supply responds along the intensive margin: an infinitesimal
change of the marginal tax rate changes the working hours only a little, whereas participa-
tion responses cannot be satisfactorily analysed within this framework (Blundell and MaCurdy
(1999)). Discrete choice labour supply models allow to analyse both the extensive (partici-
pation) and the intensive (hours worked) labour supply decision within the same modelling
framework (Blundell and MaCurdy (1999) and Van Soest et al. (2002)).
Following Van Soest (1995), we assume that the household’s head and his partner jointly
maximise a household utility function in the arguments leisure of both partners and net income.
Household i (i = 1, ..., N) can choose between a finite number (j = 1, ..., J) of combinations
(yij, lmij , lfij), where yij is the net income, lmij the leisure of the husband and lfij the leisure
of the wife of household i in combination j. Based on our data, we choose five working time
categories for men and women (unemployed, employed, overtime and two part time categories).
We model a quadratic household utility function
Vij (xij) = x′
ijAxij + β ′xij (2)
15

with the arguments yij, lmij , and lfij , which enter the utility function in linear (coefficients
β = (β1, β2, β3)′) and in quadratic and gross terms (coefficients A(3×3) = (aij)). We control for
observed heterogeneity in household preferences by adding interactions with control variables
into the specification.
Following McFadden (1973) and his concept of random utility maximisation, we add a
stochastic error term εij for unobserved factors to the household utility function:
Uij (xij) = Vij (xij) + εij (3)
Assuming joint maximisation of the households utility function implies that household i
chooses category k if the utility index of category k exceeds the utility index of any other
category l ∈ {1, ..., J}\{k}, if Uik > Uil. This discrete choice modelling of the labour supply
decision uses the probability of i to choose k relative to any other alternative l:
P (Uik > Uil) = P [(x′
ikAxik + β ′xik) − (x′
ilAxil + β ′xil) > εil − εik] (4)
Assuming that εij are independently and identically distributed across all categories j to
a Gumbel (extreme value) distribution, the difference of the utility index between any two
categories follows a logistic distribution. This distributional assumption implies that the prob-
ability of choosing alternative k ∈ {1, ..., J} for household i can be described by a conditional
logit model which can be estimated using maximum likelihood:
P (Uik > Uil) =exp (Vik)
∑J
l=1exp (Vil)
(5)
5.3 CGE module
The tax benefit and labour supply modules of FiFoSiM only account for the household side
of the economy. The CGE module allows us to simulate the overall economic effects of policy
changes including the production side. Therefore effects on labour demand, employment and
GDP as well as wage and price levels can be assessed. The static CGE module of FiFoSiM
models a small open economy with 12 sectors and one representative household.18
The representative household maximises a nested CES utility function. At the top nest
the household chooses between aggregated consumption (including leisure) today Q or in the
future S. The result of this optimisation is the savings supply. On the second level, the present
18The expressiveness of this simple CGE module as a stand-alone model is rather limited. In combination withthe state-of-the-art microsimulation module it becomes a powerful tool, though. Nevertheless, the improvementof the CGE module is work in progress.
16

consumption leisure (or labour leisure) decision takes place. The household maximises a CES
utility function U (C, F ) choosing between consumption C and leisure F :
U (C, F ) =[
(1 − β)1
σC,F CρC,F + β1
σC,F F ρC,F
]
1
ρC,F. (6)
where β is the value share, and σC,F =ρC,F−1
ρC,Fthe elasticity of substitution between consumption
and leisure. The budget constraint is:
pCC = w(
1 − tl)
(E − F ) + r(
1 − tk)
K + TLS, (7)
where pC is the commodity price, w the gross wage, tl the tax rate on labour income, E the time
endowment, r the interest rate, tk tax rate on capital income and K the capital endowment.
Consumption pCC is financed by labour income w(
1 − tl)
(E−F ), capital income r(
1 − tk)
K
and the lump sum transfer TLS, that ensures revenue neutrality. Optimising (6) subject to
(7) yields the demand functions for goods and leisure. From the latter we calculate the labour
supply of the household.
A representative firm produces a homogenous output in each production sector according
to a nested CES production function. At the top level nest, aggregate value added (V A) is
combined in fixed proportions (Leontief production function) with a material composite (M).
M consists of intermediate inputs with fixed coefficients, whereas V A consists of labour (L)
and capital (K).19 The optimisation problem at the top level in each sector i can be written
as:
Yi = min
[
1
a0i
fi(Li, Ki);M1i
a1i
; ...;M12i
a12i
]
(8)
In the bottom nest, the following CES function is used:
fi(Li, Ki) = [αiLρi
i + (1 − αi) Kρi
i ]1
ρi (9)
where σi = 11−ρi
is the constant elasticity of substitution between labour and capital.
To account for imperfections of the German labour market, a minimum wage wmini is mod-
elled as a lower bound for the flexible wages in each sector.20 The labour supply is therefore
19The CGE module allows for sector-specific wages and capital costs (although the latter is rarely used)depending on the context of the simulated reform.
20It is possible to model different minimum wages for each activity. Assuming involuntary unemploymentinduced by a minimum wage is a rather strong assumption and might be to simple for the German labourmarket and a model with wage bargaining (see e.g. Bohringer et al. (2005)) might be more realistic. Therefore,the predictions of the magnitude of the employment effects should be interpreted carefully. However, for thepurpose of explaining possibilities of linking micro and macro models, this assumption should be sufficient.
17
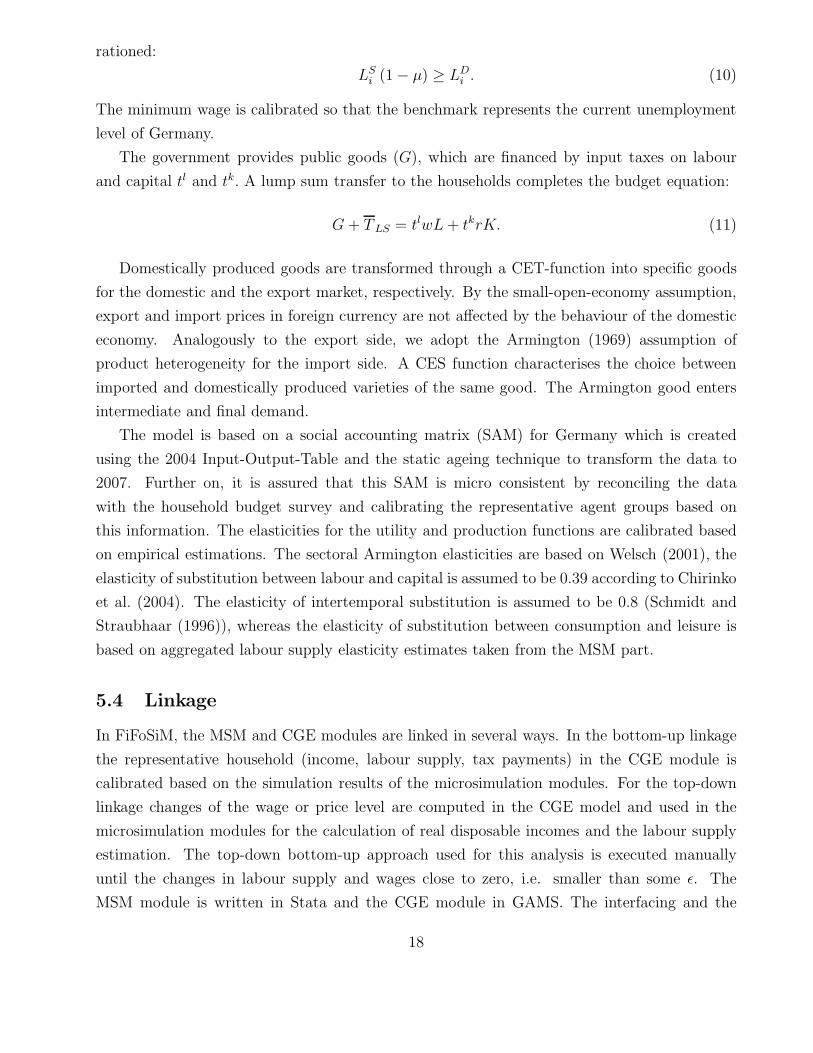
rationed:
LSi (1 − µ) ≥ LD
i . (10)
The minimum wage is calibrated so that the benchmark represents the current unemployment
level of Germany.
The government provides public goods (G), which are financed by input taxes on labour
and capital tl and tk. A lump sum transfer to the households completes the budget equation:
G + TLS = tlwL + tkrK. (11)
Domestically produced goods are transformed through a CET-function into specific goods
for the domestic and the export market, respectively. By the small-open-economy assumption,
export and import prices in foreign currency are not affected by the behaviour of the domestic
economy. Analogously to the export side, we adopt the Armington (1969) assumption of
product heterogeneity for the import side. A CES function characterises the choice between
imported and domestically produced varieties of the same good. The Armington good enters
intermediate and final demand.
The model is based on a social accounting matrix (SAM) for Germany which is created
using the 2004 Input-Output-Table and the static ageing technique to transform the data to
2007. Further on, it is assured that this SAM is micro consistent by reconciling the data
with the household budget survey and calibrating the representative agent groups based on
this information. The elasticities for the utility and production functions are calibrated based
on empirical estimations. The sectoral Armington elasticities are based on Welsch (2001), the
elasticity of substitution between labour and capital is assumed to be 0.39 according to Chirinko
et al. (2004). The elasticity of intertemporal substitution is assumed to be 0.8 (Schmidt and
Straubhaar (1996)), whereas the elasticity of substitution between consumption and leisure is
based on aggregated labour supply elasticity estimates taken from the MSM part.
5.4 Linkage
In FiFoSiM, the MSM and CGE modules are linked in several ways. In the bottom-up linkage
the representative household (income, labour supply, tax payments) in the CGE module is
calibrated based on the simulation results of the microsimulation modules. For the top-down
linkage changes of the wage or price level are computed in the CGE model and used in the
microsimulation modules for the calculation of real disposable incomes and the labour supply
estimation. The top-down bottom-up approach used for this analysis is executed manually
until the changes in labour supply and wages close to zero, i.e. smaller than some ǫ. The
MSM module is written in Stata and the CGE module in GAMS. The interfacing and the
18

information exchange has to be executed manually. We are currently implementing a routine
to automatically execute the GAMS program from Stata, read in the modified CGE parameters,
resolve the MSM model, write the modified MSM in GAMS format, execute the CGE model
and so on until convergence is achieved. However, it appears to be useful to manually check
the results to be able to quickly identify possible problems.
6 Cash flow flat tax proposal
The proposal of Mitschke (2004) in its original version combines an almost flat rate tax (two
brackets with different marginal rates) on earned income with a S-base cash flow tax, i.e. income
which is invested in firms is tax exempt.21 Real investments are granted an immediate write-
off, whereas financial investments are tax exempted. Therefore, the neutrality of the savings
and investment decision is achieved through this S-base cash flow tax. In effect, this reform
proposal is a switch from an income based tax system to consumption taxation (concept of
deferred taxation, see also Auerbach (2006)). In principle, this proposal is close to the ”Flat
Tax“ idea of Hall and Rabushka (1985) which combines a R-base cash flow taxation on corporate
income with the same single marginal tax rate on labour income.22 Essentially, the HR flat
tax is a consumption-type, origin-based value added tax (VAT) with a tax credit for labour
income (see Keen et al. (2007)). The tax base is sales minus purchases with capital goods being
excluded (R-base). Further on, this origin-based VAT is a tax on domestic production that
taxes exports but not imports (in contrast to the destination-based form of VAT).
The Mitschke proposal includes several elements to broaden the tax base compared to the
current German tax law. Pensions as well as all payments from insurance contracts are now
subject to income tax. Several non labour income related deductions are abolished or limited
to lump-sum amounts. Further on, an imputed rent on owner-occupied housing is also taxed.
In contrast to Mitschke (2004), who chooses a progressive tax schedule with two brackets, we
model a single marginal tax rate of 25% for all types of income with a basic allowance of 7,500
Euros in this paper. The marginal rate of 25% is computed from micro data as an average tax
rate of taxpayers under the Mitschke proposal. The basic allowance is chosen such that the
Mitschke flat tax yields the same revenue as the Mitschke two bracket schedule.
The Mitschke proposal further distinguishes between an introductory phase (personal in-
come tax reform) and a final phase (personal income tax and cash flow corporate tax). In the
first phase, only the personal income tax system is changed to a system with a single marginal
rate on all sources of income (including capital and business income). In the final phase, the
21See Fuest et al. (2007) for a detailed description and analysis of the Mitschke proposal.22See King (1987) and OECD (2007) for a review of the different concepts of corporate cash flow taxes.
19
modified personal income tax is combined with a cash flow corporate income tax with the
same marginal rate. In contrast to HR, the VAT is not changed in the Mitschke proposal.
Furthermore, the imputed rent on owner occupied housing is also part of the tax base in this
phase.
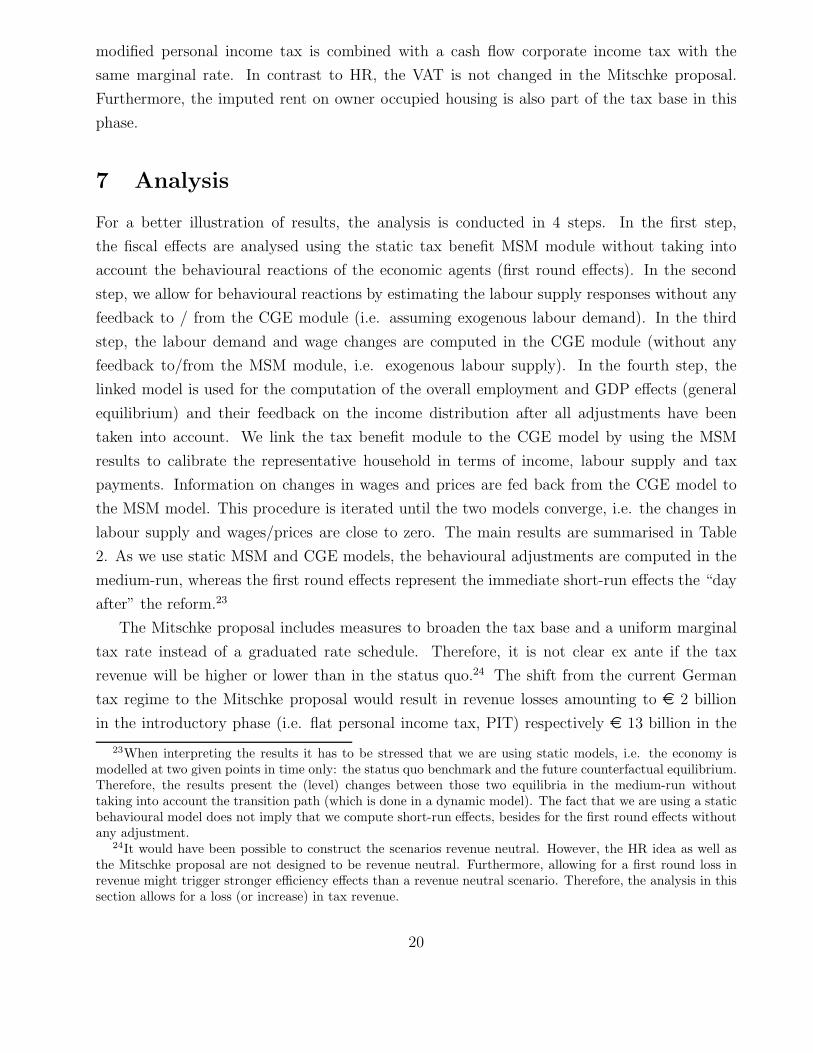
7 Analysis
For a better illustration of results, the analysis is conducted in 4 steps. In the first step,
the fiscal effects are analysed using the static tax benefit MSM module without taking into
account the behavioural reactions of the economic agents (first round effects). In the second
step, we allow for behavioural reactions by estimating the labour supply responses without any
feedback to / from the CGE module (i.e. assuming exogenous labour demand). In the third
step, the labour demand and wage changes are computed in the CGE module (without any
feedback to/from the MSM module, i.e. exogenous labour supply). In the fourth step, the
linked model is used for the computation of the overall employment and GDP effects (general
equilibrium) and their feedback on the income distribution after all adjustments have been
taken into account. We link the tax benefit module to the CGE model by using the MSM
results to calibrate the representative household in terms of income, labour supply and tax
payments. Information on changes in wages and prices are fed back from the CGE model to
the MSM model. This procedure is iterated until the two models converge, i.e. the changes in
labour supply and wages/prices are close to zero. The main results are summarised in Table
2. As we use static MSM and CGE models, the behavioural adjustments are computed in the
medium-run, whereas the first round effects represent the immediate short-run effects the “day
after” the reform.23
The Mitschke proposal includes measures to broaden the tax base and a uniform marginal
tax rate instead of a graduated rate schedule. Therefore, it is not clear ex ante if the tax
revenue will be higher or lower than in the status quo.24 The shift from the current German
tax regime to the Mitschke proposal would result in revenue losses amounting to e 2 billion
in the introductory phase (i.e. flat personal income tax, PIT) respectively e 13 billion in the
23When interpreting the results it has to be stressed that we are using static models, i.e. the economy ismodelled at two given points in time only: the status quo benchmark and the future counterfactual equilibrium.Therefore, the results present the (level) changes between those two equilibria in the medium-run withouttaking into account the transition path (which is done in a dynamic model). The fact that we are using a staticbehavioural model does not imply that we compute short-run effects, besides for the first round effects withoutany adjustment.
24It would have been possible to construct the scenarios revenue neutral. However, the HR idea as well asthe Mitschke proposal are not designed to be revenue neutral. Furthermore, allowing for a first round loss inrevenue might trigger stronger efficiency effects than a revenue neutral scenario. Therefore, the analysis in thissection allows for a loss (or increase) in tax revenue.
20

Model Round Effect PIT PIT + CIT
MSM 1 Tax revenue -2 billion e -13 billion e2 Labour supply +103,000 +251,000
CGE 3 Labour demand +370,000 +540,000Link 4 Tax revenue after adj. +3 billion e -6 billion e
4 Employment +337,000 +471,0004 Unemployment -0.9 p.p. - 1.3 p.p.4 Welfare +1.3% +2.5%4 GDP +1.1% +1.7%
Table 2: Summary of resultsSource: own calculations based on FiFoSiM
final phase (i.e. flat personal income tax and cash flow flat corporate income tax, CIT) without
taking the behavioural responses into account (first round effects). These short-run effects
indicate that the (not revenue neutral) flat tax reform scenario reduces the average tax burden
on labour. As a consequence of this lower tax wedge, the net wage is likely to increase and
the gross wage is likely to decrease. These effects imply increasing labour supply as well as
increasing labour demand due to reduced user costs of labour. These effects will be simulated
in the next steps. As mentioned before, the behavioural responses are expectations for the long-
run (partial or general) equilibrium as both models are static, i.e. not taking the transition
path into account.
In the second step, the labour supply effects are simulated in the behavioural MSM module
assuming exogenous labour demand and wages. Labour supply increases by 103,000 [251,000]
fulltime equivalents. By including those second round effects, revenue increases and revenue
losses are lowered. The distribution of the labour supply reactions with respect to different
groups is presented in the upper panel of Table 3. First of all it should be noted that all
groups increase their labour supply in both scenarios. Nevertheless, the differences between
both scenarios for the different groups are noteworthy. Women react stronger than men which
is in line with the recent empirical literature on female labour supply elasticities. One reason for
this effect in the German context is the (implicit) abolition of the system of joint taxation when
introducing a flat tax. The existing German system of joint taxation makes it unattractive for
secondary earners to work as both spouses face the same effective marginal tax rate. Therefore,
in many households only the husband is employed (often even working overtime) whereas
the wife does not work (or more precisely: specialises in household production). Lowering the
statutory (and effective) marginal tax rates decreases the incentives for this type of employment
distribution within a given household. As a consequence, women increase their labour force
participation whereas men decrease it. The fact that even married men in total increase their
labour supply can be explained by the tax relief through the lower tax rates. If the scenario
21

had been constructed to be revenue neutral ex-ante, the labour supply effects of married men
would have been close to zero (or even negative, see, e.g., Fuest et al. (2008)). These effects
are robust to parameter specifications in the sense that revenue neutral scenarios with higher
tax parameter values always yield lower labour supply effects, whereas scenarios with higher
tax reliefs yield higher labour supply reactions. Therefore, the labour supply effects of the flat
personal income tax in combination with the cash flow flat corporate income tax, which lead
to higher fiscal losses, are larger than those of the pure flat personal income tax.
Couple male Couple female Single male Single female Total
A: LS PIT 27,208 39,607 1,950 34,706 103,471PIT+CIT 46,681 73,649 55,957 74,921 251,208
B: Emp. PIT 79,754 118,753 30,238 108,900 337,645PIT+CIT 96,094 148,075 82,558 144,689 471,416
Table 3: Labour supply (A) and employment (B) effects (fulltime equivalents)Source: own calculations based on FiFoSiM
So far, these results are only based on the MSM. In the third step, the CGE model is used
to derive the effects on labour demand, which increases by 370,000 [540,000] due to reduced
costs of capital and labour. As labour supply is assumed to be exogenous in this step, the
wages increase as a consequence.
In the fourth step, the linked model is used to integrate the micro (labour supply) and macro
(labour demand) analysis. The information from the MSM (step 1 and 2) is used to calibrate
the representative household of the CGE model and the feedback effects on wages and prices
(step 3) are used again in the MSM model. Both models are resolved several times until they
converge. This leads to the following results: employment increases by 337,000 full-time jobs,
unemployment is reduced by 0.9 p.p., and GDP increases by 1.1% in the PIT scenario. The
distribution of these employment effects across different groups is presented in the lower panel
of Table 3 and is rather similar to the distribution of labour supply effects explained above.
The overall employment effects are larger than the labour supply reactions because of reduced
costs of labour and capital resulting in increasing labour and investment demand.25 However,
the employment effects are smaller than the pure labour demand effect derived from the stand-
alone CGE model in step 3. These two result imply that the incidence of the tax reform is split
between employees (labour supply) and employers (labour demand). This result is confirmed
by the average increase in the wages which is smaller than the reduction in the tax wedge.
This effect indicates the importance of taking the feedback effects into account as the pure
25These results are in line with results from Aaberge et al. (2007) for Norway. They also derive for aflat personal income tax scenario that the general equilibrium effects are larger than the pure labour supplyreactions.
22

labour supply model would underestimate the employment effects whereas the labour demand
model would overestimate them. For the PIT+CIT scenario, we calculate a total of 471,000
new full-time jobs (unemployment is reduced by 1.3 p.p.) and a 1.7% increase in GDP. These
results show that a cash flow flat tax leads to further efficiency gains due to more investment
and labour demand as a consequence of reduced tax distortions in the corporate sector.
Can such a reform overcome the fundamental equity efficiency trade-off? The introduction
of an almost revenue neutral tax reform always yields winners as well as losers. To analyse the
distributional effects of the two reform scenarios, we compute different distributional measures
based on equivalised disposable incomes26. The distributional effects before any (short run)
and after the complete (long run) adjustment process are presented in Table 4.
DPI without adj. DPI with adj. Equivalent variationDecile PIT PIT+CIT PIT PIT+CIT PIT PIT+CIT
1 0.69 0.88 79.48 79.73 65 452 0.01 -0.33 12.42 12.05 -28 -1633 -0.22 -1.82 6.20 4.35 -67 -4544 -0.64 -2.53 3.16 1.41 90 -3875 -1.33 -2.63 0.61 -0.59 282 -1266 -1.92 -2.35 -0.55 -0.63 291 7707 -2.30 -1.49 -2.13 -0.89 -516 5968 -2.42 0.03 -3.19 -0.23 -251 3,3239 -1.83 1.45 -2.63 1.88 -557 4,802
10 2.70 6.54 2.38 7.24 6,906 15,559Gini / Sum 1.51 4.90 -2.38 1.73 6,215 23,965
Table 4: Change in disposable income (DPI, in percent) and equivalent variation (in million e)Source: own calculations based on FiFoSiM
Without taking any behavioural responses or adjustments into account (short-term first
round effects) the highest decile, which generates the largest part of the overall tax payments,
gains the most in both flat tax scenarios. Households in the lowest deciles seldom pay taxes in
the status quo. Overall, both scenarios lead to redistribution from middle income households
to the ’rich’, e.g., the middle income deciles finance the relief of the 10% richest taxpayers.
This result is reflected in an increase of the Gini coefficient of disposable incomes.27 The main
26We use the new OECD equivalence scale which weights the household head with a factor of 1, householdmembers over the age of 14 with 0.5, and under 14 with 0.3. The households net income is divided by the sumof the individual weights of each member (=equivalence factor) to compute the equivalence weighted householdincome. The results without equivalising household incomes do not differ qualitatively. Further on, we do notreport the results of other summary measures of inequality, poverty or richness as they do not contribute anynew insights to the analysis.
27The Gini coefficient of the distribution of tax payments (not shown in the table) is decreasing in bothscenarios indicating less redistribution through the income tax system. This prediction is confirmed whenlooking at more comprehensive measures of tax progressivity and redistribution. These report a decrease in
23

reason is the relief for the top of the distribution. The small gains at the lower end cannot
compensate the higher burden in the middle income range and therefore inequality increases.
These effects change, however, after the economy has fully equilibrated. Especially the
lowest deciles (using the same classification of households into deciles as before any adjustments)
gain above average in relative terms in both scenarios. These high relative changes can be
explained by the low absolute values for disposable incomes in these deciles, which consist mostly
of transfers. If some of these persons start working, they often earn a multiple of their previous
income. This explains the large changes in relative terms. Still, the highest decile gains most in
absolute terms and again middle income deciles are burdened the most. The introduction of the
personal income flat tax reduces inequality because of the strong behavioural responses at the
bottom of the distribution. When combining the personal income flat tax with the corporate
cash-flow tax, however, inequality still increases but less than without behavioural adjustment.
This is due to the fact that especially the high income households have corporate or business
income.
In addition to looking at the changes in disposable income, we also report the effects on util-
ity (after the adjustment process). The computation of welfare measures is another important
aspect for the evaluation of tax reforms. Several methods and measures have been developed
in the vast literature on welfare economics.28 We compute the changes in the equivalent vari-
ation as a money metric welfare measure based on the microeconometrically estimated utility
function of the labour supply model. The equivalent variation EVi for each individual i can be
expressed as:
EVi = Ei(p0, U0
i ) − Ei(p0, U1
i ) = Ei(p1, U1
i ) − Ei(p0, U1
i ) (12)
where Ei is the expenditure function, p the price (wage) vector, and Ui the utility level before
(superscript 0) and after (1) the reform.
The effects on utility differ from the pure effects on disposable income as they take into
account the consumption-leisure decision which implies an income and a substitution effect of
the change in disposable income induced by the tax reform. Therefore, increasing (decreasing)
disposable income (i.e. labour supply incentives) does not necessarily trigger higher (lower)
labour supply. The distribution of utility gains and losses again indicate a redistribution from
the poor and middle income households to the rich. In total, when looking at the sum of these
efficiency gains (implicitly assuming an Utilitarian social welfare function with equal weights),
the utility gains are larger than the tax revenue losses. Therefore, it would be possible to
compensate the people who face lower utility as a consequence of the reform to increase the
support for such a policy. This gain in overall welfare is achieved because the reform reduces
both dimensions for both scenarios.28See Slesnick (1998) for a comprehensive survey.
24
the labour leisure distortions caused by the existing tax system. Further on, one should note
that average gains of a decile do not, of course, exclude heterogeneity within deciles.
8 Conclusion
In this paper, we analysed the introduction of a comprehensive cash flow flat tax in the tradition
of Hall and Rabushka (1985) using a linked MSM-CGE model, which provides a powerful tool
for the ex-ante evaluation of hypothetical tax benefit reform proposals. Taking the feedback
effects into account has important implications for the evaluation of tax reforms. Using the
linked model it is possible to extent the MSM analysis beyond labour supply reactions by taking
into account the effects on (un)employment and GDP. The CGE model can be supplemented
with a detailed distributive analysis.
Our analysis showed that the overall employment effects are larger than the labour supply
reactions - because of reduced costs of labour and capital resulting in increasing labour and
investment demand - but smaller than the the pure CGE labour demand effects because of
labour supply and wage adjustments. Therefore, it is important to take these feedback effects
into account. In doing so, the analysis shows that a personal income flat tax can overcome the
familiar equity efficiency trade-off, but only in the long-run. The adverse immediate distribu-
tional effects still dominate in the short-run. However, combining this flat tax with a cash flow
flat tax on business income with the same marginal rate still increases inequality due to the
large gains at the top of the distribution at the expense of the middle class. This is impor-
tant from a political economy perspective. A strong and politically powerful middle class is a
typical characteristic of most Western European countries. This suggests that it will be hard
for flat tax reforms to spill over to these grown-up democracies. Since our analysis focuses on
Germany, the question arises whether the main findings are likely to apply to other countries
as well. Therefore, more (and especially comparative) country studies are required to complete
the picture. However, a multi-country linked MSM-CGE model has not been developed yet.
When interpreting the results, it has to be taken into account that we have limited our
analysis to static models. Therefore, the effects from our analysis only account for the new
equilibrium neglecting the transition path.29 However, regarding the political feasibility of a
flat tax reform, the short-term effects are most likely to be decisive.30
29Flat taxes are also supposed to have positive dynamic efficiency and growth effects (see e.g. Stokey andRebelo (1995) or Cassou and Lansing (2004)).
30People tend to judge future gains and losses asymmetrically (see e.g. the “prospect theory“ by Kahnemanand Tversky (1979)). Starting from a reference point (status quo) and given the same variation in absolutevalues, there is a bigger impact of losses than of gains (loss aversion). Furthermore, people prefer the status quoover uncertain outcomes in the future (“status-quo-bias“, see Kahneman et al. (1991)). Therefore, short-termlosses in comparison to the status quo can have a much stronger impact than (possible) future gains. Hence,
25
An aspect that is neglected in our analysis is the impact of tax reforms on training and
human capital accumulation. The results in Jacobs et al. (2007) suggest that flat tax reforms
may increase investment in skill formation and thus change the composition of the labour
force in the long term. But the question arises whether the income tax is the best instrument
to achieve this. Furthermore, our analysis abstracts from effects of the flat tax reform on
compliance. Flat rate tax systems are widely expected to improve taxpayer compliance. The
2001 tax reform in Russia is widely thought to be an example for this effect. Indeed, tax
compliance and revenue apparently improved by about one third after the 2001 tax reform
(Ivanova et al. (2005)). However, it is not clear whether this can be attributed solely to the flat
tax or to improved law enforcement and tax administration which was also part of the 2001
reform (see also Gaddy and Gale (2005) and Gorodnichenko et al. (2007)). Moreover, the case
of Russia differs from Germany insofar as the latter has a long tradition of income taxation
in a market economy and a well established tax administration to ensure tax compliance. In
addition, since we do not change social insurance contributions, the marginal tax rate on labour
still remains high. This suggests that positive effects of a flat tax reform on compliance are
probably less important in Germany than in the transition countries of Eastern Europe.
Furthermore, the question arises whether the scope of increasing GDP and employment
through personal income tax reforms is sufficiently large. Including the corporate income tax
in the analysis does indeed lead to larger efficiency effects, but at the expense of increasing
inequality. Therefore, the main problem of implementing a flat tax would be to convince a
majority of the population that an immediate redistribution in favour of the highest income
deciles is acceptable to achieve (uncertain) future efficiency gains. Furthermore, it is uncertain
whether a tax system that abolishes a large number of exemptions and tax reliefs is politically
sustainable. The temptation for politicians to serve special interest groups with special deduc-
tions will not easily disappear. Moreover, from a political economy perspective, a broad tax
base allows the government to increase revenue with small increases in tax rates. Therefore,
narrow tax bases might protect the taxpayers from excess taxation by the government.31
References
Aaberge, R., Colombino, U., Holmøy, E., Strøm, B. and Wennemo, T. (2007). Population
Ageing and Fiscal Sustainability: Integrating Detailed Labour Supply Models with CGE
Models, in A. Harding and A. Gupta (eds), Modelling Our Future: Social Security and
Taxation, Vol. I, Elsevier, Amsterdam, pp. 259–290.
the short term effects presented here could be decisive.31Cf. Brennan and Buchanan (1980).
26
Aaberge, R., Colombino, U. and Strøm, S. (2000). Labor Supply Responses and Welfare Effects
from Replacing Current Tax Rules by a Flat Tax: Empirical Evidence from Italy, Norway
and Sweden, Journal of Population Economics 13: 595–621.
Altig, D., Auerbach, A., Kotlikoff, L., Smetters, K. and Walliser, J. (2001). Simulating funda-
mental tax reform in the U. S., American Economic Review 91(3): 574–595.
Anderson, J. M. (1990). Micro-Macro Linkages in Economic Models, in G. H. Lewis and R. C.
Michel (eds), Microsimulation Techniques for Tax and Transfer Analysis, Urban Institute
Press.
Armington, P. (1969). A Theory of Demand for Products distinguished by Place of Production,
IMF Staff Papers 16: 159–176.
Arntz, M., Boeters, S. and Gurtzgen, N. (2006). Alternative Approaches to Discrete Working
Time Choice in an AGE Framework, Economic Modelling 23: 1008–1032.
Arntz, M., Boeters, S., Gurtzgen, N. and Schubert, S. (2008). Analysing Welfare Reform in a
Microsimulation-AGE Model: The Value of Disaggregation, Economic Modelling 25: 422–
439.
Auerbach, A. J. (2006). The Choice Between Income and Consumption Taxes: A Primer,
NBER Working Paper No. 12307.
Ballard, C., Fullerton, D., Shoven, J. and Whalley, J. (1985). A General Equilibrium Model for
Tax Policy Evaluation, University of Chicago Press, Chicago.
Bergman, L. (2005). CGE Modeling of Environmental Policy and Resource Management, in
K. G. Maler and J. R. Vincent (eds), Handbook of Environmental Economics, North-
Holland, Amsterdam, chapter 24, pp. 1273–1306.
Betson, D. (1990). How Reliable are Conclusions Derived from Microsimulation Models?, in
J. Brunner and H.-G. Petersen (eds), Simulation Models in Tax and Transfer Policy:
Proceedings of an International Symposium, Campus Verlag, Frankfurt am Main, pp. 423–
446.
Blundell, R. and MaCurdy, T. (1999). Labor Supply: A Review of Alternative Approaches,
in O. Ashenfelter and D. Card (eds), Handbook of Labor Economics, Vol. 3A, Elsevier,
Amsterdam, pp. 1559–1695.
Boeters, S., Feil, M. and Gurtzgen, N. (2005). Discrete Working Time Choice in an Applied
General Equilibrium Model, Computational Economics 26: 183–211.
27

Boeters, S., Gurtzgen, N. and Schnabel, R. (2006). Reforming Social Welfare in Germany - An
Applied General Equilibrium Analysis, German Economic Review 7: 363–388.
Bohringer, C., Boeters, S. and Feil, M. (2005). Taxation and Unemployment: An Applied
General Equilibrium Approach, Economic Modelling 22: 81–108.
Bohringer, C. and Rutherford, T. (2006). Combining Top-Down and Bottom-up in Energy
Policy Analysis: A Decomposition Approach, ZEW Discussion Paper No. 06-007.
Bourguignon, F., Robilliard, A.-S. and Robinson, S. (2003). Representative versus Real
Households in the Macro-Economic Modelling of Inequality, DIAL Document de Travail
DT/2003-10.
Bourguignon, F. and Savard, L. (2008). Distributional Effects of Trade Reform: An Integrated
Macro-Micro Model Applied to the Philippines, in F. Bourguignon, L. A. Pereira da Silva
and M. Bussolo (eds), The Impact of Macroeconomic Policies on Poverty and Income Dis-
tribution Macro-Micro Evaluation Techniques and Tools, Palgrave-Macmillan Publishers
Limited, Houndmills.
Bourguignon, F. and Spadaro, A. (2006). Microsimulation as a tool for evaluating redistribution
policies, Journal of Economic Inequality 4(1): 77–106.
Brennan, G. and Buchanan, J. (1980). The Power to Tax: Analytical Foundations of a Fiscal
Constitution, Cambridge University Press, New York.
Browning, E. and Browning, J. (1985). Why Not a True Flat Rate Tax, Cato Journal 5: 127–
143.
Cajner, T., Grobovsek, J. and Kozamernik, D. (2006). Welfare and Efficiency Effects of Alter-
native Tax Reforms in Slovenia, IB Revija (IB Review) XXXX (1-2): 125–136.
Caminada, K. and Goudswaard, K. (2001). Does a Flat Rate Individual Income Tax Reduce
Tax Progressivity? A Simulation for the Netherlands, Public Finance and Management 1
(4): 471–499.
Cassou, S. P. and Lansing, K. J. (2004). Growth Effects of Shifting from a Graduated-rate Tax
System to a Flat Tax, Economic Inquiry 42(2): 194–213.
Chirinko, R. S., Fazzari, S. M. and Meyer, A. P. (2004). That Elusive Elasticity: A Long-Panel
Approach to Estimating the Capital-Labor Substitution Elasticity, CESifo-Working Paper
No. 1240.
28

Cogneau, D. and Robilliard, A.-S. (2000). Growth, Distribution and Poverty in Madagascar:
Learning from a Microsimulation Model in a General Equilibrium Framework, Interna-
tional Food Policy Research Institute TMD Discussion Paper 61.
Conrad, K. (1991). Intertemporal General Equilibrium Modelling of German Tax Reform
Proposals, Finanzarchiv 48 (2): 194–221.
Cororaton, C. B., Cockburn, J. and Corong, E. (2005). Doha Scenarios, Trade Reforms, and
Poverty in the Philippines: A Computable General Equilibrium Analysis, World Bank
Policy Research Working Paper 3738.
Davies, J. (2004). Microsimulation, CGE and Macro Modelling for Transition and Developing
Economies, Mimeo, University of Western Ontario.
Daz Gimenez, J. and Pijoan-Mas, J. (2006). Flat Tax Reforms in the US: A Boon for the
Income Poor, CEPR Discussion Paper No. 5812.
Decoster, A. and Orsini, K. (2007). Verdient een vlaktaks zichzelf terug?, Leuvense Economische
Standpunten, K.U. Leuven, Centrum voor Economische Studin.
Dunbar, A. and Pogue, T. (1998). Estimating Flat Tax Incidence and Yield: A Sensitivity
Analysis, National Tax Journal 51: 303–324.
Franz, W., Gurtzgen, N., Schubert, S. and Clauss, M. (2008). Reformen im Niedriglohnsektor -
eine integrierte CGE-Mikrosimulationsstudie der Arbeitsangebots- und Beschaftigungsef-
fekte, in W. Franz, H. J. Ramser and M. Stadler (eds), Arbeitsvertrage, Wirtschaftswis-
senschaftliches Seminar Ottobeuren Bd. 37, Tubingen.
Fuest, C., Peichl, A. and Schaefer, T. (2005a). Aufkommens-, Beschaftigungs- und Wachstum-
swirkungen einer Steuerreform nach dem Vorschlag von Mitschke, FiFo-Bericht 05-2005.
Fuest, C., Peichl, A. and Schaefer, T. (2005b). Dokumentation FiFoSiM: Integriertes
Steuer-Transfer-Mikrosimulations- und CGE-Modell, Finanzwissenschaftliche Diskussions-
beitrage Nr. 05 - 03.
Fuest, C., Peichl, A. and Schaefer, T. (2007). Aufkommens-, Beschaftigungs- und Wachstum-
swirkungen einer Steuerreform nach dem Vorschlag von Mitschke, Nomos, Baden-Baden.
Fuest, C., Peichl, A. and Schaefer, T. (2008). Is a flat tax reform feasible in a grown-up
democracy of Western Europe? A simulation study for Germany, International Tax and
Public Finance 15: 620–636.
29

Gaddy, C. G. and Gale, W. G. (2005). Demythologizing the Russian Flat Tax, Tax Notes
International 43: 983–988.
Gale, W. G., Houser, S. and Scholz, J. K. (1996). Distributional Effects of Fundamental Tax
Reform, in H. J. Aaron and W. G. Gale (eds), Economic Effects of Fundamental Tax
Reform, The Brookings Institution, Washington, D. C., pp. 281–320.
Gonzlez-Torrabadella, M. and Pijoan-Mas, J. (2006). Flat tax reforms: a general equilibrium
evaluation for Spain, Investigaciones Econmicas XXX (2): 317–351.
Gorodnichenko, Y., Martinez-Vazquez, J. and Peter, K. S. (2007). Myth and Reality of Flat
Tax Reform: Micro Estimates of Tax Evasion Response and Welfare Effects in Russia,
IZA Discussion Paper No. 3267.
Gupta, A. and Kapur, V. (2000). Microsimulation in Government Policy and Forecasting,
North-Holland, Amsterdam.
Hall, R. E. and Rabushka, A. (1985). The Flat Tax, Hoover Institution Press, Stanford.
Harding, A. (1996). Microsimulation and public policy, North-Holland, Elsevier, Amsterdam.
Hausman, J. (1985). Taxes and Labor Supply, in A. Auerbach and M. Feldstein (eds), Handbook
of Public Economics, North-Holland, Amsterdam, pp. 213–263.
Heer, B. and Trede, M. (2003). Efficiency and distribution effects of a revenue-neutral income
tax reform, Journal of Macroeconomics 25: 87–107.
Herault, N. (2007). Trade Liberalisation, Poverty and Inequality in South Africa: A CGE-
Microsimulation analysis, Economic Record 83 (262): 317–328.
Ho, M. and Stiroh, K. (1998). Revenue, Progressivity and the Flat Tax, Contemporary Eco-
nomic Policy XVI: 85–97.
Ivanova, A., Keen, M. and Klemm, A. (2005). Russia’s ’flat tax’, Economic Policy July: 397–
444.
Jacobs, B., de Mooij, R. A. and Folmer, K. (2007). Analyzing a flat income tax in the Nether-
lands, Tinbergen Institute Discussion Paper 2007-029/3.
Kahneman, D., Knetsch, J. L. and Thaler, R. H. (1991). Anomalies: The endowment effect,
loss aversion, and status quo bias, Journal of Economic Perspectives 5: 193–206.
30

Kahneman, D. and Tversky, A. (1979). Prospect theory: An analysis of decision under risk,
Econometrica 47: 263–291.
Keen, M., Kim, Y. and Varsano, R. (2007). The ’flat tax(es)’: Principles and experience,
International Tax and Public Finance forthcoming.
Kehoe, T. (1998). Social Accounting Matrices and Applied General Equilibrium Models, Applied
Economics and Public Policy pp. 59–87.
Kehoe, T. and Prescott, E. (1995). Introduction to the Symposium: The Discipline of Applied
General Equilibrium, Economic Theory 6: 1–11.
King, M. (1987). The Cash Flow Corporate Income Tax, in M. Feldstein (ed.), The Effects of
Taxation on Capital Accumulation, University of Chicago Press, Chicago.
Lau, L. (1984). Comments on Mansur and Whalley (1984), in H. Scarf and J. B. Shoven (eds),
Applied General Equilibrium Analysis, Cambridge University Press, New York, pp. 127–
137.
Mansur, A. and Whalley, J. (1984). Numerical Specification of Applied General Equilibrium
Models: Estimation, Calibration and Data, in H. Scarf and J. B. Shoven (eds), Applied
General Equilibrium Analysis, Cambridge University Press, New York, pp. 69–127.
McFadden, D. (1973). Conditional Logit Analysis of Qualitative Choice Behaviour, in P. Zarem-
bka (ed.), Frontiers in Econometrics, Academic Press, New York, pp. 105–142.
Mitschke, J. (2004). Erneuerung des deutschen Einkommensteuerrechts: Gesetzestextentwurf
und Begrundung, Verlag Otto Schmidt, Koln.
Nielsen, S. B., Frederiksen, N. K. and Lassen, D. D. (1999). Would the flat tax fall flat in
Denmark?, in T. M. Andersen, S. E. H. Jensen and O. Risager (eds), Macroeconomic
Perspectives on the Danish Economy, MacMillan, pp. 106–133.
OECD (2007). Fundamental Reform of Corporate Income Tax, OECD Tax Policy Studies 16.
Orcutt, G. (1967). Microeconomic Analysis for Prediction of National Accounts, in H. Wold,
G. H. Orcutt, E. A. Robinson, D. Suits and P. de Wolff (eds), Forecasting on a Scientific
Basis - Proceedings of an International Summer Institute, Gulbenkian Foundation, Lisbon.
Paulus, A. and Peichl, A. (2008). Effects of flat tax reforms in Western Europe on equity and
efficiency, EUROMOD Working Paper No. EM2/08, University of Essex.
31

Peichl, A. and Schaefer, T. (2006). Documentation FiFoSiM: Integrated Tax Benefit Microsim-
ulation and CGE Model, Finanzwissenschaftliche Diskussionsbeitrage Nr. 06 - 10, Univer-
sitat zu Koln.
Peichl, A. and Schaefer, T. (2008). FiFoSiM - An Integrated Tax Benefit Microsimulation and
CGE Model for Germany, International Journal of Microsimulation 2: fortcoming.
Pyatt, G. and Round, J. (1985). Social Accounting Matrices. A Basis for Planning, The World
Bank, Washington D.C.
Rausch, S. and Rutherford, T. F. (2007). Computation of Equilibria in OLG Models With
Many Heterogeneous Households, Ruhr Economic Paper No. 15.
Rutherford, T., Tarr, D. and Shepotylo, O. (2005). Poverty Effects of Russia’s WTO Accession:
Modelling ‘Real’ Households and Endogenous Productivity Effects, World Bank Policy
Research Working Paper 3473.
Savard, L. (2003). Poverty and Income Distribution in a CGE-Household Micro- Simulation
Model: Top-Down/Bottom Up Approach, CIRPEE Centre interuniversitaire sur le risque,
les politiques economiques et l’emploi. Working Paper 03-43.
Schmidt, C. and Straubhaar, T. (1996). Bevolkerungsentwicklung und Wirtschaftswachstum
- Eine Simulationsanalyse fur die Schweiz, Schweizerische Zeitschrift fur Volkswirtschaft
und Statistik 132(3): 395–414.
Slesnick, D. T. (1998). Empirical Approaches to the Measurement of Welfare, Journal of
Economic Literature 36(4): 2108–2165.
Stokey, N. L. and Rebelo, S. (1995). Growth Effects of Flat-Rate Taxes, Journal of Political
Economy 103(3): 519–550.
Van Soest, A. (1995). Structural Models of Family Labor Supply: A Discrete Choice Approach,
Journal of Human Resources 30: 63–88.
Van Soest, A., Das, M. and Gong, X. (2002). A Structural Labour Supply Model with flexible
Preferences, Journal of Econometrics 107: 345 – 374.
Ventura, G. (1999). Flat Tax Reform: A Quantitative Exploration, Journal of Economic
Dynamics and Control 23: 1425–1458.
Verboven, F. (1996). The nested logit model and representative consumer theory, Economic
Letters 50 (1): 57–63.
32

Wagenhals, G. (2004). Tax-benefit microsimulation models for Germany: A Survey, IAW-
Report / Institut fuer Angewandte Wirtschaftsforschung (Tubingen) 32(1): 55–74.
Welsch, H. (2001). Armington Elasticities and Product Diversity in the European Community:
A Comparative Assessment of Four Countries, Working Paper, University of Oldenburg.
33