THE AUTOMOTIVE SECTOR IN PAKISTAN
121
THE AUTOMOTIVE SECTOR IN PAKISTAN Final Report
Transcript of THE AUTOMOTIVE SECTOR IN PAKISTAN

THE AUTOMOTIVE
SECTOR IN PAKISTAN
Final Report

ii
TABLE OF CONTENTS
LIST OF ACRONYMS 1
EXECUTIVE SUMMARY 4
CHAPTER 1: INTRODUCTION 9
1.1. Terms of Reference 9
1.2. History of the Sector 10
1.3. Review of Literature 12
CHAPTER 2: THE AUTOMOTIVE SECTOR
16
2.1. Coverage 16
2.2. Sizing of the Sector 16
2.3. Contribution To The Economy 26
2.4. Demand Analysis 32
CHAPTER 3: POLICY AND REGULATORY FRAMEWORK
34
3.1. TRIMS 34
3.2. Investment Policy 36
3.3. Trade Policies 38
3.4. Tariff Policy 39
3.5. Auto Industry Development Programme 43
3.6. Policy and Standards 44
CHAPTER 4: EXTENT OF EFFECTIVE PROTECTION
45
4.1. Methodology 45
4.2. Results 46
4.3. Recommendations on Tariff Reform 47
CHAPTER 5: ASSESSMENT OF COMPETITION IN THE SECTOR
52
5.1. Methodology for Assessing Degree of Competition 52
5.2. Measure of Extent of Competition 53
5.3. Assessment of Competition in the Automotive Sector 54
CHAPTER 6: PROFILE OF THE SAMPLE OF VENDORS
58
6.1. Objectives of the Survey 58
6.2. The Sample 58
6.3. Legal Status 61

iii
6.4. Membership of Associations 61
6.5. Investment and Capacity 62
6.6. Turnover 63
6.7. Employment 63
6.8. Cost Structure 64
6.9. Gross Profit and Value Added 64
CHAPTER 7: KEY ISSUES IN THE VENDING INDUSTRY
66
7.1. Impact of Tariff Protection 66
7.2. Extent of Competition 70
7.3. Degree of Competitiveness 71
7.4. Factors Influencing Growth 71
7.5. The Role of Government Regulation and Policies 72
7.6. Impact of Power Outages 74
CHAPTER 8: PAKISTAN’S TRADE IN THE AUTOMOTIVE SECTOR
75
8.1. Trade in the Automotive Sector 75
8.2. Factors Constraining Growth of Exports 78
8.3. Required Support 79
CHAPTER 9: PROSPECTS FOR INDO-PAK TRADE
80
9.1. The Automotive Sector of India 81
9.2. Extent of Trade Complementarity 84
9.3.Likely Pattern of Indo-Pak Trade 86
9.4. Perceptions of Trade with India 87
9.5. Possible Mitigation Measures 89
CHAPTER 10: CONCLUSIONS AND RECOMMENDATIONS 91
10.1. Conclusions 91
10.2. Recommendations 97
APPENDICES 101
Appendix 1: Chronological History of the Automobile Industry 101
Appendix 2: Questionnaire for Autoparts Manufacturer 103
REFERENCES
114

iv
LIST OF TABLES Table 2.1: Indicators of Size of the Automotive Sector from the CMI of 2005-06 17 Table 2.2: Number of Units in 2011 According to Associations 18 Table 2.3: Reported Capacity of OEMs and Rates of Utilisation 18 Table 2.4: Estimated Levels of Production of Different Types of Vehicles, 2000-01 to
2010-11 21 Table 2.5: International Comparison of Production of Vehicles in Relation to
Population 22 Table 2.6: Recent Trends in Prices of Cars, 2008 to 2012 23 Table 2.7: Estimated Turnover in 2009-10 in Different Sub-sectors 24 Table 2.8: Increase in Number of Motor Cycles on Road and Annual Sales 25 Table 2.9: Imports by the Automotive Sector, 2005-06 to 2010-11 25 Table 2.10: Total Exports by Automotive Sector, 2005-06 to 2010-11 26 Table 2.11: Estimated Investment in the Automotive Sector, 2000-01 to 2009-10 26 Table 2.12: Estimated Value Added by the Automotive Sector, 2009-10 27 Table 2.13: Estimated Employment in the Automotive Sector, 2009-10 28 Table 2.14: Estimated Revenue Contribution by the Automotive Sector, 2009-10 29 Table 2.15: Estimated Foreign Exchange Savings due to the Automotive Sector, 2009-
10 30 Table 2.16: Summary of the Key Indicators of the Size and Contribution to the
Economy by the Automotive Sector 31
Table 2.17: International Comparison of the Contribution to the Economy by the Automotive Sector, 2010
32
Table 2.18: Short-Run Elasticities of Demand of Different Types of Vehicles 33 Table 3.1: Governing SROs 41 Table 3.2 SRO 693: Levy of Additional Duty on Automotive Sector 42 Table 4.1: Duty Structure on Automotive Sector (During 2011-12) 48 Table 4.2 Effective Protection Rates 50 Table 4.3: Proposed Tariff Structure in Automotive Sector 51 Table 5.1: Magnitude of HHI, 2010-11 54 Table 5.2: Trends in Profitability of OEMs and Autoparts Manufacturers 56 Table 6.1: Legal Status of Vendors and OEMs 61
Table 6.2: Investment and Capacity of Sampled Vendors 62
Table 6.3: Annual Turnover of Sample Vendor Units 63
Table 6.4: Average Employment by Type in Sample Vendor Units 63
Table 6.5: Labour Productivity in Sample Vendor Units 64
Table 6.6: Average Share of the Main Cost Components in Sample Vendors 64
Table 6.7: Gross Profits of the Sample Vendor Units 65
Table 6.8: Share of Value Added in Turnover 65
Table 7.1: Estimated Level of Employment in the Vending Industry 66
Table 7.2: Percentage of Sample Vendors by Type of Production Process 67

v
Table 7.3: Presence of Quality Assurance Measures in Sample Vendors 68
Table 7.4: Establishment of Quality Control Procedures by Sample Vendors 68
Table 7.5: Percentage of Sample Vendors with Quality Control 69
Table 7.6: Main Constraints to Improvement of Quality by Sample Vendors 70
Table 7.7: Vendors Share in Supply of Parts 70
Table 7.8: Main Factors Contributing to Vendors' Growth 72
Table 7.9: Government Agencies Approached for Approval of Imports 72
Table 7.10: Impact of Government Regulations on Growth of Sample Vendors 73
Table 7.11: Support Required from Government to Produce Higher Technology Products
73
Table 7.12: Implications of Power Outage 74
Table 8.1: Composition of Pakistan’s Imports and Exports of Automotive Products, 2009-10
76
Table 8.2: Origins of Major Imports of Pakistan of Automotive Products 77
Table 8.3: Destination of Major Exports by Pakistan of Automotive Products 77
Table 8.4: Support Required for Establishing Export Market 79
Table 9.1: Volume of Trade in the Automotive Sector of India 81
Table 9.2: Automobile Production Statistics by Country 82
Table 9.3: Index of Production of Vehicles in India 82
Table 9.4: Composition of India’s Exports and Imports of Automotive Products 83
Table 9.5: Index of Trade Complementarity between Pakistan’s Imports and Indian Exports of Automotive Products
85
Table 9.6: Index of Trade Complementarity between Indian’s Imports and Pakistan’s Exports of Automotive Products
86
Table 9.7: Landed Prices of ‘Potential’ Indian Exports of Automobile Products to Pakistan and Domestic Prices
88
LIST OF FIGURES
Figure 4.1: Two Protection Scenarios 44
LIST OF CHARTS Chart 2.1 Range of Automobile Products in Pakistan 19 Chart 2.2: Major Joint Ventures for Automobiles 20 Chart 2.3: Vendor Industry Technical Collaboration 22 Chart 6.1: Listing of Sampled Vendors, Type of Autoparts Produced and Listing of Sample OEMs 59
LIST OF BOXES Box 2.1: The Autovending Industry of Pakistan 21 Box 3.1: TRIMS Content 34
1
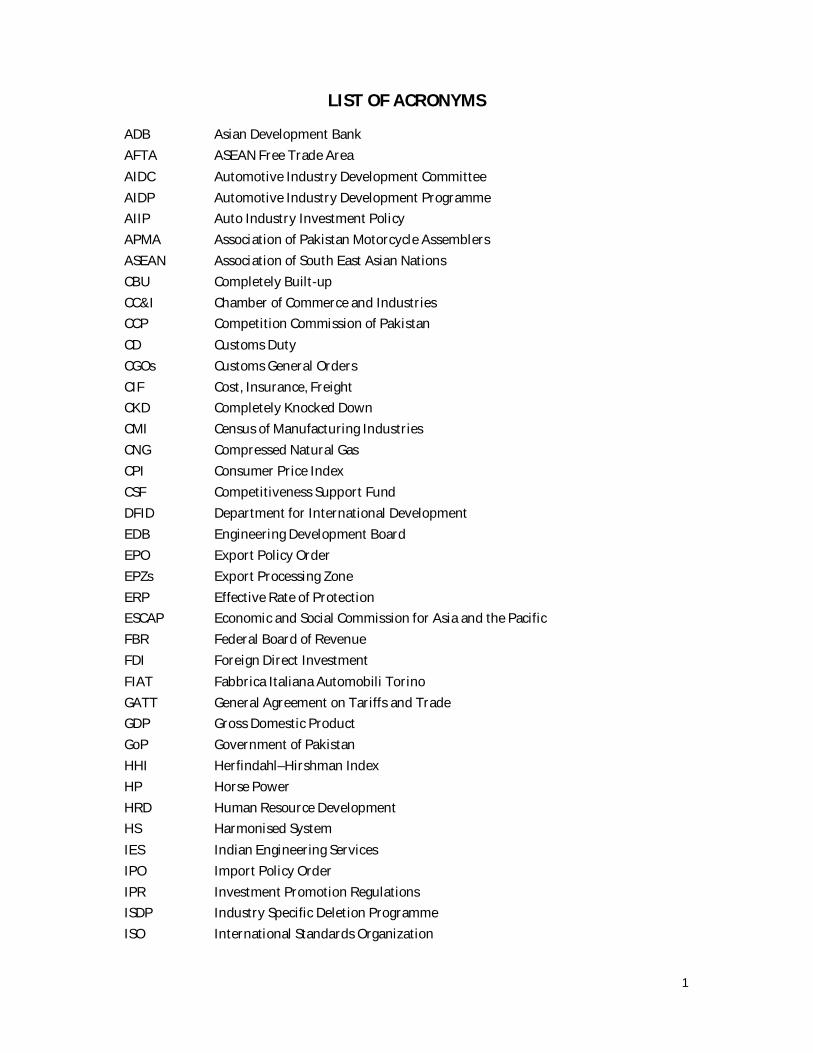
LIST OF ACRONYMS
ADB Asian Development Bank AFTA ASEAN Free Trade Area AIDC Automotive Industry Development Committee AIDP Automotive Industry Development Programme AIIP Auto Industry Investment Policy APMA Association of Pakistan Motorcycle Assemblers ASEAN Association of South East Asian Nations CBU Completely Built-up CC&I Chamber of Commerce and Industries CCP Competition Commission of Pakistan CD Customs Duty CGOs Customs General Orders CIF Cost, Insurance, Freight CKD Completely Knocked Down CMI Census of Manufacturing Industries CNG Compressed Natural Gas CPI Consumer Price Index CSF Competitiveness Support Fund DFID Department for International Development EDB Engineering Development Board EPO Export Policy Order EPZs Export Processing Zone ERP Effective Rate of Protection ESCAP Economic and Social Commission for Asia and the Pacific FBR Federal Board of Revenue FDI Foreign Direct Investment FIAT Fabbrica Italiana Automobili Torino GATT General Agreement on Tariffs and Trade GDP Gross Domestic Product GoP Government of Pakistan HHI Herfindahl–Hirshman Index HP Horse Power HRD Human Resource Development HS Harmonised System IES Indian Engineering Services IPO Import Policy Order IPR Investment Promotion Regulations ISDP Industry Specific Deletion Programme ISO International Standards Organization

2
ITC Index of Trade Complementarity ITP International Trade Price JVs Joint Ventures LCVs Light Commercial Vehicles LUMS Lahore University of Management Sciences M/C Motor Cycle MFN Most Favoured Nation MNC Multinational Company MOC Ministry of Commerce MoIP Ministry of Industries and Production NEQS National Environmental Quality Standards OECD Organisation for Economic Co-operation and Development OEMs Original Equipment Manufacturer OICA Organisation Internationale des Constructeurs d'Automobiles (International
Organization of Motor Vehicle Manufacturers) OLS Ordinary Least Squares PAAPAM Pakistan Association of Automotive Parts & Accessories Manufacturers PACCS Pakistan Automated Customs Clearance Systems PACO Pakistan Automobile Corporation PAII Productive Asset Investment Incentive PAMA Pakistan Automotive Manufacturers Association PCT Pakistan Customs Tariff PEC Pakistan Engineering Council PES Pakistan Economic Survey PIM Pakistan Institute of Management POL Pakistan Oilfields Limited PSQCA Pakistan Standard Quality Control Authority R&D Research and Development SAFTA South Asian Free Trade Area SBP State Bank of Pakistan SKD Semi-Knocked Down Units SMEDA Small and Medium Enterprise Development Authority SMEs Small and Medium Scale Enterprises SPEL Synthetic Products Enterprises Limited SROs Statutory Rules and Orders ST Sales Tax TASS Technology Acquisition Support Scheme TBS Tariff Based System TDAP Trade Development Authority of Pakistan TEVTA Technical Education & Vocational Training Authority TIR Transports Internationaux Routiers (International Road Transport)

3
TOR Terms of Reference TRIMs Trade Related Investment Measures TTC Telecommunications Technology Committee UAE United Arab Emirates UK United Kingdom USA United States of America USAID United States Agency for International Development VDTC Vendor Development & Technical Cell WDI World Development Indicators WTO World Trade Organisation

4
EXECUTIVE SUMMARY
1. COMPOSITION AND SIZE
The automobile sector in Pakistan has grown from its birth since the mid-50s has now
become a multi-billion rupee industry, with over 2,000 OEMs and vendor units (formal and
informal), manufacturing/assembling a range of products from the simplest of parts to the
precision engineered steering knuckles. The industry employs over 300,000 to 500,000 persons
(depending on source). Studies undertaken in the recent past have found that the sector is still
moderate in size and has not yet acted fully as a catalyst for promoting broad based
manufacturing sector growth. The underlying causes for this state of affairs straddle the
spectrum of the enabling framework (institutional, managerial, human resources, financial and
government policy) needed to achieve greater efficiency, competition, competitiveness and
productivity. The industry uses somewhat obsolete or out-dated technology, is mired in
reverse-engineering and the level of locally produced inputs ranges from a low of 5 percent in
the case of some makes of cars to 100 percent in the production of tractors, motor-cycles and
three-wheelers. Proliferation in the number of vendors may be attributed to the deletion
programme and the increase in demand by the manufacturers/assemblers and an expansion in
the basket of products produced. Foreign competition is discouraged by policy and allows for
small, inefficient yet profitable domestic automobile producers. Some OEMs behave
monopolistically in the domestic market and prices are higher than warranted.
2. QUALITY
Quality is low, but efforts at improvement are visible. A small, but significant number, of
vendors are ISO certified. Standards need to be developed by the PSQCA, skills need
improvement and collaboration with international opportunities for skill/quality development
need to be tapped into. While quality standards have been developed for a large number of
engineering products, there are no known standards for the automotive sector. These need to
be developed to ensure an acceptable level of quality, at the least comparable to Euro 2 in the
medium-term. A mechanism available to ensure process control is through the International
Standards Organisation’s certified Quality Assurance surveyors. Once again this is not seen yet
in the automotive sector.
3. STANDARDS
Safety standards are laid out in the Motor Vehicles’ Rules which unfortunately are not
standardised across the country. The first step should be to establish the standards and have
these approved by sub-national governments. No vehicle is examined in Pakistan as there is no

5
facility available which can test these. Further, there is no trained examiner available with the
Offices of the Motor Vehicles Examiner. It is suggested that help should be sought from such
agencies as the Transports Internationaux Routiers or International Road Transport (TIR) or
the Transport and Road Research Laboratories to help establish these facilities and operate
these for a few years. In the interim the human resource skills need to be established and a
transparent system for examinations developed and implemented.
4. COMPETITION
The Herfindahl–Hirshman Index, HHI, is a measure of competition in any particular
segment of a market or any particular product. The lower the value of the index, the greater is
the competition. For most market regulators, including the CCP, the threshold is considered to
be an index value of 1800. The only competition visible in the sector is for the motorcycle
manufactures where the HHI is substantially below the threshold. Toyota car sales account for
67 percent of the market in the large car category – population of three makes only. This
segment has a HHI value of 4728, well above the threshold level of 1800. In the 1000cc category
of cars, Suzuki dominates the market, leading to a HHI of as high as 9090. In the 800cc category,
there are two car manufacturers and the HHI is also high at 6924.Further, market shares of
individual manufacturers have not changed substantially over time. Also, there has been very
limited entry into the car market. Nissan and Kia did enter in the 1300cc – 1600cc group earlier
but have since ceased production.
There is evidence of lack of innovation in terms of changes in models, quick availability,
fuel efficiency, increase in user efficiency and cost cutting. A key indicator of the lack of
competition is late deliveries, high premium payments even in the presence of substantial
excess capacity, prices proximate to each other, advance deposits and under the table deals for
accelerating deliveries. The high prices of cars is demonstrated by the high ratio of prices to
average household income, which places Pakistan in the lowest decile of countries in terms of
affordability of cars. Some competition was “introduced” through easing the entry of new
investors by the removal of the requirement for obtaining manufacturing licenses, imports at
concessionary duty rates and accelerated depreciation. However, this has been negated by the
definition of “new entrant”. Further, import of used and reconditioned vehicles has been
liberalized, but only under gift, personal baggage schemes and transfer of residence (which is
grossly abused), but this policy has been revised year-to-year, especially with regard to
provisions for depreciation.

6
As a consequence cartelisation in parts of the automotive sector is indicated. The CCP
may wish to investigate the sector, particularly the cars segment in the greater public interest.
5. PROTECTION
Effective protection is high and imports are governed by non-tariff barriers in addition
to high rates of duty. The conclusions emerging from the ERP estimates based on two
assumptions (one, tariffs are effective in determining domestic prices, and two, domestic prices
are 90% of world price + tariffs)are:
(i) If domestic prices fully reflect tariffs, then the ERPs are generally high. They range from
98 percent for small cars (800cc) to as high as 374 percent for large cars (above
1500cc). This is a reflection of the very high customs duty of 75 percent on large cars.
The ERPs come down sharply to between 35 percent and 113 percent for cars with the
second set of assumptions.
(ii) The ERP on parts ranges from 32 percent to 78 percent depending upon the particular
set of assumptions.
(iii) The ERP on motorcycles is extremely high at 196 percent under the first set of
assumptions and falls to 76 percent if in the presence of intensive competition in this
market the domestic price remains somewhat below the world price plus tariff.
(iv) In the case of trucks there appears to be a large differential between the ERPs for small
and large vehicles respectively.
6. TARIFF PROPOSALS
The Government does envisage the reduction of tariffs in the automotive sector in a five
year time frame, as per an earlier ECC decision. But this process does not seem to go far enough
with only minor reduction in tariffs in the terminal year from the present level and large inter-
vehicle differentials will persist according to this scheme of up to 70 percent. To reduce this
spread the following recommendations are made for implementation in a medium-term setting:
(i) The maximum tariff on vehicles should be brought down to 35 percent in a five year
time frame.
(ii) The dispersion of tariffs among CBUs of vehicles should not exceed 15 percent in the
terminal year with lower rates of 20-25 percent on trucks and buses and 35 percent
on cars and motorcycles.
(iii) The same tariff rates should apply on cars of different sizes. However, in order to
discourage luxury consumption, excise duty may be applied both on CBU imports

7
and domestic production. The rate of excise duty may be levied at 20 percent on cars
with capacity of 1300-1500cc, rising to 60 percent for cars above 2000cc.
(iv) The distinction between localised parts and non-localised parts needs to be removed
in the tariff schedules, as is the case in most countries. In addition, SRO
656(1)/2006, meant for concessionary imports, must be withdrawn. These
provisions have conferred considerable discretionary power to EDB and the
Customs Department and led essentially to a reversion back to the licensing regime
with scope for rent seeking. By 2016-17, the duty should be brought down to 20
percent.
However, given apprehensions about the potential wide ranging competition from Indian
exports in the automotive sector, we suggest that for the year, 2012-13, the present tariff rates
largely be left unchanged. A subsequent review may be conducted after an assessment is made
of the actual impact on the industry following the granting of MFN status to India and the
resulting expansion of trade.
7. FOREIGN TRADE
The major automotive imports consist of CBU/CKD cars, trucks and tractors. Parts and
accessories and motorcycles also account for a significant share of imports. As opposed to this,
the base of exports is small and narrow. Japan is traditionally the largest supplier of the range
of auto-parts products. Emerging sources are Turkey in tractors, Singapore and Thailand for
cars and parts, South Korea in trucks and China in the case of motorcycles. Pakistan has
established a small market ‘niche’ for motorcycles in two SAARC countries, Afghanistan and
Bangladesh; tractors in African countries like Nigeria and Kenya; and for auto-parts in USA and
Italy.
The imports are controlled by the Import Policy Order 2009 which requires that the
EDB certify the level of imports by any manufacturer. This certification allows the importer-
manufacturer to avail the preferential rates of customs duty. In effect this is a method of
licensing which is against the very essence of the Tariff Based Scheme. In the presence of
existing documentation of the authorised level of installed production capacity, there is no
justification for such certification. Therefore, this requirement for certification, either directly
or indirectly, by the EDB should be removed to encourage greater capacity utilisation, thereby
lowering prices and increasing competition.
Pakistan’s share in world export trade of automobile products is miniscule. The cited
factors constraining the growth of export were the inability to enter the export market, lack of
awareness of export possibilities, lack of motivation to export owing to un-competitiveness as a

8
consequence of low levels of production and high level of profits from the domestic market.
CEOs identified other factors also. The major ones were: firstly, the absence of assistance by the
Commercial Counsellor’s attached to Pakistan’s diplomatic missions abroad and the Export
Development Fund in identifying opportunities, and lack of skills in performing the task
assigned to them; secondly, the lost opportunity in accessing technical assistance available from
international sources for improving the quality of output and transiting from reverse-
engineering processes to more sophisticated processes; thirdly, high cost of production as a
consequence of low productivity and low rates of capacity utilisation exacerbated by the rapid
decline in the Rupee’s exchange convertibility rates was also identified as a major inhibiting
factor; and fourthly, perhaps the most irritating factor, the delays in refund of domestic and
import input taxes paid on exported goods, which impacts on working capital and thus on
output through the inability to finance inventory replenishment.
8. TRADE WITH INDIA
The trade complementary between Pakistan imports and Indian exports in the
automotive sector is high at 0.836 (maximum of 1). Potential imports of Pakistan from India
include tractors, buses, cars, trucks, vans and autoparts. Therefore, all major imports of Pakistan
could potentially be obtained from India. The trade index in the reverse direction is low,
implying that Pakistan would face an uphill task in exporting to India. Also, landed prices of
most Indian automobile products are close to domestic prices and, therefore, could compete
favourably with Pakistani products. What might happen after MFN status to India depends on
how the monopolistic behaviour of the Pakistani business organisations responds to this – will
prices be reduced? 77 percent of the vendor survey units had a negative perception of trade
with India, namely, that low cost Indian manufacturers enjoying economies of scale could enter
the Pakistani market. Some vendors responded positively citing two factors: one, the possibility
of joint franchise production; and two, the opening up of a large export market in India.
Because of the uncertainty in the impact on the domestic market after India gains the
MFN status at the end of the year, the process of tariff rationalisation recommended above may
be withheld for one year and re-examined thereafter. However, to ensure that the domestic
manufacturers/assemblers start gearing up to achieve global competitiveness the government
should provide all support necessary to acquire technology and skills to improve quality,
promote competition and increase the utilisation of capacity. The bottom-line is that the
automotive sector is a potential growth sector, which needs to be developed through an
appropriate policy and enabling framework.

9
CHAPTER 1 INTRODUCTION
Around the world and throughout history the well-being of people has been driven by
breakthroughs in technology which range from the simple slingshot which helped David win
freedom for his people to today’s space ships which provide the engine for growth to a number
of Industries. While the engineering sector is the bedrock of growth of economies, it is generally
accepted that the automotive sector is at the forefront of growth. In fact, the ADB [2008] found
that the sector is one of the major private sector industries in Pakistan, while Felipe (2007)
considered it to be amongst the most protected sectors. The industry was earlier subject to
physical indigenisation targets, but following the Uruguay Round it has made a transition to
Trade Related Investment Measures (TRIMS).
We describe below in Section 1.1 the terms of reference for Phase I of this study on the
automotive sector. Section 1.2 presents the history of development of the automotive sector in
Pakistan. This is followed in Section 1.3 by a review of earlier studies on the sector in the
country.
1.1. TERMS OF REFERENCE
The study is divided into three phases. The first phase of the Study will provide an
overview of the automotive sector of Pakistan. It will examine the following critical key
elements of the industry:
What are the trends in the size and profile of the automotive sector?
What is the contribution of the industry to tax revenues, employment and GDP?
To what extent is the domestic market competitive?
What is the extent of protection provided through the tariff policy, import and
export policies in the sector and other regulatory mechanisms and policies?
How effective is the Automotive Industry Development Programme (AIDP) in
achieving the goals set therein, with particular reference to the deletion
programme?
Based on an analysis and current status of the industry, a set of
recommendations on future policy framework for the industry would be
formulated. This would be refined subsequent to the results of the analysis of the
survey in Phase II and III.

10
Phase II is expected to present the findings from a small sample of production units in
the industry, especially manufacturers of autoparts. The terms of reference of this part of the
study is described in Chapter 6. Phase III undertakes an assessment of the prospects for regional
trade in automotive products, especially between India and Pakistan. The TOR for this phase is
given in Chapter 8.
1.2. HISTORY OF THE SECTOR
The first car ran on the roads of South Asia in 1897, and until the 1930s, cars were
imported directly, but in very small numbers. They were used largely by the rich or the senior-
most civil servants belonging to the elitist Indian Civil Service. This changed just after the start
of the Second World War. In 1945 the brothers Mahindra began assembling the Jeep CJ-3A
utility vehicles under license from Willys and soon branched out into the manufacture of light
commercial vehicles (LCVs) and agricultural tractors. In Pakistan the history can be divided
into several periods. The periods are 1947 until the assembly of trucks (the Bedford “Rocket”)
started. The next growth phase is from 1972 until the private sector was introduced. The third
phase saw the introduction of tractor manufacturing and when motor cycles began to be
assembled. The fourth is when the private sector automobile assembly plants were established
and the vendor industry began to make its presence felt. The latest phase is when exports have
begun. A detailed chronological listing of the history of the industry is given in Appendix I.
Phase 1: 1947 to 1972
In the post independence years the first automobile plant was set up in May 1949 by the
General Motors & Sales Co. This plant started on an experimental basis and grew rapidly into an
assembly plant for the Bedford trucks and Vauxhall cars. After witnessing this rapid growth the
other three leading automobile firms in the United States collaborated with Pakistani
entrepreneurs and set up Ali Automobiles to assemble Ford products in 1955; Haroon
Industries to assemble Chrysler’s Dodge cars in 1956; and Kandawalla Industries to assemble
American Motor products in 1962.
In addition to this, in 1963 Hyesons established the Mack Trucks plant. All these plants
were restricted to semi-knocked down units (SKD) and only had assembly operations. Then in
1963, General Motors plant was sold to Ghandhara Industries Limited and in 1966 it was
granted permission to undertake the progressive manufacture of Bedford trucks and buses.
The absence of organised components' manufacturing facilities, the lack of technological
know-how and the absence of proper ancillary facilities for the design and development of tools,
jigs and fixtures slowed down the process of localisation. Besides that there was not much effort

11
made to improve the technology and develop skills. Also the management of most of the above
mentioned industries lacked professionalism.
Phase 2: The Post Nationalisation Period from 1972
Automobile units were among these nationalised through the Economic Reform Order of
1972. The units were renamed and their functions were redefined. A Board of Industrial
Management was constituted to formulate national policy for industrialisation and also to
oversee and coordinate the functions of the newly-nationalised units.
This was a huge task and to deal with it various corporations were established to look
after each major industrial sector, such as, automobiles, cement, fertilisers and engineering. But
the steps taken to formulate this policy lacked the required commitment as the corporations
appeared to show that the public sector could only run industries if they earned high profits.
Phase 3: Manufacturing of Tractors and the entry of the Private Sector
It was realised in the 80s that it was absolutely necessary for the integration of the
public and private sectors to achieve the national objective of development. A healthy
competition was required so neither the consumers nor the national economy would suffer.
This resulted in the reorganisation of several existing units alongwith the addition of new
undertakings in the public and private sectors. Awami Autos was renamed the Pak-Suzuki
Motor Company Ltd, to commence the progressive manufacture of Suzuki vehicles, including
800cc passenger cars. The manufacturing of Fiat was assigned to the new joint venture of the
company, the Al-Ghazi Tractors Ltd, under the management of the Habib Group Republic motors
Co. It became a joint venture under private sector management. Another plant by the name
Ghandhara-Nissan was sanctioned to undertake the progressive manufacture of trucks. Three
new plants were set up in the private sector with two more units established, side by side under
PACO to manufacture automotive castings and wheels. The two wheeler industry went through
the same pattern of development.
Phase 4: Establishment of the private sector automobile assembly plants and the
vendor industry
The need for another car manufacturer was felt in the mid-eighties. But sanction wasn’t
granted till 1989 because the Government was unable to take a firm decision. The sanction was
granted to the House of Habib and Toyota Motor Corporation of Japan to set up a progressively
modern plant to manufacture the best sellers of Toyota like the Corolla passenger cars and
other such popular vehicles.

12
During this phase the vendor Industry established its very first assembly plant. The first
autoparts manufacturing unit was established in Lahore on 1942 for the purpose of providing
after sales service. From 1950 to 1970, the initial focus of the industry was limited to tractors,
buses and auto parts as well as to provide to the needs of the after sales market of different
automobiles. However, in the 80s, the industry went through a major advancement when for the
first time Suzuki commenced production in Pakistan. Other assemblers of cars and motorcycles,
following Suzuki’s example, also established licenced vendors. This gave a boost to the local
industry to enter the auto parts manufacturing.
Phase 5: 2000 to 2011
The first decade of the new millennium saw the automobile industry in Pakistan
growing rapidly and making a sizeable contribution to the country’s manufacturing sector,
though it has a long way to go before it can establish itself in the international market. However,
in 2008-09 it experienced a major downturn, with sales dropping by 47 percent. This sudden
fall in demand can be attributed to the on-going economic recession, which saw high interest
rates along with a sharp depreciation of the exchange rate. All this led to an increase in the
prices of cars and the cost of components. During 2009-10, the recovery in sales helped to
increase the production from 99,307 units in 2008-09 to 141,654 units. Yet the growth was far
below the highest level achieved by the industry in 2006-071 of 204,212 units. Despite this, the
overall growth in the automobile industry is impressive and potential for further growth is
considerable.
1.3. REVIEW OF LITERATURE
The Asian Development Bank (2008) while conducting an assessment of the private
sector’s role and performance in manufacturing, infrastructure development and the services
sectors observed that the automobile sector is, mostly private sector owned, is moderately sized
with 18 automobile assembling units set up as joint ventures. There are also 47 units producing
motorcycles. Its contribution to GDP and employment is also moderate compared to other
Asian economies who have exploited the catalytic role of the automobile industry in promoting
broad based manufacturing sector growth. This is due to a variety of causes: one, it continues to
remain protected with high import duties and can thus be seen to be a rent seeker; two, it limits
entry; three it is uncompetitive; four, the deletion programme provides non-tariff based
protection to both domestic assemblers and producers of parts and components. As a
consequence, ADB concludes that “these policies discourage domestic and foreign competition
and allow for small, inefficient yet profitable domestic automobile producers”. The Bank further 1 See Nagao, Hirofumi (2007)

13
suggests that without structural change and the development of core competence and
efficiencies to develop the value chain end-to-end, it might not be possible for an efficient
Pakistani automobile sector to emerge at this stage. The Bank also proposes that a Technical
Assistance effort should be mounted to help bring about the transformation needed for ensuring
the exploitation of the potential catalytic role of the industry.
The Niazi and Bhatty (2011) study is based on a survey of a selected sample of
assemblers and up-stream vendors. The study finds that the assemblers and parts vendors are
unable to achieve capacity production for various reasons: one, institutional, technical and
financial inability to adapt to frequent changes in body design; two, inconsistent and adverse
government policies which disincentivise investment; three, non-competitiveness and the small
volume of sales; four, power outages; five, insecurity of law and order; six, high rates of inflation
and the decline in the dollar/yen parity with the Rupee. The study also finds that vendors can
improve performance if the principals arranged the following: one, financing for diversification
and growth; two, provided technical support; three, undertook rigorous quality control
procedures; and, four, training was provided in computer aided design and development of new
parts.
Mirza and Manarvi (2011) examine the technological aspects of the auto industry in
Pakistan. They state that the challenges faced by the industry include, rapid changes in models,
improvement in fuel efficiency, cutting costs and enhancing user comfort without compromising
quality. In the developing world these are compounded by a dearth of necessary skills at all
levels and the formal/informal structure of the productive infrastructure limits the absorptive
capacity to change. The objective of this research was to review the progress attained by
Pakistani automobile car assemblers and vendors, during last thirty years through mutual
collaboration and technology acquisition from global automobile manufacturers. The paper also
focuses on the deletion of spare parts of various locally assembled automobile cars by analysing
those vendors who are generating maximum revenues through production of these spare parts
under foreign technical assistance, cost effectiveness of these parts compared to imported parts
and the manufacture of complex parts locally to determine the level of diffusion of technology in
the economy.
They recommend that the industry needs to develop a strategy for increasing both
productivity and quality. This should not be limited only to HRD, but should emphasize on
technology infusion and diffusion. This should result in greater competitiveness through quality
enhancement and user friendliness of vehicles. This should be linked to a vigorous
development of the vendor market to benefit from economies of scale in output and intra-

14
vendor competitiveness. As a consequence vendor product diversification would occur and the
technical skills of the engineering industry would improve generally.
They conclude that while joint ventures (JVs) have inducted basic technology, these have
not resulted in self-reliance and adoption of state-of-the-art technologies and that the auto-
industry is technologically non-competitive with a low threshold of technology diffusion.
The CSF study [2007] examines the protection provided to the motor-cycle industry in
Pakistan and provides an insight into the reasons behind the rapid growth in the past 5 years
and the problems being faced across the value-chain.
The study found that in 2007 there were 43 OEMs of which only 6 were members of
PAMA. Installed capacity was the throughput ability of 1.3 million motorcycles of which nearly
72 per cent was for the low-end of the market (70 cc). The backward linkage chain includes
2,000 parts and component manufacturing units employing close to 50,000 persons. The
industry has achieved critical mass which has resulted in a decline in average output prices by
30 per cent in the past 5 years. The study finds that in view of the very high levels of
indigenisation, non-OEM manufacturers have cloned the 70 cc Honda and are making inroads
into Honda’s share, but they are also able to compete with the Chinese alternatives. Motorcycle
prices ranged from a low of Rs. 32,000 to Rs. 40,000 (quality dependent) for the non-OEM
domestic production to Rs. 38,000 to Rs. 40,000 for a comparable Chinese make to the high
mark of the Honda CD 70 OEM at Rs. 45,000.
The problems faced by the motorcycle assemblers were found to be as follows: one,
under-invoicing of importable inputs by Non-PAMA OEMs; two, sales tax evasion through non-
declaration; three, using commercially imported inputs but declared as from the local
component manufacturing industry; and four, fake Non-PAMA OEMs to avail of the industry-
specific benefits. Compared to this the non-PAMA OEMs identified problems which included the
following: one, under-valuation of China-origin imports; two, low quality and insufficient
volume of output by the local component manufacturing industry; three, harassment by the
Sales Tax Department; and four, absence of common die, design, tooling facilities.
SMEDA (2005) has undertaken an evaluation of the performance of the Auto Parts
Cluster it had helped establish in Lahore and found that about 750 units had successfully
established manufacturing facilities in the cluster. 100 of these were supplying mostly to the
OEMs under a “franchise” arrangement, 200 were catering to the OEMs and the retail market
and the remainder were supplying exclusively to the replacement market. However, some also
sold parts on the open market as the demand placed by the OEM concerned was below the
break-even point. In addition the study estimates that about another 1,000 SMEs have also

15
established themselves using their own resources and are flourishing and catering to the
demand for replacement parts. The study concludes that the principal reason for success has
been the Auto Deletion Programme – whereby all OEMs were required to attain a certain level
of indigenously produced parts for availing of duty concessions and other benefits.

16
CHAPTER 2 THE AUTOMOTIVE SECTOR
The objective of this chapter is to quantify the size of the automotive sector in terms of
the number of units in different sub-sectors, capacity, production, sales/turnover and
international trade. This is followed by estimation of the contribution of the sector to
investment, value added, employment, revenue and foreign exchange savings. Wherever
possible, international comparisons are made to highlight the stage of development of the
automotive sector in Pakistan.
2.1. COVERAGE
According to the TOR for the study the automotive sector includes the following major
sub-sectors: (a) automobiles/cars, (b) motorcycles/rickshaws, (c) tractors, and (d)
trucks/buses/ trailers. Within each of these there are assemblers and parts manufacturers
respectively. The study does not cover repair shops and retail outlets of automobiles.
The sector has both large-scale and small-scale components. OEMs mostly fall in the
large-scale category whereas a large number of auto parts manufacturers fall in the small-
scale/informal sector. Quantification of the size, in particular, of the latter is rendered difficult
by the absence of data and different approaches have to be used to estimate their contribution.
There are a number of producer associations in the sector as follows:
PAMA: Pakistan Automotive Manufacturers Association
PAAPAM: Pakistan Association of Automotive Parts and Accessories
Manufacturers
APMA: Association of Pakistan Motorcycle Assemblers
These associations provide basic information on their members, which is useful in the
quantification exercise. In addition, the Engineering Development Board (EDB) maintains a data
base on the automotive sector.
2.2. SIZING OF THE SECTOR
Some earlier estimates of the size and contribution of the sector are presented initially.
The first source is the Census of Manufacturing Industries (CMI) of 2005-06 carried out by the
Pakistan Bureau of Statistics. This survey covers only units which fall under the ambit of the
Factories Act and can, therefore, be considered as large-scale units. Therefore, the CMI does not

17
cover units which employ less than ten people. Also, the non-response rate in this census is high
at 45 percent.
Table 2.1 gives the magnitude of indicators of size as revealed by the CMI. In 2005-06
value added by the sector was estimated at Rs 61 billion, equivalent to 6 percent of the value
added in the large-scale manufacturing sector. Almost 82 percent is reported as value added by
OEMs and only 18 percent by auto parts manufacturers. Clearly, the contribution by the latter is
substantially understated because many of the units are relatively small. According to the
Census employment in the sector was estimated at 28269 in 2005-06.
TABLE 2.1: INDICATORS OF SIZE OF THE AUTOMOTIVE SECTOR FROM THE CMI OF 2005-06 (Rs Million)
Industry Code
No. of Reporting
Establishments
Employment
(Nos.)
Value of Production at Producer
Prices
Value Added at
Factor Cost
Value of
Fixed Assets
34102 Passenger cars, jeeps etc 6 6,155 122,066 35,867 17,280 34103 & 34104
Motor vehicles for > or = 10 persons & Motor vehicles for transport of goods 6 2,003 13,387 2,577 2,454
342 Bodies for motor vehicles & trailers 4 413 419 230 57 34301 Parts of engines 10 1,403 2,108 532 752 34302 Other parts for motor vehicles 85 7,861 17,373 5,105 7,233 34303 & 34304
Safety seat belts, airbags etc & Assembly of motor vehicles parts n.e.c 18 1,911 3,484 1,500 478
34305 MR of motor vehicles 10 395 172 92 63 35911 Motorcycles & three wheelers 17 5,730 32,445 9,809 6,155 35919 Other motor-cycle & parts 17 1,132 1,032 316 226 29211 Agricultural tractors 9 1,266 19,160 5,062 472
TOTAL 182 28,269 211,654 61,039 35,170
As % of Manufacturing 2.8 3.1 7.2 6.0 3.1
Source: Census of Manufacturing Industries, 2005-06, Pakistan Bureau of Statistics.
Other estimates of the size and contribution to the economy by the automotive sector
include the claim by PAMA that turnover by its members, mostly OEMs, exceeds Rs 300 billion,
while the foreign exchange savings realized by the sector are $1 billion. SMEDA (2005)
estimates the contribution of the automotive sector of Pakistan as follows:
Total Investment Rs 98 billion
Foreign Exchange Savings US $1.2 billion
Revenues Rs 51.50 billion
Contribution to GDP Rs 153 billion
Employment Created 500,000

18
Therefore, earlier estimates indicate a significant contribution of the automotive sector
to value added, employment, revenues and foreign exchange savings, although the bases for
these estimates have not been indicated. We attempt a verification of these estimates below.
Number of Units
The current number of operative units in the automotive sector is given in Table 2.2.
This information has been obtained from the producer associations. Accordingly, PAMA reports
eight active car manufacturers of
the makes – Suzuki, Toyota and
Honda are the dominant ones.
There are 68 manufacturers of
motorcycles, 65 are members of
APMA and three of PAMA. There
are 6 units producing
trucks/buses, four of which are
members of PAMA.
According to PAAPAM
there are as many as 2200 parts
manufacturers. 450 units are Tier
1 units; 425 units are Tier 2 units
and units in the unorganized sector and after market suppliers are 1325. 292 units currently are
members of PAAPAM.
Capacity
Data on capacity has been obtained from PAMA, APMA and EDB. Estimates of single-
shift capacity in each sub-sector are
presented in Table 2.3. The capacity for
production of cars is over 279,000
annually, while the rate of capacity
utilisation in 2010 was below 44 percent.
Therefore, a significant margin of excess
capacity exists in this sub-sector even on
a single-shift basis and potential
economies of scale do not appear to have
been exploited sufficiently.
TABLE 2.2: NUMBER OF UNITS IN 2011 ACCORDING TO ASSOCIATIONS
Member Non Member Total
Assemblers Cars 8a - 8 Motorcycles/Rickshaws 68b - 68 Tractors 2 4 6 Trucks/Buses 4 2 6
Part Manufacturers 292 1908 2200c
Sources: PAMA (http://www.pama.org.pk/home/members) APMA(http://www.motorcycleexport.com/) Directory of Members, PAAPAM. a All 3 are members of PAMA b 65 are members of AMPA and 3 are members of PAMA c Tier one units, 450; Tier 2 units 425; Unorganized and after market suppliers 1325
TABLE 2.3: REPORTED CAPACITY OF OEMS AND RATES OF UTILISATION
Capacity (Units)
Rate of Utilisation
(%) Assemblers
Cars 279,040 43.6 Motorcycles/Rickshaws 2,165,000 69.1 Tractors 67,000 110.2 Trucks/Buses 10,800 40.3
Sources: PAMA (http://www.pama.org.pk/home/members) APMA (http://www.motorcycleexport.com/) Presentation on Automobile Sector, EDB.

19
The capacity for production of motorcycles/rickshaws exceeds 2.1 million. The
estimated rate of capacity utilisation is moderately high at 69 percent. The tractor sector is the
only sub-sector characterised by a high rate of capacity utilisation at 110 percent, indicating
that there is scope for expansion of capacity in this sector.
The capacity for production of trucks/buses is 10,800, with only 40 percent of the
capacity being used currently. Given the diverse nature of output by auto parts manufacturers it
is not possible to construct a measure of capacity for this sub-sector.
Production
A range of automobile products is potentially available in Pakistan, as shown in Chart
2.1. This includes makes by members of PAMA and APMA and by others. However, some of the
makes are currently not under production.
Chart 2.1 RANGE OF AUTOMOBILE PRODUCTS IN PAKISTAN
Cars/Jeeps LCVs/ Vans Tractors Motorcycles
3-Wheelers Trucks Bus
Honda Suzuki Fiat Honda Master Hino
Suzuki Changan Massey Ferguson Yamaha Isuzu Nissan
Toyota Toyota Universal Suzuki Hino Dong Feng
Nissan Hyundai Hero Qinqqi Nissan Isuzu
Chevrolet Master Ursus Sohrab Daewoo Master
Hyundai Kalash Hero Mitsubishi Fuso Daewoo
Daihatsu Adam EURO Other Chinese Brands
Faw
Range Rover Hino Ravi Power
Habib
Sazgar
Source: Presentation on Automobile Sector, EDB.
Japanese makes dominate the market with shares in cars of 100 percent, motorcycles,
45 percent; trucks, 100 percent; buses, 87 percent; tractors, zero percent; jeeps, zero percent
and pickups, 98 percent.
Major joint ventures in the automotive sector are listed in Chart 2.2. Most of the
collaboration in the car sub-sector is with Japanese multi-national companies. In recent years,
joint venture agreements have been reached with Korean, Chinese and UK companies especially
for the production of LCVs, buses and motorcycles.

20
Cars with different capacity are being produced in Pakistan ranging from 800cc to
1600cc. These include cars with manual or automatic transmission running either on diesel or
petrol. The production of cars jumped more than fourfold from 2000-01 to 2005-06 due to
buoyant conditions in the economy as shown in Table 2.4. Production then plummeted by 29
percent by 2009-10 due to a slowdown in growth of incomes. In 2010-11, there has been a
modest recovery in production of 10 percent. A similar pattern is observed in the case of Jeeps,
Pickups and LCVs.
It is surprising that the biggest share in production is accounted for by large cars with
capacity of 1300 – 1600cc. This is in contrast to India, for example, where the share of small cars
exceeds 50 percent. This is probably a reflection of, first, inequality in household incomes and,
second, higher profitability in large cars due to greater effective protection.
Chart 2.2: MAJOR JOINT VENTURES FOR AUTOMOBILES
COMPANY JOINT VENTURE PRODUCT
Indus Motor Co. Toyota & Daihatsu, Japan Corolla & Cuore Cars
Atlas Honda Ltd. Honda, Japan Honda Cars/ Motorcycle
Pak Suzuki Motor Co. Suzuki, Japan Cars, Van, Jeep, Pickup
Suzuki Motorcycle Suzuki, Japan Suzuki Motorcycle
Ghandhara Nissan Ltd. Nissan, Japan Cars & Truck
Dewan Farooq Motors Kia & Hyundai, Korea Cars & LCVs
Master Motor Corp. Yuejin & Faw, China LCVs, Buses
Mitsubishi, Korea Prime Movers, Trucks, Buses
Sind Engineering Ltd. Dong Feng, China LCVs, Bus
Sigma Motors Ltd. Land Rover, UK Jeeps
Afzal Motors Daewoo, Korea Trucks, Buses
Karakoram Motors Changan, China LCVs
Nexus Motors GM Daewoo, Korea Chevrolet Cars
Source: Presentation on Automobile Sector, EDB.
There has been a phenomenal jump in the production of motorcycles, which has
increased fourteen fold, from 118,000 in 2000-01 to over 1.7 million in 2010-11. This is truly a
success story and is a reflection of the rapid entry of new manufacturers, with relatively low
priced makes, which has increased competition and prevented large price increases by the
established manufacturers.
Production of tractors has held up well in recent years, unlike the case of cars. This has
been the consequence of large increase in rural incomes due primarily to the jump in prices of
wheat and cotton. As opposed to this, production of buses and trucks has declined by 51 percent

21
and 36 percent respectively during the last five years. This reflects the stagnation in the
transport sector.In addition this also reflects the competition provided through the import of
second-hand CBU trucks and buses, and the import of old chassis (declared and assessed as
scrap) of concrete mixers, dump trucks and other construction related ORVs and their
subsequent conversion to rigid 2- and 3-axle rigid trucks. These sell in the market for Rs.
800,000 to Rs. 1.5 million.
Table 2.4: ESTIMATED LEVELS OF PRODUCTION OF DIFFERENT TYPES OF VEHICLES, 2000-01 to 2010-11
Type of Vehicle 2000-01 2005-06 2009-10 2010-11 Cars 41,556 170,487 121,647 133,972
1300-1800cc 17,664 69,283 60,360 62,111 1000cc 14,716 47,459 23,330 25,287 800cc 9,176 53,745 37,957 46,574
Jeeps, Pickups, LCVs 5,441 21,624 16,940 20,025 Motorcycles, Rickshaws
Motorcycles 117,858
817,387 1,481,111 1,710,841 Rickshaws 2,166 14,676 17,259
Tractors 32,533 50,257 73,844 72,303 Buses 1,073 661 526 Trucks 4,593 3,691 2,932 Sources: Statistical Information Section of PAMA (http://www.pama.org.pk/images/stories/pdf/historical-data.pdf) APMA (http://www.motorcycleexport.com/) Pakistan Economic Survey, Ministry of Finance Presentation on Automobile Sector, EDB.
Data on the volume of production of autoparts is not available. However, Box 2.1
describes the technological capacity of the sub-sector and the range of products. While some
examples of technical collaboration are presented in Chart 2.3.
Box 2.1: THE AUTOVENDING INDUSTRY OF PAKISTAN The autovending industry has gradually developed strong capabilities in casting, forging
machining, plastic injection moulding, rubber die casting and rubber extrusion. A medium level of technological sophistication has been attained.
Vendor industry has managed to localize a large number of automotive parts, including sheet metal parts, rubber and plastic parts, aluminium parts such as radiators, wire harnesses, chassis, tyres, tubes, car seats, lights gaskets, engine valve, camshaft, oil pump gears, pistons, radiators, dashboard, interior trims, etc.
The Auto Industry Development Programme (AIDP) envisages local development of high tech./value added components and assemblies This includes alternator, starter motor, water pump, fuel pump, fuel filter, seat reclining, power steering, engines, transmissions for car and LCVs and regulator rectifiers, ignition coils, piston, fuel cock, clutch assembly, sprocket cam, drum gear shift, magneto and oil pump.
The Autoparts industry has significant export potential and opportunity to become part of the global supply chain by
~ exploring ‘niche’ markets and markets for labour-intensive parts ~ entering global spares market of discontinued vehicles ~ entering other third world markets
Already 24 autoparts manufacturers are in the export business. A detailed description of the industry, based on data from a sample, is given in Chapter 6.
Source: Document on ‘Profile of Auto Vendor Industry in Pakistan’ EDB.

22
Chart 2.3: VENDOR INDUSTRY TECHNICAL COLLABORATION Components Vendors in Pakistan Collaborating Partners
Shock absorbers M/s Honda Atlas Ltd M/s Agri Auto Ind
Showa, Japan, Kayaba
Radiators M/s Alwin Engg. M/s Loads Pvt. Ltd
U.E. Radiators, Japan Toyo Radiator Japan
Car A/C M/s Sanpak, M/s Thal Engg Sanden, Japan, Denso
Radio Cassette Player M/s Automate Ind Panasonic Thailand
Lamps M/s Techno Pak Koito, Japan
Spart Plugs M/s Shaigan Electric NGK, Japan
Glass M/s NGS Pak NGS, Japan
Steering Case set M/s Polymer & Precision I.S. Seiseki, Japan
Brake Drum Assembly M/s Alsons Auto Ltd Nissin Kogyo, Japan
Source: Presentation on Automobile Sector, EDB.
An international comparison of production of vehicles per 1000 persons is presented in
Table 2.5. Out of the twelve developing countries listed, Pakistan has the lowest level of
production of cars at 0.7 vehicles per 1000 population, as compared to 2.4 in India, 2.1 in
Indonesia, 1.1 in Egypt, 8.0 in Thailand and 8.3 in Turkey. Therefore, while the automotive
sector has shown impressive growth during the last decade, it is still relatively small and at an
early stage of development in Pakistan.
TABLE 2.5: INTERNATIONAL COMPARISON OF PRODUCTION OF VEHICLES IN RELATION TO POPULATION
(per 1000 people)
Country Name Cars Commercial Vehicles Total
Argentina 12.6 5.1 17.7
Brazil 14.5 4.2 18.7
China 10.4 3.3 13.6
Egypt, Arab Rep. 1.1 0.4 1.5
India 2.4 0.6 3.0
Indonesia 2.1 0.9 2.9
Iran, Islamic Rep. 18.5 3.1 21.6
Malaysia 18.4 1.6 20.0
Mexico 12.3 8.4 20.7
Pakistan 0.7 1.0 1.7
Thailand 8.0 15.8 23.8
Turkey 8.3 6.7 15.0
Source: Production Statistics 2011, OICA (oica.net/category/production-statistics/).

23
Sales
The level of sales is determined both by the quantity sold and prices. The former
corresponds closely to the production levels. Recent trends in car prices are indicated in Table
2.5. A wide variation is observed in the extent of cumulative price increase by make over the last
four years. The largest increase of 82 percent is Cuore of 82 percent followed by Corolla at 63
percent. At the other extreme is Civic with an increase of 22 percent.
TABLE 2.6: RECENT TRENDS IN PRICES OF CARS, 2008 TO 2012 (Thousand Rupees)
Model March-June
2008 (Range)
January 2012
(Range)
Percentage Increase of Mid-
Values Mehran 444 – 352 625 – 510 42.6 Alto 554 – 505 796 – 727 43.8 Cultus 677 – NA 990 – 925 41.4 Liana 900 – 836 1351 – 1,282 51.7 Swift - 1,156 – 1056 - Corolla 1,020 – 930 1,739 – 1,444 63.2 Altis 1,390 – 1,300 1,879 – 1,789 36.4 Cuore 554 – 412 935 – 824 82.1 Civic 1,589 – 1,549 2,048 – 1,778 21.9 City 959 – 899 1,550 – 1,409 59.3
Source: Document on ‘Price Trend’, EDB.
Car manufacturers frequently justify their price increase on the grounds of appreciation
of yen, which makes CKD vehicles and parts more expensive. During the last four years, the
value of the yen with respect to the rupee has increased by as much as 87 percent, while the cost
of domestic inputs is estimated to have risen by 64 percent. Therefore, in real terms car prices
have fallen significantly, reflecting the depressed demand conditions since 2008, and profit
margins have been squeezed.
The sales/turnover of most OEMs, who are members of PAMA, is generally available
from their annual financial statements. Problems arise in the estimation of turnover of units
who are not members of producer associations and/or are in the small-scale/informal sector.
These problems are particularly severe in the case of the auto parts sub-sector. For this sub-
sector, the following methodology has been adopted:
(i) for input of auto parts into manufacture of new vehicles by OEMs, input-output
ratios for domestic and imported parts have been derived from the data on
industrial costs given in the CMI 2005-06.

24
(ii) from data on vehicle user costs provided by Ismail (2011) the consumption of
parts has been estimated for the repairs and maintenance of the existing stock of
vehicles.
(iii) from the total demand of parts estimated from (i) and (ii) combined imports of
parts have been deducted to get an overall estimate of the turnover of domestic
parts.
Accordingly, the estimates for 2009-10 are as follows:
(Rs in Million)
Consumption of Parts for New Vehicles 160,864
plus Replacement Demand for Parts 68,232
less Imports of Parts 61,294
equal Turnover of Domestic Parts Manufacturers* 167,802
* excluding tyres and batteries
Similarly, estimates of turnover of non-PAMA or APMA manufacturers of motorcycles
are not available. The prices of motorcycles of such manufacturers are estimated at 37 percent
less than that charged by Atlas
Honda. Given numbers sold
from APMA data this has
enabled determination of the
sales of motorcycles.
Overall, the estimated
turnover in 2009-10 in
different sub-sectors is given in
Table 2.7. The turnover of
OEMs aggregates to Rs 234
billion, with car sales having a
share of 52 percent, followed
by motorcycles at 25 percent,
tractors at 26 percent and
buses/trucks at 7 percent. Sales
of imported CBUs are not included in these magnitudes. Total sales by assemblers in 2009-10
are equivalent to almost $3 billion. As opposed to this, the turnover by domestic auto parts is
derived as Rs 168 billion, equivalent to $2 billion.
TABLE 2.7: ESTIMATED TURNOVER IN 2009-10 IN DIFFERENT SUB-SECTORS
(Rs. Million) Turnover Cars 120,843 Motor Cycles & Rickshaws 57,848 Buses/Trucks 16,979 Tractors 38,157 Total of Assemblers 233,827
($2.8 billion) Total of Domestic Parts Manufacturer 167,802
($2.0 billion) TOTAL OF THE AUTOMOTIVE SECTOR 401,629
($4.8 billion) Sources: Authors’ Calculation using numbers from; PAMA (http://www.pama.org.pk/home/members), Presentation on Automobile Sector, EDB Directory of Members, PAAPAM Financial Statements Analysis of Companies (Non-Financial) Listed at Karachi Stock Exchange (2005-10), SBP Census of Manufacturing Industries, 2005-06, Pakistan Bureau of Statistics.

25
The TOR requires cross-verification of production and sales of vehicles with data on
vehicles registered and/or road. As an example, this is undertaken for motorcycles in Table 2.8.
Significant differences are revealed. The divergence has tended to increase over the years.
TABLE 2.8: INCREASE IN NUMBER OF MOTOR CYCLES ON ROAD AND ANNUAL SALES (000)
Increase in Number of Motorcycles on Road
(1)
Annual Sales of Motor Vehicles*
(2)
Difference
(2) – (1) 2000-01 410 220 -190 2001-02 484 264 -220 2002-03 423 300 -123 2003-04 492 559 67 2004-05 469 731 262 2005-06 1034 915 -119 2006-07 1052 1049 -3 2007-08 1020 1255 235 2008-09 835 1215 380 2009-10 581 1580 999
Source: Pakistan Economic Survey, Ministry of Finance. * Includes imports of CBUs.
Clearly, there are many leakages in the registration process by the Provincial Excise and
Taxation Departments. A similar conclusion is reached in the case of other vehicles. The
increase in the number of vehicles registered or on road cannot be used as an effective proxy for
sales.
Trade
Substantial imports are made by the automotive sector as highlighted in Table 2.9,
although they demonstrate a somewhat declining trend after 2005-06. Within imports, bulk,
almost 90 percent, are of CKD units and parts. CBU units reached a peak in 2007-08 and have
since fallen by 47 percent. Imports of parts have risen sharply during the last two years.
TABLE 2.9: IMPORTS BY THE AUTOMOTIVE SECTOR, 2005-06 TO 2010-11 ($ Million)
2005-06 2006-07 2007-08 2008-09 2009-10 2010-11 Road Motor Vehicles 925 854 823 554 704 757
CBU 39 139 250 97 93 74 CKD 886 715 573 457 611 683
Parts 87 71 79 66 121 148 Total 1,012 925 902 620 825 905
Source: Import Receipts by Commodity, Economic Data, SBP. The process of import substitution of CBU units appears to have gone further in the case
of cars and motorcycles than in the case of trucks. This is possibly due to difference in the rate of
protection. This issue is examined in Chapter 5.

26
Turning to exports, these are limited in magnitude given the nascent nature of the
industry, although they have shown promising growth in recent years as shown in Table 2.10,
reaching $126 million by 2010-11.
TABLE 2.10: TOTAL EXPORTS BY AUTOMOTIVE SECTOR, 2005-06 TO 2010-11 ($ Million)
2005-06 2006-07 2007-08 2008-09 2009-10 2010-11
Transport Equipment 56.2 51.5 78.4 63.6 78.8 107.6 Auto Parts 12.5 15.2 16.9 14.1 10.3 18.1 TOTAL BY THE AUTOMOTIVE SECTOR 68.7 66.7 95.3 77.6 89.0 125.7 Source: Export Receipts by Commodity, Economic Data, SBP.
2.3. CONTRIBUTION TO THE ECONOMY
We now quantify the contribution of the automotive sector to the national economy.
Investment
Data on investment in the automotive sector is available only for publicly quoted
companies or for units which make their financial statements available on the internet.
Investment during a particular year is measured as the change in fixed assets at cost (prior to
provision for depreciation). We have
been able to collect this information
for units which account for 52
percent of the turnover in the sector.
Therefore, a blow up factor has been
applied of 1.923 to our estimates.
The resulting estimates are
presented in table 2.11. There is
evidence of a business cycle of
investment in the sector. Investment
expanded rapidly from 2003 to
2007, during the period when there
was very rapid growth in sales.
Thereafter, investment has fallen simultaneously with the down turn in the economy.
Cumulatively, the total investment in the sector is about $2.7 billion. The motivation for new
investment has been limited by the presence of excess capacity in most sub-sectors.
TABLE 2.11: ESTIMATED INVESTMENT IN THE AUTOMOTIVESECTOR, 2000-01 TO 2009-10
Fixed Assets (Rs. Million)
Investment (Rs. Million)
Value in $ million
2001 31,614 1474a 2002 29,768 -1,846 -31 2003 35,988 6,220 108 2004 42,798 6,810 117 2005 54,406 11,608 195 2006 71,306 16,900 281 2007 88,758 17,452 289 2008 100,802 12,044 177 2009 96,718 -4,084 -50 2010 107,924 11,206 131
TOTAL 2,690 Source: Financial Statements Analysis of Companies (Non-Financial) Listed at Karachi Stock Exchange (2005-10), SBP. a estimated by backward extrapolation of the investment series.

27
Value Added
The value added by the sector has been estimated on the basis of the share of value
added in value of production of different sub-sectors derived from the CMI of 2005-06. These
shares have been adjusted downwards to allow for the decline in profitability (as percentage of
sales) between 2005-06 and 2009-10.
The resulting estimates of value added by different sub-sectors in 2009-10 are
presented in Table 2.12. Overall, the sectoral value added is Rs 108 billion. The largest sub-
sector is auto parts with a share of 42 percent, followed by cars with share of 31 percent, and
motorcycles with a share of 15 percent.
The estimated value added by the sector appears to about 5 percent of the total value
added in the manufacturing sector of Pakistan. This share places the sector as one of the larger
industries of Pakistan after textiles, petroleum refining, iron and steel products, fertilizers and
cement. In fact, the automotive sector is larger than the sugar, vegetable ghee and
pharmaceutical industries. About 13 percent of the double-digit growth in the large-scale
manufacturing sector between 2002-03 and 2006-07 is attributable to the dynamism of the
automotive sector.
TABLE 2.12: ESTIMATED VALUE ADDED BY THE AUTOMOTIVE SECTOR, 2009-10
Value Added to
Value of Production Ratio*
Value of Sales (Rs in Million)
Value Added (Rs in Million)
Motor Cars (0.277) 120,843 33,474
Motor Cycles & Rickshaws (0.285) 57,848 16,486
Buses/Trucks (0.176) 16,979 2,988
Tractors (0.247) 38,157 9,425
Autoparts (0.272) 167,802 45,642
TOTAL 108,015
($1.3 billion)
Total Value Added in Manufacturing 2,259,400
% Share of Manufacturing 4.8%
% of GDP 0.7%
Sources: Author’s Calculation using numbers from PAMA, EDB, PAAPAM, SBP and CMI (sources are given in detail in Table 2.7). * Adjusted downward by 1.7% points in relation to the CMI 2005-06 data.

28
Employment
Employment data is directly available for members of PAMA and for some members of
PAAPAM. On the basis of labour productivity estimates for these units, sub-sectoral estimates of
employment have been generated. A downward adjustment of 20 percent has been made to
allow for higher labour-intensity in small-scale/informal units, especially in the auto parts sub-
sector.
The resulting estimates for employment by the sector are given in Table 2.13. Bulk of the
employment, 89 percent, is in the
production of auto parts. The
remainder, 11 percent, is in the
assemblers, with motorcycles being
the largest sub-sector. The estimated
employment is very close to the
estimate of 215,000 given in the TOR
provided for the study by IGC. It
appears that the automotive sector
accounts for about 4 percent of the
total employment in the
manufacturing sector.
Revenue
The automotive sector is one of the largest contributors to revenue in Pakistan. A large
part of the revenue accrues at the import stage. As shown in Table 2.14, customs duties and
sales tax on imports by the sector yielded Rs 49 billion in 2009-10. In addition, tax provisions
for corporate income tax made by the auto companies are estimated at close to Rs 9 billion.
There is also a withholding tax which is collected at the point of registration of vehicles, with
revenue of above Rs 4 billion.
The combined revenue collection from the sector of FBR taxes is Rs 62 billion in 2009-
10. This is equivalent to about 5 percent of total FBR revenues. With this contribution, the
automotive sector emerges as the third largest sector after POL products and
telecommunications.
TABLE 2.13: ESTIMATED EMPLOYMENT IN THE AUTOMOTIVE SECTOR, 2009-10
Employment (Nos.)
OEMs 22,254 Motor Cars, etc. 5,440 Motor Cycles 12,220 Buses/Trucks 1,453 Tractors 3,141
Domestic Part Manufacturers 187,070 TOTAL SECTORAL EMPLOYMENT 209,324
Sources: Author’s Calculation using numbers from PAMA, EDB, PAAPAM and CMI (sources are given in detail in Table 2.7).

29
TABLE 2.14: ESTIMATED REVENUE CONTRIBUTION BY THE AUTOMOTIVE SECTOR, 2009-10
(Rs. Million) Custom Duties 25,234 Federal Excise 119 Sales Tax 23,414
Domestic 7,325 Imported 16,089
Total Indirect Taxes 48,767
Direct Tax 12,990
Income 8,775 Withholding Tax 4,215
Total Automobile Sector 61,757 Tax Revenues 1,329,000
Tax Contribution as Percentage of Tax Revenues 4.6 Automotive Sector is the third largest contributor to Federal Tax Revenues in 2009-10.
Source: Annual Report, Federal Board of Revenue. Financial Statements Analysis of Companies (Non-Financial) Listed at Karachi Stock Exchange (2005-10), SBP.
Foreign Exchange Savings
Derivation of foreign exchange savings is based on the comparison of a counter-factual
scenario, in which there is no capacity for assembly of cars and other vehicles and demand is
catered for fully with imported CBU units with the actual outcome when there is a substantial
degree of import substitution.
As such, foreign exchange savings can be computed as follows:
Foreign exchange savings = Value of imports of CBU vehicles2 - value of imports of CKD units
and parts – value of imported inputs into domestic parts – investment
– remittance of profits + exports of vehicles and parts .......... (1)
The above magnitudes have been estimated for 2009-10. Determination of the c.i.f.
prices of vehicles is based on, first the assumption that the level of import tariffs are effective in
determining the domestic price. Therefore, in this case the domestic price is equivalent to the cif
price + customs duty + general sales tax. The validity of this assumption is discussed in Chapter
5. In the high case, the domestic price is assumed to be lower and the cif component is
correspondingly larger.
Table 2.15 presents the magnitudes in equation (1). In the counter-factual scenario
imports would have aggregated to between $1.7 billion and $1.9 billion. As opposed to this,
2 At the actual level of sales, estimated at world prices in $.

30
actual imports, investment and repatriation of profits in 2009-10 are estimated at $1.2 billion.
Inclusive of exports, the foreign exchange savings by the sector are estimated at between $607
million and $859 million. Therefore, the sector contributes significantly to foreign exchange
savings.
TABLE 2.15: ESTIMATED FOREIGN EXCHANGE SAVINGS DUE TO THE AUTOMOTIVE SECTOR, 2009-10
($ Million)
Low* High** A. If Imports of CBU and no domestic production 1,677 1,929
c.i.f. value of imports: cars 770 886 buses trucks
142 162
motorcycles 310 357 tractors 455 523
B. With Import Substitution 1,196 Imported CKD Units and Parts 732 s Imported inputs for domestic parts 320 a Investment 131 m Remittance of Profits 13 e
C. Exports of Vehicles and Parts 126
Foreign Exchange Saving (A – B + C) 607 859 Sources: Author’s Calculation using numbers from PAMA, EDB, PAAPAM and CMI (sources are given in detail in Table 2.7). * with cif prices equal to domestic price – the statutory customs duty – sales tax ** 15% higher than in the low case.
An overall summary of the key magnitudes of the sector as derived above is presented in
Table 2.16. The automotive sector has begun to acquire a prominent role in the industrial
structure of Pakistan. It accounts for almost 5 percent of the value added in the manufacturing
sector, which implies that it is already larger than industries like sugar, pharmaceuticals and
vegetable ghee. It has also made a major contribution to the double-digit growth of the
manufacturing sector in the peak of the Musharraf era.
However, our estimates of the size and contribution of the automotive sector are
somewhat more modest than earlier estimates. SMEDA (2005), for example, estimates
employment in the sector at 500,000 while our estimate is closer to 209,000. Similarly, the
value added by the sector is reported at Rs 153 billion whereas our estimate is Rs 108 billion.
Further, there is need to recognise that while the automotive sector is beginning to
make a significant contribution to the economy of Pakistan, it is still relatively small by

31
international standards. Table 2.17 makes a comparison of the contribution of the automotive
sector in eleven developing countries. Pakistan ranks relatively low in the indicators. However,
in the indicator, sector turnover as percentage of the GDP, Pakistan ranks higher than four
countries, including India and Indonesia.
TABLE 2.16: SUMMARY OF THE KEY INDICATORS OF THE SIZE AND CONTRIBUTION TO THE ECONOMY BY THE AUTOMOTIVE SECTOR
Turnover
Assemblers Rs. 234 billion
Domestic Parts Rs. 168 billion
Total Rs. 402 billion
Production
Cars 121,647
Jeeps, etc. 16,940
Motorcycle 1,481,111
Rickshaws 14,676
Tractors 73,844
Buses 661
Trucks 3,691
Employment
Assemblers 22,254
Domestic Parts 187,070
Manf.
Total 209,324
Value Added
Rs. 108 billion
4.8% of Manufacturing
0.7% of GDP
Trade
Exports $89 million
Imports $835 million
Value of Cumulative Investment $2.8 – $3.0 billion
Foreign Exchange Saving $704 million
Contribution to Revenue Rs. 61,757 million
Source: Derived from earlier Tables.

32
TABLE 2.17: INTERNATIONAL COMPARISON OF THE CONTRIBUTION TO THE ECONOMY BY THE AUTOMOTIVE SECTOR*, 2010
Country As % of GDP Employment as % of
Industrial Employment Turnover Investment Revenue Argentina 1.2 - 0.3 0.3 Brazil 1.6 0.1 - 1.4 China 1.9 0.1 - 0.8 Egypt, Arab Rep. 1.7 1.0 1.1 1.4 India 1.2 0.1 0.8 0.3 Indonesia 0.7 0.2 - 0.3 Malaysia 3.3 0.7 - 1.5 Mexico 0.4 - - 1.2 Thailand 4.7 0.2 1.1 2.4 Turkey 4.9 0.1 1.8 4.3 Pakistan 1.6 0.1 0.4 0.2 Source: Production Statistics 2011, OICA (oica.net/category/production-statistics/) World Development Indicators, World Bank. * excluding autoparts
2.4. DEMAND ANALYSIS
The automotive sector is prone to business cycles with a fairly large amplitude. In the
80s the sector showed high growth starting from a low base, but showed only modest growth in
the 90s. Between 2002-03 and 2007-08 it experienced explosive growth. Thereafter, the sales of
cars, in particular, have shown a sharp decline. What factors explain the variation in the growth
rate of the sector as measured by the volume of sales of different types of vehicles?
Results of OLS estimation of the demand equations for three types of vehicles, viz., cars
motorcycles and tractors, are presented in Table 2.18. The results indicate the following:
(i) The short-term income elasticities are generally high, ranging from 2.75 to almost 4.
This implies that fluctuations in the growth of real per capita income in the economy
have a magnified effect on demand for vehicles.
(ii) The elasticities with respect to relative price of vehicles are low. This could explain
the aggressive pricing policy, especially in the case of cars.
(iii) The elasticities with respect to interest rate are significant and moderately high. The
explosive growth of sales in the middle of the last decade can be partly attributed to
the steep fall in interest rates on advances from over 14 percent to just over 7
percent and the increased availability of consumer financing by banks.
The issue is what the implications are of the propensity of the automotive sector to
sharp fluctuations in the growth of sales. This may justify, for example, the presence of

33
significant excess capacity to take advantage of a sharp upturn or the need for maintaining
liquidity in the form of reserves to take care of downturns.
TABLE 2.18: SHORT-RUN ELASTICITIES OF DIFFERENT TYPES OF VEHICLES (DEPENDENT VARIABLE IS THE DEMAND OF THE VEHICLE TYPE)
Variablea Cars Motorcycles Tractors Per Capita Income 2.750* 3.423** 3.929* Price of Vehicle relative to Consumer Price Indexb -0.218*** -0.274** -0.315*
Rate of Interest -0.679* -0.624* -0.518*
a All variables are measured in natural logs. b Import price is measured by the Unit value Index of Machinery and Transport Equipment Group and domestic price is measured by CPI of Transport and Communication Group. *, **, *** denote that the coefficients are significant at the 1, 5 and 10 percent level of significance.

34
CHAPTER 3 POLICY AND REGULATORY FRAMEWORK
The automobile industry is governed by a set of regulations based on both domestic
legislation and on international treaties/conventions to which Pakistan is a treaty partner or
has agreed to adhere to the conventions. The international commitments supersede the local
legislation wherever there is a conflict. They include the General Agreement on Tariffs and
Trade (GATT) and the Trade-Related Investment Measures (TRIMs). GATT was signed in 1947
and lasted until 1993, when it was replaced by the World Trade Organisation (WTO) in 1995.
The original GATT text (GATT 1947) is still in effect under the WTO framework, subject to the
modifications of GATT 1994. GATT’s purpose was to promote a substantial reduction of tariffs
and other trade barriers and the elimination of preferences, on a reciprocal and mutually
advantageous basis.
3.1. TRIMS
TRIMs came into force in 1995, as part of the Uruguay Round negotiations with the same
objectives, in effect carrying on where GATT left. The TRIMs Agreement did not define
prohibited TRIMs, but its illustrative list included the following 8 components (see Box 3.1):
BOX 3.1: TRIMS CONTENT Local Content Requirements (LCRs): Impose the use of a certain amount of local inputs in production. Trade-Balancing Requirements: Oblige imports to be equivalent to a certain proportion of exports. Foreign Exchange Balancing Requirements: Stipulate that the foreign exchange made available for imports should be a certain proportion of the value of foreign exchange brought in by the firm from exports and other sources. Exchange Restrictions: Restrict access to foreign exchange and hence restrict imports. Domestic Sales Requirements: Require a company to sell a certain proportion of its output locally, which amounts to a restriction on exportation. Manufacturing Requirements: Require certain products to be manufactured locally. Export Performance Requirements (EPRs): Stipulate that a certain proportion of production should be exported. Product Mandating Requirements: Oblige an investor to supply certain markets with a designated product or products manufactured from a specified facility or operation. Manufacturing Limitations: Prevent companies from manufacturing certain products or product lines in the host country. Technology Transfer Requirements: Require specified technologies to be transferred on non-commercial terms and/or specific levels and types of Research and Development (R & D) to be conducted locally. Licensing Requirements: Oblige the investor to license technologies similar or unrelated to those it uses in the home country to host country firms. Remittance Restrictions: Restrict the right of a foreign investor to repatriate returns from an investment. Local Equity Requirements: Specify that a certain percentage of a firm's equity should be held by local investors.

35
Member States were given 90days to notify WTO of any existing non-conforming measures3.
Pakistan was one of the countries that notified investment measures under the agreement.
Following Pakistan’s request, the initial five-year transition period was further extended to
December 2002. During that time, Pakistan made an effort to eliminate all remaining TRIMs.
About 85 per cent of the measures covered by the so-called deletion programmes had been
abolished by then, Pakistan’ request for a further extension, mainly in response to the
automotive sector’s demands, was turned down by the WTO.
On the domestic front Pakistan had been following the indigenisation policy in engineering
industries through the stakeholder agreed deletion programmes since 1987.Up to 1995, the
deletion cell of Ministry of Industry and Production (MoIP) was formulating and monitoring the
deletion programmes4.In 1995, the Government set up the Engineering Development Board for
providing policy direction and impetus for growth of the engineering sector. The Board used an
integrated approach by focusing on the overall development of all the subsectors of the
engineering industry and acted as a bridge between the Government and the
entrepreneurs/investors to ensure achievement of set objectives. The Board principally agreed
to remove all the TRIMs in industry generally to make it more competitive, and recommended a
plan to phase out the deletion programmes by 2000. Slow implementation stretched the plan
slightly and the programmes in 86products were phased out from the purview of deletion policy
between 30 June 2002 and31 December 2003. Since then, there is no deletion programme for
the engineering industry.
However, in 2003 the Board set up the Industry Specific Deletion Programme for the Automobile Industry consisting of 18 components, and the targets achieved at that time were as follows:
Sr. No.& Product Category Achieved ISDP Targets
(%)
1. Car Cat-1, Upto 800cc 70.00
2. Car Cat-2, Above 800cc upto 1200cc 58.00
3. Car Cat-3, Above 1200cc 53.00
4. Tractor Cat-2, Above 40 &upto 55 HP(2X2) 85.00
5. Tractor Cat-3, Above 55 &upto 80 HP(2X2) 62.50
6. Tractor Cat-4, Above 55 &upto 80 HP (4X4) 50.00
3 See United Nations Conference on Trade and Development (2007). 4 For detail see Saeed, Muhammad (2004).

36
Sr. No.& Product Category Achieved ISDP Targets
(%)
7. Motorcycles Cat-1, Upto 100cc 85.00
8. Motorcycles Cat-2, Above 100cc upto 175cc 83.00
9. Commercial Vehicle Cat-1, Pickup 2 Ton GVW 65.00
10. Commercial Vehicle Cat-2, Pickup S/C, 4X2 Above1500cc
upto 2999cc GVW above2 ton upto 5 ton 50.00
11. Commercial Vehicle Cat-3, Rigid Truck 4X2, 5 ton to 8 ton 50.00
12. Commercial Vehicle Cat-4, Rigid Truck, 4X2,above 8 ton 54.00
13. Commercial Vehicle Cat-5(A), Rigid Truck, 6X2, above 8 ton
upto 30 ton 51.00
14. Commercial Vehicle Cat-5(C), Truck, Tractor/Prime Mover
4X4, GCW upto 30tons 42.70
15. Bus Cat-1, Minibus upto 30passengers 45.80
16. Bus Cat-2, Above 75 passengers 47.50
17. Sports Utility Vehicle SUV4X4 40.00
18. All Terrain Vehicle 4X4 Off Road 40.00
These programmes were also abandoned to ensure compliance with TRIMs requirements
for competitiveness and transparency. The sector today operates within the rubric of several
policies: the Industrial Policy,1977;the Privatisation Policy, 2000; the Trade Policies, 2009; the
Finance Acts which modify the fiscal and tariff regime backed by the Statutory Rules and Orders
(SROs) and the Customs General Orders (CGOs) which are modified from time to time; the Auto
Industry Development Programme (AIDP); the Tariff Based Scheme (TBS) which ensures
compliance to the WTO-TRIMs; the Pakistan Standards governing the sector and implemented
through the Pakistan Standard Quality Control Authority (PSQCA); and the National
Environmental Quality Standards (NEQS) which governs vehicular exhaust emissions.
3.2. INVESTMENT POLICY
The general Investment Policy announced by the Government’s Board of Investment is
very liberal, especially for foreign investors. There is no bar to remitting profits, licensing fees,

37
patent payments, technology transfer fees and charges. Also, 100 percent of the equity can be
owned by the foreign investor.
Specifically, the government has notified incentives for new entrants in automobile
sector under the Auto Industry Development Program (AIDP) to create a competitive
environment and availability of vehicles at affordable price. An amended SRO issued recently by
FBR says that additional customs-duty leviable under earlier SRO issued in 2006 shall not be
charged on sub-components, imported in any kit form by an assembler or manufacturer
declared to be a new entrant by the Engineering Development Board (EDB), for a period of three
years from the start of assembly or manufacturing of respective vehicles, subject to certain
conditions.
However, it has been made imperative for the new entrants that they shall chalk out a
plan for progressive manufacturing of the vehicles spreading over a maximum period of three
years within which they shall catch up with the localization or indigenization level of respective
vehicles, as approved by Auto Industry Development Committee (AIDC) of the EDB; and
continued non-levy of additional customs duty shall be contingent upon the achievement of
progressive annual indigenization as determined by the committee.
Earlier in another notification issued by the Ministry of Industries entitled ‘Auto
Industry in ’Auto Industry Investment Policy’ (AIIP), it was said that potential entrants with a
global presence of 100,000 units per year production in case of cars, 25000 trucks and buses
separately, and 5000 agriculture tractors shall be entitled to import 100 percent CKD kits,
whether or not locally manufactured, at the leviable customs duty for a period of 3 years for the
start of assembly or manufacturing.
In 2007, ECC set the following conditions for the new entrants: (i) have a plan for the
progressive manufacturing for vehicles; (ii) have serious and demonstrable intention to develop
parts locally; (iii) clearly identify the destinations in its plan or in agreement with its partners
for export of vehicles and parts manufactured in Pakistan; (iv) produce road worthy vehicles
complying to environment standards, with the EDB and the Ministry of Industries; (v) have
proof of land acquisition in the case of green field project or an agreement with owner, in the
case of existing assembly facilities; (vi) be required to submit a detailed business plan to EDB,
which shall verify the complete in-house assembly or manufacturing facilities and (vii) AIDC,
constituted vide Ministry of Industries, Production and Special Initiative’s Notification No 2-
4/2006/Tech-I dated 18.12.2007, shall assess the business plan and other to qualify the
potential new entrant for entitlement of benefits under AIIP or otherwise.

38
Under clause 9.3 of AIDP, there will be two regimes in the absence of SRO 693, ie (i)
existing OEMs on which SRO 693 and Customs General Order (CGO) 11 & 12 are applicable and
(ii) new entrant which imports all the CKD on the basis of SROs 655 & 656.
3.3 TRADE POLICIES
The assemblers and vendors need to import vehicles as completely knock-down vehicles,
raw materials, components and assemblies and some of them also export the products they
manufacture. The international trade in these commodities [(Chapter 87) of the Harmonised
System (HS) of Classification of Commodities] in Pakistan is governed by the Import Policy
Order (IPO) and the Export Policy Order (EPO) which are issued periodically and then modified
over their life span until the next edition of the IPO/EPO is issued by the Ministry of Commerce.
The Orders contain lists of items which may not be imported/exported and the conditions
governing such prohibition, or lists of importable and exportable commodities which originate
from or are destined to (respectively) specific countries. The currently operational IP/EP
Orders were last issued in 2009, and the one previous to that in fiscal year 2006/07. The IPO
2009 was last amended on 28 December 2011.
Alongside the trade policies the government announces the tariffs through the Finance
Acts. These are and modified this over the ensuing fiscal year through the Customs General
Orders (CGOs)5 and the Statutory Rules and Orders (SROs)6 issued under clauses 16 of the
Customs Act 1969. Thus the IPO, the EPO, the current Finance Act and the updated Customs Act
form the main body of legislation which govern the International trade of Pakistan. Others of
minor significance which rule the trade, include, but are not limited to, are the Carriage of Goods
by Sea Act, the Insurance Act, the Foreign Exchange Regulations Manual
IPO 2009
The IPO 2009 governs the import of goods into Pakistan. Article 5 Clause A prohibits
commercial import of defence materials, goods from Israel, goods infected by disease or covered
by international agreements and second hand goods of all kinds unless exempted by those
mentioned in Appendix C and restricts goods from India and Transit Trade Agreements to
certain condition.
5Which generally set out standard operating procedures 6Which generally set out terms and conditions of trade, permissions, prohibitions and restrictions on
what may or may not be imported/exported, and the rates and duties payable

39
Appendix C allows import of second hand dumpers in CBU state of 5-ton capacity or over,
specialised con-defence security vehicles, a “limited” number of CBU cars for each industry
located in EPZs.
Appendix E (para 15 of the IPO 2009) allows, under personal baggage, gifts and transfer of
residence rules, for the import of second hand/used (5 years old or less) vehicle “means
passenger car, bus, van, trucks, pickups including 4X4 vehicles”.
Appendix G of the Order is the “positive” list of tradable commodities with India which does
not include automobiles or parts etc. Appendix I lists the Machinery/Specialised Vehicles
allowed for import in second-hand/used condition by the construction, petroleum and mining
sector companies.
EPO 2009
The EPOs generally set out the framework for export promotion and identify areas
where a concerted effort is required to penetrate into new markets and consolidate the ones
into which the initial penetration has established the possibilities for growth and expansion.
The EPO also includes an elaborate list of commodities which cannot be traded and the
countries where specific commodities cannot and should not be exported to. The EPO 2009 is
silent on the automotive sector.
3.4. TARIFF POLICY
On 1st July 2006, the Deletion Programme for the automotive industry was replaced by
the Tariff Based Scheme to ensure compliance with TRIMs and issued the basic SROs which
would regulate the sector, namely, SRO 655(I)/2006 (Vendors) and SRO 656(I)/2006 (OEMs)7
(issued on 22nd June 2006). The basic framework of Tariff Based System is as under:
1. Imports in CKD condition would be allowed only to assemblers having adequate
assembly facilities and registered as such by the concerned Federal Government Agency.
2. Parts/ components indigenized by June 2004 have been placed at higher rate of Customs
Duty
3. Parts not indigenised would be allowed at CKD rate of Custom Duty.
The present tariff structure in the automotive sector is presented in Table 4.1 of the next
chapter where rates of effective protection are quantified.
7 Separately for the OEMs and the Vendors.

40
The TBS is equally applicable to the OEMs and the Licensed Vendors – the latter are
required to prove their arrangement with the former. Each is required to have a minimum
manufacturing capability, to be inspected by the EDB initially for acceptance of status as OEM or
Licensed Vendor and for renewal each year. Since this provides an opportunity for delaying
approval for the slightest infringement (paras (i), (ia) and (ib) of the SROs), the possibility of
rent-seeking cannot be set aside. The procedure set forth in obtaining the relief is in itself
cumbersome and requires details to be provided on each occasion. The EDB is the first step in
the process. It is required to forward the applications, but the supplicant has to follow this
through physically. Even one unintentionally mislaid document does jam-up the flow.
The use of SROs to encourage indigenisation and provide the nascent engineering
industry some protection from international competition started in 1988. The industry-specific
and later product-specific indigenisation programmes were initially drawn up and managed by
a wing the MoIP and post-1995 by EDB. These were agreed to by firms to establish the
mandated, but rising, shares of “local8 content”. In return EDB would agree to and input/-output
ration permitting import of specified parts and components at zero or much reduced Customs
tariffs which then be sent to FBR and routinely notified through modifying SROs amending the
CDs. This meant that EDB had and still has:
discretionary control over which of the materials and components used in the industry
could be imported, as otherwise these would have to be produced domestically, in effect
creating a non-tariff barrier to imports and amount to a de facto continuation of the old
“Import License Raj”,
considerable discretion as to the level and content allowed for import, and
discretionary control over new entrants to the industry.
However, the WTO’s Uruguay Round required removal of all non-tariff barriers to trade
and comply with the TRIMS agreement. As a consequence all auto sector programmes were
formally removed in July 2006. However, industry pressure and vested interests within
bureaucracy and government discovered alternate routes to “income”: using escalated tariff
structures combined with the continued use of tariff concessions9 and partial exemptions for
specified lists of raw materials and other intermediate inputs.
The day-to-day operations of the IPO2009 and the EPO2009 and the control of imports
and exports are governed by the Customs Act. This is done largely through publication of CGOs 8 Including in-house and contracted out vendor units 9In SRO-speak, “concessions” means that all the CD in excess of a specified level is exempted. Only if the
specified level is zero is the CD zero. So the actual CD could be zero or any other rate that is lower than the statutory duty.

41
and SROs. Chapter 87 of the Customs Tariff covers the automotive sector which is modified
annually through the money bill. Finance Bills are presented each year before the National
Assembly and approved by it as the Finance Act of the fiscal year for which it has been designed.
This is the instrument which is used to provide protection to the local automotive industry.
The levels of the “concessionary” rates are very low in comparison to the statutory rates
and the EDB is required to update the list mandatorily. In principle, none of the CD concessions
are available if components or parts are locally manufactured. To facilitate observance of this
condition at Customs clearance, EDB “in consultation with stakeholders” has compiled and
regularly updates a list of locally manufactured products. If there is a dispute as to local
availability, this is decided by EDB after consultation with “the renowned local manufacturers”
of the same or similar products. These modified lists, which deleted the relevant Chapter of the
Customs Act, spanning the spectrum of the manufacturing sector, were notified in CGO 11/2007.
This is not specific to the automotive sector.
The automotive sector lists are transferred electronically to the Customs Department
which maintains these both as hard copies and also on the servers of the Pakistan Automated
Customs Clearance System (PACCS) or its successor(s).
Two CGOs, specific to the sector, have been issued for assessing the value of used motor
vehicles. The first is CGO 14 of 2005 and the second is CGO 02 of 2011 which actually modifies
the former. The “determined” value is based on the manufacturers’ (or agents’) certification of
the FOB price to which are added on all costs incurred for importing the vehicle to arrive at the
landed cost. This value is then depreciated by a monthly rate for the period from its first
registration abroad.
As indicated earlier there are three specific SROs which govern the sector. They are
described briefly in Table 3.2 and a more detailed analysis follows.
TABLE 3.1: GOVERNING SROs
SRO No. Date Description
SRO 655(I)/2006 22.06.2006 For vendors: Partial exemption from customs duty on import of raw materials, sub-components, components, sub-assemblies and assemblies not manufactured locally
SRO 656(I)/2006 22.06.2006 For OEMs: Partial exemption from customs duty on components (which include sub-components, components, sub-assemblies and assemblies but excludes consumable) and direct materials
SRO 693(I)/2006 01.07.2006 Levy of additional customs duty on import of goods for assembly/manufacture of vehicles.
Source: EDB (http://www.engineeringpakistan.com/EngPak1/srolist.htm).

42
SRO 655(I)/2006 was issued on the 22nd of June 2006 with the sole objective of
providing relief from so much of the customs duty as was in excess of the concessionary and the
statutory rates specified in the Customs Act for the Vendors only. SRO 656(I)/2006 was also
issued simultaneously and for the same purpose, except that its beneficiary was the OEM
category of the sector. Both SROs require the “new entrants” and those wishing to the benefits
conferred shall make an application for the same both, respectively, initially and annually
thereafter which will contain the following information:
1. Proof that he is/will be registered as a Sales Tax Payer
2. List of equipment installed complying with the requirements specified
3. Submit hard and soft copy of list of components with parts numbers along with respective
PCT headings intended to be imported
4. the input output ratio of the items to be manufactured and total annual requirements of
materials
These are then verified by the EDB and forwarded to the FBR as described above. At the
time of importing the inputs the “licensed” OEM/Vendor is required to certify that the import
complies with his annual entitlement.
Through SRO 693(I)/2007 the additional duties levied are as shown in Table 3.2.
TABLE 3.2: SRO 693 - LEVY OF ADDITIONAL DUTY ON AUTOMOTIVE SECTOR Sr. No. PCT Headings Rate of
additional customs-duty
(1) (2) (3) 1 87.01 (Agricultural Tractors) 35% ad val. 2 8701.2090 and 8701.9060 35% ad val. 3. 87.01 (Tractors other than mentioned at Sr.
No.1 and 2 above). 25% ad val.
4 87.02 (CNG dedicated buses) 35% ad val. 5 87.02 (Non-CNG buses) 30% ad val. 6 87.03 6[excluding 4-stoke auto rickshaw of PCT heading 17.5%ad val.
8703.2115] 6[6a 4-stroke auto rickshaw of PCT heading 8703.2115 30% ad val.
7 87.04 (vehicles of g.v.w exceeding 5 tons). 25% ad val. 8 87.04 (vehicles of g.v.w not exceeding 5 tons) 30% ad val. 9 87.11
32.5% ad val.
Source: EDB (http://www.engineeringpakistan.com/EngPak1/Tariff%202011-12%20%28Chapter%201-97%29.pdf.)
The system discriminates between “licensed” OEMs/Vendors and commercial importers.
The former pay WHT at a 3 per cent adjustable rate on CIF+CD value; the latter pay a non-
adjustable rate of 6 per cent on CIF+CD+ST. Sales Tax in 19 per cent in the case of the latter and
16 per cent in the case of the former. Thus, the effective incidence of all taxes paid by the
commercial importer is significantly higher. This encourages the “licensed” OEM/Vendors to

43
have the approved input-output ratios skewed in their favour. This could have grave
consequences: one, commercial imports are discouraged; the small back-end assemblers and
vendors cannot get access to the economies of scale prices obtained by the commercial
importers; the SME sector faces “monopolistic” prices set by the “licensed” players; and
encourage these also to take over the commercial import market to the detriment of the SMEs,
commercial importers and the general consuming public. Therefore, a level playing field should
be provided, by removing the distinction between industrial and commercial importers.
3.5. AUTO INDUSTRY DEVELOPMENT PROGRAMME (AIDP)
In 2005 the EDB initiated preparations for the future development of the automotive
sector. After a lengthy series of stakeholder discussions, the Auto Industry Development
Programme was announced in January 2008. Its objectives were to ensure sustained growth,
increase competitiveness, absorb and diffuse technology, develop the human resources needed
and comply with standards, safety and environmental regulations. Within the overall rubric of
the sector’s development it contained the following sub-programmes:
Auto Industry Investment Policy (AIIP)
Reduced the threshold of investment required by new entrants
= However the definition excluded all those who had attempted to enter or
had exited, e.g., FIAT, General Motors, Mack Trucks. Chevrolet’s Joy thus
lost the opportunity
The one-window operation foreseen in the policy does not exist
Productive Asset Investment Incentive (PAII)
Designed as a customs duty credit on the value of investment in new productive
assets, e.g., dies, tools, jigs to be claimed against certified investment. The
Ministry of Finance did not agree to the proposal.
Five Year Tariff Plan
Designed and implemented in the first year. Subsequent reflections in the
budgets did not materialise. The Plan is attached as Appendix 3.1
Technology Acquisition Support Scheme (TASS)
Was designed as a matching grant to be funded from the Science and Technology
Ministry’s pool of R&D funds. However, since such funds were never allocated
the Scheme remained non-operational.
Auto Cluster Development

44
The Auto Parts Cluster in Lahore developed by SMEDA proved to be a success.
The Trailer/Bus Body Park is being proposed for Faisalabad. No other plans
have come to light.
Human Resource Development (HRD)
Will be based on existing public sector resources through the TEVTAs and the
Engineering Universities to develop the requisite skills.
An overall assessment would tend to suggest that the programme was well-conceived, but
was under-resourced and the political will to take it off the ground withered away with the
change in government. Even though the AIDP 2008 achieved only partial success, the MOIP and
EDB are in the throes of preparing its successor.
3.6. POLICY AND STANDARDS
The quality of manufactured goods is supposed to be set by the Pakistan Standards Quality
Control Authority (PSQCA) is an arm of the Ministry of Science and Technology and is mandated
to establish and monitor adherence to standards of all commodities manufactured locally. In
the engineering sector it has established some standards and certifies products and monitors
adherence. However, there are no known standards for the automotive sector. These need to be
developed to ensure an acceptable level of quality. Owing to a lack of human resources available
with PSQCA, it could approach the Corps of Engineers of the Pakistan Army to help establish
these, certify adherence and monitor compliance annually through quality and Standards
Audits.
Another mechanism available to ensure process control is through the International
Standards Organisation’s certified Quality Assurance surveyors. Once again this is not seen in
the automotive sector.
Safety standards are laid out in the Motor Vehicles’ Rules which unfortunately are not
standardised across the country. The first step should be to establish the standards and have
these approved by sub-national governments. No vehicle is examined in Pakistan as there is no
facility available which can test these. Further, there is no trained examiner available with the
Offices of the Motor Vehicles Examiner. It is suggested that help should be sought from such
agencies as the Transports Internationaux Routiers or International Road Transport (TIR) or
the Transport and Road Research Laboratories to help establish these facilities and operate
these for a few years. In the interim the human resource skills need to be established and a
transparent system for examinations developed and implemented.

45
CHAPTER 4 EXTENT OF EFFECTIVE PROTECTION
The previous chapter has highlighted that a transition has been made to a tariff based
system (TBS) from the system of physically setting targets for deletion in the automotive sector
in conformity with WTO requirements. The objective of this chapter is to determine what the
resulting levels of effective protection in different sub-sectors.
Section 4.1 sets up the methodology for quantifying the effective rate of protection
(ERP). Section 4.2 presents estimates of the ERPs. Based on these estimates we present in
Section 4.3 recommendations for changes in the tariff policy in a medium term setting.
4.1. METHODOLOGY
The ERP enjoyed by an industry is quantified as follows:
ERP =VA − VAW
VAW× 100… … … (1)
where VA = value added at domestic prices
VAW = value added at world prices
The value added at domestic prices is derived as follows:
푉퐴 = (1 + 푡 )− 푎 (1 + 푡 )… … … (2)
where t0 = import tariff on competing imports to the industry’s output
aij = input – output ratio of the jth input
tij = import tariff on the jth input
similarly, the value added at world prices is given by
푉퐴푊 = 1 − 푎 … … … (3)
The above equations are based on the assumption that domestic prices adjust fully to
the import tariffs. Pursell, Khan and Gulzar (2011) argue that in a regime of high tariffs, as is the
case in the automotive sector currently, it is possible that domestic prices do not adjust fully to
the tariffs. They make a comparison of the prices of the same models in Pakistan and India

46
respectively and conclude that it is likely that implicit nominal protection rates are below the
protection available from tariffs, especially in the case of large cars.
They attribute the under pricing in relation to that indicated by tariffs due to the
presence of substantial excess capacity and depressed demand conditions since 2008.
Therefore, they compute the ERPs in two scenarios:
(i) with domestic prices consistent with the tariff structure, the ERPs available
work out as 120 percent for assembly of cars, 95 percent for vendors and 104
percent for the integrated process.
(ii) with domestic prices of vehicles about 90 percent of the world price plus tariff
the ERP falls to 48 percent for the integrated process.
In effect, we depict the two scenarios in Figure 4.1 – Case I. In scenario 1, the domestic price
adjusts fully to the tariff while in Figure 4.1 – Case II the domestic price lies between the world
price and the world plus tariff.
Our calculations of ERPs are based on two scenarios, first, the domestic price equal to
the world price plus tariff and, second, the domestic price equal to 90 percent of the world price
plus tariff. We extend the analysis beyond cars and parts to other vehicles.
4.2. RESULTS
The input-output ratios for different segments of the automotive sector have been
derived from the data contained in the Census of Manufacturing Industries (CMI) of 2005-06
undertaken by the Pakistan Bureau of Statistics.
The tariff structure for different types of vehicles and parts as of 2011-12 is given in
Table 4.1. We assume that bulk of imports of CKD and non-localised parts is on the
concessionary regime as per SRO 656(1)/2006. The reduction in the rate of duty is not
pronounced in the case of cars, 32.5 percent versus the statutory rate of 35 percent. However, it
is more pronounced in the case of other vehicles.
The estimated ERPs are presented in Table 4.2 under the two sets of assumptions. The
following conclusions are reached from the ERP estimates:
(i) If domestic prices fully reflect tariffs, then the ERPs are generally high. They range
from 98 percent for small cars (800cc) to as high as 374 percent for large cars
(above 1500cc). This is a reflection of the very high customs duty of 75 percent on

47
large cars. The ERPs come down sharply to between 35 percent and 113 percent for
cars with the second set of assumptions.
(ii) The ERP on parts ranges from 32 percent to 78 percent depending upon the
particular set of assumptions.
(iii) The ERP on motorcycles is extremely high at 196 percent under the first set of
assumptions and falls to 76 percent if in the presence of intensive competition in
this market the domestic price remains somewhat below the world price plus tariff.
(iv) In the case of trucks there appears to be a large differential between the ERPs for
small and large vehicles respectively.
Overall, in both sets of assumptions, there is a substantial variation in the ERPs for different
types of vehicles and parts. Consequently, there could be substantial misallocation of resources
within the sector and between the automotive sector and other sectors of the economy. In cases
where the ERP is high there is a danger of over investment while in other sub-sectors investors
may be reluctant to enter. Clearly, the policy goal must be to move to a regime where the tariff
levels are more moderate and, more or less, uniform across sub-sectors.
4.3. RECOMMENDATIONS ON TARIFF REFORM
The Government does envisage the reduction of tariffs in the automotive sector in a five
year time frame, as per an earlier ECC decision. But this process does not seem to go for enough
with only minor reduction in tariffs in the terminal year from the present level and large inter-
vehicle differentials will persist according to this scheme of up to 70 percent.
Based on the above analysis, we make the following recommendations (see Table 4.3) for
implementation in a medium-term setting:
(v) The maximum tariff on vehicles should be brought down to 35 percent in a five year
time frame.
(vi) The dispersion of tariffs among CBUs of vehicles should not exceed 15 percent in the
terminal year with lower rates of 20-25 percent on trucks and buses and 35 percent
on cars and motorcycles.
(vii) The same tariff rates should apply on cars of different sizes. However, in order to
discourage luxury consumption, excise duty may be applied both on CBU imports
and domestic production. The rate of excise duty may be levied at 20 percent on cars
with capacity of 1300-1500cc, rising to 60 percent for cars above 2000cc.

48
TABLE 4.1: DUTY STRUCTURE ON AUTOMOTIVE SECTOR (DURING 2011-12)
S. No. Category
Duty Structure (%)
SRO 655(I)/2006 Rate of Duty on CKD on Non-localised parts SRO 693(I)/2006 1st Schedule
of Customs Act 1969
(CBU) Rate of duty
on raw Materials
Rate of duty on sub-
components
Rate of duty on
components
Rate of duty on sub-
assemblies
SRO 656(I)/2006
Statutory Duty on localised parts under SRO and/or Statutory
1 Agriculture Tractors of PCT 8701 0% 0% 0% 0% 0% 35% 35% 15%
(0% SRO 567)
2 Road Tractors for Semi-Trailers (Prime Mover) of 280HP and above of PCT 8701 0% 0% 0% 0% 0% 35% 35% 15%
3 Road Tractors for Semi-Trailers (Prime Mover) less than 280HP PCT 8701 0% 0% 0% 0% 10% 35% 35% 30%
4 Buses-Falling CNG-Dedicated of PCT 8702 0% 0% 0% 0% 0% 35% 35% 0%
5 Buses-Falling PCT 8702 (Non-CNG) 0% 5% 10% 15% 5% 35% 35% 20%
6 For Vehicle of PCT 8703 0% 5% 10% 20% 32.50% 35% 50% 50-100%a
7 Trucks of g.v.w not exceeding 5 tons falling under PCT 8704 0% 5% 10% 15% 20% 35% 50% 60%
8 Trucks of g.v.w exceeding 5 tons falling under PCT 8704 0% 5% 10% 15% 10% 35% 35% 30%
9 For vehicle of PCT 8711 motorcycles 0% 5% 10% 20% 15% 20%-35% 47.50% 65%
10 For bicycles falling under PCT heading 8712 0% 5% 10% 10% Nil Nil Nil 35%
11 Other vehicles 0% 5% 10% 15% Nil Nil Nil 35% 12 Trailers of PCT 8716 5% 5% Nil 15%
Source: EDB Customs Tariff, 2011-12, FBR. a rate on CBU for 800cc cars is 50%; 55% for exceeding 800cc but not exceeding 1000cc; 60% for exceeding 1000cc but not exceeding 1500cc; 75% for exceeding 1500cc but not exceeding 2000cc and 100% + 50% RD for exceeding 1800cc but not exceeding 3000cc.

49
FIGURE 4.1: TWO PROTECTION SCENARIOS
Case I: Pe = Pw(1 + t)
Case II: Pw< Pe< Pw(1 + t)
M
Import of CBU
Domestic Supply Curve
Qe
Pw
Pw(1+t)
Pe E
Pw(1+t)
Qe
DD
SS
E
Pw
DD

50
TABLE 4.2 EFFECTIVE PROTECTION RATES (%)
1. Tariffs are effective in determining domestic prices
2. Domestic Prices are 90% of world price + tariffs
Car Assembly 800cc 98.5 35.2 800 - 1000cc 113.2 51.5 1000 - 1500cc 153.4 64.2 1500 - 1800cc 374.2 113.0
Motorcycles 196.1 75.6
Trucks (< 5 Tons) 216.1 78.2
(> 5 Tons) 36.1 15.7
Parts 78.3 32.2
Buses (Non-CNG) 22.5 10.1 Source: Authors’ own calculations using numbers from; Census of Manufacturing Industries, 2005-06, Pakistan Bureau of Statistics. Auto Industry Development Programme, Ministry of Industries , Production & Special Initiatives.
(viii) The distinction between localised parts and non-localised parts needs to be removed
in the tariff schedules, as is the case in most countries. In addition, SRO
656(1)/2006, meant for concessionary imports, must be withdrawn. These
provisions have conferred considerable discretionary power to EDB and the
Customs Department and led essentially to a reversion back to the licensing regime
with scope for rent seeking. By 2016-17, the duty should be brought down to 20
percent.
Following the scaling down of tariffs, it is likely that the levels of effective protection will be
based on prices domestically corresponding to the world price and tariffs. Our calculations are
that ERPs in the terminal year, 2016-17, resulting from our proposed tariff reforms will be close
to 50 percent for cars. These are more moderate levels of ERPs. In addition, they will promote
more competition and balanced development of the automotive sector.
An obvious area of concern is the impact of tariff reforms over the next five years on the
level of tax revenues, especially since the automotive sector is a major contributor to FBR
revenue (see Chapter 2). Pursell, et al (2011) have argued that given the current redundancy of
tariffs, a reduction in them should not necessarily effect revenues. In fact, if the proposed
reforms lead to greater competition and increase the volume of sales of vehicles then the level of
revenues could even rise over time. This will increase pressure also for cost effectiveness and
innovation and enable the automotive sector to make a transition to the next stage of

51
development. In particular, the removal of concessionary rates on CKD and parts will promote
diversification and greater technological sophistication of the auto parts sector.
TABLE 4.3: PROPOSED TARIFF STRUCTURE IN AUTOMOTIVE SECTOR BY 2016-17 (%)
Description* Current Rates of Customs Duty 5th Year Terminal Tariff Structure
CBU CKD Localised
CKD Non-Localised CBU
CKD Localised & CKD Non-Localised
Excise Duty
Passengers Cars Capacity 800cc 50 50 32.5 35 20 0
800-1000cc 55 50 32.5 35 20 0 1000-1300c 60 50 32.5 35 20 0 upto 1500cc 60 50 32.5 35 20 20 upto 2000cc 150 50 32.5 35 20 40 beyond 2000cc 150 50 32.5 35 20 60
Passenger Buses (Non-CNG) 20 35 5 20 15 Motorcycles 65 16-47.5 15 35 20 Trucks
Trucks over 5 tons 30 35 10 25 15 Prime Movers (less 280 HP) 30 35 10 20 15 Prime Movers (> 280 HP) 15 35 0 20 15 Autoparts - 5 - 5
Terminal in 5 years but in 3 moves 1st, 3rd and 5th year. Source: Auto Industry Development Programme, Ministry of Industries , Production & Special Initiatives and Authors’ recommendations. * unchanged for buses

52
CHAPTER 5 ASSESSMENT OF COMPETITION IN THE SECTOR
Assessment of the degree of competition in a sector is important from the viewpoint of,
first, implications on consumer welfare, second, extent of pressure for innovation, productive
efficiency and cost minimization and, third, to enable a transition from internally competitive to
an internationally competitive market.
Therefore, determining the extent of competition in different sub-sectors of the
automotive sector will help in identifying if excessive profits are being made due to
‘monopolistic’ pricing behaviour, whether the process of ‘technology deepening’ is taking place
and if the sector is emerging as competitive in international markets and the process of
exporting has commenced.
The chapter is organised as follows: Section 4.1 highlights the key elements of the
methodology used to assess competition and contestability in a market. Section 4.2 identifies
measures of competition and contestability within a market. Section 4.3 assesses the extent of
competition in different sub-sectors of the automotive sector and proposes some steps for
increasing competition.
5.1. METHODOLOGY FOR ASSESSING DEGREE OF COMPETITION
The statement of methodology given below relies on the following:
~ DFID, Competition Assessment Framework
~ OECD, Competition Assessment Tool Kit
The primary purpose of a competition assessment is to evaluate government policies,
regulations and laws to determine those that promote and those which impede competition,
such that the latter can be redesigned to increase competition. The steps in the assessment
include the following:
Identification of the relevant market: different sub-sectors of the automotive sector
constitute individual markets. There may be need for further disaggregation, as in the case of
cars. Three markets can be distinguished, one for small cars (800cc), one for medium sized cars
(1000cc) and one for large cars (1300-1600cc).
Identification of competitors: this includes both suppliers (domestic and imports) and buyers.
It is possible that ‘monopsonistic’ elements are present in the latter.

53
Examination of the market structure: this involves determination of market share of each
supplier; extent of stability of market shares over time; and rate of entry of new firms into the
market and their degree of success.
In particular, it is essential to look for the presence of any barriers to entry. The first
type of barriers are natural barriers which arise when there are large economies of scale;
problems for new entrants to access technology, raw materials or distribution channels or
relative smallness of the market in relation to the minimum size of investment.
Strategic barriers result from actions by existing suppliers like creating excess capacity
(to reduce interest of potential entrants); arranging tong term exclusive contracts and supply
and distribution arrangements and potential predatory response by lowering prices if entry
takes place.
The third type of barriers are regulatory and policy barriers like licensing
restrictions; requirements to be met by foreign investors; trade barriers, including high import
tariffs and high environmental, safety and other standards.
The anti-competitive stance of policies can be determined by looking at the following:
~ presence of non-tariff barriers to imports
~ high tariffs on competitive imports
~ differential tax concessions
~ unequal application of laws and regulations
~ differential access to land, infrastructure, intellectual property rights, etc.
5.2. MEASURE OF EXTENT OF COMPETITION
The measure most commonly used by regulatory agencies to assess degree of
competition is the Herfindahl–Hirshman Index, HHI, which is quantified as follows:
퐻퐻퐼 = 푆 … … … … … (2)
where Si = market share of the ith firm supplying in the market
n = number of suppliers
The lower the value of HHI the more intense the degree of competition. A threshold level of HHI
adopted by regulatory agencies, including the Competition Commission of Pakistan (CCP) is
1800, beyond which the market is considered as not meeting competitive norms.

54
Other measures of competitiveness include the following:
(i) domestic prices compared to prices in other countries, especially neighbours
(ii) rate of entry of new firms
(iii) extent of excess capacity
(iv) rate of profitability
(v) degree of innovation in the form of new products and cost cutting improvements.
5.3. ASSESSMENT OF COMPETITION IN THE AUTOMOTIVE SECTOR
We assess below on the basis of the above measures the degree of competitiveness of
different segments of the automotive sector.
Cars
The HHI values for motor cars of different sizes are presented in Table 5.1. There are
three producers in the large car category, namely, Honda, Toyota and Suzuki, with Toyota
having the largest market share of 67 percent. The HHI value is high at 4728, well above the
threshold level of 1800. In 1000cc cars, Suzuki dominates the market, leading to a HHI of as high
as 9090. In the 800cc category, there are two car manufacturers and the HHI is also high at
6924.
Further, market shares of individual manufacturers have not changed substantially over
time. Also, there has been very limited entry into the car market. Nissan and Kia did enter in the
1300cc – 1600cc group earlier but have since ceased production.
TABLE 5.1: MAGNITUDE OF HHI, 2010-11 (Index of Market Concentration)
Sub-Sector Makes HHIa
Motor Cars
1300 – 1600cc Honda, Suzuki, Toyota 4728
1000cc Suzuki 9090
800cc Diahatsu, Suzuki 6924
Trucks Hino, Nissan, Master, Isuzu n.c.
Buses Hino, Isuzu 2782
Tractors Fiat, Millat 3795
Motorcycles Honda, large number of other makes
1170
Source: Author’s own calculations. n.c. = not computed, because of dominance of imports

55
There is evidence of lack of innovation in terms of changes in models, quick availability,
fuel efficiency, increase in user efficiency and cost cutting. A key indicator of the lack of
competition is late deliveries and high premium payments even in the presence of substantial
excess capacity (see Table 2.3).The high prices of cars is demonstrated by the high ratio of
prices to average household income, which places Pakistan in the lowest decile of countries in
terms of affordability of cars.
Positive factors contributing to greater competition are, first, entry has been facilitated
by removal of the requirement for obtaining licenses for investing in the automobile sector. The
AIDP, as highlighted in the previous chapter, allows new entrants to import CKD cars at the
same rate, 35 percent, as auto parts. As per the general Industrial Policy, a number of incentives
are available to new entrants including 50 percent initial depreciation allowance, 100 percent
foreign equity and full remittance of profits and low customs duty of 5 percent on imported
plant and machinery. It is possible, however, that the limited size of the market in Pakistan has
restricted entry.
Further, import of used and reconditioned cars has been liberalized, but only under gift,
personal baggage schemes and transfer of residence. But this policy has been revised year-to-
year, especially with regard to provisions for depreciation.
What is the net effect of the negative and positive factors on competition among car
OEMs? Table 5.2 gives estimates of profitability, measured as the return on capital employed, in
different sub-sectors. In the case of car assemblers, the rate of return was very high in 2005,
during a period of great buoyancy in demand. Since then it has fallen sharply to 12 percent,
highlighting the cyclical nature of this industry. Nevertheless, car manufacturers continue to
enjoy higher rates of profit than for the private sector as a whole.
The Competition Commission of Pakistan (CCP) has prepared a report evaluating
competition in the automobile industry. The report concludes that
‘The automotive industry is facing problems of low volumes/
underutilization of capacity, high prices, late delivery, premium and
slow transfer of technology. Therefore, requirement of effective
competition is much more pronounced now than ever before to keep
the industry afloat.’
The report proposes the following measures to improve competition:

56
(i) Tariff on import of new cars in all segments of the market be reduced to bring
protection to manufacturers down to 5 – 10 percent.
(ii) Change in the market supply chain and terms applicable to purchasing vehicles. In
particular, there should be legal prohibition on payment of premium.
(iii) Consistency in policies, such that frequent changes in taxation, deletion and import
policies are avoided.
The report has been placed on the website of CCP for public comments.
Buses/Trucks: This sector effectively
faces competition from imported CBUs in
the presence of relatively low rates of
customs duty.
Tractors: There are only two major
domestic suppliers – Al-Ghazi and Millat
tractors. Imports of built-up units have
been virtually eliminated by 2010-11. The
HHI for this sector is also relatively high
at 3795 (see Table 5.1). Further, despite
generally depressed demand conditions, sales of tractors have continued to grow and the rate of
capacity utilisation is high at 110 percent (see Table 2.3). As such, there is no evidence of a policy
of output restriction being followed to raise prices.
However, the industry has been the beneficiary of a differential taxation policy whereby
tractors had been zero rated from the general sales tax. This is one of the factors contributing to
high rates of return. According to Table 5.2, among the various sub-sectors, profitability is the
highest in the tractor industry at above 50 percent on capital employed. In fact, contrary to the
general trend, profitability has increased in 2010 and reached the peak of 65 percent.
The government introduced the 16 percent sales tax on tractors in the latest Budget of
2011-12. But, following a slump in sales, this decision has been reversed and the GST rate has
been reduced to 5 percent.
The primary way of increasing competition in the tractor sub-sector is to promote new
entry, given the high rate of capacity utilisation currently. Also, as the economy picks up, the
standard GST rate should be applied to this industry.
Motorcycles: This is the only segment of the automotive sector where the market is quite
competitive. The HHI is very low at 1170, below the threshold level of 1800. The entry of a large
TABLE 5.2: TRENDS IN PROFITABILITY OF OEMs AND AUTOPARTS MANUFACTURERS
(%) Companies Producing 2001 2005 2010
Motor Cars 15.2 45.0 12.1 Trucks/Buses 13.7 26.8 -6.8 Tractors 54.7 50.2 64.5 Motorcycles 25.2 37.8 23.2 Auto Parts 26.0 40.0 22.2 All Companies Publicly Quoted in KSE 8.5 23.9 9.4
Source: Financial Statements Analysis of Companies (Non-Financial) Listed at Karachi Stock Exchange (2005-10), SBP.

57
number of indigenous units and assemblers with cheap Chinese technology has greatly increased
competitive pressures within the industry. Real prices have consequently fallen sharply and
despite a slowdown in the economy sales have shown rapid growth in recent years. These
features of the sub-sector need to be replicated in other parts of the automotive sector. Given the
relatively large size of this market, approaching 2 million units and relatively high protection,
there has been space for entry of new units. As such the rate of profit is 23 percent in 2010, as
shown in Table 5.2, is below that of tractor companies.
Auto parts Manufacturers: This is the most fragmented part of the automotive sector with a
very large number of units, although there are specialised ‘niches’ and some manufacturers are
licensed with OEM while others primarily sell in the replacement market. In the absence of data,
it is not possible to quantify the HHIs in different segments of the auto parts market.
Auto parts manufacturers enjoy relatively high rates of protection, but it is unlikely that
they are able to hike up their prices to levels corresponding to world prices plus tariffs for a
number of reasons as follows: (a) technical specifications, quantities and delivery times are
typically solely determined by the assembler (b) the assembler often provides the production
technology including the equipment needed to produce the parts (c) the assembler is the main
buyer of the parts (d) the assembler frequently has the capacity to produce the parts in-house if
not satisfied with the general performance including the quality and prices of the parts supplier
(e) very few parts suppliers have alternative markets for their products and rely almost entirely
on one or at most three of the major local Japanese assembly operations for sales (f) the
production/sales of most parts suppliers are far below the levels required to make exports
profitable, and in any case exports would generally have to start with supplies to the multi-
national operations of the same companies being supplied in Pakistan (g) given the lack of
enforcement of proper quality standards, there is intense competition in the replacement market
for repairs and maintenance of existing vehicles.
Overall, there appears to wide variation in the extent of competition among different
segments of the automotive sector. Competition is limited in the market for cars and is most
intensive in motorcycles, with other sectors falling in between. The CCP needs to be pro-active in
ensuring greater competition among car and tractor manufacturers. In addition, there is need to
review other policies, laws and regulations.

58
Chapter 6 PROFILE OF THE SAMPLE OF VENDERS
This Chapter presents the profile of the sample of vendors as part of Phase II of the
study. Section 6.1 highlights the objectives of the survey. This is followed by a description of the
various characteristics of vendors. The next section attempts to answer a number of key
questions on the basis of the findings of the survey related to impact of tariff protection on
employment and technology deepening, degree of competitiveness, etc.
6.1. OBJECTIVES OF THE SURVEY According to the TOR of this phase of the study, the survey is expected to provide
insights into the backward-forward linkages between the ‘production’ units and their vendors
of choice and the arrangements for ‘after market’ sales. It will determine costs of production, the
margins of profit and the extent of competition among vendors for long-term supply with the
‘production units’.
The survey is also aimed at providing answers to the following critical issues:
(i) Has the protection provided to the industry resulted in sufficient job creation and
technology deepening to justify the costs imposed on consumers?
(ii) Whether the firms that have benefited from the protection are dynamically
sustainable, that is, will eventually become competitive to move up the value chain
and compete without protection?
(iii) How effective is the AIDP in achieving its goals, with particular reference to the
deletion programme?
(iv) What are the impediments to increasing competitiveness of the industry?
(v) What are the incentives required for firms to produce high technology products and
moving the industry towards greater value addition?
(vi) What are the possible impacts of imports from India?
Based on the above, this Chapter gives a description of the sample of vendors. This is
followed by an attempt to answer the above questions, based on the findings of the survey. Next,
we assess in Chapter 7, the possible impact of the imports from India as indicated by the
respondents and the type of policies which will need to be adopted to mitigate against any
negative consequences.
6.2. THE SAMPLE
The TOR of the study required a survey of 4 OEMs and 20 vendors. The purpose of
surveying the former was primarily to determine the vendors who supplied them and to select
part of the sample from this list. We are pleased that we were successful, within the survey
budget, to collect data from 34 vendors, thereby exceeding the target by 70 percent.

59
The list of the sampled vendors is given in Chart 6.1 below.
Chart 6.1 LISTING OF SAMPLED VENDORS, TYPE OF AUTOPARTS PRODUCED AND LISTING OF SAMPLE OEMs
Sr. No.
Name of Vendor Auto PartsManufactured Sr. No.
Name of Vendor Auto Parts Manufactured
FORMAL
Karachi
1 Agriautos Industries Limited* Shock Absorber, Door Locks, Steering Box 9 Muhammed Ali Engineering Works** Liner polar, seat installer,
spacing tool
2 Feroz Industries* Ashtray 10 Loads Limited*** Radiator, Silencer, Sheet metal components
3 ALLCO Transfer Printers (Pvt) Ltd* Sticker, Plates, Doom System 11 Pakistan Plastic Manufacturers
Association*** Door windows, door lever, coin box, dash board
4 Indus Engineers* Panel component front seat component
12 Balochistan Wheels Ltd*** Automotive Wheel Rims 13 Malta Auto Industries (Pvt) Ltd*** Automotive Parts
5 3-D Engineering Services* Push rod, break paddle
6 A & A Metal Industries (Pvt) Ltd* Leaf spring 14 Procon Engineering (Pvt) Ltd.**
Door Trim, Reclining Mechanism with slide Adjuster, Rear Package Tray, Engine Under Cover, Chassis Frame
7 Thal Engineering Limited**
Auto Airconditioner units, Wiring Harness, Heaters, Blower HVAC, Heat Exchanger
15 General Tyre and Rubber Company Ltd*** Rubber Tyres
8 Ruba Tech Manufacturing Industries (Pvt) Ltd**
Door Seals, wind screen, weather strips, trunk seals
Lahore
16 ANC (Pvt) Ltd.** Wheel rims 18 Standard Engineering Works (Pvt) Ltd.** Hydraulic shaft, Gear Shifter, Axel Shaft
17 Saira Industries (Pvt) Ltd** Wheel rims 19 Risan Synthetic Technical** Handle Grip, Handle, Reflector

60
Sr. No.
Name of Vendor Auto PartsManufactured Sr. No.
Name of Vendor Auto Parts Manufactured
20 Mecas Engineering (Pvt) Ltd.** Hydraulic Housing, Front Grill, Side Grill, Gear bushing
22 Hawks Engineering Door Strikers
21 Move Tech Engineering and Manufacturing**
Steering Wheels, Fan Radiators, Knob Gear
INFORMAL
Karachi
23 Javed Steel Manufacturing Works* Battery covers, tube exhaust pipe 27 Pervez Engineering Industries** Door Channel
24 Khan Engineering Works* Sheet metal 28 Razi Sons (Pvt) Ltd** Seats, Sheet Metal Parts, Trims
25 Creative Engineering Works* Tail light, winker 29 Zaib Engineering (Pvt) Ltd*** Lead side liner, mud flap, bracket lower arm
26 Japan Metal Industries* Aluminum Section, Pipe
Lahore
30 A-One Technique (Pvt) Ltd*** Bush stabilizer, steering wheel, sheet metal 33 Brightstar Engineering (Pvt) Ltd.** Handle, Brake Paddle, Back
Light, Winkers
31 Albadar Engineering Works*** Frame body Parts 34 Metaline Industries** Fuel Tank, window Floor steel stamping part
32 Teletronix** Automotive horns, engine oil filter, heat and air conditioners
Name of the OEMa
1 Honda (Motorcycles)
3 Master Motors (Trucks/Buses)
2 Pak-Suzuki (Cars) 4 Millat Tractors Notes:
a The primary purpose was to obtain the list of their vendors. Typology of Products: * Components, ** Assemblies, *** Components and Assemblies.

61
Out of the 34 vendors, 22 are ‘licensed’ or ‘formal’ with the major part of sales to OEMs.
12 are ‘unlicensed’ or ‘informal’ with most of the sales directly into the retail market for parts.
The questionnaire administered on the vendors is given in the Appendix 2. We now
describe the various characteristics of vendors obtained from the sample.
6.3. LEGAL STATUS
Table 6.1 gives the legal structure of the vendor organizations, in terms of being a public
limited company, private limited company, partnership or sole proprietor.
Table 6.1
LEGAL STATUS OF SAMPLE VENDORS (%)
Formal Informal
Public Limited Company 22.7 0.0
Private Limited Company 59.1 75.0
Partnership 4.5 8.3
Sole Proprietor 13.6 16.7
Total 100.0 100.0
Source: Estimated from Survey Data.
It is clear from above that vendors in the formal sector have a more sophisticated legal status,
either as public or private limited company. In the case of informal vendors, there is no public
limited company and a higher presence of partnership or sole proprietorship. Given the nature
of formal vendors, with higher standards of financial reporting and accountability, it is likely
that they have greater access to credit from the banking system or the capital market.
6.4. MEMBERSHIP OF ASSOCIATIONS
Pakistan’s Automotive Parts vendors are encouraged to become members of one or
more trade bodies in Pakistan through which they can promote, stimulate and protect their
interests. Within our sample of 34 auto parts manufacturers, 4 (11.7 percent) are members of
PAMA, 5 (14.7 percent) members of Chamber of Commerce and Industries (CC&I) and 8 (23.5
percent) are linked with Pakistan Engineering Council (PEC). 29 vendors, 85 percent of the
sample are members of Pakistan Association of Automotive Parts & Accessories Manufacturers
(PAAPAM). The main aim of these trading bodies is to offer various services to its members, by

62
providing a common platform to them, for representation of various issues to the Government.
In addition to this, they try to create awareness that the auto part manufacturers are an integral
part of the automotive industry, and help them in achieving industrial growth, generation of
employment and attainment of high degree of value addition in the country.
6.5. INVESTMENT AND CAPACITY
Table 6.2 gives the level of investment and different measures of capacity.
Table 6.2 INVESTMENT AND CAPACITY OF SAMPLED VENDORS
(per unit)
Formal Informal
Investment Size* (in Million Rs)
Small 3.7 0.7
Medium-sized 13.1 2.2
Large 930.0 58.0
Total 272.4 20.2
Annual Capacity (Parts) by Size* (in 000s)
Small 40.0 4.0 Medium-sized 188.3 18.4 Large 4054.6 302.4 Total 1358.9 108.3
Annual Capacity (Tons) by Size* Small 336 36 Medium-sized 660 570 Large 2016 1440 Total 1138 660
Source: Estimated from Survey Data. * Small = average of the lowest one third Medium = average of the next one third Large = average of the highest one third
The above table clearly demonstrate that the formal vendor units are substantially
larger than informal units. However, the size distribution of units in the former category is more
skewed, with some units having investment of Rs 1 billion or more.

63
6.6. TURNOVER
The average turnover by size of unit is given in Table 6.3. Here again we observe that
formal units are larger and there are some units with turnover above Rs 3 billion. However,
there is substantial variation in size among the units, especially in the formal sector.
Table 6.3 ANNUAL TURNOVER OF SAMPLE VENDOR UNITS
(Rs in Million) Formal Informal
Units by Size
Small 7 6
Medium-sized 50 40
Large 3179 857
Total 1078 301 Source: Estimated from Survey Data.
6.7. EMPLOYMENT
The average employment by type of the sampled units is given below in Table 6.4.
Table 6.4 AVERAGE EMPLOYMENT BY TYPE IN SAMPLE VENDOR UNITS
Formal % Informal %
Management & Supervisory 53 11.7 22 13.3
Skilled Workers 292 64.5 79 47.6
Unskilled Workers 108 23.8 65 39.1
Total 453 100.0 166 100.0
Source: Estimated from Survey Data.
Employment in formal units is on the average almost thrice that of informal units. Also,
given the technological nature of the industry, the major part of the employment is of
managerial and supervisory personnel and skilled workers, especially informal units.
We compare the labour productivity of formal and informal units in Table 6.5. Labour
productivity is about 72 percent higher in formal vendor units.

64
Table 6.5 LABOUR PRODUCTIVITY IN SAMPLE VENDOR UNITS
(000 Rs) Formal Informal
Annual Turnover 1409000 301000
Employment (No) 453 166
Labour Productivity 3110 1813
Source: Estimated from Survey Data.
6.8. COST STRUCTURE
The responses from the sample of vendors have enabled determination of the cost
structure. The estimates are presented in Table 6.6. The relatively capital-intensive nature of
Table 6.6 AVERAGE SHARE OF THE MAIN COST COMPONENTS IN SAMPLE VENDORS
(%)
Formal Informal
Electricity 20.6 26.4
Building/land rent 5.0 5.0
Raw Material 53.1 49.0
Labour 12.7 13.0
Machine Depreciation 5.2 5.0
Financial Cost 3.5 1.6
Total 100.0 100.0
Source: Estimated from Survey Data.
the industry is indicated by the low share of labour costs. For both categories of units, the
highest share is raw materials followed by the cost of power consumption.
6.9. GROSS PROFIT AND VALUE ADDED
Based on the above, we are in a position to estimate the value added by the sample units.
However, prior to this, we present the gross profit of these units in Table 6.7. The table indicates
that profitability in the formal sector is significantly higher at 19 percent, compared to the
informal sector where it is 12 percent on average. Smaller units also appear to have a somewhat
higher share of gross profit in turnover.

65
Table 6.7 GROSS PROFITS OF THE SAMPLE VENDOR UNITS
(Rs in Million) Formal Informal Small Medium Large Total Small Medium Large Total
Turnover 7 50 3179 1078 6 40 857 301 Gross Profit 2 15 585 200 0.3 2 105 36 Rates of Gross Profit (%)
29 30 18 19 20 5 12 12
Source: Estimated from Survey Data.
We now estimate the share of value added in turnover in Table 6.8.
Table 6.8 SHARE OF VALUE ADDED IN TURNOVER
(% of Turnover) Formal Informal
Gross Profit 19 12 Plus Labour Payments 10 11 Less Financial Costs -3 -1 Gross Value Added 26 22 Source: Estimated from Survey Data.
Therefore, the share of gross value added in turnover of formal units is 26 percent, while
it is somewhat lower for informal units at 23 percent. These estimates are close to the assumed
share of value added in value of production by autoparts manufacturers in Table 2.12 of 27
percent.
Overall, from the sample of vendors we conclude that bulk of the units, both formal and
informal, are private limited companies; there is wide variation in size of units; a high
proportion of technical and skilled workers; fairly high level of capital-intensity as
demonstrated by relatively labour productivity; high share of material and electricity costs and
reasonably high gross profit margins. Also, formal units perform significantly than informal
units both in terms of size and profitability.
It must, however, be emphasized that the results need to be interpreted with some
caution because of the small size of the sample of 34, out of a total population of over 2200
units. Consequently, the confidence intervals of these estimates are likely to be large.

66
Chapter 7 KEY ISSUES IN THE VENDING INDUSTRY
This Chapter aims to answer some of the questions in the TOR of Phase II of the study,
mentioned at the beginning of Chapter 6. These relate to the impact of tariff protection, extent of
competition within the sector, level of competitiveness and potential for moving up the value
chain. Finally, we discuss the policy measures suggested by the sample vendors which could
promote attainment of the AIDP, especially with regard to the extent of deletion.
7.1. IMPACT OF TARIFF PROTECTION
We have indicated in Table 4.1 that the rate of customs duty on non-local auto parts
generally ranges from zero to 32.5 percent (as per SRO 656(1)/2006) for different types of
vehicles. It is significantly higher at 35 to 50 percent on localised parts. According to Table 4.2,
the rate of effective protection to vendors is fairly high, at upto 78 percent.
The basic question is has the protection provided by the industry resulted in job
creation and technology deepening? We first look at the resultant level of employment in the
vending industry.
Table 7.1 ESTIMATED LEVEL OF EMPLOYMENT IN
THE VENDING INDUSTRY
% of Units
Number of Units*
Average Employment
per Unit**
Total Employment
Formal
High Estimate 10 220 453 99600
Low Estimate 5 110 453 49830
Informal
High Estimate 95 2090 166 346940
Low Estimate 90 1980 166 328680 Source: Estimated from Survey Data. * assumed total number of units is 2200, as per Table 2.2 ** as revealed by the sample, given in Table 6.4
Therefore, based on the employment in the sample units and blowing-up the numbers,
based in the population of 2200 domestic part manufacturers, we arrive at estimate of total
employment of close to 400,000. This is more than twice our estimate earlier in Table 2.13 of
187,000. However, it is close to the SMEDA estimate of employment of 500,000. Of course, there
is likely to be a substantial margin of error, given the sample size. But it is clear that the vending

67
industry is a major employer, probably employing more than fifteen times the OEMs. As such,
the extent of protection provided has facilitated substantial job creation in the auto parts sector.
This is not only the consequence of direct protection but also indirectly by protection to
automobile companies, which has raised demand for vehicles and thereby created more derived
demand for autoparts.
Has the extent of tariff facilitated the process of technology deepening in the vending
industry? From the sample of units, we look at the nature of the production process and the
level of quality control and factors influencing growth.
Type of Production Process
Out of the 34 auto parts manufacturers, close to two-thirds are registered vendors to
assemblers/OEMs. Many of these are bound to supply only to OEMs as per their agreements,
either a year contract or contract till a specific model ends. However some of them sell their
products in the replacement market in one or the other way. These vendors manufacture (88
percent), or some assemble (17 percent) sophisticated parts like piston, engine valves, gaskets,
camshafts, shock absorbers, struts, steering mechanisms, cylinder head, wheel hubs, brake
drums, wheel bumpers, instruments and instrument panel, gear of all types, radiators, cylinder
liners, blinkers and light/lamps, door locks and auto air conditioners. Approximately 41 percent
of manufacture subparts, while 64 percent manufacture the whole part.
The production processes for different parts are a mixture of different processes. The
main processes involved in the
manufacturing of auto parts are
given below (Table 7.2). It is not
necessary that production of all
parts used in an automobile will
comprise all processes. The most
commonly used production
process is sheet metal
fabrication which is in use by 20
firms, followed by 12 firms using
die stamping and 10 engaging in
production of moulds.
Table 7.2 % OF SAMPLE VENDORS BY TYPE OF
PRODUCTION PROCESS* (%)
Production Process Formal Informal Forging 36.4 0.0 Die stamping 31.8 41.7 Injection moulding 22.7 33.3 Production of moulds 22.7 41.7 Sheet metal fabrication 50.0 75.0 Electrical engineering 9.1 16.7 Chemical/flow process 4.5 16.7 Other 22.7 8.3 Source: Estimated from Survey Data. * multiple process may be in operation.

68
Therefore, it appears that while the formal units have attained an intermediate level of
technology or in some cases relatively high technology, informal units are mostly at
intermediate or low level of technology and producing more labour-intensive light parts.
Quality Control
Responses on various aspects of quality and quality control measures clearly indicate
that the respondents are aware of the importance of this and how this could help them expand.
During the survey only two of the informal vendors stated that they did not have quality
assurance methods installed as a management tool (see Table 7.3). They also stated that they
had not improved quality of output over the last five years. However the respondents all agreed
that with better quality, their volume of sales could improve.
Table 7.3 PRESENCE OF QUALITY ASSURANCE MEASURES IN
SAMPLE VENDORS (%)
Formal Informal
No. of Vendors with Quality control procedures 100.0 83.3
No. of Vendors with Improvement in Quality in last 5 years 100.0 83.3
No of Vendors who feel they can sell more with improved quality 100.0 100.0
Source: Estimated from Survey Data.
Of those who had instituted quality control measures in their organizations, they had
used a multiplicity of methods on instituting these. Table 7.4 shows that bulk of the units had
themselves instituted quality procedures.
Table 7.4 ESTABLISHMENT OF QUALITY CONTROL PROCEDURES
BY SAMPLE VENDORS* (%)
Formal Informal
Entirely yourself 77.3 91.7
With help of Principal 68.2 75.0
With help of Government or other agency 4.5 0.0 Source: Estimated from Survey Data. * Percentages exceed 100 percent because of multiple responses.
The types of quality control measures and the actual standards that are used to assure
quality by formal vendors are as follows:
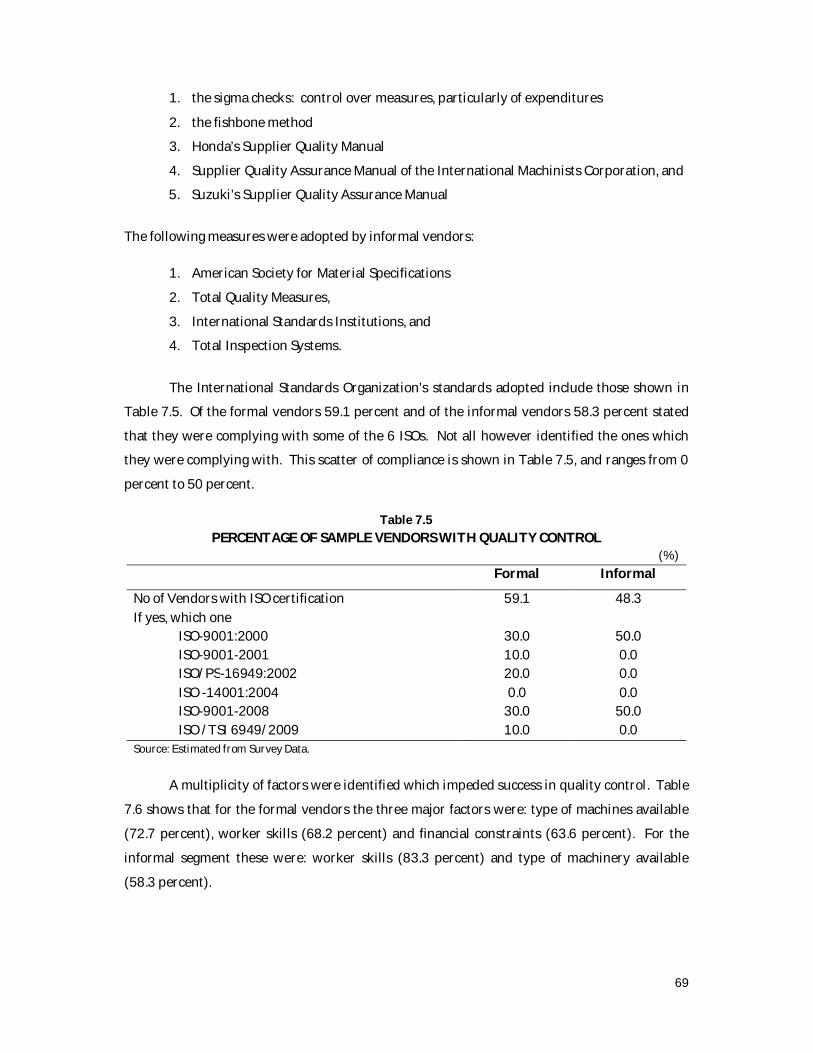
69
1. the sigma checks: control over measures, particularly of expenditures
2. the fishbone method
3. Honda’s Supplier Quality Manual
4. Supplier Quality Assurance Manual of the International Machinists Corporation, and
5. Suzuki’s Supplier Quality Assurance Manual
The following measures were adopted by informal vendors:
1. American Society for Material Specifications
2. Total Quality Measures,
3. International Standards Institutions, and
4. Total Inspection Systems.
The International Standards Organization’s standards adopted include those shown in
Table 7.5. Of the formal vendors 59.1 percent and of the informal vendors 58.3 percent stated
that they were complying with some of the 6 ISOs. Not all however identified the ones which
they were complying with. This scatter of compliance is shown in Table 7.5, and ranges from 0
percent to 50 percent.
Table 7.5 PERCENTAGE OF SAMPLE VENDORS WITH QUALITY CONTROL
(%)
Formal Informal
No of Vendors with ISO certification 59.1 48.3 If yes, which one
ISO-9001:2000 30.0 50.0 ISO-9001-2001 10.0 0.0 ISO/PS-16949:2002 20.0 0.0 ISO -14001:2004 0.0 0.0 ISO-9001-2008 30.0 50.0 ISO /TSI 6949/2009 10.0 0.0
Source: Estimated from Survey Data.
A multiplicity of factors were identified which impeded success in quality control. Table
7.6 shows that for the formal vendors the three major factors were: type of machines available
(72.7 percent), worker skills (68.2 percent) and financial constraints (63.6 percent). For the
informal segment these were: worker skills (83.3 percent) and type of machinery available
(58.3 percent).

70
Table 7.6 MAIN CONSTRAINTS TO IMPROVEMENT OF QUALITY
BY SAMPLE VENDORS (%)
Formal Informal
Financial 63.6 41.7
Skill level of worker 68.2 83.3
Type of machines available 72.7 58.3
Absence of technical support 31.8 41.7
Lack of technical support 27.3 41.7 Source: Estimated from Survey Data.
Therefore, there appears to be a general appreciation of the need for quality control in
the vending industry. However, standards of quality are lower among informal vendors who
supply more to the ‘replacement’ market for parts.
The overall conclusion is that while the formal sector, which has stronger links with
OEMs, has achieved a fairly high level of technology deepening, the informal sector is still using
low or intermediate technologies and producing simple parts mostly for the large ‘replacement
market’.
7.2. EXTENT OF COMPETITION
As mentioned earlier, the fortune of the autoparts industry is inevitably linked with the
performance of the automotive sector, its dominant customer. Thus, we need to put light on the
relationship of the vendors with the OEM. 60 percent of the auto part manufacturers produce
the auto parts first and then find the buyer for their products. The remaining 40 percent, mostly
formal vendors, first find buyers, the automotive manufacturer, for whom they produce later.
The OEMs usually have more than one auto parts manufacturer supplying them with the
same part. Thus the vendors’ share of supply of the
parts mostly falls between 10-40 percent. However
there are extreme cases where one auto part
manufacturer is the sole supplier of that respective
part, for example, Ruba Tech Manufacturer is the
sole supplier of door seals to Master Motors. Table
7.7 presents the vendors’ share of supply of parts
to the OEMs.
Table 7.7 VENDORS SHARE IN SUPPLY OF PARTS
% Formal Informal 0-20 27.3 66.7
21-40 40.9 16.7 41-60 13.6 8.3 61-80 4.5 8.3
81-100 13.6 0.0 Total 100.0 100.0
Source: Estimated from Survey Data.

71
Likewise, the auto part manufacturers do not necessarily sell to only one OEM. Formal
vendors are those manufacturers whose share of sales to OEMs is more than half. The average
share of sales by formal vendors to OEMs is 66 percent.
The extent of competition among informal suppliers to the retail parts market is quite
intense, with two-thirds of the sample reporting market share of less than 20 percent. In the
case of formal vendors, OEMs have avoided creating conditions of monopsony by diversifying
their sources of supply for most parts. This has increased their bargaining power with respect to
vendors.
On top of domestic competition, sales in the replacement market are not subject to strict
quality control standards, as determined by us through a survey of five autoparts dealers in
Lahore. In this market, consequently, local vendors face severe competition at the lower end of
the market from imported (or smuggled) parts from China and Taiwan. At the upper end of the
market, there is more competition from high-quality parts imported from Malaysia and
Thailand.
7.3. DEGREE OF COMPETITIVENESS
The key indicator of competitiveness internationally is the level of exports. For the
industry as a whole the total exports of parts stood at $10 million in 2009-10. Within the sample
of 34 vendors only 2 were actually exporters. Clearly, the possibility of exports exists primarily
in the case of formal vendors, who are making high quality supplies to OEMs using sophisticated
technology. But the limited size of the domestic market and generally low market shares of most
units have limited the possibilities of realisation of economies of scale. Looking forward, as the
industry expands, efforts must be made to expand relatively labour-intensive light parts, in
which Pakistan could acquire comparative advantage. Also, it is essential that OEMs face more
competitive pressure so that in turn vendors are motivated to achieve higher levels of cost
efficiency.
7.4. FACTORS INFLUENCING GROWTH
The sampled units were asked whether their output volumes increased over the last five
years and if so what were the factors impacting on growth. The six most important factors
contributing to growth are shown in Table 7.8. All of the vendors stated that the one of the main
factors which led to growth over the last five years was the increase in the level of orders from
their long-term relationship with their principals. The second highest level of response (91.2

72
percent) identified the diffusion of technology through the development of new parts (91.2
percent). The third most frequent response (50 percent) was for two factors leading to growth:
the first, the support of the principals in the form of technical support and quality assurance
measures in the development of new parts, more so by the formal vendors (54.5 percent) than
the informal ones (41.7 percent); the second was the increased market demand for replacement
parts.
Table 7.8 MAIN FACTORS* CONTRIBUTING TO SAMPLE VENDORS' GROWTH
(%) Formal Informal Increased orders from same principal 100.0 100.0
Increased orders from different principals 45.5 50.0
Increased market demand for autoparts 50.0 50.0
Development of new parts 86.4 100.0
Help by principals in development of new parts (Technical Support and Quality assurance ) 54.5 41.7
Source: Estimated from Survey Data. * Multiple responses were listed by respondents.
The major factors impeding growth were largely the same for both formal and informal
vendors, namely, planned and un-planned power outages, the level of customs duties and sales
tax on imported materials and components, and the law and order situation. In addition, formal
vendors identified the import of second hand cars as an impeding factor while informal vendors
highlighted the underinvoicing or smuggling of parts, especially from China.
7.5. THE ROLE OF GOVERNMENT REGULATION AND POLICIES
One of the key regulatory roles performed by agencies like EDB, Customs, Ministry of
Industries, etc., is for access to
concessionary SROs for imports. Table
7.9 indicates the extent of contact of
sample vendors with these agencies.
The units surveyed have also
indicated that it took them an average
of almost 20 days to clear goods from
the customs. Formal vendors took 25 days, while the informal ones took 9 days. Further, over
88 percent of the responding firms were registered with the Sales Tax Department of the FBR.
Table 7.9 GOVERNMENT AGENCIES APPROACHED
FOR APPROVAL OF IMPORTS (%)
Formal Informal Ministry of Industries 9.1 0.0 Engineering Development Board 36.4 41.7 Ministry of Commerce 4.5 16.7 Customs 45.5 41.7 Source: Estimated from Survey Data.

73
Overall, government regulations appear to have an ambiguous impact on growth. Some
helped growth, while others hindered. The responses (Table 7.10) indicate that only about 12
percent of the responses were positive with regard to impact of regulations. The regulations
which assisted in growth were identified as the ability to import on concessionary rates and tax
rebates on exports. The factors which adversely impacted on growth were not necessarily only
in the realm of regulations but extended to policy and modus operandi. These included energy
crisis, corruption, law and order situation, and a spectrum of Government policies. For instance,
on the issue of corruption some respondents stated that they bribed customs officials (at the
import stage), the police and officials of various government agencies.
Responding to questions on the type of
assistance required to help growth, vendors
surveyed emphasized the reduction in power
outages, a reduction in taxes and in the cost of
inputs. Formal vendors also suggested technical
support as another avenue. They requested for a
greater access to finance, while informal
vendors asked for more technical assistance.
The type of support required by the vendors
from the government is listed in Table 7.11.
Table 7.11 SUPPORT* REQUIRED FROM GOVERNMENT BY SAMPLE VENDORS TO PRODUCE
HIGHER TECHNOLOGY PRODUCTS
Formal Informal
1. Access to a technology upgradation fund established by SMEDA
36.4 41.7
2. Access to concessionary credit from the banking system 40.9 33.3
3. Establishment of a Centre for R&D in the auto parts sector 77.3 58.3
4. Access to training programmes in Computer Assisted Design and Production
59.1 41.7
5. Duty free imports of supporting machine tools 86.4 50.0
6. Sales Tax exemption on new technology intensive products 90.9 66.7
Source: Estimated from Survey Data. * multiple responses
Table 7.10 IMPACT OF GOVERNMENT REGULATIONS
ON GROWTH OF SAMPLE VENDORS (%)
Formal Informal
Helped 9.1 16.7
Hindered 90.9 83.3
Source: Estimated from Survey Data.

74
The contribution of power outages as a major factor constraining production is
described in the next section.
The most popular incentive asked for is sales tax exemption on new technology
intensive products, followed by duty free imports of machine tools for the sector. Other
innovative proposals include establishment and access to a technology upgradation fund with
SMEDA, establishment of centre for R&D in the auto parts sector, possibly with funding from the
Export Development Fund and access to training programmes in computer assisted design and
production through EDB/PIM. These measures could help, in particular, in achieving deletion
targets under the AIDP.
7.6. IMPACT OF POWER OUTAGES
As highlighted above, power outages have emerged also in the auto parts as one of the
principal constraints to production. Out of the sample, 91 percent of the units stated that they
were making up the short-fall through self-generation (Table 7.12). On the average they
estimated their daily production loss to be 5.4 hours. The reported volume of output lost on
average is 35 percent, while there was on average increase of 40 percent in the cost of
production. Clearly, power outages have emerged as a major factor restricting output and also
by increasing costs of production have reduced the level of competitiveness of the industry.
Table 7.12 IMPLICATIONS OF POWER OUTAGE
(%)
Formal Informal
No. of vendors who self-generate electricity 90.9 91.7 Average no. of lost hours of production daily 5 6 Average % reduction of output 35.3 33.6 Average % increase in unit cost 22.4 32.5 Source: Estimated from Survey Data.
In summary, the relatively high level of protection provided to the vending industry has
contributed to a high level of employment in the sector, but while there is fairly intense
competition within the industry, both domestically and from imports, the lack of competition in
the market for vehicles has implied less pressure for raising cost efficiency. The industry also
appears to be at a nascent stage, with very limited exports. The focus on enhancing
competitiveness will initially have to be in the ‘niche’ area of relatively labour-intensive parts
which are less technology based. The sample vendors have come up with some useful and
innovative proposals for support by government agencies and changes in policies to achieve a

75
higher level of technology deepening. These need to be seriously considered by agencies like
EDB, SMEDA and the Ministry of Industries.

76
Chapter 8 PAKISTAN’S TRADE IN THE AUTOMOTIVE SECTOR
We have discussed in the previous chapter the level of technology diffusion in the
autoparts sector, which consists mostly of indigenous units either in the formal or informal
sectors. OEMs, on the other hand, are mostly owned by MNCs and have access to latest
technologies and costs of production (at world prices) are dependent more on the extent of
economies of scale realised in the production process and/or on the extent of competitive
pressures.
We have also concluded in the previous chapter that a potential ‘niche’ where Pakistan
could be competitive internationally is in relatively labour-intensive parts manufactured with
low to intermediate technology.
The objective of this and the subsequent chapter is to focus on prospects for regional
trade in the automotive sector, especially with India. The following questions contained in the
TOR for Phase III of the study will be focused on:
What has been the volume and value of imports and exports of Pakistan over the last
decade and what is the potential market size?
What are the factors constraining the growth of exports and how can these be
overcome?
What are the implications of trade with India following the granting of MFN status?
Is there a potential for forming joint ventures with Indian entrepreneurs. If so, how will
these benefit Pakistan’s automotive industry?
To ensure sustainability of the industry what changes in protection policies are
required?
The Chapter is organised as follows: Section 1 gives data on the trade in the automotive
sector of Pakistan. Section 2 focuses on factors constraining growth of exports, based
particularly on the responses by the sample of vendors. Section 3 contains a list of suggestions
made by the respondents for support from the government for increasing exports.
8.1. TRADE IN THE AUTOMOTIVE SECTOR
We have already given the magnitude of total imports and exports of Pakistan in Table
2.9 and 2.10. Since 2000-01 upto 2010-11, imports have increased from $320 million to $905

77
million, implying and annual growth rate of 12 percent. In the same period, exports have gone
up from the marginal level of $7 million to about $126 million.
What is the composition of imports and exports according to the 4-digit level of the HS
code? This is given in Table 8.1.
Table 8.1 COMPOSITION OF PAKISTAN’S IMPORTS
AND EXPORTS OF AUTOMOTIVE PRODUCTS, 2009-10
HS Code No
Description Share (%)
Imports Exports
8701 Tractors 14.5 44.7
8702 Buses (10 or more persons) 6.3 -
8703 Cars 49.4 2.6
8704 Trucks & Vans 13.2 5.3
8705 Special Purpose Vehicles 1.3 -
8706 Chassis with Engines - -
8707 Bodies - -
8708 Parts and Accessories 7.0 21.1
8709 Works Vehicles 0.1 -
8710 Tanks & other Armoured Vehicles 0.4 -
8711 Motorcycles 6.2 21.1
8712 Bicycles - -
8713 Invalid Carriages - -
8714 Parts of Cycles 1.3 -
8715 Baby Carriage and Parts - 5.3
8716 Trailers and Parts 0.3 -
Total 100.0 100.0 Source: Export of Goods & Services 2010, SBP.
The major automotive imports consist of CBU/CKD cars, trucks and tractors. Parts and
accessories and motorcycles also account for significant share of imports. As opposed to this,
the base of exports is small and narrow, with emerging exports of tractors, autoparts and
motorcycles.
The origins of major Pakistani automotive imports are given in Table 8.2. Japan is
traditionally the largest supplier of the range of autoparts products given the domination of

78
Japanese MNCs in the domestic market. Emerging sources are Turkey in tractors, Singapore and
Thailand for cars and parts, South Korea in trucks and China in the case of motorcycles.
Table 8.2 ORIGINS OF MAJOR IMPORTS BY PAKISTAN
OF AUTOMOTIVE PRODUCTS SHARE (%)
Tractors (8701)
Cars (8703)
Trucks (8704)
Parts & Accessories (8703)
Motorcycles (8711)
Japan 41.1 56.4 54.2 41.3 67.3 USA - - 3.2 - - UK 7.8 - - 4.3 - UAE 12.7 - - - - South Korea - - 35.1 - - Singapore - 24.3 3.2 39.2 - Thailand - 17.1 - 10.9 12.2 Germany - 1.1 5.3 - China - - - 4.3 16.3 Turkey 16.7 - - - Others 21.7 1.1 1.0 - 4.2 Total 100.0 100.0 100.0 100.0 100.0 Source: Import of Goods & Services 2010, SBP. - indicates either no imports or small imports
We describe next the major destinations of Pakistan automotive exports. As shown in
Table 8.3, Pakistan has established a small market ‘niche’ in neighbouring country, Afghanistan,
and a SSARC partner, Bangladesh, for motorcycles; for tractors in African countries like Nigeria
and Kenya; and for parts in USA and Italy.
Table 8.3 DESTINATION OF MAJOR EXPORTS BY PAKISTAN
OF AUTOMOTIVE PRODUCTS, 2009-10 SHARE (%)
Tractors (8701)
Parts & Accessories (8708)
Motorcycles (8711)
Afghanistan 6.1 7.5 60.1 Bangladesh - 5.2 37.1 Kenya 13.1 - - Nigeria 32.0 - - Tanzania 7.8 - - UAE - 8.8 - USA - 16.9 - Italy - 17.3 - Others 41.0 44.3 2.4 Total 100.0 100.0 100.0 Source: Export of Goods & Services 2010, SBP.

79
8.2. FACTORS CONSTRAINING GROWTH OF EXPORTS
The survey of vendors revealed that almost 90 percent either did not feel capable yet of
entering the export market or were unaware of export possibilities. Similarly, OEMs are not so
motivated to export because of lack of competitiveness due to relatively low levels of
production and since high level of profits are already available from the domestic market.
In parallel to the structured questionnaire based survey of a sample of OEMs and
Vendors, a series of discussions were also held with CEOs of several manufacturers/assemblers
of vehicles and auto-parts manufacturers. During these discussions the factors inhibiting
exports were identified. One of the principal factors identified by both the vehicle and auto-
parts units was the absence of assistance by the Commercial Counsellor’s attached to Pakistan’s
diplomatic missions abroad and the Export Development Fund in identifying opportunities,
such as bulk public procurement opportunities in the developing countries, hosting road shows
using their own available resources and lack of skills in performing the task assigned to them. A
second major reason was cited as the lost opportunity in accessing technical assistance
available from international sources (such as, Association for Overseas Technical Scholarship
(AOTS)’s training program, the Japan External Trade Organization (JETRO)’s technical
assistance, and the Japan Overseas Development Corporation (JODC)’s engineer deployments)
for improving the quality of output and transiting from reverse-engineering processes to more
sophisticated processes. The high cost of production as a consequence of low productivity and
low rates of capacity utilisation exacerbated by the rapid decline in the Rupee’s exchange
convertibility rates was also identified as a major inhibiting factor.
Perhaps the most irritating factor identified was the refund of domestic and import
input taxes paid on exported goods. Delays of up to three months or more were cited. This
leads to a shortfall in working capital and thus impacts on output through the inability to
finance inventory replenishment. In a recent report (2009)10 the Pakistan-Japan Business
Forum states “If the competitiveness (cost and quality) of cars and automotive parts made in
Pakistan were improved, the potential for export to other countries would emerge and Pakistan
would conceivably have a valuable future”.
10 Pakistan-Japan Joint Study Group; 2009; Vision 2030 Pakistan; Pakistan-Japan Business Forum; Karachi.

80
8.3. REQUIRED SUPPORT
In terms of export promotion, we have already identified in the previous Chapter the
suggestions made by vendors to raise their technological capability and thereby make them
more competitive in international markets. Suggestions include the setting of a Technology
Upgradation Fund by SMEDA, establishment of a R&D Centre for the automotive sector and
fiscal incentives for investment in new products.
Vendors were also asked on which areas they need more support. The responses are
given in Table 8.4, according to which most support is required in improving quality and
achieving cost reductions, followed by easier access to the banking system.
Perhaps a role model for the sector is the intense competition in the domestic market for
motorcycles, especially from relatively cheap Chinese makes, has raised the cost efficiency of
domestic units, such that they can begin
to make a foray into foreign markets.
The same could be happening in some
autoparts.
The conclusion is that the
automotive sector of Pakistan is still at a
relatively early stage of development.
Dependence on imports remains high
and exports have only commenced in
some products with relatively small volumes. If exports are to increase manifold, the AIDP will
need to be extended upto 2020 and implemented much more vigorously.
Table 8.4 SUPPORT REQUIRED* FOR ESTABLISHING
EXPORT MARKET (%)
Formal Informal Financial (access to credit) 50.0 16.7 Improvement of quality 54.5 66.7 Cost reduction 59.1 58.3 Changes in job regulations 31.8 16.7 Support from the principal 31.8 33.3 Support from TDAP 18.2 41.7 Source: Estimated from Survey Data. * multiple responses

81
Chapter 9 PROSPECTS FOR INDO-PAK TRADE
A milestone in the context of development of regional trade in South Asia is the granting
of MFN Status to India by end 2012. This will, no doubt, contribute to an increase in Indo-Pak
trade. Various authors including Amit Batra (2004), Ishrat Hussain (2011), A.R. Kemal (2002),
Mohsin Khan (2009), Ijaz Nabi and Anjum Nasim (2001), State Bank of Pakistan (2005) and
Asad Sayeed (2005) have all concluded, by adoption of different approaches, that the potential
volume of trade is a large multiple of the present volume of trade.
Beyond the impact on the overall level of trade there is a need for analysing the
consequences of opening up of trade at the micro level, on individual sectors. The SBP (ibid)
includes an impact assessment on some key sectors of the economy of Pakistan, including
automobiles. The report says
‘Compared with Pakistan, India has a strong engineering base and has successfully created a sizable capacity for production of vehicles. It enjoys a clear edge over Pakistan in the automobile sector. Indian auto companies are highly cost competitive due to appropriate levels of automation and low cost automation and have achieved a high level of productivity by embracing Japanese concepts and best practices. India is already the second largest two wheeler manufacturer in the world, second largest tractor manufacturer in the world, and fifth largest commercial vehicle manufacturer in the world and fourth largest car market in Asia. The automobile industry in India is now evolving to replicate those of developed countries.’
However, the SBP report was published six years ago and the automotive sector in both
countries has witnessed considerable growth and structural transformation. Also, there is now
the imminent prospect of the granting of MFN status to India, which from the beginning of 2013
will remove all restrictions on trade with India.
Therefore, the objective of this chapter is to undertake an in-depth analysis, on the basis
of latest data available, on the prospects of trade in the automotive sector between India and
Pakistan following the opening of trade.
The Chapter is organized as follows: Section 1 describes the automotive sector of India.
Previous chapters have already profiled the automotive sector of Pakistan and its state of
development. Section 2 highlights the restrictions that are present currently in trade with India
in the sector. Section 3 undertakes an analysis of the extent of trade complementarity in the
sector between the two countries. Section 4 identifies the potential level and pattern of trade. In
Section 5 we present the findings of our survey of OEMs and vendors on their perception of

82
risks/potential of trade with India. Section 6 highlights some implications of the growth in
trade. Finally, in Section 7, we present some policy implications on managing the process of
liberalization in order to avoid any ‘injury’ to the automotive sector of Pakistan.
9.1. THE AUTOMOTIVE SECTOR OF INDIA
The automotive sector of India is large with considerable economies of scale. It is
technologically sophisticated and is able to export large volumes of diverse automotive products
to a large number of countries. We first highlight the growth in the volume of trade of India in
the automotive sector in Table 9.1.
Table 9.1 VOLUME OF TRADE IN THE AUTOMOTIVE
SECTOR OF INDIA ($ Million)
Exports Imports Balance 2000-01 932 322 610 2005-06 3293 1021 2272 2010-11 11301 4177 7124
Source: Department of Commerce, Ministry of Commerce & Industry, Government of India (http://commerce.nic.in/eidb/default.asp)
Exports of India of automotive products have shown phenomenal growth during the last
decade, crossing $11 billion by 2010-11. Today, these exports account for almost 5 percent of
total Indian exports. Currently, India enjoys a trade surplus of over $7 billion in the sector.
According to WTO, India is the 12th largest exporter globally of automotive products.
Table 9.2 shows that in terms of total production of automobiles, India is ranked sixth in
the world at almost four million vehicles. In fact, India now produces more cars than the USA,
where the automobile industry originated. Also, the level of output of India is about twenty
times that of the Pakistan.

83
Table 9.2 AUTOMOBILE PRODUCTION STATISTICS BY COUNTRY
2011 (000)
Cars Commercial Vehicles Total Ranking
China 14485 3934 18419 1
USA 2966 5687 8653 2
Japan 7158 1240 8398 3
Germany 5871 439 6310 4
South Korea 4221 435 4656 5
India 3054 882 3936 6
Brazil 2534 872 3406 7
Mexico 1657 1022 2680 8
Spain 1819 534 2354 9
France 1931 364 2294 10
Others
Indonesia 562 276 838
Iran 1413 235 1648
Thailand 550 929 1479 Source: Production Statistics 2011, OICA (oica.net/category/production-statistics/)
The trends in production of different types of vehicles in India are given in Table 9.3.
During the last decade, the Indian automobile industry has shown phenomenal growth,
especially in cars. This is one of the key sectors which has contributed to the fast growth of the
Indian economy. India is viewed as one of the fastest growing countries in the world in
automobile production.
Table 9.3 INDEX OF PRODUCTION OF VEHICLES IN INDIA
(1990-91 = 100)
Commercial Vehicles
Cars, Jeeps and Land Rovers
Motorcycles and Scooters
1990-91 100.0 100.0 100.0
2000-01 240.5 286.3 203.8
2009-10 389.0 1057.6 570.3
Annual Growth Rate (%)
1990-91 to 2000-01 9.2 11.0 7.4
2000-01 to 2009-10 5.5 15.6 12.1 Source: Author’s Estimates using numbers from IES.

84
We turn next to the composition of India’s trade at the 4 digit level of the HS code. The
shares are given in Table 9.4. India has a very diversified range of exports of cars (49 percent),
parts and accessories (19 percent), trucks and vans (10 percent), motorcycles (7 percent),
tractors (5 percent) and buses (4 percent).
Within the region, significant exports are to Sri Lanka, Bangladesh and Nepal. Major
export markets in East Asia are Indonesia, Thailand and Philippines. India has also penetrated
the African market with exports to Nigeria and Egypt, and to countries in Latin America
including Chile, Argentina and Peru. This is in addition to the traditional markets in Europe and
the USA.
Table 9.4 COMPOSITION OF INDIA’S EXPORTS
AND IMPORTS OF AUTOMOTIVE PRODUCTS, 2010-11
HS Code No
Description Share (%)
Exports Imports
8701 Tractors 5.2 -
8702 Buses (10 or more persons) 4.2 -
8703 Cars 48.5 13.9
8704 Trucks & Vans 10.2 1.9
8705 Special Purpose Vehicles 0.4 0.6
8706 Chassis with Engines 1.7 0.3
8707 Bodies - -
8708 Parts and Accessories 19.1 71.4
8709 Works Vehicles 0.2 -
8710 Tanks & other Armoured Vehicles - -
8711 Motorcycles 7.3 -
8712 Bicycles 0.3 1.0
8713 Invalid Carriages - -
8714 Parts of Cycles 2.6 9.3
8715 Baby Carriage and Parts - -
8716 Trailers and Parts 0.2 1.5
Total 100.0 100.0 Source: Department of Commerce, Ministry of Commerce & Industry, Government of India
(http://commerce.nic.in/eidb/default.asp)

85
Imports, on the other hand, are largely concentrated in autoparts and accessories (71
percent) and cars, mostly specialised and luxury makes. Therefore, the Indian automobile
industry is not only largely self-reliant but has acquired the capability to make large exports of a
wide range of automotive products.
9.2. EXTENT OF TRADE COMPLEMENTARITY
In order to examine the potential of trade between India and Pakistan we derive the
Index of Trade Complementarity (ITC) between the two countries. This index is measured as
follows:
퐼푇퐶 = 1− 0.5 푚 − 푥 … … … … (1)
where
ITCij=Trade Complementarity Index between countries i and j
mhi= share of good h in total imports of country i
xhj = share of good h in total exports of country j
ITCij is zero when no good exported by one country is imported by the other. It equals one when
the one country’s imports correspond exactly to those of the other’s exports. Therefore, the
higher the magnitude of ITCij the greater the trade complementarity.
We first derive the index between Pakistan’s imports and Indian exports of automotive
products at the 4 digit level of HS code. The calculations are presented in Table 9.5. The index of
trade complementarity is high at 0.836. Potential imports of Pakistan from India include the
following:
8701 Tractors
8702 Buses
8703 Cars
8704 Trucks and Vans
8708 Autoparts and Accessories
8711 Motorcycles
Therefore, all major imports of Pakistan could potentially be obtained from India. This is, of
course, subject to opening of trade and, second, the extent of competitiveness of Indian products
in the domestic market of automotive products in Pakistan.

86
Table 9.5 INDEX OF TRADE COMPLEMENTARITY BETWEEN PAKISTAN’S IMPORTS AND INDIAN EXPORTS OF AUTOMOTIVE PRODUCTS
mhi xhj 풎풉풊 − 풙풉풋
8701 0.145 0.052 0.093
8702 0.063 0.042 0.021
8703 0.494 0.485 0.009
8704 0.132 0.102 0.030
8705 0.010 0.003 0.007
8706 0.000 0.016 0.016
8707 0.000 0.000 0.000
8708 0.070 0.191 0.121
8709 0.000 0.002 0.002
8710 0.000 0.000 0.000
8711 0.062 0.073 0.011
8712 0.000 0.003 0.003
8713 0.000 0.000 0.000
8714 0.013 0.026 0.013
8715 0.000 0.000 0.000
8716 0.000 0.002 0.002
Total 1.000 1.000 1.000
퐼푇퐶 = 1 −12
(0.328) = 0.836
Source: Authors’ calculations from; Source: Import of Goods & Services 2010, SBP. Department of Commerce, Ministry of Commerce & Industry, Government of India
(http://commerce.nic.in/eidb/default.asp)
We calculate next in Table 9.6 the extent of complementarity between Indian imports
and Pakistani exports.
The index of trade complementarity between Indian imports and exports from Pakistan
is low at the level of 0.268. The potential for exports appears to be primarily in autoparts (HS
code 8711).

87
Table 9.6 INDEX OF TRADE COMPLEMENTARITY BETWEEN INDIAN’S
IMPORTS AND PAKISTAN’S EXPORTS OF AUTOMOTIVE PRODUCTS
mhi xhj 풎풉풊 − 풙풉풋
8701 0.000 0.447 .447
8702 0.000 0.000 0.000
8703 0.139 0.026 0.113
8704 0.019 0.053 0.034
8705 0.006 0.000 0.006
8706 0.003 0.000 0.003
8707 0.000 0.000 0.000
8708 0.714 0.211 0.503
8709 0.000 0.000 0.000
8710 0.000 0.000 0.000
8711 0.000 0.211 0.211
8712 0.001 0.000 0.001
8713 0.000 0.000 0.000
8714 0.093 0.000 0.093
8715 0.000 0.053 0.053
8716 0.015 0.000 0.000
Total 1.000 1.000 1.000
퐼푇퐶 = 1 −12
(1.464) = 0.268
Source: Authors’ calculations from; Source: Import of Goods & Services 2010, SBP. Department of Commerce, Ministry of Commerce & Industry, Government of India
(http://commerce.nic.in/eidb/default.asp)
9.3. LIKELY PATTERN OF INDO-PAK TRADE
The scope for trade in the automotive sector between India and Pakistan has not
materialised because of restrictions imposed historically by Pakistan. The Positive List of
imports from India virtually ruled out the possibility of significant supply, albeit cheaper, from
India. Section XVII on Vehicles & Transport Equipment of the HS, which includes chapters 86 to
89, has 245 tariff lines. The Positive List included only 15 tariff lines from Section XVII, and that
too items of only marginal importance.

88
Even now, the recently finalised Negative List of imports includes as many as 198 items.
Therefore, even though the general scope for trade with India has expanded greatly, following
the transition from the Positive List to the Negative List, this is not the case in automotive
products. If the Negative List is fully withdrawn on 31st December 2012 and MFN status given
to India, then the prospects for trade could improve greatly.
The analysis of trade complementarity in the sector undertaken in the previous section
has revealed that there is a close match between Pakistani imports and Indian exports.
Therefore, the scope of ‘trade diversion’ to India are large.
But given the present level of import tariffs on automotive products in Pakistan will
Indian products be able to compete in the domestic market? Table 9.7 derives the likely landed
prices of Indian products given the f.o.b. export price currently plus cost of insurance and freight
plus duties and sales tax. It appears that Indian exports are competitive in a number of items,
including the following:
Cars 1000cc – 1500cc
Cars ≥ 1500cc
Goods vehicles < 5 tons
Landed prices are close to domestic prices in the case of the following items:
Buses AC > 13 persons
Cars < 1000cc
Motorcycles 75-250cc
Therefore, the actual outcome will depend upon the extent to which Pakistani producers are
willing to reduce their prices in the face of competition from India and/or Indian suppliers’
motivation to reduce their prices somewhat to penetrate the Pakistani market. We have the
clear conclusion that at the present level of import tariffs, Pakistani manufacturers are barely
competitive with Indian exports in many automotive products.
9.4. PERCEPTIONS OF TRADE WITH INDIA
During our interviews of OEMs and vendors we asked questions from respondents their
perceptions about the opening of trade with India and whether they see this as a positive or
negative development. The results are as follows:

89
Negative % Response*
Low cost Indian manufacturers enjoying economies of
scale could enter the market and drive local producers
77
Positive
Opening up of the possibility for joint production or
franchises
47
A fast growing market will open up for exports 47
* including multiple responses
Table 9.7 LANDED PRICES OF ‘POTENTIAL’INDIAN EXPORTS OF AUTOMOBILE
PRODUCTS TO PAKISTAN ANDDOMESTIC PRICES price f.o.b.
of exports from India
($)
price cif of imports at
border*
($)
duty + sales tax
paid price
($)
price in Rs
(Rs)
(000)
price of Local Vehicle (with
sales tax) (Rs)
(000)
Tractor 8474 9321 9321 839 h.c.
Buses AC and for more than 13 persons
41012 45113 62727 5652 5500g
Three wheeled vehicles 1447 1592 2493 224 175h
Car
< 1000cc 4855 5340 9292 836 826a
1000cc - < 1500cc 7001 7701 14293 1286 1419b – 1571c
≥ 1500cc 9337 10270 19061 1715 1908d – 1882d
Goods Vehicles < 5 tons 4540 4994 9269 834 1
1106e Motorcycles
75cc – 250cc 615 676 1295 117 114f Source: Authors’ own calculations. aDiahatsu Cuore, bHonda City, cToyota Corolla, dHonda Civic, eHonda CG-125, fMaster Highland, gHino, hSazgar * 10% is the cost of insurance and freight ** The relative competitiveness of Indian products has been enhanced by the 14.2 percent devaluation of the Indian rupee as compared to 5.7 percent in the case of the Pakistani rupee since July 1, 2011.
Therefore, on balance the industry appears to be more apprehensive about opening up
trade in automotive products with India. It is, however, the case that almost half the sample sees
the positive challenge of accessing a much bigger market, especially if the trade-related
infrastructure improves between the two countries, trade is facilitated and India does not apply

90
some non-tariff barriers more intensively on Pakistani products. It is also reassuring that a large
proportion of the sample sees prospects for joint ventures down the road, leading to greater
intra-industry specialisation.
It also needs to be stated that the analysis of trade complementarity focuses only on
‘trade diversion’, in which India performs better, but full liberalization of trade could also lead
to some ‘trade creation’. Over time, Pakistan may be able to create a market, for example, for
products like low horsepower (below 75cc) motorcycles which are very competitively priced in
Pakistan and for various autoparts and accessories and light tractors.
Also, the emergence of a large trade imbalance with India, generally or in the automotive
sector, is not necessarily a bad outcome, if it means cheaper imports and a saving in the overall
import bill. Also, importantly, there could be significant consumer welfare gains if cheaper
Indian imports substitute for more expensive imports from existing sources. This could happen,
for example, if autoparts from India of comparable quality are available as opposed to more
expensive imports from countries like Japan or Thailand. This will lead to a decline in domestic
costs of production. Further, in the presence of Indian imports, the high profits of many OEMs
who currently operate in quasi-monopolistic markets, as discussed in Chapter 5, will come
under pressure to reduce prices and bring profits down to more reasonable levels. If this
happens, particularly in the case of buses and trucks, then this will benefit majority of the
population.
9.5. POSSIBLE MITIGATION MEASURES
The survey respondents, both OEMs and vendors, were also asked what measures are
required to protect the automobile industry from possible ‘serious injury’ from Indian imports,
as contained in WTO and SAFTA* provisions.
The proposals put forward are as follows:
% of responses 1) Develop standards to ensure import only of quality products (especially
parts) from India 59
2) Reduce tariffs on imported sub-assemblies and sub-components 56 3) Raise tariff on indigenized parts and domestically produced vehicles 53 4) Put Indian imports on the Negative List 41 5) Strengthen valuation and anti-dumping mechanism 38 * Chapter 87 is mostly included in the Sensitive List of Pakistan in SAFTA to avoid any reduction in tariffs in the automotive sector.

91
It is significant that a minority of respondents, albeit large, have not demanded that the
Negative List should be continued and automotive products put for a longer period in this list.
This would effectively deny India MFN status and led to a loss of the goodwill that has been
generated in bilateral relations. India has agreed to some major steps like rationalization of
quality regulations and procedures for customs clearance, alongwith opening of more
integrated check posts (like at Attari-Wagah) to facilitate movement of consignments by land
routes. More recently, permission has been granted for investment by Pakistanis in India. Down
the road, more steps at facilitation of trade may be forthcoming from India. All these steps auger
well for the greater access generally of Pakistani exports to the Indian market.
The other proposals, (1), (2) and (5), are worthy of consideration. In the case of non-
indigenized parts, the concessionary SRO may be withdrawn and the statutory rate brought
down to the present concessionary rate for some time and the processing of import quantities
by EDB, which is effectively a return of the licensing regime, be discontinued.
As far as quality standards are concerned, these should definitely be strengthened,
especially in the case of autoparts. The replacement market is already flooded with sub-
standard parts, both domestic and imported. These practices need to be curbed through more
effective regulation, either by federal or provincial agencies.
There is definitely a strong case for strengthening valuation and anti-dumping
mechanisms. The problem of underinvoicing of parts, in particular, has acquired serious
proportions. This may necessitate a return to the International Trade Price (ITP) system or the
use of specific duty on some items, including autoparts and other automotive products. In
addition, the existing laws on Safeguards and Anti-Dumping need to be reviewed. The National
Tariff Commission must have greater capacity to review a larger number of cases and impose
counterveiling duties wherever necessary.
Finally, we come to the issue of enhancement of tariffs, as mentioned in proposal (3)
above. In Phase I of the Study, prior to the granting of MFN status of India, we had
recommended in Chapter 4 that the maximum tariff be brought down to 35 percent by 2016-17,
to induce greater competition in the industry for the benefit of consumers. Given apprehensions
about the potential wide ranging competition from Indian exports in the automotive sector, we
suggest that for the year, 2012-13, the present tariff rates largely be left unchanged. A
subsequent review may be conducted after an assessment is made of the actual impact on the
industry following the granting of MFN status to India and the resulting expansion of trade.

92
Chapter 10 CONCLUSIONS AND RECOMMENDATIONS
10.1. CONCLUSIONS
The automobile sector in Pakistan has developed over five phases since the mid-50s and
has now become a multi-billion rupee industry, with over 2,000 O&Ms and vendor units (formal
and informal), manufacturing/assembling a range of products from the simplest of parts to the
precision engineered steering knuckles and employs up to 500,000 persons. Studies undertaken
in the recent past have found that the sector is still moderate in size and has not acted fully as a
catalyst for promoting broad-based manufacturing sector growth. The underlying causes of this
state of affairs straddle the spectrum of the enabling framework (institutional, managerial,
human resources, financial and government policy) needed to achieve greater efficiency,
competition, competitiveness and productivity. The industry uses somewhat obsolete or out-
dated technology and the level of locally produced inputs (deletion) ranges from a low of 5
percent in the case of some makes of cars to 100 percent in the production of tractors, motor-
cycles and three-wheelers. Proliferation in the number of vendors may be attributed to the
deletion programme. Foreign competition is discouraged by policy and allows for small,
inefficient yet profitable domestic automobile producers.
The CMI 2005-06 estimated the value added by the automotive sector (mostly OEMs) as
6 percent of the large scale manufacturing sector, with employment at over 28,000 persons (3.1
percent of LSM). SMEDA in 2005 estimated that the foreign exchange savings by the sector
(including OEMs and vendors) amounted to US$ 1.2 billion and that total employment was of
the order of 500,000 people with a value addition of over Rs. 150 billion. Its contribution to tax
revenues was about Rs 51.5 billion.
The current number of operative units in the automotive sector is eight active car
manufacturers, 68 manufacturers of motorcycles, 65 are members of APMA and three of PAMA.
There are 6 units producing trucks/buses, four of which are members of PAMA. PAPAM has a
membership of 292 organisations and there are an estimated 1,900 units in the informal
vendors sub-sector. All of the PAMA manufacturers/assemblers have technical collaboration
with mainly Japanese/Korean companies. Only a few of the licensed vendors have such
agreements with international companies, again largely from Japan and Korea. The utilisation
of capacity in 2010 ranged from a low of 40 percent for trucks/buses to over 110 percent for
tractors. The capacity for production of cars is over 279,000 annually, while the rate of capacity
utilisation in 2010 was below 44 percent. Therefore, a significant margin of excess capacity

93
exists in this sub-sector even on a single-shift basis and potential economies of scale do not
appear to have been exploited sufficiently. Over the last five years the production of trucks and
buses has declined to under half the output in 2005-06. While part of this may be the
consequence of economic stagnation, this also reflects the competition provided through the
import of second-hand CBU trucks and buses, and the import of old chassis (declared and
assessed as scrap) of concrete mixers, dump trucks and other construction related ORVs and
their subsequent conversion to rigid 2- and 3-axle rigid trucks. These sell in the market for Rs.
800,000 to Rs. 1.5 million. Some of these are then converted to buses.
The total value of output by the sector has been estimated to be Rs. 233 billion (US$ 2.8
billion) for the OEMs and Rs. 168 billion (US$ 2.0 billion) for the Vendors (formal and informal).
Total imports by the sector in 2010-11 are reported at US$ 905 million of which CBU/CKD
import of vehicles was US$ 757 million. Exports by the sector in the same year were a total of
US$ 126 million and US$ 108 million worth of transport equipment. Other key parameters of
the sector’s size and performance in 2009-10 are summarised as follows:
Turnover Rs. 402 billion
Employment 209,324
Value Added Rs. 108 billion (4.8% of Manufacturing, 0.7% of GDP)
Exports US$ 89 million
Imports US$ 835 million
Value of Cumulative Investment US$ 2.8 – 3.0 billion
Foreign Exchange Savings US$ 704 million
Contribution to Revenues Rs. 61.8 million
The results of the demand analysis indicate the following:
(i) The short-term income elasticities are generally high, ranging from 2.75 to almost 4.
This implies that fluctuations in the growth of real per capita income in the economy
have a magnified effect on demand for vehicles.
(ii) The elasticities with respect to relative price of vehicles are low. This could explain
the aggressive pricing policy, especially in the case of cars.
(iii) The elasticities with respect to interest rate are significant and moderately high. The
explosive growth of sales in the middle of the last decade can be partly attributed to
the steep fall in interest rates on advances from over 14 percent to just over 7
percent and the increased availability of consumer financing by banks

94
The sector is governed by a number of international conventions and treaties which it
has ratified, but has implemented only one, the WTO’s TRIMS as a consequence of which it
abandoned the deletion programme by mid-2003. The domestic regulatory framework consists
several policies and regulations: the Industrial Policy,1977; the Privatisation Policy, 2000; the
Trade Policies, 2009; the Finance Acts which modify the fiscal and tariff regime backed by the
Statutory Rules and Orders (SROs) and the Customs General Orders (CGOs) which are modified
from time to time; the Auto Industry Development Programme (AIDP); the Tariff Based Scheme
(TBS) which ensures compliance to the WTO-TRIMs; the Pakistan Standards governing the
sector and implemented through the Pakistan Standard Quality Control Authority (PSQCA); and
the National Environmental Quality Standards (NEQS) which governs vehicular exhaust
emissions. The Import Policy Order 2009 includes a negative list forbidding imports of
automotive products from India and allows for the import of second hand motor vehicles
(which is misused for commercial quantities) and scrap (used for importing old chassis of
ORVs). Cumulatively they impede competition, technology acquisition and dispersal, and lead
to monopolistic behaviour. The absence of skills and equipment with the MVEs results in plying
unfit and unsafe vehicles on roads.
The conclusions emerging from the ERP estimates are:
(v) If domestic prices fully reflect tariffs, then the ERPs are generally high. They range from
98 percent for small cars (800cc) to as high as 374 percent for large cars (above
1500cc). This is a reflection of the very high customs duty of 75 percent on large cars.
The ERPs come down sharply to between 35 percent and 113 percent for cars with the
second set of assumptions.
(vi) The ERP on parts ranges from 32 percent to 78 percent depending upon the particular
set of assumptions.
(vii) The ERP on motorcycles is extremely high at 196 percent under the first set of
assumptions and falls to 76 percent if in the presence of intensive competition in this
market the domestic price remains somewhat below the world price plus tariff.
(viii) In the case of trucks there appears to be a large differential between the ERPs for small
and large vehicles respectively.
The measure most commonly used by regulatory agencies to assess degree of
competition is the Herfindahl–Hirshman Index, HHI, which in essence is a measure of the shares
of all competing organisations in any particular segment or product. The lower the value of the
index, the greater is the competition. For most market regulators, including the CCP, the
threshold is considered to be an index value of 1800. There are three producers in the large car

95
category, namely, Honda, Toyota and Suzuki, with Toyota having the largest market share of 67
percent. The HHI value is high at 4728, well above the threshold level of 1800. In 1000cc cars,
Suzuki dominates the market, leading to a HHI of as high as 9090. In the 800cc category, there
are two car manufacturers and the HHI is also high at 6924.Further, market shares of individual
manufacturers have not changed substantially over time. Also, there has been very limited entry
into the car market. Nissan and Kia did enter in the 1300cc – 1600cc group earlier but have
since ceased production.
There is evidence of lack of innovation in terms of changes in models, quick availability,
fuel efficiency, increase in user efficiency and cost cutting. A key indicator of the lack of
competition is late deliveries and high premium payments even in the presence of substantial
excess capacity. The high prices of cars is demonstrated by the high ratio of prices to average
household income, which places Pakistan in the lowest decile of countries in terms of
affordability of cars. Some competition has been introduced through the removal of the
requirement for obtaining licenses for investing in the automobile sector, the import of CKD
cars at the same rate, 35 percent, as auto parts, 50 percent initial depreciation allowance, 100
percent foreign equity and full remittance of profits and low customs duty of 5 percent on
imported plant and machinery. Further, import of used and reconditioned cars has been
liberalized, but only under gift, personal baggage schemes and transfer of residence (which is
grossly abused), but this policy has been revised year-to-year, especially with regard to
provisions for depreciation.
The survey of 34 vendor units (formal and informal) reveals that employment in formal
units is on the average almost thrice that of informal units and, given the technological nature of
the industry, the major part of the employment is of managerial and supervisory personnel and
skilled workers. Labour productivity is about 72 percent higher in formal vendor units. Further
from the sample of vendors we conclude that the bulk of the units, both formal and informal, are
private limited companies; there is wide variation in size of units; fairly high level of capital-
intensity as demonstrated by relatively labour productivity; high share of material and
electricity costs and reasonably high gross profit margins. Also, formal units perform
significantly better than informal units both in terms of size and profitability.
While many of the licensed vendors supply only to OEMs, some sell their products in the
replacement market clandestinely. These vendors manufacture (88 percent), or some assemble
(17 percent) sophisticated parts. Of the sample 41 percent of manufacture subparts, while 64
percent manufacture the assemblies and components. The production processes for different
parts are a mixture of different processes. The main processes involved in the manufacturing of

96
auto parts (Table 7.2) and span the spectrum from metal working to precision machine tooling.
The most commonly reported production process is sheet metal fabrication which is in use by
20 firms, followed by 12 firms using die-stamping and 10 engaging in production of moulds.
Quality is monitored through OEM supervision, technical assistance and self-induced
mechanisms including skill development and acquisition of production technology and
equipment. Government help in upgrading quality is marginal (only 4.5 percent responded
positively). 59.1 percent had ISO certification in one form or another. An OEM may have more
than one supplier for a specific part/component/assembly thus ensuring “quasi” competition.
One instance of a sole supplier to the industry at large is Rastgar Engineering’s steering
knuckles which are also exported. Some vendors also sell to more than one OEM.The major
constraints to improving quality are the availability of appropriate machines and skills of labour
in both the formal and the informal sectors. Shortage of finances also impedes, but not to as
great an extent. The overall conclusion is that while the formal sector, which has stronger links
with OEMs, has achieved a fairly high level of technology deepening, the informal sector is still
using low or intermediate technologies and producing simple parts mostly for the large
‘replacement market’.
Growth in the sector is attributed to a number of factors. The two main ones being the
increase in demand placed by the OEMs/market and an expansion in the number of parts
produced by individual vendors. Government regulations have an ambiguous impact on
growth. Only 12.0 percentof the responses reported positive impacts - ability to import on
concessionary rates and tax rebates on exports. The adversely impacting factors were not
necessarily only in the realm of regulations but extended to policy and modus operandi. These
included energy crisis, corruption, law and order situation, and a spectrum of Government
policies, such as, payment of bribes to customs officials (at the import stage), the police and
officials of various government agencies. The majority stated that exemption from sales tax on
new technology products, duty free imports of supporting machine tools and access to new
technology through R&D and SMEDA’s technology development fund would contribute to
growth substantially. Over 90 percent of the formal sector generated their own electricity to
overcome power outages which reduce output by about a third and increases costs by 22
percent and 33 percent in the formal and informal units.
The major automotive imports consist of CBU/CKD cars, trucks and tractors. Parts and
accessories and motorcycles also account for a significant share of imports. As opposed to this,
the base of exports is small and narrow. Given its dominance in the fleet of vehicles on road,
Japan is traditionally the largest supplier of the range of auto-parts products. Emerging sources

97
are Turkey in tractors, Singapore and Thailand for cars and parts, South Korea in trucks and
China in the case of motorcycles. Pakistan has established a small market ‘niche’ for motorcycles
in two SAARC countries, Afghanistan and Bangladesh; for tractors in African countries like
Nigeria and Kenya; for and for auto-parts in USA and Italy.
The imports are controlled by the framework of the Import Policy Order 2009 which
requires that the EDB certify the level of imports by any manufacturer. This certification allows
the importer-manufacturer to avail the preferential rates of customs duty. In effect this is a
method of licensing which is against the very essence of the Tariff Based Scheme. In the
presence existing documentation of the authorised level of installed production capacity, there
is no justification for such certification. Therefore, this requirement for certification, either
directly or indirectly, by the EDB should be removed immediately to encourage greater capacity
utilisation, thereby lowering prices and increasing competition.
Pakistan has a very small share in the world trade in the automobile sector. The factors
constraining the growth of export were cited during the survey as inability to enter the export
market, lack of awareness of export possibilities, lack of motivation to export owing to un-
competitiveness as a consequence of low levels of production and high level of profits from the
domestic market. Parallel discussions with a sample of CEOs identified other factors also. The
major ones were: firstly, the absence of assistance by the Commercial Counsellor’s attached to
Pakistan’s diplomatic missions abroad and the Export Development Fund in identifying
opportunities, such as bulk public procurement opportunities in the developing countries,
hosting road shows using their own available resources and lack of skills in performing the task
assigned to them; secondly, the lost opportunity in accessing technical assistance available from
international sources for improving the quality of output and transiting from reverse-
engineering processes to more sophisticated processes; thirdly, high cost of production as a
consequence of low productivity and low rates of capacity utilisation exacerbated by the rapid
decline in the Rupee’s exchange convertibility rates was also identified as a major inhibiting
factor; and fourthly, perhaps the most irritating factor, the delays in refund of domestic and
import input taxes paid on exported goods, which impacts working capital and thus on output
through the inability to finance inventory replenishment. In a recent report (2009)11 the
Pakistan-Japan Business Forum states “If the competitiveness (cost and quality) of cars and
automotive parts made in Pakistan were improved, the potential for export to other countries
would emerge and Pakistan would conceivably have a valuable future”.
11 Pakistan-Japan Joint Study Group; 2009; Vision 2030 Pakistan; Pakistan-Japan Business Forum; Karachi

98
Pakistan is set to granting MFN status to India by end 2012. This will, no doubt,
contribute to an increase in Indo-Pak trade. Various authors have all concluded, by adoption of
different approaches, that the potential volume of trade is a large multiple of the present volume
of trade. Little attention has, however, been given to trade at the micro-level. The State Bank in
its report suggest that the Indian automobile sector enjoys some considerable advantage over
Pakistan’s. The latter enjoys economies of scale, uses state of the art technologies and processes
and has continuously enjoyed state patronage through consistent policies. Exports by the sector
from India were about US$ 11 billion in 2010-11 with a surplus of US$ 7 billion. Within the
region, significant exports are to Sri Lanka, Bangladesh and Nepal. Major export markets in East
Asia are Indonesia, Thailand and Philippines. India has also penetrated the African market with
exports to Nigeria and Egypt, and to countries in Latin America including Chile, Argentina and
Peru. This is in addition to the traditional markets in Europe and the USA. The Indian Tata
trucks are a by-word in the Middle East, Afghanistan and Iran.
The index of Pakistan import and Indian export trade complementarity is high at 0.836.
Potential imports of Pakistan from India include tractors, buses, cars, trucks, vans and spare
parts. Therefore, all major imports of Pakistan could potentially be obtained from India. The
trade index in the reverse direction is low, implying that Pakistan would face an uphill task in
exporting to India. Landed prices of most Indian automobile products are close to domestic
prices and, therefore, could compete favourably with Pakistani products. What might happen
after MFN status to India would depend on how the monopolistic behaviour of the Pakistani
business organisations responds to this – will capacity utilisation increase, the supply-demand
gap reduced and market behaviour adopts pro-active methods?
77 percent of the survey units had a negative perception of trade with India, namely, low
cost Indian manufacturers enjoying economies of scale could enter the market and drive local
producers out. On the other hand 47 percent responded positively citing two factors: one, the
possibility of joint franchise production; and two, the opening up of a large export market.
10.2. RECOMMENDATIONS
While quality standards have been developed for a large number of engineering
products, there are no known standards for the automotive sector. These need to be developed
to ensure an acceptable level of quality. A mechanism available to ensure process control is
through the International Standards Organisation’s certified Quality Assurance surveyors. This
is not seen yet in the automotive sector.

99
Safety standards are laid out in the Motor Vehicles’ Rules which unfortunately are not
standardised across the country. The first step should be to establish the standards and have
these approved by sub-national governments. No vehicle is examined in Pakistan as there is no
facility available which can test these. Further, there is no trained examiner available with the
Offices of the Motor Vehicles Examiner. It is suggested that help should be sought from such
agencies as the Transports Internationaux Routiers or International Road Transport (TIR) or
the Transport and Road Research Laboratories to help establish these facilities and operate
these for a few years. In the interim the human resource skills need to be established and a
transparent system for examinations developed and implemented.
The survey respondents, both OEMs and vendors, were also asked what measures are
required to protect the automobile industry from possible ‘serious injury’ from Indian imports,
as contained in WTO and SAFTA* provisions. The proposals put forward are as follows:
% of responses
(1) Develop standards to ensure import only of quality products
(especially parts) from India
59
(2) Reduce tariffs on imported sub-assemblies and sub-components 56
(3) Raise tariff on indigenized parts and domestically produced
vehicles
53
(4) Put Indian imports on the Negative List 41
(5) Strengthen valuation and anti-dumping mechanism 38
* Chapter 87 is mostly included in the Sensitive List of Pakistan in SAFTA to avoid any reduction in tariffs in the automotive sector.
The Government does envisage the reduction of tariffs in the automotive sector in a five
year time frame, as per an earlier ECC decision. But this process does not seem to go for enough
with only minor reduction in tariffs in the terminal year from the present level and large inter-
vehicle differentials will persist according to this scheme of up to 70 percent. To reduce this
spread the following recommendations are made for implementation in a medium-term setting:
(i) The maximum tariff on vehicles should be brought down to 35 percent in a five year
time frame.
(ii) The dispersion of tariffs among CBUs of vehicles should not exceed 15 percent in the
terminal year with lower rates of 20-25 percent on trucks and buses and 35 percent
on cars and motorcycles.

100
(iii) The same tariff rates should apply on cars of different sizes. However, in order to
discourage luxury consumption, excise duty may be applied both on CBU imports
and domestic production. The rate of excise duty may be levied at 20 percent on cars
with capacity of 1300-1500cc, rising to 60 percent for cars above 2000cc.
(iv) The distinction between localised parts and non-localised parts needs to be removed
in the tariff schedules, as is the case in most countries. In addition, SRO
656(1)/2006, meant for concessionary imports, must be withdrawn. These
provisions have conferred considerable discretionary power to EDB and the
Customs Department and led essentially to a reversion back to the licensing regime
with scope for rent seeking. By 2016-17, the duty should be brought down to 20
percent.
However, given apprehensions about the potential wide ranging competition from
Indian exports in the automotive sector, we suggest that for the year, 2012-13, the present tariff
rates largely be left unchanged. A subsequent review may be conducted after an assessment is
made of the actual impact on the industry following the granting of MFN status to India and the
resulting expansion of trade.
While competition is limited in the market for cars and is most intensive in motorcycles,
with other sectors falling in between, the CCP needs to be pro-active in ensuring greater
competition among car and tractor manufacturers. In addition, there is need to review other
policies, laws and regulations.
The automotive sector of Pakistan is still at a relatively early stage of development.
Dependence on imports remains high and exports have only commenced in some products with
relatively small volumes. If exports are to increase manifold, the AIDP will need to be extended
upto 2020 and implemented much more vigorously.
As far as quality standards are concerned, these should definitely be strengthened,
especially in the case of auto-parts. The replacement market is already flooded with sub-
standard parts, both domestic and imported. These practices need to be curbed through more
effective regulation, either by federal or provincial agencies.
There is definitely a strong case for strengthening valuation and anti-dumping
mechanisms. The problem of underinvoicing of parts, in particular, has acquired serious
proportions. This may necessitate a return to the International Trade Price (ITP) system or the
use of specific duty on some items, including auto-parts and other automotive products. In

101
addition, the existing laws on Safeguards and Anti-Dumping need to be reviewed. The National
Tariff Commission must have greater capacity to review a larger number of cases and impose
counterveiling duties wherever necessary.
The overall assessment of the report is that the automotive sector is a potential growth
sector of the economy, but for this potential to be realised there is need for development of an
appropriate policy and enabling framework.

102
APPENDICES
APPENDIX 1: CHRONOLOGICAL HISTORY OF THE AUTOMOBILE INDUSTRY
The following table gives the chronological history of the automobile industry. GETTING THE WHEEL IN MOTION
1949 Vauxhall Cars introduced by General Motors & Sales. Bedford Trucks introduced by General Motors & Sales. Ford Trucks introduced by Ali Automobiles.
1953 Exide battery started production.
1956 Dodge Cars introduced by Haroon Industries
1958 Ford Angela Cars introduced by Ali Automobiles.
1959 Ford Pickups introduced by Ali Automobiles.
1960 Ford Combi introduced by Ali Automobiles
1961 Precision auto parts manufacturing started at Allwin Engineering.
1962 Lamberate Scooter introduced by Wazir Ali Engineering. Jeep CJ 5, 6, & 7 introduced by Kandawala Industries. Bedford Truck assembling started at Ghandara Motors.
1963 Mack Trucks introduced by Hye Sons. General Tyres & Rubber Company started production in Karachi.
1964 MF Tractors introduced by Rana Tractors. Vespa Scooter and Rickshaw introduced by Raja Auto Cars. Honda Motor Cycle introduced by Atlas Autos. Ghandara Industries launched Localisation Plant for Bedford Trucks.
1965 Specialised Vehicles Production at Jaffer Industries.
1967 Toyota vehicles introduced by Monnoo Motors.
CHANGING TRACKS
1972 Nationalisation, Pakistan Automobile Corporation (PACO) formed. Ali Autos renamed Awami Autos, Wazir Ali Engineering renamed Sindh Engineering, Haroon Industries Renamed Republic Motors, Ghandara Motors renamed National Motors, Kandawala Industries renamed NayaDaur Motors, Hye Sons renamed Mack Trucks, Jaffer Industries renamed Trailer Development Corporation, Rana Tractors renamed Millat Tractors, Tractor Corporation of Pakistan formed.
1974 Yamaha Motor Cycle launched by Dawood Yamaha, Diesel Engines manufacturing started at Bela Engineering.
1976 Suzuki Motor Cycle introduced by Sindh Engineering.
1977 Kawasaki Motor Cycle introduced by Saif Nadeem Kawasaki. Suzuki Jeep introduced by Naya Daur Motors.
1978 Plastic parts manufacturing at SPEL
1980 Suzuki Pickups introduced by Awami Autos, Mazda Truck introduced by Sindh Engineering, Project approved for production of wheel Rims at Balochistan Wheels under TAA with GKN-Sankey.
1981 Wire Harness production at Ayenbee, Production of Specialised Auto Parts at Agriauto Industries.
CHANGING GEARS 1982 Suzuki Cars production started by Pak Suzuki. Bolan Castings started production, Belarus
Tractors introduced by Fecto Tractors

103
1983 Fiat Tractors introduced by Al-Ghazi Tractors, Vendor Development & Technical Cell (VDTC) formed.
1986 Hinopak Motors Limited formed as joint venture company between PACO, Al-Futtaim,Hino Motors & TTC.
1987 Production of Nissan Diesel Trucks by Ghandara Nissan.
1988 Pakistan Association of Auto Parts and Accessories Manufacturers (PAAPAM) formed.
1989 Second car plant sanctioned by the GoP (Indus Motor Company).
1992 Privatisation of Pak Suzuki Motor Co.
1993 Production of Toyota Corolla by Indus Motor Company Limited First export of Buses and Trailers by Hinopak Motors Limited.
READY FOR TAKE-OFF 1994 Production of Honda Civic by Honda Atlas Cars Pak Ltd. Import of Vehicles under Yellow Cab
Scheme. Pakistan Automotive Manufacturers Association (PAMA) formed.
1995 Engineering Development Board (EDB) formed First PAP Show in Islamabad.
1996 First Industry Specific Deletion Programme (ISSDP) printed for the period up to 2001.
1997 VDTC renamed AT & TC. Second PAP Show held in Lahore. Aircon Systems production starts at San pak Lahore. Production of Sohrab Motorcycle.
1998 Export of Light Commercial Vehicles by Pak Suzuki Motor Company. Saigol Quingqi starts production of motorcycles with Chinese collaboration.
1999 Dewan Farooque Motors starts production of Korean Pickup named Shahzore. Hinopak Motors Ltd. taken over by Hino Motors and TTC of Japan.
2000 3rd PAP Show in Karachi. Raja Motors starts production of UNO Cars. Production of Daihatsu vehicles by Indus Motor Company Ltd.
2001 Molded Interiors manufacturing starts at Procon Engineering.
2002 Adam Motors launches Chinese Truck named Zabardast. Revised and updated ISDP for the period up to 2005 finalised.
2003 Sindh Engineering launches range of Chinese Trucks. Economy of the country is at Take-off stage and so is the Auto Industry. 1st PAMA AutoExpo held in Islamabad (May 12, 13, 2003).
Source: PAMA

104
APPENDIX 2: Questionnaire for Autoparts Manufacturer
ORGANISATIONAL DETAILS Name Address Respondent’s Name Designation e-mail Contact Tel: Cell: Fax: Type of Organisation
1. Public Ltd Co 2. Pvt Ltd Co 3. Partnership (How many partners) 4. AOP (How many associates) 5. Proprietary 6. Other
Membership of Trade Bodies PAPAM CC&I PEC Capacity ____________ parts ________________ tons Investment Cost _____________________ Turnover (last year) ______________________ Gross Profit ____________________ Employment
Management _______ Supervisory _______ Skilled _______ Unskilled _______

105
I. TYPE OF PART, PRODUCTION PROCESS, BUYER Q1. What auto part/s do you produce? ________________________ ________________________ ________________________ Q2. Do you produce sub-parts or whole (specify in each case). [e.g. rear light cover only, or bulb only, the wiring only, or the whole rear light] _________________ _______________ _________________ _______________ _________________ _______________ Q3. Does your work involve mainly assembly of components or manufacture of the components of a particular auto part? ______________________ Q4. If manufacture, what type of production process is it?
(i) Forging ___ (ii) Die Stamping ___ (iii) Injection moulding ___ (iv) Production of moulds ___ (v) Sheet metal fabrication ___ (vi) Electrical engineering ___ (vii) Chemical/flow process ___ (viii) Other ___
II. RELATIONSHIP WITH THE BUYER(S) Q1. Do you produce the auto part first and then find a buyer? Yes ___ No ___ Q2. If yes, then how do you sell?
(i) To an intermediary/wholesaler/retailer? Please specify: _______________
(ii) Directly to the manufacturer of the OEM? ___ (iii) If directly, specify which OEM manufacturer/s do you sell to
predominantly? Name/s: _______________
_______________ _______________
(iv) Since when have you been selling directly to the OEM manufacturer/s? ______________

106
Q3. If you produce on the basis of a prior contract with the OEM manufacturer (OUTSOURCING), specify when, length of contract period, and name/s of the OEM manufacturers:
(i) Contract Period: ___________ (ii) Date of First Contract: ___________ (iii) Names of Manufacturers: ___________
___________ ___________
Q4. Does your buyer have other sources of supply of the parts that you supply them with? YES NO If yes, what proportion is your share? (___)% Q5. In finalizing the outsourcing contract, did you:
(i) Approach the OEM manufacturer, or ___ (ii) OEM manufacturer approached you? ___ (iii) An intermediary facilitated the contract? ___
Q6. What kind of support does the manufacturer provide?
(i) Specification of quality standards? Yes ___ No ___
(ii) Specification of quality control procedures? Yes ___ No ___
(iii) Training in Quality Control methods and procedures? Yes ___ No ___
(iv) Provision of ancillary manufacturing facilities? [e.g. forging, dye making, heat treatment, surface treatment, etc] Yes ___ No ___ If yes, specify the type of ancillary manufacturing facility provided:
_________ _________ _________ _________
(v) Financial Support [loans, grants]? Specify type and terms? _________ _________ _________ _________
(vi) Provision of machines or raw materials? (specify) _________ _________ _________ _________

107
Q7. Has the support provided by OEM manufacturer increased, or decreased? (i) Increased ___
Decreased ___ (ii) In each case, specify the type of support which has either increased
or decreased: _____________ _____________ _____________
Q8. Has your principal (OEM Manufacturer) remained the same, or changed? (i) Remained the same: Yes ___ No___
If yes, since when has the relationship been established? _________ (ii) Changed: Yes ___ No___
If yes, give reasons why it changed? _________________________ (iii) Do you now supply to more than one OEM manufacturer?
Yes ___ No___ If yes, indicate names and dates:
________________ ________________
________________
Q9. Share of sales to Licensor ( %) Others ( %) (Retail Wholesale Distributor
Other (Describe)] ______________________
Q10. Do you face competition in the retail/wholesale market from:
a. Low-priced Chinese spare parts b. High quality Thai/Malaysian spare parts
Q11. Do you face competition in the retail/wholesale market for your parts?
YES NO If yes, from whom? Imports Licensed Vendor Other Domestic
108
III. DIVERSIFICATION Q1. Have you increased the number/type of auto parts you supply over the last five years to the OEM manufacturer/s?
Yes ___ No ___
If yes, is it to the same or different OEM manufacturer? Same ___ Different ___
Specify name/s and type of parts: _________________ _______________ _________________ _______________ _________________ _______________ Q2. In broadening the range of auto parts you supply, what were the main enabling factors?
________________________ ________________________ ________________________ Q3. Did the diversification involve new investment, new technology, skills, increased labour force, or increased number of machines?
(i) Investment: Yes ___ No___ Amount invested if yes to above: _______________ Source of Financing:
Own savings Yes ___ No___ Bank borrowing Yes ___ No___ Loan from OEM buyer Yes ___ No___ Grant from buyer Yes ___ No___ Other _________________
(ii) Additional technical skills: Yes ___ No___ If yes, specify type: __________________
(iii) Additional labour force: Yes ___ No___ If yes, specify type: __________________
(iv) Additional machines: Yes ___ No___ If yes, specify type: __________________
IV. GROWTH Q1. Have you increased your volume of output over the last five years?
Yes ___ No ___
If yes, please specify the type of product: ____________

109
Q2. What were the main factors in your growth? (i) Increased orders from same principal?
Yes ___ No ___
(ii) Increased orders from different principals? Yes ___ No ___
(iii) Increased market demand for the auto part, from direct sales to wholesales?
Yes ___ No ___
(iv) Development of new parts? Yes ___ No ___
(v) In development of new parts, did the principal help? Yes ___ No ___ If yes, how? ________________________ ________________________
(vi) Did you involve additional family members to grow in volumes? Yes ___ No ___
(vii) What are the technical/other qualifications of your family members who joined your business to grow? ________________________ ________________________ ________________________
(viii) In the process of growth, what is the source of additional investment?
Own savings? Yes ___ No___ Borrowing from bank?Yes ___ No___ Borrowing from informal sources?
Yes ___ No___ Specify: _________________ Borrowing from principal/s?
Yes ___ No___ (ix) Did government regulations help or hinder your growth?
Helped ___ Hindered ___
If it helped, in what way? __________________ If it hindered, in what way? __________________

110
Q3. What are the main factors that have prevented you from growing? ________________________ ________________________ ________________________ Q4. What kind of support would you require to:
(i) Increase output? ________________________ (ii) Diversify? ________________________
V. PRODUCTIVITY Q1. What is the cost/unit for each type of spare part you produce?
________________________ ________________________ ________________________ Q2. What are the main cost components, give share (%) in costs:
(i) Electricity: _________________ (ii) Building/land rent: _________________ (iii) Raw material cost: _________________ (iv) Labour: _________________ (v) Machine depreciation: _________________ (vi) Financial cost: _________________ (vii) Others, specify: _________________
Q3.How does load shedding of electricity and gas impact on you Lost hours of production (average daily) ____ Reduced output by _____ % Increased unit costs by ____% Do you self-generate electricity YES NO If yes what is the cost of this per hour In the event of gas load-shedding what alternative do you use and at what cost Q4. Which components of your cost can be reduced and how? Specify? ________________________ ________________________ ________________________

111
Q5. What are the main constraints to increasing the value of output produced per worker? ________________________ ________________________ ________________________ Q6. Do you pay bribes, if so, to whom, how much, and for what?
________________________
________________________
________________________
VI. QUALITY CONTROL Q1. Do you have quality control procedures?
Yes ___ No ___
If yes, specify the procedures: ________________________ Q2. How do you assure compliance of quality control procedures?
________________________
________________________
________________________
Q3. Have you improved the quality of your product over the last five years?
Yes ___
No ___
Q4. How did you establish quality control? (i) Entirely yourself: Yes ___ No___ (ii) With help of principal: Yes ___ No___ (iii) With the help of government
or other agency: Yes ___ No___ Specify: __________________

112
Q5. Do you think quality of your product can be improved? Yes ___
No ___ Q6. In what sense has quality improved? Specify: ________________________ Q7. Can you sell more if you improve quality?
Yes ___ No ___
Q8. If yes, what are the main constraints to improvement of quality? (i) Financial: Yes ___ No___ (ii) Skill levels of workers: Yes ___ No___ (iii) Type of machines available: Yes ___ No___ (iv) Absence of technical support,
such as ancillary facilities: Yes ___ No___ (v) Lack of technical support
from principal/s: Yes ___ No___ Q9.Have you got ISO certification? YES NO If yes, which one? ___________________ VII. EXPORTS Q1. Are you exporting your products?
Yes ___ No ___
If yes: (i) Since when? _________________ (ii) Type of products: _________________ (iii) Volumes exported (by type of product last year
and in earlier years): _________________ _________________
(iv) Annual Export revenue: _________________
Q2. If yes to Q1 above, what were the main enabling factors? ________________________ ________________________ ________________________

113
Q3. If no, what enabling factors could help achieve exports? ________________________ ________________________ ________________________ Q4. Are you aware of the areas volumes and international competitors where you could export?
__________________________ __________________________
Q5. How would you establish an export market for your product?
__________________________ __________________________
Q6. What support is required for establishing an export market? (i) Financial: ___ (ii) Improvement of product quality: ___ (iii) Cost reduction/productivity increase: ___ (iv) Changes in job regulation: ___ (v) Support from principal to establish
export markets: ___ (vi) Support from EPB for establishing
export market: ___ Specify type of support required: ________________________
VIII. RELATIONSHIP WITH GOVERNMENT AGENCIES
1. Who do you have to approach to approve the import of the required volume of inputs on concessionary SROs? MOIndustries EDB MOCommerce Customs
2. How long does it take for imports to be cleared by customs? ______
3. Are you a registered with FBR for payment of Sales Tax? YES NO
4. What type of incentives do you require from government to produce higher technology products and increase the value added
a. Access to a technology upgradation fund established by SMEDA b. Access to concessionary credit from the banking system c. Establishment of a Centre for R&D in the auto parts sector d. Access to training programmes in Computer Assisted Design and Production e. Duty free imports of supporting machine tools f. Sales Tax exemption on new technology intensive products g. Others _____________

114
IX. TRADE WITH INDIA
1. The government is proposing to grant MFN status to India. How will this affect you? a. A big fast growing market will open up for export YES NO b. Low-cost Indian manufacturers enjoying economies of scale could enter the
domestic Pakistani market and drive out local vendors YES NO c. Opening up a possibility for joint venture production YES NO d. Opening up a possibility for Licensed (franchise) Production YES NO e. Others ________________________________________
2. If you see Indian Imports as a threat, what measures should the government take to
protect the domestic vendors a. Raise tariffs on indigenised parts b. Reduce tariffs on imported sub-assemblies and sub-components c. Put Indian imports of parts from India on the negative list d. Develop standards to ensure import only of quality products parts from India e. Strengthen valuation and anti-dumping mechanisms in Pakistan f. Others

115
REFERENCES
Asian Development Bank (2008). Pakistan: Private Sector Assessment. Country Planning Documents, Manila.
Batra, Amir (2004). Indians Global Trade Potential: The Gravity Model Approach. Working Paper No. 151, ICRIER, New Delhi.
Competitiveness Support Fund (2007). Policy Analysis on the Competitive Advantage of the Motorcycle Industry in Pakistan: Problems and Prospects. Competition Commission of Pakistan and the United States Agency for International Development, Islamabad.
ESCAP (2002). Development of the Automotive Sector in Selected Countries of the ESCAP Region.UNESCAP Reference No: (ST/ESCAP/2223),Trade and Investment Division,United Nations; New York.
Federal Board of Revenue. Annual Report, various issues. Government of Pakistan. Felipe J. (2007). A Note on Competitiveness and Structural Transformation in Pakistan.
Economics Working Papers, Asian Development Bank. Ghani, Javed A (1997). Automobile Deletion Policy: An Analysis. Working Paper No. 15, Centre
for Management and Economic Research; Lahore University of Management Sciences; Lahore.
Hussain, Ishrat (2011). Prospects and Challenges for Increasing India-Pakistan Trade. Brief on India-Pakistan Trade, Atlantic Council Issue.
Ismail, Z. (2011). Vehicle User Cost. Unpublished Calculations, Islamabad. Kemal, A. R., Abbas, M. K. and Qadir. U. (2002). A Plan to Strengthen Regional Trade and
Cooperation in South Asia. In Trade, Finance and Investment in South Asia, eds Srinivasan, T. N., New Delhi: Social Science Press.
Ministry of Finance. Pakistan Economic Survey, various issues. Government of Pakistan Mirza, M. Shahrukh and Irfan Anjum Manarvi (2011). Analysis of Technological
Advancements in Pakistani Automobile Car Industry. Global Journal of Research in Engineering Volume 11, Issue 3, Version 1.0; Global Journals Inc. (USA).
Nabi, Ijaz and Javaid, K. (2011), Regional Trade Panel Report. DPRC Working Paper. Nag, Biswajit, Saikat Banerjee and Rittwik Chatterjeey (2007). Changing Features of the
Automobile Industry in Asia: Comparison of Production, Trade and Market Structure in Selected Countries. Asia-Pacific Research and Training Network on Trade, Working Paper Series, No. 37.
Nagao, Hirofumi (December 7, 2010). Why importing used cars may be a bad idea. Newspaper Article, Business Recorder.
Niazi, Javeria and Maham Mustafa Bhatty (2011). Study on Regional Value Chain: Case Study for the Automobile Sector. Institute of Public Policy, Beaconhouse National University; Lahore, Pakistan.
Pakistan Bureau of Statistics. Census of Manufacturing Industries (CMI) of 2005-06.Statistics Division, Ministry of Economic Affairs & Statistics, Government of Pakistan.
Pakistan Bureau of Statistics. Pakistan Statistical Year Book, various issues. Statistics Division, Ministry of Economic Affairs & Statistics, Government of Pakistan.

116
Pursell, G., Khan, K., & Gulzaar, S. (2011). Pakistan’s Trade Policies: Future Directions. Prepared for the Planning Commission, Pakistan.
Saeed, Muhammad (2004). Pakistan & WTO.World Trade Review. Sayeed, Asad (2005). Gains and Structural Impediments to India-Pakistan Trade. Electronic
version is available on: http://www.researchcollective.org/Documents/Gains_from_Trade.pdf SMEDA (2005). Cluster Diagnostic Study: Auto Parts Cluster Lahore. Small and Medium
Enterprise Development Authority, Government of Pakistan; Lahore. State Bank of Pakistan, (2005). Implications of Liberalizing Trade and Investment with India.
Research Department, SBP. State Bank of Pakistan. Balance Sheet Analysis of Joint Stock Companies Listed on the Karachi
Stock Exchange, various issues. United Nations Conference on Trade and Development (2007). Elimination of TRIMS
Experience of Selected Development Countries. United Nations, Geneva. World Bank. World Development Indicators. Used online version.