
The Auto-component Supply Chain in China and India - STICERD
48
The Auto-component Supply Chain in China and India - A Benchmarking Study John Sutton * London School of Economics and Political Science Contents: Abstract 1. Background 2. Benchmarking the Supply Chain. Part I: An Overview 3. Benchmarking the Supply Chain. Part II: Seat and Exhaust Makers Conclusions The Toyota Centre Suntory and Toyota International Centres for Economics and Related Disciplines London School of Economics and Political Science EI/34 Houghton Street February 2004 London WC2A 2AE Tel: (020) 7955 6674 * The field work for this project was carried out in collaboration with Professor Loren Brandt of the University of Toronto (for China) and with Mr. Sri Sai of the Confederation of Indian Industry (for India). This fieldwork was financed by the World Bank, the Center for International Business at the University of Toronto and the William Davidson Institute at the University of Michigan. I would like to acknowledge the assistance of the Chinese Enterprise Institute and of Huang Yonghe for their help with the fieldwork in China, and the Confederation of Indian Industry for their help with the fieldwork in India. I would like to thank Loren Brandt, Juan Hallak, Sue Helper, Tom Rawski, François Roblin and Mari Sako for their helpful comments on a preliminary draft.
Transcript of The Auto-component Supply Chain in China and India - STICERD
The Auto-component Supply Chain in China and India - A Benchmarking Study
John Sutton*
London School of Economics and Political Science Contents: Abstract 1. Background 2. Benchmarking the Supply Chain. Part I: An Overview 3. Benchmarking the Supply Chain. Part II: Seat and Exhaust Makers Conclusions
The Toyota Centre Suntory and Toyota International Centres for Economics and Related Disciplines London School of Economics and Political Science
EI/34 Houghton Street February 2004 London WC2A 2AE Tel: (020) 7955 6674 * The field work for this project was carried out in collaboration with Professor Loren Brandt of the University of Toronto (for China) and with Mr. Sri Sai of the Confederation of Indian Industry (for India). This fieldwork was financed by the World Bank, the Center for International Business at the University of Toronto and the William Davidson Institute at the University of Michigan. I would like to acknowledge the assistance of the Chinese Enterprise Institute and of Huang Yonghe for their help with the fieldwork in China, and the Confederation of Indian Industry for their help with the fieldwork in India. I would like to thank Loren Brandt, Juan Hallak, Sue Helper, Tom Rawski, François Roblin and Mari Sako for their helpful comments on a preliminary draft.
Abstract
The aim of this study is to examine the extent to which Chinese and Indian auto-
component producers have advanced towards international best practice levels of
productivity and quality. The report is based on a survey of nine car manufacturers in
China and six in India; a range of general component suppliers in both countries, and on
a detailed benchmarking study of six seat producers and six exhaust suppliers in each
country.
Keywords: Auto Components, Supply Chains, India, China, Benchmarking. JEL Nos.: D24, F13, F14, F15, F21, L62, L15. © John Sutton. All rights reserved. Short sections of text, not to exceed two paragraphs, may be quoted without explicit permission provided that full credit, including notice, is given to the source. Contact address: Professor John Sutton, Department of Economics, London School of Economics, Houghton Street, London WC2A 2AE, UK. Email: [email protected]

One of the key drivers of industrial development lies in the integration of local firms into
global supply chains. The most highly developed supply chain is that of the car industry,
and over the past decade, Chinese and Indian companies have begun to play a major
role in its extension. Central to this development has been the arrival in both countries
of a wave of international car makers, often operating as joint ventures with local
partners. As this new generation of car makers develop the domestic supply chain in
sourcing their own needs, they interact with local suppliers (some of whom are
themselves multinational joint ventures). The transfer of production know-how that
results drives advances in productivity, but more importantly it drives advances in
product quality, without which exporting prospects remain poor, however low their
prices.
To what extent are these processes now occurring in China and India? How big a part
are multinational joint ventures playing in each country’s exports of components? How
close have domestic component suppliers moved to international best practice levels of
productivity and quality? How deeply has this process penetrated the local supply
chain?
These are the issues explored in what follows.

1
1. Background
The 1990s saw a remarkable transformation of the car industry in both India and China. At
the beginning of the decade, there had been only a very limited involvement of multinational
firms, and total production volumes in both countries remained modest. In 1991, India
produced about 209,000 cars, while China produced about 81,000. Foreign involvement in
China, up to that date, had been very limited: an early joint venture by Chrysler to produce
jeeps (“Beijing Jeep”) had been marked by continuing difficulties. in India, however, a link
up with Suzuki, forming the Suzuki-Maruti company (now Maruti Udyog) led to early
success. The once dominant Hindustan Motors, whose ‘Ambassador’ model (essentially the
1960s vintage Morris Oxford) had been India’s biggest selling car for decades, lost market
share at a dramatic rate to the new Suzuki-Maruti model, which went on to capture 70% of
passenger car sales by the early 1990s.
The Suzuki-Maruti plant, located outside Delhi, developed a network of suppliers during the
early 1990s. Some of these were joint ventures, in which Suzuki-Maruti held a substantial
stake, while others were independent domestic firms. In both cases, Suzuki-Maruti worked
with suppliers to establish international best practice, and to achieve high levels of
productivity and quality.
From the early ’90s onwards, a wave of multinational firms entered both markets. In both
countries, these entrants were required to achieve a high level of domestic content within a
specified period (typically, 70% within 3 years). For at least some of the new entrants, this
was seen as an unreasonable target, as domestic suppliers could not meet the price and
quality requirements of the car makers. Achieving the 70% target required the car makers to
switch rapidly from a reliance on imported components to sourcing from local vendors; and
this in turn gave the car makers a strong incentive to work closely with (first-tier) suppliers,
to ensure that quality standards were met, within an acceptable price.

2
By the end of the decade, car production had increased by a factor of two and a half in India
(from 209 thousand units in 1991 to 564 thousand in 2001), and by a factor of almost nine in
China (from 81 thousand in 1991 to over 703 thousand in 2001). (Table 1.1 and Figure 1.1)1
Over the same period, the supply chain had undergone a major transformation. The new
generation of multinationals worked closely with local suppliers to achieve high standards of
productivity and quality. Meanwhile, domestic car makers in both countries faced intense
competition for market share, and their response was to upgrade productivity and quality
levels in their own plants, and to look for higher quality levels from their (first-tier)
suppliers.
Table 1.1: Total production of passenger cars, 1993-2001 in India and China
India China Financial Year Production Financial Year Production
1991-92 (209,200)* 91 81,055 1992-93 (192,200)* 92 162,725 1993-94 207,658 93 229,697 1994-95 264,468 94 250,333 1995-96 348,146 95 325,461 1996-97 407,539 96 391,099 1997-98 401,002 97 487,695 1998-99 390,555 98 507,861 1999-00 574,369 99 566,105 2000-01 517,907 00 607,455 2001-02 564,113 01 703,525
Source: ACMA, Facts and Figures: Automotive Industry India, 2001-2002, Automotive Component Manufacturers Association of India. Automotive Industry of China 2002, China Association of Automobile Manufacturers/China Automotive Technology and Research Center. * Including SUVs.
1 These volumes correspond to about one-tenth of Japan’s production in the same year. In 2003, the world’s leading producers were Japan (8.1 million units), Germany (5.3), the United States (4.9), France (3.2), Korea (2.4) and Spain (2.2). China ranked fourteenth and India fifteenth.
3
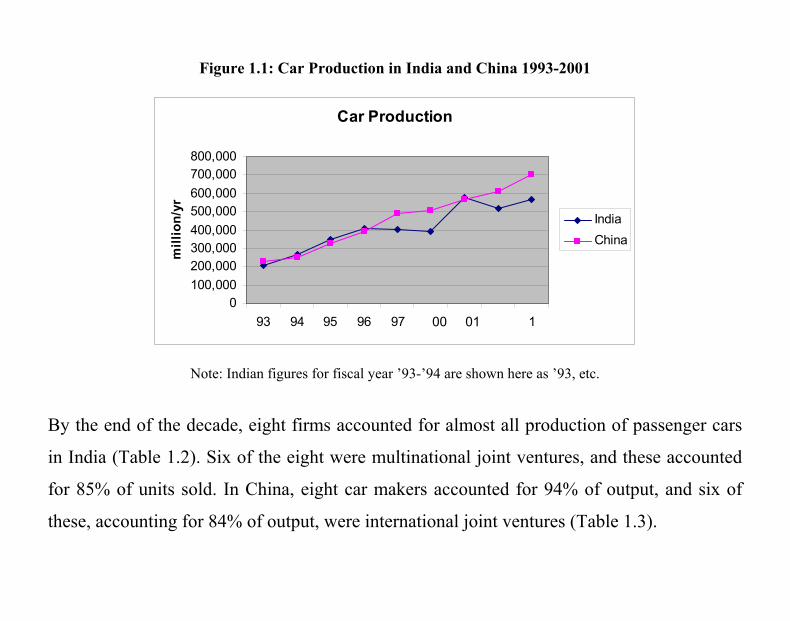
Figure 1.1: Car Production in India and China 1993-2001
Car Production
0100,000200,000300,000400,000500,000600,000700,000800,000
93 94 95 96 97 98 99 0 1
mill
ion/
yr
IndiaChina
Note: Indian figures for fiscal year ’93-’94 are shown here as ’93, etc. By the end of the decade, eight firms accounted for almost all production of passenger cars
in India (Table 1.2). Six of the eight were multinational joint ventures, and these accounted
for 85% of units sold. In China, eight car makers accounted for 94% of output, and six of
these, accounting for 84% of output, were international joint ventures (Table 1.3).
00 01

4
Table 1.2: Leading Car Makers in India, 2001-2
No. of units produced
Market Share
1 Maruti Udyog Ltd (Suzuki j.v.) 351,949 62.2%2 Hyundai Motor India Ltd. 93,888 16.5%3 Tata Engineering and Locomotive Co. Ltd. 64,712 11.5%4 Hindustan Motors Ltd. 19,398 3.4%5 Ford India Ltd. 14,306 2.5%6 Hero Honda Motors Ltd. 10,310 1.8%7 General Motors India Ltd. 8,135 1.4%8 Daimler Chrysler India Pvt. Ltd. 1,415 0.2% Total Production (All firms*) 564,113 Share of top eight 100%
*A small number produced by Fiat and by Daewoo is ‘not available’. Source: As for Table 1.1
Table 1.3: Leading Car-Makers in China, 2001
No. of units produced
Market Share
1 Shanghai VW Automotive Co. Ltd. 230,281 32.7%2 FAW-VW Automotive Co. Ltd. 133,893 18.9%3 Dongfeng Motor Corporation (Citroen j.v.) 72,192 10.2%4 Shanghai General Motors Corporation Ltd. 58,543 8.2%5 Guangzhou Honda Automobile Co. Ltd. 51,146 7.2%6 Tianjin Automotive Xiali Co. Ltd. (Daihatsu
j.v.) 51,019 7.2%
7 Changan Automobile (Group) Liability Co. Ltd. 43,123 6.1%8 China FAW Group Corporation 21,488 3.0% Total Production (All Firms) 661,685 Share of top 8: 94%
Source: As for Table 1.1
2. Benchmarking the Supply Chain. Part I: An Overview
The component supply chain developed rapidly in both countries over the decade, with the
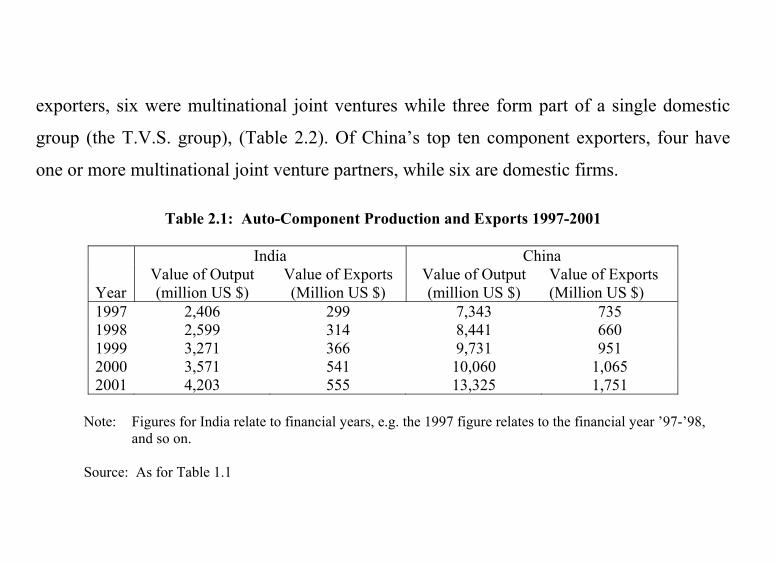
value of component production almost doubling from 1997 to 2001 in both countries. By
2001, China’s component output, and exports, exceeded India’s by a factor of about 3 (Table
2.1). India’s top 10 component exporters, however, had total export sales of about two-thirds
the level of their Chinese counterparts (Tables 2.2 and 2.3). Of these top 10 Indian
5
exporters, six were multinational joint ventures while three form part of a single domestic
group (the T.V.S. group), (Table 2.2). Of China’s top ten component exporters, four have
one or more multinational joint venture partners, while six are domestic firms.
Table 2.1: Auto-Component Production and Exports 1997-2001
India China Year
Value of Output (million US $)
Value of Exports (Million US $)
Value of Output (million US $)
Value of Exports (Million US $)
1997 2,406 299 7,343 735 1998 2,599 314 8,441 660 1999 3,271 366 9,731 951 2000 3,571 541 10,060 1,065 2001 4,203 555 13,325 1,751
Note: Figures for India relate to financial years, e.g. the 1997 figure relates to the financial year ’97-’98,
and so on. Source: As for Table 1.1

6
Table 2.2: Leading Component Exporters, India 2001-2
Multinational or Multinational j.v. (M) Domestic (D)
Company Exports million US $
Items Exported
M Visteon Automotive Systems India Pvt. Ltd.
55.4 Starter motors, alternators, climate control systems, instrument clusters
M MICO (Motor Industries Co. Ltd.) (Bosch Group)
40.5 Spark plugs, diesel fuel injection system
D Bharat Forge Ltd. 23.1 Forging – crank shafts D *Brakes India Ltd. 17.8 Brake systems and components D *Sundaram Fasteners Ltd. 17.2 Specialised fasteners and radiator
caps M Delphi Automotive Systems Pvt.
Ltd. 16.6 Shock absorbers, suspension
systems M Phoenix Lamps (India) Ltd. 15.7 Halogen lamps M Sigma Corporation (India) Ltd. 11.1 Engine and transmission mounts M Motherson Sumi Systems Ltd. 9.2 Wiring harness D *Sundaram Brake Linings Ltd. 9.0 Brake lining and clutch facings
Top 10 total 215.6 million $ Source: supplied by ACMA Overall total 555.0 million $ *member of the TVS group. Share of top 10 = 38.8 %

7
Table 2.3: Leading Component Exporters, China, 2001
Multinational or Multinational j.v. (M) Domestic (D)
Company
Exports million US $
Items Exported
D China FAW Group Corporation 44.3 Various M Kunshan Liufeng Machinery
Industry Co. Ltd. 61.2 Aluminium alloy wheel hubs
M Siemens VDO Automotive Huizhou Co. Ltd.
44.6 Car radios
* Wanxiang Qianchao Co. Ltd. 43.0 Universal joint, bearings, drive shaft, constant velocity joint, rubber seal elements, ball bearings
M Shanghai Yanfeng Johnson Controls Seats Co. Ltd.
43.0 Covers and parts for seats
D Guangzhou City Huanan Rubber Tyre Co. Ltd.
41.4 Covers for radial tyres
D Zhejiang Wanfeng Autocar Group 29.8 Aluminium wheels D Shandong Longji Group Co. Ltd. 19.6 Brake drums; brake discs D Xiang Torch Investment Co Ltd 19.0 Brake discs, lights, mirrors, sparks
plugs D Fujian Yuanguang Combined Wire
Co. Ltd. 18.7 Wiring harness
Top 10 Total 364.6 mill $ Source: As for Table 1.1 Overall Total 2,617.7 mill $ Share of top 10 = 14 % *Domestic firm with many foreign j.v. partners.

8
The focus of the present study lies in examining the supply chain (or
component supply industry) in each country from a number of perspectives:
a) The depth and stability of the chain
Here we aim to examine the degree to which efforts made in both
countries to develop local suppliers in tandem with the arrival and
expansion of the new wave of multinational car makers have succeeded.
The aim underlying the domestic content rules imposed on the new
arrivals was to bring about the development of a population of high
quality domestically-based suppliers; to what extent has this succeeded,
and will these suppliers retain their role in the wake of WTO entry
(under which such restrictions are banned)?
b) The quality of the chain
The question here is, to what degree has international best practice been
transferred to the domestically-based suppliers (whether these are
independent domestic firms or joint ventures with multinational
component producers)? We address this issue, which forms our main
focus, from two angles, looking first at a comparison of supplier quality
experienced by twinned pairs of buyers in India and China, and then
turning, in the next section, to a detailed examination of two particular
components (seats and exhausts) that lend themselves to cross-plant and
cross-country benchmarking in respect of both productivity and quality.
2.1 The Depth of the Chain
The degree of development of the supply chain may be gauged by examining
the extent to which car makers choose to buy in components, rather than
manufacture in-house. To investigate this, we visited nine Chinese and six
Indian car makers, and recorded the in-house versus buy-in decision for all

9
major components, assemblies and sub-assemblies. It is worth noting that the
decision to manufacture in-house, or to buy in, is a subtle one.2 When the car
industry first developed in the early years of the 20th century, almost all
components were bought in. By the middle of the twentieth century, in-house
production was the norm for major components. Over the past few decades,
the pattern has moved heavily towards buying-in. The issue of interest here is
the degree to which car makers have access to adequate local sources of
supply. If the supply chain is well developed, then we expect to see a pattern
in which only a couple of key components (the cylinder head and block) are
almost always made in-house; a central group of key components, assemblies
or sub-assemblies (shown as Group 2 in Table 2.4) may be outsourced or
made in-house; while a final group of less central components are normally
outsourced (Group 3 of Table 2.4). The table omits a large number of items
that are virtually always outsourced.
2 For analysis of the strategic issues involved, placed in the context of the industry’s history, see Helper, S. ‘Strategy and Irreversibility in Supplier Relations: The Case of the U.S. Automobile Industry’, Business History Review, vol. 65, Winter 1991, pp. 781-824.
10
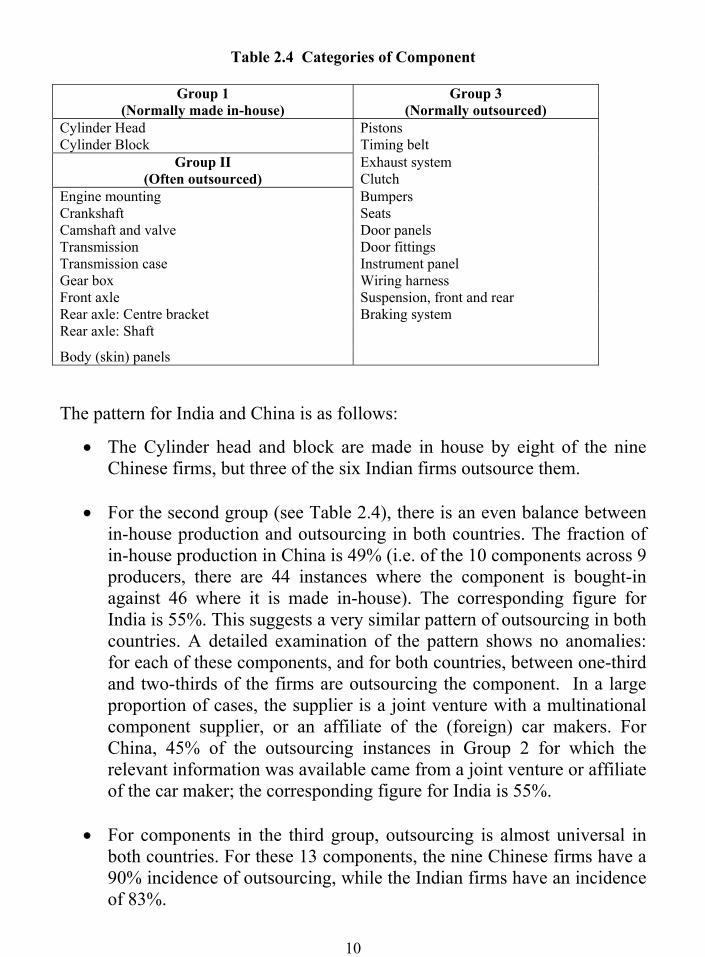
Table 2.4 Categories of Component
Group 1 (Normally made in-house)
Group 3 (Normally outsourced)
Cylinder Head Pistons Cylinder Block Timing belt
Group II (Often outsourced)
Exhaust system Clutch
Engine mounting Bumpers Crankshaft Seats Camshaft and valve Door panels Transmission Door fittings Transmission case Instrument panel Gear box Wiring harness Front axle Suspension, front and rear Rear axle: Centre bracket Braking system Rear axle: Shaft
Body (skin) panels
The pattern for India and China is as follows:
• The Cylinder head and block are made in house by eight of the nine Chinese firms, but three of the six Indian firms outsource them.
• For the second group (see Table 2.4), there is an even balance between
in-house production and outsourcing in both countries. The fraction of in-house production in China is 49% (i.e. of the 10 components across 9 producers, there are 44 instances where the component is bought-in against 46 where it is made in-house). The corresponding figure for India is 55%. This suggests a very similar pattern of outsourcing in both countries. A detailed examination of the pattern shows no anomalies: for each of these components, and for both countries, between one-third and two-thirds of the firms are outsourcing the component. In a large proportion of cases, the supplier is a joint venture with a multinational component supplier, or an affiliate of the (foreign) car makers. For China, 45% of the outsourcing instances in Group 2 for which the relevant information was available came from a joint venture or affiliate of the car maker; the corresponding figure for India is 55%.
• For components in the third group, outsourcing is almost universal in
both countries. For these 13 components, the nine Chinese firms have a 90% incidence of outsourcing, while the Indian firms have an incidence of 83%.
11
What these figures suggest is that car makers in both countries show a similar
pattern of outsourcing, and this pattern is consistent with what we would
expect to observe in an environment where there were no serious limits to the
availability of suitable local suppliers.
2.2 Supplier Quality
Assessing the quality levels achieved by firms in different parts of the supply
chain (as conventionally measured by the fraction of parts found to be
defective) by the buyer poses a number of difficulties:
i) Some types of component pose greater problems than others in
manufacturing, and so defect rates for best practice producers will vary widely from one component to another.
ii) Systematic differences in levels of quality may be expected as we move
down the supply chain, from first-tier to second-tier suppliers, and so on.3
In light of these difficulties, we attack the problem in two ways. In this
section, we look at three twinned pairs of buyers, one in India and one in
China, chosen for their close similarity in terms of the range of components
they buy. We examine the distribution of quality across each buyer’s
suppliers. This method allows us to obtain a snapshot of the quality of the
supply chain at three different points. The strength of this method lies in the
breadth of coverage: we are looking here at a wide range of components
supplied. In the next section, we adopt a complementary approach by looking
at the picture from the supplier’s side. We take two specific components (seats
and exhausts) and look at half a dozen suppliers of each component in each
3 The supply chain is usually described by reference to a number of tiers. ‘Tier 1 suppliers’ are those selling directly to the car maker (assembler). ‘Tier 2 suppliers’ are those selling directly to the ‘Tier 1’ firms, and so on.
12
country. This allows us to examine the range of performance across different
suppliers of the same product.
In this section, then, we adopt the first approach, viz. examining twinned pairs
of buyer firms. The first pair of twinned firms are car makers. Each is a
recently established multinational firm. Having been established less than a
decade, each of these firms benefited from the early development of the local
supply chain that took place up to the early 1990s in each country. Each firm
has taken advantage of the option of inviting some of its home country
suppliers to set up joint ventures with local firms in order to ensure supplier
quality.
The histograms in Figure 2.1 show the range of quality, as measured by
defects found in incoming components – expressed in ‘parts per million’
defective. International best practice for car makers in the U.S., Japan and
Europe currently aims to bring the large majority of suppliers under 100 ppm.
The histograms for the Indian and Chinese companies are fairly similar. In
each case, about half of the suppliers achieve a figure under 100 ppm. The
tail of the distribution is also similar: the fraction of suppliers with defect rates
exceeding 1500 ppm is about one-eighth (Table 2.5).

13
Figure 2.1 Supplier Defect Rates for a Twinned Pair of New Generation Car Makers
These distributions confirm the view suggested by discussions in the course of
plant visits that, in both India and China, first-tier suppliers to newly arrived
car makers are already operating close to world class standards in terms of
incoming component defect rates.
The next two pairs of histograms relate to suppliers further down the chain.
Here, we aim to distinguish suppliers of very basic components (such as
pressed and metal parts) and more sophisticated components (requiring, for
example, a series of machining and assembly operations). The first pair of
companies are seat producers who buy in parts or sections of metal frames
(pressed and stamped components, in some cases welded into a sub-
assembly). Each buyer is a seat supplier to one of the country’s leading car
makers.
Component Suppliers to Multi-National Car Makers
00.10.20.30.40.50.6
<100 ppm
100-300 -700
-1500
-3000
-7000
-12000
-25000
>25000
IndiaChina

14
Table 2.5 Supplier Deficit Rates for Two Twinned Pairs of Buyers
Percentage of Suppliers Defect Rate Car maker,
China Car maker,
India Seat Producer,
China Seat
Producer, India
<100 ppm 55 43 60 72 100-300 17 17 20 4
-700 10 7 8 0 -1500 6 20 4 3 -3000 5 7 4 5 -7000 7 4 0 4 -12000 0 0 4 1 -25000 0 2 0 1 >25000 0 0 0 9
Note: figures may not add to 100 due to rounding
The histogram of ppm rates for incoming components from the firms’ various
suppliers are shown in Figure 2.2 and Table 2.5. In each case, about two-
thirds of suppliers achieve a defect rate below 100 ppm. The tail of
distribution is longer in the Indian case, with about one-fifth of suppliers
above 1500 ppm, as opposed to one-tenth for the Chinese firm. Overall,
however, performance in both countries is close to the levels expected of
world class suppliers in the U.S., Europe and Japan.

15
Figure 2.2 Supplier Defect Rates for Seat Producers
The components supplied to these seat producers represent the lowest level of
component complexity. In contrast to this, our third pair of firms are ‘typical’
second tier suppliers. In each country, the firm we look at is a supplier of
steering gear and allied components to a range of leading car makers and first-
tier suppliers. The range of components it produces is broad, and it buys in a
range of components and sub-assemblies that require a series of machining
and assembly operations. As we move down the supply chain towards
producers of this kind in the U.S., Japan or Europe, it is usually the case that
the distribution of defect rates for incoming parts becomes less favourable, in
comparison with the corresponding distribution for first-tier suppliers.
Component Suppliers to Seat Producers
00.10.20.30.40.50.60.70.8
<100 ppm100-300 -700
-1500-3000
-7000-12000
-25000>25000
IndiaChina

16
Figure 2.3 Supplier Defect Rates for Steering Gear Producers
Table 2.6 Supplier Defect Rates for a Twinned Pair of Steering Gear Producers
Percentage of Suppliers Defect Rate % China India
<1% 60 80 1-10% 29 7 10-20% 8 9 20-40% 4 2 >40% 0 2
What is striking about the distributions shown in Figure 2.3 and Table 2.6,
however, is how wide this disparity is both for the Chinese and the Indian
suppliers. In each case, the steering-gear manufacturer experiences extremely
high rates of incoming defects. These rates are measured, not in parts per
million found defective, but rather in terms of the percentage of incoming
batches found to be (un-) acceptable on first inspection. (Random samples are
drawn from each batch on arrival. If the sampled parts are defective, the batch
is returned to the supplier, who will carry out a full inspection, and reject or
Component Suppliers to Steering Gear Firms
00.20.40.60.8
1
<1% 1-10% 10-20% 20-40% >40%
IndiaChina
17
rework as necessary before sending a replacement batch). The threshold of
interest is the percentage of batches deemed unacceptable at first inspection.
Some 60% of Chinese suppliers and 80% of Indian suppliers achieve a figure
of 1%. The tail of the distribution in each case is extremely long. About 4% of
each firm’s suppliers have over 20% of their batches rejected on first
inspection.
It is here that the main weakness of the supply chain, relative to those of the
U.S., Japan and Europe is evident. Manufacturing best practice has spread
remarkably quickly to first-tier suppliers in both India and China over the past
decade, as Figure 2.1 suggests. These practices have not as yet permeated
through the lower tiers of the supply chain. Discussions with firms in the
course of this study suggest an explanation. The spread of best practice among
first-tier suppliers was driven by pressure from the car makers during the late
1990s. These first-tier suppliers found themselves under pressures from the
car makers, not only on quality, but also on price. Car makers worked actively
with some first tier suppliers to achieve low defect rates, while other first tier
suppliers were joint ventures with multinational component suppliers who
introduced best practice techniques. But when these suppliers turned to their
own (‘Tier 2’) suppliers they faced a trade-off. Should they stay with a low-
cost supplier, and accept high defect rates, or move to a higher cost supplier?
High defect rates can be dealt with by spending more man-hours on the
inspection of incoming parts, which are sent back to the supplier if found
defective. In a low-wage environment, the cost of inspection, and of
reworking, may be more acceptable to the buyer and seller. Only when the
first-tier supplier begins to work closely with suppliers, and to de-select
suppliers who have high defect rates, is best practice likely to spread. While
our interviews with component suppliers suggest that this process is

18
occurring, it is also clear that it is happening only very slowly in both
countries, and the threshold for de-selection can be very high. (Boxes 1 and
2).
The stability of the chain
Given the current state of development of the supply chain, a key question is:
will the car-makers now begin to take advantage of WTO entry to import
components and sub-assemblies, following the pattern that some of the new
arrivals regarded as optimal in the 1990s? Here, the discussions with car-
makers in the course of the study suggest the answer is a clear and consistent
‘no’. The view expressed in all cases was that the car-maker had developed
local sources of supply that were superior, in terms of the combination of cost
and quality, to imported alternatives. This suggests that the development of
the local supply chain under local content restrictions in the years prior to
WTO entry has, in these industries, been highly successful.

19
Box 1
A Timescale for Capability Building One question of central importance relates to the timescale for capability building: how long does it take to reach world-class levels of quality? Conventional wisdom among multinational component producers involved in the present study is that starting with a new workforce on a greenfield site is a major advantage: one executive based at the world headquarters of a multinational seat maker remarked that he would expect to be able to achieve world-class quality standards at a greenfield plant in any country within one year of its establishment. If, however, he was operating in a joint venture with an established local seat maker, this process might take three years. The difference reflects the slowness of “relearning”: if established routines are in place, it is hard to change them; beginning from scratch is easier*. While the figures suggested may be optimistic, this key difference is bourne out by the (limited) set of observations we have been able to make of the time profiles of external defect rates in selected participating firms. For example:
• A multinational seat-maker operating on a greenfield site in India experienced an initial level of its external defect rate of 2,085 ppm (as compared to a “world-class threshold” of 100 ppm). In its third year of operation, this rate had fallen to 65 ppm, close to the 50 ppm level regarded as “award class” by multinational seat makers.
• One of the leading domestic seat makers on the Indian market began in the mid-90s to introduce international best practice procedures. Beginning from an initial external defect rate of 20,000, it took five years of steadily-improving performance to bring this figure down to its present level of 200 ppm.
Among multinational seat and exhaust makers, engineers from high performing plants are regularly transferred to newly formed joint ventures with established domestic producers. One engineer, who had been seconded from a world-class greenfield plant in India to a recently-established joint venture plant in China, remarked that his six-month stint would be “largely a matter of talking”. It was not, he remarked, the obvious alterations to the physical plant that mattered, but rather inducing a shift in work practices. At the most elementary level, this would involve a move away from traditional notions of “inspection at the end of the production line”, to a system in which each operator along the line searched for defects in each seat section as it arrived, and as it departed: the idea of such constant monitoring is in part to avoid “adding value to defective units”; more importantly, it is to set the basis for a system in which the sources of defects are quickly identified and rectified. (See Box 2). ________________________ *The difference also reflects, in some of the plants visited, the existence of prior contractual agreements on incentive schemes and payment systems, and on working practices, that are hard to change.

20
Box 2
Starting from Scratch
The key to achieving high levels of productivity and quality lies in the establishment of a series of inter-related working practices that have become standard in the global auto-industry over the past generation. A recurring theme in company interviews is that this is much easier to achieve in a new firm operating on a greenfield site, with newly hired employees; and rather than looking for prior experience in the industry, the newly established employer may deliberately hire individuals who have never worked in the industry before. So how can an established domestic firm adapt? A striking illustration is provided by a long-established Indian manufacturer of mechanical components (steering-gear and related parts). In order to win and service a major new export contract from a multinational car-maker, the firm recently established a new small-scale plant alongside its main premises. Employing a small workforce of male and female operatives, all in their early twenties, and with no prior employment experience, the plant is organized along ‘Japanese’ lines: each operative is responsible for all aspects of his or her work area, including sweeping and cleaning. All shop floor workers, whether skilled or unskilled, spend a month working as cooks in the canteen, in order to instil a sense that everyone is working as an equal member of a team, whose shared aim is to achieve the highest possible levels of quality. This is an extreme example, but it is illustrative of a broad tendency that was evident in about one-half of the Indian seat and exhaust producers visited in the course of the study: the achievement of high quality standards goes hand in hand with an erosion of traditional patterns of hierarchy within the plant. The emphasis, instead, is on building teams of equals, who work in close cooperation (via ‘quality circles’ etc.) to bring about a steady flow of minor innovations in working methods, whose cumulative effect is substantial. As one manager at a domestic Indian firm remarked in the course of our interview: “We take our technology from Europe, but our production practices come from Japan”.

21
3. Benchmarking the Supply Chain. Part II: Seat and Exhaust Makers
3.1 Motivation
The main difficulty in comparing productivity and quality across firms lies in
the fact that each firm has a different product mix, and controlling for
differences in the firms’ products is difficult. Two producers of gearboxes, for
example, would be difficult to compare in a satisfactory way since the
differences in design, and manufacturing complexity across different
gearboxes are very great, and since the machine shop producing gearboxes is
likely to produce a wide range of (other) components, making the allocation
of labour hours to each product line problematic.
For this reason, we focus here on two products that permit a relatively fair and
transparent comparison across rival producers: seats and exhausts. In both
cases, the component is normally produced in a single specialist plant, which
produces at most a handful of major product lines. The design and complexity
of the products produced by different firms are fairly similar, and it is possible
to identify and make allowances for such differences as exist.
A multi-country study of seat and exhaust production in North America, Japan
and Europe was carried out by a team of consultants organized by Andersen
Consulting in the late 1990s.4 That study provides some useful reference
points in respect of international best practice in what follows.
3.2 The Sample
The aim of the exercise is to compare productivity and quality levels across
the industry’s leading firms. With this in mind, we identified the seat and
4 Oliver, N., D.T Jones, R. Delbridge, J. Lowe, P. Roberts and B. Thayer (1993) “Worldwide Manufacturing Competitiveness Study: The Second Lean Enterprise Report,” Andersen Consulting, London. This study covered France, Germany, Italy, Japan, Mexico, Spain, the U.K., the U.S. and Canada. As well as seats and exhausts, it also covered braking systems; (where cross-firm comparisons are more problematic).

22
exhaust producers who supply the leading car makers in each country. We
then chose a representative set of 6 of these of seat suppliers and 6 of these
exhausts suppliers in each country, i.e. a total of 24 suppliers. These suppliers
include some which are joint ventures with, or affiliates of, major
multinational seat or exhaust producers who supply international car makers
across the world. Others of our sample firms are domestic producers, some of
whom are independent companies, and some of whom are affiliates of the car
maker they supply. Data was collected via a series of interviews and plant
visits to each supplier.
In all cases, these firms supply a similar product, or set of products. In the
case of seat suppliers, the standard product is a seat set for a passenger car (2
front and 1 rear (bench) seat). In the case of exhaust suppliers, the standard
product on which we base our analysis is an exhaust, comprising muffler,
manifold and tubes. We are concerned with measuring productivity in the
manufacture of such an exhaust, beginning from steel tube and sheet steel.
This process involves a series of cutting, bending and welding operations.
We are concerned here with looking at productivity in the assembly process,
and with two measures of quality. We measure productivity in terms of the
number of seat sets, or exhausts, produced per man-hour in the assembly
process. Quality is measured at two points. The first relates to the fraction of
units found to be defective during the production process i.e. units pulled from
the line, or units failing to pass final inspection (the ‘internal defect rate’). The
second is the ‘external’ defect rate (used in the previous section, i.e. a measure
of the quality of units delivered to the car-maker).
Beyond these productivity and quality measures, we also look at two
supplementary measures of manufacturing performance: these relate to the
23
coordination of production with materials’ suppliers and with the customer
(i.e. the car maker). The first is a measure of the level of inventory held, either
as raw material or work in progress. This is measured as the ratio of the value
of total materials purchased per annum to the value of the stock of raw
materials and work in progress on a typical day. Thus, if a firm holds one
week’s worth of materials and work in progress, and operates for 52 weeks a
year, then its ‘stock turn ratio’ is 52. The second supplementary measure is the
frequency of delivery to the car maker, expressed as a multiple of ‘daily
deliveries’: if, for example, the firm delivers twice a day, then its frequency is
2. These two supplementary measures provide an additional indicator of the
extent to which the organization of production conforms to international best
practice.
3.3 Choice of Technique
In comparing levels of labour productivity the most obvious and immediate
consideration to address lies in differences in the technique of production, as
measured by the degree of capital intensity (or capital-labour ratio) chosen in
different firms, or countries. Given that cross-country wage differences are
typically far greater then differences in the cost of capital, we might expect
that firms in low-wage countries would find it optimal to work at a lower
degree of capital intensity, and so a lower level of labour productivity (as
defined by the number of units of output per man-hour).5
Matters are complicated, however, once the quality of units produced becomes
pertinent. It may be, for example, that a low level of capital intensity makes it
more difficult to reach acceptable quality standards. While this point is
obvious, the trade-offs involved in this area can be quite subtle. 5 To make the same point in a different way, a lower level of labour productivity is consistent with a high level of ‘total factor productivity’.

24
A comparison of experience between seat producers and the exhaust makers is
particularly revealing in respect of such trade-offs, since the two product lines
differ in ways that are highly relevant to firms’ choices in this area. In each
case, it is feasible to manufacture the product using different degrees of
capital intensity. For seats, the cutting of material can be done by hand, or
using an automated (computer controlled) cutting table. The sewing is done on
industrial sewing machines, on individual benches; the machines can be low-
cost machines of a traditional kind, or more sophisticated machines in which
the material is ‘moved through’ automatically as sewing proceeds, rather than
being inched through manually. Firms included in the present study used both
types of techniques in these two areas. In the assembly operation, however, to
which our productivity measures relates, there is little variation in the degree
of capital intensity of the process across firms, or across countries. Seats are
in industry parlance, an ‘A-surface’, i.e. one that is immediately visible to the
final customer. This means that the relevant measure of quality for seats
extends to minute surface characteristics (the spacing of threads on the sewn
joints, the presence of loose thread-ends, the uniform tautness of the fabric
over each section of the seats, etc.). This consideration constrains the
organization of the production process, and the use of alternative methods that
might involve wide differences in capital intensity. Seats are assembled either
in a production line, or in a series of ‘cells’, and their assembly essentially
involves a sequence of operations in which sections of the metal frame, the
foam interior, and the sewn cover, are fitted together. The use of jigs on which
sections are mounted for fitting is standard. The only automated process is one
in which a foam section is ‘shrunk’ to allow a sewn cover to be fitted over it;
this is done for headrests in most plants, but not for other seat sections. (It
would not be appropriate in the case of most seat types in the present study).

25
The case of exhausts is very different. Here, the degree of capital intensity
varies very widely across firms within the same country. This reflects, in part,
the fact that the exhaust is a B-surface, i.e. one that is not immediately visible
to the final customer. What matters, in terms of quality, is the mechanical
strength of each welded joint, as opposed to the visible smoothness or
uniformity of the weld. This permits the use of a wide range of techniques in
the welding operations.6
Welding techniques are of three kinds (‘generations’). In increasing order of
capital intensity, they involve:
• A production line along which each worker carries out one or more welds using a simple hand-held welding torch. The sections to be welded are clamped into a jig, and held in a fixed position.
• A line on which each station has an automated jig, on which the
clamped sections of the exhaust move (rotate), while the welding torch is held in a fixed position on a stand or bracket.
• A fully automated system in which the welds are done by robots. The
only manual work involves placing and clamping the sections onto a jig. (In some cases, the jig then rotates through 1800, bringing the sections into an enclosed area, where robots carry out the welds. The part is then flipped back for unloading).
The capital cost of a set-up of the third kind will exceed by a factor of
hundreds that of the first set-up. It might seem, therefore, that the choice of
technique might rest primarily on the level of wages (relative to the cost of
capital equipment), and so it might seem that, within a single country, most
firms might use the same technique. This is not the case: the firms in the
present study operate with a mix of techniques, covering the full range
6 Cutting sheet steel, and pipe bending, on the other hand, are done on similar machines throughout the industry – the former on low-cost traditional machine tools, and the latter on specialist automated ‘pipe bending’ machines, whose use is standard across (almost) all firms, in all countries.

26
described above. The reasons for this are revealing, in respect of the trade-offs
firms face between productivity and quality, as we note below (Box 3).
Apart from the choice of more or less capital-intensive methods, there are a
number of further factors that might seem likely to affect differences in labour
productivity across firms and countries. These include (a) the volume of
production (scale economies) and (b) the nature of the firm (joint venture with
foreign partner or independent domestic firm), (c) the complexity of the
component produced. In what follows, we investigate the possible influence
of these factors. We find no influence for any of these factors in seat
production, while in exhaust production, only one of these factors matters:
productivity increases strongly and systematically with the volume of
production. (See Tables 3.1 and 3.2). As to the impact of capital intensity, it
has no statistically significant effect on differences in productivity across
different exhaust makers, a point to which we return in the next Section.
Table 3.1: Labour Productivity in Seats
Coefficients Standard Error t Stat Intercept 1.10 0.55 2.00 Country Dummy (China = 1) -0.99 0.46 -2.14 JV 0.63 0.55 1.15 Annual Production
0.26 2.84 0.09
Note: The complexity and degree of capital intensity is closely similar for all firms. The variable JV is 1 if the firm is a joint venture with a multinational seat maker, and 0 otherwise.

27
Table 3.2 Labour Productivity in Exhausts
Coefficients Standard Error t Stat Intercept 0.41 0.35 1.19 Country Dummy (China = 1) -0.17 0.44 -0.38 WDUM -0.33 0.67 -0.50 LDUMLO -0.12 0.44 -0.26 LDUMHI 0.62 0.73 0.84 JV -0.21 0.82 -0.26 Annual Production 6.77 2.46 2.75
Note: The degree of capital intensity in the production process: if most welds are carried out using hand-held welding tools, LDUM LO is 1. If no welds are carried out using hand-held welding tools, and over 20% of welds are carried out on robots, LDUM HI is 1. Otherwise these variables are set to zero. (See text). The variable WDUM measures the complexity of the exhaust by reference to the number of major welds (i.e. excluding spot welds amnd tab welds). If the number exceeds 8, WDUM is set to 1; otherwise it is set to zero. The variable JV is 1 if the firm is a joint venture with a multinational exhaust producer, and 0 otherwise.
28
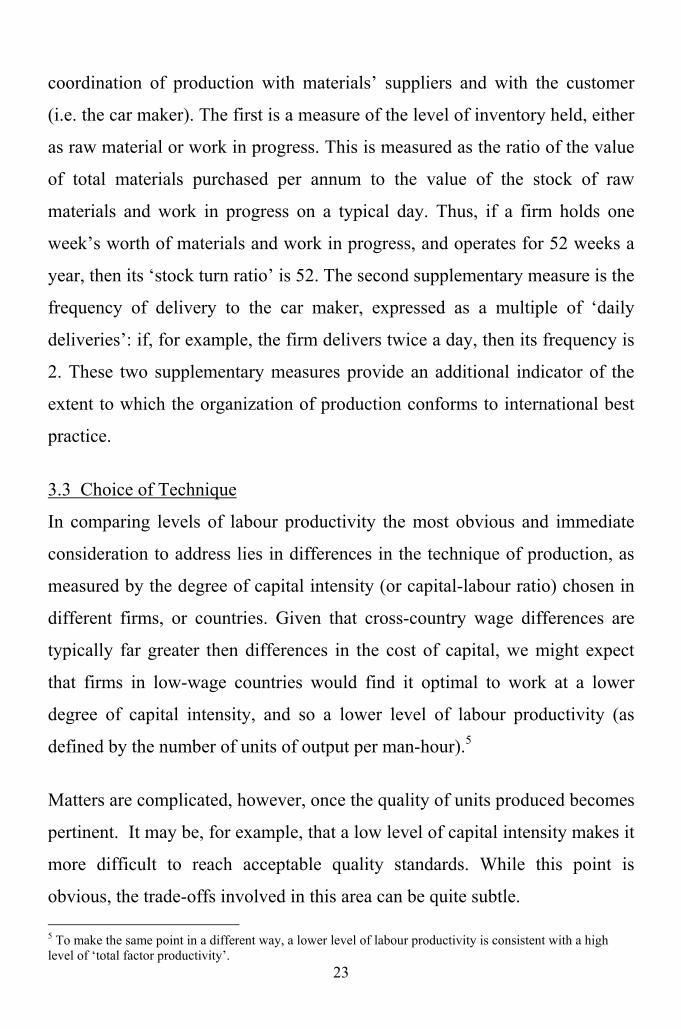
Figure 3.1 Productivity versus Annual Production Volume in Seats
0
0.5
1
1.5
2
2.5
3
0 50000 100000 150000 200000 250000 300000
Annual Prod. Vol.
Labo
ur P
rodu
ctiv
ity (u
nits
per
man
-hou
r)
India SeatsChina Seats
Figure 3.2 Productivity versus Annual Production Volume for Exhausts
0
0.5
1
1.5
2
2.5
3
3.5
0 50000 100000 150000 200000 250000 300000 350000 400000 450000 500000
Annual Prod. Vol.
Labo
ur P
rodu
ctiv
ity (u
nits
per
man
-hou
r)
India ExhaustsChina Exhausts

29
In the light of these results we may conveniently illustrate the China-India
comparison by way of the scatter diagrams shown as Figures 3.1 and 3.2,
which depict labour productivity vs. production volume for seat and exhaust
makers respectively. The main feature to emerge from these figures is that, in
exhaust production, average production volumes and average productivity
levels are similar in both countries, though the dispersion across firms on both
variables is much narrower in China: India has some very small, low
productivity producers as well as one high volume, high productivity
producer. (Figure 3.1). In seats, average production volumes are similar in
both countries. Productivity is significantly higher in India, with all of the top
three firms being Indian. (Figure 3.2).
A closer look at productivity differences across exhaust producers is provided
in the next two figures, which depict the same relation for Indian exhaust
makers only (Figure 3.3) and for Chinese exhaust makers only (Figure 3.4).
These figures show the influence of product complexity and capital intensity.
The product is described as ‘lower complexity’ if the number of welds is less
than 10 (a relatively simple exhaust) and ‘higher complexity’ otherwise. The
degree of capital intensity is measured by an index which takes the value of 1,
it is described as ‘low’ if most welds are carried out using hand-held welding
tools; it is described as ‘high’ if no welds are carried out in this way – where

30
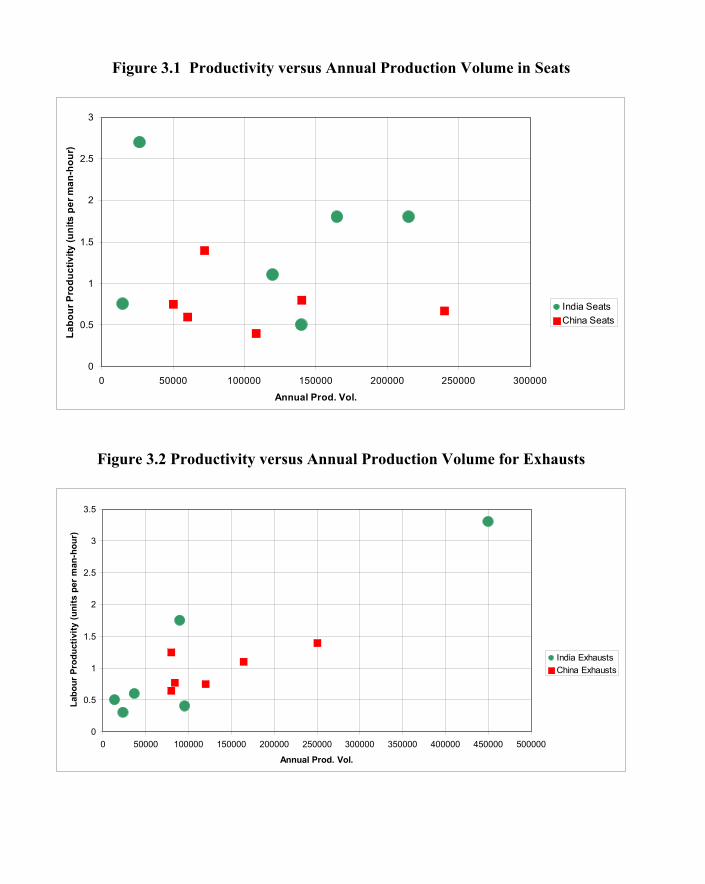
Figure 3.3 Productivity versus Annual Production Volume in Exhausts: India
India Exhausts - Annual Prod vol VS prod
0.00
0.50
1.00
1.50
2.00
2.50
3.00
3.50
0 100000 200000 300000 400000 500000
Annual Prod. Vol.
Prod
.
Figure 3.4 Productivity versus Annual Production Volume in Exhausts: China
0
0.2
0.4
0.6
0.8
1
1.2
1.4
1.6
0 50000 100000 150000 200000 250000 300000
Annual Prod. Vol.
Prod
.
Lower complexity, low capital intensity Lower complexity, medium capital intensity
Lower complexity, low capital intensity Lower complexity, medium capital intensity Higher complexity, medium capital intensity Higher complexity, high capital intensity
31
more than 20% of welds are done by robots; and it is labelled ‘medium’ in all
intermediate cases. Two points emerge from these scatters: i) Two of the Indian exhaust makers are manufacturing low volumes
of relatively simple exhausts using highly labour intensive methods (the points to the bottom left of Figure 3.3).
ii) Two of the Chinese producers (but none of the Indian producers) are
using highly capital intensive techniques, in which most welds are done by robot. These plants, however, are not relatively high volume plants, nor do they exhibit unusually high levels of labour productivity (a point to which we return below).
With all these controls and qualifications in place, we may now ask: how do
these levels of labour productivity compare with leading plants in the U.S.,
Japan or Europe? For seats, where techniques of production are closely similar
across countries, labour productivity levels are also closely similar. The
Andersen survey of 1996 identified a productivity level of 1 seat set per man
hour as the median value in their sample, which they identified as their
benchmark for world class productivity levels. Discussions with multinational
seat producers in the course of the present study indicate that this figure
remains valid, and constitutes a norm for world-class producers in high-wage
countries. As Figure 3.1 indicates, the median value for Indian and Chinese
producers is approximately 1, suggesting that world class norms are being
achieved.
In relation to exhausts, a different picture emerges. Here, a wide range of
levels of capital-intensity can be used, as we have seen. Given local wage
rates, and setting quality consideration aside, it will be economically optimal
for Chinese and Indian firms to employ a relatively labour intensive
technique, leading to a lower level of labour productivity (which does not
imply a lower level of total factor productivity).

32
The median level of labour productivity in both Chinese and Indian plants is
about 1 unit per man-hour. This compares with a threshold figure of 6 units
per man-hour for the plants surveyed in the Andersen study of 1996, which
identified this median figure for the firms it surveyed as the threshold of
world-class performance. Discussions with multinational exhaust producers
suggest that this figure remains valid as a norm for world class plants in high-
wage countries.
If all plants in India and China were using relatively labour-intensive
techniques, this gap in labour productivity levels would be unsurprising. What
is of interest, is that a wide range of levels of capital intensity are in use; and
while a very low degree of capital intensity implies low productivity (finding
(i) above), the use of robot-based production does not lead to very high levels
of labour productivity. The benefits of shifting to a more capital intensive
technique lie elsewhere (see Box 3). In the next section, we turn to the central
focus of the study: the benchmarking of quality.

33
Box 3
Why robots? Choice of Technique in Exhaust Manufacture Of the six Chinese exhaust makers, three use robots for some of their welding operations. At first glance this might seem a surprising choice of technique: given low local wage rates, the use of the most capital-intensive of the three available production techniques might seem inappropriate. One payoff from this choice, however, lies in achieving high quality standards – not in terms of the “external defect rate” (the quality of parts delivered to the customer), but rather in terms of minimising the loss of materials in the course of production (scrap losses). The largest component of the firm’s unit costs in exhaust production are accounted for by materials costs (primarily tube and sheet steel), excluding the cost of catalytic converters. The use of robots minimises scrap losses, and the payoff from switching to robots is at its highest on complex welds, such as those on a tube manifold7, or those in which tubes are welded to the (very expensive) catalytic converter unit. Of the three Chinese makers employing robots, one (“Plant A”) uses them only for catalytic converter welds, a second (“Plant B”) uses them primarily for tube manifold welds, while a third (“Plant C”) uses them for the majority of its welding operations (including all front pipe welds, all circular welds on the muffler, and the major welds on the central pipe). An interesting feature of these operations is that the level of manning on sections of the line using robots is very high by the standards of the U.S., Europe or Japan, where a single operator will control several robots: Plant B, by contrast, uses one operative per robot. The payoff lies in the quite unusually low level of scrap losses: while Plant A achieves a loss rate of 2% of the total materials cost (equivalent to 1% of plant sales revenue, corresponding to the threshold level regarded as the norm among multinational exhaust makers), Plant B achieves the extremely low figure of 0.16%. To put this in perspective, it is worth noting that for each $100 Plant spends on materials and components (excluding catalytic converters), it spends only $2.50 on labour. A 2% scrap rate implies a loss of $2 on each $100 spent on materials, and reducing the scrap rate to 0.16% implies a saving of $1.84. To achieve an equal saving on the corresponding labour cost of $2.50 would require a quadrupling of labour productivity.
7 A manifold is the section of an exhaust which joins together the inflow from several pipes into a single flow. This can be made (cheaply) from cast iron, or else by welding sections of steel tube.

34
Quality Benchmarking
Figure 3.5 shows external and internal defect rates, expressed in parts per
million, for 21 of the 24 firms surveyed. (Three firms were unable to supply a
figure for internal defect rates). The most striking feature to emerge relates to
the figures for external defect rates. This is the leading indicator of quality, as
perceived by the purchaser (i.e. the car makers). As noted earlier, a threshold
figure of 100 ppm is currently regarded by leading international car makers as
a benchmark for world class producers.8 This threshold is exceeded for 14 of
the 21 firms, seven from India and seven from China.
Figure 3.5 Internal and External Defect Rates
Note: The scale is logarithmic. Rates below 1 ppm are recorded as 1 ppm. Three firms did not report external defect rates. Two Indian seat makers had almost identical internal and external rates and the corresponding points are indistinguishable at (1,600) on the figure.
8 The Andersen study of 1996 identified a median level of 500 ppm for seats and 100 ppm for exhausts as the threshold for world class standards. However, industry-wide norms have advanced rapidly over the past 7 years, and a figure of 100 ppm is now regarded as the appropriate norm.
0
1
2
3
4
5
0 1 2 3 4
India ExhaustsIndia SeatsChina ExhaustsChina Seats
1 10 100 1000
1
10
100
1000
10,000
External Deflect Rate (ppm)
Internal Defect Rate (ppm)
35
Seat makers in both countries achieve relatively good scores, with those in
India being markedly lower (4 out of 6 having no unit supplied to customers
rejected in the past year). Five out of 6 Chinese seat suppliers have scores
below 100 ppm, though only one has a score comparable to the top four
Indian firms (reporting a level of 10 ppm).
Exhaust producers in both countries have much higher external defect rates:
two Indian producers and one Chinese producer attain rates below 100 ppm,
while two further producers, (both Chinese) achieve rates in the range of 100-
200 ppm. The tail of low performance is longer in India: one firm reported an
external defect rate of 1% (10,000 ppm) while two firms were unable to
supply a figure (and ancillary information on these firms suggest a figure
exceeding 1%).
While external defect rates are directly relevant to buyers, the internal defect
rate provides a key insight into the tightness of quality control during the
production process. The internal rate is based upon a count of all units that are
‘pulled from the line’ during the production process, or which fail to pass first
inspection. (Such units are normally set aside for re-work, though in some
cases they may be scrapped). Internal defect rates are typically much higher
than external rates. As Figure 3.5 illustrates, there is a clear positive
correlation between internal and external rates; both reflect the tightness of
quality control in the production process and in final inspection. External
defect rates for both countries lie mostly in the 1000-10,000 ppm range; one-
half of the Chinese firms and one-half of the Indian firms have rates of 2000
ppm or less, corresponding to the threshold for world class performance in the
Andersen study.

36
These results suggest that the median firm in both countries is operating at, or
close to, international best practice levels. Two ancillary measures of
international best practice confirm this view:
a) The frequency of delivery to customers is widely used as one indicator
of effective coordination between producer and customer. This is typically higher for seat producers, whose plants are usually located in the immediate vicinity of the customer. All six Chinese seat producers, and five of the six Indian producers, deliver at least once per day to their main customer. For exhaust producers, all six Chinese firms deliver at least once a day, though only three of the six Indian producers achieve this level.
b) The level of inventory held is a good ancillary indicator of the tightness
of control of the manufacturing operation. The usual measure is the ‘stock turn ratio’, which is defined as the value of annual production divided by the value of materials and work in progress in the plant on a typical day. Thus a firm that holds one week’s production in the form of materials and work-in-progress and which operates 52 weeks in a year, has a stock turn ratio of 52. Among seat producers in this study, Chinese firms achieve higher turn ratios: four out of six report a turn ratio exceeding 100, corresponding to world class levels in the Andersen study; all 6 Indian firms have ratios in the range 22-52. For exhaust producers, the calculation of stock turn ratios is more difficult, as some raw materials are often held in relatively large quantities as they are sourced from distant steel plants, and there is a concern about stock-outs. Figures on stock turn ratios are less reliable in this case: only 3 of the Chinese firms, and 4 of the Indian firms reported figures. A figure of 35 was the world class threshold in the Andersen study; all but one of the seven reporting firms had a rate in the range 10-50, the exception being an Indian firm (with a ratio of 120).
Productivity and Quality
A natural question to raise in this setting is whether productivity is correlated
with quality across different seat or exhaust plants. Here, there are two forces
at work. One way of cutting external defect rates would be to devote more
personnel to quality control and checking, leading to higher quality and lower

37
productivity, and so to a negative relationship. On the other hand, the
establishment of well-designed working practices might be expected to
contribute to improvements both in productivity and in quality, leading to a
positive relationship. The path-breaking study of Womack et al. on “lean
production” techniques9 found productivity and quality to be uncorrelated
across plants. By contrast, the Anderson study cited earlier found a clear
positive correlation.
The relationship for the plants in the present study is shown in Figures 3.6 (for
seats) and 3.7 (for exhausts). In the case of seats, there is no significant
relationship between productivity and quality. In the case of exhausts, a
(weak) positive relationship is present. (Recalling the fact that productivity
rises with production volume in exhausts (Figure 3.2), this suggests that high
volume exhaust plants might exhibit both higher productivity and higher
quality. However, a regression of quality on production volume, controlling
for product complexity and capital intensity, and joint venture status, in the
manner of Table 3.2 above, indicates that there is no significant link between
production volume and quality).
9 Womack, J. P., D. T. Jones and D. Roos (1990) The Machine That Changed the World: The Story of Lean Production, New York : Rawson Associates. Reprint, HarperPerennial, 1991.

38
Figure 3.6: Productivity versus Quality for Seat Producers
0
1
2
3
-4 -3 -2 -1 01000 100 10ppme (log scale, inverted)
prod
uctiv
ity
India Seats
China Seats
Note: Quality is measure by the external defect rate, shown on a logarithmic scale, as in Figure 3.5. The horizontal axis is inverted here, so that quality increases to the right.

39
Figure 3.7: Productivity versus Quality for Exhaust Producers
0
1
2
3
4
-4 -3 -2 -1 01000 100 10ppme (log scale, inverted)
prod
uctiv
ity
India Exhausts
China Exhausts
Note: Quality is measured as in Figure 3.6.
Summing up
The various measures of performance for seat and exhaust makers suggest that
quality levels in both countries are at, or are close to, international best
practice levels. The challenge for both sets of companies now lies in moving
towards higher level capabilities. Here, the aim is to offer a service to the car-
maker which involves a partnership in design activity. Such activities
nowadays occur at the international, rather than the national level, as seat or
exhaust makers begin from a ‘performance specification’ laid down by the car
maker for a new platform; the seat or exhaust maker then develops a design
that meets the required performance targets. One of the six Indian seat makers
included in the present study is already operating at this level, using a team of

40
200 design engineers to provide new seat designs for the international
market10.
Conclusions The overall picture that emerges from this study is that the development of the
auto industry supply chain in both China and India has proceeded very rapidly
at the level of car makers and their first-tier suppliers: here current standards
of supplier quality are at, or close to, world class standards. The main
weakness of the supply chain lies in the fact that best practice techniques are
permeating down to second tier suppliers in a very slow and uneven manner.
The similarity in the pattern across both countries is striking.
In the decade prior to WTO entry, both countries used domestic content
restrictions to stimulate development of the component industry, with a view
to widening and deepening the benefits accruing from attracting international
car makers. Policies of this kind are not always appropriate, or successful; but
in the present cases the ‘infant industry’ has been successfully nurtured, and
international car-makers show no inclination to turn away from local suppliers
following WTO entry.
One of the key benefits from the development of enhanced capabilities in the
component supply chain lies in the fact that it can lead to increases in exports
of components and sub-assemblies from domestically based firms to overseas
car-makers. While the development of the local supply chain in both countries
has in large part been driven by the presence of multinational car makers,
component exports are driven equally by multinational and domestic firms.
Both India and China have a substantial body of purely domestic firms that
10 Similar developments are evident among Chinese component makers visited in the course of this study; one wheel maker, for example, is designing aluminium alloy wheels for several US car makers.

41
have achieved major successes in export markets; of the top ten component
exporters in China, six are domestic firms; of India’s top 10, half are domestic
firms (and three of these belong to a single domestic industrial group).
A second key benefit from the development of enhanced capabilities among
component suppliers, is that domestic car makers can out-source more
effectively, achieving cost reductions while maintaining quality levels. This
process is now beginning to take hold, particularly in India, where the
Mahindra and Mahindra company has had a major success in following this
route (Box 4).
One of the most striking features of the leading component producers’
strategic decisions lies in their occasional use of highly capital intensive
techniques in these low-wage environments. These choices are heavily driven
by concerns with achieving high levels of quality control in the production
process; for some Chinese exhaust-makers in particular, the use of robots for
welding can lead to substantial gains through the achievement of levels of
scrap wastage that are extremely low.
Another strategic choice, and one which is more readily understandable in a
low-wage environment, is the use of highly qualified individuals for shop-
floor operations. This is particularly striking in India, where some firms have
achieved ‘award class’ levels of export success, by employing an all graduate
work force. (Box 5).
Underlying the rapid advance of first-tier producers towards world-class
levels of quality has been a rapid absorption and diffusion of those working
practices which originated in Japan in the 1960s and ’70-s and became
standard in the U.S. and Europe during the 1990s. These include strong
42
emphasis on cooperation and team-work, the steady improvement of quality
through diagnosis of sources of defects by groups of operatives, and the
immediate implementation of strategies to pre-empt recurrences (‘quality
circles’), the organisation of a tightly coordinated inflow of raw materials and
parts and the outflow of finished

43
Box 4
Piggy-backing the Supply Chain One of the most crucial indirect benefits of the recent wave of international joint ventures in the car industry, lies in the fact that these ventures stimulate the development of capabilities in the domestic supply chain – allowing domestic car makers to benefit from new possibilities in outsourcing from low-price, high quality suppliers. Perhaps the most striking instance of the mechanism in an Indian context is the case of Mahindra and Mahindra, one of India’s leading producers of commercial vehicles and tractors. In 1994, the company went through a major restructuring, one outcome of which was a new policy shift in favour of substantial outsourcing of components and sub-assemblies. Over the following four years, virtually all components, other than engines, transmission systems and body (skin) panels began to be outsourced. For engines, the head and block were bought in from a local supplier in semi-finished form; all transmission components were bought in. For rear axles, the centre bracket was bought in as a casting and machined in-house, but the tubes and shafts were bought in from local suppliers in fully finished form. This shift in reliance on the local supply chain came to a peak with the firm’s introduction of the Scorpio van, a light multi-use vehicle launched in 1998. The Scorpio van was designed in-house, using an Italian design house as a consultant on styling, and the outsourcing policy was pushed to new levels, with a network of 110 local suppliers. This permitted unit production costs to be much lower than would have otherwise been possible, and allowed the Scorpio to be sold at an ex-dealer price (including air-conditioning and power steering) of 5.5 lakh rupees ($11,000), which was around 60% of the price anticipated by industry observers at the time of its launch. Sales of the Scorpio have transformed the financial fortunes of Mahindra and Mahindra during the five years since its launch.
44
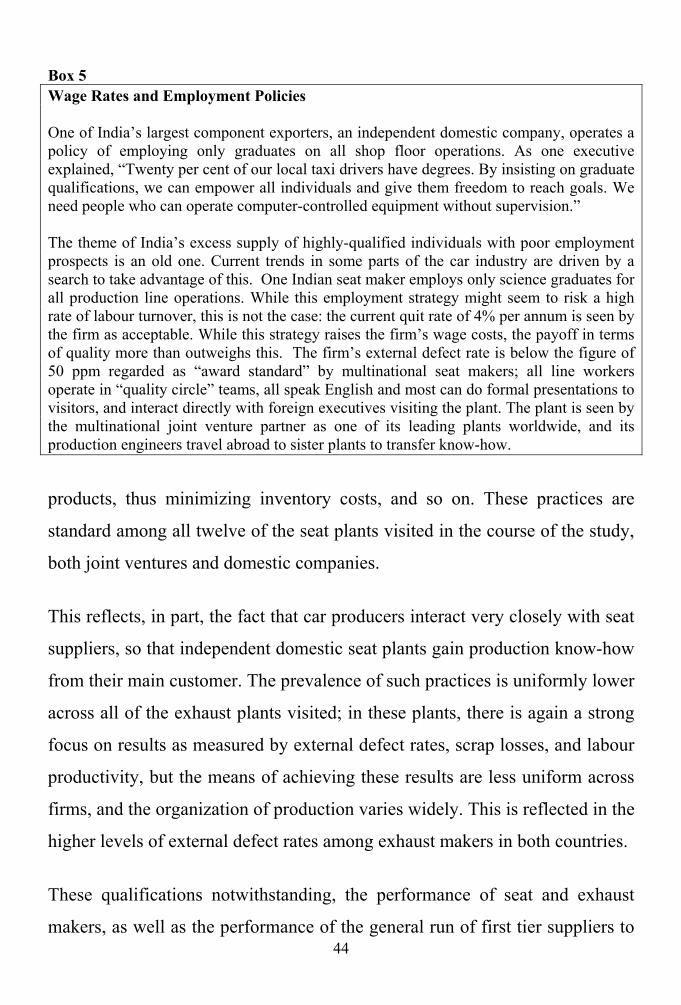
Box 5 Wage Rates and Employment Policies One of India’s largest component exporters, an independent domestic company, operates a policy of employing only graduates on all shop floor operations. As one executive explained, “Twenty per cent of our local taxi drivers have degrees. By insisting on graduate qualifications, we can empower all individuals and give them freedom to reach goals. We need people who can operate computer-controlled equipment without supervision.” The theme of India’s excess supply of highly-qualified individuals with poor employment prospects is an old one. Current trends in some parts of the car industry are driven by a search to take advantage of this. One Indian seat maker employs only science graduates for all production line operations. While this employment strategy might seem to risk a high rate of labour turnover, this is not the case: the current quit rate of 4% per annum is seen by the firm as acceptable. While this strategy raises the firm’s wage costs, the payoff in terms of quality more than outweighs this. The firm’s external defect rate is below the figure of 50 ppm regarded as “award standard” by multinational seat makers; all line workers operate in “quality circle” teams, all speak English and most can do formal presentations to visitors, and interact directly with foreign executives visiting the plant. The plant is seen by the multinational joint venture partner as one of its leading plants worldwide, and its production engineers travel abroad to sister plants to transfer know-how.
products, thus minimizing inventory costs, and so on. These practices are
standard among all twelve of the seat plants visited in the course of the study,
both joint ventures and domestic companies.
This reflects, in part, the fact that car producers interact very closely with seat
suppliers, so that independent domestic seat plants gain production know-how
from their main customer. The prevalence of such practices is uniformly lower
across all of the exhaust plants visited; in these plants, there is again a strong
focus on results as measured by external defect rates, scrap losses, and labour
productivity, but the means of achieving these results are less uniform across
firms, and the organization of production varies widely. This is reflected in the
higher levels of external defect rates among exhaust makers in both countries.
These qualifications notwithstanding, the performance of seat and exhaust
makers, as well as the performance of the general run of first tier suppliers to

45
new generation car makers, has reached levels that are at, or close to,
international best practice. The main challenge now facing the industries lies
in the extension of international best practice to second and third tier
component suppliers.


