The association between work-related potential stressors ...repository.essex.ac.uk/22914/1/Thesis...
238
1 The association between work-related potential stressors, self-compassion and perceived stress in IAPT therapists. E. Kostaki A thesis submitted for the degree of Doctorate in Clinical Psychology (D Clin Psych) School of Health and Social Care University of Essex April 2018
Transcript of The association between work-related potential stressors ...repository.essex.ac.uk/22914/1/Thesis...

1
The association between work-related potential stressors, self-compassion and
perceived stress in IAPT therapists.
E. Kostaki
A thesis submitted for the degree of Doctorate in Clinical Psychology
(D Clin Psych)
School of Health and Social Care
University of Essex
April 2018

2
Acknowledgements
I am immensely grateful to have been supported in different ways by a large
number of generous people during completing this project.
I am indebted to all the IAPT therapists who gave freely of their time and took
part in my thesis research. This project would not have been possible had it not been
for their generosity.
I am very thankful for the support of my supervisors, Dr Leanne Andrews and
Dr Syd Hiskey, who have enthusiastically shared their knowledge and expertise, and
have been a source of continuous encouragement.
I am hugely appreciative of the help and support of my fellow trainees. While
they each had their own stressors to manage, their open attitude was paramount in
enabling me to connect to a feeling of ‘togetherness’.
I am grateful for David’s kindness which allowed me to relate to myself with
compassion in stressful times. I have reflected on our conversations many times and
they are always a source of comfort and encouragement.
I am appreciative for the support of my friends who have kept me grounded
and whose commitment, passion and perseverance are inspirational.
I am deeply thankful to Kwun, whose kind, understanding and compassionate
presence has been infinitely encouraging. Thank you for helping me maintain a
balanced perspective and reminding me to have fun!
Lastly, I am deeply grateful for the support of my family whose love and
encouragement has been important to me not only during this project but throughout
my life.

3
Contents
1. Abstract …………………………………………………………………11
2. Introduction……………………………………………………………...13
2.1 Stress …………………………………………………………………..13
2.1.1 Psychological theories of stress ……………………………….....13
2.1.1.1 Stress response approach …………………………………..13
2.1.1.2 Stimulus-based approach …………………………………..15
2.1.1.3 Transactional approach……………………………………..16
2.1.1.4 Theoretical orientation of the present study ……………….18
2.1.2 Stress and work ………………………………………………….18
2.1.2.1 Work related stressors ……………………………………...19
2.1.2.2 Theoretical conceptualisation of work stress ………………21
2.1.2.3 Stress and workers’ demographics …………………………23
2.1.2.4 Impact of stress in workers …………………………………24
2.1.2.5 Stress in healthcare professionals …………………………..26
2.1.2.5.1 Stress in mental health professionals ………………......27
2.1.3 Stress: Summary …………………………………………………28
2.2 The Improving Access to Psychological Therapies (IAPT)
programme ………………………………………………………………...30
2.2.1 Conception of the IAPT programme ……………………..………30
2.2.2 IAPT structure and service delivery ……………………………...32
2.2.3 IAPT therapists …………………………………………………...35
2.2.4 IAPT programme summary ………………………………………37
2.3 IAPT and NHS values……….…………………………………………37
2.4 Compassion in healthcare ……………………………………………...38

4
2.5 Self-compassion ………………………………………………………38
2.5.1 Psychological theories for compassion and self-compassion ……39
2.5.1.1 Compassionate mind theory ………………………………..39
2.5.1.2 Self-compassion theory ……………………………………..41
2.5.1.3 Points of connection between Gilbert and Neff’s theories ….42
2.5.2 Compassion towards oneself and others as a trait or a state ……...44
2.5.3 Self-compassion and wellbeing …………………………………..44
2.5.4 Self-compassion and perceived stress …………………………….46
2.5.4.1 Studies involving healthcare professionals …………………50
2.5.4.2 Studies involving individuals with chronic physical health
conditions …………………………………………………………………..54
2.5.4.3 Studies involving students ………………………………….56
2.5.4.4 Studies involving miscellaneous samples …………………..59
2.5.4.5 Summary of studies on self-compassion and perceived
stress ……………………………………………………………………….62
2.6 Could self-compassion be a protective factor in relation to stress for IAPT
therapists? A summary of the rational leading up to the present
thesis project ……………………………………………………………….63
2.7 Research aims and objectives …………………………………………..64
3. Method …………………………………………………………………...65
3.1 Epistemological position ……………………………………………….65
3.1.1 Positivism …………………………………………………………65
3.1.2 Social constructionism …………………………………………….67
3.1.3 Critical realism …………………………………………………….68
3.1.4 Epistemological positioning in the present study …………………69

5
3.2 Design ………………………………………………………………….70
3.3. Participants …………………………………………………………….70
3.3.1 Recruitment information ………………………………………….71
3.4 Sample size ……………………………………………………………..73
3.5 Measures .………………………………………………………………74
3.5.1 Perceived Stress Scale-10 (PSS-10; Cohen & Williamson,
1988) ……………………………………………………………………….74
3.5.2 Self-Compassion Scale (SCS; Neff, 2003a) ………………………76
3.5.3 HSE Management Standards Indicator Tool (Cousins et al.,
2004) ………………………………………………………………………..77
3.5.4 Demographics questionnaire ……………………………………...80
3.6 Scoring……………………………………………………………….…81
3.7 Analysis …………………………………………………………….…..82
3.8 Ethical considerations ……………………………………………….….83
3.9 Procedure …………………………………………………………..……85
3.10 Dissemination ………………………………………………………....87
4. Results …………………………………………………………………....88
4.1 Data input ……………………………………………………………….88
4.2 Participation Rate …………………………………………………….....88
4.3 Descriptive data analyses …………………………………………….....88
4.3.1 Categorical demographic variables ……………………………......88
4.3.2 Ratio demographic variables ……………………………………....94
4.3.2.1 Assumption of normality analyses ………………………..…94
4.3.2.2 Descriptive statistics for ratio demographic variables …...…..95
4.3.3 Main study variables ……………………………………………….97

6
4.3.3.1 Assumption of normality analyses ……………………….…97
4.3.3.2 Descriptive statistics for main study variables ………….….99
4.4 Checking for confounding variables ……………………………….….103
4.4.1 Ratio demographic variables ……………………………….…….103
4.4.1.1 Spearman’s correlation coefficient ……………………..…..103
4.4.2 Dichotomous demographic variables ………………………….....104
4.4.2.1 Parametric testing assumptions ……………………………..106
4.4.2.2 Point and rank biserial correlations ……………………...….106
4.4.3 Categorical variables with more than two levels ……………..….107
4.4.4 Confounding variables conclusion …………………………..…..108
4.5 Research aim A: Levels of perceived stress amongst IAPT
therapists ……………………………………………..…………………...109
4.6 Research aim B: Exploring self-compassion as a moderator of the
relationship between work related potential stressors and perceived
stress ……………………………………………………………………..111
4.6.1 Correlations between self-compassion and work-related
stressors and perceived stress…………………………………………….112
4.6.2 Moderation analyses ……………………………………………114
4.6.3 Model cleansing strategy analyses ……………………………..116
4.6.3.1 Demands …………………………………………………..116
4.6.3.2 Control ………………………………………………….…118
4.6.3.3 Managerial support …………………………………….….120
4.6.3.4 Colleague support …………………………………………122
4.6.3.5 Role ………………………………………………………..124
4.6.3.6 Relationship ………………………………………….….....126

7
4.6.3.7 Change …………………………………………………….128
4.6.4 Checking analysis assumptions and considerations …………….130
4.6.4.1 Moderation analysis assumptions …………………………130
4.7 Summary of results …………………………………………………..132
5. Discussion …………………………………………………………..…133
5.1 Project summary ……………………………………………………..133
5.1.1 Levels of perceived stress in the sample of IAPT therapists …...133
5.1.1.1 Normative levels of perceived stress ……………………..134
5.1.1.2 Stress in healthcare professionals ……………………..….134
5.1.2 Moderation effect …………………………………………..…..136
5.2 Strengths and limitations of the project ……………………………...141
5.2.1 Sampling …………………………………………………….….141
5.2.2 Design …………………………………………………………..144
5.2.3 Method of data collection …………………………….................145
5.2.4 Measures …………………………………………………..…....146
5.3 Implications …………………………………………………………..149
5.3.1 Implications for theory ………………………………………….149
5.3.2 Implications for practice ……………………………..................151
5.3.3 Implications for future research ………………………………...155
5.4 Research summary ………………………………………..................158
6. References …………………………………………………................159
7. Appendices …………………………………………………………….187
Appendix A: Steps in literature search …………………………………..187
Appendix B: Online study information sheet …………………………….188
Appendix C: Online Debrief Page ………………………………………..191

8
Appendix D: Institutions offering IAPT training ……………....................193
Appendix F: Online Consent Form ………………………………………..195
Appendix G: End of study message for participants who do not consent…196
Appendix H: Perceived Stress Scale (Cohen & Williamson, 1988)……….198
Appendix I: Self-compassion Scale (Neff, 2003a) ………………………..199
Appendix J: HSE Management Standards Indicator Tool (Cousins, Mackay,
Clarke, Kelly, Kelly, & McCaig, 2004) ……………………………………202
Appendix K: Demographics questionnaire ………………………………...204
Appendix L: University of Essex Ethics Committee Approval ……………207
Appendix M: University of Essex Ethics Committee Amendment Request
Approval ………………………………………………………………...…209
Appendix N: Normality assumption analyses for ratio demographic
variables…………………………………………………………………….210
Appendix O: Normality assumption analyses for the main study
variables……………………………………………………………………212
Appendix P: Normality assumptions Perceived Stress (N= 200)………….214
Appendix Q: Moderation analyses with mean centering…………………..215
Appendix R: Assumptions for fit and generalisability of model cleansing
strategy analyses ………………………………………………………..…216
Appendix S: Scatterplots assessing linearity …………………………..….229
Appendix T: Residual graphs …………………………………………..…232
List of tables:
Table 2.1 Studies with healthcare professionals ……………………………52
Table 2.2 Studies of individuals with physical health conditions……….…..55

9
Table 2.3 Studies of student samples ……………………………………….57
Table 2.4 Studies of miscellaneous samples ……………………………..…61
Table 3.1 Employment status ………………………………………………..89
Table 3.2 Job role ……………………………………………………………89
Table 3.3 Working hours …………………………………………………....90
Table 3.4 Gender ……………………………………………………………91
Table 3.5 Ethnicity ………………………………………………………….92
Table 3.6 Religion …………………………………………………………..92
Table 3.7 Marital status ……………………………………………………..93
Table 3.8 Education level ………………………………………………...…94
Table 3.9 Descriptive statistics for interval ratio demographic variables……96
Table 3.10 Descriptive statistics for work-related potential stressors
(N= 207) …………………………………………………………… ……..100
Table 3.11 Descriptive statistics for self-compassion (N= 207) …………..102
Table 3.12 Spearman’s rho correlations for demographic variables …..…..104
Table 3.13 Levels of perceived stress by employment status and job role ..110
Table 3.14 Perceived stress at different educational levels ……………….110
Table 3.15 Correlations between the moderator and the dependent and
independent variables (N= 200) ……………………………………………113
Table 3.16 Correlations between the dependent and independent
variables………………………………………………………………….…114
Table 3.17 Multiple regression coefficients: perceived stress as outcome
variable, and confounders, HSE demands and self-compassion as
predictors ………………………………………………………………..…117

10
Table 3.18 Multiple regression coefficients: perceived stress as outcome
variable, and confounders, HSE control and self-compassion as
predictors …………………………………………………………………119
Table 3.19 Multiple regression coefficients: perceived stress as outcome
variable, and confounders, HSE managerial support and self-compassion as
predictors………………………………………………………………….121
Table 3.20 Multiple regression coefficients: perceived stress as outcome
variable, and confounders, HSE colleague support and self-compassion as
predictors ………………………………………………………………….123
Table 3.21 Multiple regression coefficient: perceived stress as outcome
variable, and confounders, HSE role and self-compassion as
predictors …………………………………………………………….…...125
Table 3.22 Multiple regression coefficients: perceived stress as outcome
variable, and confounders, HSE relationship and self-compassion as
predictors …………………………………………………………………127
Table 3.23 Multiple regression coefficients: perceived stress as outcome
variable, and confounders, HSE change and self-compassion as
predictors ………………………………………………………………...129
List of figures
Figure 1. Article inclusion decision diagram ……………………………..48

11
1. Abstract
Improving Access to Psychological Therapies (IAPT) therapists form a
relatively new workforce delivering psychological interventions to people with mild
to moderate mental health difficulties in often high-volume environments
(Department of Health [DOH], 2008c). Emerging research has suggested that
working as an IAPT therapist can be a demanding and stressful role (Walket & Percy,
2014; Westwood, Morison, Allt, & Holmes, 2017). Work-related stressors have been
linked to physical and mental health difficulties (e.g. Bosma, et al., 1997; Stansfeld,
Fuhrer, Shipley, & Marmot, 1999) and the financial cost of stress related illness is
considerable (Blaug, Kenyon, & Lekhi, 2007). Across the literature stress has been
conceptualised in a variety of ways (Cooper, Dewe, & O’Driscoll, 2001). The
transactional approach understands stress through the relational processes between
the person and the environment (Lazarus, 2006). Self-compassion (Gilbert, 2010a;
Neff, 2003b), a way of self-relating in times of hardship and suffering, has
predominately been inversely associated with perceived stress and has been linked to
psychological wellbeing (Neff & Costigan, 2014). This quantitative cross-sectional
online project explored IAPT therapists’ levels of perceived stress and examined
whether self-compassion moderated the relationship between work-related stressors
and perceived stress in IAPT therapists. IAPT therapists reported experiencing levels
of perceived stress that were higher than the norm. Self-compassion did not moderate
the relationship between work-related stressors and perceived stress. Multiple
regressions, employed as model cleansing strategies, revealed that work-related
stressors and self-compassion are independent predictors of perceived stress in IAPT
therapists and that self-compassion is more strongly related to perceived stress than
work-related stressors. The study demonstrates the applicability of Lazarus’ (2006)
12
approach in workplace research. The findings are discussed in relation to self-
compassion theory (Neff, 2003b) and affective regulation systems (Gilbert, 2006),
and are considered in relation to future research and practical implications around
workplace wellbeing.

13
2. Introduction
This chapter serves as an introduction to the topic of stress, self-compassion,
and the Improving Access to Psychological Wellbeing (IAPT) programme in relation
to the research project conducted. As such, the literature is reviewed not in an
exhaustive manner but in a way that scaffolds an understanding of the specific study.
2.1 Stress
The term “stress” is used in everyday life, the media and science (Cooper et
al., 2001; Lyon, 2012). It is used to describe a subjective experience and has been
linked to mental and physical health (Lyon, 2012). Although stress commonly holds
negative connotations, and interventions have been designed to aid its reduction (e.g.
Kabat-Zinn, 2013), it is also acknowledged that experiencing a low level of stress is
normal and could be beneficial when one is faced with a novel or daunting task
(Public Health England, 2017).
2.1.1 Psychological theories of stress
Over the years, stress has been conceptualised in a variety of ways (Cooper et.
al., 2001; Devonport, 2011). Three categories represent the most salient theoretical
orientations with respect to stress (Lyon, 2012), namely the stress response approach,
the stimulus-based approach and the transactional approach.
2.1.1.1 Stress response approach
Hans Selye (Selye, 1936, 1978) is the main thinker associated with the stress
response approach. Drawing from the field of medicine, he is primarily interested in

14
organisms’ physiological response patterns (Cooper et al., 2001) and defines stress as
“the nonspecific response of the body to any demand” made on it (Selye, 1978, p.1)
The term ‘General Adaptation Syndrome’ (Selye, 1978) describes organisms’
physiological response pattern, which is non-specific to the evoking stimulus and
involving of three phases, namely alarm reaction, resistance and exhaustion. These
phases are sequential (Selye, 1936, 1978); the alarm phase represents the shock
reaction to the stimulus. Providing the organism survives the first phase, the alarm
reaction subsides and is followed by the stage of resistance, an attempt to adapt to the
stimulus. Exhaustion, the third phase of the syndrome, characterised by a depletion of
the organism’s resistance resources and eventually death, occurs when the stimulus is
persisting, and the organism is unable to return to its original state of being.
The significant body of research examining the physiological response to
stress in humans since the late 1970s (Lyon, 2012) could be thought of as being in
line with response based approach. While it has been argued that physiological
indices alone cannot fully account for the stress response and the magnitude of the
stress response (Lindsey, 1993 in Lyon, 2012), this line of research has made
important contributions to the field of stress enabling a better appreciation of how
various physiological markers such as “heart rate, blood pressure, plasma and urinary
cortisols, and antibody production” (Lyon, 2012, p.4) change depending on stress
levels.
Cooper et al. (2001) have critiqued the stress response approach as being
unsophisticated and inconsiderate of the variability in stress reactions, which are
homogenously grouped under the umbrella term ‘stress response’. Evidence has been
found against the non-specificity of the stress response; Cox (1993) and Lyon (2012)
discuss the evidence pointing towards a variability in the stress response pattern. It

15
has also been pointed out (Devonport, 2011) that the response-based
conceptualisation suggests that individuals passively respond to stimuli, which are
additionally largely ignored by this approach (Cooper et al., 2001). Cox (1993) noted
that the response-based approach predominantly ignores the psychological and
cognitive processing variability between individuals, as well as the interplay between
the individual and the existing environmental context.
Post-Selye thinking in the response-based approach (e.g. McEwen, 1998;
McEwen & Wingfield, 2003 as cited in Rice, 2012), acknowledges the importance of
one’s perception of the situation and the role of environmental stressors, life events,
and individual differences in the physiological response.
2.1.1.2 Stimulus-based approach
The stimulus-oriented approach conceptualises stress as an external stimulus
exerted over individuals resulting in the evocation of a reaction. This approach has a
conceptualisation deriving from physics and engineering (Cooper et al., 2001), and is
influenced by industrialisation (Cohen & Rambur, 2012). Damage occurs when the
stress exerted exceeds the individuals’ endurance capacity (Cooper et al., 2001). This
conceptualisation of stress has been critiqued as being inadequately descriptive of the
characteristics of the stress stimuli and reactions, and ignoring of individuals’
personal qualities and differences, and of the processes by which the reaction occurs
(Cooper et al., 2001).
Holmes and Rahe’s (1967) conceptualisation of stress in relation to life events
and changes is an example of a stimulus-based approach. More specifically, Holmes
and Rahe’s (1967) Social Readjustment Rating Scale identifies 43 life events that
require adaptation or adjustment. The assumptions of this model have been

16
characterised as “inherently problematic” (Lyon, 2012, p. 6) as they do not take into
account individual differences in adaptation to life changes and in readjustment
thresholds and are inconsiderate of individual appraisal processes.
Kanner, Coyne, Schaefer and Lazarus (1981) turn their attention to a different
set of stimuli, namely every day hassles and uplifts. The minor events
conceptualisation moves away from a simplistic view of stress as being purely
external and independent of the organism as it acknowledges individual differences in
responding to stimuli and takes into account the cognitive appraisal and emotional
processes involved in the transaction with the environment (Kanner et al., 1981;
Lazarus, 2006).
Considering that the significant body of research aimed at systematically
identifying, categorising, and examining a host of different types of stressors could be
seen as aligning itself with the stimulus-based approach, this way of conceptualising
stress could be thought of as contributing to the knowledge base by drawing attention
to a different set of factors implicated in the stress phenomenon, namely the smaller
or bigger life experiences and stimuli that are linked to stress.
2.1.1.3 Transactional approach
Transactional definitions of stress focus on the relational processes between
the environment and the person that make up the stressful experience (Lazarus, 2006).
As such, appraising, “the act of making the evaluation” (Lazarus, 2006, p. 75) and
appraisal, “the evaluative product” (Lazarus, 2006, p.75) are key features in the
transactional process (Lazarus, 2006, 2012) and harm, threat and challenge are
regarded as “fundamental types of stress” (Lazarus, 2006, p. 85).

17
Primary appraising of the situation involves an evaluation of whether one’s
goals, commitments, values and beliefs are at risk. Should the outcome of the
assessment be that harm has occurred, threat is perceived, or challenge is identified, a
secondary cognitive process of appraising one’s coping options takes place. This
account takes into consideration the individual and contextual characteristics which
come into play in the appraising process and affect the appraisal outcome (Lazarus,
2006). The role of coping as potentially being capable of decreasing stress by altering
the relationship between the person and the environment or by shifting the
connotations of the relationship (Lazarus, 2006) is also highlighted.
A key strength of the transactional approach to stress could be seen as
drawing the focus on the relational process that happens between the person and the
environment. The transactional approach acknowledges the existence of individual
and contextual characteristics and places an emphasis on how the transaction between
the two contributes to the experience of stress through appraising and assigning of
personal meaning.
The use of the transactional approach in workplace settings has been
criticized. Brief and George (1995) discuss how the transactional approach may place
more emphasis on stress as it is experienced at an individual and intraindividual level
and may be less interested in factors operating at a contextual level. They therefore
suggest that the transactional approach may not be useful in identifying the work
conditions “likely to affect adversely the psychological wellbeing of most persons
exposed to them” (Brief & George, 1995, p.16). Harris (1995) also suggests that
applying the transactional approach to work settings may require attending to the
effects of the environment and points towards the methodological difficulties of
focusing on the interaction between environment and people. Nonetheless, it is

18
acknowledged that despite its limitations, the application of the transactional theory
on stress as it is experienced in the workplace has produced promising research and it
is “without doubt that the occupational stress field will benefit from carful and
thoughtful application of the transaction process model” (Harris, 1995, p. 27).
2.1.1.4 Theoretical orientation of the present study
In the present study, stress is the dependent variable under investigation and is
understood as the response of the individual to circumstances in their lives. It is
however noteworthy that this study centres around stress as it is perceived by
individuals; stress is, in other words, understood at a psychological rather than a
physiological level. Moreover, the study extends beyond simply thinking of stress as
a response and recognises the different factors associated with stress and the
mechanisms moderating the experience of stress. Thus, a more sophisticated
conceptualisation of the stress experience is reached which takes into account the
transaction of the individual with the environment. As such, the research is in keeping
with the transactional approach to stress.
2.1.2 Stress and work
Work, or in other words what one does as part of their job (Rundell & Fox,
2007), has undergone a variety of transformations over the last 60 years (Cooper,
2000; Cooper et al., 2001; de Jogne & Kompier, 1997; Schabracq & Cooper, 2000).
Organisations keep up with the pace of changes imposed by new technological
developments and growing globalisation by alterations to priorities, structure and
processes involved in work. More specifically, organisations place emphasis on
technologies and production processes, flexible working and employee training, and

19
have a tendency to becoming multinational merged corporate structures, which are
“lean and mean” (Schabracq & Cooper, 2000, p. 232) with a system of contracted
workers and departments (Schabracq & Cooper, 2000). The effects of these changes
cascade onto individual employees who experience a variety of stressors in their work
lives (Schabracq & Cooper, 2000).
2.1.2.1 Work-related stressors
In the early 1990’s and in an attempt to understand and manage the important
and extensive occupational health problem of stress at work, the Health and Safety
Commission contracted Cox (1993) to undertake a review of the literature with
regards to workplace stress (Cousins et al., 2004).
Cox’s (1993) review produced a taxonomy of physical and psychosocial
stressors. Physical stressors are identified in aspects of the physical work
environment such as levels of noise whereas psychosocial stressors arise in the
context and content of the work (Cox, 1993). Contextual psychosocial stressors
include the organisational culture, one’s job role and career development, the level of
control one has over their work, their relationships with others at work, and the
tensions existing between home- and work- life. Psychosocial stressors relating to the
content of work can stem from the job design, the demands in terms of workload and
work pace, and the patterns of work. Cox’s (1993) findings are reflected in Cartwright
and Cooper’s (1997) dynamics of work stress model which includes intrinsic job
characteristics, roles in the organisation, relationships with colleagues, career
development, structure and climate of the organisation, and non-work factors as
sources of work related stress (Cartwright & Cooper, 1997).

20
Not only has Cox’s (1993) review contributed to the systematic identification
of work-related potential stressors impacting on the wellbeing and performance of
employees irrespective of the size of the organisation (Cousins et al., 2004; MacKay,
Cousins, Kelly, Lee, & McCaig, 2004), but its findings are also reflected in models of
stress and inform subsequent Health and Safety Executive (HSE) standards for
managing stress at work (Cousins et al., 2004). More specifically, in the early 2000s,
the HSE Management Standards approach was rigorously developed with the aim of
tackling work-related stress in the UK (Cousins et al., 2004). The approach includes
three elements; firstly, a set of ‘states to be achieved’ in relation to good management
practice in six key areas of work related potential stressors, secondly, a risk
assessment process for evaluating employees’ stress and the organisation’s
performance against the standards, and, thirdly, a risk indicator tool to enable the
process of screening for stressors and risk assessing (Cousins et al., 2004).
The six work-related potential stressors included in the HSE Management
Standards approach and operationalised in the indicator tool are: workload demands,
including factors specifically related to the demands of the role; perceived control
over work, which entails the level of control an individual has over their job; support
(managerial and peer), which includes the amount of help the individual perceives
that they can have from their colleagues and management; relationships at work,
including the nature of relationships with colleagues and supervisors and the
existence of conflict and strain; clarity of role, which entails a good understanding of
one’s role within the organisation; organisational change, which relates to how any
change is communicated and managed in the organisation (Cousins et al., 2004).

21
2.1.2.2 Theoretical conceptualisation of work stress
There have been several conceptualisations of work-related stress (Cooper et
al., 2001). The job demand-control-support model (Karasek, Triantis & Chaudhry,
1982) incorporates the knowledge regarding sources of work-related stress in the
domains of demand, control and support. It offers eight scenarios depending on the
values (high or low) which the three components of the model (demand, control,
support) take (Johnson & Hall, 1988). The most unfavourable scenario involves a
situation of continuous strain where work demands are high, perceived control is low
and social support is low (de Jogne & Kompier, 1997). A buffering hypothesis
proposes that social support can buffer the effects of a strenuous work environment
on wellbeing (Karasek et al., 1982). The model has been used in studies exploring the
relationship between work and wellbeing (Johnson & Hall, 1988; Johnson, Hall, &
Theorell, 1989) and in research on work-related stress in healthcare workers
(Landsbergis, 1988).
There is a clear overlap between the job demand-control-support model
(Karasek et al., 1982) and the stressors included in the HSE Management Standards
approach and indicator tool (Cousins et al., 2004). The HSE approach and indicator
tool (Cousins et al., 2004) outline potential stressors in terms of workload demands,
levels of control over one’s work and support from management and other colleagues.
Nonetheless, the HSE approach and tool (Cousins et al., 2004), developed
significantly after the Karasek et al. (1982) model, extend beyond these three domains
of potential concern and incorporate a number of other areas which have the potential
to become stressors in the workplace (i.e. relationships at work, clarity of role,
organisational communication and management of change).

22
In their critical evaluation of the demand-control-support model, de Jogne and
Kompier (1997) report that the model is supported by epidemiological studies
examining the impact of demand and control workplace stressors on people’s health.
They, however, review evidence that suggests that more often stressors seem to
individually impact on people rather than have an interactional effect, which is not
clearly defined by the model (de Jogne & Kompier, 1997). They also outline evidence
supporting the idea that curvilinear relationships exist between demand and control
and workers’ wellbeing (de Jogne & Kompier, 1997). More specifically, they discuss
how a U-shaped relationship can occur when low and high decision latitude can result
in strain and note evidence from studies pointing towards a curvilinear relationship
between i) decision latitude and job satisfaction and ii) job demands, and job
satisfaction, job-related anxiety and job-related depression (de Jogne & Kompier,
1997).
Another criticism to the model relates to the conceptualisation and
operationalisation of demand and control. More specifically, it has been thought that
demands and control are multidimensional job characteristics running across different
levels in the organisation (e.g. individual, departmental) and can often overlap
conceptually and operationally in the workplace (de Jogne & Kompier, 1997). It has
also been suggested that the model has attracted more attention for its ability to offer
a way of thinking about job strain compared to its potential to support the
understanding of workplace environments as learning and development domains (de
Jogne & Kompier, 1997).
The simplicity of the model, its inability to account for individual
characteristics, its constraints in predicting effects of stressors in single occupation
groups and the fact that the congruence between objective and subjective appraisal of

23
the work environment has not been attended to adequately are listed as further
limitations of the model (de Jogne & Kompier, 1997).
Another popular approach to thinking about workplace stress is the person-
environment fit (Edwards & Cooper, 1990). This approach, taken up in a variety
theoretical and research domains posits that stress occurs due to a perceived mismatch
between the person’s characteristics and the workplace environment (Edwards &
Cooper, 1990). Rounds and Tracey (1990) note the assumptions that underpin the
person-environment fit; (i) individuals look for or create environments that support
them in showing their traits, (ii) increased fit between a person and their environment
links to better outcomes for the individual and the organisation, and (iii) a bi-
directional influence exists between environment and individuals.
It is clear that the person-environment fit approach acknowledges the role of
workers’ individual differences, and the importance of subjective appraisal of the
environmental and personal characteristic in the person-environment transaction. As
such it is congruent with the idea of measuring stress as it is perceived by individuals
as opposed through the use of more objective measures.
There have been several critiques of the person-environment fit model
including difficulties in conceptualising and measuring the fit, and problems in
analysing the effects of the fit (Edwards & Cooper, 1990).
2.1.2.3 Stress and workers’ demographics
A variety of variables have been associated with stress. Studies have indicated
that gender, age, education level, years of experience and working hours are related to
stress in workers (Balakrishnamurthy & Shankar, 2009; Blaug et al., 2007; Lunau,
Siegrist, Dragano, & Wahrendorf, 2015).

24
In a sample of counselling psychologists in training, younger participants
reported significantly higher levels of stress compared to older participants; in the
same sample, females reported higher levels of stress compared to males (Kumary &
Baker, 2008).
Moreover, junior Clinical Psychologists were found to be more stressed and
more likely to report levels of psychological distress that meet caseness than their
more experienced counterparts (Cushway, Tyler & Nolan, 1996). This result could be
regarded as somewhat inconsistent with Robinson’s (2015) finding that years of
clinical experience were positively correlated with stress in a sample of Clinical
Psychologists (Robinson, 2015)
In a review of the studies on Clinical Psychologist in Britain, Cushway and
Tyler (1996) concluded that more trainee clinical psychologist reported experiencing
distress than qualified professional groups. Additionally, Robinson (2015) found that
trainees reported significantly more distress that qualified Clinical Psychologists.
A study examining stress and psychological distress in workers would
therefore benefit from collecting information on participants’ gender, age, education
level, years of experience, employment status (trainee/ qualified) and working hours
not only in order to describe their sample but also in order to examine whether these
variables are related to stress and psychological distress.
2.1.2.4 Impact of stress in workers
Stress has been found to have a negative impact on professionals’ physical
and psychological wellbeing and their effectiveness at an individual and
organisational level. More specifically, stress has been shown to affect cognitive,
communication and decision-making skills (Lehner, Seyed-Solorforough, O’Connor,
25
Sak, & Mullin, 1997; Miller, Stiff, & Ellis, 1988) and the provision of compassionate
care (Firth-Cozens & Cornwell, 2009). Moreover, stress has been linked to burnout
(Morse, Salyers, Rollins, Monroe-DeVita, & Pfahler, 2012), absenteeism and
presenteeism (Cooper & Dewe, 2008), and to depression and anxiety (Odgen &
Mtandabari, 1997).
In a recent meta-analysis, Nixon, Mazzola, Bauer, Krueger, and Spector
(2011) explored the links between different work stressors and physical illnesses
cross-sectionally and longitudinally. The stressors they examined included conflict
with others at work, lack of control, organisational barriers to completing duties and
performing at work, role clarity, role conflict, workload demands and work hours
(Nixon et al., 2011). The physical health problems investigated included “backache,
headache, eye strain, sleep disturbance, dizziness, fatigue, appetite loss, and
gastrointestinal problems” (Nixon et al., 2011, p.3) as well as an aggregate score.
Nixon et al. (2011) found that, when examined cross-sectionally, all stressors were
associated positively to the composite physical health score, with organisational
constraints, role conflict, interpersonal conflict, and workload correlating the
strongest with overall physical symptoms compared to other stressors. A comparison
of the longitudinal and cross-sectional findings suggested a degree of temporal
consistency in the relationship between stressors and physical health (Nixon et al.,
2011). Lastly, in examining the links between individual stressors and physical health
difficulties, interpersonal conflict, organizational constraints, and workload were
significantly associated with every individual health problem.
In term of links between specific stressors and more severe physical illness,
the Whitehall Studies examined social determinants of health in British civil servants
and found that low job control is linked to coronary heart disease (Bosma et al.,

26
1997). Additionally, low work demands, work control and support were linked to
absences from work (North, Syme, Feeney, Shirpley & Marmot, 1996).
With respect to psychological wellbeing and work stressors, Clark et al.
(2012) found that work and non-work stressors had an independent effect on common
mental illnesses. Moreover, low support, low control and high demands have been
found to be linked to increased risk of psychiatric disorders (Stansfeld et al., 1999).
Stansfeld and Candy (2006) further explored the relationship between the work-
related stressors and mental health though a meta-analysis and found that “job strain,
low decision latitude, low social support, high psychological demands, effort-reward
imbalance, and high job insecurity predicted common mental health disorders”
(Stansfeld & Candy, 2006, p.443).
The cost of stress and work-related illness has been estimated as ranging
between £5 and 12 billion pounds, and stress and stress-related illnesses account for
12.8 million lost working days per year in the UK (Blaug et al., 2007). In 2015- 2016,
work-related stress accounted for over a third of work related ill health and for almost
half work days lost (HSE, 2016).
2.1.2.5 Stress in healthcare professionals
Since the 1970s, the National Healthcare Service (NHS) has been undergoing
a series of transformations and changes (Litwinenko & Cooper, 1995; McAuley,
2010; The Kings Fund, 2017). Schabracq and Cooper’s (2000) views on
organisational changes impacting on workers may thus explain the finding of a
consistently higher than average prevalence of stress in public health and social care
services (Blaug et al., 2007; HSE, 2016). Additionally, professional occupations have
been reported to be the category with the highest prevalence of work-related stress

27
out of all occupations (HSE, 2016). Consequently, research has investigated the
source and effects of stress in a variety of healthcare professionals including medical
doctors (e.g. Cooper, Rout, & Faragher, 2013) and general nurses (e.g. Rout, 2000).
2.1.2.5.1 Stress in mental health professionals
Mental health professionals are exposed to similar work-related stressors as
other employees but face additional emotional demands specifically related to their
role (Frajo-Apor, Padeller, Kemmler, & Hofer, 2016; Moore & Cooper, 1996).
More specifically, it has been suggested that extensive and intensive patient
work (Pines & Maslach, 1978) leads to experiences of stress in mental health
professionals. Moreover, factors such as holding clinical responsibility and working
with distressed patients who relapse, have been identified as additional stressors in
community mental health professionals (Reid et al., 1999).
Considering the emotional strain involved in their work, there is a
considerable body of literature regarding stress in professionals offering talking
therapy (e.g. Varma, 1997). Results from a recent survey show that 70% of a sample
of psychological therapies professionals found their work stressful (British
Psychological Society & New Savoy Partnership, 2016).
More detailed information regarding the levels of stress experienced by
professionals delivering psychological therapies comes from samples of trainee and
qualified clinical psychologist who have been found to experience high levels of
stress (Cushway, 1992; Cushway & Tyler, 1994; Darongkamas, Burton & Cushway,
1994). More specifically, Cushway (1992) found that 75% of trainees reported being
moderately or very stressed due to their training. Stressors reported by the trainees
related to “course structure and organisation”, “workload”, “poor supervision”,
28
“disruption of social support”,” self-doubt”, “client difficulties and distress”
(Cushway, 1992, p.174). Qualified psychologists also seem to experience high levels
of stress; in Darongkamas et al. (1994), 78% clinical psychologists reported being
moderately or very stressed by their job and in Cushway and Tyler’s (1994) study the
percentage was 75%.
Trainee and qualified clinical psychologists have reported distress meeting
criteria for clinical disorders such as anxiety or depression (Cushway, 1992; Cushway
& Tyler, 1994; Darongkamas et al. 1994; Robinson, 2015). Cushway (1992) found
that the prevalence of psychological distress at a level of clinical disturbance in
trainee clinical psychologist was 59%. In Darongkamas et al. (1994) study of clinical
psychologist, 24% of the sample reported experiencing distress “suggestive of a
nonpsychotic emotional illness” (Darongkamas et al., 1994, p.167). Cushway and
Tyler (1994) found that 29.4% of qualified psychologist met the levels suggestive of
clinical disturbance. Robinson (2015) found that in the United Kingdom a third of
trainee and a fifth of qualified clinical psychologists reported psychological distress
that met the clinical criteria for anxiety or depressive disorder.
These findings provide support to the idea that therapists are at risk of stress-
related psychological difficulties (Shapiro, Brown, & Biegel, 2007).
2.1.3. Stress: Summary
Across the literature stress and workplace stress has been conceptualised in a
variety of ways (Cooper et al., 2001) and research into workplace stress has led to the
identification and operationalisation of a number of work-related potential stressors
(e.g. Cox, 1993; Cousins et al., 2004). The present study aligns itself with the
transactional approach to stress which takes into account the relational processes

29
between the person and the environment (Lazarus,2006). The negative impact of
stress both on an individual and on a broader level is well documented; work-related
stressors have been linked to physical and mental health difficulties (e.g. Bosma et
al., 1997; Stansfeld et al., 1999) and the financial cost of stress related illness is
considerable (Blaug et al., 2007).
Considering that workers in public health and social care services have been
found to have consistently higher than average prevalence of stress (Blaug et al.,
2007; HSE, 2016) and workers in mental health services are considered to face
additional emotional demands related to their role, it is unsurprising that professionals
delivering psychological therapies have been found to experience high levels of stress
and distress (e.g. Cushway, 1992; Cushway & Tyler, 1994; Darongkamas et al., 1994;
Robinson, 2015).
Recent years have seen “changes to the composition of the psychological
therapies workforce” (Centre for Workforce Intelligence, 2013, p.10) through the
advent of the Improving Access to Psychological Therapies (IAPT) programme.
More specifically, the IAPT initiative involved the recruitment and training of a
substantial number of therapists and the formation of a new therapists’ workforce.
Considering what is already known about the experiences of stress in professionals
delivering psychological therapies, the new workforce of therapists created by the
IAPT initiative may merit a closer examination in terms of their working context and
their experiences of stress.

30
2.2 The Improving Access to Psychological Therapies (IAPT) programme
2.2.1 Conception of the IAPT programme
The IAPT programme is a government-funded initiative (Marzillier & Hall,
2009) looking to make evidence-based psychological therapy more accessible to
people with common mental health problems (specifically mild to moderate anxiety
and depression) living in Britain (London School of Economics [LSE], 2006).
The initiative was a response to a report published by the Mental Health
Policy Group of the Centre for Economic Performance at the London School of
Economics (LSE, 2006). The report, also known as the Layard Report or the
Depression Report, highlights the high prevalence of common mental health
difficulties such as anxiety and depression in the context of a lack of trained
therapists, able to deliver evidence-based psychological interventions (LSE, 2006).
The argument that these interventions could cure at least half of the people
affected from depression and anxiety at a cost of £750 per individual treatment and
considering that the incapacity benefits cost £750 per month, led Professor Lord
Richard Layard and his group to the conclusion that if the individual “works just a
month more as a result of the treatment, the treatment pays for itself” (LSE, 2006,
p.1).
It could be argued that the IAPT initiative has improved access to
psychological treatment. Clark (2011) noted how “a large number of people who
would not otherwise have had the opportunity to receive evidence based
psychological treatment have accessed, and benefited from, the new IAPT services”
(Clark, 2011, p. 375). More specifically, the IAPT programme is currently being
accessed by around 900,000 people each year and over 550,000 progress to receive
psychological therapy (The National Collaborating Centre for Mental Health

31
[NCCMH], 2018). It is noteworthy that the number of people accessing IAPT
services is expected to further increase; it is estimated that by 2020/2021 one and a
half million adults with depression or anxiety will access IAPT each year (NCCMH,
2018). While the access to IAPT has been arguably significant and while currently
two out of three people having a course of IAPT treatment “show worthwhile
improvements in their mental health” (NCCMH, 2018, p.5), it has been
acknowledged that the targeted outcome of a 50% recovery rate was initially “an
elusive target but it was finally achieved in January 2017” (NCCMH, 2018, p.5)
The IAPT programme is currently, amongst other priorities, looking towards
improving “quality and people’s experience of services” (NCCMH, 2018, p.6). There
is also an emphasis on working towards “equity access and outcomes for all”
(NCCMH, 2018, p.54) and towards the delivery of integrated care whilst involving
users of services in the process of co-production.
Despite these notable aspirations and strengths, since its inception, the IAPT
program has received critiques regarding its economic character. While it is
acknowledged that the IAPT programme aims to promote wellbeing (LSE, 2006)
through improving access to psychological therapies, the major programme driver has
been seen as making financial savings by returning people to work and reducing
reliance on incapacity benefits and absenteeism (Binnie, 2015; Marzillier & Hall,
2009). The emphasis on workability as a predetermined outcome for successful
therapy (Watts, 2015) can be thought to be difficult to match at an ideological and
ethical level with delivering psychological therapy within a health care setting, where
the ‘good’ outcome cannot be named (House & Loewenthal, 2008 as cited in Watts,
2015). It could additionally be argued that these priorities together with tendering

32
pressures may cascade downwards contributing to practices that make Binnie (2015)
think of a “therapy factory” (Binnie, 2015, p.80).
2.2.2 IAPT structure and service delivery
The ambition of the team led by Professor Layard (LSE, 2006) was to form a
therapy service to which people with depression and anxiety can self-refer or be
referred to by general practitioners, the Job Centre or Occupational Health Services.
The links with employment extend beyond the referral pathway to the team
composition and working environment. More specifically, service plans included
nationwide rolling out of 250 teams, which would largely operate in primary care
settings, workplaces, third sector settings and job centres (LSE, 2006). Moreover,
while the programme included training a new workforce of 10,000 therapists to
deliver the evidence-based interventions, the plan for the service also included
employment advisers, and benefit and housing advisers (LSE, 2006). The service plan
additionally focussed on having a hierarchy of supervision within teams,
implementing a rigorous monitoring of treatment outcomes and providing “on-the-job
training” (LSE, 2006, p.9).
The IAPT programme implementation began in 2008 following two
demonstration sites in Doncaster and Newham (DOH, 2008a). It was given a starting
budget of £300m which made it the biggest ever government investment in
psychological therapies within the NHS (Marziller & Hall, 2009). This budget was
later increased with an allocation of a further £400m (DOH, 2012).
Following the rolling out of the programme with working age adults, the
IAPT programme looked at expanding to older adults, children and young people,
33
long-term conditions, medically unexplained symptoms, and severe mental illness
(DOH, 2011).
The main therapeutic modality in IAPT is Cognitive Behavioural Therapy
(CBT) (Clark et al., 2009) which is recommended by the National Institute for
Clinical Excellence (NICE, 2009, 2011) for both depression and anxiety.
Interventions are delivered following a person-centred assessment (DOH, 2008d) and
according to the stepped care model (Bower & Gilbody, 2005) which is a model of
service delivery. Step two (low intensity) treatments are offered to most individuals
with mild and moderate difficulties; individuals who do not benefit from low
intensity treatments or who present more complex difficulties are offered step three
(high intensity) interventions (DOH, 2008b, 2008d, 2011). Low intensity
interventions are routinely brief and involve a watch-and-wait approach, guided self-
help (which may be delivered over the phone), up to seven sessions of face-to-face
psychological intervention or computerised CBT (DOH, 2008d). High intensity
interventions involve a longer course (up to 20 sessions) of face-to-face psychological
therapy (DOH, 2008d).
The IAPT program has received critiques regarding its model for
conceptualising mental health and the evidence-base from which it draws upon. It
has been thought that the LSE (2006) report includes a “naïve view of mental health
problems” (Marzillier & Hall, 2009, p. 396). Language referring to curing (LSE,
2006), diagnosing and treating (Binnie, 2015) and the medical definition of
‘recovery’ targets (NHS Digital, 2017) could be regarded as ill-fitting in the context
of the government’s view of recovery as distinct from symptoms and illness (DOH,
2001) and its focus on promoting a holistic sense of wellbeing through policies
(Cabinet Office, 2013).

34
Furthermore, according to the medical model of psychological distress,
depression and anxiety are viewed as discrete psychiatric conditions (Marzillier &
Hall, 2009) linked almost linearly and in a prescribed way to specific manualised
treatments (Binnie, 2015) involving, in the step two domain, an emphasis on self-
management (Risq, 2011). As such, the broader contextual determinants, the
comorbidity and the complexity of mental health difficulties are thought to be largely
ignored (Binnie, 2015; Marzillier & Hall, 2009; Timimi, 2015) and the responsibility
for recovery is seen as being placed within the individual (Risq, 2011; Watts, 2015).
Marzillier and Hall (2009) have also drawn attention to the LSE report’s
“overly optimistic assessment of how effective psychological treatments may be”
(Marzillier & Hall, 2009, p. 396). This claim could be thought of in relation to the
evidence on which the IAPT interventions are based. The NICE evidence on which
IAPT interventions are based has been questioned (McPherson, Evans, Richardson
2009). Marzillier and Hall (2009) have pointed out that “the transition from carefully
controlled research trials to the messy reality of clinical practice- from efficacy to
effectiveness- is not straightforward” (Marzillier & Hall, 2009, p. 399). The National
Collaborating Centre for Mental Health has recently noted how “some attenuation of
clinical outcomes when treatments are implemented outside the artificial environment
of a clinical trial” is expected (NCCMH, 2018, p.5). Additionally, flaws have been
found in the principles of the systematic reviews involved in the development of
treatment guidelines (McPherson, 2017); NICE privileges randomised control trials
and places less emphasis on follow up data and recovery indexes that move away
from symptoms and illnesses, such as functioning and quality of life (McPherson,
2017; McPherson et al., 2009).

35
Marzillier and Hall (2009) have also suggested that CBT - the main treatment
modality offered by IAPT- alone may not benefit the majority of individuals with
serious or complex difficulties; this may be particularly relevant given the expansion
of the IAPT programme for different groups of people (e.g. severe mental illness). It
is also, noteworthy, that the IAPT programme is reported as having poorer recovery
rates that pre-IAPT services or third sector counselling services and not positively
impacting the number of people relying on incapacity benefits (Timimi, 2015), and
only met the 50% recovery target for all individuals having treatment in January 2017
(NCCMH, 2018).
2.2.3 IAPT therapists
Therapists are trained through nationwide programmes to deliver either low or
high intensity interventions. According to the Department of Health (2008d), high
intensity workers are usually clinical psychologists, psychotherapists, nurses,
counsellors and other professionals, whereas low intensity workers come from a
variety of backgrounds including psychology graduates. Both high and low intensity
courses are year-long and trainees spend one (low intensity) or two (high intensity)
days in a training institution and the other days of the week in their workplace
delivering the interventions under supervision (DOH, 2008d).
The IAPT working environment is intense with low intensity workers
expected to work in high volume environments with a caseload of 45 active cases at
any one time; delivering interventions for between 175-250 patients per year (DOH,
2008c). The emphasis on outcomes is echoed in the close monitoring of therapists
(Risq, 2011; Whatts, 2015) and therapy outcomes (DOH, 2008d); evaluation of low
intensity workers’ performance occurs against “their clinical, social and employment

36
outcomes” (DOH, 2008c, p.3). Low intensity workers are asked to focus on “social
inclusion – including return to work or other meaningful activity- as well as clinical
improvement” for the people they work with. (DOH, 2008c, p.5).
Data-driven reflective practice is also being used to improve outcomes
(NCCMH, 2018); this can take the form of (i) a service reviewing the data collected
over a period of time to inform changes to the service provision, which are in turn
monitored in terms of outcome evaluation, (ii) monitoring outcomes by team,
modality and type of difficulty, (iii) outcome-focused and live supervision, (iv)
planned continuous professional development, and (v) examining patterns of reliable
improvement and deterioration.
The non-traditional routes of developing the IAPT workforce (Health
Education England, 2017) and the employment of non-traditional modes of
intervention delivery (Baguley et al., 2010) alongside the high workload intensely
monitored and structured IAPT practices may contribute to an experience of work in
an IAPT setting that is significantly different than in non- or pre-IAPT mental health
services and may be linked to experiences of high stress in IAPT therapists.
Literature around IAPT staff’s experiences is recently tentatively emerging
with some studies identifying stressors including high volume and target driven job,
change, resources, team stressors, training demands, management of client distress
and risk, and home-work conflict (Walket & Percy, 2014). Evidence of high stress is
also starting to be found; more recently 29.5% of a sample of IAPT staff were found
to be experiencing psychological stress which reached levels for minor psychiatric
disturbance (Walket & Percy, 2014). In a different study, the prevalence of burnout
amongst step two practitioners was 68.6% and amongst step three therapists was 50%
(Westwood, et al., 2017). The picture of a stressful working environment (Walket &

37
Percy, 2014) where there is high prevalence of burnout (Westwood et al., 2017) is
completed by considerable difficulties in therapists’ retention (Risq, 2011).
2.2.4 IAPT programme summary
The IAPT programme is a government-funded initiative aiming to make
psychological therapy more accessible to people with common mental health
difficulties. Its implementation has changed the landscape of mental health provision
(Rizq, 2011; Watts, 2015) with a new workforce being employed and trained to
deliver interventions according to a stepped care model. The initiative behind and the
implementation of the IAPT programme has received several criticisms and concerns
have been raised regarding the demands it places on therapists engaging emotionally
and responding to the needs of people accessing the service.
2.3 IAPT and NHS values
There is a clear relationship between the IAPT programme and the wider
NHS, launched after the second world war with a plan to offer good healthcare to all
free at the point of delivery (NHS Choices, 2015), as it is acknowledged that “IAPT is
run by the NHS in England” (NHS Digital, 2017, p.1).
While the NHS has undergone a variety of transformations over the years, the
initial vision is still present in the seven key principles, outlined by the NHS
Constitution (DOH, 2015), that guide its operation today. These principles relate to
the provision of an available to all comprehensive service, that is based on clinical
need and not one’s ability to pay (DOH, 2015). There is also a commitment to the
provision of a high standard and accountable service centred around the patient and in
38
collaboration with other stakeholders and organisations, with the understanding of the
importance of providing the best value for money and using resources in a fair and
sustainable way.
The guiding principles are underpinned by six values which were developed
with the contributions of patient, staff and the public (DOH, 2015). The NHS values
highlight the importance of collaborative work in the interest of patients, the
promotion of respect and dignity, the commitment to providing high quality care,
improving lives and an inclusive practice, and the centrality of compassion in the
delivery of care (DOH, 2015).
2.4 Compassion in healthcare
Compassion, an ability to sensitively respond to another person’s suffering
and attempt to alleviate it, forms one of the fundamental values of the NHS (DOH,
2015). Evidence has shown that compassionate care can be hindered due to stress and
burnout induced by organisational structures (Firth-Cozens & Cornwell, 2009) but
may be enabled through adopting a compassionate stance towards oneself (Gustin &
Wagner, 2013). Considering the stressor-laden environment in which IAPT therapists
work, self-compassion might be of interest to explore in this professional group,
especially in relation to their perceived stress levels and work-related stressors.
2.5 Self-compassion
Despite having a longstanding presence in eastern traditions, compassion
towards oneself and others has only relatively recently attracted the attention of
psychology in the West (Gilbert, 2006; Neff, 2003b). Western thinking has retained
the conceptualisation of compassion in relation to suffering or adversity central to the
39
Buddha’s teachings (Gilbert, 2010b) where loving-kindness and compassion were
routes to “the release from suffering for all” (Gilbert, 2006, p.1).
Self-compassion is a way of self-relating in times of difficulty that is
characterised by (i) self-kindness, involving holding a kind attitude towards oneself,
as opposed to self-judgement, involving a critical approach towards oneself, (ii)
common humanity, entailing perceiving one’s experiences as also shared by other
human beings versus perceiving one’s experience in isolation, and (iii) mindfulness,
allowing for an awareness of ones’ experiences in a balanced way versus over-
identification, involving awareness of one’s experience through fixating on certain
aspects of thoughts or emotions (Neff, 2003a, 2016a, 2016b).
2.5.1 Psychological theories for compassion and self-compassion
Two psychological theories have been developed with respect to compassion
in western psychology, Professor Paul Gilbert’s compassionate mind theory and Dr
Kristin Neff’s theory of self-compassion.
2.5.1.1 Compassionate mind theory
According to Gilbert (2010b) who draws on the Dalai Lama, compassion
entails an awareness of the suffering in oneself and others together with a desire and
attempt to alleviate it. Compassion is regarded as emerging from “a combination of
motives, emotions, thoughts and behaviours” (Gilbert, 2006, p.1).
Gilbert’s theory examines compassion towards self and others from an
evolutionary perspective and explains the function of compassion in the context of the
social world and in relation to neurological emotion regulation systems (Gilbert,
2006, 2010a, 2010b).

40
Gilbert (2006, 2010a) discusses the evolutionary function of three emotion
regulation systems; one geared towards threat and defence and two oriented towards
different positive emotions, namely the incentive-resource focussed system and the
affiliation-focussed system. It is proposed that reciprocal interactions between these
three types of emotion regulation systems create patterns of neural connections and
that the maturation of these patterns is impacted upon by genetic and environmental
influences (Gilbert, 2006).
The threat-focused system is thought to offer protection for oneself and of
others through a process whereby threats originating in the external environment
(social and non-social) or through one’s self-awareness (e.g. one’s thoughts and
feelings) trigger a speedy brain response which translates into defensive and safety
seeking behaviours (Gilbert, 2006, 2010a).
Cortisol, a stress hormone, is thought to be important in the threat-focussed
system (Gilbert, 2010a). In conditions of threat, elevated cortisol has been posited to
have a self-preservative function and has been linked to a state of arousal and anxiety
but also to a reaction of defeat and depression (Gilbert, 2006). In order to make sense
of the cortisol levels in relation to self-preservation, it is suggested that one needs to
attend to contextual, physiological and psychological factors and that while greater
loss of control and greater distress are linked to greater elevations of cortisol, in states
of extreme lack of control, a response that involves the suppression of cortisol levels
and disengagement or shutting off from the environment, can also have a self-
preservative function (Gilbert, 2006).
The incentive-resource focussed system relates to feelings of drive and
excitement and the seeking of rewards and pleasure (Gilbert, 2006, 2010a). The
pursuit of goals and resources is key to survival. Dopamine, a neurotransmitter, is

41
linked to experiencing an “energized and hyped-up good feeling” (Gilbert, 2010b,
p.47) and is thought to be important for human drives. The good feelings generated
by the incentive-resource focussed system are thought to motivate and guide our
pleasure and resource seeking behaviours (Gilbert, 2010b).
The affiliation-focussed system is characterised by the experience of soothing
feelings such as contentment/non-striving, calm, connectedness, and safeness
(Gilbert, 2006, 2010a). It is argued that the experience of feeling soothed when being
cared for in a warm way since infancy creates a link between the experience of
contentment and affection and kindness (Gilbert, 2010a). One’s capacity to self-
soothe is therefore thought to be linked to one’s ability to be kind and compassionate
towards oneself (Gilbert, 2010a). On a biological level, the release of endorphins and
oxytocin are thought to help generate feelings of calmness, safeness and
connectedness, contentment and compassion (Carter, 1998; Gilbert, 2010a; Lee &
James, 2012). Compassion towards oneself is not seen as a distinct concept but is
instead viewed jointly with compassion towards others in Gilbert’s compassionate
mind theory.
2.5.1.2 Self-compassion theory
Neff (2003a), on the other hand, takes a primary interest in self-compassion
drawing from the Insight Buddhism (Neff, 2016b). According to Neff (2003a, 2016a,
2016b), self-compassion has three facets, or components, each of which has a positive
and negative aspect representing compassionate and uncompassionate behaviours; (i)
self-kindness, involving holding a kind attitude towards oneself, as opposed to self-
judgement, involving a critical approach towards oneself, (ii) common humanity,
entailing perceiving one’s experiences as also shared by other human beings versus

42
perceiving one’s experience in isolation, and (iii) mindfulness, allowing for an
awareness of ones’ experiences in a balanced way versus over-identification,
involving awareness of one’s experience through fixating on certain aspects of
thoughts or emotions.
The three facets of self-compassion, while being “conceptually distinct” (Neff,
2003a, p. 224), are thought to “mutually enhance and engender one another” (Neff,
2003a, p. 225) and be dynamically inter-connected (Neff, 2016b). Self-compassion
not only involves how one responds emotionally to one’s failure or shortcomings, but
also how one makes sense of one’s experience and attends to their circumstances
(Neff, 2016a, 2016b).
Neff (2003a, 2003b) discusses how self-compassion is conceptually different
from self-esteem and tends to promote an interest in the other through its non-
evaluative and interconnected nature. It is also thought that self-compassion is distinct
from self-pity through its attitude of mindfully acknowledging the commonality of
human suffering (Neff, 2003a, 2003b).
2.5.1.3 Points of connection between Gilbert and Neff’s theories
Gilbert and Neff’s conceptualisations of self-compassion overlap as they both
understand this way of self-relating with regards to the more general construct of
compassion; Gilbert appears to view self-compassion jointly with compassion
towards others and Neff seeks to understand self-compassion with regards to “what it
means to feel compassion more generally” (Neff & Dahm, 2014, p. 121). They also
both acknowledge the importance of feeling connected with others and the relevance
of the context and life experiences in the development of compassion towards
oneself.

43
While Neff and Dahm (2014) suggest that an understanding of self-
compassion may be facilitated by considering what compassion more generally
means, Gilbert (2014) makes the link between self-compassion and the more general
construct of compassion by explaining that directing compassion towards oneself is
one direction that compassionate feelings may flow (other directions involve
channelling compassion towards another and receiving compassion from another).
Germer and Neff (2013) also seem to adopt this view as they suggest that self-
compassion “is simply compassion directed inward” (Germer &Neff, 2003, p.856).
As such, it seems that Neff and Gilbert are in line with what is generally
acknowledged, namely that self-compassion shares similarities with the “more
general construct of compassion” (Zessin Dickhauser, & Garbade, 2015, p.343) in
that they both involve a connection with suffering, a feeling of kindness and a desire
to alleviate suffering.
Both Neff and Gilbert emphasise the importance of connectedness in the
experience of compassion towards oneself and others (Gilbert, 2014). Neff (2003b)
calls this experience common humanity and differentiates this from the experience of
isolation whereas Gilbert (2014) discussed the sense of belonging from an
evolutionary and attachment-based perspective.
In fact, while Gilbert bases his approach on evolutionary and attachment
theories and Neff’s model is influenced by Insight Buddhism (Neff, 2016b), Neff and
Dahm (2014) also acknowledge the development of self-compassion within a social
context and attachment-based framework and discuss how self-compassion is linked
to care-giving and receiving and early childhood experiences of social interaction
within the family. As such, Gilbert and Neff both acknowledge social and contextual
influences on the development of self-compassion.

44
2.5.2 Compassion towards oneself and others as a trait or state.
The debate of whether compassion and self-compassion are state- or trait-like
tendencies has attracted interest. Goetz, Keltner and Simon-Thomas (2010) define
compassion as an “affective state” (Goetz et al., 2010 p. 251). They however also
acknowledge that compassion is not only linked to specific situations fluctuating over
time, but can also develop and assume a trait-like quality (Goetz et al., 2010).
Neff’s (2003a) self-compassion measure prompts respondents to think about
how they typically act towards themselves when faced with adversity, suggesting that
a consistency of action and hence a trait-like quality. Neff Kirkpatrick and Rude
(2007) have however argued that it is useful to view self-compassion as amenable to
development. Moreover, Neff and Dahm (2014) discuss how self-compassion skills
can be taught even though trait levels of self-compassion exist.
Strauss et al. (2006) also conceptualise compassion as state- and trait-like and
explain that the existence of compassion focused interventions implies that
compassion is considered a quality that can be developed with practice and over time.
Interventions developed to enhance individuals’ ability to relate to themselves in a
compassionate way include the Compassionate Mind Training, used in Compassion-
Focused Therapy (Gilbert, 2009), and the Mindful Self-Compassion programme
(Neff & Dahm, 2014).
2.5.3 Self-compassion and wellbeing
Self-compassion has started to be considered a “potentially important
protective factor, promoting emotional resilience” (Raes, 2010, p.757) and a

45
“potentially important protective factor for emotional problems such as depression”
(Raes, 2011, p.33).
Moreover, self-compassion has been associated with a host of positive
outcomes in relation to individual wellbeing (Barnard & Curry, 2011; Neff &
Costigan, 2014). While it is acknowledged that the majority of the evidence is
produced by correlational studies, different designs appear to be emerging (e.g. mood
inductions) in the field of self-compassion and wellbeing (Neff & Costigan, 2014).
More specifically, in early papers, increased self-compassion was linked to
reduced depression, anxiety and neurotic perfectionism, and increased life satisfaction
(Neff, 2003a). Its protective role in buffering against anxiety has also been examined
(Neff et al., 2007). The impact of self-compassion on physiology (e.g. tendency to
reduce cortisol levels) and its links with happiness, optimism, gratitude, emotional
intelligence, wisdom, personal initiative, curiosity, intellectual flexibility, social
connectedness, feelings of autonomy, competence, relatedness, and self-
determination, and resilience, and reduced rumination, perfectionism, and fear of
failure, are amongst many beneficial effects (Neff & Costigan, 2014).
Two recent meta-analyses have examined the relationship between self-
compassion and wellbeing, and self-compassion and psychopathology. In a meta-
analysis of 79 samples (Zessin et al., 2015), a positive relationship (average Pearson
correlation of r= .47) was found between self-compassion and positive aspects of
wellbeing. Additionally, MacBeth and Gumley’s (2012) meta-analysis of 20 samples
found a large effect size for the negative association (r= -.54, combined correlation
coefficient) between self-compassion and different psychopathology variables (stress,
anxiety, depressive symptoms). These findings support the idea that self-compassion
is beneficial.

46
Additionally, it has been posited that self-compassion could direct people
towards “proactive behaviours” aimed at fostering their wellbeing or preventing
suffering (Neff, 2003b, p.93). Self-compassion is also thought to potentially be linked
with intrinsic behavioural motivation and a more accurate self-awareness, and
potentially “be related to self-regulation in terms of coping with stress” (Neff, 2003b,
p.94).
More recently, self-compassion has been examined in studies involving
therapists (e.g. Rimes & Wingrove, 2011; Shapiro et al., 2007; Stafford-Brown &
Pakenham, 2012) and it is beginning to be thought of as linked to compassionate care
(Gustin & Wagner, 2013) and therapists’ self-care (Patsiopoulos & Buchanan, 2011).
2.5.4 Self-compassion and perceived stress
Although the relationship between self-compassion and stress was examined
in MacBeth and Gumley’s (2012) meta-analysis, it is noteworthy that the stress scales
(Depression, Anxiety and Stress Scale, Lovibond & Lovibond, 1995; SF-12v2
Mental Health Summary, Ware, Kosinski, & Keller, 1996; Symptoms of Stress
Inventory, Leckie & Thompson, 1979) used did not measure perceived stress but had
a different focus (e.g. stress symptoms) thus not directly and solely measuring the
degree to which respondents appraised their lives as stressful.
Given the importance of the appraisal process in the stress experience as
posited by the transactional theory of stress (Lazarus, 2006) and considering the idea
that self-compassion involves not only how one responds emotionally to one’s failure
or shortcomings, but also how one makes sense of one’s experience and attends to
their circumstances (Neff, 2016a, 2016b), the literature was reviewed to examine the
relationship between self-compassion and perceived stress in adults.

47
A literature search was conducted on the 14th of January 2018 in the following
databases; CINAHL Complete, MEDLINE with Full Text, PsycARTICLES, and
PsycINFO. The search included terms for self-compassion, perceived stress and
correlation and was limited to peer reviewed papers written in the English language
where participants were adult (Appendix A).
The selected search terms were specifically chosen as the author wished to
capture the particular concepts of self-compassion and perceived stress and examine
the correlation between them. While one could argue that these terms are limited, the
author argues that the search terms strike an appropriate balance between sensitivity
and accuracy and the inclusion of broader terms may have shifted the focus from this
particular relationship of interest and yielded a significantly larger number of
irrelevant results.
There were seven inclusion criteria: (i) studies published anytime measuring
perceived stress and self-compassion as outcomes, (ii) studies examining the
correlation between self-compassion and perceived stress, (iii) studies where
participants were individuals (both males and females) over the age of 18 years, (iv)
both clinical and non-clinical samples were included, (v) all types of methods and
designs were included, (vi) studies which were published in peer review journals, and
(vii) studies which were written in the English language were included. The exclusion
criteria involved studies (i) not measuring self-compassion and perceived stress as
outcome variables, (ii) not exploring the correlation between self-compassion and
perceived stress, (iii) where participants were younger than 18 years old, (iv) written
in any language other than English, (v) of theoretical nature or presenting study
protocols, and (vi) that were duplicates. Criteria relating to age, language, and peer
review status were included in the search as limiters.

48
Figure 1. Article inclusion decision diagram.
Abstracts and result sections of the 39 papers produced by the search were
screened; 14 papers were found to be relevant to the review’s aim. Of the 25 papers
excluded, 16 did not report on the association between self-compassion and perceived
stress, one was a duplicate, one did not measure self-compassion as the outcome, one
was written in a language other than English, one presented a study protocol, four
used samples of adolescents, one involved two studies one with adolescents and with
adults where there was no association. The article inclusion decision process can be
seen in Figure 1.
Records excluded
(total n=25)
Reason for exclusion:
- not reporting on the association between self-compassion
and perceived stress (n=16)
-sample of adolescents (n=4)
- duplicate (n=1)
-not measuring self-compassion as the outcome (n=1)
-written in a language other than English (n=1)
- study protocol (n=1)
-paper involving two studies one with adolescents and with
adults where there was no reporting of an association
between self-compassion and perceived stress (n=1)
Studies identified through database search and screened for eligibility
(n=39)
Studies included in the review
(n= 14)

49
The quality rating grading system described by Walfisch, Sermer, Cressman
and Koren (2013), which suitable for all types of quantitative designs, was used to
guide the evaluation of the 14 studies. The quality appraisal was based on the degree
of adherence to standards relating to (i) description of population, comparison groups,
setting, intervention, (ii) appropriate measurement, analysis and reporting, (iii) errors,
(iv) dropout rate and description, and (v) consideration and adjustment for
confounding variables. While a quality grade was not assigned to the included
studies, these standards guided the discussions relating to the interpretations of the
quality of the included studies. The most pertinent limitations of the studies are
commented upon in the narrative below.
The samples of the included studies varied significantly and were thus
reviewed by participant group; studies of healthcare professionals were reviewed first
followed by studies of individuals with chronic physical health conditions, student
samples and miscellaneous samples.
Examining the studies by participant group was thought to be the optimal way
of scaffolding an understanding of the literature in relation to the review question
while enabling a closer examination of the different participant groups and as such
was preferred over adopting a specific framework of synthesis. Moreover, existing
guidance on Narrative synthesis (Popay et al., 2006), a framework for synthesising
literature review findings, is primarily focused on synthesising results of research
examining the (i) effects of interventions and (ii) factors influencing the
implementation of interventions and as such did not feel as relevant to the purposes of
the present review.
In line with recommendations detailed in the Cochrane Handbook for
Systematic Reviews of Interventions (The Cochrane Collaboration, 2011), for each

50
group of participants, a ‘characteristics of included studies’ table drew together the
most relevant information regarding the participants, the study design, the
intervention and the study outcomes. The information presented within each of these
characteristics categories reflected what was deemed to be most relevant to the
present review and did not encompass all the details recommended by the Handbook.
Moreover, the tables in the present review did not include a ‘Notes’ section as it was
deemed that there was no further relevant information that was not covered by the
aforementioned categories. Lastly, despite not being recommended by the Handbook
(The Cochrane Collaboration, 2011), the tables included the relevant findings as it
was thought that this would be of use to the reader.
Cohen’s (1992) guidelines were followed in relation to the understanding of
the magnitude of the observed effects when using Pearson’s correlation coefficient
(.10 small; .30 medium; .50 large).
Considering that many of the studies reviewed did not set out to explore the
relationship between self-compassion and perceived stress as their primary objective,
the aim of each study was briefly noted and the focus then turned to the examination
of the findings relating to the relationship between the variables of interest, namely
self-compassion and perceived stress.
2.5.4.1 Studies involving healthcare professionals
Table 2.1 provides a summary of the main characteristics of the four studies
involving healthcare professionals. Crary (2013) examined the “beliefs, behaviours,
and health” (Crary, 2013, p.74) of a convenience sample of undergraduate student
nurses. This online cross-sectional study found a negative relationship between self-
compassion and perceived stress (r= -.59, p= .001; Crary, 2013).

51
Kemper, Mo and Khayat, (2015) set out to explore the relationship between
self-compassion and mindfulness with variables theoretically related to burnout and
quality of care via an online cross-sectional study. Their diverse sample of young
clinicians and trainees working in an academic health centre reported an inverse
relationship between perceived stress and self-compassion (r= -.55, p< .001; Kemper
et al. 2015).
Another study reporting an inverse relationship between perceived stress and
self-compassion was Olson and Kemper’s (2014) cross-sectional pilot project
exploring factors associated with wellbeing and confidence in delivering
compassionate care. While the small sample of medical trainees reported a strong
negative relationship between the aforementioned concepts (r= -.79), the significance
level of the correlation coefficient in Olson and Kemper (2014) is unclear as it
reported to be p< .05 in text and p< .01 in the correlational matrix.
A randomised controlled study exploring the effects of an abridged
mindfulness intervention on wellness in first year medical students found an
association of a similar direction at baseline for the entire sample (r= -.47, p< .001;
Erogul, Singer, McIntyre, & Stefanov, 2014). Moreover, in exploring the association
between outcomes from baseline to six months following the study, changes in
perceived stress were found to be significantly correlated with changes in self-
compassion in the intervention group (r= -.58, p= .001) but not in the control group
(r= -.35, p= .06) in Erogul et al. (2014).
The studies varied in quality; poor quality was linked to methodological
limitations and poor standard of reporting. Studies suffered from one or more of the
following limitations; small and potentially biased sample (Olson & Kemper, 2014),
self-selection of participants (Crary, 2013; Kemper et al., 2015), borderline

52
Table 2.1
Studies with healthcare professionals
Note. MBSR= Mindfulness Based Stress Reduction, PSS-4= Perceived Stress Scale- 4, PSS-10= Perceived Stress Scale-10, SCS= Self-Compassion Sca
Authors Sample N Participants Design Measures Intervention Result
Crary,
2013 154
Undergraduate
nursing students Cross-
sectional
SCS (12
item); PSS-
10; PSS-4
Negative association between self-
compassion and overall perceived stress (r=
-.59) and nursing school perceived stress
(r= -.46).
Kemper,
Mo, &
Khayat,
2015
213
Young health
professionals
and trainees
Cross-
sectional
SCS (12
item); PSS-
10
Negative association between self-
compassion and perceived stress (r=-.55).
Olson &
Kemper,
2014
12 Medical trainees Cross-
sectional
SCS; PSS-
10
Negative association between perceived
stress and self-compassion (r=-.79).
Erogul,
Singer,
McIntyre,
&
Stefanov,
2014
58 First year
medical students
Randomised
controlled
SCS; PSS-
10
Eight-week abridged
MBSR (75min
session weekly plus
retreat and
homework)
Negative association between self-
compassion and perceived stress at baseline
for the entire sample (r= -.47). Changes in
perceived stress correlated with changes in
self-compassion in the intervention group
(r= -.58) but not in the control group.

53
acceptable drop-out rate (Crary, 2013; Olson & Kemper, 2015), or absence of
information regarding drop-out rates (Kemper et al., 2015).
More specifically, in relation to the critique regarding the small and
potentially biased sample in Olson and Kemper (2014), this project was an
exploratory proof of concept study of a sample of medical trainees due to attend
elective seminar on integrative medicine with a focus on meditation. Although the
majority of participants reported not having had any ‘mind-body training’ over the
past three months, it is likely that these participants may have had a special interest in
self-care practices as they had chosen to attend an elective seminar focusing on
meditation, and may have, as such, differed from the wider population of medical
trainees. If this was the case, the representativeness and generalisability of the study
findings to the population of medical trainees could have been compromised.
With respect to the critique regarding self-selection of participants, (Crary,
2013; Kemper et al., 2015), and considering that the study by Kemper et al. (2015)
was part of a bigger project, participants opting to take part in the studies by Crary
(2013) and Kemper et al.(2015) may have had higher level of interest in wellbeing,
stress, self-care and integrative medicine than those who did not opt to take part. As
such, participants in these studies may have differed significantly from the wider
population and as a result the findings may not be generalisable to the wider
population.
A biased sample can also come about through high drop-out rates, as
participants completing the study may differ significantly from non-completers. The
absence of information regarding drop-out rates in Kemper et al. (2015) made it
impossible to ascertain whether bias may have introduced in their study through
participants dropping-out. When comparing the number of recruited participants with

54
the number of participants having completed the entire survey, the drop-out rate met
(Olson & Kemper, 2015) or was marginally above (Crary, 2013) the cut off of 20%
(Walfisch et al., 2013).
Additionally, the studies suffered with errors or inconsistencies in the
referencing of measures (Crary, 2013; Kemper et al., 2015) and inconsistencies in the
reporting of results (Olson & Kemper, 2014), which led to confusion when
attempting to make sense of the findings.
Whilst it is important to hold in mind the studies’ limitations, it is also
important to note that the findings towards a negative association between self-
compassion and perceived stress with a moderate to large effect size.
2.5.4.2 Studies involving individuals with chronic physical health conditions
Two cross sectional studies reported on the relationship between self-
compassion and perceived stress in samples of individuals with chronic physical
health conditions (Table 2.2).
In their study with individuals infected with the Human Immunodeficiency
Virus (HIV), Brion, Leary and Drabkin (2014) explored whether self-compassion was
protective against the emotional impact of illness and related to adherence with
medical guidance. Brion et al. (2014) used a modified version of the SCS (Neff,
2003a) which involved 12 items (four highest loading items for each subscale). They
also conducted a factor analysis on the PSS-14 before regressing self-compassion,
gender, and their interaction term onto the two retained perceived stress scale factors,
namely successful coping with stressful events, and perceived stress and inability to
cope (Brion et al., 2014).

55
With Brion et al.’s (2014) unconventional approach to measurement and
analysis, a strong partial correlation (sr= -.52, t(161)= 7.72, p< .001) was found
indicating a negative relationship between self-compassion and perceived stress and
inability to cope and an equally strong positive partial correlation (sr= .52, t(161)=
7.69, p< .001) between self-compassion and successful coping with stressors. The
study recruitment relied on self-selection; this may have introduced bias if
participants opting in to the study had a special interest in self-compassion and
differed significantly from those who opted out.
Table 2.2
Studies of individuals with chronic physical health conditions
Note. HIV= Human Immunodeficiency Virus; IBD= Irritable Bowel Disease; PSS-10= Perceived Stress Scale-10,
PSS-14= Perceived Stress Scale-14, SCS=Self-Compassion Scale, sr= semi-partial correlation that controls for
gender.
Sirois, Molnar and Hirsch (2015) set out to explore how self-compassion
related to stress and coping in chronic illness. Sirois et al. (2015) found a negative
relationship with a large effect (r= -.56, p< .05) between self-compassion and
perceived stress in participants with inflammatory bowel disease and participants with
arthritis. The data for this study were gathered at the six-month follow up point of a
larger study not involving an intervention and examining perceptions and adjustment
Authors Sample N Participants Design Measures Result
Brion,
Leary, &
Drabkin,
2014
187 Individuals
with HIV
Cross-
sectional
Modified
SCS;
PSS-14
Self-compassion
predicted more
successful coping with
stressors (sr= .52), and
lower perceived stress
and inability to cope (sr=
-.52)
Sirois,
Molnar, &
Hirsch,
2015
325 (170
with
arthritis
and 155
with IBD)
Individuals
with chronic
inflammatory
conditions
Cross-
sectional
SCS;
PSS-10
Negative association
between self-compassion
and perceived (r= -.56)

56
to illness. Given that their sample was self-selected, predominantly white and female,
and subject to significant drop-out rate (less than half of participants taking part at
Time 1 completed the follow up survey), selection bias may have hindered the degree
of representativeness of the target population (Delgado- Rodriguez & Llorca, 2004).
2.5.4.3 Studies involving students
Table 2.3 shows the details of five studies carried out with student samples.
Sirois (2014) explored the relationship between self-compassion, procastination and
stress across three samples of undergraduate students and a sample of community
adults. The data were collected as part of a larger project focusing on stress, self-
regulation and health. With respect to the relationship between self-compassion and
perceived stress, Sirois (2014) found a strong negative relationship (ρ= -.61, p< .001)
across the four samples.
Pinciotti, Seligowski, and Orcutt (2016) set out to explore the psychometric
properties of a coping flexibility measure and found a strong inverse relationship
between self-compassion and perceived stress in their sample of trauma exposed
psychology students (r= -.66, p< .001).
Fong and Loi (2016) explored the mediating role of self-compassion in
students’ wellbeing and distress. Measures of stress, burnout, negative affect and
depression captured students’ distress. The findings from their online study pointed
towards all measure of distress being negatively associated with self-compassion. In
terms of the relationship of interest, a negative association between self-compassion
and perceived stress (r= -.74) was found but the significance level of this finding was
unclear. More specifically, while the correlation and descriptive statistics table note
read “Correlations ≥ .19 are significant at p<.001) suggesting that the aforementioned

57
Table 2.3
Studies of student samples
Note. PSS-10= Perceived Stress Scale-10, PSS-14= Perceived Stress Scale-14, SCS= Self-Compassion Scale.
a Significance level unclear.
Authors Sample N Participants Design Measures Intervention Result
Pinciotti,
Seligowski,
& Orcutt,
2016
322
Trauma exposed
psychology
students
Cross-sectional SCS;
PSS-10
Negative association between self-compassion and perceived
stress (r= -.66)
Hall, Row,
Wuensch, &
Godley, 2013
182 Psychology college
students Cross-sectional
SCS;
PSS-14
Self-judgement minus self-kindness (β= .22) and over-
identification minus mindfulness (β= .33) predicted perceived
stress. Isolation minus common humanity did not predict
perceived stress.
Fong & Loi,
2016 306
International
tertiary students Cross-sectional
SCS;
PSS-10
Negative association between self-compassion and perceived
stress (r= -.74)a.
Sirois (2014)
768 (total;
sample1:
n= 145;
sample 2: n= 339;
sample 3: n= 190;
sample 4:
n= 94)
Samples 1-3:
Undergraduate
students; Sample 4:
Community adults
Samples1-3: Cross-
sectional Sample 4:
Prospective
(however, reviewed
measures taken at
the follow up time
point)
SCS;
PSS-10
The average correlation between self-compassion and perceived
stress across samples was ρ= -.61.
Greeson,
Juberg,
Maytan,
James, &
Rogers, 2014
Koru group
(n=35) Wait-list
control group
(n=39)
College students Randomised
Controlled
SCS;
PSS-10 Koru
Negative association between changes in self-compassion and
changes in perceived stress in the intervention group (r= -.46)
but not the waitlist control.

58
finding is non-significant, the in-text narrative stated that “higher self-compassion
was associated with higher well-being and lower distress” (Fong & Loi, 2016, p. 6).
Should the negative association found in this study be significant, this result would be
consistent with the results from Sirois (2014) and Pinciotti et al. (2016).
The studies by Sirois (2014), Pinciotti et al. (2016), and Fong and Loi (2016)
were of suboptimal quality and the main shared limitation related to sample
representativeness (all samples were predominantly female). Moreover, Pinciotti et al.
(2016) did not appear to consider and adjust for confounding variables in their study
and seem to retrospectively note the importance of assessing peritrauma reactions and
demographic characteristics in their sample in relation to their key concepts.
In a higher quality randomised controlled trial, Greeson, Juberg, Maytan,
James and Rogers (2014) explored the effects of the Koru mindfulness program on
students. The Koru program is a manualised intervention delivered in a group format
that consists of four 75-minute sessions plus daily private practice and homework.
Participants on the Koru program were compared to a wait list control group. The
study found that changes in self-compassion were linked to changes in perceived
stress in the intervention (r= -.46, p< .01) but not the control group (r= .20, p> .05)
which according to Greeson et al. (2014) confirmed the hypothesis that improvements
in stress and self-compassion are interlinked during the intervention.
Hall, Row, Wuensch, and Godley (2013) set out to explore the role of self-
compassion on wellbeing. Hall et al. (2013) explored the relationship between
perceived stress and self-compassion composite scores. More specifically, they
created three composite scores by subtracting each of the three positive self-
compassion subscales from its corresponding negative subscale. Hall et al. (2013) did

59
not provide any statistical evidence on the validity of measuring self-compassion after
delineating the subscales into composite scores.
Through this unusual way of measuring self-compassion, they too supported
the idea that self-compassion is linked to perceived stress (Hall et al., 2013). More
specifically, the regression model involving the three composite scores was
significant; perceived stress was predicted by the composites involving self-
judgement minus self-kindness (β= .22, p= .04) and over-identification minus
mindfulness (β= .33, p< .01) but the composite involving isolation minus common
humanity did not appear to have a significant unique effect (β= .04, p= .69).
It terms of limitation to this project, in addition to the questionable validity of
the use of composite scores for measurement of self-compassion. Hall et al. (2013)
did not describe their sample or the research setting adequately, nor did they appear to
consider and adjust for confounding variables, such as demographic characteristics
that are known to relate to stress. Furthermore, a reporting error in the discussion
section of the paper was confusing. More specifically, the discussion section stated
that the multiple regression analysis “indicated that all three composites… made
significant unique contributions in predicting perceived stress” (Hall et al., 2013, p.
318) whereas the tabled results and the narrative in the results section indicated that
the isolation minus common humanity composite did not have a significant effect on
perceived stress.
2.5.4.4 Studies involving miscellaneous samples
Table 2.4 presents details of studies conducted with other participant groups,
namely parents and educators of children with developmental challenges (Benn,
Akiva, Arel, & Roeser, 2012), a sample deriving from the general population

60
(Krieger, Harmann, Zimmermann, & Holtforth, 2015), and a sample of “meditation-
naïve” (Rowe, Shepstone, Carnelley, Cavanagh, & Millings, 2016, p.642) adults with
no history of severe mental illness.
Benn et al. (2012) set out to explore the effects of mindfulness training on
caregivers of children with developmental delays. Their robust study compared an
intervention group with a waitlist control group. While the intervention consisted of
nine 2.5h sessions SMART-in-Education (Stress Management and Relaxation
Techniques) school-based mindfulness training sessions, homework, and two full day
retreats over five weeks, the finding that is most relevant to the present review derives
from data gathered from the entire sample at baseline. More specifically, an inverse
relationship between self-compassion and perceived stress was found (r= -.61, p<.01;
Benn et al., 2012).
The objective in Krieger et al. (2015) was to explore the relationship between
self-compassion, perceived stress and self-esteem with mood and stress reactivity.
Participants from the Swiss German-speaking general population reported a
significant negative association between self-compassion and perceived stress (B= -
0.37, p<.05; Krieger et al., 2015). The findings from Krieger et al. (2015) need to be
interpreted with caution as they used a measure of perceived stress which was face
valid. Despite reportedly showing convergent validity with the perceived stress scale
in a dataset deriving from the research group, this evidence regarding the convergent
validity of the employed stress measure was unpublished. In addition to the lack of
published evidence regarding the validity of the stress measure, the sample in Krieger
et al. (2015) was entirely Caucasian and consisted of predominately highly educated
female students; this understandably may have hindered the generalisability of the
findings.
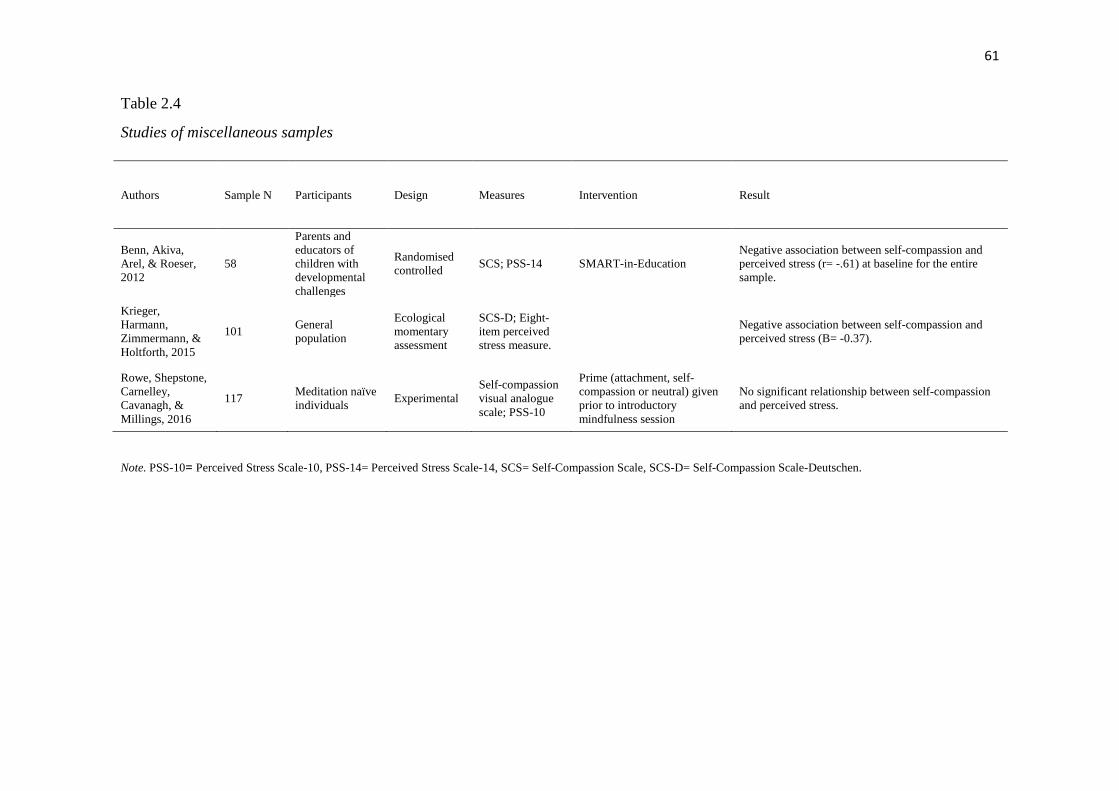
61
Table 2.4
Studies of miscellaneous samples
Note. PSS-10= Perceived Stress Scale-10, PSS-14= Perceived Stress Scale-14, SCS= Self-Compassion Scale, SCS-D= Self-Compassion Scale-Deutschen.
Authors Sample N Participants Design Measures Intervention Result
Benn, Akiva,
Arel, & Roeser,
2012
58
Parents and
educators of
children with
developmental
challenges
Randomised
controlled SCS; PSS-14 SMART-in-Education
Negative association between self-compassion and
perceived stress (r= -.61) at baseline for the entire
sample.
Krieger,
Harmann,
Zimmermann, &
Holtforth, 2015
101 General
population
Ecological
momentary
assessment
SCS-D; Eight-
item perceived
stress measure.
Negative association between self-compassion and
perceived stress (B= -0.37).
Rowe, Shepstone,
Carnelley,
Cavanagh, &
Millings, 2016
117 Meditation naïve
individuals Experimental
Self-compassion
visual analogue
scale; PSS-10
Prime (attachment, self-
compassion or neutral) given
prior to introductory
mindfulness session
No significant relationship between self-compassion
and perceived stress.

62
Rowe et al. (2016) examined whether attachment and self-compassion
priming would make it more likely that meditation naïve individuals continue to
engage in mindfulness practice. Rowe et al. (2016) failed to find a significant
relationship between self-compassion and perceived stress (r=.17, p> 0.5); their
choice to use a single item measure of self-compassion rated via a visual analogue
scale instead of a validated measure of self-compassion may have impacted on this
finding. Moreover, and similarly to Krieger et al. (2015) the sample consisted of
predominately female students, which may have affected the generalisability of the
findings.
2.5.4.5 Summary of studies on self-compassion and perceived stress
While studies in professionals, clinical samples, student samples and other
populations predominately support the idea that there is an inverse relationship
between self-compassion and perceived stress, methodological limitations
compromise the confidence in this claim. As such, it is important that future research
is methodologically robust and moves away from the caveats of non-representative
samples.
Additionally, while the reviewed studies provide some evidence that changes
in self-compassion reported after interventions are linked to changes in perceived
stress in healthcare professionals and college students (Erogul et al., 2014; Greeson et
al., 2014), future research needs to further explore the role self-compassion in the
stress phenomenon when stress is conceptualised as the dependent variable or
outcome of interest. The possibility of future research examining self-compassion’s
potential to, for example, “buffer the negative effects of stress”, has been reflected
upon (Kemper et al., 2015, p.501).

63
2.6 Could self-compassion be a protective factor in relation to stress for IAPT
therapists? A summary of the rational leading up to the present thesis project.
The negative effects of stress have been well documented across the literature;
the impact of work-related stressors (Cousins et al., 2004; Cox, 1993) on workers’
wellbeing (e.g. Bosma et al., 1997; Stansfeld et al., 1999) and the financial cost of
work related illness have been found to be considerable (Blaug, et al., 2007).
Workers in public health and social care services are reported as having a
consistently higher than average prevalence of stress (Blaug et al., 2007; HSE, 2016)
and professionals delivering psychological therapies are found to be experiencing
high levels of stress and distress (e.g. Cushway, 1992; Cushway & Tyler, 1994;
Darongkamas et al., 1994; Robinson, 2015).
Recent years have seen the advent of the IAPT program and a change in the
landscape of the mental health workforce (Centre for Workforce Intelligence, 2013)
through the development of a new workforce of IAPT therapists. While the IAPT
program has looked at expanding and offering services to different clinical
populations (DOH, 2011), difficulties retaining therapists have been documented
(Rizq, 2011) and emerging research suggests that working as an IAPT therapist is a
demanding and stressful role (Walket & Percy, 2014; Westwood et al., 2017).
Considering that the literature review examining the relationship between
perceived stress and self-compassion suggests that these variables are predominately
negatively associated across samples of healthcare professionals and other
populations and given that the review provides some evidence that changes in
perceived stress reported after interventions are linked to changes in self-compassion,
one could wonder whether self-compassion can be a protective factor against stress

64
for health professionals, such as the IAPT therapists, working in potentially
demanding and stressful environments.
Moderation analyses, which provide insights into the possible underlying
processes involved in phenomena examined in cross-sectional research, could provide
a way of exploring self-compassion’s potential to protect against stress in stressful
working environments. Moderation analyses were deemed to be the most suitable
analyses to be conducted as the present study hoped to explore a moderation effect,
i.e. whether the strength or direction of the relationship between each of the seven
work-related potential stressors and perceived stress was affected by self-compassion.
2.7 Research aims and objectives
The present study aims to explore the levels of perceived stress in IAPT
therapists and to examine whether self-compassion moderates the relationship
between work related potential stressors and perceived stress in IAPT therapists.
More specifically, it is hypothesised that self-compassion will moderate the
relationship between (i) workload demands and perceived stress, (ii) perceived
control over workload and perceived stress, (iii) managerial support and perceived
stress, (iv) peer support and perceived stress, (v) relationships and perceived stress,
(vi)role clarity and perceived stress, (vii) management and communication of
organisational change and perceived stress.

65
3. Method
This chapter provides an overview of the study methods. Firstly, a discussion
of the epistemological positioning provides the background to introducing an
overview of the study’s design. A detailed account of participant recruitment and
sample size is followed by a presentation of the measures, and an outline of the data
analysis. Finally, ethical considerations and plans for dissemination of the research
findings are discussed.
3.1 Epistemological position
Hitchcock and Hughes (1995) have argued that one’s ontological position,
which relates to notions regarding reality and ‘the study of being’ (Crotty, 1998,
p.10), influences one’s epistemological stance, which relates to certain ideas
regarding how knowledge of the reality is ‘created, acquired and communicated’
(Scotland, 2012, p. 9), which in turn impacts on the choice of methodology, or in
other words how one goes about acquiring this knowledge. It is therefore important to
reflect on where the present study lies in relation to these concepts, centring the
discussion around epistemology.
3.1.1 Positivism
The historically dominant paradigm for social sciences has been positivism
(McGrath & Johnson, 2007). Positivism, traditionally linked to Comte (Comte,
1948/1908) lies within the realist ontological position, which ascertains that reality
exists independently of the knower (Cohen, Manion, & Morrison, 2007). Assuming
such a position about the nature of reality has implications on how one gets to know
the real world.

66
Objectivism, which dictates that ‘meaning exists in objects independently of
any consciousness’ (Crotty, 1998, p.10) is the epistemological position associated
with positivism. Knowing can be, therefore, characterised as having what Gergen
(1985) calls an exogenic perspective whereby it is lies in the objective reality and is
acquirable. The role of the researcher is, thus, to obtain a type of knowledge which is
representative (Blaikie, 2007), “pure” (McGrath & Johnson, 2007), or in other words
‘mirrors the actualities of the real world’ (Gregen, 1985, p. 269).
The principles used to assist the social researcher in the study of the social
reality are effectively the same as those used to study the natural world (Cohen et al.,
2007). Impartiality (Scotland, 2012) and objectivity, characterise the methodology
and guide the researcher in his endeavour to discover knowledge (McGrath, Johnson,
2007). The deductive and analytical spirit structures the researcher’s approach to
seeking causal relations in the observable phenomena (McGrath & Johnson, 2007).
Generalisability and predictability is sought (Scotland, 2012), and knowledge is seen
as value-free (McGrath & Johnson, 2007) while the political, social and cultural
context is disregarded. Empiricism drives experimental designs and survey research
to discover the truth (Crotty, 1998; Gergen, 1985).
The 20th century marked a shift in the scientific paradigm with the move to
post-positivism (Scotland, 2012) and a questioning of the positivistic approach. The
principles of verification and falsification are now used in the process of scientific
enquiry and knowledge is acquired through the testing of hypotheses (Scotland, 2012;
Popper, 2002). The notion that knowledge deriving from the scientific process ‘must
remain tentative for ever’ (Popper, 2002, p.280) defines a change in the way truth is
conceptualised (move from absolute to tentative).

67
The positivist approach, although dominant, has been subjected to numerous
critiques (McGrath & Johnson, 2007). Psychological research, in particular, has been
critiqued as failing to recognise that ‘psychological phenomena are constituted within
historical, sociocultural traditions of human life’ (Martin, 2015, p.36). Jovanovic
(2010) introduced the idea that language has an active role in organising one’s view
of reality. The knower is therefore not seen as detached from the reality; he is instead
viewed as holding an active role in creating meaning though engaging with the world
(Crotty, 1998). The social, political and historical context is seen as shaping one’s
perception of the world (McGrath & Johnson, 2007). A key approach in science
which argues these points is social constructionism.
3.1.2 Social constructionism
Social constructionism, as an approach, can be positioned either within the
relativist or the realist ontological framework. Whether one accepts that the reality
exists independently of one’s consciousness or not will inform whether one holds a
realist or relativist ontological position (Crotty, 1998) in relation to the constructionist
approach. Given that realism has been previously discussed, it would be useful to
briefly define the concept of relativism. Within a relativist framework, reality and
other concepts are ‘understood as relative to a specific conceptual scheme, theoretical
framework, paradigm, form of life, society, or culture’ (Bernstein, 1993, p. 8).
What differentiates social constructionism from positivism is epistemology;
constructionist epistemology sees knowledge as dependent on human practices, being
constructed through the interaction of individuals with the reality and embedded in a
social context (Crotty, 1998; Gergen, 1985). Meanings are no longer considered to be
independent of the knower and knowledge is no longer seen as a ‘mental
68
representation’ (Gergen, 1985, p. 270); meaning and knowledge are regarded as
‘something that people do together’ (Gergen, 1985, p.270).
Within social constructionism, the researcher is not seen as a detached
observer but as a co-author (Burman, 1997). There is no absolute truth to be
discovered (Blaikie, 2007); instead there are multiple truths. In this context, the role
of the researcher is to encourage narratives which give insight into people’s
subjective experiences while being aware and reflexive of their own influences on the
research procedure (Mareek, 2007). The notion of value-free research and knowledge
is seen as untenable. Language is regarded as having a ‘performative use’ (Gergen,
1985, p. 270) and it is acknowledged that psychological phenomena exist in
‘historical, sociocultural, moral and political practices and significances’ (Martin,
2015, p. 37). In terms of methodology, social constructionism pays attention to how
language used to construct reality (Gergen, 1985).
Social constructionism has received various criticisms (Alvesson &
Skőldberg, 2009). One critique relevant to the present discussion is the idea that
social constructionism has anti-theoretical tendencies (Alvesson & Skőldberg, 2009,
p.37) as the scientific enquiry is descriptive of the process of social construction of
the world. Critical realism is an approach that has criticised both positivism and
social constructionism (Alvesson & Skőldberg, 2009).
3.1.3 Critical realism
Critical realism regards positivism and social constructionism as ‘superficial,
unrealistic and anthropocentric’ (Alvesson & Skőldberg, 2009, p. 16). Originating in
Bhaskar’s work (Collier, 1994) and adopting a realist ontological position, critical
realism acknowledges an independent reality and sees the role of scientific theories as

69
understanding the deeper structures, mechanisms and causal laws of the world
(Archer, Bhaskar, Collier, Lawson, & Norrie, 1998). Knowledge and the world are
regarded as ‘constructed’, ‘differentiated and changing’ but ‘the latter exists
independently of the former’ (Archer et al., 1998, p. 19). This differentiates critical
realism from the social constructionism which can be more relativistic in its ontology.
Constructions, in critical realism, are also seen as ‘objective phenomena’ (Alvesson
& Skőldberg, 2009, p. 41) and the role of science is to identify them.
Critical realism thus acknowledges contextual influences on knowledge and
embraces a form of epistemic relativism (Archer et al., 2016). Methodological
pluralism is necessitated by the acceptance of knowledge being context, concept and
activity dependent which in turn implies that all knowledge is limited by the
conceptual framework available and fallible (Archer et al., 2016).
3.1.4 Epistemological positioning in the present study
The present study aims to explore the levels of perceived stress in IAPT
therapists and the factors associated with perceived stress in these workers. The
relationship of work related potential stressors and self-compassion with perceived
stress is explored.
As such the project aligns itself with the critical realism approach in a number
of ways. The assumption that the key study concepts, stress, self-compassion and
work-related stressors, can be quantified and measured through a self-report measure
via a survey can be seen as deriving from the ontological position of realism.
While it is assumed that a reality exists independent of the researcher, it is
also accepted that these concepts are constructed within a social, political and
historical context. Given that concepts are part of the social world and thus include

70
past knowledge (Sayer, 2000), their representation in the present study is constrained
by the researcher’s own influences and the operationalisation of the concepts made by
the creators of the self-report measures employed.
The assumption that a relationship between these measurable concepts can be
explored through statistical analyses also relates to critical realism, which seeks to
understand the deeper levels of structures in phenomena.
3.2 Design
A quantitative cross-sectional design was employed in the present study. The
cross-sectional design is used to explore associations between variables at one point
in time (Levin, 2006) and thus was regarded as the most suitable design to explore
factors associated with perceived stress in IAPT therapists.
In the present study, perceived stress is the dependent or outcome variable, the
work-related potential stressors are the independent variables and self-compassion is
the moderator.
3.3 Participants
Participants were IAPT therapists. The term “therapist” was used broadly
encompassing staff having clinical contact (i.e. working clinically with patients in an
assessment and/or intervention focus). Both trainee and qualified therapists were
eligible to take part.
The participant inclusion criterion, which involved IAPT staff having clinical
contact (i.e. working clinically with patients in an assessment and/or intervention
focus), was broad and encompassed staff working at a low and high intensity level
and those who were trainees and qualified. The participant exclusion criteria involved

71
not working for IAPT and IAPT staff not having clinical contact. No other exclusion
criteria existed as it was important for this study to be as inclusive as possible given
that was the first one of its kind to explore perceived stress in IAPT therapists.
3.3.1 Recruitment information
Participants were recruited through their training institution, their professional
body (British Psychological Society, BPS; British Association for Behavioural and
Cognitive Psychotherapies, BABCP) or the social networking site FacebookTM.
More specifically, with regards to FacebookTM, the researcher posted the link
to the study on their (the researcher’s) page, with the invite to anyone who meets the
eligibility criteria to participate in the online study comprising of four questionnaires.
The researcher also included an invite to viewers of her post to ‘share’ the post on
their pages or email/direct the link to individuals they believe would be interested in
participating. The researcher also posted the link to the study on the BPS’s Facebook
page with an invite to eligible individuals to participate and an invite to individuals to
‘share’ the post on their pages or email/direct the link to individuals who they believe
would be interested in the study.
The BABCP hosted the invitation for research participation message on their
forum and a short piece regarding the study in the September 2017 issue of the CBT
Today magazine (Kostaki, 2017). In the FacebookTM posts and the BABCP forum
invitation for research participation message, the definition of the term “therapist”
was explained as being used broadly and encompassing staff having clinical contact
(i.e. working clinically with patients in an assessment and/or intervention focus). It
was explained that possible job titles of potential participants could include (Trainee)
Psychological Wellbeing Practitioner, (Trainee) High intensity worker, Counsellor,

72
Psychologist, or Assistant Psychologist. It was also stated that both trainee and
qualified therapists are eligible to participate. This explanation was also present in the
information sheet (Appendix B) and was on occasions shared in other aspects of the
recruitment phase, such as when contacting institutions.
The snowballing method was used to allow participants to invite other
individuals who meet the eligibility criteria to participate; participants were invited to
forward the link to the study to other individuals who may be eligible in the
information and debrief page (Appendices B and C).
With regards to training providers, institutions offering Psychological
Wellbeing Practitioner and High- Intensity training were located through the BPS
accredited training programmes list and the BABCP Level 2 accredited courses
respectively. A list of institutions contacted can be found in Appendix D. Training
institutions were primarily contacted via email. From the 15 institutions offering
Psychological Wellbeing Practitioner courses, ten agreed to make their trainees aware
of the project and five did not respond to the invite. From the 18 institutions offering
the High Intensity Training, nine agreed to make their students aware of the project,
two did not distribute the link to their trainees and seven did not respond. One course,
where the link was not distributed, declined to make their trainees aware of the
project and explained that they had recently been invited to participate in another
study. The administrator from the other course, where the link was not distributed,
had made the researcher aware that they were not permitted to send research requests
to their students.
Recruiting for the study predominately via the internet was deemed preferable as it
allowed the researcher to reach IAPT therapists quickly, easily, affordably, and
efficiently at a nationwide level. It was assumed that all therapists would be able to
73
complete the study should they wish as internet access is widely available and
internet-based studies are commonly used. The sampling can, in some respects, be
characterised as convenience sampling as recruiting through social media and
professional bodies resulted in individuals accessible to the researcher being at first
instance invited to the study. An effort to make the sample more representative and
counteract the sampling bias resulting from convenience sampling can be identified in
contacting all known training providers. The snowball sampling method allowed for
the study to become known to further eligible individuals who may have been
interested in taking part.
3.4 Sample size
The sample size for the present study was calculated using the a-priori sample
size calculator for multiple regression by Statistics Calculators version 4.0 Beta
(Soper, 2016). For an anticipated medium effect size (f2 = .15), a power level of .80
and a significance level of .05 in a multiple regression with 3 predictors (independent
variable, predictor variable and interaction term), an estimated sample of 76
participants was indicated.
A medium effect size was justified by Robinson (2015) who used the same
measures of stress, PSS-10 (Cohen & Williamson, 1988), and self-compassion, SCS
(Neff, 2003a), in a sample of trainee and qualified Clinical Psychologists. Robinson
(2015) mentioned that the effect sizes in previous research varied from non-existent
to large with the majority of the effect sizes being medium. It is, moreover,
noteworthy that in Robinson’s study, which is not dissimilar to the present study in
terms of geographical location, field and discipline, and professional statuses of

74
participants, the effect sizes found were large. The choice to calculate power for a
medium effect size was therefore a conservative one.
The sample size for the present study was 207; main analyses were conducted
on a sample of 200. Recruitment continued beyond the initially estimated number of
76 participants as it was deemed important to allow more time for qualified therapist,
who were underrepresented in the sample, to take part and to allow for additional
confounding variables to be included in the analyses if necessary.
3.5 Measures
Participants were asked to complete four questionnaires; one purpose-built
demographic questionnaire and three standardised questionnaires. All measures were
screened to ensure that they were not unclear or excessively taxing and time-
consuming; this was particularly important given potential participants’ high-volume
work life and the possible time-constraints that they could be experiencing as
qualified or trainee therapists. The appropriateness for use in an anonymous online
study, where the researcher was absent and thus unable to clarify ambiguities and
respond to risk concerns, was also considered.
3.5.1 Perceived Stress Scale-10 (PSS-10; Cohen & Williamson, 1988)
The Perceived Stress Scale-10 (PSS-10; Cohen & Williamson, 1988) is a 10
item self-report measure of perceived stress. The scale (Appendix H) explores how
stressful respondents perceive their lives to have been in the last month tapping into
the degree of perceived unpredictability, lack of control and sense of being
overwhelmed. Participants are invited to answer on a 5-point Likert scale ranging
from “never” to “very often”. The total score is calculated by summing the scores of
75
all items after reversing the score for items 4, 5, 7 and 8, which are positively stated;
the total score range is 0-40. The use of this measure has been permitted for non-
profit academic research.
Interest in participants’ appraisals of their stress levels led to the selection of
the PSS-10 (Cohen & Williamson, 1988) which has been widely used in studies
relating to mental and physical wellbeing (e.g. Cohen, Tyrrell, & Smith, 1993;
Padden, Connors, & Agazio, 2011). The PSS-10 (Cohen & Williamson, 1988) allows
for a broad evaluation of participants’ experiences, without enquiring about a
particular event. Moreover, it measures solely perceived stress as opposed to moving
into the terrain of psychiatric disorders, which is characteristic of the Depression,
Anxiety and Stress Scales (DASS; Lovibond & Lovibond, 1995). Lastly, the PSS-10
(Cohen & Williamson, 1988) has a different temporal orientation compared to the
Stress Appraisal Measure (SAM; Peacock & Wong, 1990), which measures
perceptions of anticipatory stress.
Three versions of the PSS exist, namely the 14-item, the 10-item and the 4-
item version (Cohen &Williamson, 1988). The PSS-10 derived from dropping four
items with low factor loadings from the original longer 14-item version of the
measure, whereas the 4-item version of the PSS consists of items 2, 4, 5 and 10 of the
PSS-10. The PSS-10 showed good convergent validity, being moderately correlated
with other stress measures (Cohen & Williamson, 1988). Cohen and Williamson
(1988) recommend the use of the 10-item version of the PSS in research as it has
better internal reliability (Cronbach alpha of .78) compared to the longer 14-item
version (Cronbach alpha of .75) and the shorter 4-item version (Cronbach alpha of
.60). In a sample of therapists in training, the PSS-10 demonstrated improved
internal consistency, with a Cronbach alpha of .87 (Shapiro, Brown, & Biegel, 2007)

76
suggesting that it is a suitable measure to use in the present study. In the present
study, the PSS-10 showed even better internal consistency with a Cronbach alpha of
.88.
3.5.2 Self-Compassion Scale (SCS; Neff, 2003a)
The Self-Compassion Scale (SCS; Neff, 2003a) is a 26 item self-report
questionnaire. Participants rate how they typically act towards themselves using a 5-
point Likert scale (Appendix I) ranging from “almost never” to “almost always”.
Self-compassion entails three facets and six subscales, namely (a) i) self-
kindness as opposed to ii) self-judgement, (b) i) common humanity versus ii)
isolation, and (c) i) mindful awareness as opposed to ii) over-identification (Neff,
2003a). The subscale scores are calculated by computing the mean of the subscale
items; they range from 1 to 5. A total score can also be calculated as the grand mean
of the subscales after reversing the score of the negative subscales (items 1, 2, 4, 6, 8,
11, 13, 16, 18, 20, 21, 24 and 25) and calculating their means.
This measure has good psychometric properties and is theoretically sound
(Neff, 20016a, 2016b); Neff (2003a) reports that the scale has convergent and
discriminant validity and good internal consistency (Cronbach alpha of .92). In an
adult sample, Cronbach alphas of the subscales ranged between .71 and .86
(Williams, Dalgleish, Karl, & Kuyken, 2014). In the present study, internal
consistency was good for the scale overall (overall Cronbach alpha of .95) and ranged
between .73 and .88 for the subscales.
Test-retest reliability was also reported to be good for the total score (.93), and
the self-kindness (.88), self-judgement (.88), common humanity (.80), isolation (.85),
mindfulness (.85) and over-identification (.88) subscales (Neff, 2003a). It is however,

77
unclear which statistical analysis these reliability findings are based on. However,
importantly, the scale was found not to be subjected to social desirability bias (Neff,
2003a) despite self-compassion possibly being seen as a desirable quality.
The instructions of the SCS (Neff, 2003a) were modified in the following way
to correspond with the display of the questionnaire on the online platform; the phrase
“To the left of each item” was changed to “Below each item”. The rest of the
instructions remained unchanged.
Using the 26-item SCS (Neff, 2003a), as opposed to the 12-item short form
version (Self-Compassion Scale-Short Form; SCS-SF) of the questionnaire, when
interested in the subscale scores as well as the total self-compassion score is
recommended (Raes, Pollier, Neff, & Gucht, 2011).
Other measures tap into the construct of self-compassion but do so in addition
to measuring compassion towards others (e.g. Narrative Compassion Scale; MacBeth,
2011) or relational aspects of compassion (e.g. Relational Compassion Scale; Hacker,
2008). The use of the SCS (Neff, 2003a), which is the only scale exclusively
measuring self-compassion (López et al., 2015) as a total score and in terms of
subscale scores, has been permitted for academic purposes.
3.5.3 HSE Management Standards Indicator Tool (Cousins et al., 2004)
The HSE Management Standards Indicator Tool (Cousins et al., 2004) is a 35-
item self-report measure of perceived potential stressors at work which requires
participants to respond on a 5-point scale (Appendix J). Some items range from
“never” to “always” while others range from “strongly disagree” to “strongly
agree”.

78
This measure has good psychometric properties with Cronbach’s alphas
ranging from .78 to .89 on the seven subscales (Cousins et al., 2004; Edwards,
Webster, Van Laar, & Easton, 2008), and with an overall Cronbach’s alphas of .92
(De Vellis, 2003). In the present study, the HSE Management Standards Indicator
Tool (Cousins et al., 2004) showed good internal consistency with alphas ranging
from .79 to .90 for the subscales and an overall Cronbach alpha of .95.
The HSE Management Standards Indicator Tool is based on the demand-
control and support model for work-related stress (Edwards et al., 2008). The seven
subscales include (i) demand, which entails workload and work environment topics,
(ii) control, which relates to the perceived levels of control that individuals think they
have over their work, (iii) peer support, covers the support offered by colleagues, (iv),
managerial support, captures support offered by managers, (v) relationships, incudes
experiences of difficult relationships in the workplace and experiences unacceptable
behaviors, (vi) role, entails clarity and understanding of one’s role at an
organizational level, (vii) change, refers to how change is communicated in the
organization.
The instructions of the Tool were modified to cater for the present study. The
original instructions were as follows: ‘Instructions: It is recognised that working
conditions affect worker well-being. Your responses to the questions below will help
us determine our working conditions now, and enable us to monitor future
improvements. In order for us to compare the current situation with past or future
situations, it is important that your responses reflect your work in the last six
months.’ (Cousins et al., 2004). Modifying the instructions was an ethical imperative
as the above statement would be misleading the participants given that their responses
were not used to monitor future improvements or compare the current situation with

79
past or future situations. Moreover, it was hoped that by clarifying that the invite to
complete the questionnaire was not coming from their organization or service,
through removing the word ‘our’, respondents would be enabled to be open and
honest. Given these considerations, the instructions were modified to: ‘Instructions: It
is recognised that working conditions affect worker well-being. Your responses to the
questions below will help us determine your working conditions. It is important that
your responses reflect your work in the last six months.’.
The HSE Management Standards Indicator Tool (Cousins et al., 2004) has
been used as a measure of perceived “psychosocial work conditions” (Bevan,
Houdmont, & Menear, 2010, p. 525) in studies in public and private organizations
(e.g. Bevan et al., 2010; Gyllensten & Palmer, 2005; Kerr, McHugh, & McCrory,
2009).
A Danish tool, the Copenhagen Psychosocial Questionnaire (COPSOQ;
Kristensen, Hannerz, Høgh, & Bor, 2005) is another measure of work environment,
which, in its long form, also taps into other constructs such as wellbeing, stress, and
personality factors. The shortest version of the COPSOQ has 44-items, includes items
relating to demands, work organization and content, interpersonal relationships and
leadership, satisfaction, and health (Kirstensen et al., 2005). The COPSOQ has
weaker psychometric qualities than the HSE tool, with Cronbach alphas ranging from
0.61 to 0.81 for the 8 scales of the measure (Kirstensen et al., 2005). More recently,
the COPSOQ II was developed; 57 % of the items from the initial COPSOQ were
retained and new scales were added (Pejtersen, Kristensen, Borg, & Bjoner, 2010). A
short form of the COPSOQ II incudes 40 items relating to concepts such as stress,
burnout, trust, conflict, job satisfaction, relationship and leadership, work
organization and demands at work (Pejtersen et al., 2010).

80
For the purposes of this study, the HSE Management Standards Indicator Tool
(Cousins et al., 2004) was used to explore areas of risk concerning work-related
stress. The HSE Management Standards Indicator Tool (Cousins et al., 2004)
measures potential stressors without drifting into measuring related concepts such as
burnout (Pejtersen et al., 2010). Moreover, considering that it is a UK-developed
scale, the HSE Management Standards Indicator Tool (Cousins et al., 2004), was
thought to potentially be better suited to the UK workforce especially given the
potential for cultural variability in survey research (Johnson et al., 1996). Lastly, the
HSE Management Standards Indicator Tool (Cousins et al., 2004) has better internal
consistency and is shorter, and therefore less taxing, compared to the COPSOQ
(Kirstensen, et al., 2005).
3.5.4 Demographics questionnaire
The purpose-built demographic questionnaire collected information on
gender, age, ethnicity, religion, marital status, education level, years of work
experience, hours of supervision, time working in IAPT, qualification status, job role
and working hours (Appendix K). It was deemed important to capture these
characteristics of the sample as the snowball sampling method could have resulted in
a skewed sample where particular characteristics are more prominent than others.
Moreover, findings that gender, age, education level, years of experience and
working hours are related to stress in different professional groups
(Balakrishnamurthy & Shankar, 2009; Blaug, et al., 2007; Lunau et al., 2015) made it
important to examine the sample in the present study in terms of these characteristics.
Robinson (2015) also showed that Trainee Clinical Psychologists reported
significantly more distress than qualified Clinical Psychologists indicating that

81
qualification status and education level were important variables to explore. Hours of
supervision were of interest in this study as Westwood et al. (2017) found that they
predicted lower odds of burnout, which is a response to work stressors (Masclach,
Schaufeli, & Leiter, 2001).
3.6 Scoring
Reverse item scoring had already been set up for the appropriate questionnaire
items on designing the recording of the responses on Qualtrics; items 4, 5, 7 and 8 for
the PSS-10 (Cohen & Williamson, 1988), items 3, 5, 6, 9, 12, 14, 16, 18, 20, 21, 22
and 34 for the HSE Management Standards Indicator Tool (Cousins et al., 2004), and
items 1, 2, 4, 6, 8, 11, 13, 16, 18, 20, 21, 24 and 25 for the SCS (Neff, 2003a) were
reverse scored.
A total score for the PSS-10 (Cohen & Williamson, 1988) was calculated by
summing the scores across all items of the questionnaire. HSE Management
Standards Indicator Tool (Cousins et al., 2004) subscale scores were calculated for all
seven subscales of the measure; demands subscale (mean of items 3, 6, 9, 12, 16, 18,
20 and 22), control subscale (mean of items 2, 10, 15, 19, 25 and 30), managerial
support subscale (mean of items 8, 23, 29, 33 and 35), colleagues support subscale
(mean of items 7, 24, 27 and 31) role subscale (mean of items 1, 4, 11, 13 and 17),
relationships subscale (mean of items 5, 14, 21 and 34) and change subscale (mean of
items 26, 28 and 32).
Subscale scores and a total score were calculated for the SCS (Neff, 2003a) as
follows; self-kindness subscale (mean of items 5, 12, 19, 23 and 26), self-judgement
subscale (mean of items 1, 8, 11, 16 and 21), common humanity subscale (mean of
items 3, 7, 10 and 15), isolation subscale (mean of items 4, 13, 18 and 25),

82
mindfulness subscale (mean of items 9, 14, 17 and 22), over-identification subscale
(mean or items 2, 6, 20 and 24), total score for SCS (grand mean of six subscale
means). Calculating the total self-compassion score using the grand mean of the
subscales has been proposed by Neff (Appendix I) and is an alternative method of
computation than what is used in Neff (2003a), where the sum of the subscales was
used. The choice to use the grand mean was driven by the ease in interpretation the
total score when this method is used (Appendix I).
3.7 Analysis
Data, collected using Qualtrics TM, were downloaded onto SPSS (IBM Corp.,
2015) in preparation for data analysis. Analyses were carried out using SPSS (IBM
Corp., 2015) for Windows. Descriptive statistics allowed exploration of the data in
terms of the main study variables and the demographic characteristics of the sample.
Data were checked for normality.
Preliminary analyses explored whether perceived stress was significantly
associated with the characteristics measured in the demographic questionnaire.
Confounding effects of ratio demographic variables were explored through
correlations. With respect to nominal variables, the potential confounding effect of
the dichotomous demographic variables was explored through point or rank biserial
correlations. For categorical variables with more than two levels, regression analyses
were carried out.
The PROCESS add-on dialog box (Hayes, n.d., 2013, 2016) was used to
conduct moderation analyses. Moderation analyses (Baron & Kenny, 1986; Field,
2013; Hayes, 2013; MacKinnon, Krull, & Lockwood, 2000) explored the effect of
self-compassion, as measured by the SCS (Neff, 2003a), on the relationship between

83
work-related potential stressors, as measured by the seven subscales of the HSE
Management Standards Indicator Tool (Cousins et al., 2004), and perceived stress, as
measured by the PSS-10 (Cohen & Williamson, 1988).
Seven moderation analyses were conducted, each with 5 predictor variables
(independent variable, moderator and the independent- moderator interaction term,
plus two variables that were found to be confounding in the present study). Each of
the seven subscales of the work-related stressor measure, namely workload demands,
perceived control over workload, managerial support, peer support, relationships at
work, clarity of role and organisational change, was treated as the independent
variable in seven separate moderation analyses. The effect of self-compassion
(moderator) on the relationship between each work-related stressor (independent
variable) and perceived stress (outcome variable) was examined.
3.8 Ethical considerations
The researcher sought and gained ethical approval from The University of
Essex Ethics Committee (Appendix L). This was sufficient approval for the purposes
of the present study as the research was aimed at staff.
An amendment request was submitted to and approved by The University of
Essex Ethics Committee (Appendix M) at a subsequent date. The amendment
requested was approved, namely adding the question referring to the hours of
supervisions received in the demographics questionnaire (Appendix K) and amending
the information sheet (Appendix B) to include a list of support organisations and their
contact details. The reason for the first amendment was Westwood et al.’s (2017)
finding that amongst Psychological Wellbeing Practitioners hours of supervision
predicted lower odds of burnout; this study came to the researcher’s attention after the
84
original ethical approval had been obtained. Adding the list of support organisations
and their contact details to the information sheet ensured that all potential participants
had access to them regardless of whether they completed the study.
Given that the study involved human participants and was carried out online,
the British Psychological Society ethical guidelines on research with human
participants, online psychological research and internet mediated research were
adhered to (BPS, 2007, 2010, 2013).
The study was conducted online, thus the principal researchers’ contact details
were included on the information page (Appendix B) and potential participants were
encouraged to use them if they need to discuss the study further before they were
presented with the consent form. Participation in the study was voluntary and
participants were free to leave the study at any point without consequences.
Participants were also informed that it would not be possible to remove their data
from the database once they completed the study due to anonymization.
Informed consent was sought as the consent (Appendix F) form followed the
information sheet. The online study was set up in a way that a “yes” or “no” response
was required from potential participants on the consent form. Participants could not
proceed to the next screen unless they provided a response. Only participants
indicating their consent by responding “yes” were presented with the questionnaires.
Data collected was treated according to the Data Protection Act (DPA, 1998).
No personal data was collected; the setting “Anonymize Response” was enabled in
the survey options menu resulting in the removal of the respondents’ IP address and
location data from the results. Data was anonymous and was accessed by the principal
investigator and the named supervisors. Making the participation anonymous was a
way to facilitate participants to respond frankly to the questionnaires.

85
The University of Essex research data management policy (University of
Essex, 2012) was consulted regarding the optimal mechanisms and services for secure
data storage and backup. Data was stored on a password protected personal laptop
owned by the principal investigator and was backed up on their personal drive at the
University of Essex network and a password protected memory stick. Following the
completion of the principal investigator’s doctorate degree, the data will be stored for
at least 5 years on an University of Essex central drive in a folder accessible only by
the named supervisors.
Despite the fact that it was not expected that participants become distressed
when taking part in the study, due to anonymity, it was impossible to take action in
the event of detecting particularly high stress levels in any individual. A list of
support organisations was however, included on the information sheet (Appendix B)
and at the end of the study, on the debrief page of the study (Appendix C), and the
end of study message (Appendix G) for participants who did not consent. Contact
details of the principal researcher and the researcher’s supervisors were also included
for participants to use if they wished to discuss the study further, or request a
summary of the results. The contact details at the debrief page and the end of study
message for participants who did not consent could also be used to feedback any
distress they might have experienced (BPS, 2007). The researcher received six email
requests for a summary of the results.
3.9 Procedure
Participants were invited to take part in the study online using the QualtricsTM
software. Upon clicking on the link directing them to the study, participants viewed
the study information sheet (Appendix B). Following the information sheet,

86
participants clicked to the next page and were presented with the consent form
(Appendix F). Individuals who did not consent were directed to an end of the study
message (Appendix G) explaining why they reached the end of the study, thanking
them for considering the project, inviting them to share the link to the study with
individuals who might be interested to take part and providing information on
organisations which they could access for support if they wished.
Participants who consented to take part, were asked to complete the
demographics questionnaire which asked them to confirm their area of work within
IAPT allowing the researcher to ensure that the study was completed by the targeted
sample. The remaining three questionnaires were then presented in the following
order; Perceived Stress Scale-10 (PSS-10; Cohen & Williamson, 1988), HSE
Management Standards Work-Related Stress Indicator Tool (Cousins et al., 2004),
and Self-Compassion Scale (SCS; Neff, 2003a). Participants’ responses were saved
anonymously by Qualtrics TM.
At the end of the study, participants were presented with a debrief page
(Appendix C) which included information on organisations which they could access
for support if they wished and an invite to forward the link of the study to any
individual they knew who met the eligibility criteria and who they thought would
have been interested in participating in the study. The debrief page was followed by
an end of study message stating “This is the end of the study”.
Data collection lasted approximately six months; commencing in April 2017
and finishing in October 2017.

87
3.10 Dissemination
The study results will be disseminated to individuals who contact the principal
researcher. The researcher will also disseminate the study and its findings in the
Clinical Psychology Doctorate Programme and in the School of Health and Social
Care at the University of Essex. The researcher will endeavour to disseminate the
study at workshops, conferences, or through publication in journals (such as the
International Journal of Stress Management, Work and Stress), periodicals and media.

88
4. Results
This chapter will examine the results of the cross-sectional online study. A
presentation of the demographic details of the sample will be followed by an
exploration of the findings regarding the main study objectives. The chapter will end
with a summary of the findings.
4.1 Data input
In preparation for analyses, data were downloaded from QualtricsTM, the
software used to host the questionnaires online during data collection phase, onto
SPSS version 23.
4.2 Participation rate
The study was accessed 253 times through the study link. Eighteen
respondents did not answer the consent form and, as such, did not progress to viewing
the questionnaires. Furthermore, one respondent declined to participate at the consent
form stage, and the remaining 234 participants consented to the study. The percentage
of respondents consenting to take part was 92.49%.
From the 234 respondents consenting to participate in the study, 207
completed all the questionnaires, resulting in an 88.46% completion percentage.
4.3 Descriptive data analyses
4.3.1 Categorical demographic variables
Frequency analyses provided an overview of the nominal demographic
characteristics of the sample comprising of 207 participants. There was an almost
equal split between trainee and qualified therapists (Table 3.1) and therapists working

89
at the low and the high intensity level (Table 3.2). The participant marking their
employment status as ‘Other’ noted that they were an “Assistant Psychologist”.
Participants noting their job role as ‘Other’ reported the following job titles,
“Assistant Psychologist”, “Clinical Lead”, Clinical Psychologist”, “Counsellor”,
“Interpersonal Psychotherapist”, “Psychologist”, “Trainee Clinical Associate in
Applied Psychology”, and “Volunteer doing Integrative therapy”.
Table 3.1
Employment status
Employment status n %
Trainee 96 46.4
Qualified 109 52.7
Unqualified 1 0.5
Other 1 0.5
Total 207 100
Note. n= frequency.
Table 3.2
Job role
Job role n %
Low intensity worker 92 44.4
High intensity worker 106 51.2
Other 9 4.3
Total 207 100
Note. n= frequency.
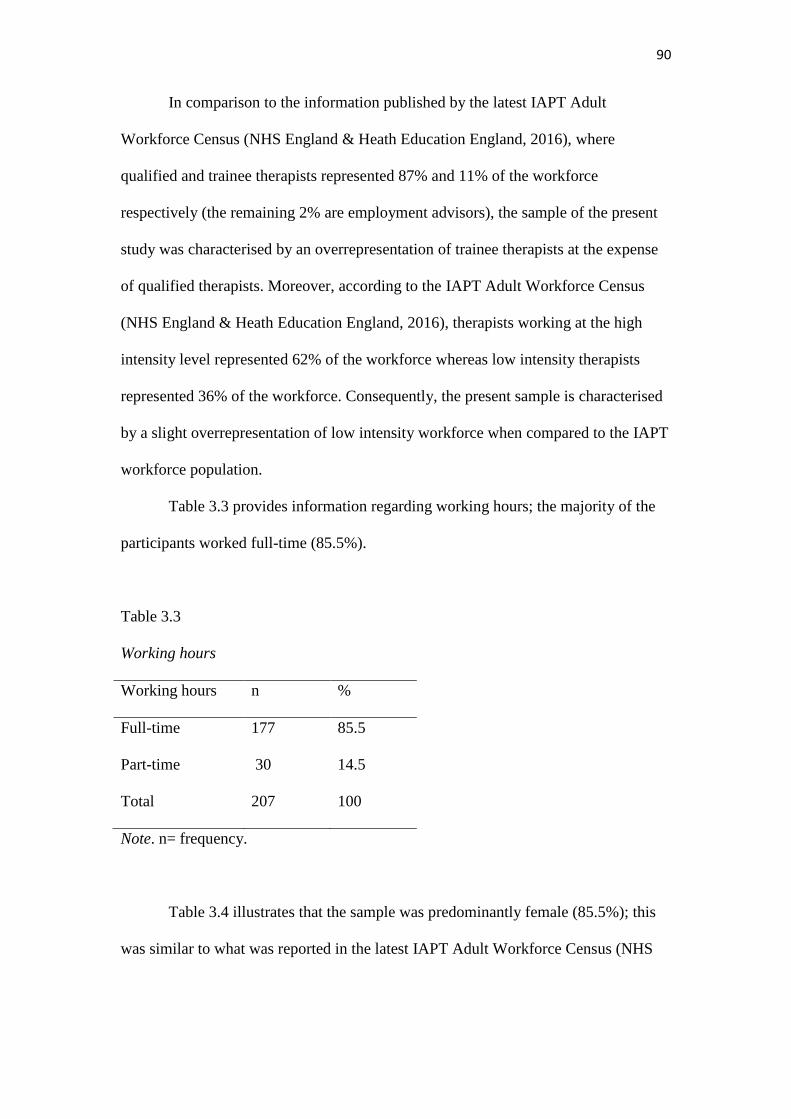
90
In comparison to the information published by the latest IAPT Adult
Workforce Census (NHS England & Heath Education England, 2016), where
qualified and trainee therapists represented 87% and 11% of the workforce
respectively (the remaining 2% are employment advisors), the sample of the present
study was characterised by an overrepresentation of trainee therapists at the expense
of qualified therapists. Moreover, according to the IAPT Adult Workforce Census
(NHS England & Heath Education England, 2016), therapists working at the high
intensity level represented 62% of the workforce whereas low intensity therapists
represented 36% of the workforce. Consequently, the present sample is characterised
by a slight overrepresentation of low intensity workforce when compared to the IAPT
workforce population.
Table 3.3 provides information regarding working hours; the majority of the
participants worked full-time (85.5%).
Table 3.3
Working hours
Working hours n %
Full-time 177 85.5
Part-time 30 14.5
Total 207 100
Note. n= frequency.
Table 3.4 illustrates that the sample was predominantly female (85.5%); this
was similar to what was reported in the latest IAPT Adult Workforce Census (NHS

91
England & Heath Education England, 2016), where 79% of the workforce was found
to be female.
Table 3.4
Gender
Gender n %
Male 29 14
Female 177 85.5
Prefer not to say 1 0.5
Total 207 100
Note. n= frequency.
Similarly to the IAPT Adult Workforce Census (NHS England & Heath
Education England, 2016) where the workforce was found to be predominantly White
British (83%), most of the participant in this study identified as ‘White British, White
English, White Scottish, White Welsh’ (Table 3.5). Participants identifying as having
‘Other ethnic background’ reported the following descriptions for their ethnicity,
“Mixed- Black British and Asian British”, “Mixed- White & Asian British”, “Mixed
White and Asian”, “Mixed white british & middle eastern”, and “mixed white/asian”.
In addition, the majority of the participants identified as not having a religion
or being Christian (Table 3.6). The participants selecting the response ‘Other religion’
noted their religion as “spiritual” and “Quaker”.

92
Table 3.5
Ethnicity
Ethnicity n %
Asian British, Asian English, Asian Scottish, Asian Welsh 7 3.4
Black British, Black English, Black Scottish, Black Welsh 5 2.4
White British, White English, White Scottish, White Welsh 158 76.3
Black other 1 0.5
White other 25 12.1
Chinese 5 2.4
Middle Eastern 1 0.5
Other ethnic background 5 2.4
Total 207 100
Note. n= frequency.
Table 3.6
Religion
Religion n %
I do not have a religion 128 61.8
Buddhist 3 1.4
Christian 60 29
Jewish 3 1.4
Muslim 3 1.4
Sikh 3 1.4
Other religion 2 1
Prefer not to say 5 2.4
Total 207 100
Note. n= frequency.

93
With respect to marital status, most participants were either ‘married, in civil
partnership or cohabitating’ or single and had never been married (Table 3.7).
Table 3.7
Marital status
Note. n= frequency.
With regards to highest level of education attained the majority of the sample had
either a bachelor’s degree or equivalent or a master’s degree (Table 3.8).
Marital Status n %
Single, never been married 68 32.9
Married, in civil partnership or cohabiting 123 59.4
Divorced or separated 13 6.3
Widowed 2 1
Prefer not to say 1 0.5
Total 207 100

94
Table 3.8
Education level
Highest education level completed n %
GCSE or equivalent 2 1
A level, BTEC or equivalent 2 1
Bachelor’s degree or equivalent 97 46.9
Master’s degree 94 45.4
Doctorate Degree 10 4.8
Prefer not to say 2 1
Total 207 100
Note. n= frequency.
4.3.2 Ratio demographic variables
The variables ‘Age’, ‘Years of clinically relevant experience’, ‘Hours of
supervision received’, and ‘Years employed in IAPT’ are ratio variables as the
intervals between points of the scale are equal, the intervals are meaningful and a
meaningful score of zero exists (Field, 2005). In order to select the most appropriate
measures of central tendency and dispersion for these variables, analyses to test for
the assumption of normality were carried out.
4.3.2.1 Assumption of normality analyses
The assumption of normality was explored both using plots and statistics
(Field, 2005). Following examination of the histograms, Q-Q plots and box-plots, the
calculated z-scores of skewness and kurtosis and the results of the Shapiro-Wilk tests
of normality were examined.

95
For the variable ‘Age’, the histogram showed a positively skewed distribution,
the Q-Q plots revealed patterning, and the box-plot whiskers were uneven.
Moreover, the z-score for skewness was greater than +1.96 and the Shapiro-Wilk test
was significant. These findings indicate that the distribution for the variable ‘Age’
differed significantly from the normal distribution. A similar pattern of results,
namely one that points towards a distribution differing from the normal distribution
was found for the variables ‘Years of clinically relevant experience’ and ‘Hours of
supervision received’.
With respect to the variable ‘Years employed in IAPT’, two participants were
excluded from analyses (leaving a sample of 205, instead of 207) as the recorded
values of 2016.00 (participant 21) and 2009.00 (participant 61) for this variable were
clearly invalid. Again, inspection of the patterns of results on the Q-Q plots, the
histogram, the box-plot, skewness and kurtosis, and the Shapiro-Wilk test suggested
that this variable differed significantly from the normal distribution.
In conclusion, all four ratio demographic variables were found to be not
normally distributed. Appendix N provides graphical and statistical information
regarding the non-normality findings; statistical information is presented for all
variables and graphs are presented for the variable ‘Age’ for illustrative purposes.
4.3.2.2 Descriptive statistics for ratio demographic variables
Considering that the ratio demographic variables were not normally
distributed, the median, and the interquartile range (IQR), and the range were used as
measures of central tendency and variability respectively (Table 3.9).
The median, representing the middle value of the scores when all scores are
arranged in ascending order (Manicandan, 2011), is affected to a smaller degree than

96
the mean by outliers and is regarded as an appropriate measure of central tendency for
not normally distributed data (Manicandan, 2011; McCluskey & Lalkhen, 2007). The
IQR and the range offer complimentary information regarding the variability or
dispersion in the data. More specifically, while the range represents the spread
between the highest and the lowest score (McCluskey & Lalkhen, 2007), the IQR
shows the variability in the middle 50% of the data (Field, 2005) and is commonly
used as a measure of dispersion in not normally distributed data (McCluskey &
Lalkhen, 2007).
Table 3.9
Descriptive statistics for interval ratio demographic variables
Note. IQR= Interquartile Range, N= sample size.
The median age of the IAPT therapists taking part in the study was 31 years.
Moreover, participants had a median of 6 years of clinically relevant experience. It is
worth noting the wide range of ages (Range= 44) and years relevant experience
(Range= 33) in the sample, which may be understood in the context of the therapists’
different professional paths and backgrounds (IAPT therapists at different levels of
N Median IQR Range
Age 207 31.00 13.00 44.00
Years of clinically relevant
experience
207 6.00 6.00 33.00
Hours of supervision received
per month
207 5.00 5.50 15.00
Years employed in IAPT 205 3.00 5.00 11.00

97
stepped care range from qualified professionals such as psychologists and nurses to
psychology graduates; DOH, 2008d) which may result in a workforce with a large
spread of different ages and degrees of experience. Participants reported a median of
3 years of working in IAPT (Range= 11) indicating a relatively new workforce,
which may be understood both in the context of IAPT being a relatively new initiative
and with respect to the therapist retention difficulties in IAPT (Rizq, 2011).
4.3.3 Main study variables
The main study variables, namely perceived stress, work-related stressors and
self-compassion were explored descriptively.
4.3.3.1 Assumption of normality analyses
Similarly to above, normality was checked for the main study variables via
plots (histograms, Q-Q plots, and box-plots) and relevant statistics (skeweness and
kurtosis z-scores, and the Shapiro-Wilk test) in the sample of 207 therapists (Field,
2005).
Perceived stress, measured by the PSS-10 (Cohen & Williamson, 1988) scale,
was normally distributed as the skewness and kurtosis z-scores fell within the -1.96 to
+1.96 range, and the Shapiro Wilk test was non-significant. Moreover, the histogram
was characterised roughly by a bell-shaped curve, data were mapped onto the
diagonal line on the Q-Q plots, and the box-plot whiskers appeared even. Appendix O
includes graphical findings regarding perceived stress alongside statistical findings
for all the main study variables.
The findings were mixed for the work-related potential stressors measured by
the HSE Management Standards Indicator Tool (Cousins et al., 2004). Skewness and

98
kurtosis z-scores for ‘Control’ fell within the acceptable range and the Shapiro-Wilk
test was non-significant indicating the subscale’s distribution does not differ
significantly from the normal distribution. The plots for ‘Control’ were also
indicative of an approximately normal distribution (a slight deviation from the line
was found on the Q-Q plot resulted in characterising the distribution as approximately
normal).
The decision to characterise the distribution of the ‘Change’ subscale as
normally distributed was less straightforward. Although the z-scores for skewness
and kurtosis fell within the -1.96 to +1.96 acceptable range (albeit the marginal value
for kurtosis 1.92) and the histogram and Q-Q plots were indicative of a normal
distribution, the slightly uneven whiskers on the box-plot and the significant Shapiro-
Wilk result pointed towards a non- normal distribution. In the above context and
considering the large sample size of the present study (Field, 2005), the significant
Shapiro-Wilk result was seen as a likely result of a Type 1 error and thus the
assumption of normality was regarded as being met.
For the remaining subscales, the majority of the z-scores fell outside the -1.96
to +1.96 range, the Shapiro-Wilk results were significant, and the plots pointed
towards a non-normal distribution. As such, with the exception of the ‘Control’ and
‘Change’, all other work-related potential stressors were not normally distributed.
With regards to checking the normality of the Self-Compassion Scale’s (SCS;
Neff, 2003a) total score and subscale scores, the visual and statistical explorations
indicated that the ‘Isolation’ and ‘Over-identification’ subscales were not normally
distributed. The z-scores for skewness and kurtosis and the visual inspection of the
plots for remaining subscales pointed towards a normal distribution, despite the
Shapiro-Wilk result being significant for some subscales. The significance of the

99
Shapiro-Wilk finding was again attributed to a Type 1 error brought on by the large
sample size. Lastly, the total score for self-compassion was normally distributed.
In conclusion, the total self-compassion score, the self-compassion subscales
scores for self-kindness, self-judgement, common humanity and mindfulness, the
perceived stress score, and the control and change work related potential stressors
subscales scores were normally distributed.
4.3.3.2 Descriptive statistics for main study variables
Given that perceived stress was normally distributed, the mean and standard
deviation were the most relevant measures of central tendency and dispersion
respectively (McCluskey & Lalkhen, 2007). For the entire sample (N=207), the mean
score for perceived stress was 18.32 and the standard deviation was 6.70.
Table 3.10 includes the measures of central tendency and dispersion for the
HSE Management Standards Indicator Tool (Cousins et al., 2004) subscales. The
mean and standard deviation, and median and interquartile range are reported for
normally and not normally distributed data respectively (McCluskey & Lalkhen,
2007). The range value is reported for all variables.
HSE Management Standards Indicator Tool (Cousins et al., 2004) subscale
scores can range from one to five, higher scores indicating a better psychosocial
working environment. The factor with the smaller mean score in the study was
‘Change’ (Mean= 2.71, SD= 0.92), indicating that how change is communicated and
dealt with in the organisation may be difficult for IAPT therapists in the sample. The
work related potential stressor with the highest median score was ‘Relationships’

100
Table 3.10
Descriptive statistics for work-related potential stressors (N=207)
Note. IQR= Interquartile Range, SD= Standard Deviation.
Subscale Mean Median SD IQR Range
Demands 3.00 1.25 3.63
Managerial Support 3.60 1.40 4.00
Colleague Support 4.00 1.00 3.50
Role 4.00 1.00 3.20
Relationship 4.25 1.00 3.75
Change 2.71 0.92 4.00
Control 3.17 0.76 4.00

101
(Median= 4.25, IQR= 1.00) indicating that working relationships may be less of a
stressor for IAPT therapists in the sample.
Table 3.11 comprises the measures of central tendency and dispersion for the
sample of 207 therapists on the self-compassion scale (Neff, 2003a). Data is
presented for all six subscales and the total self-compassion score. Considering that
the scores on the measure vary from ‘1’ to ‘5’, the mean or median scores for IAPT
therapists in this sample fall around the middle of scale.
For the total self-compassions score, the mean (SD) was 3.11 (1.05) in this
study. The mean (SD) self-compassion total score from Robinson’s (2015) UK
community sample was 2.99 (0.64). As such, the present sample of IAPT therapists
can be thought of as having slightly higher levels of self-compassion compared to a
UK community sample and that the average variability of the present data set is
bigger than the deviation of the scores in Robinson’s (2015) sample.

102
Table 3.11
Descriptive statistics for self-compassion (N=207)
Note. IQR= Interquartile Range, SD= Standard Deviation.
(Sub)scale Mean Median SD IQR Range
Self-kindness 3.04 0.88 4.00
Self-judgement 2.81 0.91 4.00
Common humanity 3.21 0.83 4.00
Mindfulness 3.45 0.73 3.50
Over-identification 2.75 1.50 4.00
Isolation 3.00 1.50 4.00
Total score 3.11 1.05 3.61

103
4.4 Checking for confounding variables
Analyses were carried out to establish whether the demographic variables
were significantly related to perceived stress. Any demographic variable found to be
related to perceived stress would be regarded as a confounding variable in this study.
Confounding effects of ratio demographic variables were explored through
correlations. With respect to nominal variables, the potential confounding effect of
the dichotomous demographic variables was explored through point or rank biserial
correlations. For categorical variables with more than two levels, regression analyses
with the variables dummy coded, were carried out.
4.4.1 Ratio demographic variables
4.4.1.1 Spearman’s correlation coefficient
Three main conditions, or in other words assumptions, need to be met prior to
conducting Pearson product-moment correlations; the data must be at least interval,
the relationship between the variables must be linear, and data must be normally
distributed (Field, 2005).
Given that all ratio demographic variables, namely ‘Age’, ‘Years of clinically
relevant experience’, ‘Hours of supervision received’, and ‘Years employed in IAPT’,
were not normally distributed, the assumptions for conducting Pearson’s product-
moment correlations were violated. As such Spearman’s correlation coefficient rho
was used to ascertain whether the ratio demographic variables were related to
perceived stress (Table 3.12).
Only the variable ‘Years of clinically relevant experience’ was significantly
negatively associated with perceived stress (rho= -.19, p < .01). This means that more

104
experienced therapists reported significantly less perceived stress that their less
experienced counterparts. Given that ‘Years of clinically relevant experience’ was
significantly related to the dependent variable, it was included in the main analyses of
this study as a confounding variable.
Table 3.12
Spearman’s rho correlations for demographic variables
N Perceived Stress
Age 207 -.07
Years of relevant clinical experience 207 -.19**
Hours of supervision received per month 207 .04
Years employed with IAPT 205 -.10
Note. N= sample size.
**p<.01
4.4.2 Dichotomous demographic variables
The potential confounding effect of the dichotomous demographic variables,
namely working pattern (full/part time), gender (female/male), employment status
(trainee/qualified), job role (high/ low intensity) and education level (bachelor’s
degree or equivalent/ postgraduate degree) was explored through point or rank
biserial correlations.
A point biserial correlation, involving the computation of a Pearson’s
correlation when one of the variables is discretely dichotomous, was calculated when
the assumptions of parametric tests were met (Field, 2005). In the event of the
assumptions of parametric tests not being met, a rank correlation was run, whereby
105
the Spearman’s rho correlation option was chosen when computing the biserial
correlation.
The variable ‘Gender’, was treated as a dichotomous variable after one
participant was excluded from the analyses as they were the only one who selected
the option “prefer not to say”. Retaining the three levels of the variable while having
one participant represent the level ‘prefer not to say’ was meaningless and statistically
unsound. The assumption of homogeneity of variances and the correlation were
therefore run in a sample of 206.
The variable ‘Employment status’ was treated as a dichotomous variable after
two participants were excluded from the analyses for similar reasons, namely they
were the only ones who selected a response different than “trainee” or “qualified”.
Homogeneity and correlation analyses were therefore carried out on a sample of 205.
When calculating the homogeneity analysis and biserial correlation for the
variable ‘Job Role’, nine participants were excluded from the analyses (leaving a
sample of 198 participants) as they formed a very small (compared to the size of the
other levels) group that had selected the option (‘other’) from that variable. Including
these nine participants as a separate category would be meaningless, as the diversity
of their job roles would hinder a coherent interpreting the results regarding the group.
It would also be statistically unsound, as the group would be comparatively very
small group in relation to the other two categories.
The variable ‘Education level’ was treated as a dichotomous variable. After
identifying that the three levels with the most cases were ‘Bachelor’s degree or
equivalent’, ‘Master’s degree’, and ‘Doctorate degree’ and that the ‘Doctorate level’
included considerably less participants than the other two groups, the master’s and
doctorate degree levels were collated into one level. This new variable level
106
represented the ‘postgraduate degree’ education level. The variable ‘Education level’
was then explored as a categorical variable with two levels, i.e. ‘Bachelor’s degree or
equivalent’ and ‘Postgraduate degree’. The other levels of the variables did not have
sufficient cases to represent separate groups and collating them did not make sense;
cases therefore corresponding to them were excluded (‘GCSE or equivalent’ n= 2, ‘A
level, BTEC or equivalent’ n= 2, ‘prefer not to say’ n= 2) from the analyses.
4.4.2.1 Parametric testing assumptions
Assumptions for parametric tests were checked prior to conducting point
biserial correlations (Field, 2005). Given that the variables working pattern, gender,
job role, and education level met the assumptions, the computation of a point biseral
correlation for these variables was deemed appropriate. The variable employment
status did not meet the assumptions and therefore the computation of a rank biserial
correlation, whereby the Spearman’s rho correlation option was chosen when
carrying out the biserial correlation, was deemed appropriate.
4.4.2.2 Point and rank biserial correlations
The findings of the point biserial correlations are as follows. There was no
significant correlation between gender and perceived stress (rpb= 0.068, p= .335),
between pattern of working and perceived stress (rpb= 0.003, p= .970), or between job
role and perceived stress (rpb= -0.008, p= .915). There was, however, a significant
correlation between education level and perceived stress (rpb= -0.217, p= .002). The
results of the rank biserial correlation indicated that there was no significant
correlation (rho= -0.064, p= .362) between employment status and perceived stress.

107
In conclusion, the point and rank biserial correlations revealed that only education
level was a confounding variable in this study.
4.4.3 Categorical variables with more than two levels
The categorical variables with more than two levels were examined for their
role as confounding variables in this study with multiple regressions. In the event that
they were confounding in this study, the results of the multiple regressions would
point towards the variables predicting perceived stress better than just using the mean.
However, prior to carrying out the multiple regressions, the levels of each of the
variables ‘Ethnicity’, ‘Religion’, and ‘Marital status’ were collapsed into three
categories to enable statistical analyses and newly formed levels of the variables were
dummy coded.
More specifically, for ethnicity, the ten levels of the original variable were
collapsed into three categories, a) ‘white UK’ representing the level ‘White British,
White English, White Scottish, White Welsh’ of the original variable, b) ‘white other’
representing level ‘white other’ of the original variable, c) ‘other ethnicity’
encompasses all other levels of the original variable.
For religion, the eight variable levels relating to religiosity were collapsed into
three a) ‘do not have a religion’ representing the level ‘I do not have a religion’ of the
original variable; b) ‘Christian’ representing the level ‘Christian’ of the original
variable, c) ‘other religion’ encompassing levels ‘Buddhist’, ‘Hindu’, ‘Jewish’,
‘Muslim’, ‘Sikh’, and ‘Other religion’ of the original variable. Five cases were
excluded from the analysis as they represented individuals who responded “Prefer not
to say”.

108
For marital status, analyses were carried out on the three groups with most
cases, i.e. ‘single, never been married’, ‘Married, in civil partnership or cohabiting’
and ‘divorced or separated’. The other levels of the variables did not have sufficient
cases, collating them did not make sense and thus cases corresponding to them were
excluded (‘widowed’ n= 2, ‘prefer not to say’ n= 1).
The newly created collapsed variables for ethnicity and religion were dummy
coded. For the collapsed ethnicity variable, the reference group was ‘white UK’ as
this was the level with the most cases. For the collapsed religion variable, the
reference group was ‘Do not have a religion’ as this was the level with the most
cases. The newly formed three-level variable for marital status was also dummy
coded with the reference group being ‘Married, in civil partnership or cohabiting’ as
this was the level with the most cases.
Multiple regressions carried out using the dummy coded variables showed
that ethnicity (N= 207) and religion (N= 202), and marital status (N= 204) do not
predict perceived stress significantly better than just using the mean. As such, they
were not confounding variables in this study.
4.4.4 Confounding variables conclusion
Overall, two variables appeared to be confounding variables in this study,
namely ‘Years of relevant clinical experience’ and ‘Education level’. As such, these
variables were included and controlled for in the moderation analyses.

109
4.5 Research aim A: Levels of perceived stress amongst IAPT therapists
As discussed earlier, the mean perceived stress for the entire sample of 207
therapists was 18.32 and the standard deviation was 6.70; this was higher in absolute
values than the Cohen and Williamson (1988) US norms, which were based on a
large adult national sample collected through a telephone poll. Considering that the
moderation analyses were completed on a sample of N=200 (the reduction to 200
from an entire sample of 207 was due to removing of data of the seven participants
who been excluded when exploring the confounding variables, ‘Years of clinically
relevant experience’ and ‘Education level’), it is worth noting the measures of central
tendency on the sample of 200 participants. The mean perceived stress was 18.44 and
the standard deviation was 6.47 (Appendix P).
Considering that the significance test for the biserial correlation is
conceptually the same as the independent sample t-test (Field, 2005) and given that
correlations carried out on the dichotomous demographic variables revealed no
significant association between working pattern (full/part time), gender
(female/male), employment status (trainee/qualified), or job role (high/ low intensity)
and perceived stress, it is redundant to explore the between-group mean differences in
perceived stress for these variables though independent samples t-tests.
It is, however, worthwhile descriptively noting (Table 3.13) the stress levels
of participants based on their employment statuses and job roles considering that
these characteristics inform the position of these participants within the newly formed
IAPT mental health workforce. It appears that trainees reported higher levels of
stress compared to qualified therapists and that low intensity therapists report higher
levels of stress than high intensity level therapists.

110
Table 3.13
Levels of perceived stress by employment status and job role
n Mean SD
Employment Status
Trainee 95 19.08 5.72
Qualified 103 17.95 7.07
Job role
High intensity 101 18.38 6.33
Low intensity 91 18.75 6.43
Note. n= frequency, SD= Standard Deviation.
Considering that ‘Education level’ was found to be a confounding variable, it
is worth exploring the perceived stress in the two educational groups descriptively
(Table 13.4). Therapists with a Batchelor’s degree or equivalent as their highest
educational level achievement report higher levels of stress compared to participants
with a postgraduate degree.
Table 3.14
Perceived stress at different educational levels
Note. n= frequency, SD= Standard Deviation.
n Mean SD
Bachelor’s degree or equivalent 97 19.91 5.98
Postgraduate Degree level 103 17.05 6.63

111
The categorical variables with three levels were explored through conducting
one-way Analysis of Variances (ANOVA) analyses. There was no significant
difference in levels of perceived stress between participants with different ethnicities,
n= 200, Levene’s test= 0.384, p= .682, F(2, 197) =1.078, p= .342; religions, n=196,
Levene’s test= 0.347, p= .707, F(2, 193)= 1.673, p= .190; or marital statuses, n=197,
Levene’s test= 0.393, p= .675, F(2, 194)= 0.734, p= .481.
In conclusion, the levels of perceived stress in this sample of IAPT therapists
appear to be higher than the levels reported by the US norms (Cohen & Williamson,
1988). Descriptive statistics suggest that (i) trainee therapists report higher levels of
stress than qualified therapists, (ii) low intensity workers report higher levels of stress
than high intensity workers, and (ii) therapists with a Batchelor’s degree or equivalent
as their highest educational level achievement report higher levels of stress compared
to participants with a postgraduate degree.
4.6 Research aim B: Exploring self-compassion as a moderator of the
relationship between work related potential stressors and perceived stress
Seven moderation analyses (Baron & Kenny, 1986; Field, 2013; Hayes, 2013)
were conducted to ascertain whether the strength or direction of the relationship
between each of the seven work-related potential stressors and perceived stress was
affected by self-compassion.
In each of the seven separate analyses a different work related potential
stressor was the independent variable, the total self-compassion score was the
moderator variable and perceived stress was the dependent, or outcome, variable.
Confounding variables (‘Years of clinically relevant experience’, and ‘Education

112
level’) were taken into account conceptually and statistically in the moderation
analyses conducted (Hayes, 2013).
A moderation effect would be detected should the interaction between the
predictor and the moderator significantly predict the dependent variable (Field, 2013).
Significant moderation effects would be explored further by examining what happens
to the relationship between the predictor and outcome variable at many different
levels of the moderator using the Johnson and Neyman technique (Field, 2013). The
Johnson and Neyman technique was preferred over the pick-a-point approach as it
combats the arbitrariness of selecting points at which to evaluate the effect of the
moderator on the relationship between the predictor and the outcome (Hayes, 2013).
Moderation analyses were completed using the PROCESS add-on dialog box
(Hayes, n.d.; 2013; 2016) on a sample of N= 200; the reduction to 200 from an entire
sample of 207 was due to removing of data of the seven participants who been
excluded when exploring the confounding variables (‘Years of clinically relevant
experience’ and ‘Education level’). Names of the variables included in the
moderation analyses were shortened where appropriate to meet the requirement of the
PROCESS tool. Model ‘1’, ‘heteroscedasticity-consistent SEs’, ‘OLS/ML
confidence intervals’ and ‘Generate data for plotting (model 1,2, and 3 only)’ were
selected. Bootstrapping for indirect effects was set to ‘1000’, and the Johnson-
Neyman conditioning choice was selected.
4.6.1 Correlations between self-compassion and work-related stressors and
perceived stress
Correlations between the moderator, self-compassion, and the independent
variables, work related stressors, and dependent variable, perceived stress, are
presented below for reference purposes (Table 3.15).

113
Table 3.15
Correlations between the moderator, and the dependent and independent variables
(N= 200)
Total Self-Compassion
Perceived Stress a -.51***
HSE control a .26***
HSE change a .11
HSE demands b .10
HSE managerial support b .13
HSE colleague support b .10
HSE role b .22**
HSE relationship b .10
Note. HSE= HSE Management Standards Indicator Tool.
a Pearson’s correlation co-efficient. b Spearman’s rho.
** p< .01, *** p< .001
There was a significant negative correlation between perceived stress and self-
compassion (p< .001) and a significant positive correlation between the psychosocial
conditions relating to control over one’s work (p< .001) and role clarity and self-
compassion (p=.001). This meant that therapists reporting higher levels of self-
compassion reported less perceived stress and better conditions of work regarding
control and role clarity. All other correlations were non-significant.

114
In the present sample (N= 200), all stressors were significantly negatively
related to perceived stress (Table 3.16). This meant that the better psychosocial
working conditions therapists reported the less perceived stress they expressed.
Table 3.16
Correlations between the dependent and independent variables
Note. HSE= HSE Management Standards Indicator Tool.
a Pearson’s correlation co-efficient. b Spearman’s rho.
*** p< .001
4.6.2 Moderation analyses
The moderation analyses were run with (see below) and without mean (see
Appendix Q) centring and yielded the same results. Mean centering, the procedure of
subtracting each score from the mean of all scores for the variable is not a sine qua
non of moderation analysis (Hayes, 2013). Despite its usefulness in ensuring that the
independent and moderator variable coefficients are always meaningful and
interpretable in all circumstances, the interaction term findings are not affected by the
Perceived Stress
HSE control a -.38***
HSE change a -.29***
HSE demands b -.44***
HSE managerial support b -.39***
HSE colleague support b -.34***
HSE role b -.34***
HSE relationship b -.37***

115
process of mean centring (Hayes, 2013). It is therefore unsurprising that mean
centering did not impact the results of the interaction term (Hayes, 2013).
Examining the interaction terms produced by the moderation analyses, it was
found that self-compassion did not moderate the relationship between any of the
work-related stressors and perceived stress. More specifically self-compassion did not
moderate the (i) the relationship between demands and perceived stress
(unstandardized beta coefficient (B)= 0.62, t=0.88, p= .381, CI [-0.77, 2.02]; R
Square Change due to interaction= 0.004, F(1, 194)= 0.77, p= .381), (ii) the
relationship between control and perceived stress (B= 0.45, t= 0.73, p= .465, CI [-
0.76, 1.65]; R Square Change due to interaction= 0.002, F(1, 194)= 0.54, p=.465),
(iii) the relationship between managerial support and perceived stress (B= 0.53, t=
0.77, p= .441, CI [-0.83, 1.89]; R Square Change due to interaction= 0.004, F(1,
194)= 0.60, p=.441), (iv) the relationship between colleague support and perceived
stress (B= -0.08, t= -0.11, p= .911, CI [-1.56, 1.39]; R Square Change due to
interaction= 0.0001, F(1, 194)= 0.013, p= .911), (v) the relationship between role
clarity and perceived stress (B= -0.30, t= -0.30, p= .762, CI [-2.23, 1.64]; R Square
Change due to interaction= 0.0005, F(1, 194)= 0.092, p= .762), (vi) the relationship
between relationships and perceived stress (B= -0.20, t= -0.27, p= .785, CI [-1.64,
1.24]; R Square Change due to interaction= 0.0004, F(1, 194)= 0.075, p= .785), or
(vii) the relationship between change and perceived stress (B= 0.45, t= 0.76, p= .446,
CI [-0.71, 1.61]; R Square Change due to interaction= 0.003, F(1, 194)= 0.58, p=
.446).
As such, it can be concluded that self-compassion did not moderate the
relationship between work related potential stressors and perceived stress in the
sample of 200 IAPT therapists.

116
4.6.3 Model cleansing strategy analyses
In the event of an absence of a moderation effect, Hayes (2013) recommends a
model cleansing strategy whereby a model is estimated without the interaction term.
In the re-estimation, seven multiple regressions were carried out using the Enter
method. In each multiple regression, the confounding variables ‘Years of relevant
clinical experience’ and ‘Education level’ were entered as predictors in the first
block, each work related potential stressor was entered as a predictor in the second
block and, the ‘Self-Compassion Total’ was entered in the third block. The dependent
variable was perceived stress.
4.6.3.1 Demands
Three models were generated: ‘Model 1’, F (2, 197) = 8.747, p< .001, only
included the confounding variables and accounted for 8.2% of the variance in
perceived stress.
‘Model 2’, F (3, 196) = 25.085, p< .001, included the confounding variables
and the HSE demands subscale score; this model improved the fit by 19.6%, R
Square Change= .196, F Change (1, 196)= 53.133, p< .001, accounting for a total of
27.7% of the variability in perceived stress.
‘Model 3’, F (4, 195)= 38.385, p< .001, included the confounding variables,
the HSE demands subscale score and ‘Self-Compassion Total’; this model improved
the model by a further 16.3%, R Square Change= .163, F Change (1, 195) = 56.841,
p< .001, accounting for a total of 44.1% of the variance. The multiple regression
coefficients can be found in Table 3.17. Examination of the standardised coefficients
in Model 3 showed that self-compassion had a stronger relationship with perceived
stress (β= -.43) than did other predictors.

117
Table 3.17
Multiple regression coefficients: perceived stress as outcome variable, and
confounders, HSE demands and self-compassion as predictors
Note. B= Unstandardized Coefficients, SE B= Standard Error of Unstandardized
Coefficients, β= Standardized Coefficients Beta, HSE= HSE Management Standards
Indicator Tool, CI= Confidence Interval for B, LB= Lower Bound, UB= Upper
Bound.
*p<.05. **p<.01. ***p<.001.
95% CI
B SE B β LB UB
Model 1
Constant 23.80 1.46 20.92 26.68
Years of relevant clinical Experience -0.23 0.09 -.18** -0.40 -0.06
Education level -2.55 0.89 -.20** -4.30 -0.79
Model 2
Constant 33.79 1.89 30.06 37.51
Years of relevant clinical Experience -0.20 0.08 -.16* -0.35 -0.05
Education level -2.74 0.79 -.21** -4.30 -1.18
HSE demands subscale -3.37 0.46 -.44*** -4.28 -2.46
Model 3
Constant 42.48 2.03 38.48 46.47
Years of relevant clinical Experience -0.05 0.07 -.04 -0.19 0.09
Education level -1.94 0.71 -.15** -3.33 -0.55
HSE demands subscale -3.09 0.41 -.41*** -3.90 -2.29
Self-compassion total score -3.79 0.50 -.43*** -4.78 -2.80
118
The models fitted well the observed data, were not influenced by a small
number of cases and could be generalised without losing substantial predictive power;
information regarding the assumptions and cross-validation of the model can be
found in Appendix R.
4.6.3.2 Control
Three models were generated: ‘Model 1’, F (2, 197) = 8.747, p< .001, only
included the confounding variables and accounted for 8.2% of the variance in
perceived stress.
‘Model 2’, F (3, 196) = 15.458, p< .001, included the confounding variables
and the HSE control subscale score; this model improved the fit by 11%, R Square
Change= .110, F Change (1, 196) = 26.607, p< .001, accounting for a total of 19.1%
of the variability in perceived stress.
‘Model 3’, F (4, 195) = 24.980, p< .001, included the confounding variables,
the HSE control subscale score and ‘Self-Compassion Total’; this model improved
the model by a further 14.7%, R Square Change= .147, F Change (1, 195) = 43.491,
p<.001, accounting for a total of 33.9% of the variance. The multiple regression
coefficients can be found in Table 3.18. Examination of the standardised coefficients
in Model 3 showed that self-compassion had a stronger relationship with perceived
stress (β= -.41) than did other predictors.

119
Table 3.18
Multiple regression coefficients: perceived stress as outcome variable, and
confounders, HSE control and self-compassion as predictors
Note. B= Unstandardized Coefficients, SE B= Standard Error of Unstandardized
Coefficients, β= Standardized Coefficients Beta, HSE= HSE Management Standards
Indicator Tool, CI= Confidence Interval for B, LB= Lower Bound, UB= Upper
Bound.
*p<.05. **p<.01. ***p<.001.
95% CI
B SE B β LB UB
Model 1
Constant 23.80 1.46 20.92 26.68
Years of relevant clinical Experience -0.23 0.09 -.18** -0.40 -0.06
Education level -2.55 0.89 -.20** -4.30 -0.79
Model 2
Constant 32.50 2.18 28.21 36.79
Years of relevant clinical Experience -0.12 0.09 -.09 -0.29 0.05
Education level -2.52 0.84 -.20** -4.17 -0.87
HSE control subscale -2.99 0.58 -.34*** -4.13 -1.85
Model 3
Constant 39.66 2.25 35.22 44.10
Years of relevant clinical Experience 0.00 0.08 0.00 -0.16 0.16
Education level -1.77 0.77 -.14* -3.29 -0.26
HSE control subscale -2.29 0.54 -.26*** -3.35 -1.23
Self-compassion total score -3.66 0.56 -.41*** -4.75 -2.56

120
The models fitted well the observed data, were not influenced by a small number of
cases and could be generalised without losing substantial predictive power;
information regarding the assumptions and cross-validation of the model can be
found in Appendix R.
4.6.3.3 Managerial support
Three models were generated: ‘Model 1’, F (2, 197) = 8.747, p< .001, only
included the confounding variables and accounted for 8.2% of the variance in
perceived stress.
‘Model 2’, F (3, 196) = 17.649, p< .001, included the confounding variables
and the HSE managerial support subscale score; this model improved the fit by
13.1%, R Square Change= .131, F Change (1, 196) = 32.642, p< .001, accounting for
a total of 21.3% of the variability in perceived stress.
‘Model 3’, F (4, 195) = 29.479, p< .001, included the confounding variables,
the HSE managerial support subscale score and ‘Self-Compassion Total’; this model
improved the model by a further 16.4%, R Square Change= .164, F Change (1, 195) =
51.365, p< .001, accounting for a total of 37.7% of the variance. The multiple
regression coefficients can be found in Table 3.19. Examination of the standardised
coefficients in Model 3 showed that self-compassion had a stronger relationship with
perceived stress (β= -.41) than did managerial support.

121
Table 3.19
Multiple regression coefficients: perceived stress as outcome variable, and
confounders, HSE managerial support and self-compassion as predictors
Note. B= Unstandardized Coefficients, SE B= Standard Error of Unstandardized
Coefficients, β= Standardized Coefficients Beta, HSE= HSE Management Standards
Indicator Tool, CI= Confidence Interval for B, LB= Lower Bound, UB= Upper
Bound.
*p<.05. **p<.01. ***p<.001.
95% CI
B SE B β LB UB
Model 1
Constant 23.80 1.46 20.92 26.68
Years of relevant clinical Experience -0.23 0.09 -.18** -0.40 -0.06
Education level -2.55 0.89 -.20** -4.30 -0.79
Model 2
Constant 31.59 1.92 27.80 35.38
Years of relevant clinical Experience -0.25 0.08 -.20** -0.41 -0.09
Education level -2.17 0.83 -.17* -3.80 -0.53
HSE managerial support subscale -2.41 0.42 -.36*** -3.24 -1.58
Model 3
Constant 40.20 2.09 36.07 44.33
Years of relevant clinical Experience -0.10 0.08 -.08 -0.24 0.05
Education level -1.43 0.75 -.11 -2.90 0.04
HSE managerial support subscale -2.12 0.38 -.32*** -2.87 -1.37
Self-compassion total score -3.81 0.53 -.43*** -4.85 -2.76
122
The models fitted well the observed data, were not influenced by a small
number of cases and could be generalised without losing substantial predictive power;
information regarding the assumptions and cross-validation of the model can be
found in Appendix R.
4.6.3.4 Colleague support
Three models were generated: ‘Model 1’, F (2, 197) = 8.747, p< .001, only
included the confounding variables and accounted for 8.2% of the variance in
perceived stress.
‘Model 2’, F (3, 196) = 14.831, p< .001, included the confounding variables
and the HSE colleague support subscale score; this model improved the fit by 10.3%,
R Square Change= .103, F Change (1, 196) = 24.880, p< .001, accounting for a total
of 18.5% of the variability in perceived stress.
‘Model 3’, F (4, 195) = 26.437, p< .001, included the confounding variables,
the HSE colleague support subscale score and ‘Self-Compassion Total’; this model
improved the model by a further 16.7%, R Square Change= .167, F Change (1, 195)=
50.108, p< .001, accounting for a total of 35.2% of the variance. The multiple
regression coefficients can be found in Table 3.20. Examination of the standardised
coefficients in Model 3 showed that self-compassion had a stronger relationship with
perceived stress (β= -.43) than did colleague support.

123
Table 3.20
Multiple regression coefficients: perceived stress as outcome variable, and
confounders, HSE colleague support and self-compassion as predictors
Note. B= Unstandardized Coefficients, SE B= Standard Error of Unstandardized
Coefficients, β= Standardized Coefficients Beta, HSE= HSE Management Standards
Indicator Tool, CI= Confidence Interval for B, LB= Lower Bound, UB= Upper
Bound.
*p<.05. **p<.01. ***p<.001.
95% CI
B SE B β LB UB
Model 1
Constant 23.80 1.46 20.92 26.68
Years of relevant clinical Experience -0.23 0.09 -.18** -0.40 -0.06
Education level -2.55 0.89 -.20** -4.30 -0.79
Model 2
Constant 34.47 2.55 29.45 39.49
Years of relevant clinical Experience -0.26 0.08 -.21** -0.42 -0.10
Education level -1.94 0.85 -.15* -3.61 -0.26
HSE colleague support subscale -2.87 0.58 -.33*** -4.00 -1.73
Model 3
Constant 42.57 2.55 37.54 47.59
Years of relevant clinical Experience -0.10 0.08 -.08 -0.26 0.05
Education level -1.23 0.77 -.10 -2.74 0.28
HSE colleague support subscale -2.45 0.52 -.28*** -3.47 -1.43
Self-compassion total score -3.84 0.54 -.43*** -4.91 -2.77

124
The models fitted well the observed data, were not influenced by a small
number of cases and could be generalised without losing substantial predictive power;
information regarding the assumptions and cross-validation of the model can be
found in Appendix R.
4.6.3.5 Role
Three models were generated: ‘Model 1’, F (2, 197) = 8.747, p< .001, only
included the confounding variables and accounted for 8.2% of the variance in
perceived stress.
‘Model 2’, F (3, 196) = 12.848, p< .001, included the confounding variables
and the HSE role subscale score; this model improved the fit by 8.3%, R Square
Change= .083, F Change (1, 196) = 19.415, p< .001, accounting for a total of 16.4%
of the variability in perceived stress.
‘Model 3’, F (4, 195) = 23.080, p< .001, included the confounding variables,
the HSE role subscale score and ‘Self-Compassion Total’; this model improved the
model by a further 15.7%, R Square Change= .157, F Change (1, 195) = 45.105, p<
.001, accounting for a total of 32.1% of the variance. The multiple regression
coefficients can be found in Table 3.21. Examination of the standardised coefficients
in Model 3 showed that self-compassion had a stronger relationship with perceived
stress (β= -.43) than did other predictors.

125
Table 3.21
Multiple regression coefficient: perceived stress as outcome variable, and
confounders, HSE role and self-compassion as predictors
Note. B = Unstandardized Coefficients, SE B = Standard Error of Unstandardized
Coefficients, β = Standardized Coefficients Beta, HSE = HSE Management Standards
Indicator Tool, CI= Confidence Interval for B, LB= Lower Bound, UB= Upper
Bound.
*p<.05. **p<.01. ***p<.001.
95% CI
B SE B β LB UB
Model 1
Constant 23.80 1.46 20.92 26.68
Years of relevant clinical Experience -0.23 0.09 -.18** -0.40 -0.06
Education level -2.55 0.89 -.20** -4.30 -0.79
Model 2
Constant 34.47 2.80 28.96 39.98
Years of relevant clinical Experience -0.19 0.08 -.15* -0.36 -0.03
Education level -2.31 0.85 -.18** -3.99 -0.63
HSE role subscale -2.82 0.64 -.29*** -4.09 -1.56
Model 3
Constant 41.20 2.72 35.84 46.56
Years of relevant clinical Experience -0.05 0.08 -.04 -0.21 0.10
Education level -1.59 0.78 -.12* -3.13 -0.06
HSE role subscale -2.11 0.59 -.22*** -3.27 -0.94
Self-compassion total score -3.76 0.56 -.43*** -4.87 -2.66

126
The models fitted well the observed data, were not influenced by a small
number of cases and could be generalised without losing substantial predictive power;
information regarding the assumptions and cross-validation of the model can be
found in Appendix R.
4.6.3.6 Relationship
Three models were generated: ‘Model 1’, F (2, 197) = 8.747, p< .001, only
included the confounding variables and accounted for 8.2% of the variance in
perceived stress.
‘Model 2’, F (3, 196) = 20.242, p< .001, included the confounding variables
and the HSE relationship subscale score; this model improved the fit by 15.5%, R
Square Change= .155, F Change (1, 196) = 39.787, p< .001, accounting for a total of
23.7% of the variability in perceived stress.
‘Model 3’, F (4, 195) = 32.660, p< .001, included the confounding variables,
the HSE relationship subscale score and ‘Self-Compassion Total’; this model
improved the model by a further 16.5%, R Square Change= .165, F Change (1, 195) =
53.615, p< .001, accounting for a total of 40.1% of the variance. The multiple
regression coefficients can be found in Table 3.22. Examination of the standardised
coefficients in Model 3 showed that self-compassion had a stronger relationship with
perceived stress (β= -.43) than did relationship.

127
Table 3.22
Multiple regression coefficients: perceived stress as outcome variable, and
confounders, HSE relationship and self-compassion as predictors
Note. B= Unstandardized Coefficients, SE B= Standard Error of Unstandardized
Coefficients, β= Standardized Coefficients Beta, HSE= HSE Management Standards
Indicator Tool, CI= Confidence Interval for B, LB= Lower Bound, UB= Upper
Bound.
*p<.05. **p<.01. ***p<.001.
95% CI
B SE B β LB UB
Model 1
Constant 23.80 1.46 20.92 26.68
Years of relevant clinical Experience -0.23 0.09 -.18** -0.40 -0.06
Education level -2.55 0.89 -.20** -4.30 -0.79
Model 2
Constant 36.80 2.46 31.96 41.65
Years of relevant clinical Experience -0.30 0.08 -.23*** -0.45 -0.14
Education level -2.17 0.82 -.17** -3.78 -0.57
HSE relationship subscale -3.20 0.51 -.40*** -4.20 -2.20
Model 3
Constant 45.06 2.46 40.22 49.91
Years of relevant clinical Experience -0.14 0.07 -.11 -0.29 0.01
Education level -1.43 0.73 -.11 -2.87 0.02
HSE relationship subscale -2.88 0.45 -.36*** -3.77 -1.99
Self-compassion total score -3.81 0.52 -.43*** -4.83 -2.78

128
The models fitted well the observed data, were not influenced by a small
number of cases and could be generalised without losing substantial predictive power;
information regarding the assumptions and cross-validation of the model can be
found in Appendix R.
4.6.3.7 Change
Three models were generated: ‘Model 1’, F (2, 197) = 8.747, p< .001, only
included the confounding variables and accounted for 8.2% of the variance in
perceived stress.
‘Model 2’, F (3, 196) = 13.073, p< .001, included the confounding variables
and the HSE change subscale score; this model improved the fit by 8.5%, R Square
Change= .085, F Change (1, 196) = 20.036, p< .001, accounting for a total of 16.7%
of the variability in perceived stress.
‘Model 3’, F (4, 195) = 24.637, p< .001, included the confounding variables,
the HSE change subscale score and ‘Self-Compassion Total’; this model improved
the model by a further 16.9%, R Square Change= .169, F Change (1, 195) = 49.603,
p< .001, accounting for a total of 33.6% of the variance. The multiple regression
coefficients can be found in Table 3.23. Examination of the standardised coefficients
in Model 3 showed that self-compassion had a stronger relationship with perceived
stress (β= -.44) than did other predictors.

129
Table 3.23
Multiple regression coefficients: perceived stress as outcome variable, and
confounders, HSE change and self-compassion as predictors
Note. B= Unstandardized Coefficients, SE B= Standard Error of Unstandardized
Coefficients, β= Standardized Coefficients Beta, HSE= HSE Management Standards
Indicator Tool, CI= Confidence Interval for B, LB= Lower Bound, UB= Upper
Bound.
*p<.05. **p<.01. ***p<.001.
95% CI
B SE B β LB UB
Model 1
Constant 23.80 1.46 20.92 26.68
Years of relevant clinical Experience -0.23 0.09 -.18** -0.40 -0.06
Education level -2.55 0.89 -.20** -4.30 -0.79
Model 2
Constant 29.46 1.88 25.75 33.17
Years of relevant clinical Experience -0.24 0.08 -.19** -0.40 -0.07
Education level -2.52 0.85 -.20** -4.19 -0.84
HSE change subscale -2.10 0.47 -.29*** -3.03 -1.18
Model 3
Constant 38.24 2.10 34.11 42.37
Years of relevant clinical Experience -0.08 0.08 -.07 -0.24 0.07
Education level -1.72 0.77 -.13* -3.24 -0.21
HSE change subscale -1.76 0.42 -.24*** -2.60 -0.93
Self-compassion total score -3.86 0.55 -.44*** -4.95 -2.78

130
The models fitted well the observed data, were not influenced by a small
number of cases and could be generalised without losing substantial predictive power;
information regarding the assumptions and cross-validation of the model can be
found in Appendix R.
4.6.4 Checking analysis assumptions and considerations
4.6.4.1 Moderation analysis assumptions
Given that the statistical model for moderation is a multiple regression (Field,
2013; Hayes, 2013), it was important to ascertain whether regression assumptions
were met in this sample as this would inform the inferences made regarding the
aforementioned findings.
The assumptions regarding the predictor and outcome variables being at least
interval, the values of the predictors being varied, the outcome variable scores being
independent, and homoscedasticity of error variances were met. The scatterplots of
each of the predictor and dependent variable were examined and did not indicate a
curvilinear relationship (Appendix S). The variables were constrained and thus
unbound; however, this is common and inevitable in research based on
questionnaires.
Seven multiple regressions using the method enter were run to explore the
remaining assumptions regarding multicollinearity, independence and distribution of
errors, and outliers and influential cases as it was impossible to explore these through
the PROCESS model output. Each multiple regression involved perceived stress as
the outcome variable and five predictors, namely one confounding variables relating
to years of relevant clinical experience, one confounding variable relating to
education level, a work related potential stressor, the self-compassion total score, and

131
the corresponding ‘self-compassion total score X work-related potential stressor’
variable relating to the moderation interaction term. All predictors were entered in the
aforementioned order in a single block. Seven interaction term variables were created
by multiplying each work-related stressor score with the total self-compassion score.
With respect to multicollinearity, no predictors correlated substantially with
each other. The correlations were all below .9 for all seven multiple regressions. The
Variance Inflation Factor (VIF) and tolerance statistics were not examined as the
generation of a model whereby an interaction term predictor exists alongside the
variables that compose it, would potentially produce a very large VIF and a small
tolerance; this is unavoidable given our endeavour of ‘running’ a moderation analysis
as a multiple regression.
Considering the independent errors, the Durbin-Watson statistic was 1.97,
1.95, 1.90, 1.94, 1.93, 1.94 and 1.96 for the multiple regression relating to demands,
control, managerial support, colleague support, role clarity, relationship and change
respectively; this is close to 2 so the assumption of independent errors was deemed to
be met.
The assumption regarding the linearity of residuals was met as there was no
patterning observed on the plots of residuals. Normality of the standardised residuals
was also met as the histograms were roughly bell-like shaped, and the points roughly
mapped onto the line of the normal probability plots. Residual graphs can be found in
Appendix T.
Casewise diagnostics showed that only one case had a standard residual
greater than 3 for the multiple regressions regarding demands, managerial support,
and change. Cook’s Distance for this case was less than one thus the case was not
deemed to be influential. The multiple regressions regarding control, colleague

132
support, role clarity and relationship yelled two cases with residuals greater than 3;
neither was deemed an influential case once Cook’s distances were examined.
In conclusion, it appears that most of the assumptions of multiple regressions
are met and the findings can be interpreted with relative trust.
4.7 Summary of results
Self-compassion did not moderate the relationship between work related
potential stressors and perceived stress in the sample of 200 IAPT therapists. When
data cleansing strategies were employed, work related stressors and self-compassion
were found to be independent predictors of perceived stress.

133
5. Discussion
This chapter discusses the findings from the present study and explores how
they can be understood considering previous research. The study will be critically
appraised as the strengths and shortcomings of the project will be examined.
Following this, there will be an evaluation of the study’s implications in terms of
theory, practice and future research.
5.1 Project summary
The study aimed to identify the levels of perceived stress in IAPT therapists
and to explore whether self-compassion moderates the relationship between work
related potential stressors and perceived stress. The findings relating to levels of
perceived stress will be presented and discussed first followed by the findings relating
to the moderation effect hypotheses.
5.1.1 Levels of perceived stress in the sample of IAPT therapists
To the researcher’s knowledge, this is the first study examining perceived
stress as measured by the PSS-10 (Cohen & Williamson, 1988) in IAPT therapists. In
this study (N= 200), the mean score for perceived stress was M= 18.44 and the
standard deviation was SD= 6.47. Considering that there is no published data on the
levels of perceived stress in IAPT therapists and given that the IAPT workforce is
relatively newly formed and the IAPT working practices are different to traditional
mental health therapeutic settings (Baguley et al., 2010), these findings will first be
discussed in relation to the normative data. Following this, the present findings will
be discussed in relation to existing literature on healthcare professionals.

134
5.1.1.1 Normative levels of perceived stress
The initial norms for the PSS-10 derived from the 1983 US Harris telephone
poll survey (Cohen & Williamson, 1988). The Harris poll sample consisted of over
2,000 adult respondents who reported a mean score of 13.02 and a standard deviation
of 6.35 on the PSS-10 (Cohen & Williamson, 1988). When looking at the most
relevant- in relation to the present sample’s age- age brackets in the Harris poll
sample, 30 to 44-year olds (n= 750) reported a mean score of 13.00 (SD= 6.2) on the
measure (Cohen & Williamson, 1988).
Cohen and Janicki-Deverts (2012) presented more recent normative data
collected online through the eNation survey from 2,000 US adults in 2006 and 2009.
When looking at the most relevant- in relation to the present sample’s age- age
brackets, the 25 to 34-year olds in the 2006 sample (n= 331) reported a mean of 17.78
(SD= 7.19) and those in the 2009 sample (n= 433) reported a mean of 17.46 (SD=
7.31) (Cohen & Janicki-Deverts, 2012).
Considering that no published UK normative data for the PSS-10 could be
found by the researcher and bearing in mind the findings from Cohen and Williamson
(1988), and Cohen and Janicki-Deverts (2012), it could be argued that the present
sample of IAPT therapists (N= 200) appeared to report higher levels of perceived
stress (M= 18.44, SD= 6.47) compared the 1983, 2006 and 2009 US norms.
5.1.1.2 Stress in healthcare professionals
The present findings regarding levels of perceived stress in IAPT therapists
can be discussed in relation to aforementioned healthcare professionals’ studies using
the same measure of perceived stress and in terms of findings relating to stress in
health care professionals deriving from the same national workforce.

135
In terms of aforementioned healthcare professionals’ studies using the 10-item
Perceived Stress Scale, Erogul et al. (2014), Kemper et al. (2015) and Olson and
Kemper (2014) report on the total perceive stress score of their samples. The levels of
perceived stress in Erogul et al. (2014), while lower than the levels reported in the
present study, were more similar to the findings of the present research compared to
the results from the remaining studies. Erogul et al.’s (2014) sample of first year
medical trainees reported an average of 17.9 (SD= 6.3) of perceived stress. The
average level of perceived stress reported by Erogul et al. (2014) can be thought of as
a high score given that Kemper et al. (2015) characterised the mean score found in
their sample of young health care professionals and trainees (M= 17.4, SD= 5.3) as
being “at the high end of perceived stress scores among health professionals”
(Kemper et al., 2015, p. 499). Meanwhile, Olson and Kemper (2014) noted that their
finding that medical trainees reported a mean of 13.5 (SD = 3.5) in perceived stress
was “somewhat lower” (Olson & Kemper, 2014, p.293) that the levels reported by
medical trainees in another study using the same measure.
In thinking about the UK context, the findings from the present study
indicating relatively high levels of perceived stress in IAPT therapists are in line with
outcomes presented by other studies deriving from the same national workforce.
More specifically, the present findings are congruent with the results from the British
Psychological Society and New Savoy Partnership (2016) survey, which showed that
70% of a sample of UK psychological therapies professionals found their work
stressful.
Additionally, relatively high levels of perceived stress found in this sample of
IAPT therapists, are consistent with the findings relating to burnout prevalence of
68.6% amongst step two practitioners and 50% amongst step three therapists

136
(Westwood et al., 2017). The present results are also in keeping with the finding that
29.5% of a sample of IAPT staff were found to be experiencing psychological stress
which reached levels for minor psychiatric disturbance (Walket & Percy, 2014).
This research together with the British Psychological Society and New Savoy
Partnership (2016) survey findings, and the results from Westwood et al. (2017), and
Walket and Percy (2014) indicate that the IAPT workforce, which is embedded in the
UK psychological therapies workforce, may be experiencing elevated levels of stress
and psychological distress, and burnout.
5.1.2 Moderation effect
The study aimed to explore whether self-compassion moderated the
relationship between work-related potential stressors and perceived stress in IAPT
therapists. The moderation hypotheses were formed after acknowledging (i) the links
between work-related stressors, and experiences of stress and reduced wellbeing, and
(ii) the negative association between self-compassion, a potentially protective factor
against emotional suffering, with stress.
More specifically, existing literature had found a relationship between work-
related stressors and psychological difficulties (Clark et al., 2012; Stansfeld & Candy,
2006; Stansfeld et al., 1999), and an association between work-related stressors and
physical symptoms (Nixon et al., 2011) such as headache, dizziness, sleep problems,
fatigue and appetite loss, which are indicative of stress (NHS Choices, 2017). Self-
compassion, on the other hand, had been associated with a host of positive outcomes
relating to individual wellbeing (Barnard & Curry, 2011; Neff & Costigan, 2014).
Self-compassion had, additionally, been seen as potentially holding a protective role
in relation to emotional suffering and fostering emotional resilience (Raes, 2010,

137
2011) and was also found to be predominately negative related to perceived stress
across the literature. As such, and in an attempt to understand whether self-
compassion was a protective factor with respect to the relationships between
perceived stress and workplace stressors, analyses testing whether self-compassion
moderated the relationship between work-related stressors and perceived stress were
conducted.
The analyses suggested that self-compassion did not moderate the relationship
between work-related potential stressors and perceived stress in the sample of 200
IAPT therapists. Considering the existing literature, upon which the hypotheses were
based, and the posited protective role of self-compassion, this was an unexpected
finding.
With regards to the optimal conditions for a moderation analysis, Baron and
Kenny (1986) and Hayes (2013) discuss the conceptual and statistical parameters of
moderation analyses. According to Hayes (2013), an association between the
independent and dependent variables is not necessary for a moderation analysis to be
conducted. In the present sample, all stressors were significantly negatively related to
perceived stress (Table 3.16).
In terms of the relationships between the variables in the moderation, Baron
and Kenny (1986) suggest that it is preferable for the moderator to not be associated
with either the independent nor the dependent variable as an absence of a correlation
would make the moderation effect easier to interpret. As described previously (Table
3.15), there was an inverse relationship between perceived stress and self-compassion
(p< .001) and a positive correlation between the psychosocial conditions relating to
control over one’s work (p< .001) and role clarity and self-compassion (p= .001) in

138
the present sample. Considering that moderation effects were not found, this desirable
condition is not applicable to the findings.
The absence of moderation effects indicating that different levels of self-
compassion did not affect the strength or direction of the relationship between work-
related potential stressors and perceived stress, could be understood if one
conceptualises self-compassion not as a protective factor but as a resource that aids
individuals to cope with stressors (Allen & Leary, 2010).
Allen and Leary (2010) explored the links of self-compassion with five main
categories of coping, namely cognitive restructuring, problem solving, support
seeking, distraction and avoidance. The majority of the research reviewed supported
the conceptualisation of self-compassion as a coping resource that primarily “involves
thinking about stressful situations in ways that enhance coping” (Allen & Leary,
2010, p.115). Other researchers have understood self-compassion as a “useful
emotional-approach coping strategy” (Neff, 2003b, p. 92), whereby the individual
connects with their feelings. Its relationship with self-regulation in the context of
coping with stress has also been posited (Neff, 2003b).
More recently, research has aimed to systematically understand the role of
self-compassion in the stress and coping process. For example, Mosewich (2013),
despite not finding a moderation effect of self-compassion on the relationship
between goal progress, and appraisal, coping and affect in female athletes, suggested
that self-compassion may have a more direct role in the stress and coping process in
female athletes. More specifically, it was suggested that self-compassion may aid the
prediction of perceived control appraisal, threat appraisal, avoidance coping and
negative affect in female athletes (Mosewich, 2013). Given that the present study did
not conceptualise self-compassion in relation to coping and did not measure aspects

139
of the coping process, it is impossible to comment on whether self-compassion may
have held such a role in the sample of IAPT therapists. Future research should
explore the role of self-compassion in relation to the coping process and phenomenon
in IAPT therapists.
Considering that the present study did not find a moderation effect, data
cleansing strategies were employed. Through these analyses, work related stressors
and self-compassion were found to independently explain a unique amount of
variance in perceived stress. While prior research had pointed towards work-stressors
and self-compassion being important factors linked to individual stress, and physical
and psychological health (e.g. Bosma et al., 1997; Clark et al., 2012; Crary, 2013;
Danna & Griffin, 1999; Erogul et al. 2014; Kemper et al., 2015; MacBeth & Gumley,
2012; Nixon et al., 2011; Olson & Kemper, 2014; Stansfeld & Candy, 2006;
Stansfeld et al., 1999), this project examining both work-related stressors and self-
compassion in the same study showed that both variables are independent predictors
of perceived stress.
The present finding relating to the independent contributions of work-related
stressors and self-compassion in explaining perceived stress suggests that
interventions aiming for a reduction in perceived stress in IAPT therapists would
benefit from having a two-fold orientation, namely towards improving workers ability
to related to themselves in a self-compassionate way and towards attending to the
environmental stressors.
An additional finding of the present study relates to self-compassion having a
stronger relationship with perceived stress than any of the work-related stressors as
indicated by the standardised regression coefficients. While this finding suggests that
an improvement in self-compassion can have more impact on perceived stress than a

140
reduction in work-related stressors, it is important that attempts to reduce stress in
IAPT therapists attend to both these areas for two main reasons.
Firstly, working towards increasing self-compassion and reducing work-
related stressors is important as both were found to be predictors of perceived stress.
Secondly, the relevance of the social context and environment in shaping one’s way
of relating to oneself and others (Gilbert, 2018) suggests that attending to work
related stressors may be important in facilitating the adoption of a self-compassionate
attitude and, consequently, a reduction to perceived stress in IAPT therapists.
Gilbert (2018) has examined human suffering in relation to social contexts
and culture and has commented on the need non-toxic mental environments and
contexts for human wellbeing thus highlighting the relevance of the environments in
shaping our orientation towards ourselves and others.
In the field of healthcare, McPherson, Hiskey and Alderson (2015) discuss the
impact of contextual factors, such as organisational barriers, on the delivery of
compassionate care in dementia wards and note that attending to contextual and
structural factors in the work environment and practices may improve compassionate
care.
Moreover, in their framework for compassionate care based on the perspective
of healthcare professionals working with individuals with type 2 diabetes, Tierney,
Seers, Tutton and Reeve (2017) discuss how one’s wish to provide compassionate
care is not enough for it to transpire. They explain how ‘professional compassion’,
the “inner desire to improve patient well-being and to act as one would expect from
someone in a healthcare role” (Tierney et al., 2017 p. 6) and driver of the
compassionate care flow can be affected by systemic and other factors. The systemic
factors identified by Tierney et al. (2017) functioned either as drainers (e.g. time

141
constraints and competing demands on resources) or defenders (e.g. support from
colleagues, professional autonomy, compassionate organisation culture) of the
compassionate care flow. Drainers hampered the compassionate care flow whereas
defenders reinforced it.
Considering the findings from McPherson et al. (2015) and Tierney et al.
(2017), which suggest that systemic, structural and contextual workplace factors
affect the delivery of compassionate care, and given that directing compassion
towards others (Gilbert, 2014) is one of three ways that compassion can flow, it could
be hypothesised that toxic contexts at work may hinder the flow of compassion from
oneself towards one’s self, resulting in an increase in stress.
5.2 Strengths and limitations of the project
The present study will be critically appraised in relation to its strengths and
limitations in terms of sampling strategies, design, method of data collection and
measures.
5.2.1 Sampling
Quantitative research in social sciences is commonly interested in drawing
wider conclusions regarding a target population (Field, 2005). Generalisability is
considered a quality indicator in projects employing quantitative methods (Polit &
Beck, 2010). The extent to which one can generalise findings from a particular
sample to the target population depends on the representativeness of the sample. A
sampling method giving each member of the population equal chance to participate in
the study is thought to be the optimal way of achieving a representative sample (Polit
& Beck, 2010).

142
It can be argued that, in the present study, the researcher endeavoured to
provide each member of the trainee population with equal chance to participate in the
study. The researcher attempted to contact every low and high intensity training
institution in the UK to make them aware of the study taking place. Nineteen out of
33 courses agreed to make their trainees aware of the project meaning that trainees on
the majority of the courses were given the opportunity to take part in the study.
An attempt to reach as many as possible trainee and non-trainee IAPT
therapists at a nationwide level was made through the use of popular and specialised
internet-based platforms (FacebookTM, BABCP forum), relevant magazines (CBT
Today) and through linking up with nationwide professional bodies (BPS, BABCP).
Snowball sampling was also encouraged by inviting people who saw the advert to
pass the link to the study on to others who might have been eligible and interested in
taking part. The sampling can also be characterised as convenience sampling as
individuals most accessible to the researcher were at first instance invited to the
study.
Convenience and snowball sampling was employed in combination to
maximise the chances of the research invitation being disseminated, considered and
taken up by therapists and the required sample size being achieved. This was
particularly important considering the high caseloads (DOH, 2008c), training
commitments and demands, and thus heavy workload that some of the potential
participants may have had, which could have rendered achieving the required sample
size a challenge.
While this recruitment method did not allow for each and every IAPT
therapist to have equal chance to be invited to take part in the study, it was deemed to

143
be a feasible, affordable and efficient, way of disseminating the invitation widely
given the time and resource constraints of the project.
While convenience and snowball sampling allowed for the required sample
size for this study to be achieved, it could have introduced a number of limitations to
the project. More specifically, therapists with a particular interest in the topics of
stress, work stressors and self-compassion or individuals who were more engaged
with professional bodies may have been more likely to take part in the study. If this
were to happen, the study sample may have been subject to self-selection bias and
may have not accurately represented the entire population of IAPT therapists. The
same applies regarding the possibility that IAPT therapist with particularly high or
low stress levels could have been more likely to take part in the study due to possibly
wanting to voice their experience of feeling stressed or because they may have had
increased availability to take part.
It is not possible to determine if self-selection bias and motivational
differences biased the findings as data on special interest in the study topic and
engagement with professional bodies were not captured, and published research on
levels of perceived stress in IAPT therapists is not available to allow for comparisons.
Another way to evaluate the possibility of existence of self-selection bias in a study is
to examine attrition rates. However, due to the nature of the anonymous online study,
it was not possible to ascertain how many individuals saw the link but chose not to
participate and what may have been the reasons for this choice. As such, the findings
of the present study need to be considered with these limitations in mind.
Convenience sampling may also result in a demographically skewed sample.
To examine if this was the case in this study, demographic data were collected from
participants and were compared with information from the latest IAPT Adult

144
Workforce Census (NHS England & Heath Education England, 2016). The present
sample was found to be characterised by an overrepresentation of trainee therapists
and the low intensity workforce in comparison to the IAPT workforce population.
This may have been a result of recruiting through training institutions and as a
consequence of a higher proportion of Psychological Wellbeing Practitioner courses
agreeing to disseminate the link compared to High Intensity Programmes.
Additionally, the sample was predominantly female which was fairly similar
to what was reported in the latest IAPT Workforce Census (NHS England & Heath
Education England, 2016). Again, similarly to the IAPT Workforce Census (NHS
England & Heath Education England, 2016) where the workforce was found to be
predominantly White British, most of the participant in this study identified as ‘White
British, White English, White Scottish, White Welsh’. As such, the present sample of
IAPT therapists could be characterised as fairly representative of the IAPT workforce
in terms of gender and ethnicity.
5.2.2 Design
This was a cross-sectional study. While cross-sectional designs are well suited
to explore the prevalence of an outcome and the associations between many variables
and in providing single-time-point information regarding a phenomenon (Levin,
2006), they have some significant shortcomings. The main limitations of cross-
sectional designs, relevant to the present study, include the inability to infer causal
relationships from the findings and susceptibility to biases produced by the single-
time-point data collection (Levin, 2006).
The present study did not aim to explore causal relationships between
variables but was, instead, interested in exploring prevalence of perceived stress in

145
IAPT therapists and the associations between work-related potential stressors, self-
compassion and perceived stress. As such, the cross-sectional design was appropriate
and relevant to the research aims.
Moreover, the present findings were consistent with existing literature
pointing towards elevated levels of distress and burnout in IAPT therapists (Walket &
Percy, 2014; Westwood et al., 2017); as such, it was deemed unlikely that contextual
or historic influences biased the findings.
5.2.3 Method of data collection
The data collection happened online in the present study. The advantages of
an online study in terms of speed, ease, affordability, and efficiency have been noted
in the literature (Wright, 2005). It was assumed that therapists would be able to
complete the study should they wish as internet access is widely available and
internet-based studies are commonly used. The remoteness of online research could
also reduce the presence of Hawthorne’s effect, or in other words the extent to which
participants would alter their behaviour due to being observed.
Despite presenting with these strengths, online research also has a number of
limitations. In addition to the difficulty of evaluating attrition rates, a further
limitation relates to the fact that the researcher is not physically present to offer
clarifications to participants before and during their participation in the project. With
this limitation in mind, the contact details of the researcher and the research
supervisors were included in the study information sheet along with a sentence
prompting individuals to contact the researcher should they wish to discuss the study
further. No one used this option. In hindsight, the physical presence of the researcher
may have offered the opportunity to participants who made an error when recording

146
their years of employment with IAPT to gain appropriate clarifications and this may
have prevented them from responding in a way that was invalid.
It is important to note that the following factors may have also contributed to
a reduction to the Hawthorne’s effect and participants responding in a more open and
honest way, namely (i) not recruiting through participants’ place of work, (ii)
communicating, during the recruitment process, that the study is completed as part of
the researcher’s doctorate degree training, (iii) amending the instructions of the HSE
Management Standards Work-Related Stress Indicator Tool (Cousins et al., 2004) as
to not suggest that the research is linked with their employing organisation, (iv)
participation in the study was anonymous, (v) participation in the study was voluntary
and participants gave freely of their time.
5.2.4 Measures
This study used self-report questionnaires, which is a widely used method of
collecting data in the social and behavioural science (Harrison, McLaughlin, &
Coalter, 1996). The measures’ suitability for use in online research was screened. It
was considered that participants would be familiar with this way of collecting data as
self-report screening tools are frequently used within their day to day role in the IAPT
setting.
Anonymity of the collected data and blinding to the specific study hypotheses
were thought to be ways of minimising the effects of social desirability and
obsequiousness bias (Delgado- Rodriguez & Llorca, 2004). More specifically, it was
deemed that if responses were anonymous and participants did not know the study’s
specific hypotheses, it would be more likely that they would answer in a way that was
147
honest and that they would be less likely to want to portray themselves in a positive
light or provide answers that they think the researcher wants to hear.
Given that the use of self-report measures to explore attitudinal and perceptual
constructs and theories has been seen as appropriate (Schmitt, 1994), the employment
of self-report measures to capture self-compassion, perceived stress and work-related
potential stressors can be considered a strength of the research.
The measures used in the present study had good psychometric properties.
The HSE Management Standards Work-Related Stress Indicator Tool (Cousins et al.,
2004) was selected as a measure of work-related potential stressors as it has better
internal consistency and is shorter, and therefore less taxing, compared to the other
measures (e.g. Kirstensen, et al., 2005). In the present study, the HSE Management
Standards Indicator Tool (Cousins et al., 2004) showed good internal consistency.
The PSS-10 (Cohen & Williamson, 1988) was selected as the measure of
how stressful respondents perceived their lives to have been in the last month. The
10-item version of the scale had been found (Cohen & Williamson, 1988) to have
better internal reliability compared to the longer 14-item version and the shorter 4-
item version and was, as such, chosen for the present study. In this project, the PSS-
10 showed even better internal consistency compared to previous literature in
therapists (Shapiro et al., 2007).
The SCS (Neff, 2003a), was selected as the measure for self-compassion in
the present study. The SCS (Neff, 2003a), although commonly used across the
literature, has received a number of recent criticisms with respect to its theoretical
validity and its psychometric properties (Cleare, Gumley, Cleare, & O’Connor, 2018;
Neff, 2016b).

148
Some researchers have raised concerns around the existence of subscales
representing uncompassionate responses, namely self-judgements, isolation and over-
identification (Muris, Otgaar, & Petrocchi, 2016), which was thought to have the
potential to lead to an inflation of the association of the self-compassion total score
with measures of psychopathology (Muris & Petrocchi, 2017). In addition to noting
the importance of the interactive and dynamic nature of the relationship between the
self-compassion components in the conceptualisation of the construct (Neff, 2016b),
the distinct but interrelated physiological manifestations of compassionate and
uncompassionate responses have also been presented (Neff, 2016a) as an argument
for why the presence of subscales representing both compassionate and
uncompassionate responses is theoretically valid. According to Neff,
“conceptualizing self-compassion as a dynamic system, and using a total SCS score
to assess the relative balance of system components makes sense” (Neff, 2016a, p.
793).
To address the criticism around a possible boosting of the association between
self-compassion and psychopathology, Neff (2016a) noted that the negative ways of
self-relating measured by the SCS are not psychopathology outcomes as such and that
future research might need to attend to this criticism “by comparing effect sizes when
the link between self-compassion and psychopathology is examined using an SCS
total score versus an intervention or mood induction” (Neff, 2016a, p.795).
The validity of the use of the total score on the SCS (Neff, 2003a) and the
measure’s factor structure has received criticism (Muris et al., 2016). Empirical
evidence supporting the initial structure and the use of a total score has been mixed
(Cleare et al., 2018). Neff (2016a) explained how recent findings support “the idea
that the SCS could be used as originally proposed—to measure either a total self-

149
compassion score or else six separate subscales scores” (Neff, 2016a, p.793)
considering that “estimates suggested a general self-compassion factor accounted for
at least 90% of the reliable variance in SCS scores across” (Neff, Whittaker, & Karl,
2017, p. 596). Research by Cleare et al. (2018) also seemed to support the use of the
six-subscales and total score. In the present study, the internal consistency of the
measure was good.
The SCS (Neff, 2003a), used in the present study, is the only scale exclusively
measuring self-compassion (López et al., 2015); other measures tap into the construct
of self-compassion while also measuring compassion towards others (e.g. Narrative
Compassion Scale; MacBeth, 2011) or relational aspects of compassion (e.g.
Relational Compassion Scale; Hacker, 2008).
5.3 Implications
5.3.1 Implications for theory
The present study aligned itself to one of the three dominant conceptual
orientations of stress, namely the transactional approach (Lazarus, 2006). The
transactional approach places emphasis on the relational processes between the
environment and the individual, and the role of appraisal and meaning making of the
experience (Lazarus, 2006). This project focused on exploring a possible mechanism
involved in the person-environment transaction namely, whether one’s levels of self-
compassion can moderate the relationship between their appreciation of workplace
environment and their levels of perceived stress.
Brief and George (1995) have criticized the use of the transactional approach
in workplace settings explaining that the transactional approach may be less
interested in factors operating at a contextual level. One factor operating at a

150
contextual level is organisational culture or in other words “the way in which the
organizations demonstrate management commitments and have procedures that are
fair and open” (McKay et al., 2004, p. 95). Organisational culture is present in the
areas of stressors relating to workplace demands, perceived control, support and
relationships at work, job role and communication and managements of
organisational change (McKay et al., 2004). Considering this and by incorporating the
HSE Management Standards Work-Related Stress Indicator Tool (Cousins et al.,
2004), it could be argued that the present project captured elements of organisational
culture. As such, this research demonstrates how the transactional theory can be
employed to guide research tapping into factors that operate on a contextual level.
A second theoretical implication relates to the finding that self-compassion
did not moderate the relationship between work related stressors and perceived stress.
This result indicated that the proposed protective role of self-compassion in relation
to a moderating effect of the relationship between work-related potential stressors and
perceived stress did not hold true in the present sample.
Exploring the role of self-compassion in the stress and coping phenomenon
and understanding its potential function as a coping resource or a resource that aids
individuals to cope with workplace stressors is important. The transactional approach
to stress can theoretically accommodate such a function for self-compassion.
According to the transactional approach of stress, should a primary appraisal establish
that one’s goals, commitments, values and beliefs are at risk, a secondary evaluation
of one’s coping options takes place. Self-compassion, involving how one responds
emotionally to one’s failure or shortcomings and how one makes sense of one’s
experience and attends to their circumstances (Neff, 2016a, 2016b), could potentially
mitigate the aforementioned appraisal processes.

151
Exploring the role of self-compassion in the stress and coping process would
also be in keeping with Gilbert’s (2006, 2010a) conceptualisation of the interplay
between the affect regulation systems. Experiencing compassion from others in early
life is posited to support the calming of the threat-focussed system and the gradual
development of a compassionate way of self-relating, which can be applied to internal
and external threats. Further understanding how a compassionate way of self-relating
can support coping with external and internal perceived threats in the workplace
context may be an important step in compassion and self-compassion theory.
Research is already attempting to understand compassion towards others and
towards oneself in relation to appraisal and coping. A review by Goetz et al. (2010)
drew from evolutionally perspectives and relevant literature and noted the distinct
appraisal processes of compassion. Goetz et al. (2010) suggested that compassion is
shaped by (i) how relevant the sufferer is to oneself, (ii) how deserving the sufferer is
thought to be of his predicament, and (iii) one’s ability to cope with the difficulty.
Allen and Leary (2010) explored the links of self-compassion with five main
categories of coping, namely cognitive restructuring, problem solving, support
seeking, distraction and avoidance. The majority of the research reviewed supported
the conceptualisation of self-compassion as a coping resource that primarily “involves
thinking about stressful situations in ways that enhance coping” (Allen & Leary,
2010, p.115).
5.3.2 Implications for practice
Given prior knowledge regarding the detrimental effects of stress on
individuals and collective level (Blaug et al., 2007; Bosma et al., 1997; Stansfeld et
al, 1999), the finding that IAPT therapists reported levels of perceived stress that are

152
higher than the US norm and “at the high end of perceived stress scores among health
professionals” (Kemper et al., 2015, p. 499) is worrying. This worry is exacerbated
considering the slowly emerging research on the prevalence of stress and psychiatric
disturbance, and burnout amongst IAPT staff (Walket & Percy, 2014; Westwood et
al., 2017).
While exploring and intervening to reduce IAPT therapists’ stress levels are
warranted, what is less clear is whether the interventions should be targeted at the
intra-individual, inter-individual or contextual level (McPherson & Hiskey, 2016).
Having explored stress as the transaction of the individual with their environment,
one’s way of relating to themselves (self-compassion) and factors representing
aspects of the workplace context (work-related stressors), this study supports the idea
that any future intervention aiming towards a reduction in perceived stress in IAPT
therapists should attend to both improving contextual factors, or in other words
reducing work-related potential stressors, and supporting workers in self-relating with
compassion.
In examining how individuals appraise their work environment, the mean and
median scores for all seven different areas of potential work stressors fell around the
middle of the scale. All stressors were significantly negatively related to perceived
stress indicating that the better psychosocial working conditions therapists reported
the less perceived stress they reported. This alongside the finding that each work-
related stressor accounted for a unique amount of variance in perceived stress
indicates that intervening at the organisational level may helpful when attending to
the difficulties of perceived stress in IAPT therapists.
Considering the findings in relation to self-compassion, IAPT therapists in
this sample appeared to have reported slightly higher levels of self-compassion (M=

153
3.11, SD= 1.05) compared to Robinson’s (2015) UK community sample. Similarly to
what has been reported regarding clinical psychologists (Robinson, 2015), while
IAPT therapists may know about the links between self-compassion and wellbeing,
the overall moderate scores on the self-compassion measure suggest that they may
struggle to put these principles into practice.
It seems that particular aspects of the workplace environment are linked to
self-compassion; therapists reporting higher levels of self-compassion reported better
conditions of work regarding control (r= .26) and role (rho= .22). While it is
important to note that these correlational findings should not interpreted as causal
relationships, they suggest that perceiving that one has clarity over one’s role and
responsibility, and reporting that one has a say over how they work is linked to
relating towards one’s self in a compassionate manner. As such, it could be argued
that by improving therapists’ role clarity and the level of say they have over their
work, self-compassion may increase or vice versa.
Given the positive relationship between self-compassion and better conditions
of work regarding control and role alongside the finding relating to a strong negative
association between self-compassion and perceived stress (r= -.51), it could be
suggested that, by increasing levels of IAPT therapists’ control over how they do
their work and improving their role clarity and conflict, self-compassion and stress
levels may improve or vice versa.
While the important role of the context in shaping self-relating has been noted
(Gilbert, 2018), interventions that target the development of self-compassion may be
warranted considering that this way of relating to one’s self was the strongest
predictor of perceived stress. Two of the most prominent interventions that aim to
teach individuals how relate to themselves in a more compassionate way are the

154
Compassion Focused Therapy (Gilbert, 2010b) and the Mindful Self-Compassion
(Germer & Neff, 2013; Neff & Germer, 2013).
Compassion Focused Therapy was developed as an intervention for
individuals struggling with mental health difficulties relating to shame and self-
criticism (Gilbert, 2010b). It is based on evolutionary neuroscience model and is a
multimodal therapy using a host of practices to promote wellbeing and recovery such
as guided discovery, monitoring, behavioural interventions, imagery, chair work,
letter writing, and mindfulness (Gilbert, 2010b).
Mindful Self-Compassion was developed for use with people without mental
health difficulties and with some clinical groups (Neff & Germer, 2013). It is an
eight-week intervention with participants meeting for two or two and a half hours
weekly plus a half-day meditation retreat (Neff & Germer, 2013). Mindful Self-
Compassion supports individuals to learn how to practice mindfulness and self-
compassion through discussions, experiential exercises, meditative practice, small
group conversations, and homework (Centre for Mindful Self-Compassion, 2017;
Neff & Germer, 2013).
In thinking about using Compassion Focused Therapy and Mindful Self-
Compassion as ways of targeting the development of self-compassion in IAPT
therapists, one may need to consider the appropriateness, feasibility and effectiveness
of these interventions with IAPT workers. As well as increasing the evidence base for
these interventions with IAPT workers, understanding how widely available these
interventions are and thinking about how they would be implemented in the IAPT
context may be important issues to consider.

155
5.3.3 Implications for future research
It would be important for future research to focus on the topic of perceived
stress in IAPT therapists. Given that this project was the first measuring perceived
stress in IAPT therapists, it is pivotal that more data is collected at a national level in
order to increase the confidence in the present study’s estimate of the prevalence of
perceived stress in this professional group.
In order to increase the generalisability and reliability of the finding, it would
be helpful for the project to be replicated. It might be helpful to examine levels of
perceived stress and the moderation hypotheses in particular IAPT settings (e.g. long-
term conditions, severe mental illness, children and young people’s IAPT) especially
given the initiatives relating to rolling out the service provision to these clinical
populations (DOH, 2011) are extending the initial remit of the IAPT programme
which involved working with common mental health difficulties. This type of project
would allow a better understanding of the prevalence of stress and mechanisms
implicated in the stress experience in different IAPT service settings.
Examining more systemic and contextual factors implicated in the stress
phenomenon may be an important next step in transactional theory research. Using a
measure of organisational culture may provide a different dimension to the
understanding of stress as it is experienced by IAPT therapists.
Future research may examine the self-compassion and stress constructs
broached in this study through measures other than self-report questionnaires and
though different research designs. More specifically, it might be helpful to capture
stress and self-compassion though biological measures. The heart rate variability as a
proxy for cardiac vagal tone or parasympathetic nervous system activation has
attracted increased interest (Laborde, Mosley, & Thayer, 2017) and may be relevant

156
in the study of self-compassion. Neff (2016a) has already noted that Gilbert’s Social
Mentality Theory posits that compassionate responses are linked to parasympathetic
activation and uncompassionate responses are linked to the sympathetic activation.
Physiological measures of stress used in the existing literature include heart period,
muscle tension, skin conductance, pulse transit time and cortisol excretion (Alvarsson,
Wiens, & Nilsson, 2010; Ulrich et al., 1991; van Holland, Frings-Dresen, & Sluiter,
2012).
Moreover, considering how one can unconsciously repress difficult emotions
and be unaware of their levels of self-compassion, Neff (2003a) has already
highlighted the benefits of developing and employing clinical assessment tools to
measure self-compassion. The same can be said to apply for the measurement of
stress levels. As such it may be helpful if future research looks into the development
of clinical assessment tools for stress and self-compassion.
Understanding whether self-compassion is linked to particular behavioural
indicators and developing measures to capture these may also be an area of future
research. Research may also benefit from developing and using measures that capture
behavioural indicators of stress (NHS Choices, 2017) as this may provide new
insights into the stress phenomenon.
In terms of using a different research design, studies exploring the effects of
interventions targeting either the workplace stressors or the cultivation of self-
compassion may help generate robust evidence regarding the link between self-
compassion, work-related potential stressors and perceived stress in IAPT therapists.
In a pilot study, Neff and Germer (2013) found that, amongst other positive
outcomes, participants of a Mindfulness Self-Compassion intervention reported a
reduction of perceived stress and an increase in self-compassion following the course.

157
Moreover, in a randomised controlled study, participants in the Mindfulness Self-
Compassion condition showed, amongst other positive outcomes, greater
improvements in their self-compassion (large effect size) and perceived stress (small
effect size) scores compared to the wait list controls (Neff & Germer, 2013).
Increases in self-compassion predicted reductions in perceived stress following the
course and gains linked to the intervention were maintained at six-months and one-
year follow up (Neff & Germer, 2013).
As already discussed, it might also be worth exploring the effects of
interventions targeting stress through attending to the work place stressors. Given the
impact of systemic, structural and contextual factors on compassion as it is
demonstrated through compassionate care (McPherson et al., 2016; Tierney et al.,
2017), it may be helpful for future research to consider targeting the improvement of
work-related stressors in particular IAPT services and examining the levels of stress
and self-compassion pre- and post the improvements. Improving work-related
stressors can be done through using the HSE Management Standards Approach to
assess workplace stressors and developing plans to tackle them at a practical level, a
policy level or an organisational culture level (TUC & HSE, 2017).
Experimental designs may be useful in exploring the relationship between
self-compassion, stressors and perceived stress; conducting controlled experimental
studies involving the manipulation of the variable of self-compassion through for
example self-compassion priming or involving the manipulation of the contextual
stressors may lead to new knowledge regarding the role of self-compassion on the
stress phenomenon. The employment of experimental designs in the study of self-
compassion has been recommended by Neff (2003a) and is starting to materialise
(Rowe et al., 2016).

158
Research exploring the role of self-compassion in the stress and coping
phenomenon, is also relevant considering the aforementioned theoretical implication
of the present study. This area of research has been attracting interest (e.g. Neff,
Hseih, & Dejitthirat, 2005; Sirois et al., 2015). It will be helpful if future research
explored self-compassion in relation to coping processes and coping skills in light of
compassion and self-compassion theories, and the transactional approach to stress.
Following on from the reviews by Goetz et al. (2010), and Allen and Leary (2010),
understanding the appraisal processes involved in engendering a self-compassionate
response and further exploring how self-compassion links in with different coping
strategies in different contexts are important areas for future research.
5.4 Research summary
The present study was a quantitative cross-sectional online project examining
the levels of perceived stress in IAPT therapists and exploring whether self-
compassion moderated the relationship between work-related stressors and perceived
stress in IAPT therapists.
Participants reported experiencing levels of perceived stress that were higher
than the US norm and at the higher end of scores among healthcare professionals.
Self-compassion did not moderate the relationship between work-related stressors and
perceived stress. Nonetheless, work related stressors and self-compassion were found
to be independent predictors of perceived stress in IAPT therapists. Moreover, self-
compassion was more strongly related to perceived stress than work-related stressors.
The findings suggest that IAPT therapists are experiencing elevated levels of
stress and that interventions focusing on improving self-compassion and tackling
work-related stressors may have an impact on their stress levels.

159
6. References
Allen, A. B., & Leary, M. R. (2010). Self-compassion, stress and coping. Social and
Personality Psychology Compass, 4(2), 107-118. doi: 10.1111/j.1751-
9004.2009.00246.x
Alvarsson, J. J., Wiens, S., & Nilsson, M. E. (2010). Stress Recovery during
Exposure to Nature Sound and Environmental Noise. International Journal of
Environmental Research and Public Health, 7(3), 1036-1046.
doi:10.3390/ijerph7031036
Alvesson, M., & Skőldberg, K. (2009). Reflexive methodology: New vistas for
qualitative research. London: Sage.
Archer, M., Bhaskar, R., Collier, A., Lawson, T., & Norrie, A. (1998). Critical
realism: Essential readings. London: Routledge.
Archer, M., Decoteau, C., Gorski, P., Little, D., Porpora, D., Rutzou, T., Smith, C., …
Vandenberghe, F. (2016, December). What is Critical Realism? Perspectives.
Retrieved from http://www.asatheory.org/current-newsletter-online/what-is-
critical-realism
Baguley, C., Farrand, P., Hope, R., Leibowitz, J., Lovell, K., Lucock, M.,
…Williams, C. (2010). Good practice guide on the use of self-help materials
within IAPT services. Retrieved from https://serene.me.uk/helpers/iapt-self-
help-good-practice-guide.pdf
Balakrishnamurthy C., & Shankar, S. (2009). Impact of age and level of experience
on occupational stress experienced by non-gazetted officers of the central
reserve police force. Industrial Psychiatry Journal, 18(2), 81–83. doi:
10.4103/0972-6748.62264

160
Barnard, L. K., & Curry, J. F. (2011). Self-Compassion: Conceptualizations,
correlates, & interventions. Review of General Psychology.
doi:10.1037/a0025754
Baron, R. M., & Kenny, D. A. (1896). The moderator-mediator variable distinction in
social psychological research: Conceptual, strategic, and statistical
considerations. Journal of Personality and Social Psychology, 51(6), 1173-
1182.
Benn, R., Akiva, T., Arel, S., & Roeser, R. W. (2012). Mindfulness training effects
for parents and educators of children with special needs. Developmental
Psychology, 48(5), 1476-1487. doi:10.1037/a0027537
Bernstein, R. J. (1983). Beyond objectivism and relativism: Science, hermeneutics,
and praxis. Philadelphia: University of Pennsylvania Press.
Bevan, A., Houdmont, J., & Menear, N. (2010). The management standards
indication tool and the estimation of risk. Occupational Medicine, 60(7), 525-
531. doi:10.1093/occmed/kqq109
Binnie, J. (2015). Do you want therapy with that? A critical account of working
within IAPT. Mental Health Review Journal, 20(2), 79-83.
Blaikie, N. (2007). Approaches to social enquiry: Advancing knowledge. Cambridge:
Polity Press.
Blaug, R., Kenyon, A., & Lekhi, R. (2007). Stress at work: A report prepared for the
work foundation’s principal partners. London: The Work Foundation.
Retrieved from
http://citeseerx.ist.psu.edu/viewdoc/download?doi=10.1.1.610.5243&rep=rep
1&type=pdf

161
Bosma, H., Marmot, M. G., Hemingway, H., Nicholson, A. G., Brunner, E., &
Stansfeld, A. (1997). Low job control and risk of coronary heart disease in
Whitehall II (prospective cohort) study. British Medical Journal, 314, 558-65.
doi: 10.1136/bmj.314.7080.558
Bower, P., & Gilbody, S. (2005). Stepped care in psychological therapies: Access,
effectiveness and efficiency. Narrative literature review. British Journal of
Psychiatry, 186, 11-17. doi:10.1192/bjp.186.1.11
Brief, A. P., & George, J. M. (1995). Psychological stress and the workplace: A brief
comment on Lazarus' outlook. In R. Crandall & P. L. Perrewé (Eds.), Series in
health psychology and behavioral medicine. Occupational stress: A handbook
(pp. 15-19). Philadelphia, PA: Taylor & Francis.
Brion, J. M., Leary, M. R., & Drabkin, A. S. (2014). Self-compassion and reactions to
serious illness: The case of HIV. Journal of Health Psychology, 19(2), 218-
229. doi:10.1177/1359105312467391
British Psychological Society (2007). Report of the working party on conducting
research on the internet: Guidelines for ethical practice in psychological
research online. Leicester: The British Psychological Society.
British Psychological Society (2010). Code of human research ethics. Retrieved from
http://www.bps.org.uk/sites/default/files/documents/code_of_human_research
_ethics.pdf
British Psychological Society (2013). Ethics guidelines for internet-mediated
research. Leicester: The British Psychological Society.
British Psychological Society & New Savoy Partnership (2016). Psychological
therapies staff in the NHS report alarming levels of depression and stress:
their own. Retrieved form

162
http://www.bps.org.uk/system/files/Public%20files/Comms-
media/press_release_and_charter.pdf
Burman, E. (1997). Minding the gap: Positivism, psychology and the politics of
social research. Journal of Social Issues, 53(4), 785-801.
Cabinet Office (2013). Wellbeing policy and analysis. Retrieved from:
https://www.gov.uk/government/uploads/system/uploads/attachment_data/file
/224910/Wellbeing_Policy_and_Analysis_FINAL.PDF
Carter, C. S. (1998). Neuroendocrine perspectives on social attachment and love.
Psychoneuroendocrinology, 23(8), 779-818. Retrieved from
https://www.ncbi.nlm.nih.gov/pubmed/9924738
Cartwright, S., & Cooper, C. (1997). Managing workplace stress. Thousand Oaks,
CA: Sage.
Centre for Mindful Self-Compassion (2017). What is MSC? Retrieved from
https://centerformsc.org/train-msc/
Centre for Workforce Intelligence (2013). Improving workforce planning for the
psychological therapies workforce. Retrieved from
https://assets.publishing.service.gov.uk/government/uploads/system/uploads/a
ttachment_data/file/507554/CfWI_Physcological_Therapies_Workforce_in-
depth_review.pdf
Clark, C. Pike, C., McManus, S., Harris, J., Bebbington, P., Brugha, T., Jenkings, R.,
… Stansfeld, S. (2012). The contribution of work and non-work stressors to
common mental disorders in the 2007 Adult Psychiatric Morbidity Survey.
Psychological Medicine, 42, 829-842. doi:10.1017/S0033291711001759

163
Clark, D. M. (2011). Implementing NICE guidelines for the psychological treatment
of depression and anxiety disorders: The IAPT experience. International
Review of Psychiatry, 23, 375- 384. doi: 10.3109/09540261.2011.606803
Clark, D. M., Layard, R., Smithies, R., Richards, D. A., Suckling, R., Wright, B.
(2009). Improving access to psychological therapy: Initial evaluation of two
UK demonstration sites. Behavioural Research Therapy, 47(11), 910-920. doi:
10.1016/j.brat.2009.07.010
Cleare, S., Gumley, A., Cleare, C. J., & O’Connor, R. C. (2018). An investigation of
the factor structure of the Self-Compassion Scale. Mindfulness, 9(2), 618-628.
doi: 10.1007/s12671-017-0803-1
Cohen, J. (1992). A power primer. Psychological Bulletin, 112(1), 155-159.
Cohen, J. A., & Rambur, B. A. (2012). Stress and the workplace. In V.H. Rice (Ed.).
Handbook of stress, coping and health: Implications for nursing research,
theory and practice. London: Sage.
Cohen, L., Manion, L., & Morrison, K. (2007). Research methods in education.
London: Routledge.
Cohen, S., & Janicki-Deverts, D. (2012). Who’s stressed? Distributions of
psychological stress in the United States in probability samples from 1983,
2006 and 2009. Journal of Applied Social Psychology, 42(6), 1320-1334. doi:
10.1111/j.1559-1816.2012.00900.x
Cohen, S., Tyrrell, D. A. J., & Smith, A. P. (1993). Negative life events, perceived
stress, negative affect, and susceptibility to the common cold. Journal of
Personality and Social Psychology, 64, 131-140.
Cohen, S., & Williamson, G. (1988). Perceived stress in a probability sample of the
United States. In S. Spacapan & S. Oskamp (Eds.), The social psychology of

164
health: Claremont Symposium on applied social psychology. Newbury Park,
CA: Sage.
Collier, A. (1994). Critical realism: an introduction to Roy Bhaskar’s philosophy.
London: Verso.
Comte, A. (1908). A general view of positivism (J.H. Bridges, Trans.) London:
Routledge. (Original work published 1848)
Cooper, C. L. (2000). Theories of organisational stress. Oxford: Oxford University
Press.
Cooper, C. L., & Dewe, P. (2008). Well-being- absenteeism, presenteeism, cost and
challenges. Occupational Medicine, 58, 522-524. doi:10.1093/occmed/kqn124
Cooper, C. L., Dewe, P. J., & O’Driscoll, M. P. (2001). Organisational stress: A
review and critique of theory, research, and applications. London: Sage.
Cooper, C. L., Rout, U., & Faragher, B. (2013). Mental health, job satisfaction, and
job stress among general practitioners. In C. L. Coopers (Ed.) From stress to
wellbeing: Volume 1. Basingstoke: Palgrave Macmillan.
Cousins, R., Mackay, C. J., Clarke, S. D., Kelly, C., Kelly, P. J., & McCaig, R. H.
(2004). ‘Management Standards’ and work-related stress in the UK: Practical
development. Work and Stress, 18, 113-136. doi:
10.1080/02678370410001734322
Cox, T. (1993). Stress research and stress management: Putting theory to work.
Sudbury: HSE Books.
Crary, P. (2013). Beliefs, behaviors, and health of undergraduate nursing students.
Holistic Nursing Practice, 27(2), 74-88. doi:10.1097/HNP.0b013e318280f75e
Crotty, M. (1998). The foundations of social research. London: Sage.

165
Cushway, D. (1992). Stress in clinical psychology trainees. The British Journal of
Clinical Psychology, 31(2), 169-179.
Cushway, D., & Tyler, P. (1994). Stress and coping in clinical psychologists. Stress
Medicine, 10, 35-42.
Cushway, D., & Tyler, P. (1996). Stress in clinical psychologists. International
Journal of Social Psychiatry, 42(4), 142-149.
Cushway, D., Tyler, P. A., & Nolan, P. (1996). Development of a stress scale for
mental health professionals. British Journal of Clinical Psychology, 35(2),
279-295.
Danna, K., & Griffin, R. W. (1999). Health and well-being in the workplace: A
review and synthesis of the literature. Journal of Management, 25(3), 357-
384. doi:10.1177/014920639902500305
Darongkamas, J., Burton, M.V., & Cushway, D. (1994). The use of personal therapy
by clinical psychologists working in the NHS in the United Kingdom. Clinical
Psychology and Psychotherapy, 1(3), 165-173.
Data Protection Act (1998). Part II Rights of data subjects and others. Retrieved
from:
http://www.legislation.gov.uk/ukpga/1998/29/pdfs/ukpga_19980029_en.pdf
de Jonge, J. & Kompier, M. A. J. (1997). A critical examination of the demand-
control-support model from a work psychological perspective. International
Journal of Stress Management, 4(4), 235-258.
Delgado- Rodriguez, M. & Llorca, J. (2004). Bias. Journal of Epidemiology and
Community Health, 58, 635-461.
Department of Health [DOH] (2001). The Journey to Recovery– The Government’s
vision for mental health care. Retrieved from:

166
http://webarchive.nationalarchives.gov.uk/20120503230346/http://www.dh.go
v.uk/prod_consum_dh/groups/dh_digitalassets/@dh/@en/documents/digitalas
set/dh_4058900.pdf
Department of Health [DOH] (2008a). Improving Access to Psychological Therapies
(IAPT) Commissioning Toolkit. Retrieved from
http://webarchive.nationalarchives.gov.uk/20130124042556/http://www.dh.go
v.uk/prod_consum_dh/groups/dh_digitalassets/@dh/@en/documents/digitalas
set/dh_084066.pdf
Department of Health [DOH] (2008b). IAPT implementation plan: Curriculum for
high-intensity therapies workers. Retrieved from
https://www.uea.ac.uk/documents/246046/11919343/implementation-plan-
curriculum-for-high8208intensity-therapies-workers.pdf/88d52978-44ca-
47ad-a317-d9b8e1042ef4
Department of Health [DOH] (2008c). Improving Access to Psychological Therapies
Implementation Plan: Curriculum for low‑intensity therapies workers.
Retrieved from
http://webarchive.nationalarchives.gov.uk/20130124042314/http://www.dh.go
v.uk/prod_consum_dh/groups/dh_digitalassets/@dh/@en/documents/digitalas
set/dh_084494.pdf
Department of Health [DOH] (2008d). IAPT implementation plan: National
guidelines for regional delivery. Retrieved from
http://webarchive.nationalarchives.gov.uk/20130124042312/http://www.dh.go
v.uk/prod_consum_dh/groups/dh_digitalassets/@dh/@en/documents/digitalas
set/dh_083168.pdf

167
Department of Health [DOH] (2011). Talking therapies: A four year plan of action.
Retrieved from
https://www.gov.uk/government/uploads/system/uploads/attachment_data/file
/213765/dh_123985.pdf
Department of Health [DOH] (2012). IAPT three-year report: The first million
patients. Retrieved from
https://www.uea.ac.uk/documents/246046/11919343/IAPT+3+year+report.+T
he+first+million+patiets.pdf/0e0469ff-0884-4203-99de-4b61601e69dd
Department of Health [DOH] (2015). The NHS Constitution. Retrieved from
https://www.gov.uk/government/publications/the-nhs-constitution-for-
england/the-nhs-constitution-for-england
De Vellis, R. F. (2003). Scale Development. London: Sage.
Devonport, T. J. (2011). A brief review of commonly used theories and the
importance of applying theory in practice. In T. J. Devonport (Ed.), Managing
stress: From theory to application (pp. 1-12). New York: Nova.
Edwards, J. A., Webster, S., Van Laar, D., & Easton, S. (2008). Psychometric
analysis of the UK Health and Safety Executive’s Management Standards
work-related stress Indicator Tool. In British Academy of Management
Annual Conference, 10-12 Sep, Harrogate, UK.
Edwards, J. R., & Cooper, C. L. (1990). The person-environment fit approach to
stress: Reccuring problems and some suggested solutions. Journal of
Organisational Behaviour, 11, 293-307.
Erogul, M., Singer, G., McIntyre, T., & Stefanov, D. G. (2014). Abridged
mindfulness intervention to support wellness in first-year medical students.

168
Teaching and Learning in Medicine, 26(4), 350-356.
doi:10.1080/10401334.2014.945025
Field, A. (2005). Discovering Statistics using SPSS. London: Sage.
Field, A. (2013). Discovering statistics using IBM SPSS statistics. London: Sage.
Firth-Cozens, J., & Cornwell, J. (2009). The Point of Care: Enabling compassionate
care in acute hospital settings. London: The Kings Fund.
Fong, M., & Loi, N. M. (2016). The mediating role of self‐compassion in student
psychological health. Australian Psychologist, 51(6), 431-441.
doi:10.1111/ap.12185
Frajo-Apor, B., Pardeller, S., Kemmler, K., & Hofer, A. (2016.) Emotional
Intelligence and resilience in mental health professionals caring for patients
with serious mental illness. Psychology, Health & Medicine, 21(6), 755-761,
doi: 10.1080/13548506.2015.11203
Gergen, K. J. (1985). The social constructionist movement in modern psychology.
American Psychologist, 40(3), 266-275.
Germer, C. K., & Neff, K. D. (2013). Self-compassion in clinical practice. Journal of
Clinical Psychology, 69(8), 856-867. doi:10.1002/jclp.22021
Gilbert, P. (2006). Compassion: conceptualisations, research and use in
psychotherapy. Hove: Routledge.
Gilbert, P. (2009). Introducing compassion-focused therapy. Advances in Psychiatric
Treatment, 15, 199–208. doi: 10.1192/apt.bp.107.005264
Gilbert, P. (2010a). The Compassionate Mind. London: Constable & Robinson Ltd.
Gilbert, P. (2010b). Compassion Focused Therapy: Distinctive Features. London:
Routledge.

169
Gilbert, P. (2014). The origins and nature of compassion focused therapy. British
Journal of Clinical Psychology, 53, 6-41. doi: 10.1111/bjc.12043.
Gilbert, P. (2018). Living like Crazy. York: Annwyn House.
Goetz, J. L., Keltner, D., Simon-Thomas, E. (2010). Compassion: An evolutionary
analysis and empirical review. Psychological Bulletin, 136(3), 351-374.
doi:10.1037/a0018807.
Greeson, J. M., Juberg, M. K., Maytan, M., James, K., & Rogers, H. (2014). A
randomized controlled trial of Koru: A mindfulness program for college
students and other emerging adults. Journal of American College Health,
62(4), 222-233. doi:10.1080/07448481.2014.887571
Gustin, W. L., & Wagner, L. (2013). The butterfly effect of caring: clinical nursing
teachers' understanding of self-compassion as a source to compassionate care.
Scandinavian Journal of Nursing Science, 27(1), 175-183. doi:
10.1111/j.1471-6712.2012.01033.x
Gyllensten, K., & Palmer, S. (2005). The relationship between coaching and
workplace stress: a correlational study. International Journal of Health
Promotion and Education, 43(3), 97-103.
Hacker, T. (2008). The relational compassion scale: Development and validation of a
new self-rated scale for the assessment of self-other compassion (Doctoral
dissertation). Retrieved from
http://theses.gla.ac.uk/462/1/2008hackerDclinpsy.pdf
Hall, C. W., Row, K. A., Wuensch, K. L., & Godley, K. R. (2013). The role of self-
compassion in physical and psychological well-being. The Journal of
Psychology: Interdisciplinary and Applied, 147(4), 311-323.
doi:10.1080/00223980.2012.693138

170
Harris, J. R. (1995). An examination of the transaction approach in occupational
stress research. In R. Crandall & P. L. Perrewé (Eds.), Series in health
psychology and behavioral medicine. Occupational stress: A handbook (pp.
20-28). Philadelphia, PA: Taylor & Francis.
Harrison, D. A., McLaughlin, M. E. & Coalter, T. M. (1996). Context, cognition and
common method variance: Psychometric and verbal protocol
evidence. Organizational Behavior and Human Decision Processes, 68, 246-
261.
Hayes, A. F. (2013). Introduction to mediation, moderation, and conditional process
analysis: A regression-based approach. New York, NY: The Guilford Press.
Hayes, A. F. (n.d.). SPSS, SAS, and Mplus Macros and Code. Retrieved from
http://afhayes.com/spss-sas-and-mplus-macros-and-code.html
Hayes, A. F. (2016). Download. Retrieved from
http://www.processmacro.org/download.html
Health and Safety Executive [HSE] (2016). Work related stress, anxiety and
depression statistics in Great Britain 2016. Retrieved from:
http://www.hse.gov.uk/statistics/causdis/stress/stress.pdf
Health Education England (2017). Stepping forward to 2020/21: The mental health
workforce plan for England. Retrieved from
https://www.rcpsych.ac.uk/pdf/FYFV%20Mental%20health%20workforce%2
0plan%20for%20England%20FINAL.pdf
Hitchcock, G., & Hughes, D. (1995). Research and the Teacher. London: Routledge.
Holmes, T. H., & Rahe, R. H. (1967). The Social Readjustment Rating Scale. Journal
of Psychosomatic Research, 11(2), 213-218.

171
IBM Corp. (2015). IBM SPSS Statistics for Windows, Version 23.0. Armonk, NY:
IBM Corp.
Johnson, T. P., O’Rourke, D., Chavez, N., Sudman, S., Warnecke, R.B., Lacey, L., &
Horm, J. (1996). Cultural variations in the interpretation of health survey
questions. In R. B. Warnecke, (Ed.) Health Survey Research Methods
Conference Proceedings (pp. 57–62). Hyattsville, MD: National Centre for
Health Statistics.
Johnson, J. V., & Hall, E. M. (1988). Job strain, work place social support, and
cardiovascular disease: a cross-sectional study of a random sample of the
Swedish working population. American Journal of Public Health, 78, 1336-
1342.
Johnson, J. V., Hall, E. M., & Theorell, T. (1989). Combined effects of job strain and
social isolation on cardiovascular disease morbidity and mortality in a random
sample of the Swedish male working population. Scandinavian Journal of
Work, Environment and Health, 15, 271-279.
Jovanovic, G. (2010). Historizing epistemology in psychology. Integrative
Psychological and Behavioural Sciences, 44(4), 310-328. doi:
10.1007/s12124-010-9132-9
Kabat-Zinn, J. (2013). Full catastrophe living: How to cope with stress, pain, and
illness using mindfulness meditation. London: Piatkus.
Kanner, A. D., Coyne, J. C., Schaefer, C., & Lazarus, R. S. (1981). Comparison of
two modes of stress measurement: Daily hassles and uplifts versus major life
events. Journal of Behavioural Medicine, 4(1), 1-39.
Karasek, R. A., Triantis, K. P., & Chaudhry, S. S. (1982). Coworker and supervisor
support as moderators of associations between task characteristics and mental

172
strain. Journal of Organizational Behavior, 3, 181–200.
doi:10.1002/job.4030030205
Kemper, K. J., Mo, X., & Khayat, R. (2015). Are mindfulness and self-compassion
associated with sleep and resilience in health professionals? The Journal of
Alternative And Complementary Medicine, 21(8), 496-503.
doi:10.1089/acm.2014.0281
Kerr, R., McHugh, M., & McCrory, M. (2009). HSE Management Standards and
stress-related work outcomes. Occupational Medicine, 59, 574-579.
doi:10.1093/occmed/kqp146
Kostaki, E. (2017). Stress in IAPT therapists: A research project. CBT Today, 45(3),
9. Retrieved from http://www.babcp.com/files/CBT-Today/cbt-today-
september-2017.pdf
Krieger, T., Hermann, H., Zimmermann, J., & Holtforth, M. G. (2015). Associations
of self-compassion and global self-esteem with positive and negative affect
and stress reactivity in daily life: Findings from a smart phone study.
Personality and Individual Differences, 87, 288-292.
doi:10.1016/j.paid.2015.08.009
Kristensen, T. S., Hannerz, H., Høgh, A., & Borg, V. (2005). The Copenhagen
Psychosocial Questionnaire (COPSOQ). A tool for the assessment
and improvement of the psychosocial work environment. Scandinavian
Journal of Work Environment and Health, 31, 438-449.
Kumary, A., & Baker, M. (2008). Stresses reported by UK trainee counselling
psychologists. Counselling Psychology Quartely, 21(1), 19-28. doi:
10.1080/09515070801895626

173
Laborde, S., Mosley, E., & Thayer, J. F. (2017). Heart Rate Variability and Cardiac
Vagal Tone in Psychophysiological Research – Recommendations for
Experiment Planning, Data Analysis, and Data Reporting. Frontiers in
Psychology, 8, 213. doi: 10.3389/fpsyg.2017.00213.
Landsbergis, P. A. (1988). Occupational stress among health care workers: A test of
the job demands control model. Journal of Organisational Behaviour, 9(3),
217- 239.
Lazarus, R. S. (2006). Stress and emotion: A new synthesis. New York: Springer.
Lazarus, R. S. (2012). Evolution of a model of stress, coping and discrete emotions.
In V.H. Rice (Ed.). Handbook of stress, coping and health: Implications for
nursing research, theory and practice. London: Sage.
Leckie, M. S., & Thompson, E. (1979). Symptoms of stress inventory. Seattle, WA:
University of Washington.
Lee, D., & James, S. (2012). The compassionate mind approach to recovering from
trauma. London: Constable & Robinson Ltd.
Lehner, P., Seyed-Solorforough, S. M., O’Connor, M. F., Sak, S., & Mullin, T.
(1997). Cognitive biases and time stress in team decision making. IEEE
Transactions on Systems, Man and Cybernetics Part A: Systems and Humans,
27, 698–703.
Levin, K. A. (2006). Study design III: Cross-sectional studies. Evidence-Based
Dentistry, 7, 24-25. doi: 10.1038/sj.ebd.6400375
Litwinenko, A. & Cooper, C. (1995). The impact of trust status on health care
workers. Journal of Managerial Psychology, 10(3), 12-16.

174
London School of Economics [LSE] (2006). The depression report: A new deal for
depression and anxiety disorders. Retrieved from
http://cep.lse.ac.uk/pubs/download/special/depressionreport.pdf
López, A., Sanderman, R., Smink, A., Zhang, Y., van Sonderen, E., Ranchor, A., &
Schroevers, M. J. (2015). A Reconsideration of the Self-Compassion Scale’s
Total Score: Self-Compassion versus Self-Criticism. PLoS ONE 10(7), doi:
10.1371/journal.pone.013294
Lovibond, S. H., & Lovibond, P. F. (1995). Manual for the Depression Anxiety Stress
Scales. Sydney: Psychology Foundation of Australia.
Lunau, T., Siegrist, J., Dragano, N., & Wahrendorf, M. (2015). The association
between education and work stress: Does the policy context matter? PLoS
One, 10(3), doi: 10.1371/journal.pone.0121573.
Lyon, B. L. (2012). Stress, coping and health: A conceptual overview. In V.H. Rice
(Ed.). Handbook of stress, coping and health: implications for nursing
research, theory and practice. London: Sage.
MacBeth, A. M. (2011). The Narrative Compassion Scale: development and
validation of an interview measure of compassion and recovery in complex
mental health difficulties (Doctoral dissertation). Retrieved from
http://theses.gla.ac.uk/2875/1/2011MacBethdclinpsy.pdf
MacBeth, A., & Gumley, A. (2012). Exploring compassion: A meta-analysis of the
association between self-compassion and psychopathology. Clinical
Psychology Review, 32(6), 545–552. doi:10.1016/j.cpr.2012.06.003
MacKay, C. J., Cousins, R., Kelly, P. J., Lee, S., & McCaig, R. H. (2004).
Management Standards and work-related stress in the UK: Policy background
175
and science. Work and Stress, 18(2), 91-112. doi:
10.1080/02678370410001727474
MacKinnon, D. P., Krull, J. L., & Lockwood, C. M. (2000). Equivalence of the
mediation, confounding and suppression effect. Prevention Science: The
Official Journal of The Society for Prevention Research, 1(4), 173-181.
Manikandan, S. (2011). Measures of central tendency: Median and mode. Journal of
Pharmacology and Pharmacotherapeutics, 2(3), 214–215.
http://doi.org/10.4103/0976-500X.83300
Mareek, J. (2007). Dancing through minefields: Towards a qualitative stance in
Psychology. In P. M. Camic, J. E. Rhodes, & L. Yardley (Eds.), Qualitative
Research in Psychology: Expanding perspectives in methodology and design
(pp. 49-69). Washington, DC: American Psychological Association.
Martin, J. (2015). Positivism, quantification and the phenomena of psychology.
Theory and Psychology, 13(1), 33-38.
Marzillier, J., & Hall, J. (2009). The challenge of the Layard report. The Psychologist,
22, 396-399.
Maslach, C., Schaufeli, W. B., & Leiter, M. P. (2001). Job burnout. Annual Review of
Psychology, 52, 397-422.
McAuley, L. (2010). Occupational stress and hardiness personality traits in trainee
IAPT therapists: Providing care in the modern NHS (Doctoral Dissertation).
Retrieved from
http://eprints.lincoln.ac.uk/17553/1/17553%20Laura%20McAuley%20-
%20Thesis.pdf

176
McCluskey, A. & Lalkhen, A. G. (2007). Statistics II: Central tendency and spread of
data. Continuing Education in Anaesthesia Critical Care and Pain, 7(4), 127-
130
McEwen, B. S. (1998). Protective and damaging effects of stress mediators. New
England Journal of Medicine, 338, 171–179.
McGrath, J. E., & Johnson, B. A. (2007). Methodology makes meaning: How both
qualitative and quantitative paradigms shape evidence and its interpretation. In
P. M. Camic, J. E. Rhodes & L. Yardley (Eds.), Qualitative Research in
Psychology: Expanding perspectives in methodology and design (pp. 31-48).
Washington, DC: American Psychological Association.
McPherson, S. (2017, June 14). Old wine in new bottles? On the new NICE guidelines
for depression [Web log post]. Retrieved from: http://www.cost-
ofliving.net/old-wine-in-new-bottles-on-the-new-nice-guidelines-for-
depression/
McPherson, S., Evans, C., & Richardson, P. (2009). The NICE Depression
Guidelines and the recovery model: Is there an evidence base for IAPT?
Journal of Mental Health, 18(5), 405-414.
McPherson, S. & Hiskey, S. (2016, February 11). Is the NHS really suffering a crisis
of compassion? [Web log post]. Retrieved from http://www.cost-
ofliving.net/is-the-nhs-really-suffering-a-crisis-of-compassion/
McPherson, D. S., Hiskey, D. S., Alderson, D. Z. (2015). Distress in working on
dementia wards - a threat to compassionate care: a grounded theory study.
International Journal of Nursing Studies, 53, 95-104. doi:
10.1016/j.ijnurstu.2015.08.013

177
Miller, K. I., Stiff, J. B., & Ellis, B. H. (1988). Communication and empathy as
precursors to burnout among human service workers. Communication
Monographs, 55, 250–265.
Mosewich, A. D. (2013). Self-compassion as a resource to manage stress in women
athletes (Doctoral Dissertation). Retrieved from
https://open.library.ubc.ca/cIRcle/collections/ubctheses/24/items/1.0073655
Moore, K. A., & Cooper, C. L. (1996). Stress in mental health professionals: A
theoretical overview. International Journal of Social Psychiatry, 42(2), 82-89.
doi: 10.1177/002076409604200202
Morse, G., Salyers, M. P., Rollins, A. L., Monroe-DeVita, M., & Pfahler, C. (2012).
Burnout in mental health services: A review of the problem and its
remediation. Administration and Policy in Mental Health and Mental Health
Services Research, 39 (5), 341-352. doi: 10.1007/s10488-011-0352-1
Muris, P., Otgaar, H., & Petrocchi, N. (2016). Protection as the mirror image of
psychopathology: Further critical notes on the self-compassion scale.
Mindfulness, 7(3), 787- 790. doi: 10.1007/s12671-016-0509-9
Muris, P., & Petrocchi, N. (2017). Protection or vulnerability? A meta-analysis of the
relations between the positive and negative components of self-compassion
and psychopathology. Clinical Psychology and Psychotherapy, 24(2), 373–
383. doi: 10.1002/cpp.2005.
National Collaborating Centre for Mental Health (2018). The Improving Access to
Psychological Therapies Manual. Retrieved from
https://www.england.nhs.uk/wp-content/uploads/2018/06/the-iapt-manual.pdf
National Institute for Clinical Excellence (2009). Depression in adults: recognition
and management. Retrieved from http://www.nice.org.uk/guidance/cg90

178
National Institute for Clinical Excellence (2011). Generalised anxiety disorder and
panic disorder in adults: management. Retrieved from
http://www.nice.org.uk/guidance/cg113
Neff, K. D. (2003a). Development and validation of a scale to measure self-
compassion. Self and Identity, 2, 223-250. doi:10.1080/15298860390209035
Neff, K. D. (2003b). Self-compassion: An alternative conceptualisation of a healthy
attitude toward oneself. Self and Identity, 2, 85-101. doi:
0.1080/15298860390129863
Neff, K. D. (2016a). Does self-compassion entail reduced self-judgment, isolation,
and over-identification? A Response to Muris, Otgaar, and Petrocchi (2016).
Mindfulness, 7(3), 791-797. doi: 0.1007/s12671-016-0531-y
Neff, K. D. (2016b). The Self-Compassion Scale is a valid and theoretically coherent
measure of self-compassion. Mindfulness, 7, 264–274. doi: 0.1007/s12671-
015-0479-3
Neff, K. D., & Costigan, A. P. (2014). Self-compassion, wellbeing, and happiness.
Psychologie in Österreich, 114-117.
Neff, K. D., & Dahm, K. A. (2014). Self-compassion: What it is, what it does, and
how it relates to mindfulness. In M. Robinson, B. Meier, & B. Ostafin (Eds.),
Mindfulness and Self-Regulation (pp.121-140). New York: Springer.
Neff, K. D., & Germer, C. K. (2013). A pilot study and randomized controlled trial of
the mindful self‐compassion program. Journal of Clinical Psychology, 69(1),
28–44. doi: 10.1002/jclp.21923
Neff, K. D., Hseih, Y., & Dejitthirat, K. (2005). Self-compassion, achievement goals,
and coping with academic failure. Self and Identity, 4, 263-287. doi:
0.1080/13576500444000317

179
Neff, K. D., Kirkpartick, K. L., & Rude, S. S. (2007). Self-compassion and adaptive
psychological functioning. Journal of Research in Personality, 41(1), 139-
154. doi:10.1016/j.jrp.2006.03.004
Neff, K. D., Whittaker, T., & Karl, A. (2017). Evaluating the factor structure of the
Self-Compassion Scale in four distinct populations: Is the use of a total self-
compassion score justified? Journal of Personality Assessment, 99(6), 596-
607.
NHS Digital (2017). Psychological therapies: Annual report on the use of IAPT
services. England 2015-16. Retrieved from
http://www.content.digital.nhs.uk/catalogue/PUB22110/psyc-ther-ann-rep-
2015-16_v2.pdf
NHS Choices (2015). The history of the NHS. Retrieved from
https://www.nhs.uk/NHSEngland/thenhs/nhshistory/Pages/NHShistory1948.a
spx
NHS Choices (2017). How to deal with stress. Retrieved from
https://www.nhs.uk/conditions/stress-anxiety-depression/understanding-stress/
NHS England & Heath Education England (2016). 2015 Adult IAPT Workforce
Census Report. Retrieved from https://www.england.nhs.uk/mentalhealth/wp-
content/uploads/sites/29/2016/09/adult-iapt-workforce-census-report-15.pdf
Nixon, A. E., Mazzola, J. J., Bauer, J., Krueger, J. R., & Spector, P. E. (2011). Can
work make you sick? A meta-analysis of the relationships between job
stressors and physical symptoms. Work and Stress, 25(1), 1-22.
doi:10.1080/02678373.2011.569175
North, F.M., Syme, L.S., Feeney, A., Shipley, M., & Marmot, M. (1996)
Psychosocial work environment and sickness absence among British civil

180
servants: The Whitehall II Study. American Journal of Public Health, 86,
332-340.
Odgen, J., & Mtandabari, T. (1997). Examination of stress and changes in mood and
health related behaviours. Psychology and Health, 12, 289- 299.
Olson, K., & Kemper, K. J. (2014). Factors associated with well-being and
confidence in providing compassionate care. Journal of Evidence-Based
Complementary & Alternative Medicine, 19(4), 292-296.
doi:10.1177/2156587214539977
Padden, D. L., Connors, R. A., & Agazio, J. G. (2011). Stress, coping, and well-being
in military spouses during deployment separation. Western Journal of
Nursing, 33(2), 247-267. doi: 10.1177/0193945910371319.
Patsiopoulos, A. T., & Buchanan, M. J. (2011). The practice of self-compassion in
counselling: A narrative Inquiry. Professional Psychology: Research and
Practice, 42(4), 301-307. doi: 10.1037/a0024482
Peacock, E. J., & Wong, P. T. (1990). The Stress Appraisal Measure (SAM): A
multidimensional approach to cognitive appraisal. Stress Medicine, 6, 227–
236.
Pejtersen, J. H., Kristensen, T. B., Borg, V., & Bjorner, J. B. (2010). The second
version of the Copenhagen Psychosocial Questionnaire. Scandinavian Journal
of Public Health, 38(3), 8-24. doi: 10.1177/1403494809349858.
Pinciotti, C. M., Seligowski, A. V., & Orcutt, H. K. (2017). Psychometric properties
of the PACT Scale and relations with symptoms of PTSD. Psychological
Trauma: Theory, research, practice, and policy, 9(3), 362-369.
doi:10.1037/tra0000206

181
Pines, A., & Maslach, C. (1978). Characteristics of staff burnout in mental health
settings. Hospital and Community Psychiatry, 29, 233-237.
Polit, D. E., & Beck, C. T. (2010) Generalisation in quantitative and qualitative
research: Myths and strategies. International Journal of Nursing Studies, 47,
1451- 1458. doi: 10.1016/j.ijnurstu.2010.06.004
Popay, J., Roberts, H., Sowden, A., Petticrew, M., Arai, L., Rogers, M., … Duffy, S.
(2006). Guidance on the conduct of narrative synthesis in systematic reviews.
Retrieved from
http://citeseerx.ist.psu.edu/viewdoc/download?doi=10.1.1.178.3100&rep=rep
1&type=pdf
Popper, K. (2002). The logic of scientific discovery. London: Routledge.
Public Health England (2017). One you: Stress. Retrieved from
https://www.nhs.uk/oneyou/stress#KYQeCRSS53yegZEE.97
Raes, F. (2010). Rumination and worry as mediators of the relationship between self-
compassion and depression and anxiety. Personality and Individual
Differences, 48, 757-761. doi: 10.1016/j.paid.2010.01.02
Raes, F. (2011). The effect of self-compassion on the development of depression
symptoms in a non-clinical sample. Mindfulness, 2, 3-36. doi:
10.1007/s12671-011-0040-y
Raes, F., Pommier, E., Neff, K. D., & Van Gucht, D. (2011). Construction and
factorial validation of a short form of the Self-Compassion Scale. Clinical
Psychology & Psychotherapy, 18, 250-255. doi: 10.1002/cpp.702
Reid, Y., Johnson, S., Morant, N. Kuipers, E. Thornicroft, G. Bebbington, P., &
Prosser, D. (1999). Explanations for stress and satisfaction in mental health

182
professionals: a qualitative study. Social Psychiatry and Psychiatric
Epidemiology, 34 (6), 301-308.
Rice, V. H. (2012). Theories of stress and its relationship to health. In V.H. Rice
(Ed.). Handbook of stress, coping and health: Implications for nursing
research, theory and practice. London: Sage.
Rimes, K. A., & Wingrove, J. (2011). Pilot study of mindfulness-based cognitive
therapy for trainee clinical psychologists. Behavioural and Cognitive
Psychotherapy, 39, 235-241. doi:10.1017/S1352465810000731
Risq, R. (2011). IAPT, anxiety and envy: A psychoanalytic view of NHS primary
care mental health services today. British Journal of Psychotherapy, 27(1),
37-55.
Robinson, C. J. E. (2015). Factors associated with self-compassion in clinical
psychologists (Doctoral dissertation). Retrieved from
http://repository.essex.ac.uk/15221/
Rounds, J. B., & Tracey, T. J. (1990). From trait-and-factor to person-environment fit
counseling: Theory and process. In W. B. Walsh & S. H. Osipow (Eds.),
Career counseling: Contemporary topics in vocational psychology (pp. 1-44).
Hillsdale, NJ: Lawrence Erlbaum Associates.
Rout, U. R. (2000). Stress amongst district nurses: A preliminary investigation.
Journal of Clinical Nursing, 9, 303-309.
Rowe, A. C., Shepstone, L., Carnelley, K. B., Cavanagh, K., & Millings, A. (2016).
Attachment security and self-compassion priming increase the likelihood that
first-time engagers in mindfulness meditation will continue with mindfulness
training. Mindfulness, 7(3), 642-650. doi:10.1007/s12671-016-0499-7

183
Rundell, M. & Fox, G. (Eds.) (2007). MacMillan English dictionary for advanced
learners: New Edition. Oxford: MacMillan Publishers Limited
Sayer, A. (2000). Realism and Social Science. London: Sage.
Schabracq, M. J., & Cooper, C. L. (2000). The changing nature of work and stress.
Journal of Managerial Psychology, 15(3), 227-241.
Schmitt, N. (1994). Method bias: The importance of theory and measurement.
Journal of Organizational Behavior, 15, 393-398.
Scotland, J. (2012). Exploring the philosophical underpinnings of research: Relating
ontology and epistimology to the methodology and methods of the scientific,
interpretive, and critical research paradigms. English Language Teaching,
5(9), 9-16. doi:10.5539/elt.v5n9p9
Selye, H. (1936). A syndrome produced by diverse nocuous agents. Nature, 138, 32.
Selye, H. (1978). The stress of life. New York, NY: McGraw-Hill.
Shapiro, S. L., Brown, K. W., & Biegel, G. M. (2007). Teaching self-care to
caregivers: effects of mindfulness-based stress reduction on the mental health
of therapists in training. Training and Education in Professional Psychology,
1(2), 105–115. doi: 10.1037/1931-3918.1.2.105
Sirois, F. M. (2014). Procrastination and stress: Exploring the role of self-
compassion. Self and Identity, 13(2), 128-145.
doi:10.1080/15298868.2013.763404
Sirois, F. M., Molnar, D. S., & Hirsch, J. K. (2015). Self-compassion, stress, and
coping in the context of chronic illness. Self and Identity, 14(3), 334-347.
doi:10.1080/15298868.2014.996249
Soper, D. (2016). Statistics Calculator. Retrieved from
http://www.danielsoper.com/statcalc3/calc.aspx?id=1

184
Stafford- Brown, J., & Pakenham, K. I. (2012). The effectiveness of an ACT
informed intervention for managing stress and improving therapist qualities in
clinical psychology trainees. Journal of Clinical Psychology, 68(6), 592-613.
doi: 02/jclp.21844
Stansfeld, S., & Candy, B. (2006). Psychosocial work environment and mental health:
a meta-analytic review. Scandinavian Journal of Work, Environment and
Health, 32(6), 443-462
Stansfeld, S. A., Fuhrer, R., Shipley, M. J., & Marmot, M. G. (1999). Work
characteristic predict psychiatric disorder: prospective results from the
Whitehall II study. Occupational and Environmental Medicine, 56, 302-307.
Strauss, C., Taylor, B. L., Gu, J., Kuyken, W., Baer, R., Jones F., & Cavanagh, K.
(2006). What is compassion and how can we measure it? A review of
definitions and measures. Clinical Psychology Review, 47, 15-27.
Tierney, S., Seers, K., Tutton, E., & Reeve, J. (2017). Enabling the flow of
compassionate care: a grounded theory study. BMC Health Services Research,
17, 174. doi: 10.1186/s12913-017-2120-8
Timmie, S. (2015). Children and young people’s Improving Access to Psychological
Therapies: Inspiring innovation or more of the same? BJPsych Bulletin, 39,
57-60.
The Kings Fund (2017). Sustainability and transformation plans (STPs) explained.
Retrieved from https://www.kingsfund.org.uk/topics/integrated-
care/sustainability-transformation-plans-explained
The Cochrane Collaboration (2011). Cochrane Handbook for Systematic Reviews of
Interventions Version 5.1.0. Retrieved from http://handbook-5-

185
1.cochrane.org/chapter_11/11_2_2_characteristics_of_included_studies_table
s.htm
TUC & HSE (2017). Tackling workplace stress using the HSE Stress Management
Standards. TUC and HSE guidance for health and safety representative.
Retrieved from https://www.tuc.org.uk/sites/default/files/tacking-workplace-
stress-guide.pdf
Ulrich, R. S., Simons, R. F., Losito, B. D., Fiorito, E., Miles, M. A., & Zelson, M.
(1991). Stress recovery during exposure to natural and urban environments.
Journal of Environmental Psychology, 11(3), 201-230. doi:10.1016/S0272-
4944(05)80184-7
University of Essex (2012). University of Essex research data management policy.
Retrieved from https://www.essex.ac.uk/reo/documents/rdm-policy.pdf
van Holland, B. J., Frings-Dresen, M. H. W., & Sluiter, J. K. (2012). Measuring
short-term and long-term physiological stress effects by cortisol reactivity in
saliva and hair. International Archives of Occupational and Environmental
Health, 85(8), 849-852. doi: 10.1007/s00420-011-0727-3
Varma, V. P. (1997). Stress in psychotherapists. London: Routledge.
Walfisch, A., Sermer, C., Cressman, A., & Koren, G. (2013). Breast milk and
cognitive development – the role of confounders: as systematic review. British
Medical Journal Open, 3, 8-31. doi:10.1136/bmjopen-2013-003259
Walket, E. & Percy, C. (2014). Stress and coping in IAPT staff: A mixed methods
study. Applied Psychological Research Journal, 2, 15-25.
Ware, J. E., Kosinski, M., & Keller, S. D. (1996). A 12-item short-form health
survey. Medical Care, 34, 220–233. doi:10.1097/00005650-199603000-00003

186
Watts, J. (2015). IAPT and the ideal image. Retrieved from
http://www.academia.edu/21585145/IAPT_and_the_Ideal_Image
Westwood, S., Morison, L., Allt, J., & Holmes, N. (2017). Predictors of emotional
exhaustion, disengagement and burnout among improving access to
psychological therapies (IAPT) practitioners. Journal of Mental Health, 26(2),
172-179. doi: 10.1080/09638237.2016.1276540
Williams, M. J., Dalgleish, T., Karl, A., & Kuyken, W. (2014). Examining the factor
structures of the five facet mindfulness questionnaire and the self-compassion
scale. Psychological Assessment, 26(2), 407–418. doi: 10.1037/a0035566
Wright, K., B. (2005). Researching internet-based populations: Advantages and
disadvantages of online survey research, online questionnaire authoring
software packages, and web survey services. Journal of computer-mediated
communication 10, 3, doi: 10.1111/j.1083-6101.2005.tb00259.x
Zessin, U., Dickhauser, O., Garbade, S. (2015). The relationship between self-
compassion and wellbeing: A meta-analysis. Applied Psychology: Health and
Well-being, 7(3), 340–364. doi:10.1111/aphw.12051

187
7. Appendices
Appendix A: Steps in literature search
Table A1
Literature search procedure
Search Number Search Terms Limiters
Search 1 (S1) self-compassion OR “self
compassion”
Search 2 (S2) “perceived stress”
Search 3 (S3) relation* OR associat* OR
correlat*
Search 4 (S4) S1 AND S2 AND S3
Search 5 (S5) S1 AND S2 AND S3 Peer reviewed
Search 6 (S6) S1 AND S2 AND S3 Peer reviewed, English
language
Search 7 (S7) S1 AND S2 AND S3 Peer reviewed, English
language, adulthood
(18yrs &older), young
adulthood (18-29yrs),
middle age (40-64 yrs),
thirties (30-39yrs),
adult: 19-44 years, aged
(65yrs & older) all
adult, middle aged (45-
64 years), aged
(65+years)

188
Appendix B: Online study information sheet
Name of Study: Factors associated with perceived stress in IAPT therapists
Summary of Study:
The purpose of this study is to explore the levels of stress experienced by therapists in
Improving Access to Psychological Therapies (IAPT) services. The study is also
interested in looking into which factors may be associated to these levels of stress.
The study will involve questions related to stress, work related potential stressors,
self-compassion and demographics.
Why is this study being conducted?
Stress has been explored in health care professionals delivering psychological therapy
and there have been studies exploring self-compassion as a factor protecting
psychological wellbeing. Research exploring the levels of stress experienced by IAPT
therapists and the factors that are associated with it is emerging. It is hoped that this
study will further shed light on this area.
Why have I been invited?
You have been invited as you are a therapist working in IAPT. In this study, the term
“therapist” is used broadly and it encompasses staff having clinical contact (i.e
working clinically with patients with an assessment and/or intervention focus).
Possible job titles of potential participants may include (Trainee) Psychological
Wellbeing Practitioner, (Trainee) High intensity worker, Counsellor, Psychologist,
Assistant Psychologist.
What will I have to do?
You will be invited to complete four questionnaires. There are no right or wrong
answers. Please select the answer that best suits you. All responses will be
anonymous. The questionnaires will take approximately 10-20 minutes to complete.

189
Do I have to take part?
No. Participation in this study is voluntary. If you decide not to take part, there will
be no consequences. If you decide to participate and start completing the
questionnaires but then wish to withdraw, you can close your browser and exit; your
responses will not be included in the study. If you know any IAPT therapist who may
be interested in participating in the study, please email them the link for the study.
Are there any risks to taking part?
This study will require about 10-20 minutes of your time. The questionnaires will ask
you to think about yourself and your thoughts, emotions and behaviours in difficult
situations. In doing this, you may experience a temporary lower mood. If you feel a
dip in your mood and you would like support with this, please do not hesitate to
contact one of the following organisations:
a) Samaritans: Telephone support. Phone: 116 123 (24-hour helpline), Website:
www.samaritans.org.uk ,
b) Mind: Provides general mental health information and can be used to look for
details of help and support in your own area. Phone: 0300 123 3393 (infoline),
Website: www.mind.org.uk ,
c) Rethink Mental Illness: Provides advice and information. Phone: 0300 5000 927,
Website: www.rethink.org.
The contact details for these organisations also appear at the end of the study. If your
feelings persist, it is advised that you contact your GP.
What are the possible benefits of taking part?
There are no direct benefits to participants of taking part. This research will help add
to the knowledge base on perceived stress and factors associated with it in IAPT
therapists.

190
How do I consent?
You will be asked to complete a consent form on the next page.
What will happen with my answers?
Once your questionnaires are submitted at the end of the study, it will not be possible
to delete your data as it will be saved anonymously. Data will be accessed by the
principal investigator and her supervisors. Your answers will be stored securely in a
database. The results will be analysed and included in a clinical psychology doctorate
thesis. They may be published in a journal article. The data may be used in future
analyses. Your answers will not be identifiable in any future publication or analysis.
To discuss this study further please contact the principal investigator, Evgenia
Kostaki : [email protected] . The study will be supervised by Dr Leanne
Andrews: [email protected] and Dr Syd Hiskey: [email protected] .
Thank you for reading this information sheet.

191
Appendix C: Online Debrief Page
Thank you for completing the questionnaires. Your responses will allow us to further
develop our knowledge of stress levels and the factors that are associated with it in
therapists working in IAPT with the aim of promoting both personal and professional
wellbeing.
If you know an IAPT therapist (trainee/ qualified/unqualified/other, high or low
intensity) who you think may be interested in participating in the study, please copy
and paste the link below and email it to them. <insert link>
If, after completing this study, you feel a dip in your mood and you would like
support with this please do not hesitate to contact one of the following organisations:
Samaritans
Telephone support.
Phone: 116 123 (24-hour helpline)
Website: www.samaritans.org.uk
Mind
Provides general mental health information and can be used to look for details of help
and support in your own area.
Phone: 0300 123 3393 (infoline)
Website: www.mind.org.uk
Rethink Mental Illness

192
Provides advice and information.
Phone: 0300 5000 927
Website: www.rethink.org
If your feelings persist, please visit your GP.
Should you wish to discuss this study further or receive a summary of the study
results, you can contact the lead researcher Evgenia Kostaki: [email protected] .
If you would like to contact one of the supervisors, please contact Dr Leanne
Andrews: [email protected] or Dr Syd Hiskey: [email protected]

193
Appendix D: Institutions offering IAPT training
Table D1
List of Institutions offering Psychological Wellbeing Practitioner courses (last
updated March 2016)
Note. N= 15
Name of Institution
Birmingham and the Black Country Consortium/University of Birmingham
University of Central Lancashire
De Montfort University
University of Essex
University of Exeter
Liverpool John Moores University
University College London
University of Manchester
Newcastle University
University of Reading
University of Sheffield
University of Southampton
University of Surrey
Teesside University
Ulster University
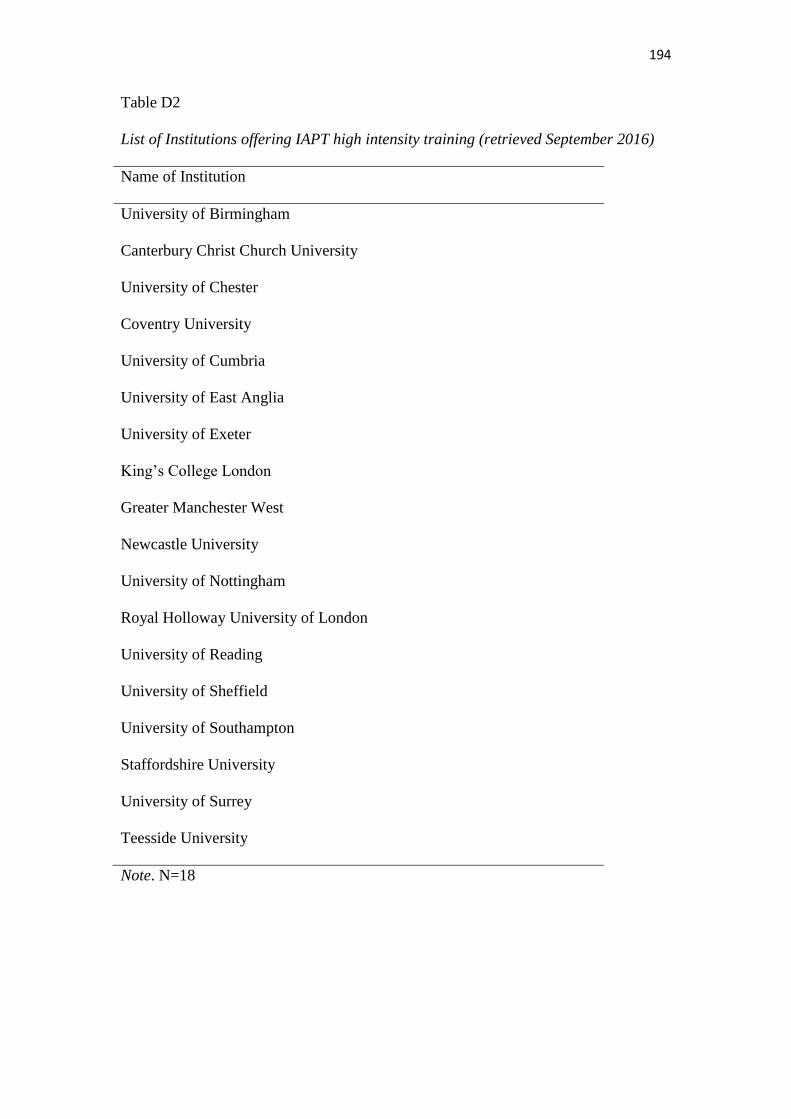
194
Table D2
List of Institutions offering IAPT high intensity training (retrieved September 2016)
Name of Institution
University of Birmingham
Canterbury Christ Church University
University of Chester
Coventry University
University of Cumbria
University of East Anglia
University of Exeter
King’s College London
Greater Manchester West
Newcastle University
University of Nottingham
Royal Holloway University of London
University of Reading
University of Sheffield
University of Southampton
Staffordshire University
University of Surrey
Teesside University
Note. N=18

195
Appendix F: Online Consent Form
Name of study: Factors associated with perceived stress in IAPT therapists
Please read the following six statements.
1. I confirm that I have read and understand the information sheet for the
above study and have had the opportunity to ask questions.
2. I understand that my participation is voluntary and that I am free to
withdraw at any time, without giving reason and without any consequences.
3. I understand than my answers will remain anonymous.
4. I agree that data gathered in this study may be stored and may be used
for future analyses.
5. I confirm that I am a IAPT staff whose work is clinical (i.e. I have
clinical contact with patients and deliver work that is assessment and/or
intervention focused).
6. I agree to participate in the study.
After reading the six statements above, I confirm that I agree with all six statements
and that I consent to take part in the study.
Yes
No

196
Appendix G: End of study message for participants who do not consent
You have been directed to the end of the study as you have indicated that you do not
consent to the statements in the consent form.
Thank you for taking the time to consider participating in this study.
If you know an IAPT therapist (trainee/ qualified/unqualified/other, high or low
intensity) who you think may be interested in participating in the study, please copy
and paste the link below and email it to them. <insert link>
If, after considering this study, you feel a dip in your mood and you would like
support with this please do not hesitate to contact one of the following organisations:
Samaritans
Telephone support.
Phone: 116 123 (24-hour helpline)
Website: www.samaritans.org.uk
Mind
Provides general mental health information and can be used to look for details of help
and support in your own area.
Phone: 0300 123 3393 (infoline)
Website: www.mind.org.uk
Rethink Mental Illness
197
Provides advice and information.
Phone: 0300 5000 927
Website: www.rethink.org
If your feelings persist, please visit your GP.
Should you wish to discuss this study further or receive a summary of the study
results, you can contact the lead researcher Evgenia Kostaki: [email protected] .
If you would like to contact one of the supervisors, please contact Dr Leanne
Andrews: [email protected] or Dr Syd Hiskey: [email protected]

198
Appendix H: Perceived Stress Scale (Cohen & Williamson, 1988)
Permissions: Permission for use of scales is not necessary when use is for nonprofit
academic research or nonprofit educational purposes
(http://www.psy.cmu.edu/~scohen/)

199
Appendix I: Self-compassion Scale (Neff, 2003a)

200

201
Please note that the following change was made to the instructions; the phrase “To the
left of each item” was changed to “Below each item”.

202
Appendix J: HSE Management Standards Indicator Tool (Cousins, Mackay, Clarke,
Kelly, Kelly, & McCaig, 2004)
Instructions: It is recognised that working conditions affect worker well-being. Your
responses to the questions below will help us determine your working conditions. It is
important that your responses reflect your work in the last six months.

203

204
Appendix K: Demographics questionnaire
Demographic Questionnaire
Please select your employment status: a) Trainee
b) Qualified
c) Unqualified
d) Other
If ‘Other,’ please state
Please select your job role: a) Low intensity worker
b) High intensity worker
c) Other
If ‘Other’, please state
Please select: I work in my current job: a) full-time
b) part-time
Please select your gender:
a) male
b) female
c) other
d) prefer not to say
Please type your age using numbers
What is your ethnicity:
a) Asian British, Asian English, Asian Scottish or Asian Welsh
b) Black British, Black English, Black Scottish or Black Welsh
c) White British, White English, White Scottish or White Welsh
d) Asian other
e) Black other

205
f) White other
g) Chinese
h) Middle Eastern
i) Other ethnic background
j) Prefer not to say
If ‘Other ethnic background’, please state
Please select your religion:
a) I do not have a religion
b) Buddhist
c) Christian
d) Hindu
e) Jewish
f) Muslim
g) Sikh
h) Other religion
i) Prefer not to say
If ‘Other religion’, please state
Please select your marital status:
a) Single, never been married
b) married, in civil partnership or cohabiting
c) divorced or separated
d) widowed
e) prefer not to say
Please select the highest level of education you have completed:
a) no formal qualification

206
b) GCSE or equivalent
c) A levels, BTEC or equivalent
d) Bachelor’s degree or equivalent
e) Master’s degree
f) Doctorate degree
g) Prefer not to say
Please type in how many years of clinically relevant experience you have to date, to
the nearest year.
Please type in how long you have been employed with IAPT, to the nearest month
and year. years
months
How many hours of supervision do you receive per month?

207
Appendix L: University of Essex Ethics Committee Approval

208

209
Appendix M: University of Essex Ethics Committee Amendment Request Approval

210
Appendix N: Normality assumption analyses for ratio demographic variables
Graphical results for the variable ‘Age’.

211
Table N1
Statistical results for variables
Note. N= sample size, SEskew= Standard Error for skewness, SEkurt= Standard Error for kurtosis, Signf. = significance level.
a The z-scores for skewness and kurtosis were calculated using the following formulas z-skewness= Skewness /St Error, z-kurtosis=
Kurtosis/St Error.
N
Skewness
(SEskew)
z-skewness
Kurtosis
(SEkurt)
z-kurtosis
Shapiro-Wilk
Signf.
Age 207 1.126 (.169) 6.663 0.306 (.337) 0.908 <.001
Years of clinically relevant
experience to date (to the nearest
year)
207 1.815 (.169) 10.740 5.373 (.337) 15.944 <.001
Hours of supervision received per
month
207 0.671 (.169) 3.970 -.050 (.337) -0.148 <.001
How long have you been employed
with IAPT, to the nearest
month and year. - years
205
0.532
(.170)
3.129 -.933 (.338) -2.760 <.001

212
Appendix O: Normality assumption analyses for the main study variables
Graphical results for the variable ‘Perceived Stress’.

213
Table O1
Statistical results for the main study variables (N=207)
Note. Signf. = significance level.
a The z-scores for skewness and kurtosis were calculated using the following formulas z-skewness= Skewness /Skewness Standard Error,
z-kurtosis= Kurtosis/Kurtosis Standard Error, where Skewness Standard Error is .169 and Kurtosis Standard Error is .337.
Skewness
z-skewness a Kurtosis z-kurtosis a Shapiro-Wilk Signf.
Perceived Stress Total -.136 -.805 -.352 -1.045 .103
HSE Demands -.322 -1.905 -.742 -2.202 <.001
HSE Control -.079 -.467 -.024 -0.071 .088
HSE Managerial Support -.524 -3.101 -.488 -1.448 <.001
HSE Colleague Support -.714 -4.225 .266 0.789 <.001
HSE Role -.818 -4.840 .759 2.252 <.001
HSE Relationship -1.407 -8.325 1.912 5.674 <.001
HSE Change .073 .432 -.647 -1.920 .001
SCS Self-Kindness .022 .130 -.215 -.638 .083
SCS Self-Judgement .145 .858 -.401 -1.190 .026
SCS Common Humanity .091 .538 -.125 -.371 .009
SCS Isolation .161 .953 -.812 -2.409 <.001
SCS Mindfulness -.004 -.024 -.127 -.377 .008
SCS Over-identification .249 1.473 -.654 -1.941 .001
SCS Total .191 1.130 -.152 -.451 .478

214
Appendix P: Normality assumptions Perceived Stress (N= 200)
With respect to the normal distribution the z-scores for skewness and kurtosis fell
within the acceptable range and the Shapiro-Wilk test was non-significant (Table P1).
The plots were also indicative of a normal distribution.
Table P1
Skewness and Kurtosis scores for Perceived Stress
Note. n=frequency, Signf= Significance level.
n Skewness z-skewness Kurtosis z-kurtosis
Shapiro-Wilk
Signf.
Perceived Stress Total 200 -.019 -1.10 -.485 -1.42 .053

215
Appendix Q: Moderation analyses with mean centering
Table Q1
Interaction effect moderation analyses significance levels (N= 200)
Note. p= significance level
Interaction effect p
HSE Demands X Total SCS .381
HSE Control X Total SCS .465
HSE Managerial Support X Total SCS .441
HSE Colleague Support X Total SCS .911
HSE Role X Total SCS .762
HSE Relationship X Total SCS .785
HSE Change X Total SCS .446

216
Appendix R: Assumptions for fit and generalisability of model cleansing strategy
analyses
Demands
Multicollinearity: The SPSS correlation matrix did not show indication of
multicollinearity as no predictors correlated substantially with each other. The
correlations were all well below .9 (highest absolute value of correlation coefficient
was .51). Moreover, the largest Variance Inflation Factor (VIF) across all three
models was 1.13, which is well below 10, the average VIF for each model was very
close to 1 (Model 1= 1.02, Model 2= 1.01, Model 3= 1.07) and tolerance statistics
were well above .2 (smallest tolerance across the three models was .89). The
correlation matrix coefficients, and the VIF and tolerance values pointed towards no
multicollinearity.
Independent Errors: The Durbin-Watson statistic was 2 so the assumption of
independent errors was met.
Influential Cases: Casewise diagnostics showed that only one case had a
standard residual greater than 3 (case 255). Cook’s Distance for case 255 was .20
(<1) thus the case was not influential.
Linearity: The plot of residuals looked like a “random array of dots evenly
dispersed around zero” (Field, 2005, p. 202) suggesting that the assumption of
linearity was met.

217
Normality of Residuals: The histogram was roughly bell-like shaped and the
points roughly mapped onto the line of the normal probability; this suggested that the
residuals were normally distributed.
Cross- validity/ Generalisability: The difference between the R2 and the
Adjusted R2 was small for all three models (Model 1= .010, Model 2= .011, Model 3=
.012) This means that if the models 1, 2 and 3 derived from the population as opposed
to the sample, they would account for 1%, 1.1% and 1.2% less variance in perceived
stress respectively.
Control
Multicollinearity: The SPSS correlation matrix did not show indication of
multicollinearity as no predictors correlated substantially with each other. The
correlations were all well below .9 (highest absolute value of correlation coefficient
was .51). Moreover, the largest Variance Inflation Factor (VIF) across all three
models was 1.16, which is well below 10, the average VIF for each model was very
close to 1 (Model 1= 1.02, Model 2= 1.06, Model 3= 1.11) and tolerance statistics
were well above .2 (smallest tolerance across the three models was .86). The

218
correlation matrix coefficients, and the VIF and tolerance values pointed towards no
multicollinearity.
Independent Errors: The Durbin-Watson statistic was 1.95, which is close to 2
so the assumption of independent errors was met.
Influential Cases: Casewise diagnostics showed that only two cases had a
standard residual greater than 3 (cases 217 and 255). Cook’s Distance for case 217
was .03 (<1) and for case 255 was .16 (<1) thus the case was not influential.
Linearity: The plot of residuals looked like a “random array of dots evenly
dispersed around zero” (Field, 2005, p. 202) suggesting that the assumption of
linearity was met.
Normality of Residuals: The histogram was roughly bell-like shaped and the
points roughly mapped onto the line of the normal probability; this suggested that the
residuals were normally distributed.

219
Cross- validity/ Generalisability: The difference between the R2 and the
Adjusted R2 was small for all three models (Model 1= .010, Model 2= .012, Model 3=
.014) This means that if the models 1, 2 and 3 derived from the population as opposed
to the sample, they would account for 1%, 1.2% and 1.4% less variance in perceived
stress respectively.
Managerial support
Multicollinearity: The SPSS correlation matrix did not show indication of
multicollinearity as no predictors correlated substantially with each other. The
correlations were all well below .9 (highest absolute value of correlation coefficient
was .51). Moreover, the largest Variance Inflation Factor (VIF) across all three
models was 1.13, which is well below 10, the average VIF for each model was very
close to 1 (Model 1= 1.02, Model 2= 1.02, Model 3= 1.08) and tolerance statistics
were well above .2 (smallest tolerance across the three models was .88). The
correlation matrix coefficients, and the VIF and tolerance values pointed towards no
multicollinearity.
Independent Errors: The Durbin-Watson statistic was 1.89, which is close to 2
so the assumption of independent errors was met.
Influential Cases: Casewise diagnostics showed that only one case had a
standard residual greater than 3 (case 255). Cook’s Distance for case 255 was .20
(<1) thus the case was not influential.
Linearity: The plot of residuals looked like a “random array of dots evenly
dispersed around zero” (Field, 2005, p. 202) suggesting that the assumption of
linearity was met.

220
Normality of Residuals: The histogram was roughly bell-like shaped and the
points roughly mapped onto the line of the normal probability; this suggested that the
residuals were normally distributed.
Cross- validity/ Generalisability: The difference between the R2 and the
Adjusted R2 was small for all three models (Model 1= .010, Model 2= .012, Model 3=
.013) This means that if the models 1, 2 and 3 derived from the population as opposed
to the sample, they would account for 1%, 1.2% and 1.3% less variance in perceived
stress respectively.
Colleague support
Multicollinearity: The SPSS correlation matrix did not show indication of
multicollinearity as no predictors correlated substantially with each other. The

221
correlations were all well below .9 (highest absolute value of correlation coefficient
was .51). Moreover, the largest Variance Inflation Factor (VIF) across all three
models was 1.13, which is well below 10, the average VIF for each model was very
close to 1 (Model 1= 1.02, Model 2= 1.03, Model 3= 1.09) and tolerance statistics
were well above .2 (smallest tolerance across the three models was .88). The
correlation matrix coefficients, and the VIF and tolerance values pointed towards no
multicollinearity.
Independent Errors: The Durbin-Watson statistic was 1.94, which is close to 2
so the assumption of independent errors was met.
Influential Cases: Casewise diagnostics showed that only two cases had a
standard residual greater than 3 (cases 217 and 255). Cook’s Distance for case 217
was .03 (<1) and for case 255 was .18 (<1) thus the case was not influential.
Linearity: The plot of residuals looked like a “random array of dots evenly
dispersed around zero” (Field, 2005, p. 202) suggesting that the assumption of
linearity was met.
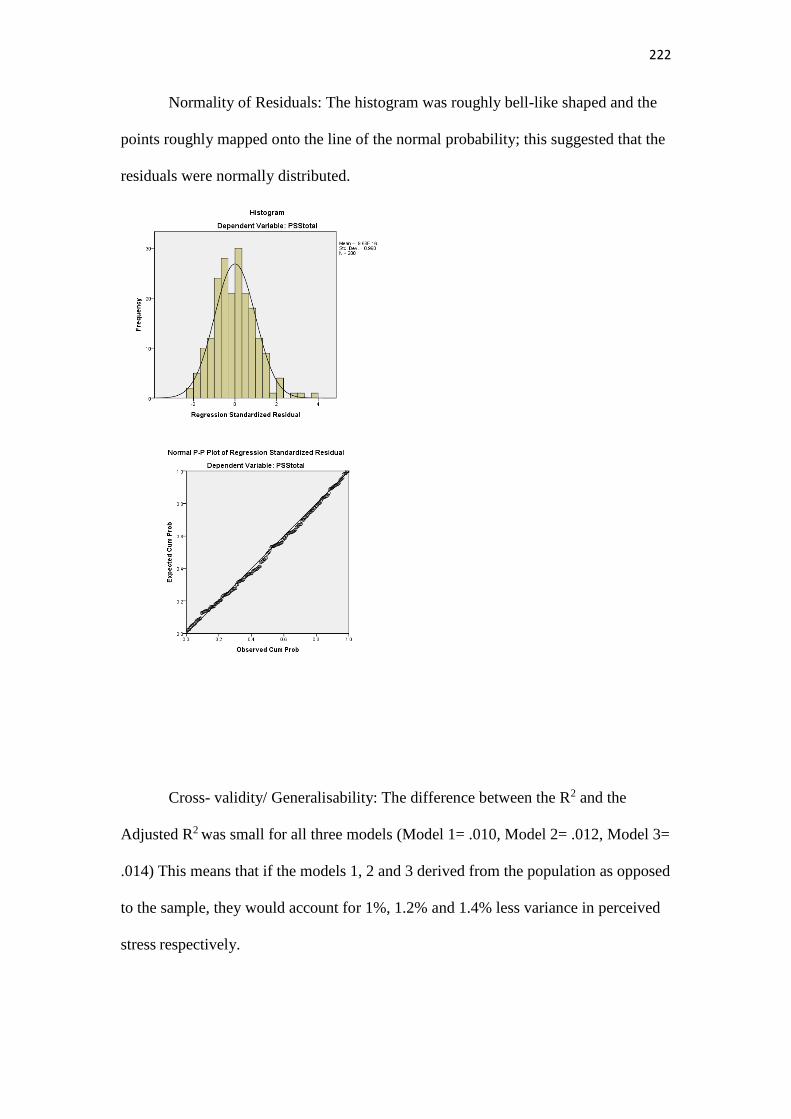
222
Normality of Residuals: The histogram was roughly bell-like shaped and the
points roughly mapped onto the line of the normal probability; this suggested that the
residuals were normally distributed.
Cross- validity/ Generalisability: The difference between the R2 and the
Adjusted R2 was small for all three models (Model 1= .010, Model 2= .012, Model 3=
.014) This means that if the models 1, 2 and 3 derived from the population as opposed
to the sample, they would account for 1%, 1.2% and 1.4% less variance in perceived
stress respectively.

223
Role
Multicollinearity: The SPSS correlation matrix did not show indication of
multicollinearity as no predictors correlated substantially with each other. The
correlations were all well below .9 (highest absolute value of correlation coefficient
was .51). Moreover, the largest Variance Inflation Factor (VIF) across all three
models was 1.16, which is well below 10, the average VIF for each model was very
close to 1 (Model 1= 1.02, Model 2= 1.02, Model 3= 1.09) and tolerance statistics
were well above .2 (smallest tolerance across the three models was .86). The
correlation matrix coefficients, and the VIF and tolerance values pointed towards no
multicollinearity.
Independent Errors: The Durbin-Watson statistic was 1.93, which is close to 2
so the assumption of independent errors was met.
Influential Cases: Casewise diagnostics showed that only two cases had a
standard residual greater than 3 (cases 217 and 255). Cook’s Distance for case 217
was .04 (<1) and for case 255 was .15 (<1) thus the case was not influential.
Linearity: The plot of residuals looked like a “random array of dots evenly
dispersed around zero” (Field, 2005, p. 202) suggesting that the assumption of
linearity was met.

224
Normality of Residuals: The histogram was roughly bell-like shaped and the
points roughly mapped onto the line of the normal probability; this suggested that the
residuals were normally distributed.
Cross- validity/ Generalisability: The difference between the R2 and the
Adjusted R2 was small for all three models (Model 1= .010, Model 2= .012, Model 3=
.014) This means that if the models 1, 2 and 3 derived from the population as opposed
to the sample, they would account for 1%, 1.2% and 1.4% less variance in perceived
stress respectively.
Relationship
Multicollinearity: The SPSS correlation matrix did not show indication of
multicollinearity as no predictors correlated substantially with each other. The

225
correlations were all well below .9 (highest absolute value of correlation coefficient
was .51). Moreover, the largest Variance Inflation Factor (VIF) across all three
models was 1.13, which is well below 10, the average VIF for each model was very
close to 1 (Model 1= 1.02, Model 2= 1.03, Model 3= 1.08) and tolerance statistics
were well above .2 (smallest tolerance across the three models was .89). The
correlation matrix coefficients, and the VIF and tolerance values pointed towards no
multicollinearity.
Independent Errors: The Durbin-Watson statistic was 1.94, which is close to 2
so the assumption of independent errors was met.
Influential Cases: Casewise diagnostics showed that only two cases had a
standard residual greater than 3 (cases 217 and 255). Cook’s Distance for case 217
was .03 (<1) and for case 255 was .21 (<1) thus the case was not influential.
Linearity: The plot of residuals looked like a “random array of dots evenly
dispersed around zero” (Field, 2005, p. 202) suggesting that the assumption of
linearity was met.
Normality of Residuals: The histogram was roughly bell-like shaped and the
points roughly mapped onto the line of the normal probability; this suggested that the
residuals were normally distributed.

226
Cross- validity/ Generalisability: The difference between the R2 and the
Adjusted R2 was small for all three models (Model 1= .010, Model 2= .012, Model 3=
.012) This means that if the models 1, 2 and 3 derived from the population as opposed
to the sample, they would account for 1%, 1.2% and 1.2% less variance in perceived
stress respectively.
Change
Multicollinearity: The SPSS correlation matrix did not show indication of
multicollinearity as no predictors correlated substantially with each other. The
correlations were all well below .9 (highest absolute value of correlation coefficient
was .51). Moreover, the largest Variance Inflation Factor (VIF) across all three
models was 1.13, which is well below 10, the average VIF for each model was very
close to 1 (Model 1= 1.02, Model 2= 1.01, Model 3= 1.07) and tolerance statistics
were well above .2 (smallest tolerance across the three models was .88). The
correlation matrix coefficients, and the VIF and tolerance values pointed towards no
multicollinearity.
Independent Errors: The Durbin-Watson statistic was 1.96, which is close to 2
so the assumption of independent errors was met.

227
Influential Cases: Casewise diagnostics showed that only one case had a
standard residual greater than 3 (case 255). Cook’s Distance for case 255 was .21
(<1) thus the case was not influential.
Linearity: The plot of residuals looked like a “random array of dots evenly
dispersed around zero” (Field, 2005, p. 202) suggesting that the assumption of
linearity was met.
Normality of Residuals: The histogram was roughly bell-like shaped and the
points roughly mapped onto the line of the normal probability; this suggested that the
residuals were normally distributed.

228
Cross- validity/ Generalisability: The difference between the R2 and the
Adjusted R2 was small for all three models (Model 1= .010, Model 2= .013, Model 3=
.014) This means that if the models 1, 2 and 3 derived from the population as opposed
to the sample, they would account for 1%, 1.3% and 1.4% less variance in perceived
stress respectively.

229
Appendix S: Scatterplots assessing linearity

230

231

232
Appendix T: Residual graphs
Demands:

233
Control:

234
Managerial support:

235
Colleague support:
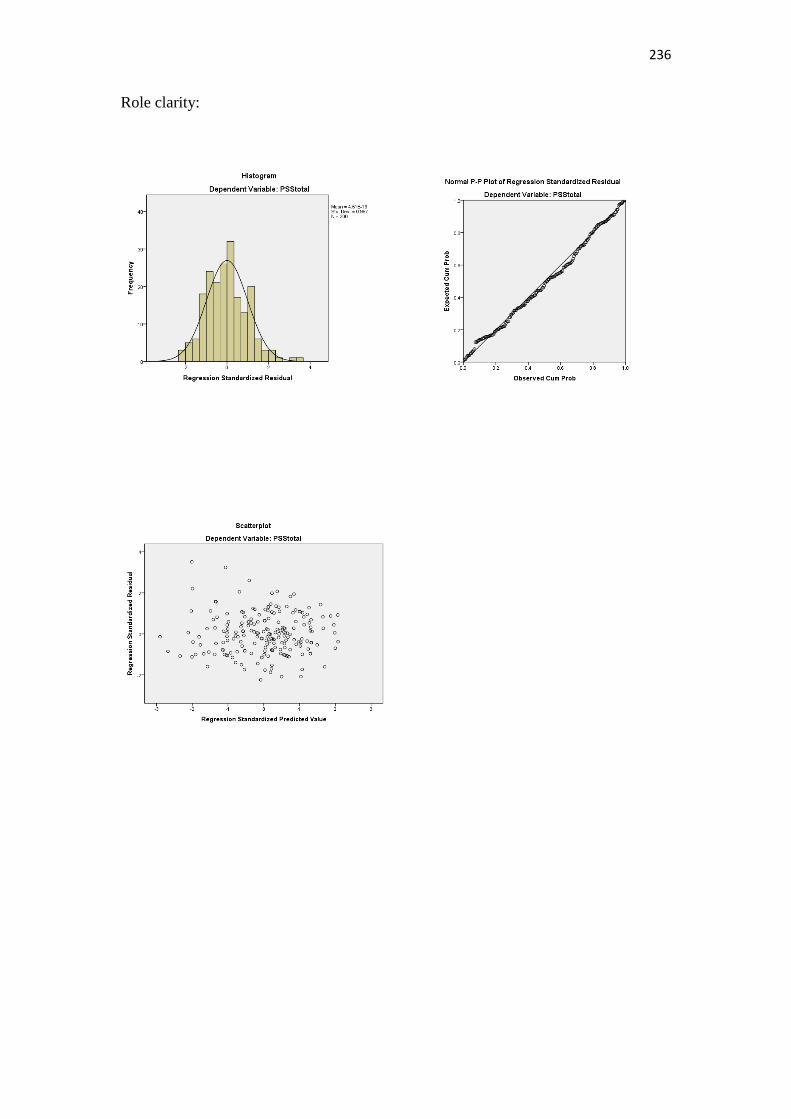
236
Role clarity:

237
Relationship:

238
Change:


![The impact of immigration on the population structure of Greece [1] [1] Viron Kotzamanis [2], Anastasia Kostaki [3] [3] [1][1] This research is a part.](https://static.fdocuments.in/doc/165x107/56649f2c5503460f94c47c08/the-impact-of-immigration-on-the-population-structure-of-greece-1-1-viron.jpg)


![Guard Cells Integrate Light and Temperature Signals to ... · Guard Cells Integrate Light and Temperature Signals to Control Stomatal Aperture1[OPEN] Kalliopi-Ioanna Kostaki,a Aude](https://static.fdocuments.in/doc/165x107/6106bf0eedf09355c055d381/guard-cells-integrate-light-and-temperature-signals-to-guard-cells-integrate.jpg)