The Association Between Changes in Vocational Programs on ...
106
Seton Hall University eRepository @ Seton Hall Seton Hall University Dissertations and eses (ETDs) Seton Hall University Dissertations and eses Spring 5-22-2018 e Association Between Changes in Vocational Programs on Student Mobility, Aendance, and Suspension in New Jersey: A Retrospective Study Jared Edward Keshishian [email protected] Follow this and additional works at: hps://scholarship.shu.edu/dissertations Part of the Vocational Education Commons Recommended Citation Keshishian, Jared Edward, "e Association Between Changes in Vocational Programs on Student Mobility, Aendance, and Suspension in New Jersey: A Retrospective Study" (2018). Seton Hall University Dissertations and eses (ETDs). 2509. hps://scholarship.shu.edu/dissertations/2509
Transcript of The Association Between Changes in Vocational Programs on ...

Seton Hall UniversityeRepository @ Seton HallSeton Hall University Dissertations and Theses(ETDs) Seton Hall University Dissertations and Theses
Spring 5-22-2018
The Association Between Changes in VocationalPrograms on Student Mobility, Attendance, andSuspension in New Jersey: A Retrospective StudyJared Edward [email protected]
Follow this and additional works at: https://scholarship.shu.edu/dissertations
Part of the Vocational Education Commons
Recommended CitationKeshishian, Jared Edward, "The Association Between Changes in Vocational Programs on Student Mobility, Attendance, andSuspension in New Jersey: A Retrospective Study" (2018). Seton Hall University Dissertations and Theses (ETDs). 2509.https://scholarship.shu.edu/dissertations/2509

The Association Between Changes in Vocational Programs on Student Mobility, Attendance, and Suspension in New Jersey: A Retrospective Study
Jared Edward Keshishian
Dissertation Committee Christopher Tienken Ed.D, Mentor
Elaine Walker Ph.D George J Solter Jr. Ed.D
Submitted in partial fulfillment of the requirements for the degree of
Doctor of Education Seton Hall University 2018

©2018 Jared Keshishian

ii
Abstract
This explanatory longitudinal study explains the influence of the removal of vocational
education on specific school variables and determines the between-group differences of high
school vocational programs and county vocational schools on these variables. The data set was
obtained from the New Jersey Historical School Report Card from 1994–2001, which can be
found on the NJDOE (New Jersey Department of Education) website. The time frame of the data
set was chosen because many school districts during this time removed their vocational classes to
make room for the state’s mandated minimum course requirements. The results from this study
aid in explaining what occurred to the variables over an 8-year time frame when the vocational
programs were cut. The study looks at 35 high schools in New Jersey with a low socioeconomic
status and 46 county vocational schools. Although there are some significant differences in the
means of some of the variables, the results do not show a cause and effect. Hopefully, this
research will lead to further studies in vocational education to fill in the research gap and help its
implementation because many stakeholders are calling for its return.

iii
Acknowledgements
I want to first begin by thanking my mentor, Dr. Christopher Tienken. You were the first
person I met when I decided to start this challenge in 2010, and you have been there for me this
entire time.
To Dr. Elaine Walker, thank you so much for the statistical knowledge bestowed upon
me throughout the statistic classes, as well as for taking the time to aid me in refining my data
analysis, which was needed to produce a well-rounded thesis.
To Dr. George J. Solter Jr., who has given up a lot of time to talk with me and guide me
through this process since I began: for this, I am grateful. Since I began work at North Bergen,
you have been an amazing inspiration and mentor for me.
I also want to acknowledge and thank those whose paths crossed with mine during my
time at Seton Hall. To all my teachers who were incredible and to all my classmates, I wish you
all the best of luck in your endeavors.

iv
Dedication
I dedicate this dissertation to my parents, John and Isabella Keshishian. You taught me
the value of hard work, the importance of education, and the maxim: once you begin something,
you better finish it. You have always been there for me, and without your support, I would not
have been able to complete this chapter in my life. You bestowed the knowledge, values, and
love that allowed me to be the man I am today. I hope and pray I can do the same for my
children as you have done for me with such grace and ease. I love you both.
To my beautiful wife Raffaella Daniela, I love you and thank you for never giving up on
me and pushing me to finish this dissertation. We have supported each other in our goals in
education throughout our relationship, and the sacrifices we both made to follow our dreams
were well worth it.
To the rest of my family and friends, thank you for your support and encouragement over
these past few years. To my sister Jocelyn, thank you for listening and always checking in on me.
To my uncle, Dr. Robert Otnisky, your talks in Florida helped me realize my potential and made
me believe I could succeed. To Ms. Theodora “Teddi” Gino, who is truly the last grammarian,
you were always there, reviewing my paper for sentence structure and grammar. To Mr. Guy
DiVincent, your historical knowledge is unparalleled to anyone I have ever met. Thank you for
all those talks during cafeteria duty. To Mr. Dave Enrico, thank you for your technical support
and computer wizardry. To my friend Ivan, thank you for always listening. Now you have to buy
my book.
I also want to dedicate this dissertation to my past and future students at North Bergen
High School. This is grit, and if you want something, keep moving forward toward your goal.
v
Table of Contents
Abstract ............................................................................................................................................. ii Acknowledgements ........................................................................................................................... iii Dedication ......................................................................................................................................... iv Table of Content ................................................................................................................................ v List of Tables .................................................................................................................................... vii List of Figures .................................................................................................................................... viii I INTRODUCTION ........................................................................................................................ 1 Background ........................................................................................................................... 1
Problem Statement ................................................................................................................ 13 Purpose of the Study .............................................................................................................. 13 Research Questions .............................................................................................................. 13 Independent Variables ........................................................................................................... 14 Dependent Variables ............................................................................................................. 14 Null Hypothesis ..................................................................................................................... 15 Significance of the Study ....................................................................................................... 15 Limitations ............................................................................................................................ 17 Delimitations ........................................................................................................................ 18 Definitions of Terms ............................................................................................................. 18 Organization of the Study ..................................................................................................... 19
II REVIEW OF LITERATURE ...................................................................................................... 21 Introduction .......................................................................................................................... 21
Literature Search Procedures ................................................................................................. 21 Inclusion Criteria .................................................................................................................. 22 History of Vocational Education in The United States in Decade Intervals ......................... 22 New Jersey School Report Card ............................................................................................ 34 Mobility/Attendance .............................................................................................................. 35 Suspension Rate ..................................................................................................................... 37 Drop Out Rate ........................................................................................................................ 39 Studies on Vocational Education ........................................................................................... 41 Studies on a Prescribed Curriculum ...................................................................................... 44 Active learning ...................................................................................................................... 45
III METHODOLOGY ...................................................................................................................... 50
Research Design .................................................................................................................... 50 Methods ................................................................................................................................. 51 Research Questions ............................................................................................................... 51 Hypothesis ............................................................................................................................. 52 Sample Population/Data Source ........................................................................................... 52 Data Collection ...................................................................................................................... 53 Dependent Variables ............................................................................................................. 57 Independent Variables ........................................................................................................... 58 Instrumentation ...................................................................................................................... 59

vi
Data Analysis ......................................................................................................................... 59 Procedure ............................................................................................................................... 61 Summary ............................................................................................................................... 61
IV ANALYSIS OF DATA ................................................................................................................ 63 Results .................................................................................................................................. 63 Mobility ................................................................................................................................. 64 Attendance ............................................................................................................................. 65 Suspension ............................................................................................................................. 66 HSPT all results ..................................................................................................................... 67 Between Groups Mobility ..................................................................................................... 70 Between Groups Attendance ................................................................................................. 72 Between Groups Suspension ................................................................................................. 74 Between Groups HSPT all results ......................................................................................... 76
V CONCLUSION AND RECCOMENDATIONS ......................................................................... 79 Conclusion .............................................................................................................................. 79 Summary of finding ................................................................................................................ 80 Conclusions ............................................................................................................................ 82 Recommendation for Policy ................................................................................................... 83 Recommendation for Practice ................................................................................................ 86 Recommendation for Future research .................................................................................... 87 Summary ................................................................................................................................. 88 References ......................................................................................................................................... 90

vii
List of Tables Table 1.Major Events and Legislation Shaping Vocational Education in the
United States .............................................................................................................. 8 Table 2.Dependent Variable Explained ............................................................................................ 14 Table 3.Data Retrieved from NJDOE and Utilized in the Study ...................................................... 54 Table 4.Year Vocational Education was removed ............................................................................ 55 Table 5.Number of High Schools by Type ........................................................................................ 56 Table 6.Variables and Names of Dependent Variables ..................................................................... 57 Table 7.Dependent and Separation of Independent Variable ............................................................ 58 Table 8.Descriptive Statistics for Main Study Variable (N=35) ....................................................... 63 Table 9.Repeated Measure Analysis of Variance (Mobility) ............................................................ 65 Table 10. Repeated Measure Analysis of Variance (Attendance) ..................................................... 65 Table 11.Repeated Measure Analysis of Variance (Suspension) ...................................................... 66 Table 12.Repeated Measure Analysis of Variance (School Achievement) ....................................... 68 Table 13. Descriptive Statistics for Main Study Variable (N=81) .................................................... 69 Table 14.Repeated Measure Analysis of Variance (Mobility *School Type) ................................... 71 Table 15.Test of Between-Subjects Effects (Mobility) ..................................................................... 71 Table 16.Repeated Measure Analysis of Variance (Attendance *School Type) .............................. 73 Table 17.Test of Between-Subjects Effects (Attendance) ................................................................. 73 Table 18. Repeated Measure Analysis of Variance (Suspension *School Type) ............................. 75 Table 19Test of Between-Subjects Effects (Suspension) .................................................................. 75 Table 20.Repeated Measure Analysis of Variance (School Achievement *School Type) ............... 77 Table 21.Test of Between-Subjects Effects (Achievement) .............................................................. 77

viii
List of Figures
Figure 1.Google NGram Viewer ....................................................................................................... 15 Figure 2.First Data Analysis of Just Secondary High School ........................................................... 60 Figure 3. Second Data Analysis Between Groups ............................................................................. 60 Figure 4. Profile Plot of Mobility ...................................................................................................... 72 Figure 5. Profile Plot of Attendance .................................................................................................. 74 Figure 6. Profile Plot of Suspension .................................................................................................. 76 Figure 7. Profile Plot of School Achievement ................................................................................... 78

1
Chapter I
Introduction
Background
With the dawn of the Industrial Age in the United States, a need for a change in
the education system arose, especially for vocational education, where most knowledge
and skills were passed down through apprenticeships. An apprentice is defined by
Merriam Webster as “one who is learning by practical experience under skilled workers
a trade, art, or calling.” (Apprentice, n.d.) Historically, trade education was passed down
within families, where a child would learn a skill or trade from watching and helping
his or her elders. For example, the son of a farmer would likely take on that trade and,
basically, become an apprentice to the more skilled elder.
Yet when the Industrial Revolution reached the United States in the late
nineteenth century, the apprenticeship model could no longer keep up with the demands
for new skills and technologies needed in constantly-evolving factories. Thus, the
technique of apprenticeship, which passed knowledge and skills from one generation to
another through observation and practice, no longer was a relevant form of education.
As the economic and societal environments of the United States progressed and
evolved in the twentieth century, a key turning point in public education occurred
during World War I. “The Great War” began in July of 1914, and the United States did
not join the fight until March of 1917. During the three years leading up to its active
engagement in World War I, the United States produced large amounts of food to sell to
the Allied and Central Powers. Thus, the mass production of food initiated a need for
agricultural vocations.

2
In 1914, the United States government began a 3-year battle to promote and fund
vocational education; the original agrarian model could not meet the needs of the
country, and with the advent of farming technologies and methods, a more skilled
workforce was needed. Also, with the economic boost from the sale of food to the war-
ridden countries in Europe, the economics of supply and demand were coming into
play. However, many questions arose about the theoretical framework and design of
vocational education in the United States, causing a debate.
To address these issues, Congress passed the Vocational Education Act of 1917,
also called the Smith-Hughes Act, which was named after Hoke Smith and Dudley
Hughes, two politicians from Georgia. Hoke Smith had been at the forefront of this
push, urging the passage of an agricultural extension where scientific research and new
technologies could be applied to farming. Hughes, on the other hand, contributed to this
act as chairman of the House Committee of Education because he was a farmer by trade
and had many business ventures in agriculture.
The Smith-Hughes act begins with the following paragraph:
An Act to provide for the promotion of vocational education; to provide for cooperation
with the States in the promotion of such education in agriculture and the trades and
industries; to provide for cooperation with the states in the preparation of teachers of
vocational subjects; and to appropriate money and regulate its expenditure. (Tompkins,
2000)
This opening paragraph is the foundation of vocational education in the United States, and as this
dissertation is a retrospective study, understanding the primary document and the historical
background will aid explaining the changes in vocational education over the past one hundred

3
years. While, there were multiple sections in the Smith-Huges act that specified how the monies
would be appropriated from the federal government to local education agencies. For example,
section two of the act aided in supplementing the salaries of teachers, administrators, and
directors. The monies were distributed over an 8-year period, starting with $500,000 and
growing to $3,000,000 and continuing on thereafter.
In section five of the act, to be eligible to receive the funding, the state had to designate
or create a State Board of Vocational Education with no less than three members, which would
cooperate with the Federal Board of Vocational Education.
The initial Federal Board of Vocational Education consisted of the following members:
the Secretary of Agriculture, the Secretary of Commerce, the Secretary of Labor, the United
States Commissioner of Education, and three citizens of the United States who would be
appointed by the president: one representative for manufacturing and commercial interests, one a
representative for agricultural interests, and finally a representative of labor interests. The
individuals that made of the Federal Board of Vocational Education was initially responsible for
the studies, investigations, and reports related to vocational education.
The formation of a separate board of education might have had another purpose.
Hayward and Benson (1993) wrote that, “The Smith-Hughes Act was restrictive to students in
federally funded vocational-technical education courses, perhaps to protect practical instructional
programs from being dominated by the academic elite” (p. 6).
The Smith-Hughes Act came into Congress 1914 and was debated for 3 years until
finally being signed into law on February 23,1917 by President Woodrow Wilson, ensuring
federal aid to vocational education at the secondary level (Smith, 1999).
During this time, another document, the Cardinal Principles of Secondary Education was
4
produced by the Commission on the Reorganization of Secondary Education (CRSE), a group
that came together to discuss education as a medium to hold the country together. This document
was used to reform secondary education in the United States. The cardinal principals supported
the Smith-Hughes Act in terms of the act’s educational purposes. The reform was needed at this
time because the United States was experiencing a large influx of immigration from the unrest in
Europe, and this immigration continued for many years after World War I. Although separate but
equal treatment of racial and ethnic minorities was acceptable, there were competitive economic
systems, such as socialism, communism, and capitalism, which were all vying for the interest of
the population. Yet at the time, only one-third of students went to high school and less than five
percent completed high school and went on to college (Department of the Interior, 1918).
Clearly, something was not working in public schools for secondary education students.
In 1918, when the CRSE released the Cardinal Principles of Secondary Education, “The report
indeed endorsed the comprehensive high school, called for flexible programs to accommodate
changing student interests, embraced traditional subjects but re-conceptualized subject matter to
be more practical than the prevailing memoriter instruction allowed, and even employed some
social efficiency-type language” (Wraga, 1999, p. 7). To put it in layman’s terms, the Cardinal
Principles of Secondary Education were intended to drive education in a direction other than just
the academic, instead encouraging education of the whole student in health, command of
fundamental processes, worthy home membership, vocation education, civic education, worthy
use of leisure, and ethical character. To be a functioning member of society, many individuals
needed to learn skills or a trade, as seen in one of the following Cardinal Principles of Secondary
Education:
4. Vocation -Vocational education should equip the individual to secure a livelihood for himself and those dependent on him, to serve society well through his vocation, to

5
maintain the right relationships toward his fellow workers and society, and, as far as possible, to find in that vocation his own best development. This ideal demands that the pupil explore his own capacities and aptitudes, and make a survey of the world's work, to the end that he may select his vocation wisely. Hence, an effective program of vocational guidance in the secondary school is essential.
Vocational education should aim to develop an appreciation of the significance of them chosen vocation to the community, and a clear conception of right relationships between the members of the chosen vocation, between different vocational groups, between employer and employee, and between producer and consumer. These aspects of vocational education, heretofore neglected, demand emphatic attention.
The extent to which the secondary school should offer training for a specific vocation depends upon the vocation, the facilities that the school can acquire; and the opportunity that the pupil may have to obtain such training later. To obtain satisfactory results those proficient in that vocation should be employed as instructors and the actual conditions of the vocation should be utilized, either within the high school or in cooperation with the home, farm, shop, or office. Much of the pupil's time will be required to produce such efficiency. (Department of the Interior, 1918, p. 13) The Smith-Hughes Act echoed the Cardinal Principles of Secondary Education.
Vocations at the time of the Cardinal Principles of Secondary Education followed a
stipulation of the Smith-Hughes Act: if a student received federal funding and time spent in
vocational classes, “The Federal Vocational Board was quickly able to extend the control of
students' time to what came to be known as the 50-25-25 rule: 50 per cent time in shop work;
twenty-five per cent in closely related subjects, and twenty-five per cent in academic course”
(Hayward & Benson, 1993, p. 7). This time allocation (i.e., the 50-25-25 rule) in some ways
segregated the academic and vocational students. The segregation of intelligence at this time in
U.S. history was directly related to a social science “eugenics,” a prominent and popular social
science at the time; one principle of eugenics stated that the shape of the head or the size of the
brain determined intelligence, hence dividing certain groups, races, and genders and giving rise
to the idea that certain individuals would be more suited to a vocational, rather than an academic,
track.
The segregation was amplified not only because of the time restriction, but also because
6
of the population that was enrolled in the vocational studies. When immigration spiked during
and after World War I, Congress passed the Emergency Quota act of 1921 to stop the influx of
immigration from southern and eastern Europe. At the time of the Vocational Studies Act and the
release of the Cardinal Principles of Secondary Education, the predominant influx of immigrants
included Italians, Greeks, and Polish. Although many immigrants arrived with vocational skills
from their original countries, they were unacquainted with the technologies that the United States
used in its factories, such as machinery for farming. Thus, vocational education was one method
of ensuring that the immigrants became active members of American society, both economically
and socio-civically.
Another immigration act, the Johnson-Reed Act, was passed in 1924. This act also
attempted to limit the number of immigrants allowed into the country by using a quota system
similar to the 1921 Emergency Quota Act, where a percentage of immigrants from a certain
country or region was allowed to immigrate based on the current regional population already
present in the United States.
Also in 1924, Edward Thorndike, a prominent American psychologist, finished and
published Mental Disciplines in High School Studies. This study consisted of a pre- and post-
intelligence test given to nearly 8,564 pupils after completion of a specific course of study to see
if that specific course increased the intelligence of the students. It was determined that little to no
change occurred in the IQ of students who took Latin, geometry, chemistry, and history when
compared with students who took arithmetic, bookkeeping, cooking, or sewing. Thorndike
revisited his study, and in 1927, he published A Second Study of Mental Disciplines in High
School Studies, which was similar in nature; however, this time, Thorndike studied a group
heading for specific classes because it was nearly impossible in the first study to compare one

7
course of study to another. In the second study, Thorndike used approximately 5,000 pupils for a
total number of 13,000 students. Thanks to Thorndike’s study, the segregation of intelligence
that the Smith-Hughes Act fostered with the 50-25-25 rule was no longer relevant because
Thorndike showed that specific academic rigor did not increase IQ and that the trades actually
resulted in more transfer of learning than subjects such as Latin.
After Thorndike’s second study was published, the eight-year study began. The eight-
year study, also known as the thirty school study, was conducted by the Progressive Education
Association from 1930–1940. The grounds for the study were driven by the government’s for
educational reform based on the fact that for the “six who enter the high school only three
graduate; of the three who graduate, only one goes on to college” (Aikin, 1942, p. 3).
The eight-year study used 30 experimental schools, each of which developed different
curriculums through a democratic process among the school’s principals, teachers, and students.
Finally, the schools could recreate the curriculum to fit their ideology, “We are free from outside
domination; no one telling us what we must do. We shall recreate our schools” (Aikin, 1942, p.
25). While schools developed their different curriculums, during this time, there were three
schools of thought about how knowledge is obtained: knowledge as a structured discipline (i.e.,
mental discipline), knowledge as a personal experience (i.e., Piaget theory of intellectual
development), and knowledge as fusion. Regardless of how the experimental schools structured
the curriculum, there seemed to be no difference in the students’ college readiness: “Departures
from the prescribed pattern of subjects and units did not lessen the students’ readiness for the
responsibilities of college” (Aikin, 1942, p. 118). In fact, “the graduates of the most experimental
schools were strikingly more successful than their matches” (Aikin, 1942, p. 113) in collegiate
standards. This is because the facilitators of the study knew that they needed to map out a

8
stronger curriculum; they also realized that not only did national and international forces shape
education, but so did the local community and school culture.
The study’s final report showed that the curriculum in secondary education was disconnected
from the students. Aikin (1942) exposed exactly what a high school diploma had become:
High school diploma meant only that the student had done whatever was necessary
to accumulate the required number of units. Graduation from high school found most
boys and girls without long range purpose, without vocational preparation,
without that discipline which comes through self direction and without having
discovered for themselves something which gave meaning to living. (p. 10)
There is a common trend that was found by the multiple scientific investigations on the
curriculum used in education. The researchers of the eight-year study doubted that success in
college depended on the study of certain subjects for a certain length of time. Both of
Thorndike’s studies proved that mental discipline was a fallacy and that prescribed courses did
not increase the IQ of student. Looking at the results from the above studies, the initial
segregation of the vocational curriculum because of the 50-25-25 rule mandated by the Smith-
Hughes Act was more accepted because of the era, but the upcoming decades revived the fear of
the initial vocational act: the academic elite were driving education. “Nevertheless, the effort to
bring the modern and career-oriented studies into an honorable place in the school curriculum
has been a continuing struggle” (Tanner & Tanner, 2007, p. 46).
Table 1 Major Events and Legislation Shaping Vocational Education in the United States
YEAR Major Events and Legislation
1910s Vocational Education Act signed into law (1917) The United States entered World War 1 (1917)

9
World War 1 ends (1918) The Cardinal Principles written (1918)
1920s Immigration quotas set because of an influx of immigrants from Europe (1921 and 1924) Thorndike published first study on mental discipline (1924) Broyler, Thorndike, & Woodyard, published second study on mental discipline (1927)
1930s The Great Depression Eight-year study began and lasted for 10 years Pinnacle of progressive education
1940s Economy rebounds due to WWII The United States entered WWII in 1941, and the war ended in 1945 GI bill enacted Baby boom occurred
1950s McCarthyism, the second red scare and the shift from progressive education back to essentialism. Vocational education acts and funding remained relatively the same as its induction in 1917 Brown vs. BOE (1954) Sputnik launched into orbit, causes the focus of education, to shift to predominantly math and science because for the first time, the United States realized it was behind other countries (1957)
1960s The Great Migration (1960) Vocational Act of 1963, which essentially gave money to expand the influence over state vocational programs and focused on the poor and handicapped The Immigration and Naturalization Act of 1965, which removed quotas from 1921-1924 Amendments to vocational education: work-study, co-op education, and exemplar programs introduced (1968)
1970s Decline in industry, spike in unemployment Amendments written to improve planning, improve programs, and reverse sex role stereotypes (1976) The National Assessment of Vocational Education (NAVE) authorized by the 1976 amendments, which was designed to draw attention to the ambiguous provisions of the federal legislation; the federal government's attempt to do too much with too little; and the underrepresentation of disadvantaged populations in programs offering a strong possibility for career employment (U.S. DOE major reforms, p. 6) Vocational stigma arose

10
1980s A Nation at Risk is published; this document shifted educational focus and revitalized mental discipline (1983) Perkins Act of 1984: “This act placed more emphasis than earlier legislation on access, program improvement, cooperation between the public and private sectors, advanced technology and training, and retraining and upgrading of workers” (Hayward & Benson, 1993, p. 7).
Note. Information of Major Events and Legislation Shaping Vocational Education in the United
States was complied from Danzer (2007), Tanner and Tanner (2007), & Hayward and Benson
(1993).
Although the Perkins Act began to put a focus on and provide federal funding to
vocational education, the introduction of minimum course requirements following the release of
a federal report called A Nation at Risk caused the public school policy to move away from
vocational studies (Lillard & DeCicca, 2001). The minimum course requirements were
reminiscent of those propagated by supporters of the mental discipline theory. In less than 100
years, education had circled back around to a preferred set of courses. Most of what had been
learned about the importance of vocational education in the previous decades had been
overwritten. The predominant policy prescribed a fixed set of academic courses that would
benefit all students because these courses would increase the students’ intelligence. This thinking
is contrary to what Thorndike and the results from the eight-year study showed. The minimum
course requirements did not follow any of the objectives of the Cardinal Principles, and the
schools also disconnected the curriculum from the students, which had been one reason for the
eight-year study in the first place.
This cyclical return to early twentieth-century theories of education can be seen in the
current minimum course requirements and the academic time requirements, which has had the
strongest negative effect on vocational programs. As of 2016 in New Jersey, the prescribed
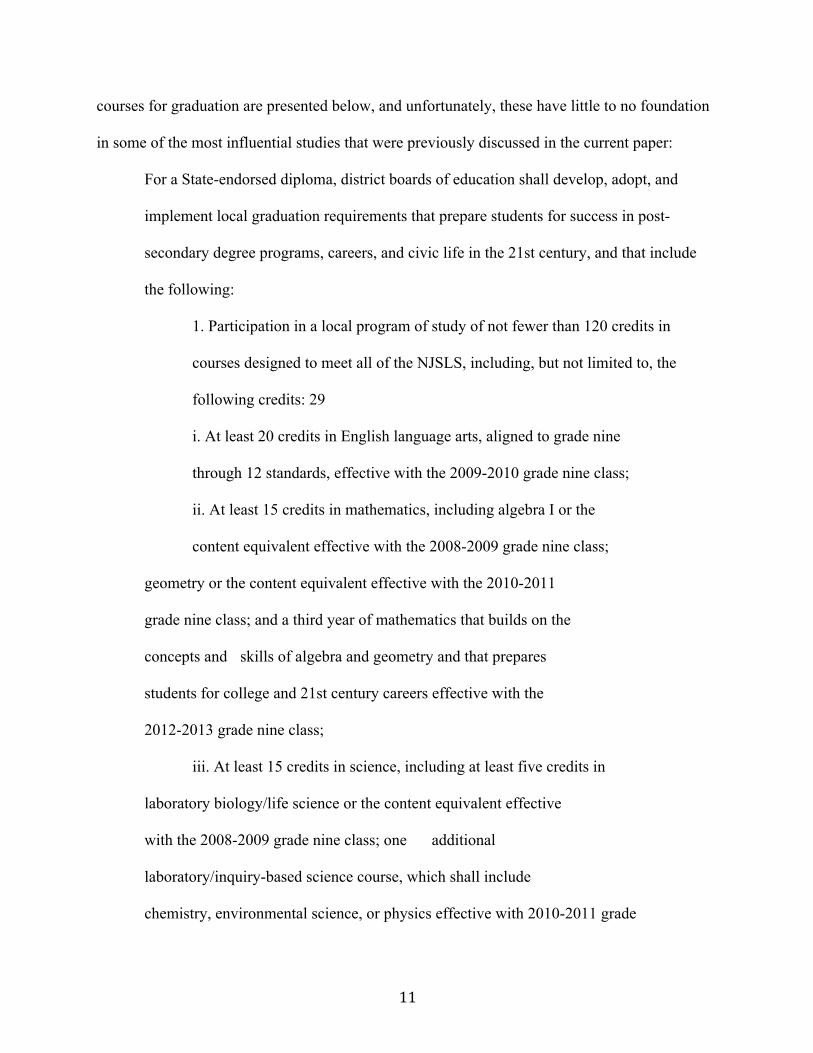
11
courses for graduation are presented below, and unfortunately, these have little to no foundation
in some of the most influential studies that were previously discussed in the current paper:
For a State-endorsed diploma, district boards of education shall develop, adopt, and
implement local graduation requirements that prepare students for success in post-
secondary degree programs, careers, and civic life in the 21st century, and that include
the following:
1. Participation in a local program of study of not fewer than 120 credits in
courses designed to meet all of the NJSLS, including, but not limited to, the
following credits: 29
i. At least 20 credits in English language arts, aligned to grade nine
through 12 standards, effective with the 2009-2010 grade nine class;
ii. At least 15 credits in mathematics, including algebra I or the
content equivalent effective with the 2008-2009 grade nine class;
geometry or the content equivalent effective with the 2010-2011
grade nine class; and a third year of mathematics that builds on the
concepts and skills of algebra and geometry and that prepares
students for college and 21st century careers effective with the
2012-2013 grade nine class;
iii. At least 15 credits in science, including at least five credits in
laboratory biology/life science or the content equivalent effective
with the 2008-2009 grade nine class; one additional
laboratory/inquiry-based science course, which shall include
chemistry, environmental science, or physics effective with 2010-2011 grade

12
nine class; and one additional laboratory/inquiry-based science course
effective with 2012-2013 grade nine class;
iv. At least 15 credits in social studies, including satisfaction of N.J.S.A.
18A:35-1 and 2; five credits in world history; and the integration of civics,
economics, geography and global content in all course offerings;
v. At least 2.5 credits in financial, economic, business, and entrepreneurial
literacy, effective with 2010-2011 grade nine class;
vi. At least 3 ¾ credits in health, safety, and physical education during each
year of enrollment, distributed as 150 minutes per week, as required by
N.J.S.A. 18A:35-5, 7 and 8;
vii. At least five credits in visual and performing arts;
viii. At least five credits in world languages or student demonstration of
proficiency as set forth in (a)2ii(2) below; 30
ix. Technological literacy, consistent with the NJSLS, integrated throughout
the curriculum; and
x. At least five credits in 21st century life and careers, or career-technical
education. (NJDOE, n.d., p. 28)
As the state of New Jersey mandates 120 credits to receive a high school diploma 105 of
them are mandated by the state only allowing for 15 credits worth of electives or intrest classes.
These minimum course requirements beginning in the early nineteen nineties may have lead to
many school boards removing their vocational programs. Although many school leaders have
terminated or modified their high school vocational programs in New Jersey, the reason for

13
doing this varies from district to district. In general, the academic time requirements have had the
strongest negative effect on the vocational programs.
Problem Statement
School administrators in New Jersey are tasked with improving school-level achievement,
maintaining elevated levels of school attendance, and keeping students disciplined. Vocational
education programs have a demonstrated track record of improving school-level achievement,
attendance, and discipline for more students (e.g., Aikin, 1942; Thorndike, 1924), yet vocational
offerings in New Jersey public high schools have decreased over the last 30 years. Little
quantitative research exists since the time of A Nation at Risk regarding the influence of
vocational course offerings on school-level achievement, mobility, attendance, and discipline.
Purpose of Study
The current non-experimental, longitudinal, and explanatory study is retrospective in
nature, aiming to determine the association between student mobility, attendance, school-level
achievement, and suspension in schools that serve students in lower socioeconomic communities
when a vocational program is suspended or significantly modified. The data come from a time
period prior to the transformation of many vocational programs into highly specialized academic
academies, hence offering insights into potential trends that were beginning to emerge in
vocational education programs at the time.
Research Questions
1) What is the association between the removal of vocational programing and the rate of
student mobility over time?
2) What is the association between the removal of vocational programing and the student
attendance rate over time?
14
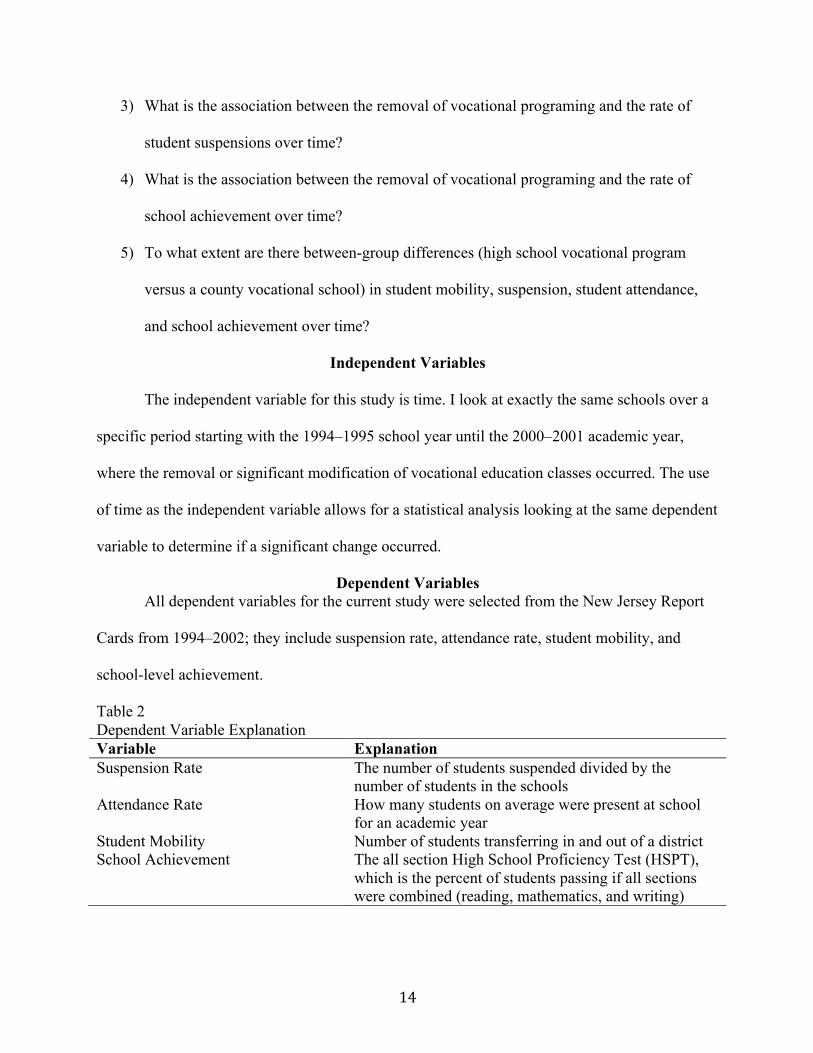
3) What is the association between the removal of vocational programing and the rate of
student suspensions over time?
4) What is the association between the removal of vocational programing and the rate of
school achievement over time?
5) To what extent are there between-group differences (high school vocational program
versus a county vocational school) in student mobility, suspension, student attendance,
and school achievement over time?
Independent Variables
The independent variable for this study is time. I look at exactly the same schools over a
specific period starting with the 1994–1995 school year until the 2000–2001 academic year,
where the removal or significant modification of vocational education classes occurred. The use
of time as the independent variable allows for a statistical analysis looking at the same dependent
variable to determine if a significant change occurred.
Dependent Variables All dependent variables for the current study were selected from the New Jersey Report
Cards from 1994–2002; they include suspension rate, attendance rate, student mobility, and
school-level achievement.
Table 2 Dependent Variable Explanation Variable Explanation Suspension Rate The number of students suspended divided by the
number of students in the schools Attendance Rate How many students on average were present at school
for an academic year Student Mobility Number of students transferring in and out of a district School Achievement The all section High School Proficiency Test (HSPT),
which is the percent of students passing if all sections were combined (reading, mathematics, and writing)

15
Null Hypotheses
HO: There is no difference in the suspension rate, attendance rate, student mobility, and
school-level achievement regarding the HSPT before and after the vocational education program
was collapsed or significantly modified in an A, B, or CD District Factor Group (DFG) School.
Significance of the Study
In many countries of varying gross domestic products, a dual system of education is
prevalent, and the literature discusses the importance of this type of education not only to meet
the demands of the country’s workforce, but also to foster the value of education throughout a
student’s life. Active participation in their own learning leads students to connecting class
content to the skills and knowledge needed in life, such as for problem-solving skills, giving
students life skills to become functional members of society. The educational history of the
United States shows the need for vocational training as an integral part of the educational
framework, with the eight-year study and Cardinal Principals outlining the relevance and
importance of vocations in secondary education. Yet although the United States had a strong
vocational education system, the political and educational landscape changed, causing vocational
education to disappear from American education. Vocational education has also been declining
in the literature since the groundbreaking studies that occurred in the 1920’s – 1930’s.

16
Figure 1. Google Ngram viewer *Google Ngram viewer only plots how often the words are used in published books and can
show a decline of a certain topic in the literature (Google Ngram viewer, 2018).
In the United States, vocational education is a post-secondary degree, predominantly run
by for-profit schools. Students enter the post-secondary school never having experienced any of
the fields or options and blindly choose the trade that they feel may be the best fit. An article by
Krupnick (2017) discussed how secondary education has been pushing bachelor’s degrees for
over two decades now. In California, finally, secondary education is realizing that there is value
in the trades, and with such a shortage of workers in the trades, millions of dollars are being put
back to revitalize vocational education. “Now California is spending $6 million on a campaign to
revive the reputation of vocational education, and $200 million to improve the delivery of it”
(Krupnick, 2017). The rest of the article showed federal figures, how local community colleges
are teaming up with high schools to give students more choices, and the perceptions of the trades
by students and teachers; the article aided in the significance of the current dissertation by
showing that states are beginning to see the value in vocational education, as well as by
discussing how policy and practice are beginning to change in the state of California. Still there
is a lack of quantitative and exploratory literature on the subject. Thus, the current longitudinal
explanatory historical study uses a repeated measures ANOVA to assess changes over time.

17
Although the data used in the current study are nearly two decades old, the data being
used come from the beginning of the standardization movement in New Jersey. No longer was it
the choice of the student to determine what subjects fit them: they were now forced into a mold,
(i.e., the return to mental discipline). The data set, similar to a medical study, has information
before, during, and after the adaptions of vocational education, which is valuable in explaining
vocational education’s association to school-level variables. Thus, the time period used in the
current study is an excellent framework because many constants, such as how the data was
calculated, the same achievement tool (HSPT) was used, and the data was reported and stored to
the NJDOE.
Currently, a vocational program at the secondary level seldom functions to the capacity
intended when the progressive movement (1900s–1940s) dominated the educational landscape,
even at county vocational schools. If the current study shows that a significant change in the
outcomes occurred when the vocational education program was removed or modified, then it is
up to other researchers and policy makers to further analyze vocational education and potentially
discover its potential as a valuable and equal education route for students. Policies should allow
for students to easily choose that route by removing the minimum course requirements. The
current New Jersey minimum course requirements outline the prescribed number of courses
required to graduate. Out of the 120 credits needed to graduate, 105 are required, leaving only 15
credits of electives for a student to take, which amounts to just three classes. Yet those remaining
15 credits normally are used for meeting higher education requirements. Finally, the research
should be reported to policy makers as another source of knowledge to ensure informed
decisions are being made regarding the current model used to obtain a high school diploma.
Limitations

18
The current study is non-experimental and explanatory in nature because of the difficulty
of actually producing an experimental design in a school setting. There are other factors that can
influence the results, but they are not being considered because of changes in definitions,
reporting requirements, or to the accountability system, such as (a) dropout rate, (b) introduction
of the New Jersey Core Curriculum Standards, and (c) the exact date of the removal of the
vocational education program. Because there is no record of when a school modified or removed
vocational education, the research relies on individual’s memories of when vocational education
was removed or modified, hence the timeline of 1994–2001, which was the aggregate from the
information received.
Delimitations
The data were limited to public, secondary institutions in the state of New Jersey. The lack of
available school report cards from the NJDOE before the 1994–1995 school year only allowed
the use of a time frame of 7 years of student variables. Using schools with low Socio Economic
Status (SES). (DFG’s: A, B, and CD).
Definitions of Terms
• Industrial arts: as defined by Merriam-Webster is, “a subject taught in elementary and
secondary schools that aims at developing manual skill and familiarity with tools and
machines.” (Industrial Arts, n.d.)
• Vocational education: as defined by Merriam Webster 1: of, relating to, or concerned
with an occupation <vocational opportunities> 2: relating to or providing training in a
skill or trade to be pursued as a career <a vocational school> (Vocational Education, n.d.)
• NJDOE: New Jersey Department of Education

19
• District factor group (DFG): is an indicator of the socioeconomic status of citizens in
each district and has been useful for the comparative reporting of test results from New
Jersey's statewide testing programs (District Factor Groups (DFG) for School Districts,
2018). The letters range from A (lowest SES) to J (high SES).
• Student mobility: is the percentage of students who both entered and left during the
school year. The calculation is derived from the sum of students entering and leaving
after the October enrollment count divided by the total enrollment. (Department of
Education - DOE Archives, 2018)
• Suspension rate: is the percentage of students who were suspended at least once during
the school year. Students suspended more than one time are counted once. The
percentages are calculated by dividing the total number suspended by the total
enrollment. (Department of Education - DOE Archives, 2018)
• Attendance rate: are the grade-level percentages of students on average who are present
at school each day; these are calculated by dividing the sum of days present in each grade
level by the sum of possible days present for all students in each grade. The school and
state totals are calculated by the sum of days present in all applicable grade levels divided
by the total possible days present for all students. (Department of Education - DOE
Archives, 2018)
• School achievement: all sections of HSPT, which is the percent passing if all sections
were combined (reading, mathematics, and writing).
Organization of the Study Chapter 1 highlights the major events and legislation that affected vocational education,
including, but not limited to, key figures, studies, and world and federal events. The chapter’s
summation of vocational education is required to understand who, what, where, why, when, and

20
how vocational education grew, changed, and eventually left the educational stage. I have sought
to paint a picture of vocational education in the United States.
Chapter II includes a more in-depth view of how the outside political structure affected
vocational education. The reviewed literature also looks at how other countries view vocational
education to show the significance of vocational education needs. The reviewed literature also
looks at how curriculum design and educational theories of learning (active learning) affect
students in education.
Chapter III explains the study’s design. The data collected for student variables, mobility,
suspension rates, and attendance were retrieved via the school report card from the New Jersey
Department of Education.
Chapter IV presents the results of the repeated measures ANOVA tests, and Chapter V
contains a detailed discussion of the statistical findings and how the data can be used for policies
at the state, district, and school level.

21
Chapter II
Review of Literature
Introduction
The purpose of the current study is to investigate if vocational education can be
associated with specific student variables when it was in place and later removed or modified.
This literature review will first look at each decade individually and the specific factors that
affected vocational education; this historical review was completed through a variety of texts:
academic journals that were peer reviewed, governmental publications of the topics, textbooks,
and books. The second part will look at empirical studies that have been conducted on the
variables included in the current quantitative study (e.g., student mobility, attendance, and
suspension rates). The third part will look at an overview of studies done on vocational education
in other countries, with a word of caution that these studies cannot truly be compared to the
American system of education because they come from many developing countries or countries
whose education system differs too greatly to make a fair comparison. Finally, the literature
review will analyze the educational theories of why vocational education has meaning. The
literature will also show the cyclic nature of education, moving from and then returning to a
prescribed curriculum, which has been shown not to benefit the child.
Literature Search Procedures I followed the guidelines adapted from Boote and Beile (2005) for literature reviews. I chose and
accessed peer-reviewed literature through the SHU search function in the Seton Hall Library
database, which contains online databases, including ERIC, JSTOR, EBSCOhost, and more,
along with published literature in the form of textbooks and books. Each variable was
individually searched and with a combination using the advanced search of vocational education,

22
student mobility, student engagement, and suspensions. The reviewed literature includes
governmental reports, amendments, and experimental and quasi-experimental studies.
Inclusion Criteria
The research in this literature review was included using the following criteria:
1) Studies that were either exploratory, experimental, or quasi-experiential and used
quantitative methods
2) Peer-reviewed research, including dissertations and government reports
3) Textbooks and books published on the topic of vocational education
4) Studies that focused on student mobility, attendance, suspension, and vocational
education
5) Studies that examined the influence of SES and vocational education
6) Studies that examined minimum course requirements
7) Classic and recent literature on vocational education
8) State and national legislation on vocational education
9) Studies on learning theories
History of Vocational Education in the United States in Decade Intervals
An in-depth discussion of the landscape of the nation and its educational policies (i.e.,
mental discipline, progressive movement, McCarthyism, the great migration, President Johnsons’
change in immigration, Mariel boatlift, and Nation at Risk) show why there is a cyclic nature to
educational policies in the United States. This information leads to a strong historical perspective
and, ultimately, a deep understanding as to why vocational education is important. In the words
of George Santayana (1980), “Those who cannot remember the past are condemned to repeat it.”

23
The Vocational Education Act of 1917, also known as the Smith-Hughes Act, was the
Magna Carta of vocational education. Yet the debate about how vocational education fits into the
American public education system actually stemmed from Germany’s vocational education
model. Therefore, in the original Vocational Act of 1917, there was a push for vocational
education to remain separate from the general public school systems. Wirth (1974) argued that
the rise of vocational education occurred after the overproduction of goods in the United States
after the civil war and depression of 1893. Many manufacturers went overseas to get into new
markets but were constantly outperformed by the German businessmen already there. The
American businessmen went to Germany to learn why this was occurring, and they found that
the German model had 21 different schools for the preparation of trades in Germany, all of
which were run by the Ministry of Commerce rather than the education sector. Thus, many
American manufacturers felt that the German model must be adopted in the United States. The
major players who pushed for this movement were David Snedden and Charles Prosser, who
produced the technocratic model: which, in laymen terms, was training based on behavior as a
stimulus and response and curriculum design being dictated by current industry standards.
It is important to look at the social forces at work during this time. New social sciences
were emerging, and one new pseudoscience, social Darwinism, was in vogue. Social Darwinism
states that social status and financial prowess dictate status, which is an inaccurate scientific
interpretation of the “survival of the fittest theory” used to drive the needs of the few. Yet
Snedden and Prosser deemed that in society, there were leaders and those that would do as they
were told. Snedden viewed junior high school, which first appeared in the U.S. education
landscape in 1909, as the medium to sort the students into differentiated courses (Wirth, 1974).

24
Snedden went on to appoint Prosser to develop a system of vocational schools, which
Prosser completed in 1912. Many parallels of Prosser’s model were written into the Vocational
Education Act of 1917. For example, the individuals doing the training (the teachers) must have
mastered the occupation. Traditional education had to be kept separate, and the theories had to be
in line with Thorndike’s “all habitats of doing and thinking are developed in specific situations.”
Because Prosser’s work set the stage for vocation education in the United States, he was
rewarded by being appointed the executive director of the Federal Board of Vocational
Education (Corson, 1988).
Hayward and Benson (1993) discussed the unregulated system of vocational education,
showing that the common standards from one district to the next or one state to another varied
greatly. The vocational education system was not conducive to students moving onto post-
secondary education settings because there were no benchmarks that were followed, unlike its
traditional counterpart. “In sum, vocational-technical education programs in the United States
lack standards for skill development fail to have coherent, uniform curricula and are unable to
systematically assess the proficiency of program completers” (p. 3).
The Vocational Educational Act of 1917 resulted in a stratification and separation of the
student population because of its fostering a dual educational system in the United States, even if
the education took place in the same school building. At the time, the comprehensive high
schools were either producing academics or individuals preparing to enter the workforce. This
duality in education was only magnified by the nation’s landscape with pseudo-sciences such as
social Darwinism in vogue and increased immigration caused by the volatile unrest in Europe.
Yet during the inaugural years of vocational education in the United States, a strong
workforce was produced in accordance with Thorndike’s theory of the nature of the learner.

25
During this era, education was geared toward the individual instead of a specific prescription of
classes, where the needs of many students can be overlooked. It was the era of progressivism, yet
it did not last long after the induction of vocational education.
The political progressive era in the United States (1890–1920) was a time when the idea
of giving control back to the people was popular, taking forms such as breaking big businesses
and trusts, conservation in the forms of national parks, and giving the poor guy from a farm a
chance, seen in the sixteenth through nineteenth amendments. Two presidents were instrumental
in taking this social movement into the political arena: Theodore Roosevelt and William Taft.
These new political ideologies carried over into education because education was about growth,
molding students into people who would be worthy, participating members of society.
“Secondary education should be determined by the needs of the society to be served, the
character of the individuals to be educated, and the knowledge of the educational theory and
practice available” (Department of the Interior, 1918, p. 7).
Yet some educational theorists did not like the direction education was going, and one
individual had a different theory of vocational education. John Dewey (1916/2009) stated in his
book Democracy and Education that, “Any scheme for vocational education which takes its
point of departure from the industrial regime that now exists, is likely to assume and to
perpetuate its divisions and weaknesses, and thus become an instrument in accomplishing the
feudal dogma of social predestination” (p. 543). Thus, educating individuals in vocational
education only solidified a dual system. Vocational education was very different than the current
trade model in which industry drives what needs to be learned. Dewey wrote that education
should be all encompassing; although vocations are needed, he believed that the industrial model
would cause education to change drastically. Even a machinist wanting to learn how to work new

26
technologies needs to be well versed in a variety of subjects that make up the trade to give
meaning to the work. “Industry has ceased to be essentially an empirical rule of thumb procedure,
handed down by custom. Its technique is now technological: that's is to say, based upon
machinery resulting from discoveries in mathematics, physics, chemistry, bacteriology etc.”
(Dewey, 1916/2009, p. 536).
Like Dewey, many in the progressive movement disagreed with social Darwinism, which
contended that a person was either a follower or leader depending on his or her heredity.
However, the progressive idea fell out of favor when the United States became involved in
World War I. After the war, the federal government enacted numerous laws, especially during
President Harding’s term, termed the return to normalcy, which put America’s interests first, as
follows:
America's present need is not heroics, but healing; not nostrums, but normalcy; not
revolution, but restoration; not agitation, but adjustment; not surgery, but serenity; not
the dramatic, but the dispassionate; not experiment, but equipoise; not submergence in
internationality, but sustainment in triumphant nationality.... (Freidel & Sidey, 2017)
Vocational education was one method that was used to ensure that the immigrants
became active members of American society, both economically and socio-civically. During the
1920s, progressive education was still at the forefront, and education was becoming increasingly
more scientific in nature. Multiple studies and ideas emerged, such as Thorndike’s studies on
mental discipline (1924, 1927). Education became the medium to nationalize a population
around the tenets of democracy.
In the next decade, the 1930s, the United States entered the Great Depression, and
education attendance decreased . People no longer went to school en masse to better themselves

27
or learn a trade; during this time, people were in survival mode. Many schools closed because of
low enrollment, especially in the Midwest because the children had to return to the family farm.
The economy picked up in 1939 as the United States geared up for the next war. With
many policies, especially geared toward industry, a well-educated workforce was once again
required. For example, the U.S. trade policy went from “cash and carry,” or pay in cash and carry
goods away, to “lend lease,” in which the United States traded its goods and munitions for land
bases in Europe because the Allies could no longer pay for the goods. Then, in 1941, the United
states entered the war, which can be seen as the true beginning of the end of progressive
education in the United States. Despite this, World War II did produce a spike in vocational
education in another format: the GIs returning from war were no longer of grade-level age and
needed an education. The GI Bill was enacted so that returning GIs could use money to go to a
trade school, attend college, buy a farm, start a business, or buy a house.
At the end of the 1940s, the baby boom occurred. Like the influx of immigration, there
was a need for more schools as the population of the United States increased at a high rate due to
a variety of variables, such as low infant mortality rate due to modern medicine.
From a Harvard report in 1945, post-war America viewed the role of vocational
education in the context of a comprehensive high school. The Harvard report stated that one-
third of the students’ time should be spent in vocational education if they decide not to continue
their education after high school. So the dual system should not only be connected, but continue:
“The two sides of education should be thought of as connected, the special forever flowing out of
the general and forever returning and enriching it” (Tanner & Tanner, 2007, p. 322). The
Education for All American Youth (1944, revised 1952) book envisioned a model educational
system in which students in high school would have programs extending into grades 13 and 14

28
through a community college. Tanner and Tanner (2007) discussed the National Education
Association (NEA’s) Education for all American Youth, emphasizing that, “The time devoted to
vocational education would total one sixth in grade 10, one third in grade 11 and 13, and one half
in the community college, which would be administered integrally to the school district” (p. 322).
This was also the first time the high school curriculum was linked to a community college.
Although a strong curriculum and model were in place for vocational education in the United
States, the idea of a comprehensive high school was short-lived because of the Cold War and the
effect of fear on the entire country.
In the 1950s, new ideas, that diverted from the norm, were no longer tolerated in the
United States. The Russian communist threat grew stronger, and nationalism began to infiltrate
every aspect of the United States. During this time, mass hysteria of a foreign threat on American
values predominated, primarily because of a U.S. senator from Wisconsin: Joseph McCarthy.
Initially, McCarthyism was employed as a “gimmick” to get re-elected, yet the effects
snowballed and caused the second “red scare,” which was the fear of Russian ideology
infiltrating the American populace. Many court cases, or so-called “witch hunts,” were led by
Joseph McCarthy, one example being the actress Lucille Ball, who was put on trial for being a
member of the communist party because her late grandfather had been a member. Although in
American history, it is estimated that no more than 1% of the population at any time was ever a
member of the communist party, these fears ran deep in the American psyche. (Danzer, 2007)
Their effect on vocational education and education as a whole was unprecedented. Arthur Bestor,
a critic of American public education and a history professor at the University of Illinois, first
advocated a return to the liberal arts curriculum and mental discipline. He believed vocational
education “bred servile dependence,” saying that vocational education could be equated to

29
slavery and menial labor. Thus, Bestor advocated that vocational education should not occur
until the student was at least 17 years of age and that vocational classes should not be worth
credit (Tanner & Tanner, 2007, p. 323). Then, the launch of Sputnik initiated new educational
reform.
This reform focused predominantly on science and math so that the United States could
“catch up” to the Russians. Wernher von Braun, a former Nazi scientist, who is considered the
father of rocketry, spoke at a congressional hearing about how to reform the American
educational system. Von Braun stated that the United States should remove the “ballast” so that
those who could not succeed be “simply eliminated” from the school, meaning “the teachers of
these schools need not bother with the less gifted” (Tanner, 1982, p.608). Other well-known
scientists, such as Admiral Hyman Rickover, the father of the nuclear submarine, echoed this
similar survival of the fittest model at this meeting, which can be tied to social Darwinism.
Therefore, education became about efficiency, meaning the curriculum favored the needs of the
country, which was still in a wartime mentality. The scientific approach to educational theories,
the same approach that proved mental discipline to be false, began infiltrating education and
would truly be revived in the upcoming decades.
The 1960s brought the first new legislation on vocational education in half a century.
Although it echoed its 1917 counterpart, the Vocational Act of 1963 had certain differences.
After the Brown vs. Topeka Board of Education case in 1960, which ended legal segregation in
public schools, a large migration of African Americans into the northern cities from southern
states occurred and another communist revolution occurred only 90 miles from American soil:
the Cuban revolution, which caused the United States to see an influx of Cuban immigrants.
Thus this migration/immagration increased enrollment in vocational education, and these factors
30
played a role in the development of the Vocational Act of 1963, which was written after the
Secretary of Health, Education, and Welfare, Abraham A. Ribicoff, was tasked by President
Kennedy to assess the nation’s vocational educational acts. Ribicoff formed a panel and found
“that graduates of high school vocational programs are less likely to be unemployed than other
high school graduates, the vocational graduates do in fact work in the occupation for which they
prepare, and that vocational education increases their subsequent earning” (panel, 1963, p. xvi).
The panel said that the vocational programs were only serving 13% of the 15–19 age group”
(Tanner & Tanner, 2007, p. 326). These findings were the driving force of the Vocational Act of
1963. In the act, federal funds were to be used for the following conditions:
1) Extend, improve, and maintain vocational education programs for the handicapped,
socioeconomically disadvantaged, and women in male-dominated fields.
2) Use the money for data collection, program evaluation, and staffing.
3) Form a wide array of programs from industrial arts to home economics for adult
education.
The conditions for funding were a rough outline of what changed from the Vocational
Education Act of 1917 to the new 1963 act. Yet many said that for the states to receive federal
money, they had to standardize the courses and programs. Originally, the act of 1963 wanted to
remove many provisions of how the funding occurs, but a senator from Kentucky, Carl D.
Perkins, advocated for this act, ensuring that provisions from the Smith-Hughes Act remained.
Perkin’s hard work and dedication to vocational education was evident when a vocational
education act was named after him 20 years later.
Although the Vocational Act of 1963 was hailed, as a momentous act on vocational
education since the initial 1917 act, its outcome caused again more problems than solutions.

31
Similar to the original 1917 act, there was the desire for vocational education to remain separate
from academia, yet this separation was also the beginning of a stigma on those who attended
vocational schools or vocational programs: these students were considered on a lower
educational level than those in traditional educational settings.
After President John F. Kennedy’s assassination in November 1963, Lyndon B. Johnson
became president. During the transition, many changes occurred in the sense of work–study
programs replacing traditional vocational education. In the Economic Opportunity Act of 1964,
President Johnson funded neighborhood youth corps and job corps to aid disadvantaged youth
from the ages of 16–21, helping them find employment and training (McClure, Chrisman, &
Mock, 1985, p. 117).
Johnson also changed the laws of immigration. The Immigration and Naturalization Act
of 1965, also known as the Hart-Cellar Act, removed the old quota system in place from 1924
and 1928, causing a large influx of immigration from Central and South America. As this next
wave of American immigration occurred, there was already a lack of jobs due to new
technologies or lack of skilled workers, the federal money from the Vocational Education Act of
1963 perpetuated the idea of the dual system, as separate vocational schools were constructed
causing students to be segregated from their peers. The passage of this act caused unrest, much
the same as when the Vocational Act of 1917 passed. In 1968, an amendment to the act was
completed, establishing special programs at the post-secondary level.
The 1970s had the most prominent decline of vocational education, which came in part
because of decline in industry, an increase in academic snobbery, and the stigma of vocational
education. The decline in manufacturing caused the United States to see a large spike in
unemployment. Factories moved out of large cities, such as Detroit, and either moved overseas

32
to countries with less worker protections and lower pay or into rural areas where wages were
lower. The need for vocational training in high school no longer seemed necessary. An attack on
the comprehensive high school began with a Health, Education, and Welfare (HEW) task force
report on vocational education in high schools, which stated the following (McClure et al., 1985,
p. 123):
(1) Over half the vocational graduates did not take their first job within the area of their
training,
(2) The unemployment figures for high school vocational graduates were not
significantly different from those of non-vocational high school graduates.
(3) The unemployment figures were higher for high school vocational graduates than
for graduates of other vocational schools – junior college and post secondary programs,
(4) High school vocational curriculum was the most expensive form of education costing
50 percent to 75 percent more than any other high school curricula,
(5) The high school programs teach the older, established, and accepted jobs and skills.
Also, during this time, “academic snobbery” emerged, and “a negative stigma has come
to be attached to such terms as vocational and occupational education” (Tanner & Tanner, 2007,
p. 329). The stigma grew as certain occupations developed a social status and the people within
did not want to be grouped by specific term, such as “service worker.” For example, a newspaper
article called “Nurses as a Service Worker,” caused a nurse to write a letter to the editor of the
New York Times Magazine in 1973, where she attempted to sum up the status of the occupation:
“I had to train for three strenuous years in order to receive my registration.” (Tanner & Tanner,
2007, p. 330) She noted that in classifying her as a “service worker,” the author of the article had

33
“caused me distress,” and she ended her letter by stating that the author, “owes an apology to
nurses” (Tanner & Tanner, 2007, p. 330).
During this decade, two more amendments were made to the Vocational Education Act,
one in 1972 and the other in 1978. The amendment in 1972 included special programs for
disadvantaged individuals. In 1978, the Vocational Education Act added the community school
concept, as defined by the Institute for Educational Leadership, which is both a place and a set of
partnerships between the school and other community resources. Finally, a basic skills program
was included to increase students’ achievement in reading and mathematics.
In the 1980s, the United States educational views and theories seemed to revert to an
essentialist view of how to educate children. When a new, wider view of vocational education
appeared in the form of the Carl D. Perkins Vocational Education Act, it expanded and
modernized vocational education programs to meet the needs of a new workforce and promote
economic growth. Then, a single report by President Reagans’ National Commission on
Excellence in Education, known as A Nation at Risk, strongly affected the idea of vocational
education, as follows:
Demanded a curriculum focused on the “new basics” (the traditional academic
subjects, with increased emphasis on math and science plus computer literacy), along
with increased “standards” for high school graduation. Within 2 years after A Nation at
Risk, most of the states had responded by mandating increased units in academic subjects
for high school graduation (Tanner & Tanner, 2007, p. 331).
This new curriculum, especially that of increased units in academic subjects, would have a
profound effect on vocational and elective programs.

34
The increased academic units that came out of A Nation at Risk continued and grew in the
1990s. There were some attempts to keep vocational education, such as in the “two plus two
design,” where the junior and senior year in secondary education would be used to prepare
students for vocational training when they enrolled in a community post-secondary certification
program or tech-prep programs. County vocational schools began to appear; counties funded
only one vocational school as enrollment dropped in the secondary schools vocational programs
at the student’s home school. Yet even these county schools could not operate as originally
intended by the Perkins Act because of the high school exit exams given in over 25 states and
other standardized testing and basic skill requirements. With the advent of minimum course
requirements, many schools had to close or adapt their vocational programs. Even the county
vocational schools had to evolve. Although two more Perkins Acts appeared, the damage caused
by A Nation at Risk was irreversible to the point that federal funds began to go to “for-profit”
schools, which offered vocational programs after a student graduated from high school.
New Jersey School Report Card
The New Jersey School Report Card is an annual report that began around 1988 and contains
data on the school environment, student information, student performance indicators, staff
information, and district/charter financial data (Department of Education – DOE Archives,
2018). “The function of the New Jersey School Report Card is to increase school- and district-
level accountability for educational progress by communicating useful information to members
of the public to be used in measuring how well their schools are doing” (Gemellaro, 2012, p. 31).
The report card was used to obtain information pertaining to the current study, predominantly
from the historical archives, which date back from 1994–2002. Many changes in reporting
occurred after 2002, the NJDOE website makes clear: “There are some report card fields that

35
have been changed between 2001-02 and 2002-03 and, therefore, they will not be comparable in
the two databases” (NJDOE, 2011a).
Jacobson, Saultz, and Snyder (2013) discussed that the underlying purpose of a school
report card is to pressure schools to abide by the current educational landscape: “Current policies
that publicize performance information are based on the idea that schools, seeking to avoid this
public embarrassment, will behave in ways to improve outcomes and avoid negative
performance reports” (p. 65). School reporting began in the 1960s with the development of the
National Assessment of Educational Progress (NAEP), which reported on what students knew. In
the 1980s, the federal government ranked states by their SAT and ACT scores, and by the 1990s,
most states developed their own report cards (Jacobson et al., 2013). As discussed, the New
Jersey Department of Education’s report cards date back to 1994. Although changes to reporting
occurred in the early 2000s because of the No Child Left Behind (NCLB) act, they do not have
any bearing on the current study. The New Jersey Report Card archives had a vast amount of
data, which was difficult to sort through because of the variety of codes to determine county,
district, school, and so forth. Reference sheets were needed to decode the data overload.
Mobility/Attendance
Many studies have looked at student mobility and attendance factors on achievement
scores. Although the current study does not look at student achievement on standardized tests,
the definitions, theories, and factors that relate to mobility are useful to give context to what
affects student mobility and attendance.
One factor that affects school mobility is socio economic status. “Children are not equally
likely to experience high rates of mobility” (Malmgren & Gagnon, 2005, p. 301). Children who
are from non-English-speaking immigrant families, have a low SES, and are in “inner cities”

36
have a higher rate of mobility. Malmgren and Gagon’s (2005) study looked at emotionally
disturbed students receiving special education services. The breakdown was as follows: “The
sample was comprised of 37% (n = 26) African American, 51% (n = 36) Caucasian, and 11% (n
= 8) Hispanic youth” (Malmgren & Gagnon, 2005, p. 302). Malmgren and Gagnon used a
univariate repeated measures ANOVA, yet the results showed there was no significant difference
between the groups in the study when it came to mobility.
As reported by the U.S. Bureau of the Census (1997), between March 1996 and March
1997, over 43 million Americans, roughly 16.5% of the population, changed residences (Engec,
2006, p. 167). Mobility can be attributed to either academic or personal/family reasons (Engec,
2006). Mobility does have a direct effect on the receiving and leaving school districts. The
schools with high academic standards can have negative effects on students, such as discipline
issues or increased suspension rates or lower academic marks, in turn negatively affecting the
receiving school. Therefore, students who move during the school year have a higher suspension
rate. However, for the leaving district, the effect is positive because most students who have high
mobility come from low socioeconomic families. Engec (2006) wrote, “The U.S. General
Accounting Office (GAO, 1995) reported that 41% of highly mobile students in the United
States were low achievers, whereas 26% of students who never changed schools were low
achievers” (p. 168). Engec (2006) looked more at the effect of mobility on test scores and
determined that mobility had a negative effect on both variables. Although Engec’s study was
primarily on student mobility’s influence on school suspension rates, Wright (1999) determined
that mobility is not the main predictor of student achievement. By looking at 1,039 students from
a Kansas school district, Wright (1999) determined that mobility relies more on ethnic minority
status and low family income and that mobility is used as an excuse for low academic

37
achievement.
Suspension Rate
Recent statistics from the U.S. Department of Education website showed that of the 49
million students enrolled in public schools in 2011–2012, 3.5 million students were suspended in
school; 3.45 million students were suspended out of school; and 130,000 students were expelled.
It was determined that students with disabilities and of color were disproportionally affected by
suspension practices (U.S. Department of Education, 2016).
Suspension, either in school or out of school, is used as a disciplinary action in nearly every
school in the United States, and suspension rates can be connected to a variety of variables.
Looking at one study completed in the state of Wisconsin by Sullivan, Klingbeil, and Van
Norman (2013), 24,295 students in 51 schools during the 2009–2010 academic year had an
overall suspension rate of 7.79%. The results indicated that gender and race, predominantly black
and individuals with disabilities, had the highest rate of suspension: “20% and 19% of students,
respectively, were suspended during the 2009-2010 academic year” (Sullivan et al., 2013, p.
107). Another large longitudinal study done by Mendez (2003) looked at 8,268 students from
kindergarten through grade 12 in a school district in Pinellas County, Florida. Mendez (2003)
determined that suspension does not deter students from misbehavior, regardless of gender,
ethnicity, cognitive ability, and other factors. Yet because special education students are not
receiving the correct interventions in behavior, their suspension rate was more prominent. There
are an array of studies regarding teacher burnout (i.e., not having the emotional resources) and
hence teachers not using positive behavior strategies; this is discussed in a review titled “A
multivariate meta-analysis of student misbehavior and teacher burnout” (Aloe, Shisler, Norris,
Nickerson, & Rinker, 2014). Although there are many variables that lead to suspension, such as

38
demographics and climate, suspension has also been linked to dropout rates (Lee, Cornell,
Gregory, & Fan, 2011). Lee et al. (2011) determined that suspension does have a correlation with
dropout rates, regardless of ethnicity, even though white students have a greater chance of
dropping out if they have a high suspension rate when compared with black students. Here,
student engagement in a class also may lead to disciplinary issues that can lead to suspension. If
a student is forced to take a specific course, even though that student has no interest in it,
misbehavior is likely to occur. Although suspension is meant as a deterrent from future
disciplinary action, for some students, “being sent home is negative reinforcement, especially if
they escape from the boredom of school and into the stimulating world of videogames”
(Gregory, 2012, p. 207). Boredom, which occurs for many students on a regular basis can affect
academic outcomes and create discipline issues. Tze, Daniels, and Klassen (2016) used a meta-
analysis of over 29 studies that encompassed 19,052 students to determine the effects of
boredom on motivation, study strategies, behaviors, and performance; their study had an overall
influence, 𝑟=−.24, r2 = .0576, which was significant at p < .001 for each of the variables, such as
GPA, exam score, course grade, and so forth. The results show that boredom had a negative
consequence on the variables, implying that on the secondary level for school officials, “it is
important to design appropriate curriculum and learning contexts, and to provide quality
instruction that may help to alleviate this negative emotion” (Tze Et. al, 2016, p. 139). Thus,
mandated minimum course requirements are placing students in a situation where they are forced
to be in a class where they will become disengaged and bored, which in turn will lead to a variety
of issues.
Another study by Kanevsky and Keighley (2003) explored the factors that contribute to
the boredom of honor students who begin to disengage from classroom learning; Kanevsky and

39
Keighley (2003) interviewed 10 students from a Canadian school district; the students felt bored
and the “learning they sought had five interdependent features, five C's: control, choice,
challenge, complexity and caring” (p. 28). The students’ interviews showed how boredom can
lead to misbehavior. One student from the study stated, “Boredom in school is just sitting there
when the teacher is babbling, listening to lectures.... I'm bored sitting there twiddling my thumbs,
being a class clown, figuring out ways to stump the teacher.... It's agitating; it's frustrating to be
bored....” (Kanevsky & Keighley, 2003, p. 24).
Dropout Rate
Archambault, Janosz, Morizot, and Pagani (2009) studied 13,300 students, 5,958 boys,
and 7,372 girls from 69 different high schools in Quebec, Canada for 3 consecutive years in high
school, and during this time, the students reported their behavioral, emotional, and cognitive
engagement to school. The study was conducted using a questionnaire, which determined that,
“Students reporting low engagement or important decreasement in behavioral investment from
the beginning of high school presented higher risks of later dropout” (p. 408). However,
Archambault et al. (2009) concluded that, “efforts to sustain and nurture student values and
interest in school could thus promote both their behavioral compliance and an overall positive
school experience. These efforts may increase student chances of positive academic outcomes
and also favor their social-emotional well-being” (p. 413).
Rumberger (2011) discussed Finns’ models, two models that psychologist Jeremy Finn
proposed in 1989; frustration-self-esteem and participation-identification model. Looking
predominately at the participation – identification model, Rumberger stated (2011):
Finn labels the “participation- identification” model. In this model, the initial antecedent to withdrawal is the lack of participation in school activities (classroom participation, homework, and participation in the social, extracurricular, athletic, and governance aspects of the school), which in turn leads to poor school performance

40
and then to less identification (a sense of “belonging” and “valuing”) with school. Over time, the lack of identification with school leads to less participation, poorer school performance, less identification with school, and eventually drop-ping out of school. (p. 146) Rumberger (2011) also mentioned that many scholars have produced models to explain the
process of dropping out and the factors that may influence them. Rumberger (2011) believed that
dropping out is a process, not just a single event.
After assessing policies, Bishop and Mane (2005) completed a study using micro-data
that were collected by the National Educational Longitudinal Study of eighth graders, which was
completed in 1988, along with two follow-up studies of the participants at 2 and 8 years after
their scheduled graduation. Bishop and Mane (2005) looked predominately at the 40% of
students who would not seek any post-secondary education. Although the increase in graduation
requirements caused significantly fewer students to continue their education and obtain a
bachelor’s or associate’s degree, the increased course requirements did not lower the number of
students taking vocational courses: students took more. Bishop and Mane determined that their
“findings tend to support the emphasis on combining rigorous academic coursework with
specialization built around an occupational theme that characterizes the popular whole-school
reform models for American upper secondary education” (2005, p. 185). Non-college-bound
students ended up benefiting from the reforms because employers paid more for the students’
more rigorous coursework. The students gave up classes such as study halls to take more
academic courses and study harder. Although Bishop and Mane (2005) showed that increased
course requirements help vocational education, there are many studies that contradict this
finding.
The effects of minimum course requirements in the 1980s are reflected in Lillard and
DeCicca (2001), who used census data from 1980 and 1990 to determine that dropout students

41
aged 14–17 not enrolled in school or without a high school diploma faced significant
consequences. Higher course requirements to graduate high school greatly affected the increased
dropout rate. The state of New Jersey contended that minimum course requirements had no
effect on dropout rate, which is against Lillard and DeCicca’s (2001) study but agrees with the
findings of Bishop and Mane (2005).
Studies on Vocational Education
Segedin and Levin (2012) pointed out the vast differences between the United States’
vocational education programs compared with other nations. In many countries, (Finland, Japan,
etc.), students may be placed or tracked into vocational programs because of their SES, yet they
receive a vocation degree. On the other hand, the United States considers vocational education a
“post-secondary activity” (Segedin & Levin, 2012), mostly because of the lack of connection
between the schools and the labor market. Segedin and Levin (2012) also showed that most U.S.
graduates who take a vocational route are not financially comparable with students who take the
traditional route of education because of the lack of highly skilled individuals that work in
industry. Halpren (2012) discussed the shortcomings of vocations in secondary education, which
provides little vocational knowledge to students who enter the labor force after graduation. This
lack of knowledge comes from the school staff, who are ill-equipped to disseminate the
knowledge of careers and choices in careers and/or from the educators’ view that not attending
college is a negative (Halpren 2012). Vocational education has also been viewed as a way of
tracking individuals of color and preparing people for low-paying careers that don’t exist
anymore. Yet many countries track their students, by choosing their educational path or choice
dependent on academic achievement of standardized tests etc..

42
Kogan, Gebel, and Noelke (2012) looked at Central and Eastern European countries’
vocational curriculum in secondary education; the study consisted of reanalyzing previous data
using a vast number of experts who collected data from a variety of countries. Comparative
national data determined that most students enrolled in the vocational track came from a lower
economic status and had parents with a low educational background (Kogan et al., 2012).
However, students drop out of vocational programs as well. A study done by Tas, Selvitopu,
Bora, and Demirkaya (2013) was a qualitative analysis of 19 students who left their vocational
high schools without a diploma. The studnets fell into four categories: families, SES, curriculum,
or location of the school itself (Tas et al., 2013).
The United States’ view of vocational education and that of other countries differs
significantly. Thus, knowledge of a countries educational system is needed to understand the
above studies. Also, to frame a educational trend from an international perspective, one must
understand that education is a constantly evolving organism, and many facets of vocational
education must be revamped to be relevant in the current fast-paced and ever-changing society.
Thus constant and consistent revamping hopes to ensure vocational education is a relevant and
well-respected part of an educational culture. Vocational education internationally is already
viewed as a valuable and important aspect to education because it allows for a highly skilled
native workforce, stimulates the economy by creating jobs, and, most importantly, allows choice
so that all citizens can become valuable participants in society.
India, for example, understands the need for revamping vocational education. An article
by Kotamraju (2014) discussed that India is at the brink of becoming an economic powerhouse,
and for this to occur, “the country needs to alter its workforce education system by reengineering
the Indian Vocational Education and Training (VET) System” (p. 740).

43
The stigma of vocational education in many countries is that vocational education means
dumb, poor, or a last resort of education. Minhua (2015) summed up the stigma soundly: the
term “hooligans epitomizes the social stigma of vocational schooling in urban China today” (p.
109). China has attempted to reconcile this stigma, but the “inferiority of vocational schooling on
the education ladder persists as both public perception and objective reality” (Minhua, 2015, p.
109). These stigmas create constant barriers regarding curriculum, staffing, and approaches to
changing the belief that vocational education is a last resort for students who do not have the
right skills to go the traditional route. At one time, England had one of the most comprehensive
and productive vocational educational programs in the world. Yet changing attitudes toward
vocational education have shown the need for a revamping and better understanding that the
curriculum needs to be more up-to-date and relevant; yet without the support or so called “buy in”
by the youth of the country, many fear the vocational routes will never change (McCrone, 2014)
A perfect article that summarizes England’s heavy debates discussed that revamping vocational
education is long overdue because it is important to allow an alternate route for students who do
not wish to pursue a traditional education (McCrone, 2014).
Although the above studies often compared apples to oranges, few studies done in the
United States explained the influence of a vocational education program on students. Therefore,
a brief review of the literature and studies done in developing countries has been used to
highlight what is occurring in vocational training outside the United States. Most countries that
outperform the United States vary greatly in vocational schools and tracking methods of students.
(Segedin & Levin, 2012).
A stigma about vocational education has developed within the curriculum that many
states have adopted (Mulory, 2011). Mulory (2011) noted that Michigan State is looking at

44
producing a three-tiered graduation system with diplomas and sub-diplomas, yet this will be a
revisit of the 1970s when the dual system of lower education was viewed as subpar. Mulory
(2011) discussed Jay Bray, Executive Director of the Association for Career and Technical
Education, who said,
High schools... parents, and employers are beginning to realize that . . . to be competitive, our educational system needs to be more than academic theory . . .. They are realizing their needs to be more relevance to the workplace, to what students are interested in and to what the changing economy needs. (Mulroy, 2011, p. 664) The reason for discussing the above article was to reiterate the cyclical nature and stigma
that still is associated with vocational education. The hope is that the current study will
historically show that the loss of vocational education affected the students of New Jersey,
especially those in lower income areas.
Studies on a Prescribed Curriculum
Although vocational studies are mentioned, the state of New Jersey came up with a
prescribed curriculum for all students, regardless of interest or skill, which students must take to
make them a better college candidates, simply putting mental discipline under a different name.
Smagorinsky, Lakly, and Johnson (2002) discussed the county-wide curriculum in Georgia that
was produced because at that time, the state made all districts and teachers more accountable for
test scores. It was a “cookie cutter” curriculum in which everything was laid out in a three-ring
binder filled with the assessments, programs, and so forth that they should use to ensure there
was no lack of uniformity from one district to the next (Smagorinsky et al., 2002). These county-
wide curricula, where students experience content at the same pace regardless of ability or an
innate interest in specific disciplines, is akin to every school-age child learning Latin in the early
1900s because it would make the pupil more intelligent. However, Edward Thorndike disproved

45
the efficacy of this nearly 80 years ago. These curriculums have appeared along with the rise of
standardized tests, as follows:
The design assumed that when teaching with the prescribed commercial anthology, all teachers in all schools would read the same literature on approximately the same day, ask the same questions, use the same assessments, and otherwise provide each student in the district the same instruction… The curriculum was further tied to standardized county wide tests that assessed students after each unit, further pressuring teachers to follow the curriculum guide faithfully. (Smagorinsky et al., 2002, p. 198) This is also occurring in New Jersey, where many counties have created a consortium of teachers
from every district to represent the subject matter and build this type of curriculum.
Active Learning
Vocational education is grounded in the theory of active learning, which can be seen in
Thorndike’s theory of mental discipline and the eight-year study: “Active learning is anything
course-related that all students in a class session are called upon to do other than simply
watching a lecture and taking notes” (Felder & Brent, 2009, p. 2). Active learning can be project
based or hands-on learning; it is learning in which students problem solve or analyze using
course material.
Many of the countries discussed in this chapter have policies in place to make vocational
education a viable educational option for secondary education. The German educational system,
which drove the policies of vocational education in the United States in 1917, understands the
logistics required to make vocational education a viable process, such as including the
importance of active learning.
The history of the German vocational system is a bit different from the United States. In
the early 1900s, a compulsory education in Germany ended at the age of 15, and military service
could not occur until 21. Thus, many Germans were left wandering, which led to revolutionary
thoughts. To deal with these societal issues, vocational education occurred from age 15–18 to

46
compliment the students’ general education. The founder of vocational education in Germany,
Georg Kerschensteiner, set up vocational education for students (1) to learn how to dutifully
perform an occupation, (2) to take up a societal function using their skills, (3) and to stabilize
their imperial state as dutiful citizens (Gessler & Howe, 2015, p. 217). The current German dual
system is set up to have a student complete 3 days of vocational training at a company and 2
days of vocational education in school. The Germans produce contracts with the companies
where students study for the duration of their training. The mixed system allows the students to
transition from school to work because the students are actually part of the company (intern), not
just there for learning. The Germans justify this curriculum using the principles of personality,
science, and situations. Personality is used to develop the choice of content toward the objective.
Science is used to develop the way the material is structured and how the content is passed to the
educators and then to the students. Finally, the situation is oriented toward current or future
needs, in which the material content and learning tasks can be derived (Gessler & Howe, 2015).
Yet the Germans understand the following:
Learning is an active, individual construction process in conjunction with the preexisting
knowledge and experience of the learner, that acquiring skills cannot be separated from
their practical application in a community of practice, and skills are to be regarded as
highly context-bound. In order to ensure the transfer of what has been learned, the
learning situation of the subsequent application situation should be as similar as possible,
i.e. situational. A learning situation should therefore be an interesting, authentic problem
or task that is integrated in a real job-related situation. (Gessler & Howe, 2015, p. 220)
In China, a study that reviewed the vocational curriculum offered at one institution in
Hong Kong noted that there was very little research into personal development education at the

47
vocational level and little to no relevant research into a new personal development program. In
2009, Hong Kong’s Education Commission recommended, “The provision of a broad senior
curriculum to enable students to acquire experiences in various key learning areas, construct a
broad knowledge base and enhance their ability to analyze problems” (Leung & McGrath, 2010,
p. 94). Leung and McGrath (2010) completed a four-phase study in which they used
documentary research to identify key areas in personal development, quantitative research to
identify the skills, attitudes, and knowledge the students need for college, and finally an
interview phase. The results pointed to recommendations that would aid in the development of a
vocational education through the process of active learning. The researchers spoke of the
importance in their results as follows:
All around the world, good knowledge and appropriate skills are important. However, the modern job market demands even more; good attitudes and continuous proactive lifelong learning are now the keys to success. However, the importance of vocational learning goes further than this as it is, linked to arguments about active citizenship and full self-actualization. The kind of programme outlined here has the potential to nurture fully rounded individuals. However, in Hong Kong, and elsewhere, the success of such programmes requires active collaboration by all relevant stakeholders. (Leung & McGrath, 2010, p. 102)
Active learning enriches the learning process. Active learning can be used in all programs, but
the learning process that occurs in a hands-on environment shows the value of vocational
education because the student can put his or her theory into practice.
Pieratt (2010) looked at the ideas of John Dewey and how the high-tech schools in San
Diego used his philosophies and attempted to implement them. High-Tech High (HTH) reformed
the educational process and went to a hands-on approach and project-based learning. Similar to
the schools that participated in the study, increases were seen in college readiness and acceptance
rates. Although HTH boasts a 100% acceptance rate for its students to colleges around the
country, the school’s principles are ‘personalization, teacher as designer, adult world connection

48
and a common intellectual mission” (Pieratt, 2010, p. 52), which has a direct connection to
Dewey’s philosophies. Also, the principles are similar to the German dual system because they
look at personality as an aid in driving instruction and curricula. Rosenstock’s inspiration for the
school grew out of his experience as a teacher. Seeing students tracked into vocational education
because of their SES, he saw that once this happened, many thought the students had no
intellectual future, an issue with vocational education around the world. John Dewey, the same
with HTH, understood the importance of vocational education in schools because it is
occupationally driven "by giving a larger place to occupation we should secure an excellent,
perhaps the very best, way of making an appeal to the child's spontaneous interest" (Dewey,
1902, p. 136). Again, drawing a connection to the German dual system in which occupations
drive curriculum, many critics felt that occupations should not drive what a student learns. Even
Dewey criticized occupation-driven curriculum as being “materialistic, utilitarian or even menial
in their tendency" (p. 23). Dewey often advocated that vocational skills had a place in the
classroom and that they were "not just practical devices or modes of routine employment, [but
instead were] active centers of scientific insight into natural materials and processes, points of
departure whence children shall be led out into a realization of the historic development of man"
(p. 19). Thus, HTH has project-based learning in which students use power tools because it is a
real-world life skill, allowing them to foster choices regardless of their chosen profession. Yet
throughout this article, they talk about progressive education, which was prevalent in the United
States until the 1950s. This return and the results from the high-tech schools are examples of the
importance of bringing back vocational education in secondary education. Vocational education
is not just needed to fill a void or a specific occupation; all students’ benefit from it. The hands-
on approach, or project-based learning, aids in educational outcomes for all students and allows

49
for more informed choices and life skills that will transfer throughout their life experiences. It’s a
way of looking at a problem and not just learning facts or theories but putting them into practice.
The current study, while historic in nature, will show that vocational education affects students.

50
Chapter III
Methodology
I conducted a non-experimental, longitudinal, and explanatory study that was
retrospective in nature. The study utilized quantitative methods to determine whether the
removal of or an excessively modified vocational education component is associated with the
variables of school mobility, suspension rates, school achievement, and attendance. The
measurements were derived from historical NJ Report Card Data from 1994–2001. Because of a
lack of quantitative studies completed in the United States on the influence of the removal of
vocational education on student output variables, I decided to use a repeated measures ANOVA
to analyze the longitudinal data so that I could monitor how the variables changed over time. The
current study supplements existing research on prescribed curriculums (i.e., mental discipline
and active learning), and may influence policy makers and administration to determine if their
current curriculum is appropriate to serve all students.
Research Design
Regarding the current study’s design, “Non-experimental research is frequently an
important and appropriate mode of research in education (Johnson, 2001, p. 3). An explanatory
design was used to determine if the absence of a vocational program could be associated with
student variables (mobility, suspension, attendance, and school achievement). The term
explanatory non-experimental research, as per the criteria discussed by Johnson (2001), is as
follows”
(a) Were the researchers trying to develop or test a theory about a phenomenon to explain “how” and “why” it operates? (b) Were the researchers trying to explain how the phenomenon operates by identifying the causal factors that produce change in it? If the answer is “yes” (and there is no manipulation) then the term explanatory non-experimental research should be applied. (p. 9)

51
A one-way repeated measures ANOVA was used to explain the association to student variables
over time after the vocational education program was removed or modified.
Methods
A repeated measures design is “a type of analysis that tests whether differences exist among
population means with measures on the same subjects” (Wilke & Wilke, 2010, p. 372). The
repeated measures design was chosen because my investigation is time related. Although
repeated measures are usually done in medical studies, such as the effect of drugs within a group
of variables over time, I chose to use this statistical analysis to look at the same schools over a
period of time and at the association, if any, vocational education had on these variables. An
example is heart rate during an exercise program. One can look at the heart rate before, during,
and after a workout. By looking at the same variable over multiple points in time, the repeated
measures will determine if a significant change in the related means of the levels before, during,
and after workout were significant. In the current study, I looked at the variables over a 7- 8 year
period before, during, and after the removal of the vocational program to determine if significant
changes in the mean occurred. From here on, the independent variables are referred to as within
subject factors.
Research Questions Research Question 1:
What is the association between the removal of vocational programing and the rate of
student mobility over time?
Research Question 2:
What is the association between the removal of vocational programing and the student
attendance rate over time?
Research Question 3:

52
What is the association between the removal of vocational programing and the rate of
student suspensions over time?
Research Question 4:
What is the association between the removal of vocational programing and the rate of
school achievement over time?
Research Question 5:
To what extent are there between-group differences (high school vocational program
versus a county vocational school) in student mobility, suspension, and student attendance and
school achievement over time?
Hypothesis
HO: There is no difference in the suspension rate, attendance rate, student mobility, and school-
level achievement regarding the HSPT before and after the vocational education program was
removed or significantly modified in an A, B, or CD DFG school.
HO = m1 = m2 = m3 …. = m8
H1: There is a difference in the suspension rate, attendance rate, student mobility, and school-
level achievement regarding the HSPT before and after the vocational education program was
removed or significantly modified in an A, B, or CD DFG school.
H1: Ho is false (at least two means are significantly different)
Sample Population and Data Source
The sample for the current study consisted of public high schools within the state of New Jersey.
The schools included met the following criteria:
A. The school had a district factor group of A, B, or CD in the 1990 and 2000 school
years.

53
B. The schools contained a vocational education program or industrial arts program that
was removed during the studied 8-year period.
C. The schools reported all student variables and all other pertinent information required
by the New Jersey Department of Education.
The number of schools that fit the above criteria was (n = 35). There were 22 schools designated
A for 1990 and 2000, eight schools designated B, and five schools that were CD. District factor
groups use the following six variables to calculate the letter denomination and districts that fall
in A, B, or CD, which are the lowest denominations in the state (District Factor Groups (DFG)
for School Districts, 2018):
1) Percent of adults with no high school diploma
2) Percent of adults with some college education
3) Occupational status
4) Unemployment rate
5) Percent of individuals in poverty
6) Median family income
Finally, the number of vocational schools in the state of New Jersey that were designated
vocational schools on the state report card and fit the above criteria is N = 46.
Data Collection
The data used in the current study were obtained from the New Jersey Department of
Education’s website (http://www.state.nj.us/education/reportcard). The DFG were obtained at
another New Jersey Department of Education’s website
(http://www.nj.gov/education/finance/rda/dfg.shtml). This website contains an instruction and
roadmap section to find the appropriate files in the zipped csv file. The data set was downloaded
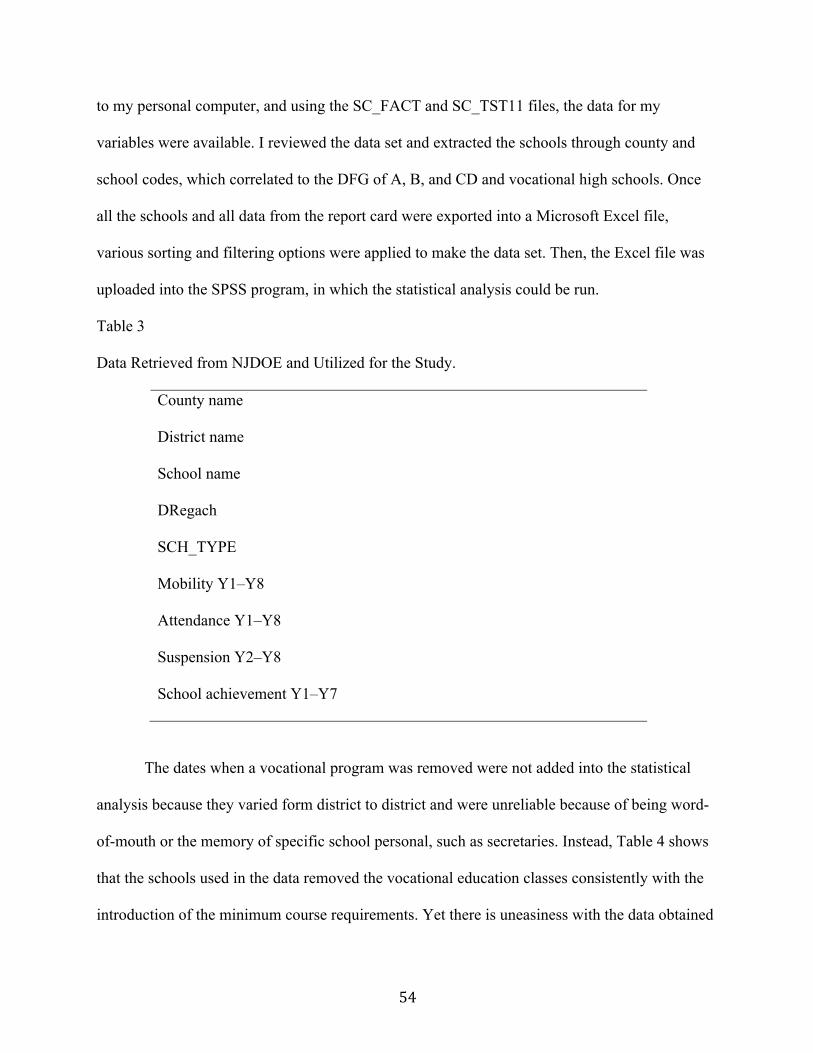
54
to my personal computer, and using the SC_FACT and SC_TST11 files, the data for my
variables were available. I reviewed the data set and extracted the schools through county and
school codes, which correlated to the DFG of A, B, and CD and vocational high schools. Once
all the schools and all data from the report card were exported into a Microsoft Excel file,
various sorting and filtering options were applied to make the data set. Then, the Excel file was
uploaded into the SPSS program, in which the statistical analysis could be run.
Table 3
Data Retrieved from NJDOE and Utilized for the Study.
County name
District name
School name
DRegach
SCH_TYPE
Mobility Y1–Y8
Attendance Y1–Y8
Suspension Y2–Y8
School achievement Y1–Y7
The dates when a vocational program was removed were not added into the statistical
analysis because they varied form district to district and were unreliable because of being word-
of-mouth or the memory of specific school personal, such as secretaries. Instead, Table 4 shows
that the schools used in the data removed the vocational education classes consistently with the
introduction of the minimum course requirements. Yet there is uneasiness with the data obtained

55
because there is no record at the state level when the curriculum was changed to make way for
the new minimum course requirements.
Table 4 Year Vocational Education Was Removed
Schools Used in the Study
Year Vocational Education Was Removed
(Estimates as info collected from word-of-mouth)
1 1999–2000
2 1995
3 1990s (still have a woodshop though)
4 Mid 1990s
5 Mid 1990s
6 Mid 1990s
7 Mid 1990s
8 Mid 1990s
9 Mid 1990s
10 Mid 1990s
11 Mid 1990s
12 Mid 1990s
13 1998
14 Removed year unknown
15 Mid 1990s
16 Mid 1990s

56
17 Mid 1990s
18 Mid 1990s
19 Mid 1990s
20 1995
21 Removed year unknown
22 Mid to late 1990s
23 Removed year unknown
24 1995
25 Mid 1990s
26 Mid 1990s
27 Mid 1990s
28 Mid 1990s
29 Mid 1990s
30 Removed year unknown
31 1994
32 1995
33 Mid 1990s
34 1991 began removing classes; full removal later
35 Mid 1990s Table 5 Number of High schools by School Type SCH_TYPE N V (Vocational) 44 H (Secondary High 35

57
School DFG A = 22, B = 8, CD = 6)
Dependent Variables
The percentage of school variables—mobility, suspension, and attendance, along with the
school achievement (percent passing of all sections of the HSPT)—are the dependent variables.
The rate for mobility is derived from the sum of students entering and leaving after the October
enrollment count divided by the total enrollment (Department of Education - DOE Archives,
2018). The rate for attendance is calculated by the sum of days present in all applicable grade
levels divided by the total possible days present for all students (Department of Education - DOE
Archives, 2018). The suspension rate is calculated by dividing the total number suspended by the
total enrollment (Department of Education - DOE Archives, 2018). The HSPT 11, which is a
basic skills test and high school graduation requirement, was used as a dependent variable to
highlight school achievement because this test was given from 1993 to 2004, which is consistent
with the time frame of 1994–2001. The HSPT consisted of three sections: reading, writing, and
mathematics. All the results used in the current study were derived by the percent passing if all
three sections were combined. The dependent variables each have either a 7- or 8-year
continuous data set.
Table 6
Variables and Names of Dependent Variables
Variable Label Description
Mobility (8 years) MOB The calculation is derived from the sum of
students entering and leaving after the October
enrollment count divided by the total enrollment
(Department of Education - DOE Archives,
2018).
Attendance (8 years) ATT The school and state totals are calculated by the

58
sum of days present in all applicable grade levels
divided by the total possible days present for all
students (Department of Education - DOE
Archives, 2018).
Suspension (7 years starting in
year 2)
SUSPEN The percentages are calculated by dividing the
total number suspended by the total enrollment
(Department of Education - DOE Archives,
2018).
School achievement (7 years
starting year 1)
ALLSEC Percent passing if all sections were combined
(reading, mathematics, and writing).
Table 7
Dependent and Separation of Independent Variables
Within-subject Factors (Dependent Variables)
Mobility year 1 through year 8
Suspension year 2 through year 8
Attendance year 1 through year 8
School achievement year 1 through 7
Between-subject Factors (Independent Variables)
Public Secondary Schools in NJ (0)
Public County Vocational Schools in NJ (1)
Independent Variable (effect)
Time
Independent Variables
Because the current study is a one-way repeated measures ANOVA, the independent
variable (effect) is time. Also, there is a between-subject factor (independent variables) used to

59
determine the between-group differences of a secondary high school versus a county vocational
school.
Instrumentation
“The Department of Education issues annually the state-mandated New Jersey School
Report Card that contains statistical profiles of every school in the state” (New Jersey School
Report Cards, 2018); individual districts and schools must report the required data to the state in
which a report card will be produced and published. Each report card contains information on six
different categories: 1) school environment; 2) student information; 3) student performance;
indicators; 4) other performance indicators; 5) staff information; and 6) district/charter financial
data. The variables of attendance, suspension, and mobility used in the current study are rates
produced by formulas outlined by the state. The HSPT 11 data were used for school achievement
because in the school report card, standardized tests (HSPT, AP, and SAT) are labeled under
student performance indicators. Finally, I used Version 24 IBM “SPSS” Statistics, release
24.0.0.0 64-bit edition.
Data Analysis
A one-way repeated measures ANVOA tests the differences of the means of within-
subject factors (independent variable). Witte and Witte (2010) discussed the analysis done by the
repeated measures one-way ANOVA, noting that in a repeated measure, because the researcher
is looking at the same group over multiple measures, variability can be eliminated from the
analysis. Also, a one-way repeated measures ANOVA compared to a normal ANOVA is similar
because it is “customary ANOVA assumptions about normality and equal variances” but the
striking difference is that a repeated measures ANOVA assumes sphericity, which is “the
assumption of equality among all possible correlations between population” (Witte & Witte,
2010, p. 387). Finally, the Bonferroni correction is used because I did not have three groups to

60
run a post hoc Tukey to reject the overall null hypothesis and pinpoint the specific differences
between the means at different points. To better understand how the data were analyzed Figure 2
shows how the variables were looked at and how they were grouped.
A variation of a figure will be used in repeated measures Anova, Laerd Statistcs (n.d.), will to
show how my data were organized and analyzed.
Year 1 Year 2 Year 3 Year 4 Year 5 Year 6 Year 7
Measure Student Variable Measure Student Variable Measure Student Variable Vocational education Removal Post vocational education
Determine if a significant change in the means occurred over the 7 or 8years
Figure 2: First data analysis of just secondary high schools Year 1 Year 2 Year 3 Year 4 Year 5 Year 6 Year 7
Measure Student Variable Measure Student Variable Measure Student Variable Vocational education Removal Post vocational education Secondary High Schools Vocational High Schools
Determine if there is a significant difference in the means depending on school type.
Figure 3: Second data analysis between groups.
The schools (subjects) means of the dependent variables (mobility rate and attendance rate) from
the school report card were calculated over an 8-year period, while suspension and school
achievement was over 7 years; a F statistic was generated to determine the statistical significance
F = MSbetween / MS error.

61
Procedure
For each outcome, the following steps occurred: Each dependent variable was run
independently, and the first step was to obtain the descriptive statistics for each variable to
summarize the data. The next step was then to determine a significance of differences in the
mean within-subject effect using a one-way repeated measures ANOVA for each of the variables.
To determine significance, I looked at the Greenhouse-Geisser. The reason for reporting the
Greenhouse-Geisser was that I did not assume sphericity because only one to two conditions
were analyzed at any time. Finally, each variable was run with a between-subject group,
secondary high schools and vocational high schools. The data were then plotted with multiple
measures of the dependent variable on the x-axis, and each of the between subject factors had a
separate line. Once the statistical analysis was run, the following statistics were noted:
1) The descriptive statistics table
2) Multivariate test
3) The within-subject test and/or between-subject test
4) Profile plots
Summary
Chapter III presented the methodological framework of the present study, which is a
quantitative analysis, and discussed the methodology and designs used for the one-way repeated
measures ANOVA. The variables were identified, along with the method and instrumentation
used to extract the data, from the school report card, along with sorting. The null hypothesis will
be rejected if a significance level is at or below 0.05.

62
Chapter IV presents the results of the repeated measure ANOVA. The tables and graphs
are used to assist in understanding the data and analysis.

63
Chapter IV
Analysis of Data
Results
The purpose of the current study was to explain the association of vocational education to
student mobility, attendance, suspension, and school achievement. During this analysis, only two
(mobility and school achievement) out of the four variables showed significance at the 95%
confidence level. The extent of the between-group differences in the outcomes between high
school vocational programs and a county vocational school were also significant for only two
(mobility and school achievement) out of the four variables at the 95% confidence level. To
begin this chapter, there is a description of the major variables using descriptive statistics, as
seen in Table 8. Out of the four variables, only mobility decreased over the 8 years, with certain
years increasing yet never passing the 25.71 rate of 1994 year. Attendance, with 8 years’ worth
of data points, and suspensions along with academic achievement, 7 years of data points,
increased, and throughout their respective years, they never were lower than the 1994 rate. In
Table 13, I noted that a similar trend was occurring in the variables in the county vocational
schools.
Table 8
Descriptive Statistics for Main Study Variables (N = 35)
Variable 94–95 95–96 96–97 97–98 98–99 99–00 00–01 01–02
Mobility 25.71
(19.28)
21.79
(13.10)
19.1
(11.60)
21.28
(16.29)
23.53
(16.10)
19.02
(12.08)
18.53
(11.97)
18.79
(11.93)
Attendance 85.42
(14.19)
88.35
(6.50)
89.43
(5.35)
89.87
(4.88)
89.29
(4.92)
90.09
(5.25)
87.52
(15.90)
90.95
(3.52)

64
Suspension * 12.62
(16.94)
14.03
(18.45)
15.15
(16.94)
18.45
(17.41)
19.14
(16.66)
16.77
(15.46)
17.42
(10.8)
Academic
Achievement
52.41
(27.37)
72.51
(25.78)
73.47
(25.00)
69.61
(26.80)
66.47
(26.36)
68.05
(26.26)
66.76
(29.19)
*
Note: () represents standard deviations, and * denotes no data available for the year.
Mobility Research Question 1:
What is the association between the removal of vocational programing and the rate of
student mobility over time?
A one-way repeated measures ANOVA was conducted to determine how the removal of
vocational programing might have affected the mobility rate in 35 secondary high schools in
New Jersey across a time span of 8 years. Because the assumption of sphericity was violated by
Mauchly’s test, W = .31 c2 = 109.696, p = .000, the Greenhouse-Geisser correction test was used.
The Greenhouse-Geisser correction determined that the mobility means differed significantly
over the 8 years, F (3.599.122.380) = 464.466, P = .014 (Refer to Table 9). The inference is that
since the eradication or redesign of the vocational program, mobility has decreased. In 1994–
1995, the average mobility was 25.71, the highest over the 8 years. In 2001–2002, the rate had
decreased to 18.70. Bonferroni post hoc tests indicate that no specific year-to-year pairwise
means were significantly different.
The inference is that fewer students left the secondary schools, even after the vocational
program was removed. This may be associated with the increases in the minimum course
requirements needed for a high school diploma and students no longer having time to follow
their interests outside of academia.

65
Table 9
Repeated Measures Analysis of Variance (Mobility)
Effect MS df F P Greenhouse-
Geisser
Huynh-
Feldt
Mobility 238.829 7 3.422 .000 .014 .010
Error 69.787 238
Attendance Research Question 2:
What is the association between the removal of vocational programing and the student
attendance rate over time?
A one-way repeated measures ANOVA was conducted to determine how the removal of
the vocational programing might be associated with the attendance rate in 35 secondary high
schools in New Jersey across a time span of 8 years. Because the assumption of sphericity was
violated by Mauchly’s test, W = .00 c2 =460.952, p = .000, the Greenhouse-Geisser correction
test was used. The Greenhouse-Geisser correction determined that the attendance means did not
differ significantly over the 8 years, F (2.066,70.246) = 1.879, P = .159 (Refer to Table 10). The
inference is that since the elimination or redesign of the vocational program, attendance has not
changed. In 1994–1995, the average attendance was 85.42, the lowest over the 8 years. In 2001–
2002, the rate had increased to 90.95. However, the Bonferroni post hoc test indicates that the
1995 and 1998, 1997 and 2002, and 1998 and 2002 pairwise means were significantly different
from each other.
Table 10
Repeated Measures Analysis of Variance (Attendance)
Effect MS df F P Greenhouse- Huynh-

66
Geisser Feldt
Attendance 106.503 7 1.879 .074 .159 .156
Error 56.589 238
Suspension Research Questions 3:
What is the association between the removal of vocational programing and the rate of
student suspensions over time?
A one-way repeated measures ANOVA was conducted to determine how the removal of
vocational programing might have affected the suspension rate in 35 secondary high schools in
New Jersey across a time span of 7 years. Because the assumption of sphericity was violated by
Mauchly’s test, W= .059 c2 =89.932, p = .000, the Greenhouse-Geisser correction test was used.
The Greenhouse-Geisser correction determined that the suspension means did not differ
significantly over the 7 years, F(3.309,112.522) = 2.424, P = .063 (Refer to Table 11). The
inference is that since the eradication or redesign of the vocational program, suspension has not
been affected. In 1994–1995, the average attendance was 12.62, the lowest over the 7 years. In
2001–2002, the rate increased to 17.42. The Bonferroni post hoc tests indicates that no specific
year-to-year pairwise means were significantly different from each other. The results suggest that
there is not an association between removal of vocational programing and the rate of student
suspensions.
Table 11
Repeated Measures Analysis of Variance (Suspension)
Effect MS df F P Greenhouse-
Geisser
Huynh-
Feldt
Time 199.051 6 2.424 .028 .063 .056

67
Error 82.104 204
School Achievement HSPT Results Research Question 4:
What is the association between the removal of vocational programing and the rate of
school achievement over time?
A one-way repeated measures ANOVA was conducted to determine how the removal of
vocational programing might have affected school achievement in 35 secondary high schools in
New Jersey across a time span of 7 years. Because the assumption of sphericity was violated by
Mauchly’s test, W = .013 c2 =138.101, p = .000, the Greenhouse-Geisser correction test was used.
The Greenhouse-Geisser correction determined that the school achievement means differed
significantly over the 7 years, F (2.099, 71.355) = 29.434, P = .000 (Refer to Table 12). The
inference is that since the eradication or redesign of vocational programs, school achievement
has actually increased the first year and then began a downward trajectory. In 1994–1995, the
average achievement was 52.41, the lowest over the 7 years. In 2001–2002, the rate increased to
66.76. Bonferroni post hoc tests indicate that significant differences were found for the following
pairwise comparisons: 1994–1995 consecutively for all the remaining 6 years, 1995–1996 vs.
1998–1999 and 1999–2000, 1996–1997 consecutively to 1999–2000, and 1997–1998 vs. 1998–
1999
The inference is that after the first year of the HSPT results, the schools may have
adapted their curriculum, which may explain the increase form year one to two, yet after the
change of curriculum required for increased basic and testing skills, the curriculum shifted from
active learning to increased seat time, which may explain the remaining 6 years, where the HSPT
scores decreased each year.

68
Table 12
Repeated Measures Analysis of Variance (School Achievement)
Effect MS df F P Greenhouse-
Geisser
Huynh-
Feldt
Time 1712.301 6 29.434 .000 .000 .000
Error 58.175 204 Research Questions 5:
To what extent are there between-group differences (high school vocational program
versus a county vocational school) in student mobility, suspension, attendance, and
school achievement over time?
Out of the four variables, only the school achievement results were statistically significant in all
three terms of the within- and between-subject effects. School achievement F(2.819, 222.692) =
19.167, p = .000, school achievement*SchType F(2.819,222.692) = 4.002, p = .010, and
SCH_TYPE F(1,79) = 17.348, p = .000. Over the 7 years, vocational schools remained on an
upward trajectory, unlike their secondary counterpart, where school achievement was on a
decreasing trajectory (refer to Figure 7). Mobility only had a significant difference in the rate
between the vocational and secondary schools, F(1,79) = 8.209 p = .005, but there was no
significant interaction. The mobility rate in the vocational schools was significant compared with
the secondary schools from 2000–2002; the prior years’ trends of mobility were very similar. In
the last 2 years, vocational schools’ mobility increased, showing the beginning exodus (refer to
Figure 4) from the vocational schools. The other two variables, attendance and suspension, were
only statistically significant for the time effect, yet there was no significant interaction or
difference in the rate between vocational and secondary schools.

69
Table 13
Descriptive Statistics for the Main Study Variables (N = 81)
School Type N 0 (Secondary) 35 1 (Vocational) 46
Variable 94–95 95–96 96–97 97–98 98–99 99–00 00–01 01–02
Mobility
N=35
25.71
(19.28)
21.79
(13.10)
19.1
(11.60)
21.28
(16.29)
23.53
(16.10)
19.02
(12.08)
18.53
(11.97)
18.79
(11.93)
Mobility Voc
N=46
14.75
(13.09)
12.16
(9.02)
13.67
(10.34)
15.59
(14.95)
13.66
(12.28)
12.67
(13.71)
15.28
(15.54)
15.18
(13.38)
Mobility total
N=81
19.49
(16.86)
16.32
(11.90)
16.02
(11.16)
18.05
(15.70)
17.92
(14.80)
15.41
(13.33)
16.68
(14.12)
16.74
(12.82)
Attendance
N=35
85.42
(14.19)
88.35
(6.50)
89.43
(5.35)
89.87
(4.88)
89.29
(4.92)
90.09
(5.25)
87.52
(15.90)
90.95
(3.52)
Attendance
Voc N=46
79.84
(31.30)
79.72
(31.32)
80.18
(31.43)
88.33
(19.54)
86.51
(23.20)
86.40
(23.20)
90.50
(14.03)
90.87
(14.01)
Attendance
Total N=81
82.25
(25.39)
83.45
(24.25)
84.18
(24.27)
88.99
(15.02)
87.71
(17.74)
87.99
(17.83)
89.21
(14.84)
90.90
(10.76)
Suspension
N=35
*
*
12.62
(16.94)
14.03
(18.45)
15.15
(16.94)
18.45
(17.41)
19.14
(16.66)
16.77
(15.46)
17.42
(10.8)
Suspension
Voc N= 46
*
*
9.87
(11.10)
10.42
(11.4824)
10.72
(10.95)
12.95
(13.69)
14.19
(11.12)
12.83
(10.81)
12.90
(10.14)
Suspension
Total N=81
*
*
11.06
(13.90)
11.98
(14.71)
12.63
(13.94)
15.33
(15.55)
16.33
(13.91
14.54
(13.08)
14.85
(10.60)
Academic
Achievement
N=35
52.41
(27.37)
72.51
(25.78)
73.47
(25.00)
69.61
(26.80)
66.47
(26.36)
68.05
(26.26)
66.76
(29.19)
*

70
Academic
Achievement
Voc N=46
24.14
(31.36)
36.09
(42.14)
35.71
(41.77)
34.88
(41.00)
36.55
(40.44)
40.36
(42.04)
44.23
(42.29)
*
*
Academic
Achievement
Total N=81
36.36
(32.71)
51.83
(40.14)
52.03
(40.01)
49.89
(39.35)
49.48
(37.91)
52.32
(38.44)
53.97
(38.66)
*
*
Note: () represents standard deviations, and * denotes no data available for the year.
Mobility* School Type
A mix of the between- and within-subject’s one-way repeated measures ANOVA was
conducted to assess the type of school (non-vocational, N = 35 vs. vocational schools, N = 46)
on mobility rate across a time span of 8 years. The assumption of sphericity was violated by
Mauchly’s test, W = .118 c2 = 163.196, p = .000, so a Greenhouse-Geisser correction was used.
The mobility rate over the 8 years was not statistically significant F(4.026,318.042) = 2.051, p
= .087 (Refer to Table 14), and looking at the interaction between time and school type, the non-
significant Greenhouse-Geiser test indicates that variations in the observed mobility rates did not
differ between the two types of settings, F(4.026,318.042) = 2.161, p = .073 (Refer to Table 14).
The interaction plot in Figure 4 confirms this.
Yet there was a significant difference in the average mobility over the 8 years between
the vocational and secondary schools. The average mobility rate for the vocational school was
14.12, and for the secondary, it was 20.97, F(1,79) = 8.21, p = .005 ( Refer to Table15).
Bonferroni post hoc tests indicate that no specific year-to-year pairwise means were significantly
different.

71
Table 14
Repeated Measures Analysis of Variance (Mobility*School Type)
Effect MS df F Greenhouse-
Geisser
Mobility 284.408 4.026 2.051 .087
Mobility *
School
Type
299.665 4.026 2.161 .073
Error 79.767 318.042
Table 15 Test of Between-Subjects Effects (Mobility)
Effect MS df F Sig
Intercept 195782.27 1 215.35 .000
School
Type
7463.39 1 8.21 .005
Error 909.118 79

72
Figure 4: Profile plots of mobility
Attendance * School Type
A mix of the between- and within-subject’s one-way repeated measures ANOVA was
conducted to assess the type of school (non-vocational, N = 35 vs. vocational schools, N = 46)
on attendance rate across a time span of 8 years. The assumption of sphericity was violated by
Mauchly’s test, W = .001 χ2 =577.947, p = .000, so a Greenhouse-Geisser correction was used.
The attendance rate over the 8 years was statistically significant F(2.817,222.528) = 3.058, p
= .032 (Refer to Table 16). Yet looking at the interaction between time and school type, the
Greenhouse-Geiser test indicates that variations in the observed attendance rates did not differ
between the two types of settings, F(2.817,222.528) = 1.583, p = .197 (refer to Table 16). The
interaction plot in Figure 5 confirms this.
Finally, there was no significant difference in the average attendance rate over the 8 years
between the vocational and secondary schools. The average attendance rate for the vocational
school was 85.29, and for the secondary, it was 88.87, F(1,79) = 1.381 p = .243 (refer to Table
17). Bonferroni post hoc tests indicate that no specific year-to-year pairwise means were
significantly different.

73
Table 16
Repeated Measures Analysis of Variance (Attendance*School Type)
Effect MS df F Greenhouse-
Geisser
Attendance 1657.82 2.817 3.058 .032
Attendance
* School
Type
858.44 2.817 1.583 .197
Error 542.178 222.528
Table 17 Test of Between-Subjects Effects (Attendance)
Effect MS df F Sig
Intercept 4822926.02 1 3279.82 .000
School
Type
2030.49 1 1.381 .243
Error 1470.484 79

74
Figure 5: Profile plots attendance
Suspension * School Type
A mix of the between- and within-subject’s one-way repeated measures ANOVA was
conducted to assess type of school (non-vocational, N = 35 vs. vocational schools, N = 46) on
suspension rate across a time span of 7 years. The assumption of sphericity was violated by
Mauchly’s test W = .09 χ2 =184.967, p = .000, so a Greenhouse-Geisser correction was used.
The suspension rate over the 7 years was statistically significant F(3.272,258.50) = 4.062, p
= .006 (Refer to Table 18). Yet looking at the interaction between time and school type, the non-
significant Greenhouse-Geiser test indicates that variations in the observed suspension rates did
not differ between the two types of settings, F(3.272,258.50) = .210, p = .904 (refer to Table 18).
The interaction plot in Figure 6 confirms this.
Finally, there was no significant difference in the average suspension rate over the 7
years between the vocational and secondary schools. The average suspension rate for the
vocational school was 11.98, and for the secondary, it was 16.23, F(1,79) = 2.98 p = .088 (refer
to Table 19). Bonferroni post hoc tests indicate that the 1999–2000 pairwise means were
significantly different from 1995–1996, 1996–1997, and 1997–1998.
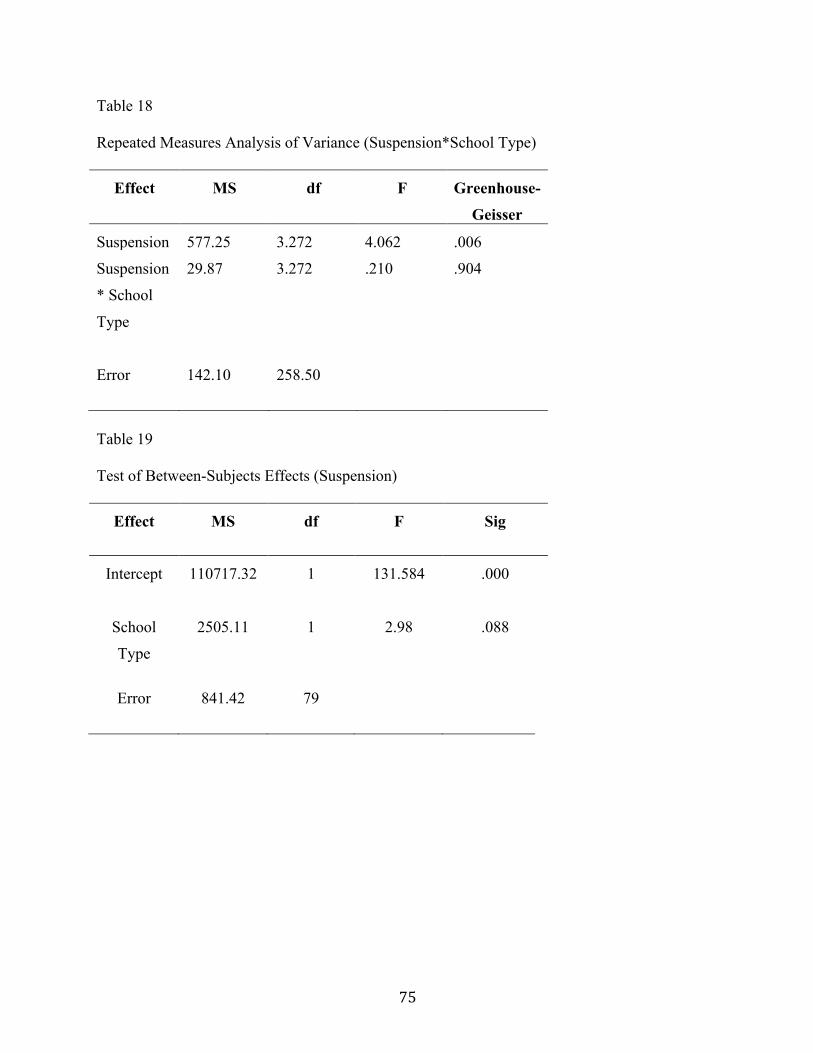
75
Table 18
Repeated Measures Analysis of Variance (Suspension*School Type)
Effect MS df F Greenhouse-
Geisser
Suspension 577.25 3.272 4.062 .006
Suspension
* School
Type
29.87 3.272 .210 .904
Error 142.10 258.50
Table 19
Test of Between-Subjects Effects (Suspension)
Effect MS df F Sig
Intercept 110717.32 1 131.584 .000
School
Type
2505.11 1 2.98 .088
Error 841.42 79

76
Figure 6: Profile plots suspension
School Achievement * School Type
A mix of the between- and within-subject’s one-way repeated measures ANOVA was
conducted to assess the type of school (non-vocational, N = 35 vs. vocational schools, N = 46)
on school achievement across a time span of 7 years. The assumption of sphericity was violated
by Mauchly’s test W = .021 χ2 =297.518, p = .000, so a Greenhouse-Geisser correction was used.
The school achievement over the 7 years was statistically significant F(2.819,222.69) = 19.167, p
= .000 (Refer to Table 20). Looking at the interaction between time and school achievement, the
Greenhouse-Geiser test indicates that variations in the observed school achievement differed
between the two types of settings, F(2.819,222.69) = 4.002, p = .010 (refer to Table 20). The
interaction plot in Figure 7 confirms this.
Finally, there was a significant difference in the average school achievement over the 7
years between the vocational and secondary schools. The average school achievement for the
vocational school was 35.99, and for the secondary school, it was 67.04, F(1,79) = 17.348 p
= .000 (refer to Table 21). Bonferroni post hoc tests indicate that significant differences were
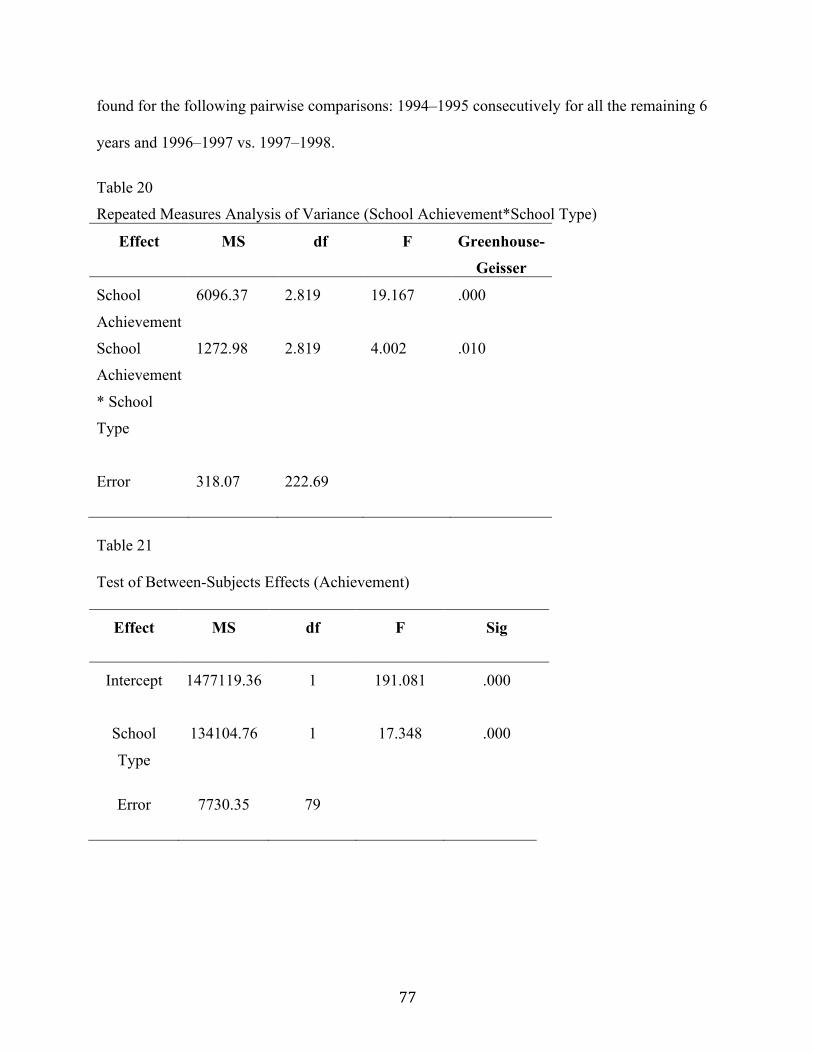
77
found for the following pairwise comparisons: 1994–1995 consecutively for all the remaining 6
years and 1996–1997 vs. 1997–1998.
Table 20
Repeated Measures Analysis of Variance (School Achievement*School Type)
Effect MS df F Greenhouse-
Geisser
School
Achievement
6096.37 2.819 19.167 .000
School
Achievement
* School
Type
1272.98 2.819 4.002 .010
Error 318.07 222.69
Table 21
Test of Between-Subjects Effects (Achievement)
Effect MS df F Sig
Intercept 1477119.36 1 191.081 .000
School
Type
134104.76 1 17.348 .000
Error 7730.35 79

78
Figure 7: Profile plots of School Achievement

79
Chapter V
Conclusions and Recommendations
Conclusions
This chapter presents the conclusions, recommendations for policy and practice, and
suggestions for future research. It is evident that many educational journals and media outlets
have discussed the need for vocational education in the United States (i.e., the Forbes article by
Nicholas Wyman [2016], an associated press article by Lisa Leff [2016]). Yet education
bureaucrats in New Jersey’s Department of Education rely on an antiquated, prescribed
curriculum that relies on mental discipline, with graduation requirements being met through
minimum course requirements since the mid-1990s. These prescribed courses have led to the
removal of vocational education from high schools and have even turned the county vocational
schools into “cream-skimming” schools with entrance requirements. The analyses in the current
paper suggest that something occurred in student variables over the time frame before and after
the removal of vocational education programs in New Jersey. Although the current study cannot
fully determine the complete association of the removal of the program, it did identify that
something occurred during the studied time frame.
The current study is based on data that are at least 15 years old. It is important to
understand the overall value of the current study as retrospective in the way it views the changes
occurring in education over a 7- and 8-year period during the time of standardization in New
Jersey. Viewing the historical data reveals trends that are consistent with the historical changes
in New Jersey vocational education and can better prepare future researches for the next change
in vocational education. Since 2001–2002, vocational schools have transformed into “cream-
skimming” elite academic academies, because the students can no longer obtain a high school

80
diploma outlined by the minimum course requirements. An exodus or increased mobility out of
the vocational schools caused them to adaption to “High Techs” (refer to figure 4) in 2001-2002.
Now that the populace is calling for increasing vocational education, will history repeat itself and
how can educational leaders be prepared for this paradigm shift. Later in this chapter, I will
discuss recommendations for policy changes, such as better monitoring of student progress and
recommendations for practice in career and technical education (CTE), along with an option for
two diplomas. Fifteen years later, changes are currently occurring to revitalize vocational
education back into secondary schools in New Jersey, and a retrospective view is required to
ensure a strong foundation in which to build these new programs. Finally, further research should
be completed to determine a cause and effect, which will be outlined later in this chapter.
Summary of the Findings
Although the current study was explanatory in nature, the statistical analysis did find
significant differences in the means of some of the variables (mobility and school achievement)
over the 7- or 8-year period in New Jersey high schools with a low socioeconomic status that
removed or modified their vocational education offerings. The mobility in the secondary schools
decreased, which may be associated with students not leaving their home schools to pursue
interests in other forms of learning because they needed to complete the minimum course
requirements to obtain their diplomas. Also, the downward trajectory after year two of school
achievement using the HSPT results may be associated with the shift from an active learning
curriculum through vocational classes and electives to basic skills and increased seat time,
further separating the curriculum from student interests.
However, the results indicate statistically significant differences in the means of student
mobility and school achievement (HSPT scores) between vocational schools and secondary high

81
schools in New Jersey. Changes in school achievement during the 7 years examined suggest that
vocational education continued its upward trajectory (See Figure 7) of HSPT results, even when
an exodus (increased mobility) was occurring in the vocational schools compared with their
secondary counterparts. This trend may show the association between active learning and a more
connected curriculum to the content than what was occurring in the secondary schools during the
same time frame, where pushing basic skills was on a downward trajectory. New Jersey, for the
past 24 years, is still monitoring student progress through large-scale assessments that still
measure students ELA and math content knowledge.
The results for mobility indicates that the trends from 1994–2000 were similar in
secondary and vocational schools until the last 2 years (2000–2002) when mobility increased in
the vocational schools. The increase was consistent with the exodus of the vocational programing
because of students not being able to meet the high school graduation requirements through the
satellite or shared time model. This increased mobility caused many vocational schools to adapt
and evolve into “cream-skimming” elite academic academics, attracting the top students from the
county’s secondary schools. Now, secondary schools are looking into bringing back vocational
education through a variety of new terms, career and technical education (CTE), or educational
technologies (EdTech), which is vocational education without the stigma of the name. These new
course offerings in secondary schools may show a similar trend in mobility out of the county
vocational schools back to the secondary schools, possibly causing the vocational schools to
return to their original purpose of a shared time or satellite school to better serve the needs of the
county’s students who are interested in programs where shared time is more financially
responsible.

82
Although the findings cannot determine a cause and effect, the goal of the current study
was to explain what occurred during this time frame and highlight that more research should be
completed on this topic. According to the current research, there has never been an adverse
association from including a vocational education program within a school’s curriculum. In
addition, the data indicate there may be negative consequences from removing these programs.
Therefore, one begins to understand why educators and the public are calling for vocational
education to return and why more studies need to be completed on vocational education in the
United States, especially with the lack of literature on the topic.
Conclusions
The theories of active learning and the falsity of mental discipline guided the current
dissertation. The educational history of the United States saw the rise and fall of many
educational fads and ideologies (i.e., social Darwinism), yet there were groundbreaking acts and
studies such as the Cardinal Principals of Secondary Education and the eight-year study, which
gave rise to progressive education. Although the present dissertation was explanatory in nature, I
observed and began to understand the ever-changing federalist ideas and democratic process of
the United States and how it is relevant to education. I found significant differences in the means,
and interactions between the school types in the mobility and HSPT results. The findings in the
literature were consistent with the findings from the current study. For example, students are
engaged in education when they find value and have interest in the curriculum, which is why
there was a similar trend in mobility within the vocational schools and secondary schools for the
first 6 years. Yet one must be cautious about jumping to the conclusion that vocational education
was the cause for these results. A study by Malmgren and Gagnon (2005) showed that students
from non-English speaking families and low SES see a higher rate of mobility. The current study
83
used schools in low SES districts, which may be a better explanatory factor for the mobility that
occurred.
As for the HSPT results, vocational education has an active learning approach and
includes Marco curriculum, highlighting the use and value of material learned in other
disciplines, such as math and ELA skills, which the HSPT tested. Vocational education may
explain why the HSPT results continued to increase in the vocational high schools because the
students received their basic knowledge curriculum weaved into their active learning curriculum
unlike traditional high schools. Yet the other two variables, attendance and suspension, were not
statistically significant, which may contradict some of the literature discussed, such as Tze
, Daniels, and Klassen (2015), who determined that a lack of engagement affects discipline.
More research and studies pertaining to the association of vocational education on school and
student variables is needed. Yet the purpose of the current dissertation was ultimately to ensure
that policy makers and school leaders remember their history and review the past to make a more
informed and educated decision in reorganizing and rewriting the curriculum to include active
learning and vocational studies, rather than just pushing mental discipline (i.e., minimum course
requirements) to obtain a high school diploma.
Recommendations for Policy
The current model for attaining a public school high school diploma in New Jersey is to
complete a prescribed number of courses, limiting students’ abilities to find their individual
vocational interests. Instead of allowing the school personnel to nurture and grow a student’s
interests in an active learning environment, current policy restricts them by following a
prescribed curriculum, reminiscent of mental discipline, preparing them only for academia.
Recently, New Jersey produced the twenty-first-century life and careers standards as part of the

84
New Jersey Core Content Curriculum Standards (Standard 9) to ensure that students obtain
knowledge of the workforce and opportunities throughout their K-12 education. For example,
standard 9.2 outlines, “the importance of being knowledgeable about one's interests and talents,
and being well informed about postsecondary and career options, career planning, and career
requirements” (New Jersey Department of Education, 2014). Yet there is no career academy,
vocational education, or anything that the student can actively participate in to make a more
informed decision. Instead, the students are to research, analyze, assess, examine, or identify
their career choices instead of doing and trying. Thus, policy makers need to examine the current
model used in obtaining a high school diploma in New Jersey and should develop the ability for
students to find different tracks in obtaining their diplomas, as well as letting students find value
in high school. As discussed in Chapter 2, in the 1900s the United States looked at other
countries (i.e., Germany) to see why it was out performing the United States economically. After
a century, it is time for policy makers to review and research what other countries are doing in
secondary education to develop their workforces. Policy makers should also return to a true
American invention: the comprehensive high school. The comprehensive high school, as
described by Tanner and Tanner, is a “unitary, multipurpose school” (2007, p. 233); it ensured
that there would be no separation of the public, as done in European schools, but rather be an
amalgamation of a students with common interests. The design of the comprehensive school
included the following (Tanner & Tanner, 2007, p. 233):
1) A general education for all youth as citizens of a democratic society
2) Specialized programs for vocational proficiency for those youngsters planning to enter
the workforce after high school
3) The specialized program of academic preparation for college

85
4) Exploratory studies and experiences to enable adolescents to investigate new sources
of learning
5) Enrichment studies and experiences to widen and deepen the sources of learning for all
adolescents
6) Special-interest studies to meet individual interests apart from specialized studies
This paradigm shift from traditional high schools, founded with mental discipline at the
core, must find a model that would allow students the opportunity to foster their interests and
find their niche. Policy must also be in place for monitoring student progress if this paradigm
shift is to occur. The current monitoring system in New Jersey is based on yearly assessments; a
student must either complete and pass standardized tests such as the Partnership for Assessment
of Readiness for College and Career (PARCC) or the portfolio appeal process if the student
cannot pass the ELA or math sections of PARCC. New Jersey also requires teachers to set
personal goals for their students and frequently monitors their progress through the student
growth objective (SGO), but this score is only used for the teacher effectiveness rating for
NJSMART.
This current monitoring system of student achievement does not work for all students.
There are now multiple types of monitoring progress that may be more beneficial for a
revitalization of vocational education, such as a progress monitoring or curriculum-based
measurements, which are used in a variety of right to intervention or special education settings
because these areas look at the skills or growth of the students, not at knowledge of the academic
content. These policy changes would not only revitalize vocational education, but also would
return the U.S. educational system to becoming a valuable asset in making sure that all citizens
have a purpose in American society.

86
Recommendations for Practice
School leaders need to ensure that their students’ needs are being met; these needs range
from socio-civic, economic-vocational, and individual-avocational, which were outlined by the
Cardinal Principles of Secondary Education and later intertwined into the macro-curriculum that
became the foundation for the comprehensive high school. School leaders need to become
advocates for reform and how a student obtains a high school diploma. School leaders need to be
able to modify curriculum to increase the amount of time spent on career education. This can be
accomplished by increasing the career and technical education (CTE) offering laid out by the
state of New Jersey. Currently, New Jersey has the Office of Career Readiness that is responsible
for, “collaboration with the state workforce development system, institutions of higher education,
business and industry and other state agencies to create rigorous programs of study aligned to
workforce needs and career pathways” (Career and Technical Education, 2018, para. 2).
School leaders will have to apply to obtain CTE certification through a rigorous process,
but this will ultimately allow them to apply for Perkins funding, and they will have to re-apply
every 5 years to keep their CTE status. Although students still must complete the minimum
course requirements to obtain a high school diploma, school leaders can use the option two
diplomas, which allows for personalizing a student’s educational experience to fix their needs.
The option two diplomas are an alternative to seat time credits received in the traditional
educational setting. Option two would allow schools to give credit for students attending
community college courses or make it so that the students can participate in project-based or
multidisciplinary courses to satisfy the credit and minimum course requirements. This is similar
to developing a comprehensive approach with a macro-curriculum. Delano and Hutton (2007)
stated, “Career academies differ from traditional academic and vocational education high schools

87
by preparing students for both college and careers. Academies provide broad information about
fields such as biosciences, finance, engineering, media, or health care. They weave the career
themes into academic curricula that qualify students for admission to four-year colleges or
universities and prepare them for the associated workplace.”(p. 48) Changing the course offering
or producing macro-curriculums will allow the school leader to ensure that active learning is
taking place and that students interests are being fostered, instead of pushing for them to have
bachelor’s degrees. Another option besides modifying curriculum is to use online courses or
summer class offerings to aid in completing their minimum course requirements, allowing for
more co-op or apprenticeship classes, giving their students real-world experience in a career that
the student currently has an interest in. If the New Jersey Department of Education refuses to
change the graduation requirements, then school leaders simply must out smart them and use
loopholes, giving those students who are not college bound a skill or trade to make them
valuable members of society.
Recommendations for Future Research
Because the current study was an explanatory longitudinal study, the research cannot find
a cause and effect or fully explain the association of removing a vocational education program
from secondary high schools in New Jersey. To expand on the lack of literature and the present
study, the following recommendations are given:
1) Recreate the study in other states
2) Recreate the study using a pilot program in schools that contain a true vocational program
and track the success of the student after graduation compared to a similar district that
still follows the mandated minimum course requirements

88
3) Design a study that can show cause and effect to determine the significance of vocational
education on school variables
4) Study the way how the paradigm of vocational education has changed during the last
decade
5) Study how the changes in technology have changed the required competencies of
students in CTE programs
More recommendations for future research to further fill in the literature gap on vocational
education in the United States include studies on
1) Financing and shared services between districts because a single school district may not
have the finances to support a vast amount of student interests and certified and skilled
staff. Thus, a consortia of schools may allow for increased curricula offerings.
2) The logistics of the validity and reliability of successful shared services and the influence
of apprenticeships.
3) Determine the best practices of the apprenticeship models used in other countries and
how they can be used in the United States.
Summary
Education is constantly evolving because of the input of politicians, bureaucrats, policy
makers, and the public. All stakeholders need to remember the history of education in the United
States. With the lack of historical knowledge, policy makers recreate or reorganize past practices,
thus leading to the cyclical nature realized during the literature review. Education is not
evolving: it is simply changing names or ideas that have been posed a century or decades ago.
Although the current study looked at the loss of vocational education in New Jersey public high
schools, the policy makers of the Department of Education need to remember that every student

89
is different, having different interests and prior knowledge. “No one can do inspired work
without genuine interest in his subject and understanding of its characteristics.” ~ Andreas
Feininger Quote, 2018. Trying to force a one-size-fits-all prescription is a disservice to the idea of
education. The lack of literature and studies about vocational education in the United States
compared with the multitude of countries was astonishing. Ninety years ago, Edward Thorndike
showed that taking a course does not increase one’s intelligence. Why and, more importantly,
how did we return to a century-old thought process, and what will it take to once again move
past this idea?

90
References
Aikin, W. M. (1942). The story of the eight-year study. Harper & Brothers. Aloe, A. M., Shisler, S. M., Norris, B. D., Nickerson, A. B., & Rinker, T. W. (2014). Review: A
multivariate meta-analysis of student misbehavior and teacher burnout. Educational Research Review, 1230-44. doi:10.1016/j.edurev.2014.05.003
AndreasFeiningerQuote.(2018).A-ZQuotes.Retrieved5April2018,fromhttp://www.azquotes.com/quote/726151
Apprentice.(n.d.).RetrievedApril8,2018,from
https://www.merriam-webster.com/dictionary/apprentice
Archambault, I., Janosz, M., Morizot, J., & Pagani, L. (2009). Adolescent behavioral, affective, and cognitive engagement in school: relationship to dropout. Journal of School Health, 79(9), 408-415. doi:10.1111/j.1746-1561.2009.00428.x
Bishop, J. H., & Mane, F. (2005). Raising academic standards and vocational concentrators: Are they better off or worse off? Education Economics, 13(2), 171-187.
Boote, D. N., & Beile, P. (2005). Scholars before researchers: On the centrality of the dissertation literature review in research preparation. Educational researcher, 34(6), 3-15.
Corson, D. (Ed.). (1988). Education for work: Background to policy and curriculum. Multilingual Matters.
Broyler, C. R., Thorndike, E. L., & Woodyard, E. (1927). A second study of mental discipline in high school studies. Journal of Educational Psychology, 18(6), 377-404. doi:10.1037/h0073902
CEP. (2007). Choices, changes, and challenges: curriculum and instruction in the NCLB era. Washington, DC: Author.
Career and Technical Education. (2018). Nj.gov. Retrieved from http://www.nj.gov/education/cte/#
Danzer, G. A. (2007). The Americans. Evanston, IL: McDougal Littell. Delano, R. K., & Hutton, K. C. (2007). Economic and workforce Development - K
through 12 education issue. Economic Development Journal, 6(2), 47-53.
Department of the Interior, B. (. (1918). Cardinal Principles of Secondary Education: A Report of the Commission on the Reorganization of Secondary Education, Appointed by the

91
National Education Association. Bulletin, 1918, No. 35. Washington, DC: Bureau of Education, Department of The Interior.
D.O.E (n.d.). FAQ - transforming secondary education. Retrieved from http://www.state.nj.us/education/ser/faq/
Department of Education - DOE Archives. (2018). State.nj.us. Retrieved 5 April 2018, from
http://www.state.nj.us/education/reportcard/2011/definitions.htm Dewey, J. (1902). The child and the curriculum & the school and society. Chicago, IL: The
University of Chicago Press. Dewey, J. (1916/2009). Democracy and education: An introduction to the philosophy of
education. Waiheke Island: The Floating Press. District Factor Groups (DFG) for School Districts. (2018). Nj.gov. Retrieved
from http://www.nj.gov/education/finance/rda/dfg.shtml
Engec, N. (2006). Relationship between mobility and student performance and behavior. Journal of Educational Research, 99(3), 168.
Felder, R. M., & Brent, R. (2009). Active learning: An introduction. ASQ Higher Education Brief, 2(4), 1-5.
Freidel, F., & Sidey, H. (2017, March 08). Warren G. Harding. Retrieved from https://www.whitehouse.gov/1600/presidents/warrenharding
Gemellaro, D. M. (2012). What is the relative influence of NJ school report card variables on NJ Ask 5 scores? South Orange, NJ: Seton Hall University.
Gessler, M., & Howe, F. (2015). From the reality of work to grounded work-based learning in German vocational education and training: Background, concept and tools. International Journal for Research in Vocational Education and Training, 2(3), 214-238.
Google Ngram Viewer. (2018). Retrieved from https://books.google.com/ngrams/graph?content=vocational+education&year_start=1900&year_end=2000&corpus=15&smoothing=3&share=&direct_url=t1%3B%2Cvocational%20education%3B%2Cc0
Gregory, A. (2012). The universe of alternatives: Intervening with schools and teachers. Journal of Community Psychology, 40(2), 206-208.
Halpren, R. (2012). Supporting vocationally oriented learning in the high school years: Rationale, tasks, challenges. New Directions for Youth Development, 2012(134), 85-106. doi:10.1002/yd.20018

92
Hayward, G. C., Benson, C. S., & Office of Vocational and Adult Education (ED), W. D. (1993). Vocational-Technical Education: Major Reforms and Debates 1917-Present.
Industrial arts. (n.d.). Retrieved April 8, 2018, from https://www.merriam-webster.com/dictionary/industrial arts
Jacobson, R., Saultz, A., & Snyder, J. W. (2013). Grading school report cards. Phi Delta Kappan, 95(2), 64-67.
Johnson, B. (2001). Toward a new classification of nonexperimental quantitative research. Educational Researcher, 30(2), 3-13.
Kanevsky, L., & Keighley, T. (2003). To produce or not to produce? Understanding boredom and the honor in underachievement. Roeper Review, 26(1), 20-28.
Kogan, I., Gebel, M., & Noelke, C. (2012). Educational systems and inequalities in educational attainment in Central and Eastern European Countries. Studies of Transition States & Societies (STSS), 4(1), 69-83.
Kotamraju, P. (2014). The Indian Vocational Education and Training (VET) System: Status, challenges, and options. Community College Journal of Research And Practice, 38(8), 740-747.
Krupnick, M. (2017, August 29). After decades of pushing bachelor's degrees, U.S. needs more tradespeople. Retrieved from https://www.pbs.org/newshour/education/decades-pushing-bachelors-degrees-u-s-needs-tradespeople
Lee, T., Cornell, D., Gregory, A., & Fan, X. (2011). High suspension schools and dropout rates for black and white students. Education and Treatment of Children, 34(2), 167- 192.
Leff, L. (2016, April 27). Career education making a comeback in US high schools. Retrieved from https://apnews.com/755b0187ecea4650a9e765e56dd759e0/career-education-making-comeback-us-high-schools
Leung, A. M., & McGrath, S. (2010). An effective learning model to support people development: The emerging approach of the Hong Kong Institute for Vocational Education. International Education Studies, 3(4), 94-106.
Lillard, D. R., & DeCicca, P. P. (2001). Higher standards, more dropouts? Evidence within and across time. Economics of Education Review, 20(5), 459-473. Malmgren, K., & Gagnon, J. (2005). School mobility and students with emotional disturbance.
Journal of Child & Family Studies, 14(2), 299-312. doi:10.1007/s10826-005-5058-0

93
Mendez, L. M. (2003). Predictors of suspension and negative school outcomes: A longitudinal investigation. New Directions for Youth Development, (99), 17-33.
McClure, A. F., Chrisman, J. R., & Mock, P. (1985). Education for work: The historical evolution of vocational and distributive education in America. Fairleigh Dickinson Univ Press.
McCrone, T., (2014). Vocational education policymakers must change hearts and minds. Education Journal, (217), 14.
Minhua, L. (2015). "Bad students go to vocational schools!": Education, social reproduction and migrant youth in urban China. China Journal, (73), 108-131.
Mulroy, J. (2011). College or bust: Replacing 'college prep for all' with a three-tiered educational model based on student abilities. Family Court Review, 49(3), 657. doi:10.1111/j.1744-1617.2011.01400.x
NJDOE. (n.d.). N.J.A.C. 6A:8, STANDARDS AND ASSESSMENT. Author. doi:http://www.state.nj.us/education/code/current/title6a/chap8.pdf
NJDOE. (2011a). NJDOE Historical Report Card Data 1994-95 to 2001-02. Retrieved from http://www.state.nj.us/education/reportcard/2002/index.html
New Jersey Department of Education. (2014). New Jersey Student Learning Standards Retrieved from http://www.state.nj.us/educ.ation/cccs/2014/career/
New Jersey School Report Cards. (2018). State.nj.us. Retrieved from http://www.state.nj.us/education/title1/accountability/rc/
Pieratt, J. R. (2010). Advancing the ideas of John Dewey: A look at the high-tech schools. Education and Culture, 26(2), 52-64.
Laerd Statistics. (n.d.). Repeated Measures ANOVA. Retrieved from https://statistics.laerd.com/statistical-guides/repeated-measures-anova-statistical- guide.php
Rumberger, R. W. (2011). Dropping out. Cambridge, MA: Harvard University Press. Smagorinsky, P., Lakly, A., & Johnson, T. S. (2002). Acquiescence, accommodation, and
resistance in learning to teach within a prescribed curriculum. English Education, 34(3), 187-213.
Santayana, G. (1980). The life of reason [or the phases of human progress]. Vol. 1, Reason in common sense. Chicago, IL: Dover
Segedin, L., & Levin, B. (2012). International approaches to secondary education. International

94
Studies in Educational Administration (Commonwealth Council For Educational Administration & Management (CCEAM)), 40(2), 49-68.
Smith, N. B. (1999). A tribute to the visionaries, prime movers and pioneers of vocational education, 1892 to 1917. Journal of Career and Technical Education, 16(1). Sullivan, A. L., Klingbeil, D. A., & Van Norman, E. R. (2013). Beyond behavior: Multilevel analysis of the influence of sociodemographics and school characteristics on students'
risk of suspension. School Psychology Review, 42(1), 99-114.
Taş, A., Selvitopu, A., Bora, V., & Demirkaya, Y. (2013). Reasons for dropout for vocational high school students. Educational Sciences: Theory & Practice, 13(3), 1561- 1565. doi:10.12738/estp.2013.3.1398
Tanner, D. (1982). The comprehensive high school in American education. educational research, 607.
Tanner, D., & Tanner, L. N. (2007). Curriculum development: Theory into practice. New York, NY: Macmillan.
Thorndike, E. L. (1924). Mental discipline in high school studies. Journal of Educational
Psychology, 15(1), 1-22. doi:10.1037/h0075386
Tompkins, V. (Ed.). (2000). Smith-Hughes Act of 1917 primary source e-text. Retrieved from http://www.enotes.com/topics/smith-hughes-act-1917
Tze, V., Daniels, L., & Klassen, R. (2016). Evaluating the relationship between boredom and academic outcomes: A meta-analysis. Educational Psychology Review, 28(1), 119-144. doi:10.1007/s10648-015-9301-y
U.S. Department of Education. (2016, July 18). School climate and discipline: Know the data. Retrieved from https://www2.ed.gov/policy/gen/guid/school- discipline/data.html
Vocational education. (n.d.). Retrieved April 8, 2018, from https://www.merriam- webster.com/dictionary/vocational education
Witte, R. S., & Witte, J. S. (2010). Statistics (9th ed.). Hoboken, NJ: Wiley. Wraga, W. G. (1999). Who wrote the Cardinal Principles Report? The Commission on the
Reorganization of Secondary Education Revisited
Wright, D. (1999). Student mobility: A negligible and confounded influence on student achievement. The Journal of Educational Research, (6), 347. Wirth, A. G. (1974). Philosophical issues in the vocational-liberal studies controversy

95
(1900–1917): John Dewey vs. the social efficiency philosophers. Studies in Philosophy and Education, 8(3), 169-182.
Wyman, N. (2016, October 07). Why we desperately need to bring back vocational training in schools. Retrieved from https://www.forbes.com/sites/nicholaswyman/2015/09/01/why-we-desperately-need-to-bring-back-vocational-training-in-schools/