The assembly and annotation of a draft transcriptome ...
41
Chapter 3 The assembly and annotation of a draft transcriptome sequence of a Eucalyptus hybrid tree Chapter Preface The following publication resulted from the worked described in this chapter: • Mizrachi, E., Hefer, C.A., Ranik, M., Joubert, F. and Myburg, A.A., 2010. De novo assembled expressed gene catalog of a fast-growing Eucalyptus tree produced by Illumina mRNA-Seq. BMC Genomics, Volume 11, 681. Several of the figures used in this chapter were also used in the above mentioned publication. The manuscript is attached as Appendix D. Author contributions: C.A. Hefer performed the de novo assembly and automated annotation, participated in data analysis, and drafted the chapter. E. Mizrachi helped sample the biological material, prepared the libraries, participated in the de novo assembly and data analysis, M. Ranik prepared the libraries, helped sample the biological material and participated in data analysis. F. Joubert participated in data analysis. A.A. Myburg conceived of the study, and participated in its design and coordination and participated in data analysis. 81
Transcript of The assembly and annotation of a draft transcriptome ...
Chapter 3
The assembly and annotation of a draft transcriptome
sequence of a Eucalyptus hybrid tree
Chapter Preface
The following publication resulted from the worked described in this chapter:
• Mizrachi, E., Hefer, C.A., Ranik, M., Joubert, F. and Myburg, A.A., 2010. De novo assembled
expressed gene catalog of a fast-growing Eucalyptus tree produced by Illumina mRNA-Seq. BMC
Genomics, Volume 11, 681.
Several of the figures used in this chapter were also used in the above mentioned publication. The
manuscript is attached as Appendix D.
Author contributions:
C.A. Hefer performed the de novo assembly and automated annotation, participated in data analysis,
and drafted the chapter. E. Mizrachi helped sample the biological material, prepared the libraries,
participated in the de novo assembly and data analysis, M. Ranik prepared the libraries, helped sample
the biological material and participated in data analysis. F. Joubert participated in data analysis. A.A.
Myburg conceived of the study, and participated in its design and coordination and participated in data
analysis.
81

3.1. Introduction
In South Africa, 36% (450 000ha) of the total land area used for commercial forestry comprises of eu-
calypt species (DWAF report, http://www2.dwaf.gov.za/webapp/Documents/FSA=Abstracts2009.pdf).
The Eucalyptus genome released early in 2011 (http://www.phytozome.net) is only the second forest
hardwood tree for which a genome sequence is available. Together with the genome sequence of Populus
trichocarpa (Tuskan et al., 2006), the Eucalyptus genome sequence provides researchers with interests
in woody biomass production unique opportunities to elucidate the underlying biochemical and genetic
components of wood properties and cellulose production. Eucalypt and poplar trees have been earmarked
as potential bioenergy crops (Hinchee et al., 2009), which adds to the existing value of these plantation
crops in the pulp, paper and timber industries (Moore et al., 2010).
Accurately identifying gene models in a newly sequenced genome relies heavily on the presence of
evidence of expression of potential gene models in order to reduce the number of false positives identified
using computational gene finders. Despite the availability of uHTS technology, by the the end of 2009 pre-
cious few eucalypt unigene and EST datasets had been made available to the scientific community, mostly
due to the commercial interests in the species (Hibino, 2009). The EST datasets that were available con-
sisted mostly of Sanger sequenced datasets (Rasmussen-Poblete et al., 2008; Rengel et al., 2009) and 454
(Roche Life Sciences) generated EST datasets (Novaes et al., 2008). A collection of EST resources in the
public domain is now accessible from the EucalyptusDB resource (http://eucalyptusdb.bi.up.ac.za), and
consists of ESTs and unigenes derived from seedlings and different leaf and xylem tissues from various
eucalypt species.
Sequencing gene specific tags of the mRNA content of a cell was first demonstrated during the
human genome project (Adams et al., 1991), and has in the past two decades been used to profile the
transcriptomes of many organisms (Boguski et al., 1993, 1994; Sterky et al., 1998; Seki et al., 2002;
Dias Neto et al., 2000; Rasmussen-Poblete et al., 2008). The advent of ultra-high-throughput sequenc-
ing technologies, especially the use of mRNA-Seq has enabled the genome wide identification of novel
expressed transcripts in various tissues and organisms (Cloonan et al., 2008; Denoeud et al., 2008; Mor-
82

tazavi et al., 2008), the identification of alternative splicing events (Pan et al., 2008; Sultan et al., 2008;
Filichkin et al., 2010) and quantification of transcript abundance (Mortazavi et al., 2008; Trapnell et al.,
2010). Transcriptome profiling has mostly been performed for model organisms, although early access to
genome sequences has been used to profile gene expression in non-model organisms, with reference-based
transcriptome assemblies performed for the Pachycladon (Collins et al., 2008), Melitaea (Vera et al.,
2008) and Cucumis (Wu et al., 2010) genomes.
The following sections describe the de novo assembly, annotation and transcriptome profiling of
a Eucalyptus hybrid tree. By performing deep mRNA sequencing of six different tissues with Illumina
technology, reads ranging from 35-55 bp long were assembled into 18 894 contigs longer than 200 bp. The
assembled contigs were evaluated for contig contiguity and assembly quality, and transcript composition
compared to the homologous transcripts available for the Populus trichocarpa, Vitis vinifera and Ara-
bidopsis thaliana angiosperms. Annotation of the assembled contigs was performed based on homology
search results against the above mentioned angiosperm transcriptome datasets, as well as additional
annotation including protein family and protein feature annotations, gene ontology classification and
functional pathway classifications. The transcript abundance of the assembled contigs was calculated
in each of the sampled tissues, and a set of transcripts over-expressed in woody when compared to
non-woody tissues were identified. The deep sequencing of the tissues also allowed for the identification
of possible polymorphism sites in the assembled gene catalog, providing insight in the heterozygosity
present in the hybrid transcriptome.
3.2. Materials and methods
3.2.1. Plant tissue collection, mRNA-Seq library preparation and sequence generation
Six different tissues from a six year old ramet of a commercially grown E. grandis x E. urophylla hybrid
clone (GUASPI, Sappi forest Research) sampled consisted of xylem, immature xylem, phloem, shoot tip,
and young and mature leaf tissue. After total RNA extraction and polyA enrichment, paired-end libraries
83

with an approximate average insert length of 200 bp were synthesized. The libraries were sequenced on
an Illumina Genome Analyser (version I, II and IIx) equipped with a paired-end module. Further details
regarding the sampling and laboratory methods are described in the Materials and Methods section of
Mizrachi et al., 2010 (Appendix D).
3.2.2. De novo transcriptome assembly
A single paired-end file was created containing the reads from the various tissues and sequence
lanes. After removing reads containing regions of consecutive low quality bases (4 consecutive ”N”s), a
total dataset of 3.9 Gb of sequence was used for the assembly. The de novo transcriptome assemblies
were performed with the de Bruijn graph-based assembler Velvet (Zerbino and Birney, 2008). Various
assemblies were performed to firstly identify the optimal kmer length, and then the expected coverage
cutoff that resulted in the assembly of the final set of transcripts. A stringent average coverage cutoff of
8X was used to remove entire contigs with low coverage.
Extending the assembly
The short read assembler, Velvet (Zerbino and Birney, 2008) showed superior performance over
other short read assemblers, and although the assembler was developed for genome assembly, it managed
to assemble sufficiently long contigs of representative mRNA-transcripts. The assembler requires an
estimation of the coverage across a transcript in order to correctly join nodes in the de Bruijn graph
representing each contig. If large discrepancies in coverage happen to occur across a contig, the genome
assembler tends to break the contig into two or more shorter sequences. Due to the variable nature
of transcript expression, a coverage assisted re-assembly of the assembled contigs was performed. The
re-assembly process involved mapping the dataset of short reads to the assembled contigs, and calculating
the average sequence depth of each transcript. The matching read and associated mate pair reads
that mapped to any given transcript were then extracted from the total dataset and together with the
calculated average coverage and the original contig used in a reference based approach to re-assemble
84

Figure 3.1: A schematic flow diagram of the coverage-assisted re-assembly process. First, a mappingprocess (using Mosaik, Stromberg and Marth, 2008) is followed where all the Illumina reads are mappedto a contig from the initial de novo Velvet assembly, then the average coverage of the contig is calculated.The short-reads will map as pairs (red) or single reads (blue) to the assembled contig. All mate-pairs(of the red and blue reads) that mapped to the contig are then extrancted from the Berkeley databaseand stored in a seperate file. These pairs are then, together with the appropriate coverage setting andthe contig as a backbone, submitted to Velvet for re-assembly.
the contig (see Figure 3.1 for a graphical representation of the process, and Appendix B for the Python
code).
A Berkeley database (BDB, Oracle, 2009) was constructed to facilitate the storage of the mate-pair
information for the 35 million paired-ends reads in an efficient manner. The high performance and
scalability of the BDB storage system made BDB more suited for the task at hand than relational database
systems or flat-file storage (Oracle, 2009). The BDB system is designed to be embeddable in a program-
matic fashion, and have the ability to handle multiple concurrent queries. The mate pair information
was stored as tuples in the database, with the name of the entry as the lookup or key value. The
85

key-value storage allowed for the fast querying of the data, but with the initial computational overhead
of initializing the database. The Python API provided access to the database via a dictionary-like object,
and streamlined the extraction of mate-pair information from the database.
The average coverage per contig for the assembled contigs were calculated using the Mosaik assembler
(Stromberg and Marth, 2008). The mapping parameters used a hash size of 12, and limited the number
of hash positions on a contig to 100, as per user documentation. Variations of the input parameters did
not yield significantly different results. In addition to the coverage value for each contig, the assembler
returns a list of short reads which aligned to each contig. These reads and their respective pairs were
then extracted from the BDB using custom Python scripts.
The contig coverage and short reads that mapped to a specific contig as determined by Mosaik were
used in a reference based re-assembly. The expected coverage parameter was customized to represent
the calculated coverage, and the short reads were submitted as paired reads to the assembler, with the
original contig as the reference template. The reference based assembly had a relatively small memory
footprint, since only the reads that mapped to the contig were used during the assembly, and a pipeline
was developed to run the re-assembly process in parallel on the 24-core server used for assembly.
The release of a de novo transcriptome assembler, OASES (Zerbino et al., unpublished and in beta
release) prompted the re-assembly of the contigs using the same parameters that was used for the original
Velvet-based assembly. The OASES assembler does not accept any parameters regarding the expected
coverage values since it attempts to estimate the coverage during assembly. The OASES-assembled contigs
were then compared with the Velvet assembled transcripts and a set of full-length cDNA sequences from
GenBank.
3.2.3. Prediction of coding sequences
In order to provide supporting information for the contiguity of the assembled contigs, multiple
ab initio coding sequence (CDS) predictions were performed on the assembled and extended contigs
(Table 3.2). GENSCAN (Burge and Karlin, 1997), GeneMark (Borodovsky and McIninch, 1993), AUGUSTUS
86

(Stanke and Waack, 2003), GLIMMER (Salzberg et al., 1999) and GeneID (Guigo et al., 1992) are all Markov
model-based prediction tools for the prediction of coding sequences from genomic DNA. Markov-based
prediction tools are trained on a predefined known dataset of known features associated with a coding
sequence such as a transcriptional start site (TSS), 5’ and 3’ untranslated regions (UTRs), start codons,
splice donors and acceptors, etc. These training sets are then used to perform ab initio coding sequence
predictions. For all of the previously-mentioned predictors, the Arabidopsis training data set was used
to predict the coding regions of the contigs. The prediction of coding sequences played an important
role in validating the assembled contigs in terms of possible misassemblies occurring in the dataset.
3.2.4. Inspecting contig contiguity
The nature of the assembled contigs in terms of assembling a complete full length contig, and in
terms of identifying possible misassemblies, were inspected by selecting 33 full-length Eucalyptus cDNA
sequences representing various different gene families, and using these as reference templates for the
assembled contigs (Section C.1.1 in Appendix B). The homology search tool, BLAST (Altschul et al.,
1990), was used with a stringent e-value cutoff (1e−100) to find the corresponding assembled contig that
matched each of the Genbank cDNA sequences. A global alignment (Needle, Rice et al., 2000) was
then performed between the cDNA sequence and the assembled contig, and the cDNA sequence and the
predicted coding sequence from the GENSCAN analyses were considered in order to evaluate the contig
contiguity.
The coverage per base pair (CBP) was calculated separately for all of the cDNA sequences, the
assembled contigs and the predicted CDS with BWA aligner (Li and Durbin, 2009, see section 3.2.7 for a
description of the parameters used). The coverage values and the alignment information were then used
to construct a graph which represents the coverage accross the alignment between the three sequences.
This representation of the sequences allowed for the fast identification of misassembled contigs from
Illumina data in comparison to the full cDNA sequences obtained from Sanger sequencing.
87

3.2.5. Homology searches
Homology-based analyses were used to evaluate the size categories and completeness of the assembled
contig dataset. The complete peptide datasets of Arabidopsis thaliana (TAIR9, Huala et al., 2001), Pop-
ulus trichocarpa (Version 2, Tuskan et al., 2006) and Vitis vinifera (Jaillon et al., 2007) were compared to
two Eucalyptus datasets, the assembled transcriptome, and a dataset of all publicly available Eucalyptus
sequences at that time (August 2009). The publicly available dataset (henceforth known as the EucAll
dataset) consisted of 45 442 entries from GenBank (http://www.ncbi.nlm.nih.gov/Genbank/index.html
downloaded on 27 July 2009), 13 930 entries from a Eucalyptus Wood (EucaWood) unigene and ESTs
resource (Rengel et al., 2009), leaf tissue ESTs (120 661 entries from JGI-produced sequences), and 190
106 unigenes and singlets from 454 data (Novaes et al., 2008). The aim was to identify the sequence
homologs of the Arabidopsis, Vitis and Populus protein datasets present in the Eucalyptus datasets
with homology-based searches. BLAST searches were performed against the Eucalyptus datasets with
e-value thresholds of 1e−5, 1e−10 and 1e−20, and a High Scoring Pair (HSP) minimum alignment length
of 100 bp (33 amino acids). The set of results were further separated based on the size of the hit
(Eucalyptus) sequence. The proportion of genes shared among four angiosperm species (Eucalyptus,
Arabidopsis, Poplar and Vitis) were also determined with BLAST (1e−10, min HSP alignment length of
100 bp) analysis, identifying genes common to all four species, and genes shared between the assembled
Eucalyptus contigs and each of the other three angiosperm species.
3.2.6. InterProScan
The InterProScan tool was used to detect protein predictive models or signatures in the assembled
dataset. InterProScan relies on integrative data stored in the InterPro database (Hunter et al., 2009)
which aggregates diverse information from multiple databases, including Gene3D, PANTHER, Pfam, PIR,
PRINTS, ProDom, ProSITE, SMART, SUPERFAMILY and TIGRFAM data. In the 2009 release of InterPro close
to 58 000 different signatures were present in the database, and together with the over 16 000 UniProtKB
entries formed a valuable tool for protein functional annotation.
88

3.2.7. Calculating transcript coverage and expression
Average coverage per contig was calculated by mapping the short reads to the assembled contigs with
the BWA aligner (Li and Durbin, 2009), and averaging the coverage per base pair (CBP) for every base
in the assembled transcript. The alignment allowed for a 0.04 fraction of missing alignments given the
predicted 2% uniform error rate of Illumina reads, also allowing for one gap in the sequence alignment.
During alignment, deletions were disallowed within 16 bp of the 3’ end of the sequences, and within 5
bp of the 5’ end. A gap opening penalty of eleven and gap extension penalty of four were used for the
scoring matrices, and the mean insert size for a paired read to be considered as being mapped properly
was set to 200 bp.
The Fragments per Kilobase of exon per Million mapped (FPKM, initially developed by Mortazavi
et al. (2008) as Reads per Kilobase of exon per Million mapped, RPKM, but redefined as FPKM by
Trapnell et al., 2010) were derived from mapping the short reads to the assembled contigs with the
BOWTIE short read aligner (Langmead et al., 2009). The resulting alignment files (SAM format, Li et al.,
2009a) were then used as input for the CUFFLINKS software program (Trapnell et al., 2010) in order to
calculate the FPKM values. The parameters for the BOWTIE alignment allowed for three mismatches in
the seed (first 28 bp from the 5’ end of the sequence), but no gaps in the alignment. A mean insert size
of 200 bp was used for the correct alignment of paired-end reads.
Differential transcripts in the xylogenetic (woody tissues which include the xylem and immature xylem
datasets) vs. non-xylogenetic (non-woody tissues which include the shoot tip, mature and immature leaf
samples) were detected by filtering the transcripts to only contain transcripts with an expression value
>2X in either of the two groups of tissues. KEGG and gene ontology analysis of the set of differentially
expressed transcripts were performed with the BiNGO Cytoscape plugin (Maere et al., 2005) and the
Paintomics (García-Alcalde et al., 2010) web server.
89
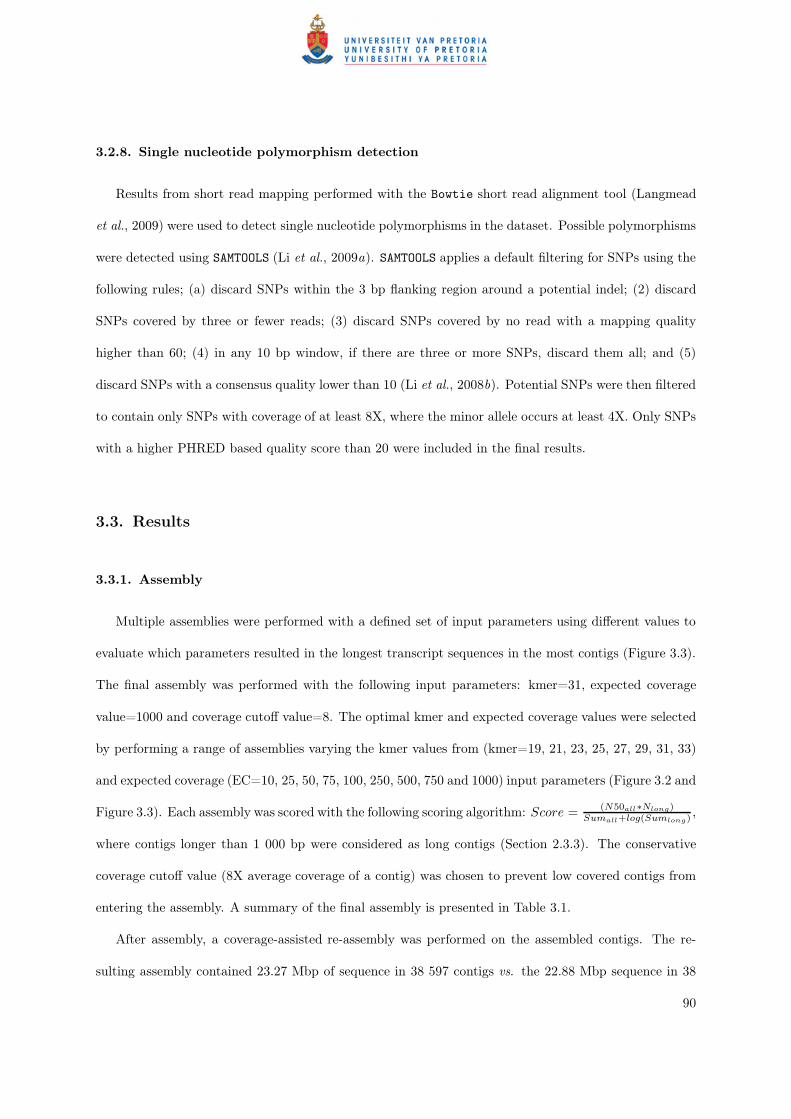
3.2.8. Single nucleotide polymorphism detection
Results from short read mapping performed with the Bowtie short read alignment tool (Langmead
et al., 2009) were used to detect single nucleotide polymorphisms in the dataset. Possible polymorphisms
were detected using SAMTOOLS (Li et al., 2009a). SAMTOOLS applies a default filtering for SNPs using the
following rules; (a) discard SNPs within the 3 bp flanking region around a potential indel; (2) discard
SNPs covered by three or fewer reads; (3) discard SNPs covered by no read with a mapping quality
higher than 60; (4) in any 10 bp window, if there are three or more SNPs, discard them all; and (5)
discard SNPs with a consensus quality lower than 10 (Li et al., 2008b). Potential SNPs were then filtered
to contain only SNPs with coverage of at least 8X, where the minor allele occurs at least 4X. Only SNPs
with a higher PHRED based quality score than 20 were included in the final results.
3.3. Results
3.3.1. Assembly
Multiple assemblies were performed with a defined set of input parameters using different values to
evaluate which parameters resulted in the longest transcript sequences in the most contigs (Figure 3.3).
The final assembly was performed with the following input parameters: kmer=31, expected coverage
value=1000 and coverage cutoff value=8. The optimal kmer and expected coverage values were selected
by performing a range of assemblies varying the kmer values from (kmer=19, 21, 23, 25, 27, 29, 31, 33)
and expected coverage (EC=10, 25, 50, 75, 100, 250, 500, 750 and 1000) input parameters (Figure 3.2 and
Figure 3.3). Each assembly was scored with the following scoring algorithm: Score = (N50all∗Nlong)Sumall+log(Sumlong)
,
where contigs longer than 1 000 bp were considered as long contigs (Section 2.3.3). The conservative
coverage cutoff value (8X average coverage of a contig) was chosen to prevent low covered contigs from
entering the assembly. A summary of the final assembly is presented in Table 3.1.
After assembly, a coverage-assisted re-assembly was performed on the assembled contigs. The re-
sulting assembly contained 23.27 Mbp of sequence in 38 597 contigs vs. the 22.88 Mbp sequence in 38
90
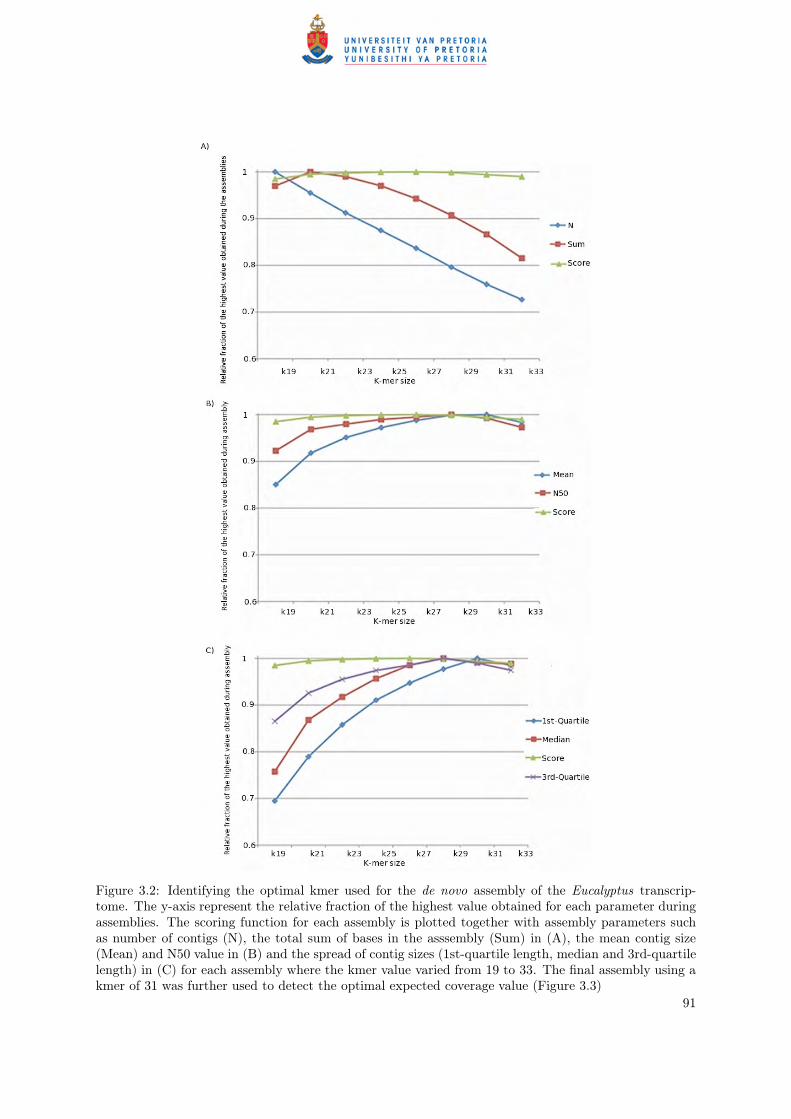
Figure 3.2: Identifying the optimal kmer used for the de novo assembly of the Eucalyptus transcrip-tome. The y-axis represent the relative fraction of the highest value obtained for each parameter duringassemblies. The scoring function for each assembly is plotted together with assembly parameters suchas number of contigs (N), the total sum of bases in the asssembly (Sum) in (A), the mean contig size(Mean) and N50 value in (B) and the spread of contig sizes (1st-quartile length, median and 3rd-quartilelength) in (C) for each assembly where the kmer value varied from 19 to 33. The final assembly using akmer of 31 was further used to detect the optimal expected coverage value (Figure 3.3)
91

Figure 3.3: Identifying the optimal expected coverage value to use for the de novo assembly of theEucalyptus transcriptome. The y-axis represent the relative fraction of the highest value obtained foreach parameter during the assemblies. The scoring function for each assembly is plotted together withassembly parameters such as number of contigs (N), the total sum of bases in the asssembly (Sum) in(A), the mean contig size (Mean) and N50 value in (B) and the spread of contig sizes (1st-quartile length,median and 3rd-quartile length) in (C) for each assembly where the expected coverage parameter variedfrom 10 to 1 000. The final assembly was performed with an expected coverage value of 1 000.
92

Figure 3.4: The number of bases per contig added during the extension of the assembly. The theoreticalupper limit of the number of bases added by the extension step is 400 bp (200 bp for each end of thecontig, which corresponds to the sequenced library size) + the standard deviation of the sequenced DNAfragment sizes. 99% of the added bases per contig were shorter than 336 bp.
597 contigs before extention. Although the maximum contig length did not improve, the average length
of the shorter contigs did improve overall in the re-assembled dataset (Table 3.1). The mean contig
length improved from 592.88 bp to 728.49 bp (22%), and number of unknown bases (N) in the assembly
increased from 396 029 to 405 429 (2.3%). Figure 3.4 indicates that 99% of the additional bases added
to the assembly per contig were shorter than 336 bp. The theoretical limit with which a single contig
can be expected to be extended, was estimated as the insert size of the sequenced DNA library (200 bp)
x 2 (one for each end of a contig) and adding a standard deviation for the library insert size (Figure 3.5).
This would cater for the cases where one sequence from the mate pair library occured at the beginning
or end of the assembled contig, and the other fragment of the paired sequence were added during the
extension step.
A closer look at the top 10 contigs where more than 500 bp was added to the assembly during
93

Figure 3.5: The effect of performing a coverage-assisted re-assembly on a single contig (contig_10522).An additional 124 bp were added to the contig during assembly. 72 bp were added to the beginning and45 bp to the end of the contig due to a better estimate of the expected coverage of the contig.
94

extension revealed that the extensions still yielded biologically relevant molecules, as shown with the
alignment of the sequences against known protein coding sequences and against the sequences present
in the pre-extended dataset. For example, after the initial assembly contig_68291 (Figure 3.6) had a
region of low quality or coverage bases (the result from the stringent 8X coverage cutoff parameter) at
positions 65 and position 1832, spanning 40 and 54 bases respectively. During the re-assembly step,
when the contig sequence acted as a template sequence for the extended assembly and the 8X coverage
cutoff value was not enforced anymore, these regions of unknown bases were extended and repeated,
resulting in a total extension of 1 485 bp of low quality bases. By replacing these regions of low quality
bases with a stretch of four consecutive Ns (NNNN), and aligning the contig before and after extension,
the alignment indicates that the contig after extension actually had bases removed from the beginning
of the sequence due to the presence of the polyA region which could not be overcome by the assembler
(position 1-171 of the before-extension contig, see Figure 3.6). The alignment also indicates that a region
initially consisting of low quality bases at position 1838 of the pre-extension contig was resolved during
the extension step.
After applying a further restriction to the assembly to only include contigs equal to or longer than
200 bp, the final assembly contained 18 894 contigs representing 22 108 288 bp of sequence data (Table
3.1). The mean contig length was 908 bp, with the longest contig consisting of 12 053 bp. The N50 value
of the final assembly was 1640 bp. These sequences were then used for further contig validation, coding
sequence prediction and annotation.
3.3.2. Prediction of coding sequences
In order to determine whether or not the assembled transcripts were full-length, contiguous biological
molecules, coding sequence (CDS) predictions were performed on the assembled contigs to identify CDS,
open reading frames (ORFs) and transcriptional start and stop sites. The success rate of various CDS
detection software tools ranged from identifying 10 400 (7 776 single-exon and 2 624 multi-exon) contigs
containing valid coding sequences to 18 894 (16 568 single and 2 326 multi-exon) CDS containing contigs
95

Figure 3.6: The alignment of contig_68291 before and after extension. The alignment shows thatalthough 1 485 bases was reportedly added to the contig during extension, these bases mostly consistedof the extension of a low quality region containing Ns. The extension did however resolve a 88 bp regionof these low quality bases. The contig after extension also showed removed regions at the start and endof the original contig, due to the presence of a polyA region at the beginning of the sequence. The fullalignment of the two sequences is available in Appendix C.1.3.
Table 3.1: Comparing the assembled Velvet dataset before and after the coverage assisted extention.The most notable effect is observed in the increased length of the shorter reads (the Q1, median and Q3values).
Velvet assembly After assistedre-assembly
Final assembly(>=200 bp)
Number of contigs 38 597 38 597 18 894Amount of bases in assembly 22 883 310 23 272 382 22 108 288Shortest contig length (bp) 61 61 200First quartile length (Q1) (bp) 64 89 470Median contig length (bp) 137 358 908Third quartile length (Q3) (bp) 856 1 078 1573Maximum contig length (bp) 12 053 12 053 12 053Mean contig length (bp) 592.88 728.49 1170.12N50 length (bp) 1 550 1 570 1640Number of Ns in assembly (bp) 396 029 (1.73 %) 405 439 (1.74 %) 405 238 (1.83 %)
96

Table 3.2: Coding sequences predicted in the assembled dataset with different ab initio gene predictionsoftware packages.
Number of predicted exons GENSCAN GeneMark AUGUSTUS GLIMMER GeneID
Single exon 10 887 8 320 11 134 7 776 16 568Multiple exons 4 827 10 365 4 770 2 624 2 326
Total CDS predicted sequences 15 714 18 685 15 904 10 400 18 894
by the GLIMMER and GeneID software packages respectively (Table 3.2). GeneID assigned single-exon
status to each of the input contigs, a clear over-estimation of the number of contigs present in the
assembly, and the results were disgarded in further analysis. The prediction of single exon coding
sequences ranged from 38.70% of the complete dataset with the GeneMark prediction tool, to around
70% (69.28%, 70.00% and 74.76% with the GENSCAN, AUGUSTUS and GLIMMER tools respectively), with a
maximum of 87.69% by GeneID. When comparing the GENSCAN, GLIMMER and AUGUSTUS results, a total of
15 275 (94.85%) out of the maximum of 15 904 CDS-containing sequences were predicted by at least two
of the CDS prediction tools. GENSCAN predicted more than 98% of the total coding sequences predicted by
this subset of predictors, and the results from GENSCAN were subsequently used in downstream analysis.
Further analysis showed that 6 294 (39.57%) of the 15 904 predicted CDS had both start (ATG) and
stop (TAA, TGA or TAG) codons present as the first and last codons of the sequence, while 13 660
(81.91%) had one of the features present. Predicted partial CDS sequences with neither the start nor
stop codons present as the first and last positions of the contig comprised 14.19% (2 258 contigs) of the
total dataset.
3.3.3. Inspecting contig contiguity
In order to gain confidence in the quality of the assembled contigs, several sequence alignment ap-
proaches were followed to ensure that the assembled contigs were representive of biologically relevant
contiguous sequences and not assembly artifacts. Full length Eucalyptus cDNA sequences were retrieved
from GenBank, and aligned with the corresponding assembled contig and predicted CDS results from
GenScan (Figure 3.7 and the alignment of the predicted amino acid sequence on contig_5550 and the
GenBank sequence AF197329.1 in Figure 3.8). The alignment showed mismatches in the 5’ and 3’ UTR
97

regions between the GenBank and assembled contig sequences, but a high proportion of similarity in the
CDS alignments. For each of the 33 cDNA sequences (see Appendix C.1.1) a global alignment between
the cDNA, the contig and predicted CDS sequence was performed to evaluate the contig contiguity. The
short read library was then mapped to the cDNA, predicted CDS and assembled contig, and the depth
of coverage plotted across the length of each of the sequences. The multiple sequence alignment and the
coverage plots of the sequences were then used to construct a coverage-alignment plot for each of the
cDNA sequences (Figure 3.9 and Appendix C.1.2). Gaps in the alignment between the three sequences
as presented as gaps in the coverage across the region, and where regions of dissimilar sequence occur,
the coverage across the region will aid in detecting possible misassemblies.
Using the full-length cDNA sequences as template, 23 of the 33 (69%) comparisons revelealed the
presence of indels in either the cDNA sequence, the assembled contig, or the predicted CDS sequence.
For the purpose of this analysis, indels were defined as any insertion or deletion in the alignment between
the sequences longer than five base pairs. Of the 23 sequences where indels were detected, 17 (74%) had
indels within the predicted coding sequence, with the remaining indels present in the predicted UTR
regions. Twenty eight (85%) of the 33 sequences inspected contained both the 5’ and the 3’ UTRs, while
the remaining sequences contained at least one UTR sequence.
Inspection of the zinc transporter cDNA sequence AF197329 and its corresponding assembled con-
tig_5550 showed some initial indels present in the 5’ region of the assembled sequence when compared
to the cDNA sequence (Figure 3.9A). Various single base pair mismatches occur within the predicted
coding sequence (e.g. position 92 on the assembled contig), with a six base pair indel present at position
686 of the assembled contig. The coverage was calculated across the indel as 40X, indicating that the
indel is likely present in the mRNA-Seq sequenced sample, and is not an artifact of a missasembly. The
alignment of the three sequences is presented on the x-axis of Figure 3.9A, with the coverage across each
sequence plotted on the y-axis. The 6 bp gap in the alignment where the indel is present, is indicated by
a gap in the coverage (red line) of the graph. More indels were detected in the 3’ region of the assembled
transcript.
98
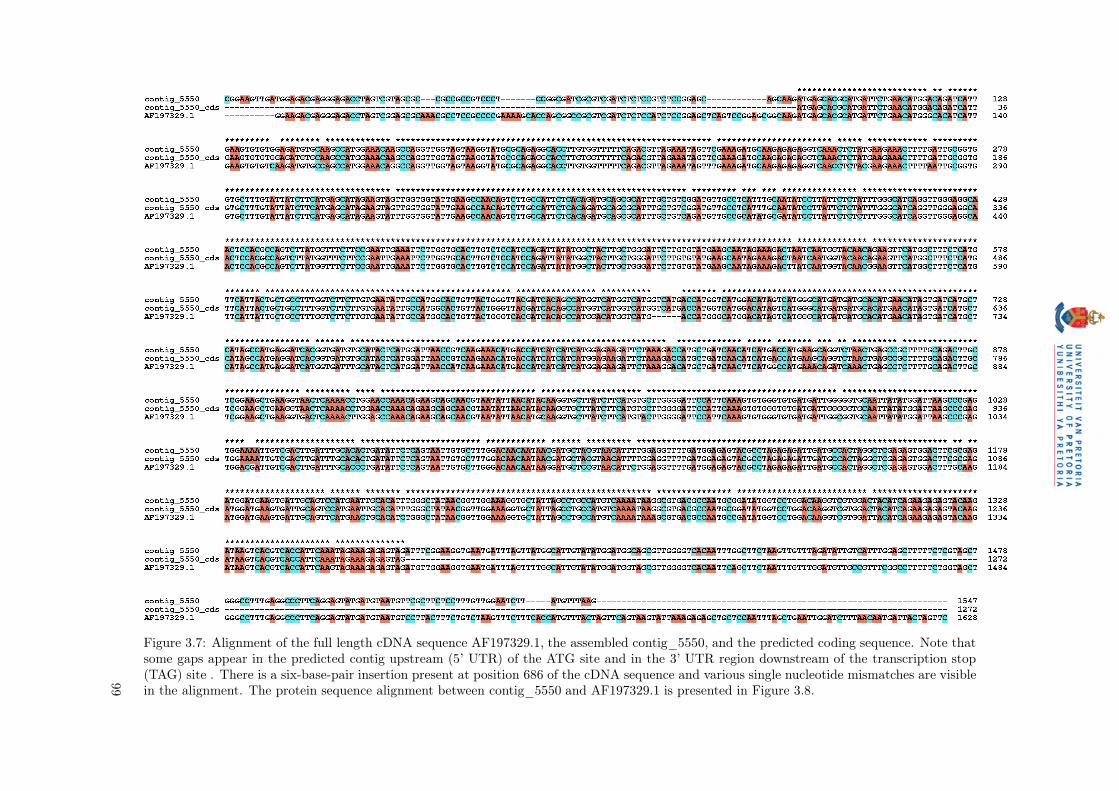
Figure 3.7: Alignment of the full length cDNA sequence AF197329.1, the assembled contig_5550, and the predicted coding sequence. Note thatsome gaps appear in the predicted contig upstream (5’ UTR) of the ATG site and in the 3’ UTR region downstream of the transcription stop(TAG) site . There is a six-base-pair insertion present at position 686 of the cDNA sequence and various single nucleotide mismatches are visiblein the alignment. The protein sequence alignment between contig_5550 and AF197329.1 is presented in Figure 3.8.
99

Figure 3.8: Alignment of the protein coding sequence of contig_5550 and the full length cDNA sequenceAF197329.1. The six basepair insert in the assembled contig (contig_5550) coded for the amino acidsglycine and histidine (at position 191 and 192) of the amino acid sequence. Alignment differencesbetween the two sequences can be attributed to the species differences and natural variation between thetwo organisms represented by the amino acid sequences.
The de novo transcriptome assembler OASES (Zerbino et al., unpublished which is based on the
Velvet assembler) was used to assemble a transcriptome using the same kmer parameters as was used
during the Velvet assembly. The OASES assembler corrects for the difference in expected coverage across
transcripts in a dataset, and is able to assemble alternative isoforms of a transcript. By comparing the
assembled Velvet contig (contig_5550) to the assembled OASES transcripts, six shorter transcripts were
identified in the OASES assembled dataset, with one of the transcripts (locus_19278) suggesting that
alternative isoforms of the transcript are present in the sequenced biological sample (Figure 3.9B). The
OASES assembler holds the promise to be able to detect alternative isoforms of a transcript, but at the
time of this study, it was found that it performs this function at the expense of assembling full-length
transcripts.
100

Figure 3.9: Alignment coverage figure of the full length cDNA sequence AF197329.1, the assembled homologous contig (contig_5550) and thepredicted CDS (A) and the OASES assembled transcripts (B). In figure A, the coverage per base are plotted on the y-axis, with the sequenceon the x-axis (1 574 bp long). The cyan and blue bars represent the calculated coverage of the assembled contig (cyan) and predicted CDSsequence (blue). The red bars represent the coverage of the genbank sequence (AF197329.1). The six bp indel present in the GenBank sequenceis indicated as a gap in the red coverage plot. In figure B, the assembled contig is presented as a light grey box at the top left of the figure. Thered bands indicates regions of high similarity between the assembled contig and the loci assembled with OASES, while blue bands indicate lowersimilarity scores. The figure illustrates that multiple loci are being assembled by OASES at the cost of assembling a single contiguous sequencewhen compared to the Velvet assembly.
101

3.3.4. Homology searches
The assembled contig diversity was inspected with the aid of homology-based comparisons of the
contigs against the different angiosperm transcriptomes. The EucAll (see Section 3.2.5) and assembled
gene catalog were binned into six different size categories, and the transcriptome sequences of Arabidopsis,
Populus and Vitis compared against the binned sequences (Table 3.3). The results indicate that the
assembled contig represented the same sequence diversity present in the EucAll dataset, but that a
larger number of contigs (1 865, 4 543 and 2 887 vs 6 185, 15 286 and 9 010 for Arabidopsis, Vitis and
Populus respectively ) are represent in the larger size categories (>2 000 bp) of the assembled contigs.
When comparing the assembled contig dataset against the selected angiosperm datasets, a large
percentage of the contigs (82% or 15 505 contigs) matched at least one other angiosperm gene sequences
(BLAST e-value cutoff at 1e−10 and min HSP length of 100 bp, Figure 3.10). Between the Populus and the
assembled Eucalyptus datasets, 14 769 sequences were common, while Eucalyptus and Vitis shared 14
883 sequences. Between Eucalyptus and Arabidopsis there were a common set of 14 231 sequences, while
3 552 sequences in Eucalyptus did not show similarity to any of the selected angiosperm transcriptomes
at an e-value cutoff of 1e−10.
3.3.5. InterProScan
The InterProScan pipeline annotated protein features and/or signatures on 10 557 (56%) of the 15 904
assembled contigs. During annotation, 2 504 distinct protein families (PFAM) were detected, assigning
family information to 85% (9 028 contigs) of the 10 557 annotated contigs. PANTHER analysis provided
4 274 distinct functional annotations, with 7 589 (40.16%) sequences annotated and 7 056 sequences
(37.43%) were classified in 724 distinct superfamilies, while 1 076 profiles were detected in 5 438 sequences.
Conserved domains identified with TIGR HMM models contributed 869 (4.6%) of the total annotations
utilising 492 models, and 364 (1.9%) sequences were annotated with 241 Protein Information Resource
(PIR) domain identifiers (Figure 3.11).
102

Table 3.3: A summary of the representation of Arabidopsis, Populus and Vitis genes (number of sequences in brackets) in the constructedpublic dataset (EucAll), and the assembled contig dataset at different e-value thresholds. The assembled contigs contained the same number ofhomologous contigs as the EucAll dataset (27 939 and 26 848 sequences in Arabidopsis), but contained more longer contigs than the publiclyavailable Eucalyptus datasets (> 2 000 bp).
Angiosperme-value EucAll dataset Assembled contigs>200bp >300bp >500bp >1000bp >2000bp >3000bp >200bp >300bp >500bp >1000bp >2000bp >3000bp
Arabidopsis1e−5 27 939 27 394 25 593 17 245 2 002 199 26 845 26 020 24 512 18 516 6 862 2 177(33 410) 1e−10 26 587 26 202 24 662 16 903 1 940 199 25 538 24 757 23 390 17 744 6 602 2 114
1e−20 24 302 24 129 23 093 16 279 1 865 191 23 242 22 545 21 485 16 569 6 185 1 978Vitis 1e−5 63 777 62 197 56 085 36 655 4 862 1 118 59 231 57 312 53 600 40 913 17 716 7 791(75 983) 1e−10 61 167 59 932 54 585 35 975 4 750 1 088 56 462 54 632 51 231 39 301 16 897 7 374
1e−20 55 264 54 713 50 806 34 412 4 543 989 50 953 49 274 46 526 36 064 15 286 6 522Populus 1e−5 38 723 37 835 34 827 23 340 3 107 483 36 922 35 737 33 487 25 348 10 197 3 673(45 779) 1e−10 36 981 36 308 33 730 22 891 3 038 466 35 131 34 011 31 987 24 395 9 813 3 521
1e−20 33 082 32 789 31 034 21 736 2 887 401 31 546 30 560 28 936 22 451 9 010 3 171
103

Figure 3.10: Similarity search results of the assembled Eucalyptus transcripts against three angiospermspecies. In total, 15 505 contigs had homologous sequences in either Populus (14 769), Vitis (14 833)or Arabidopsis (14 883). The results were filtered to contain only high similarity results (e-value 1e−10
and a minimum HSP length of 100 bp or 33 amino acids). There were 3 552 Eucalyptus sequences thatwere assembled but did not have homologous counterparts in the selected angiosperm datasets with thesefilter parameters.
3.3.6. Expression profiling
Relative gene expression in terms of Fragments of reads mapped Per Kilobase of exon per Million
mapped reads (FPKM, Trapnell et al., 2010) was calculated by mapping the six different mRNA-Seq
samples back to the assembled transcriptome, and calculating the transcript abundance with the TopHat
(Trapnell and Salzberg, 2009) and Cufflinks (Trapnell et al., 2010) software packages. The expression
ratio of the xylogenic tissues (average expression in xylem and immature xylem) vs. the non-xylogenic
tissues (average expression in shoot tips, mature and young leaf) were used to identify genes which
are differentially expressed between the woody and non-woody tissues. A 2X threshold was set, and 3
602 (19.06%) genes were identified with higher expression in the xylogenic tissues, while 879 (4.65%)
genes were expressed 2X higher in the non-xylogenic tissues (Figure 3.13A). The expression profile of
the selected genes indicate that the genes selected show patterns of co-expression across different tissues
(Figure 3.13B).
Gene ontology (GO) category analysis of the over expressed genes in the xylogenic tissues (Figure
104

Figure 3.11: The 20 most prevalent protein family (PFAM) and protein information resource (PIR)annotations from InterProScan analysis. The pie charts represent the frequency of the top 20 annotationsbased on PFAM (a), and PIR (b) annotations. The number of annotations in each annotation categoryis presented in the center of each pie chart. Leucine repeats and protein kinase-related family memberswere the most prevalent protein families, and hydrolases, ligases and chaperone protein domains the mostfrequently annotated PIR features.
105

Figure 3.12: The 20 most prevalent Panther (a) and Prosite (b) annotations from InterProScan analysis.Protein kinase signatures were the most prevalent in both annotation sets, as well as the WD40 andleucine-rich repeats.
106

Figure 3.13: Identifying over-expressed xylogenic and non-xylogenic genes (non-xylogenic tissues includemature leaf (ML), shoot tip (ST) and young leaf (YL) tissues, while xylogenic tissues include the imma-ture xylem (IX) and xylem (XY) tissues). Of the 18 894 genes, genes which are expressed 2X higher inxylogenic than non-xylogenic tissues and vice versa were identified (A). The expression profiles of thethree sets of genes indicate a trend towards co-expression of the genes in the different tissues (B).
107

3.14, Figure 3.15 and Figure 3.16) and the non-xylogenic tissues (Figure 3.14B) indicated an abundance
in transporter associated, catalytic activity and membrane associated proteins in the xylogenic tissues.
Additional structural components over represented include the vacuole and the plasma membrane, both
indicative of transport activity in these tissues. Photosynthetic biological processes and plastid associated
genes were most prevalent in the non-xylogenetic tissues, as expected for these photosynthetic tissues.
By mapping the Arabidopsis homologs of the 3 602 genes identified as being over-expressed in xy-
logenic tissues to the starch and sucrose metabolism pathway (KEGG map00500) in KEGG, xylem
over-represented enzymes in the KEGG pathway were identified. The enzymes fructokinase (EC:2.7.1.4),
dehydrogluconokinase (EC:2.7.1.13), UDP glucose pyrophosphorylase (EC:2.7.7.9) and alpha-galacturonosyl-transferase
(EC:2.4.1.43) showed the largest differentiation in expression in the xylogenic tissue (Figure 3.17). In the
photosyntesis pathway (KEGG map00195) the photosystem II enxymes psbR, psbS and psbP were the
most abundant, while the psaD, psaL and psaM photosynthesis I enzymes were the most differentially
expressed (Figure 3.18). The annotations of the top 30 genes identified as differentially expresed are
presented for xylogenic (Table 3.4) and phytosynthetic tissues (Table 3.5).ansferase
From Table 3.4 several known secondary cell wall proteins were identified as being over-expressed
in xylegenic tissues, which validates the approach of performing a de novo assembly with mRNA-Seq
data, and making use of the short-read data to infer transcript expression. This included genes in-
volved in growth and shoot development (AT3G53980, Che et al., 2006, AT3G23090, Yuen et al.,
2003, AT1G15080, Katagiri et al., 2005), heat shock, disease and stress response pathways (AT5G12030,
Wehmeyer and Vierling, 2000, AT5G59720 and AT4G10250, Nishizawa et al., 2006, AT3G53260, Wanner
et al., 1995, AT2G35980, Zheng et al., 2004, AT3G51780, Doukhanina et al., 2006, AT2G39530, Cartieaux
et al., 2003). Two proteins of unknown function (AT1G0961, Brown et al., 2005) and AT3G0998 that
contains the domain of unknown function (DUF662) have also been identified among others as being
over-expressed in xylogenic tissue. More importantly, xylem development genes, such as those identified
as being active in the xylem development transcriptional network (AT4G28380, Ko et al., 2006), those
involved in secondary cell wall construction (AT5G60490 and AT5G03170, Andersson-Gunnerås et al.,
108

Figure 3.14: Over-represented molecular function gene ontology terms of genes over-expressed in xylogenic and photosynthetic tissues. AMIGOresults of over-represented molecular function gene ontology terms in xylogenic (A) and photosynthetic (B) tissues. Xylogenic tissues containedan overrepresented set of terms associated with protein binding and genes with a catalytic activity, especially kinase and transferase activities.
109

Figure 3.15: Over-represented gene ontology terms of genes over-expressed in xylogenic and photosynthetic tissues. AMIGO results ofover-represented genes in xylogenic (A) and photosynthetic (B) tissues. Growth and protein modification processes dominated the xylogenictissues, while processed associated with biosynthesis and photosynthesis processes were abundant in the photosynthetic tissue dataset.
110

Figure 3.16: Over-represented cellular component gene ontology terms of genes over-expressed in xylogenic and photosynthetic tissues. AMIGOresults of over-represented genes in xylogenic (A) and photosynthetic (B) tissues. Cell wall and plasma membrane components were identifiedas over-represented term in the xylogenic tissues, while terms associated as part of the plastid were over-represented in the photosynthetic set ofgenes.
111

Figure 3.17: Differential gene expression between the xylogenic and photosynthetic genes represented on the starch and sugar metabolism KEGGpathway. The starch and sugar metabolism pathway were used to identify enzymes higher expressed in xylogenic than photosynthetic tissues.The enzymes are highlighted relative to their expression in both xylogenic (left) and photosynthetic (right) tissues, where a dark red indicates ahigher expression of the enzyme in the pathway. Results were generated by the Paintomics web-server.
112

Figure 3.18: Differential gene expression between the xylogenic and photosynthetic genes represented on the photosynthesis metabolism KEGGpathway. The pathway indivates several enzymes higher expressed in photosynthetic tissues compared to xylegenic tissues. The enzymes arehighlighted relative to their expression in both xylogenic (left) and photosynthetic (right) tissues, where a dark red indicates a higher expressionof the enzyme in the pathway. Results were generated by the Paintomics web-server.113

Table 3.4: The top 30 genes identified in the xylogenic tissues, compared to photosynthetic tissues. The ratio between xylogenic and photo-synthetic expression were used to select the genes with the biggest differential expression. Only genes with a match (e-value < e−10) to anArabidopsis homolog were included in the list.
Contig Name Arabidopsis homolog Description Ratiocontig_139 AT3G53980.2 Protease inhibitor/seed storage/lipid transfer protein (LTP) family protein 437.20contig_4304 AT5G12030.1 A. thaliana heat shock protein 17.6A; Unfolded protein binding 388.05contig_2918 AT5G59720.1 Heat shock protein 18.2 382.59contig_368 AT1G09610.1 unknown protein 362.02contig_14996 AT3G09980.1 unknown protein 351.51contig_16352 AT3G53260.1 Phenylalanine ammonia-lyase 332.46contig_954 AT2G35980.1 Yellow leaf specific gene 9 235.42contig_29940 AT4G28380.1 Leucine-rich repeat family protein 221.68contig_319 AT5G60490.1 FLA12 186.99contig_35092 AT4G10250.1 Heat shock protein 22.0 185.77contig_6941 AT5G01300.1 Phosphatidylethanolamine-binding family protein 176.87contig_17263 AT1G24530.1 Transducin family protein / WD-40 repeat family protein 172.50contig_13899 AT3G16920.1 Chitinase 170.75contig_31438 AT3G51780.1 A. thaliana BCL-2-associated Athnogene 4; protein binding 165.51contig_2525 AT3G23090.1 unknown protein 164.42contig_4068 AT3G16920.1 Chitinase 161.67contig_24841 AT1G15080.1 Acid phosphatase / phosphatidate phosphatase 157.65contig_21284 AT2G39530.1 Integral membrane protein 158.06contig_1039 AT4G12980.1 Auxin-responsive protein 148.23contig_63769 AT4G33430.1 BRI1-Associated receptor kinase; kinase/ protein binding / protein heterodimerization 145.16contig_41003 AT1G50590.1 Pirin 134.02contig_59694 AT2G30490.1 Ttrans-cinnamate 4-monooxygenase 131.12contig_3127 AT5G60020.1 Laccase 17 129.04contig_3811 AT1G27440.1 Catalytic/ glucuronoxylan glucuronosyltransferase 126.59contig_1532 AT3G16920.1 Chitinase 125.30contig_17037 AT1G73140.1 unknown protein 124.19contig_2707 AT5G03170.1 FLA11 122.99contig_27288 AT2G30395.1 Thalianaovate family protein 17 120.44contig_65667 AT1G72510.2 unknown protein 116.05contig_69508 AT3G16920.1 Chitinase 114.86
114

Table 3.5: Top 30 photosynthetic genes identified as over-expressed in photosynthetic tissue compared to xylogenic tissue. Only genes with aArabidopsis homolog (e-value < e−10) were considered for selection.
Contig Name Arabidopsis homolog Description Ratiocontig_17098 AT5G38430.1 Ribulose bisphosphate carboxylase small chain 1B / RuBisCO small subunit 1B (RBCS-1B) 393.58contig_14337 AT2G47400.1 CP12-1, CP12 221.94contig_22811 AT3G15353.1 Methallothionein 3; copper ion binding 191.79contig_93397 AT4G27450.1 Unknown protein 171.45contig_21245 AT5G47230.1 Ethylene responsove element binding factor 5; DNA binding transcription factor 166.67contig_40682 AT3G01500.3 Carbonic anhydrase 1; carbonate dehydratase/ zinc ion binding 141.56contig_86098 AT3G19390.1 Cysteine proteinase, putative / thiol protease 141.38contig_31364 AT1G44575.1 Nonphotochemical quencing (NPQ4); chlorophyll binding / xanthophyll binding 123.27contig_76583 AT5G22430.1 Unknown protein 91.95contig_3750 AT5G04660.1 Electron carrier/ heme binding / iron ion binding / monooxygenase/ oxygen binding 91.66contig_93320 AT4G37360.1 Electron carrier/ heme binding / iron ion binding / monooxygenase/ oxygen binding 91.57contig_65926 AT1G76080.1 Chloroplastic drought-induced stress protein of 32KD (CDSP32) 75.40contig_51400 AT4G29270.1 Acid phosphatase class B family protein 72.53contig_37387 AT5G59320.1 Lipid transfer protein 3 (LTP3) 64.85contig_46787 AT2G34430.1 Chlorophyll binding ( LHB1B1, LHCB1.4, LHB1B1) 46.80contig_74523 AT5G48480.1 Unknown protein 40.42contig_84512 AT4G37300.1 Maternal effect embryo arrest 59 (MEE59) 36.75contig_32402 AT4G00430.1 Plasma membrane intrinsic protein (TMP-C, PIP1;4, PIP1E); water channel 33.88contig_93894 AT4G24000.1 Cellulose synthase / transferase, transferring glycosyl groups (ATCSLG2, CSLG2) 33.51contig_49907 AT3G10450.1 Serine carboxypeptidase like 7; serine-type carboxypeptidase 31.02contig_61965 AT3G54420.1 Chitinase 26.92contig_54188 AT1G12090.1 Extensin-like protein; lipid binding 25.54contig_25739 AT1G79040.1 Photosystem II subunit R (PSBR) 24.49contig_92707 AT1G68570.1 Proton-dependent oligopeptide transport (POT) family protein 23.61contig_95912 AT4G25000.1 Alpha-amylase-like (ATAMY1, AMY1) 23.06contig_37372 AT5G09640.1 Serine-type carboxypeptidase/ sinapoyltransferase (SNG2) 23.01contig_38811 AT4G03280.1 Photosynthetic electron transfer C (PETC, PGR1) 22.80contig_83181 AT1G73270.1 Serine carboxypeptidase-like 6 (SCPL6) 22.03contig_95420 AT5G41120.1 Esterase / lipase / thioesterase family protein 21.92contig_89772 AT3G03980.1 Short-chain dehydrogenase/reductase (SDR) family protein 21.91
115

2006, AT3G16920, Brown et al., 2005, AT2G30490, Bayer et al., 2006, AT1G27440, Bosca et al., 2006,
AT1G73140 which contains DUF231, Bischoff et al., 2010) and lignin biosynthesis (AT5G60020, Sibout
et al., 2005 ) have been identified as up-regulated in the xylogenic tissues.
3.3.7. Single nucleotide polymorphism (SNP) detection
SNP diversity was investigated in a subset of the assembled contigs which were deemed to consist of
high quality, full length coding genes. The high quality contigs were selected based on the decision tree
shown in Figure 3.19. The total contig dataset was separated in CDS and non-CDS-containing reads, and
further classified according to homology matches (BLAST e-value of e−10 and a minimum HSP length of
100 bp) of the contigs against various datasets. The 13 806 contigs which contained a predicted CDS and
showed high levels of homology against angiosperm protein datasets (Arabidopsis thaliana, Vitis vinifera
and Populus trichocarpa) were selected for polymorphism analysis.
A total of 106 658 possible SNPs were observed in these 13 806 contigs. The average SNP density in a
predicted coding sequence was 0.21 SNP/100 bp (16 969 SNPs), while the SNP density in the predicted
UTR regions was seven fold higher (1.43 SNP/100 bp, 89 689 SNPs). The overall SNP density (CDS
and UTR regions) was 0.53 SNP/100 bp, with an average of 7.72 SNPs detected per contig.
3.4. Discussion
Deep Illumina mRNA-Seq data analysis of six different tissues of an actively growing six year old
Eucalyptus grandis x Eucalyptus urophylla tree was used to assemble and annotatate 18 894 expressed
gene transcripts (Table 3.1), producing a well-annotated gene catalog of expressed eucalypt transcripts.
The assembly process consisted of performing multiple assemblies of the data with the Velvet assembler
in order to identify the set of input parameters that produces the longest contigs with the most bases,
corresponding to near full length gene models (Figure 3.3). The assemblies were evaluated with a scoring
function that accounts for the number of bases, the number of contigs and the length of contigs to
evaluate an assembly (Section 2.3.3). The final assembly (assembly parameters: kmer=31, expected
116

Figure 3.19: Selection of high quality, high confidence contigs for polymorphism detection. The totaldataset were queried for contigs that matched against A. thaliana, P. trichocarpa or V. Vinifera proteins,and seperated based on the presence of a predicted CDS (A and B). The remaining contigs were then usedto identify matches against the E. grandis genome sequence (B and C), and the NCBI non-redundant(NR) protein database (E and F, and G and H).
117

coverage = 1 000 and a coverage cutoff value of 8X) consisted of 22.8 million bases in approximately 40
000 contigs (Table 3.1). A novel assembly strategy, where the expected coverage value of each individual
contig was calculated and the contig together with all the reads that matched to the contig were used
for a coverage assisted re-assembly, yielded an additional 400 000 bases to the assembly, with most of
the additional bases added to the shorter contigs (Section 3.2.2, Table 3.1 and Figure 3.4). The final
assembly, containing only contigs longer than 200 bp, comprised of 22.1 Mbp transcript catalog in 18 894
contigs with an N50 length of 1 640 bp. Further inspection of the extended contigs indicated that most
of the additional reads added during the coverage-assisted re-assembly were added to the start and end
of the de novo assembled contigs (Figure 3.5 and Appendix B), with the exceptions of some low quality
regions (Ns in the assembled contig), that became artificially elongated during the re-assembly process.
This dataset represents the most complete gene catalog for a Eucalyptus forest tree produced making
use of uHTS technology data (Novaes et al., 2008).
Due to the nature of the assembler used, the assembled dataset would not contain full length al-
ternative transcripts of the gene models assembled. De Bruijn graph assemblers returns the longest
contigs with the most coverage as a consensus contig, and alternative fragments would be lost. De
novo transcriptome specific assemblers, such as trans-ABySS (Birol et al., 2009), OASES (Zerbino et al.,
unpublished) and Trinity (Grabherr et al., 2011), became available at the end of the lifetime project and
were not considered as alternative assemblers. The chosen assembler did however manage to assembly
long contiguous transcripts that could be used for transcriptome profiling.
Ab initio coding sequence prediction tools were used to identify transcriptional start and stop sites in
the assembled dataset. These prediction tools were developed to make use of genomic sequence, where
it relies on finding sequence features in a predefined order, for example, in a 5’ to 3’ direction. These
methods take into account the presence of promotor regions, the TSS, 5’ UTR, start codon, exons, splice
donors, introns, splice acceptors, stop codons, 3’ UTR and polyA tail. In the case of partially assembled
contigs producing coding sequences, when a feature needed for that stage of the HMM prediction state
is not present, the predictor would be unable to exit the current state and fail to continue searching for
118

features in the rest of the sequence, resulting in a negative or incomplete CDS prediction. This can be
classified as a false negative prediction, since the gene product is present in the assembly, but the gene
model is incomplete. Much of the variation in the prediction of coding sequences can be attributed to
the low sensitivity (70%) and specificity (60%) generally observed by ab initio gene prediction software
(Blanco and Guigó, 2005), and together with the incomplete nature of the assembled contigs, most of the
variation in coding sequence prediction results are explained (Table 3.2). The GENSCAN tool predicted
98% of the total coding sequences predicted by a combination of GLIMMER, GENSCAN and AUGUSTUS. The
predicted CDS from GENSCAN were subsequently used to evaluate the contiguity of the assembled contigs.
A total of 33 full-length cDNA sequences representing a range of gene families were used to inspect
the contiguity of the assembled contigs and predicted CDS sequences. Short indels were present in most
of the UTR regions of the assembled sequences when compared to the full-length cDNA sequences, with
a very low frequency of indels present in the CDS sequences. No gross misassemblies were observed in
the tested dataset (Appendix C.1.2). Results from the de novo transcriptome assembler OASES were also
compared to the assembled dataset, but the extended Velvet assembly produced longer, higher quality
contigs in general. To further assess the quality of the assembled dataset, an in depth comparison between
the predicted gene models based on the genome sequence will be performed when the gene models become
available, but the current analysis provided great confidence in the quality and contiguity of the de novo
assembled gene catalog.
The diversity of the assembled contigs was firstly evaluated by performing various homology-based
searches against other angiosperm datasets. The assembled dataset represented longer, more diverse
sequences than the previously available public dataset (EucAll), and over 14 000 contigs showed high
similarity with other angiosperm species. A subset of the sequences did not show any homology to known
angiosperm proteins, and these will be further investigated when the full set of gene models are available
from the Eucalyptus genome annotation effort. InterProScan analysis provided the second measure of
diversity for the assembled dataset. Over 10 000 protein sequences were annotated with a functional
domain, allocating sequences to over 2 500 distinct protein families. These annotation together with the
119

Gene Ontology annotations made to the assembled dataset assigned valuable functional annotations to
the sequences, which became especially useful during the expression profiling of the sequences.
By assigning relative expression values, in the form of FPKM values to each of the genes for each
of the tissues sampled and sequenced, genes highly expressed in wood forming (xylogenic) and photo-
synthetic tissues were identified. The results indicate, as expected, that the xylogenetic tissues have an
over-abundance of transporter-associated, catalytic- and membrane-associated genes expressed, as well
as an over-expressed set of structural proteins. Photosynthetic pathways and processes were the most
abundant in the leafy and phloem tissues. A similar approach was followed in Mizrachi et al. (2010),
where genes for which a high correlation in terms of expression patterns with some of the primary cell
wall genes was observed. The database of expression patterns developed will serve as an starting point
for more in depth analysis of expression correlation and tissue specific expression of various genes and
pathways in future studies.
In the 13 806 contigs that were considered for putative SNP detection, 16 696 SNPs were identified
in coding regions (0.206 SNPs/100 bp, 89 962 SNPs were identified in UTRs), resulting in an overall
SNP density for coding an non-coding regions of 0.534 SNPs/100 bp (compared to genomic SNP density
of one SNP per 17 bp, Külheim et al., 2009). Furthermore, the theoretical designability of Illumina
GoldenGate and Infinium HD Genotyping assays (http://www.illumina.com) was determined. This
analysis ignored the presence of introns in the sequence, and is thus an over-estimation of the number
of possible SNPs that can be used in the assays. Of the 106 658 putative SNPs, 73% (77 631) passed
the initial 50 bp flanking window filter where no other polymorphisms should be present in order for
the probes to bind, of which 16% (12 285 SNPs or 0.17 SNPs/100 bp) occurred within predicted coding
regions. For the 60 bp window, a total of 12 070 coding regions SNPs (0.168 SNPs/100 bp) and 64 225
UTR SNPs (1.207 SNPs/100 bp) were detected. Assay designability performed by the Illumina support
team (http://www.illumina.com/support) revealed that 68 606 (90%) of the SNPs had an Infinium HD
Assay designability score higher than 0.8, and 68 579 (90%) had GoldenGate Genotype designability
scores of 1.0. These results indicate that by designing the SNP assays based on the coding regions of the
120

genomic sequence, these two Illumina platforms could be useful for SNP genotyping and genetic mapping
of thousands of expressed genes in a interspecific hybrid pedigree.
3.5. Conclusion
In this study we succesfully assembled a draft gene catalog of an Eucalyptus grandis x Eucalyptus
urophylla hybrid clone using deep mRNA-Seq from six different sampled tissues. The assembled tran-
scriptome was evaluated in terms of contig contiguity and homology to other angiosperm transcriptomes.
The assembled dataset does not contain only full length transcripts, but through investigation into the
structure and nature of the assembled contigs, it can confidently be described as the most complete gene
catalog hitherto of a single Eucalyptus tree. The level of completeness of the transcripts can only be
fully evaluated when a complete, annotated genome sequence becomes available.
Functional annotations were assigned to the assembled transcriptome dataset, providing insight to
the active transcriptional landscape of the organism. The expression profile of each assembled contig
in the six sampled tissues were calculated and used to identify over-expressed genes in xylogenic and
photosynthetic tissues. Several genes known to be active in secondary cell-wall formation (such as
FLA11 and FLA12) and lignin biosynthesis (such as LAC17) were identified in the list op top 30 genes
over-expressed in xylogenic tissues.
The dataset produced can be considered as a first step towards identifying transcriptional control
networks active in a fast-growing wood-forming organism. Transcriptional profiles of individual trees with
different genetic background (mapping populations), disease and physiological states will soon become
available, which will soon shed more information on the level of gene co-expression and underlying active
trancriptional modules involved in wood formation.