A Comprehensive Transcriptome Assembly of...
9
Molecular Plant • Volume 5 • Number 5 • Pages 1020–1028 • September 2012 RESEARCH ARTICLE A Comprehensive Transcriptome Assembly of Pigeonpea (Cajanus cajan L.) using Sanger and Second-Generation Sequencing Platforms Himabindu Kudapa a , Arvind K. Bharti b , Steven B. Cannon c,d , Andrew D. Farmer b , Benjamin Mulaosmanovic c , Robin Kramer b , Abhishek Bohra a , Nathan T. Weeks c , John A. Crow b , Reetu Tuteja a , Trushar Shah a , Sutapa Dutta e , Deepak K. Gupta e , Archana Singh e , Kishor Gaikwad e , Tilak R. Sharma e , Gregory D. May b , Nagendra K. Singh e and Rajeev K. Varshney a,f,1 a International Crops Research Institute for the Semi-Arid Tropics (ICRISAT), Patancheru 502324, India b National Center for Genome Resources (NCGR), Santa Fe, NM 87505, USA c United States Department of Agriculture–Agricultural Research Service (USDA–ARS), Corn Insects and Crop Genetics Research Unit, Ames, IA, USA d Department of Agronomy, Iowa State University, Amens, IA, USA e National Research Centre on Plant Biotechnology (NRCPB), Indian Agricultural Research Institute, New Delhi 110 012, India f CGIAR Generation Challenge Programme (GCP), c/o CIMMYT, 06600 Mexico DF, Mexico ABSTRACT A comprehensive transcriptome assembly for pigeonpea has been developed by analyzing 128.9 million short Illumina GA IIx single end reads, 2.19 million single end FLX/454 reads, and 18 353 Sanger expressed sequenced tags from more than 16 genotypes. The resultant transcriptome assembly, referred to as CcTA v2, comprised 21 434 transcript as- sembly contigs (TACs) with an N50 of 1510 bp, the largest one being ;8 kb. Of the 21 434 TACs, 16 622 (77.5%) could be mapped on to the soybean genome build 1.0.9 under fairly stringent alignment parameters. Based on knowledge of intron junctions, 10 009 primer pairs were designed from 5033 TACs for amplifying intron spanning regions (ISRs). By using in silico mapping of BAC-end-derived SSR loci of pigeonpea on the soybean genome as a reference, putative mapping posi- tions at the chromosome level were predicted for 6284 ISR markers, covering all 11 pigeonpea chromosomes. A subset of 128 ISR markers were analyzed on a set of eight genotypes. While 116 markers were validated, 70 markers showed one to three alleles, with an average of 0.16 polymorphism information content (PIC) value. In summary, the CcTA v2 transcript assembly and ISR markers will serve as a useful resource to accelerate genetic research and breeding applications in pigeonpea. Key words: Cajanus cajan (L.); second-generation sequencing; transcriptome assembly; intron spanning region (ISR) markers. INTRODUCTION Pigeonpea (Cajanus cajan (L.) Millspaugh) is an important food legume crop of tropical and subtropical regions of the world. It is a diploid (2n = 2x = 22), with moderate genome size of 858 Mbp (Greilhuber and Obermayer, 1998). The genus Cajanus comprises 32 species, most of which are found in India and Aus- tralia, and one is native to West Africa (Bohra et al., 2011a). Pigeonpea is grown in 4.67 Mha across the world and India is the world’s largest producer (van der Maesen, 1990). It is an important crop in south Asia, the Caribbean, and parts of Africa and South America. Pigeonpea is a vital source of protein (with 20–22% protein by dry weight), especially in vegetarian diets (Duke, 1981). Key limitations to sustainable pigeonpea production are several abiotic stresses (e.g. drought, salinity and water- logging) and biotic stresses (e.g. Fusarium wilt (FW), sterility mosaic disease (SMD), and pod borer insects). Addressing these limitations is critical to meeting the demands of resource-poor 1 To whom correspondence should be addressed at address a . E-mail r.k.varsh [email protected], tel. +91 4030713305, fax +91 40 30713074. ª The Author 2012. Published by the Molecular Plant Shanghai Editorial IPPE, SIBS, CAS. This is an Open Access article distributed under the terms of the Creative Com- mons Attribution Non-Commercial License (http://creativecommons.org/ licenses/by-nc/3.0), which permits unrestricted non-commercial use, distribu- tion, and reproduction in any medium, provided the original work is properly cited. doi: 10.1093/mp/ssr111 Received 27 September 2011; accepted 29 November 2011 , Advance access publication 11 January 2012 Office in association with Oxford University Press on behalf of CSPB and at International Crops Research Institute for the Semi-Arid Tropics on October 4, 2012 http://mplant.oxfordjournals.org/ Downloaded from
Transcript of A Comprehensive Transcriptome Assembly of...
Molecular Plant • Volume 5 • Number 5 • Pages 1020–1028 • September 2012 RESEARCH ARTICLEMolecular Plant • Pages 1–9, 2012 RESEARCH ARTICLE
A Comprehensive Transcriptome Assembly ofPigeonpea (Cajanus cajan L.) using Sanger andSecond-Generation Sequencing Platforms
Himabindu Kudapaa, Arvind K. Bhartib, Steven B. Cannonc,d, Andrew D. Farmerb,Benjamin Mulaosmanovicc, Robin Kramerb, Abhishek Bohraa, Nathan T. Weeksc, John A. Crowb,Reetu Tutejaa, Trushar Shaha, Sutapa Duttae, Deepak K. Guptae, Archana Singhe, Kishor Gaikwade,Tilak R. Sharmae, Gregory D. Mayb, Nagendra K. Singhe and Rajeev K. Varshneya,f,1
a International Crops Research Institute for the Semi-Arid Tropics (ICRISAT), Patancheru 502324, Indiab National Center for Genome Resources (NCGR), Santa Fe, NM 87505, USAc United States Department of Agriculture–Agricultural Research Service (USDA–ARS), Corn Insects and Crop Genetics Research Unit, Ames, IA, USAd Department of Agronomy, Iowa State University, Amens, IA, USAe National Research Centre on Plant Biotechnology (NRCPB), Indian Agricultural Research Institute, New Delhi 110 012, Indiaf CGIAR Generation Challenge Programme (GCP), c/o CIMMYT, 06600 Mexico DF, Mexico
ABSTRACT A comprehensive transcriptome assembly for pigeonpea has been developed by analyzing 128.9million short
Illumina GA IIx single end reads, 2.19 million single end FLX/454 reads, and 18 353 Sanger expressed sequenced tags from
more than 16 genotypes. The resultant transcriptome assembly, referred to as CcTA v2, comprised 21 434 transcript as-
sembly contigs (TACs) with an N50 of 1510 bp, the largest one being ;8 kb. Of the 21 434 TACs, 16 622 (77.5%) could be
mapped on to the soybean genome build 1.0.9 under fairly stringent alignment parameters. Based on knowledge of intron
junctions, 10 009 primer pairs were designed from 5033 TACs for amplifying intron spanning regions (ISRs). By using in
silico mapping of BAC-end-derived SSR loci of pigeonpea on the soybean genome as a reference, putative mapping posi-
tions at the chromosome level were predicted for 6284 ISR markers, covering all 11 pigeonpea chromosomes. A subset of
128 ISR markers were analyzed on a set of eight genotypes. While 116 markers were validated, 70 markers showed one to
three alleles, with an average of 0.16 polymorphism information content (PIC) value. In summary, the CcTA v2 transcript
assembly and ISR markers will serve as a useful resource to accelerate genetic research and breeding applications in
pigeonpea.
Key words: Cajanus cajan (L.); second-generation sequencing; transcriptome assembly; intron spanning region (ISR)
markers.
INTRODUCTION
Pigeonpea (Cajanus cajan (L.) Millspaugh) is an important food
legume crop of tropical and subtropical regions of theworld. It
is a diploid (2n = 2x = 22), with moderate genome size of 858
Mbp (Greilhuber and Obermayer, 1998). The genus Cajanus
comprises 32 species,most ofwhich are found in India andAus-
tralia, and one is native to West Africa (Bohra et al., 2011a).
Pigeonpea is grown in 4.67 Mha across the world and India
is the world’s largest producer (van der Maesen, 1990). It is
an important crop in south Asia, the Caribbean, and parts
of Africa and South America. Pigeonpea is a vital source of
protein (with 20–22% protein by dry weight), especially in
vegetarian diets (Duke, 1981).
Key limitations to sustainable pigeonpea production are
several abiotic stresses (e.g. drought, salinity and water-
logging) and biotic stresses (e.g. Fusarium wilt (FW), sterility
mosaic disease (SMD), and pod borer insects). Addressing these
limitations is critical to meeting the demands of resource-poor
1 To whom correspondence should be addressed at addressa. E-mail r.k.varsh
[email protected], tel. +91 4030713305, fax +91 40 30713074.
ª The Author 2012. Published by the Molecular Plant Shanghai Editorial
Office in association with Oxford University Press on behalf of CSPP and
IPPE, SIBS, CAS.
This is an Open Access article distributed under the terms of the Creative Com-
mons Attribution Non-Commercial License (http://creativecommons.org/
licenses/by-nc/3.0), which permits unrestricted non-commercial use, distribu-
tion, and reproduction in any medium, provided the original work is properly
cited.
doi: 10.1093/mp/ssr111
Received 27 September 2011; accepted 29 November 2011
people where pigeonpea is grown. Although there are con-
tinuing efforts for pigeonpea improvement through conven-
tional breeding (Reddy et al., 1978; Saxena et al., 1983;Wanjari
and Patel, 2003; Saxena, 2008), and molecular breeding has
a great potential to enhance crop productivity (Varshney et al.,
2010), limited availability of genomic resources coupled with
a narrow genetic diversity in the cultivated gene pool have
been serious bottlenecks to successful molecular breeding in
pigeonpea (Varshney et al., 2009a).
Genomic resources like molecular markers, genetic maps,
transcriptomic, or genome sequence data are prerequisites
for undertaking molecular breeding in any crop. In the case
of pigeonpea, efforts have been made only recently to develop
some genomic resources. These include 88 860 bacterial artifi-
cial chromosome (BAC)-end sequences (BESs), 3072 BES-derived
simple sequence repeat (SSR, or BES-SSR)markers, a 239 BES-SSR
locus geneticmap (Bohra et al., 2011a), 18 353 Sanger ESTs (Raju
et al., 2010; unpublished), and 1.696 million FLX/454 reads
(Dutta et al., 2011). Additionally, 494 353 FLX/454 reads and
128.9 million short Illumina GA IIx single end reads have also
been generated (Dubey et al., 2011). The 494 353 FLX/454 reads
along with the 10 817 Sanger ESTs available at the time were
merged to generate a transcript assembly (CcTA v1) comprising
48 726 contigs (Dubey et al., 2011).
To improve the resources for pigeonpea genetics research
and breeding applications, the present study was undertaken
to develop a comprehensive transcriptome assembly based
on a hybrid approach consisting of Sanger ESTs and mRNA-
Seq data from two different next-generation sequencing
platforms (Illumina GA IIx and FLX/454). This new assembly
(CcTA v2) is available through the Legume Information System
(LIS) website at http://cajca.comparative-legumes.org/data/
lista_cajca-201012.tgz. These transcript assembly contigs (TACs)
were aligned to the genome sequence of soybean (Glycine
max), also in the Phaseoleae tribe and separated from Cajanus
by about 20 Mya (Stefanovic et al., 2009). With the help of an-
choring points between pigeonpea and soybean genomes, in-
tron spanning region (ISR) markers were developed. Probable
chromosomal assignments for more than 6000 ISRmarkers have
been predicted for pigeonpea on the basis of location of the ISR
markers in the soybean genome, and the locations of mapped
BES-SSR loci in the pigeonpea genetic map that were used as
anchor points between the pigeonpea and soybean genomes.
Validation of a subset of ISR markers underlines the utility of
these markers to enrich the existing pigeonpea genetic maps
and identification of the quantitative trait loci (QTLs) for
resistance/tolerance to biotic/abiotic stresses.
RESULTS
Development of an Improved Transcriptome Assembly
Four datasets, including 128.9 million Illumina GA IIx reads
from 12 genotypes (Dataset I), 2.19 million FLX/454 reads from
three genotypes (Datasets II and III), and 18 353 Sanger ESTs
from six genotypes (Dataset IV) were processed to generate
the transcriptome assembly CcTA v2 (Table 1). The transcrip-
tome assembly comprises 21 434 TACs.
When the datasets above were analyzed individually in ear-
lier studies, a wide range of TAC counts were reported: 4557
contigs from 9888 Sanger ESTs (Raju et al., 2010) and 43 324
contigs from 1.696 million FLX/454 reads (Dutta et al., 2011).
The CcTA v1 (Dubey et al., 2011), assembled from 494 353
454/FLX reads and 10 817 Sanger ESTs, produced an assembly
of 48 726 contigs. The transcriptome assembly in this study, re-
ferred to as CcTA v2, has numerous improved characteristics
(Table 2). For instance, the CcTA v2 has a total of 21 434 TACs,
with N50 of 1510 bp, while the CcTA v1 included 48 726 con-
tigs, with N50 length of only 285 bp (Dubey et al., 2011). The
largest TAC in CcTA v2 is 7909 bp, which is almost four times
larger than that in the CcTA v1, with 2067 bp.
To check for microbial contamination, if any, all 21 434 TACs
of the transcriptome assembly (CcTA v2) were BLASTed against
NCBI’s bacterial genomes database. Only 49 TACs had signifi-
cant hits to bacterial genomes. These 49 TACs were further
BLASTed against NCBI’s EST_others database (non-human,
non-mouse).While 45 TACs hadhitwithpigeonpea cDNA librar-
ies or other plant cDNAs, only four TACs (lista_cajca-201012
TACs# 9664, 18316, 21003, and 21371) still showed hit with mi-
crobial ESTs. However, three of these TACs (lista_cajca-201012
TACs# 9664, 18316, and 21371) could bemapped to the soybean
genome at .90% sequence similarity and 80% coverage of
query length. Therefore, these TACs also could be considered
legitimate transcript contigs. The remaining one TAC (lista_
cajca-201012 TAC# 21003) could also bemapped to soybean ge-
nome at a lower stringency, namely .85% sequence similarity
and.50% coverage of query length. Therefore, the developed
transcriptome assembly seems to be of high quality without any
microbial contamination.
Comparison of CcTA v2 with the Soybean Genome
All TACs of CcTA v2were aligned to the soybean genome (ftp://
ftp.jgi-psf.org/pub/JGI_data/phytozome/v7.0/Gmax/) using the
HMM-based alignment program Exonerate 2.2.0 (Slater and
Birney, 2005), to investigate gene coverage and gene struc-
tures of pigeonpea. Using the alignment criteria of 80% iden-
tity and 50% coverage, of the 21 434 TACs, 16 622 (77.5%)
could be aligned. These alignments can be visualized in
the soybean genome browser, using the track ‘Cajanus
cajan (pigeonpea) v.2’, at http://soybase.org/gb2/gbrowse/
gmax1.01. It is encouraging to note that 27 490 predicted
soybean genes have matches, and that the overall distribu-
tion of soybean gene models covered by the CcTA v2 is rel-
atively even across all 20 soybean chromosomes, ranging
from 50 to 73%of predicted soybean genes per chromosome
with pigeonpea matches (Table 3). Further, 9863 (59.3%) out
of 16 622 CcTA v2 TACs had two good matches with the soy-
bean genome, consistent with the recent genome duplica-
tion in soybean with respect to pigeonpea, while an
additional 20% had three or four good matches, as might
2 | Kudapa et al. d Transcriptome Assembly of Pigeonpea
, Advance access publication 11 January 2012
Office in association with Oxford University Press on behalf of CSPB and
at International Crops R
esearch Institute for the Semi-A
rid Tropics on O
ctober 4, 2012http://m
plant.oxfordjournals.org/D
ownloaded from
Kudapa et al. • Transcriptome Assembly of Pigeonpea 1021Molecular Plant • Pages 1–9, 2012 RESEARCH ARTICLE
A Comprehensive Transcriptome Assembly ofPigeonpea (Cajanus cajan L.) using Sanger andSecond-Generation Sequencing Platforms
Himabindu Kudapaa, Arvind K. Bhartib, Steven B. Cannonc,d, Andrew D. Farmerb,Benjamin Mulaosmanovicc, Robin Kramerb, Abhishek Bohraa, Nathan T. Weeksc, John A. Crowb,Reetu Tutejaa, Trushar Shaha, Sutapa Duttae, Deepak K. Guptae, Archana Singhe, Kishor Gaikwade,Tilak R. Sharmae, Gregory D. Mayb, Nagendra K. Singhe and Rajeev K. Varshneya,f,1
a International Crops Research Institute for the Semi-Arid Tropics (ICRISAT), Patancheru 502324, Indiab National Center for Genome Resources (NCGR), Santa Fe, NM 87505, USAc United States Department of Agriculture–Agricultural Research Service (USDA–ARS), Corn Insects and Crop Genetics Research Unit, Ames, IA, USAd Department of Agronomy, Iowa State University, Amens, IA, USAe National Research Centre on Plant Biotechnology (NRCPB), Indian Agricultural Research Institute, New Delhi 110 012, Indiaf CGIAR Generation Challenge Programme (GCP), c/o CIMMYT, 06600 Mexico DF, Mexico
ABSTRACT A comprehensive transcriptome assembly for pigeonpea has been developed by analyzing 128.9million short
Illumina GA IIx single end reads, 2.19 million single end FLX/454 reads, and 18 353 Sanger expressed sequenced tags from
more than 16 genotypes. The resultant transcriptome assembly, referred to as CcTA v2, comprised 21 434 transcript as-
sembly contigs (TACs) with an N50 of 1510 bp, the largest one being ;8 kb. Of the 21 434 TACs, 16 622 (77.5%) could be
mapped on to the soybean genome build 1.0.9 under fairly stringent alignment parameters. Based on knowledge of intron
junctions, 10 009 primer pairs were designed from 5033 TACs for amplifying intron spanning regions (ISRs). By using in
silico mapping of BAC-end-derived SSR loci of pigeonpea on the soybean genome as a reference, putative mapping posi-
tions at the chromosome level were predicted for 6284 ISR markers, covering all 11 pigeonpea chromosomes. A subset of
128 ISR markers were analyzed on a set of eight genotypes. While 116 markers were validated, 70 markers showed one to
three alleles, with an average of 0.16 polymorphism information content (PIC) value. In summary, the CcTA v2 transcript
assembly and ISR markers will serve as a useful resource to accelerate genetic research and breeding applications in
pigeonpea.
Key words: Cajanus cajan (L.); second-generation sequencing; transcriptome assembly; intron spanning region (ISR)
markers.
INTRODUCTION
Pigeonpea (Cajanus cajan (L.) Millspaugh) is an important food
legume crop of tropical and subtropical regions of theworld. It
is a diploid (2n = 2x = 22), with moderate genome size of 858
Mbp (Greilhuber and Obermayer, 1998). The genus Cajanus
comprises 32 species,most ofwhich are found in India andAus-
tralia, and one is native to West Africa (Bohra et al., 2011a).
Pigeonpea is grown in 4.67 Mha across the world and India
is the world’s largest producer (van der Maesen, 1990). It is
an important crop in south Asia, the Caribbean, and parts
of Africa and South America. Pigeonpea is a vital source of
protein (with 20–22% protein by dry weight), especially in
vegetarian diets (Duke, 1981).
Key limitations to sustainable pigeonpea production are
several abiotic stresses (e.g. drought, salinity and water-
logging) and biotic stresses (e.g. Fusarium wilt (FW), sterility
mosaic disease (SMD), and pod borer insects). Addressing these
limitations is critical to meeting the demands of resource-poor
1 To whom correspondence should be addressed at addressa. E-mail r.k.varsh
[email protected], tel. +91 4030713305, fax +91 40 30713074.
ª The Author 2012. Published by the Molecular Plant Shanghai Editorial
Office in association with Oxford University Press on behalf of CSPP and
IPPE, SIBS, CAS.
This is an Open Access article distributed under the terms of the Creative Com-
mons Attribution Non-Commercial License (http://creativecommons.org/
licenses/by-nc/3.0), which permits unrestricted non-commercial use, distribu-
tion, and reproduction in any medium, provided the original work is properly
cited.
doi: 10.1093/mp/ssr111
Received 27 September 2011; accepted 29 November 2011
people where pigeonpea is grown. Although there are con-
tinuing efforts for pigeonpea improvement through conven-
tional breeding (Reddy et al., 1978; Saxena et al., 1983;Wanjari
and Patel, 2003; Saxena, 2008), and molecular breeding has
a great potential to enhance crop productivity (Varshney et al.,
2010), limited availability of genomic resources coupled with
a narrow genetic diversity in the cultivated gene pool have
been serious bottlenecks to successful molecular breeding in
pigeonpea (Varshney et al., 2009a).
Genomic resources like molecular markers, genetic maps,
transcriptomic, or genome sequence data are prerequisites
for undertaking molecular breeding in any crop. In the case
of pigeonpea, efforts have been made only recently to develop
some genomic resources. These include 88 860 bacterial artifi-
cial chromosome (BAC)-end sequences (BESs), 3072 BES-derived
simple sequence repeat (SSR, or BES-SSR)markers, a 239 BES-SSR
locus geneticmap (Bohra et al., 2011a), 18 353 Sanger ESTs (Raju
et al., 2010; unpublished), and 1.696 million FLX/454 reads
(Dutta et al., 2011). Additionally, 494 353 FLX/454 reads and
128.9 million short Illumina GA IIx single end reads have also
been generated (Dubey et al., 2011). The 494 353 FLX/454 reads
along with the 10 817 Sanger ESTs available at the time were
merged to generate a transcript assembly (CcTA v1) comprising
48 726 contigs (Dubey et al., 2011).
To improve the resources for pigeonpea genetics research
and breeding applications, the present study was undertaken
to develop a comprehensive transcriptome assembly based
on a hybrid approach consisting of Sanger ESTs and mRNA-
Seq data from two different next-generation sequencing
platforms (Illumina GA IIx and FLX/454). This new assembly
(CcTA v2) is available through the Legume Information System
(LIS) website at http://cajca.comparative-legumes.org/data/
lista_cajca-201012.tgz. These transcript assembly contigs (TACs)
were aligned to the genome sequence of soybean (Glycine
max), also in the Phaseoleae tribe and separated from Cajanus
by about 20 Mya (Stefanovic et al., 2009). With the help of an-
choring points between pigeonpea and soybean genomes, in-
tron spanning region (ISR) markers were developed. Probable
chromosomal assignments for more than 6000 ISRmarkers have
been predicted for pigeonpea on the basis of location of the ISR
markers in the soybean genome, and the locations of mapped
BES-SSR loci in the pigeonpea genetic map that were used as
anchor points between the pigeonpea and soybean genomes.
Validation of a subset of ISR markers underlines the utility of
these markers to enrich the existing pigeonpea genetic maps
and identification of the quantitative trait loci (QTLs) for
resistance/tolerance to biotic/abiotic stresses.
RESULTS
Development of an Improved Transcriptome Assembly
Four datasets, including 128.9 million Illumina GA IIx reads
from 12 genotypes (Dataset I), 2.19 million FLX/454 reads from
three genotypes (Datasets II and III), and 18 353 Sanger ESTs
from six genotypes (Dataset IV) were processed to generate
the transcriptome assembly CcTA v2 (Table 1). The transcrip-
tome assembly comprises 21 434 TACs.
When the datasets above were analyzed individually in ear-
lier studies, a wide range of TAC counts were reported: 4557
contigs from 9888 Sanger ESTs (Raju et al., 2010) and 43 324
contigs from 1.696 million FLX/454 reads (Dutta et al., 2011).
The CcTA v1 (Dubey et al., 2011), assembled from 494 353
454/FLX reads and 10 817 Sanger ESTs, produced an assembly
of 48 726 contigs. The transcriptome assembly in this study, re-
ferred to as CcTA v2, has numerous improved characteristics
(Table 2). For instance, the CcTA v2 has a total of 21 434 TACs,
with N50 of 1510 bp, while the CcTA v1 included 48 726 con-
tigs, with N50 length of only 285 bp (Dubey et al., 2011). The
largest TAC in CcTA v2 is 7909 bp, which is almost four times
larger than that in the CcTA v1, with 2067 bp.
To check for microbial contamination, if any, all 21 434 TACs
of the transcriptome assembly (CcTA v2) were BLASTed against
NCBI’s bacterial genomes database. Only 49 TACs had signifi-
cant hits to bacterial genomes. These 49 TACs were further
BLASTed against NCBI’s EST_others database (non-human,
non-mouse).While 45 TACs hadhitwithpigeonpea cDNA librar-
ies or other plant cDNAs, only four TACs (lista_cajca-201012
TACs# 9664, 18316, 21003, and 21371) still showed hit with mi-
crobial ESTs. However, three of these TACs (lista_cajca-201012
TACs# 9664, 18316, and 21371) could bemapped to the soybean
genome at .90% sequence similarity and 80% coverage of
query length. Therefore, these TACs also could be considered
legitimate transcript contigs. The remaining one TAC (lista_
cajca-201012 TAC# 21003) could also bemapped to soybean ge-
nome at a lower stringency, namely .85% sequence similarity
and.50% coverage of query length. Therefore, the developed
transcriptome assembly seems to be of high quality without any
microbial contamination.
Comparison of CcTA v2 with the Soybean Genome
All TACs of CcTA v2were aligned to the soybean genome (ftp://
ftp.jgi-psf.org/pub/JGI_data/phytozome/v7.0/Gmax/) using the
HMM-based alignment program Exonerate 2.2.0 (Slater and
Birney, 2005), to investigate gene coverage and gene struc-
tures of pigeonpea. Using the alignment criteria of 80% iden-
tity and 50% coverage, of the 21 434 TACs, 16 622 (77.5%)
could be aligned. These alignments can be visualized in
the soybean genome browser, using the track ‘Cajanus
cajan (pigeonpea) v.2’, at http://soybase.org/gb2/gbrowse/
gmax1.01. It is encouraging to note that 27 490 predicted
soybean genes have matches, and that the overall distribu-
tion of soybean gene models covered by the CcTA v2 is rel-
atively even across all 20 soybean chromosomes, ranging
from 50 to 73%of predicted soybean genes per chromosome
with pigeonpea matches (Table 3). Further, 9863 (59.3%) out
of 16 622 CcTA v2 TACs had two good matches with the soy-
bean genome, consistent with the recent genome duplica-
tion in soybean with respect to pigeonpea, while an
additional 20% had three or four good matches, as might
2 | Kudapa et al. d Transcriptome Assembly of Pigeonpea
at International Crops R
esearch Institute for the Semi-A
rid Tropics on O
ctober 4, 2012http://m
plant.oxfordjournals.org/D
ownloaded from
1022 Kudapa et al. • Transcriptome Assembly of Pigeonpea
be expected given the ancient whole-genome duplication
event in pappilionoids ;59 Mya (Schmutz et al., 2010).
Details of the number of pigeonpea TACs mapped onto soy-
bean at a given number of times are given in Supplemental
Table 1. Synteny and commonalities between pigeonpea
TACs and soybean genes can be visualized genome-wide
in soybean Gbrowse (http://soybase.org/gb2/gbrowse/
gmax1.01) (Figure 1).
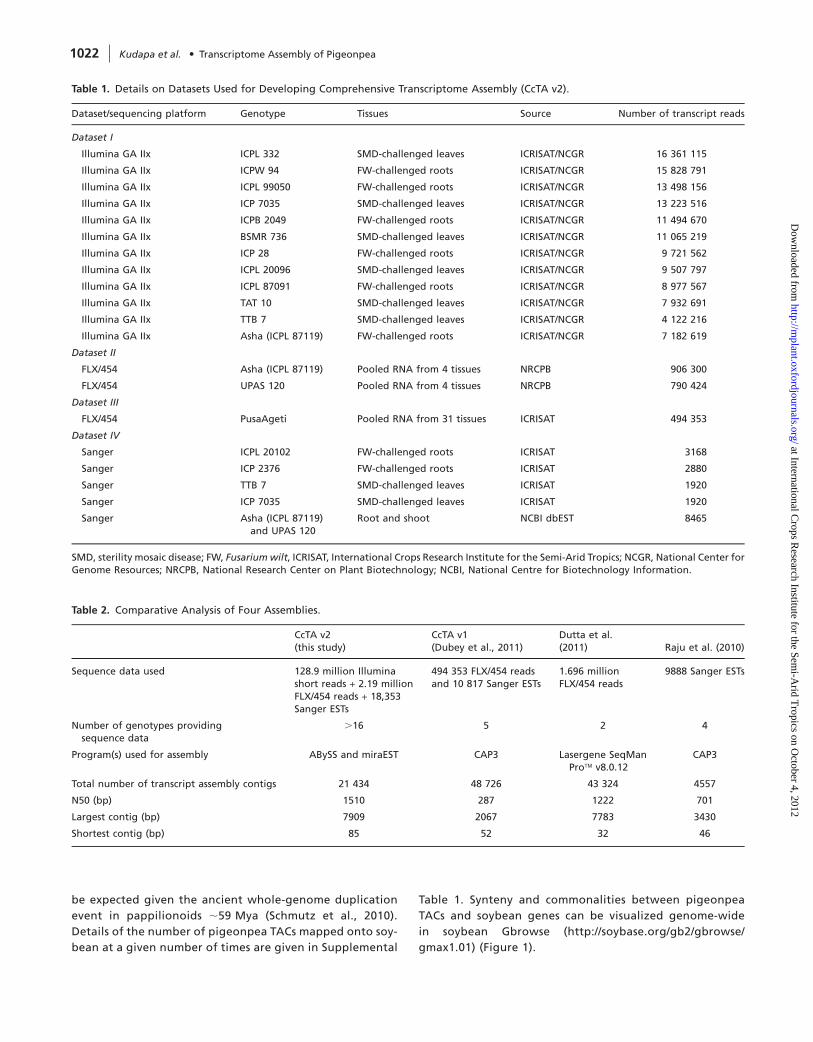
Table 1. Details on Datasets Used for Developing Comprehensive Transcriptome Assembly (CcTA v2).
Dataset/sequencing platform Genotype Tissues Source Number of transcript reads
Dataset I
Illumina GA IIx ICPL 332 SMD-challenged leaves ICRISAT/NCGR 16 361 115
Illumina GA IIx ICPW 94 FW-challenged roots ICRISAT/NCGR 15 828 791
Illumina GA IIx ICPL 99050 FW-challenged roots ICRISAT/NCGR 13 498 156
Illumina GA IIx ICP 7035 SMD-challenged leaves ICRISAT/NCGR 13 223 516
Illumina GA IIx ICPB 2049 FW-challenged roots ICRISAT/NCGR 11 494 670
Illumina GA IIx BSMR 736 SMD-challenged leaves ICRISAT/NCGR 11 065 219
Illumina GA IIx ICP 28 FW-challenged roots ICRISAT/NCGR 9 721 562
Illumina GA IIx ICPL 20096 SMD-challenged leaves ICRISAT/NCGR 9 507 797
Illumina GA IIx ICPL 87091 FW-challenged roots ICRISAT/NCGR 8 977 567
Illumina GA IIx TAT 10 SMD-challenged leaves ICRISAT/NCGR 7 932 691
Illumina GA IIx TTB 7 SMD-challenged leaves ICRISAT/NCGR 4 122 216
Illumina GA IIx Asha (ICPL 87119) FW-challenged roots ICRISAT/NCGR 7 182 619
Dataset II
FLX/454 Asha (ICPL 87119) Pooled RNA from 4 tissues NRCPB 906 300
FLX/454 UPAS 120 Pooled RNA from 4 tissues NRCPB 790 424
Dataset III
FLX/454 PusaAgeti Pooled RNA from 31 tissues ICRISAT 494 353
Dataset IV
Sanger ICPL 20102 FW-challenged roots ICRISAT 3168
Sanger ICP 2376 FW-challenged roots ICRISAT 2880
Sanger TTB 7 SMD-challenged leaves ICRISAT 1920
Sanger ICP 7035 SMD-challenged leaves ICRISAT 1920
Sanger Asha (ICPL 87119)and UPAS 120
Root and shoot NCBI dbEST 8465
SMD, sterility mosaic disease; FW, Fusariumwilt, ICRISAT, International Crops Research Institute for the Semi-Arid Tropics; NCGR, National Center forGenome Resources; NRCPB, National Research Center on Plant Biotechnology; NCBI, National Centre for Biotechnology Information.
Table 2. Comparative Analysis of Four Assemblies.
CcTA v2(this study)
CcTA v1(Dubey et al., 2011)
Dutta et al.(2011) Raju et al. (2010)
Sequence data used 128.9 million Illuminashort reads + 2.19 millionFLX/454 reads + 18,353Sanger ESTs
494 353 FLX/454 readsand 10 817 Sanger ESTs
1.696 millionFLX/454 reads
9888 Sanger ESTs
Number of genotypes providingsequence data
.16 5 2 4
Program(s) used for assembly ABySS and miraEST CAP3 Lasergene SeqManPro� v8.0.12
CAP3
Total number of transcript assembly contigs 21 434 48 726 43 324 4557
N50 (bp) 1510 287 1222 701
Largest contig (bp) 7909 2067 7783 3430
Shortest contig (bp) 85 52 32 46
Kudapa et al. d Transcriptome Assembly of Pigeonpea | 3
Development of ISR Markers
The alignment of the CcTA v2 transcriptome assembly with the
soybean genome predicted 10 009 intron spanning regions
(ISRs), for a total of 5033 TACs. The alignments and primer sets
can be viewed on the SoyBase genome browser at http://bit.ly/
Cajca_ISR3, and are available for download at http://cajca.
comparative-legumes.org/data/contrib/cajanus_cajan_v2_
primers.txt.gz. A minimum of one and a maximum of 19 ISRs
were designed against each of the matched soybean gene
(varying based on the number of introns in a gene and the abil-
ity of the primer prediction software to identify low-copy ISR
markers across the introns). The largest number of genes with
ISR markers (1516) contained two markers.
Selection of Genome-Wide Set of ISR Markers
In addition to the identification of ISR markers in pigeonpea,
approximatemapping positions for a portion of these markers
were predicted based on syntenic regions between pigeonpea
and soybean genomes, using mapped BES-SSR loci in the
pigeonpea genetic map as anchor points. In this context,
239 pigeonpea BES-SSR loci (Bohra et al., 2011a), mapped onto
the genome sequence of soybean, were used for identifying
the syntenic regions between the pigeonpea and soybean
genomes. Of these 239 BES-SSR loci, 93 showed probable
synteny in soybean chromosomes, and were used to identify
putative linkage groups for 6284 pigeonpea ISR markers.
This method produced putative linkage group assignments
for all 11 of the pigeonpea linkage groups. The strongest
associations were for Gm10 and CcLG02, and for Gm14 and
CcLG10; for these associations, there were 12 and 10 markers
in syntenic regions, respectively; and putative placements for
888 and 738 ISRs on CcLG02 and CcLG10, respectively. Details of
correspondences of other ISR markers between soybean
chromosome and expected pigeonpea CcLGs are given in
Supplemental Table 2.
ISR Marker Polymorphism
Primer pairs were designed and synthesized for a total of 128
ISR markers. All these primer pairs were screened for amplifi-
cation of DNA from two pigeonpea genotypes, namely ICP 28
and the popular variety Asha (ICPL 87119). This analysis iden-
tified a set of 116 markers (90.6%) with scorable amplicons.
These 128 ISR markers corresponded to 10 pigeonpea linkage
groups, generally distributed evenly—as assessed relative to
the syntenic regions on soybean chromosomes. Screening of
these 116 ISRs on eight pigeonpea genotypes including seven
cultivated (ICPL 332, ICPL 99050, ICPB 2049, ICP 28, ICPL 20096,
ICPL 87091, and ICPL 87119) and one wild (ICPW 94) showed
length polymorphism (two to three alleles) (Figure 2) with 70
(54.6%) markers (Table 4 and Supplemental Table 3). The poly-
morphism information content (PIC) value for the polymorphic
markers ranged from 0.19 to 1.00, with an average of 0.16.
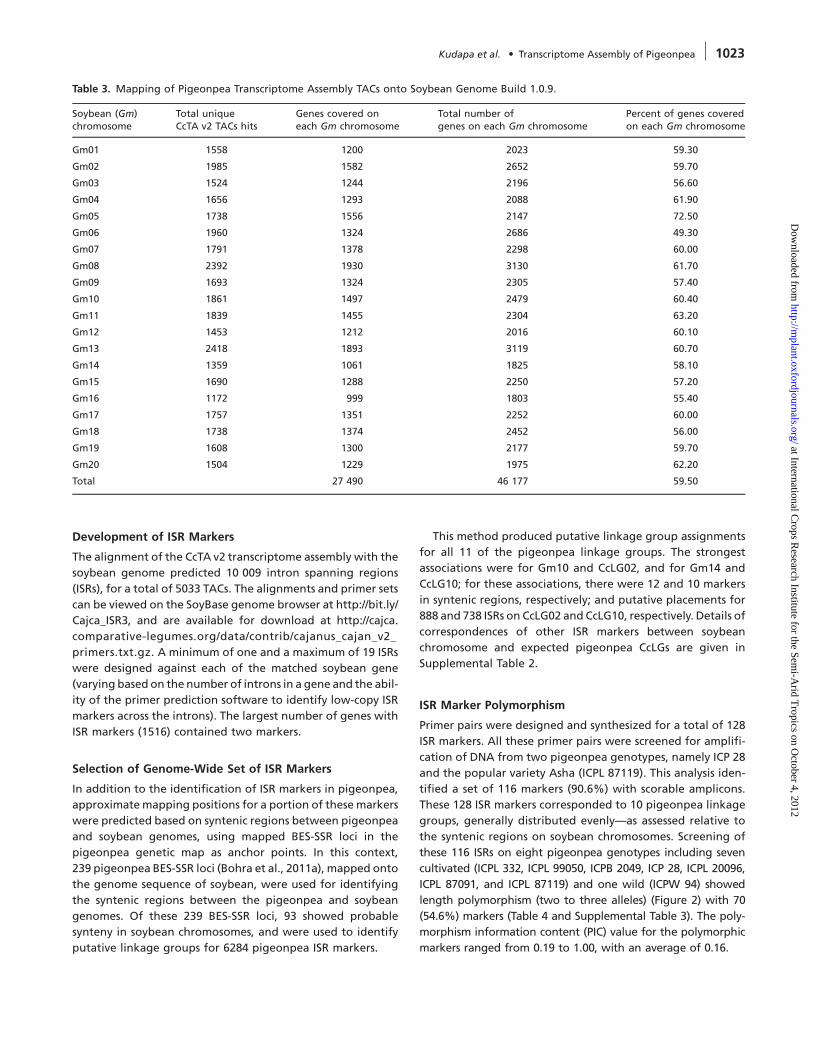
Table 3. Mapping of Pigeonpea Transcriptome Assembly TACs onto Soybean Genome Build 1.0.9.
Soybean (Gm)chromosome
Total uniqueCcTA v2 TACs hits
Genes covered oneach Gm chromosome
Total number ofgenes on each Gm chromosome
Percent of genes coveredon each Gm chromosome
Gm01 1558 1200 2023 59.30
Gm02 1985 1582 2652 59.70
Gm03 1524 1244 2196 56.60
Gm04 1656 1293 2088 61.90
Gm05 1738 1556 2147 72.50
Gm06 1960 1324 2686 49.30
Gm07 1791 1378 2298 60.00
Gm08 2392 1930 3130 61.70
Gm09 1693 1324 2305 57.40
Gm10 1861 1497 2479 60.40
Gm11 1839 1455 2304 63.20
Gm12 1453 1212 2016 60.10
Gm13 2418 1893 3119 60.70
Gm14 1359 1061 1825 58.10
Gm15 1690 1288 2250 57.20
Gm16 1172 999 1803 55.40
Gm17 1757 1351 2252 60.00
Gm18 1738 1374 2452 56.00
Gm19 1608 1300 2177 59.70
Gm20 1504 1229 1975 62.20
Total 27 490 46 177 59.50
4 | Kudapa et al. d Transcriptome Assembly of Pigeonpea
at International Crops R
esearch Institute for the Semi-A
rid Tropics on O
ctober 4, 2012http://m
plant.oxfordjournals.org/D
ownloaded from
Kudapa et al. • Transcriptome Assembly of Pigeonpea 1023
be expected given the ancient whole-genome duplication
event in pappilionoids ;59 Mya (Schmutz et al., 2010).
Details of the number of pigeonpea TACs mapped onto soy-
bean at a given number of times are given in Supplemental
Table 1. Synteny and commonalities between pigeonpea
TACs and soybean genes can be visualized genome-wide
in soybean Gbrowse (http://soybase.org/gb2/gbrowse/
gmax1.01) (Figure 1).
Table 1. Details on Datasets Used for Developing Comprehensive Transcriptome Assembly (CcTA v2).
Dataset/sequencing platform Genotype Tissues Source Number of transcript reads
Dataset I
Illumina GA IIx ICPL 332 SMD-challenged leaves ICRISAT/NCGR 16 361 115
Illumina GA IIx ICPW 94 FW-challenged roots ICRISAT/NCGR 15 828 791
Illumina GA IIx ICPL 99050 FW-challenged roots ICRISAT/NCGR 13 498 156
Illumina GA IIx ICP 7035 SMD-challenged leaves ICRISAT/NCGR 13 223 516
Illumina GA IIx ICPB 2049 FW-challenged roots ICRISAT/NCGR 11 494 670
Illumina GA IIx BSMR 736 SMD-challenged leaves ICRISAT/NCGR 11 065 219
Illumina GA IIx ICP 28 FW-challenged roots ICRISAT/NCGR 9 721 562
Illumina GA IIx ICPL 20096 SMD-challenged leaves ICRISAT/NCGR 9 507 797
Illumina GA IIx ICPL 87091 FW-challenged roots ICRISAT/NCGR 8 977 567
Illumina GA IIx TAT 10 SMD-challenged leaves ICRISAT/NCGR 7 932 691
Illumina GA IIx TTB 7 SMD-challenged leaves ICRISAT/NCGR 4 122 216
Illumina GA IIx Asha (ICPL 87119) FW-challenged roots ICRISAT/NCGR 7 182 619
Dataset II
FLX/454 Asha (ICPL 87119) Pooled RNA from 4 tissues NRCPB 906 300
FLX/454 UPAS 120 Pooled RNA from 4 tissues NRCPB 790 424
Dataset III
FLX/454 PusaAgeti Pooled RNA from 31 tissues ICRISAT 494 353
Dataset IV
Sanger ICPL 20102 FW-challenged roots ICRISAT 3168
Sanger ICP 2376 FW-challenged roots ICRISAT 2880
Sanger TTB 7 SMD-challenged leaves ICRISAT 1920
Sanger ICP 7035 SMD-challenged leaves ICRISAT 1920
Sanger Asha (ICPL 87119)and UPAS 120
Root and shoot NCBI dbEST 8465
SMD, sterility mosaic disease; FW, Fusariumwilt, ICRISAT, International Crops Research Institute for the Semi-Arid Tropics; NCGR, National Center forGenome Resources; NRCPB, National Research Center on Plant Biotechnology; NCBI, National Centre for Biotechnology Information.
Table 2. Comparative Analysis of Four Assemblies.
CcTA v2(this study)
CcTA v1(Dubey et al., 2011)
Dutta et al.(2011) Raju et al. (2010)
Sequence data used 128.9 million Illuminashort reads + 2.19 millionFLX/454 reads + 18,353Sanger ESTs
494 353 FLX/454 readsand 10 817 Sanger ESTs
1.696 millionFLX/454 reads
9888 Sanger ESTs
Number of genotypes providingsequence data
.16 5 2 4
Program(s) used for assembly ABySS and miraEST CAP3 Lasergene SeqManPro� v8.0.12
CAP3
Total number of transcript assembly contigs 21 434 48 726 43 324 4557
N50 (bp) 1510 287 1222 701
Largest contig (bp) 7909 2067 7783 3430
Shortest contig (bp) 85 52 32 46
Kudapa et al. d Transcriptome Assembly of Pigeonpea | 3
Development of ISR Markers
The alignment of the CcTA v2 transcriptome assembly with the
soybean genome predicted 10 009 intron spanning regions
(ISRs), for a total of 5033 TACs. The alignments and primer sets
can be viewed on the SoyBase genome browser at http://bit.ly/
Cajca_ISR3, and are available for download at http://cajca.
comparative-legumes.org/data/contrib/cajanus_cajan_v2_
primers.txt.gz. A minimum of one and a maximum of 19 ISRs
were designed against each of the matched soybean gene
(varying based on the number of introns in a gene and the abil-
ity of the primer prediction software to identify low-copy ISR
markers across the introns). The largest number of genes with
ISR markers (1516) contained two markers.
Selection of Genome-Wide Set of ISR Markers
In addition to the identification of ISR markers in pigeonpea,
approximatemapping positions for a portion of these markers
were predicted based on syntenic regions between pigeonpea
and soybean genomes, using mapped BES-SSR loci in the
pigeonpea genetic map as anchor points. In this context,
239 pigeonpea BES-SSR loci (Bohra et al., 2011a), mapped onto
the genome sequence of soybean, were used for identifying
the syntenic regions between the pigeonpea and soybean
genomes. Of these 239 BES-SSR loci, 93 showed probable
synteny in soybean chromosomes, and were used to identify
putative linkage groups for 6284 pigeonpea ISR markers.
This method produced putative linkage group assignments
for all 11 of the pigeonpea linkage groups. The strongest
associations were for Gm10 and CcLG02, and for Gm14 and
CcLG10; for these associations, there were 12 and 10 markers
in syntenic regions, respectively; and putative placements for
888 and 738 ISRs on CcLG02 and CcLG10, respectively. Details of
correspondences of other ISR markers between soybean
chromosome and expected pigeonpea CcLGs are given in
Supplemental Table 2.
ISR Marker Polymorphism
Primer pairs were designed and synthesized for a total of 128
ISR markers. All these primer pairs were screened for amplifi-
cation of DNA from two pigeonpea genotypes, namely ICP 28
and the popular variety Asha (ICPL 87119). This analysis iden-
tified a set of 116 markers (90.6%) with scorable amplicons.
These 128 ISR markers corresponded to 10 pigeonpea linkage
groups, generally distributed evenly—as assessed relative to
the syntenic regions on soybean chromosomes. Screening of
these 116 ISRs on eight pigeonpea genotypes including seven
cultivated (ICPL 332, ICPL 99050, ICPB 2049, ICP 28, ICPL 20096,
ICPL 87091, and ICPL 87119) and one wild (ICPW 94) showed
length polymorphism (two to three alleles) (Figure 2) with 70
(54.6%) markers (Table 4 and Supplemental Table 3). The poly-
morphism information content (PIC) value for the polymorphic
markers ranged from 0.19 to 1.00, with an average of 0.16.
Table 3. Mapping of Pigeonpea Transcriptome Assembly TACs onto Soybean Genome Build 1.0.9.
Soybean (Gm)chromosome
Total uniqueCcTA v2 TACs hits
Genes covered oneach Gm chromosome
Total number ofgenes on each Gm chromosome
Percent of genes coveredon each Gm chromosome
Gm01 1558 1200 2023 59.30
Gm02 1985 1582 2652 59.70
Gm03 1524 1244 2196 56.60
Gm04 1656 1293 2088 61.90
Gm05 1738 1556 2147 72.50
Gm06 1960 1324 2686 49.30
Gm07 1791 1378 2298 60.00
Gm08 2392 1930 3130 61.70
Gm09 1693 1324 2305 57.40
Gm10 1861 1497 2479 60.40
Gm11 1839 1455 2304 63.20
Gm12 1453 1212 2016 60.10
Gm13 2418 1893 3119 60.70
Gm14 1359 1061 1825 58.10
Gm15 1690 1288 2250 57.20
Gm16 1172 999 1803 55.40
Gm17 1757 1351 2252 60.00
Gm18 1738 1374 2452 56.00
Gm19 1608 1300 2177 59.70
Gm20 1504 1229 1975 62.20
Total 27 490 46 177 59.50
4 | Kudapa et al. d Transcriptome Assembly of Pigeonpea
at International Crops R
esearch Institute for the Semi-A
rid Tropics on O
ctober 4, 2012http://m
plant.oxfordjournals.org/D
ownloaded from
1024 Kudapa et al. • Transcriptome Assembly of Pigeonpea
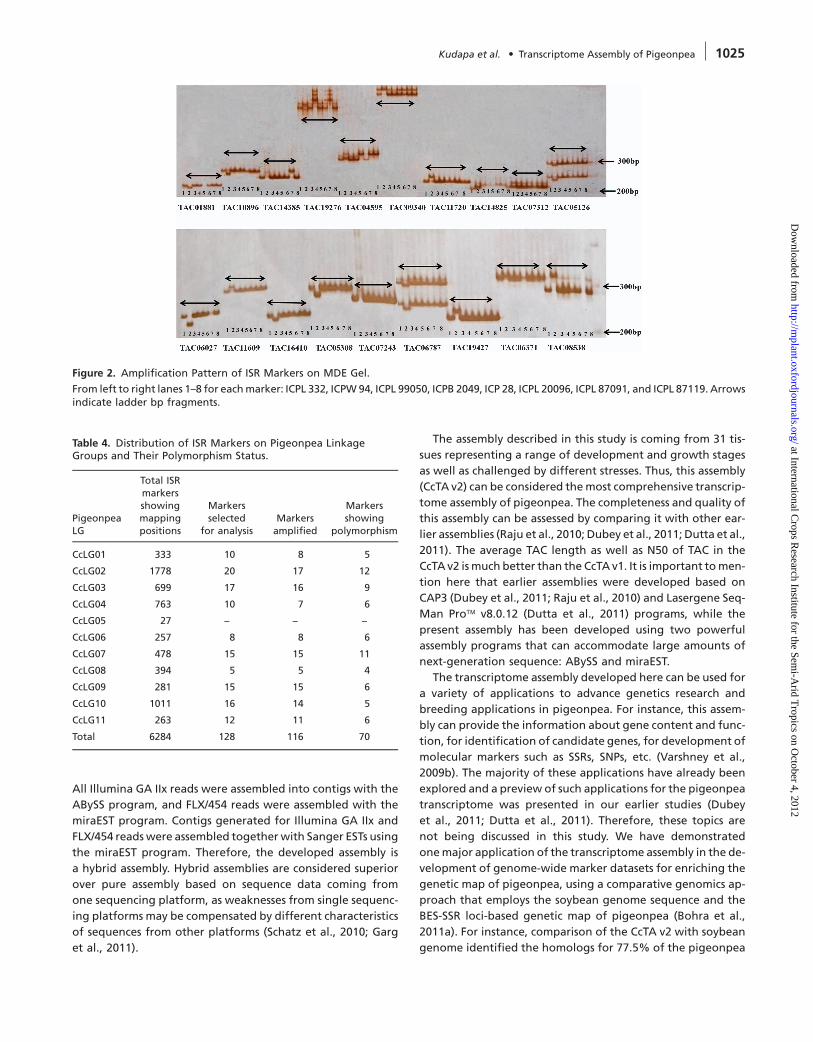
With an objective of identification of SNPs and indels with
ISR markers, as an example, sequence data were generated for
eight pigeonpea genotypes with six ISR markers (TAC12160,
TAC08538, TAC10495, TAC04354, TAC18853, and TAC07243). Af-
ter trimming low-quality sequences at both ends, sequencedata
were aligned and analyzed for occurrence of SNPs and indels in
the eight genotypes.While sixmarkers showed 27 SNPs and two
ISR markers (TAC08538 and TAC07243) showed two indels be-
tween the wild species, ICPW 94 and seven cultivated species
(ICPL 332, ICPL 99050, ICPB 2049, ICP 28, ICPL 20096, ICPL
87091, and ICPL 87119) (Supplemental Table 4 and Supplemen-
tal Figure 1). Indels observed in the cases of TAC08538 and
TAC07243 markers were confirmed on mutation detection en-
hancement (MDE) gel as mentioned above (Figure 2).
DISCUSSION
In pigeonpea, conventional breeding to date has proceeded
without the support of molecular methods. Limited use of
germplasm over the course of pigeonpea domestication has
also resulted in a very narrow genetic base (Yang et al.,
2006). As a result, pigeonpea genetic improvement programs
have made comparatively little progress and hence have faced
problems in addressing key constrains to crop production, in-
cluding a range of abiotic stresses (e.g. drought, salinity, wa-
ter-logging) and biotic stresses (e.g. Fusarium wilt, sterility
mosaic disease, Helicoverpa armigera). Only during last five
years some efforts have been made to develop genomic
resources such as SSRs, ESTs, genetic, maps and transcriptome
assemblies in pigeonpea (Varshney et al., 2009a, 2010). The
available genetic maps, especially based on intra-specific map-
ping populations, do not have a good marker density (Bohra
et al., 2011b; Gnanesh et al., 2011).
This study reports a comprehensive transcriptome assembly
that is based on 131 million sequence reads coming from
a range of tissues of more than 16 different pigeonpea geno-
types. We employed two assembly programs in order to take
advantage of the characteristics of the constituent sequences.
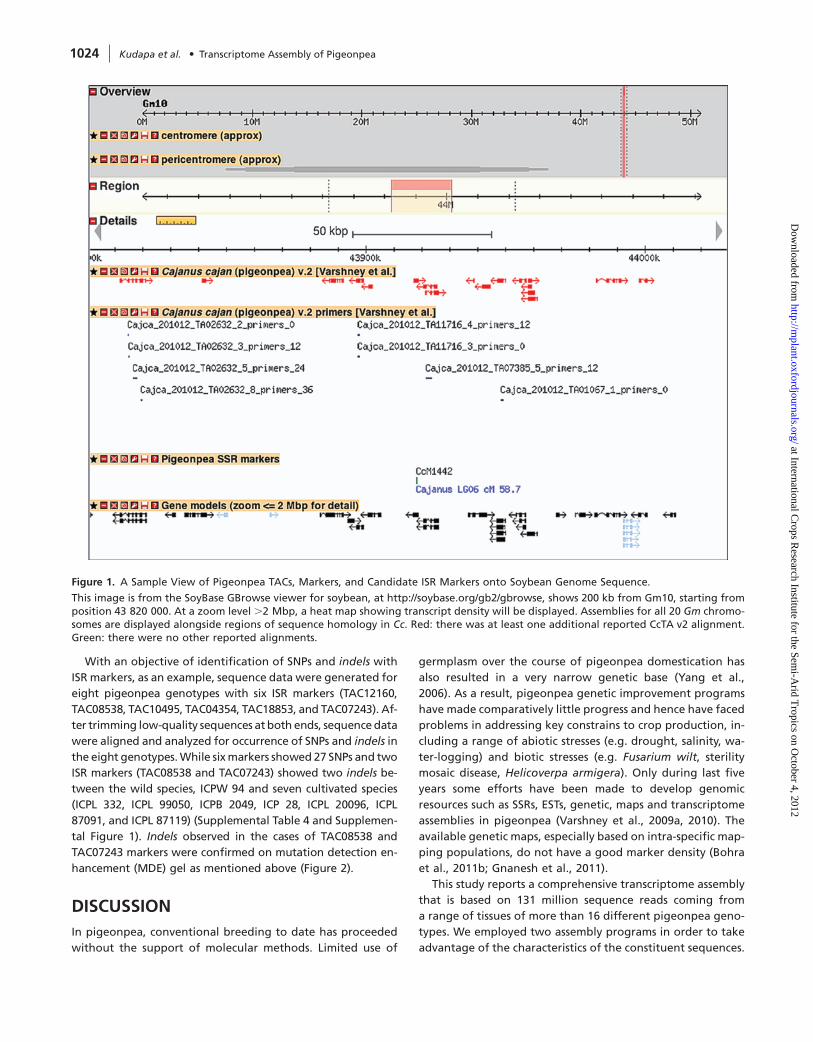
Figure 1. A Sample View of Pigeonpea TACs, Markers, and Candidate ISR Markers onto Soybean Genome Sequence.
This image is from the SoyBase GBrowse viewer for soybean, at http://soybase.org/gb2/gbrowse, shows 200 kb from Gm10, starting fromposition 43 820 000. At a zoom level .2 Mbp, a heat map showing transcript density will be displayed. Assemblies for all 20 Gm chromo-somes are displayed alongside regions of sequence homology in Cc. Red: there was at least one additional reported CcTA v2 alignment.Green: there were no other reported alignments.
Kudapa et al. d Transcriptome Assembly of Pigeonpea | 5
All Illumina GA IIx reads were assembled into contigs with the
ABySS program, and FLX/454 reads were assembled with the
miraEST program. Contigs generated for Illumina GA IIx and
FLX/454 readswere assembled togetherwith Sanger ESTs using
the miraEST program. Therefore, the developed assembly is
a hybrid assembly. Hybrid assemblies are considered superior
over pure assembly based on sequence data coming from
one sequencing platform, as weaknesses from single sequenc-
ing platforms may be compensated by different characteristics
of sequences from other platforms (Schatz et al., 2010; Garg
et al., 2011).
The assembly described in this study is coming from 31 tis-
sues representing a range of development and growth stages
as well as challenged by different stresses. Thus, this assembly
(CcTA v2) can be considered themost comprehensive transcrip-
tome assembly of pigeonpea. The completeness and quality of
this assembly can be assessed by comparing it with other ear-
lier assemblies (Raju et al., 2010; Dubey et al., 2011; Dutta et al.,
2011). The average TAC length as well as N50 of TAC in the
CcTA v2 ismuch better than the CcTA v1. It is important tomen-
tion here that earlier assemblies were developed based on
CAP3 (Dubey et al., 2011; Raju et al., 2010) and Lasergene Seq-
Man Pro� v8.0.12 (Dutta et al., 2011) programs, while the
present assembly has been developed using two powerful
assembly programs that can accommodate large amounts of
next-generation sequence: ABySS and miraEST.
The transcriptome assembly developed here can be used for
a variety of applications to advance genetics research and
breeding applications in pigeonpea. For instance, this assem-
bly can provide the information about gene content and func-
tion, for identification of candidate genes, for development of
molecular markers such as SSRs, SNPs, etc. (Varshney et al.,
2009b). The majority of these applications have already been
explored and a preview of such applications for the pigeonpea
transcriptome was presented in our earlier studies (Dubey
et al., 2011; Dutta et al., 2011). Therefore, these topics are
not being discussed in this study. We have demonstrated
onemajor application of the transcriptome assembly in the de-
velopment of genome-wide marker datasets for enriching the
genetic map of pigeonpea, using a comparative genomics ap-
proach that employs the soybean genome sequence and the
BES-SSR loci-based genetic map of pigeonpea (Bohra et al.,
2011a). For instance, comparison of the CcTA v2 with soybean
genome identified the homologs for 77.5% of the pigeonpea
Figure 2. Amplification Pattern of ISR Markers on MDE Gel.
From left to right lanes 1–8 for eachmarker: ICPL 332, ICPW94, ICPL 99050, ICPB 2049, ICP 28, ICPL 20096, ICPL 87091, and ICPL 87119. Arrowsindicate ladder bp fragments.
Table 4. Distribution of ISR Markers on Pigeonpea LinkageGroups and Their Polymorphism Status.
PigeonpeaLG
Total ISRmarkersshowingmappingpositions
Markersselected
for analysisMarkersamplified
Markersshowing
polymorphism
CcLG01 333 10 8 5
CcLG02 1778 20 17 12
CcLG03 699 17 16 9
CcLG04 763 10 7 6
CcLG05 27 – – –
CcLG06 257 8 8 6
CcLG07 478 15 15 11
CcLG08 394 5 5 4
CcLG09 281 15 15 6
CcLG10 1011 16 14 5
CcLG11 263 12 11 6
Total 6284 128 116 70
6 | Kudapa et al. d Transcriptome Assembly of Pigeonpea
at International Crops R
esearch Institute for the Semi-A
rid Tropics on O
ctober 4, 2012http://m
plant.oxfordjournals.org/D
ownloaded from
Kudapa et al. • Transcriptome Assembly of Pigeonpea 1025
With an objective of identification of SNPs and indels with
ISR markers, as an example, sequence data were generated for
eight pigeonpea genotypes with six ISR markers (TAC12160,
TAC08538, TAC10495, TAC04354, TAC18853, and TAC07243). Af-
ter trimming low-quality sequences at both ends, sequencedata
were aligned and analyzed for occurrence of SNPs and indels in
the eight genotypes.While sixmarkers showed 27 SNPs and two
ISR markers (TAC08538 and TAC07243) showed two indels be-
tween the wild species, ICPW 94 and seven cultivated species
(ICPL 332, ICPL 99050, ICPB 2049, ICP 28, ICPL 20096, ICPL
87091, and ICPL 87119) (Supplemental Table 4 and Supplemen-
tal Figure 1). Indels observed in the cases of TAC08538 and
TAC07243 markers were confirmed on mutation detection en-
hancement (MDE) gel as mentioned above (Figure 2).
DISCUSSION
In pigeonpea, conventional breeding to date has proceeded
without the support of molecular methods. Limited use of
germplasm over the course of pigeonpea domestication has
also resulted in a very narrow genetic base (Yang et al.,
2006). As a result, pigeonpea genetic improvement programs
have made comparatively little progress and hence have faced
problems in addressing key constrains to crop production, in-
cluding a range of abiotic stresses (e.g. drought, salinity, wa-
ter-logging) and biotic stresses (e.g. Fusarium wilt, sterility
mosaic disease, Helicoverpa armigera). Only during last five
years some efforts have been made to develop genomic
resources such as SSRs, ESTs, genetic, maps and transcriptome
assemblies in pigeonpea (Varshney et al., 2009a, 2010). The
available genetic maps, especially based on intra-specific map-
ping populations, do not have a good marker density (Bohra
et al., 2011b; Gnanesh et al., 2011).
This study reports a comprehensive transcriptome assembly
that is based on 131 million sequence reads coming from
a range of tissues of more than 16 different pigeonpea geno-
types. We employed two assembly programs in order to take
advantage of the characteristics of the constituent sequences.
Figure 1. A Sample View of Pigeonpea TACs, Markers, and Candidate ISR Markers onto Soybean Genome Sequence.
This image is from the SoyBase GBrowse viewer for soybean, at http://soybase.org/gb2/gbrowse, shows 200 kb from Gm10, starting fromposition 43 820 000. At a zoom level .2 Mbp, a heat map showing transcript density will be displayed. Assemblies for all 20 Gm chromo-somes are displayed alongside regions of sequence homology in Cc. Red: there was at least one additional reported CcTA v2 alignment.Green: there were no other reported alignments.
Kudapa et al. d Transcriptome Assembly of Pigeonpea | 5
All Illumina GA IIx reads were assembled into contigs with the
ABySS program, and FLX/454 reads were assembled with the
miraEST program. Contigs generated for Illumina GA IIx and
FLX/454 readswere assembled togetherwith Sanger ESTs using
the miraEST program. Therefore, the developed assembly is
a hybrid assembly. Hybrid assemblies are considered superior
over pure assembly based on sequence data coming from
one sequencing platform, as weaknesses from single sequenc-
ing platforms may be compensated by different characteristics
of sequences from other platforms (Schatz et al., 2010; Garg
et al., 2011).
The assembly described in this study is coming from 31 tis-
sues representing a range of development and growth stages
as well as challenged by different stresses. Thus, this assembly
(CcTA v2) can be considered themost comprehensive transcrip-
tome assembly of pigeonpea. The completeness and quality of
this assembly can be assessed by comparing it with other ear-
lier assemblies (Raju et al., 2010; Dubey et al., 2011; Dutta et al.,
2011). The average TAC length as well as N50 of TAC in the
CcTA v2 ismuch better than the CcTA v1. It is important tomen-
tion here that earlier assemblies were developed based on
CAP3 (Dubey et al., 2011; Raju et al., 2010) and Lasergene Seq-
Man Pro� v8.0.12 (Dutta et al., 2011) programs, while the
present assembly has been developed using two powerful
assembly programs that can accommodate large amounts of
next-generation sequence: ABySS and miraEST.
The transcriptome assembly developed here can be used for
a variety of applications to advance genetics research and
breeding applications in pigeonpea. For instance, this assem-
bly can provide the information about gene content and func-
tion, for identification of candidate genes, for development of
molecular markers such as SSRs, SNPs, etc. (Varshney et al.,
2009b). The majority of these applications have already been
explored and a preview of such applications for the pigeonpea
transcriptome was presented in our earlier studies (Dubey
et al., 2011; Dutta et al., 2011). Therefore, these topics are
not being discussed in this study. We have demonstrated
onemajor application of the transcriptome assembly in the de-
velopment of genome-wide marker datasets for enriching the
genetic map of pigeonpea, using a comparative genomics ap-
proach that employs the soybean genome sequence and the
BES-SSR loci-based genetic map of pigeonpea (Bohra et al.,
2011a). For instance, comparison of the CcTA v2 with soybean
genome identified the homologs for 77.5% of the pigeonpea
Figure 2. Amplification Pattern of ISR Markers on MDE Gel.
From left to right lanes 1–8 for eachmarker: ICPL 332, ICPW94, ICPL 99050, ICPB 2049, ICP 28, ICPL 20096, ICPL 87091, and ICPL 87119. Arrowsindicate ladder bp fragments.
Table 4. Distribution of ISR Markers on Pigeonpea LinkageGroups and Their Polymorphism Status.
PigeonpeaLG
Total ISRmarkersshowingmappingpositions
Markersselected
for analysisMarkersamplified
Markersshowing
polymorphism
CcLG01 333 10 8 5
CcLG02 1778 20 17 12
CcLG03 699 17 16 9
CcLG04 763 10 7 6
CcLG05 27 – – –
CcLG06 257 8 8 6
CcLG07 478 15 15 11
CcLG08 394 5 5 4
CcLG09 281 15 15 6
CcLG10 1011 16 14 5
CcLG11 263 12 11 6
Total 6284 128 116 70
6 | Kudapa et al. d Transcriptome Assembly of Pigeonpea
at International Crops R
esearch Institute for the Semi-A
rid Tropics on O
ctober 4, 2012http://m
plant.oxfordjournals.org/D
ownloaded from
1026 Kudapa et al. • Transcriptome Assembly of Pigeonpea
TACs, and covering 27 490 genes in the soybean genome. Of
these, the majority of TACs (9863/16 622) mapped twice
against soybean genome—as expected, because of the ;13-
Mya genome duplication in soybean. Occurrence of more than
two hits in the soybean genome for a given pigeonpea TAC is
also not surprising, as ;75% of soybean genes were found in
multiple copies, due to older genomeduplications in soybean’s
history (Schmutz et al., 2010). Based on exon–intron bound-
aries, 10 009 primer pairs, designed for 5033 TACs, can be used
for checking the length or sequence polymorphism between
the parental genotypes of mapping populations. To shortlist
a set of markers that can be mapped across the pigeonpea ge-
nome, 177 anchor points were identified between the soybean
and pigeonpea genomes, with the genetically mapped
pigeonpea BES-SSR loci being placed by sequence homology
onto the soybean genome sequence. Based on this informa-
tion, 6284 ISRmarkers were identified that have putative chro-
mosomal placements in the pigeonpea genome. A subset (128)
of these markers was further analyzed for length (indel) poly-
morphism in eight parental genotypes of mapping popula-
tions segregating for three important traits, FW, SMD, and
pod borer that are significant for pigeonpea improvement.
While 90.6% (116) markers provided scorable amplicons,
54.6% (70) markers showed polymorphism with two to three
alleles in the genotypes analyzed onMDE gel. Utility of single-
strand confirmation polymorphism-based SNPs and indels has
been shown earlier in several species like common bean
(Galeano et al., 2009), pearl millet (Thudi et al., 2010), etc. Al-
though the majority of the markers showed polymorphism be-
tween ICPW 94 (C. scrabaeoides) and other genotype(s) of
cultivated species (C. cajan), only threemarkers showed length
polymorphism between the parental combinations of culti-
vated species. These results are not unexpected, as very low
levels of polymorphism in some other cultivated species have
been observed in several earlier studies (Yang et al., 2006;
Varshney et al., 2009a; Raju et al., 2010; Varshney et al.,
2010; Bohra et al., 2011a, 2011b; Dubey et al., 2011; Dutta
et al., 2011; Gnanesh et al., 2011).On the other hand, sequence
analysis of amplicons generated for six ISR markers showed
their utility for identification of SNPs and indels at sequence
level. Two common markers used for length as well as se-
quence polymorphism also confirmed the length polymor-
phism on MDE gel at sequence level. In brief, the validation
results with some markers for detection of polymorphisms
on MDE gel and sequence level underline the importance of
developed resource of ISR markers. These markers should be
useful for genetic mapping and trait mapping in breeding pro-
grams to develop the superior pigeonpea varieties with en-
hanced crop productivity.
In conclusion, the present study demonstrated a high-quality
comprehensive transcriptome assembly of the important le-
gume crop pigeonpea using Sanger and second-generation se-
quencing (FLX/454 and Illumina GA IIx) technologies. The
results deliver novel information for future genetic studies
in pigeonpea and provide a robust transcriptome assembly.
The identification of syntenic regions between the pigeonpea
and the sequence of a related phaseolid legume, soybean, pro-
vides greater insight into the gene content of pigeonpea. For
the ISR markers identified, their putative mapping positions
and parental polymorphism information will be a useful re-
source for molecular breeding programs to develop elite
pigeonpea cultivars.
METHODS
Sequence Datasets
The following four datasets were used for defining the tran-
scriptome assembly: (1) 128.9 million Illumina GA IIx short sin-
gle end reads (1x36-nt) generated from 12 genotypes at
ICRISAT and NCGR (Dubey et al., 2011; unpublished), referred
to as Dataset I; (2) 1.696 million FLX/454 reads generated from
the genotypes ‘Asha’ and ‘UPAS 120’ at NRCPB (Dutta et al.,
2011), referred to as Dataset II; (3) 494 353 FLX/454 reads gen-
erated from ‘PusaAgeti’ at ICRISATand J. Craig Venter Institute
(JCVI) (Dubey et al., 2011), referred to as Dataset III; and (4)
18 353 vector-trimmed Sanger ESTs downloaded from dbEST
(www.ncbi.nlm.nih.gov/dbEST/dbEST_summary.html) (the ma-
jority of which were generated at ICRISAT (Raju et al., 2010)
and NRCPB, referred to as Dataset IV) (see Table 1).
Sequence Assembly
Sequence datasets, asmentioned above,were assembledusing
the programs ABySS (Simpson et al., 2009) and miraEST
(Chevreux et al., 2004), using the following three steps. In
the first step, all Illumina GA IIx reads (Dataset I) from 12 gen-
otypes were pooled and assembled together using ABySS. In
the second step, FLX/454 reads from three genotypes (Datasets
II and III) were trimmed of adapter sequences and assembled
individually using the miraEST assembler. Subsequently, the
pooled Illumina GA IIx (step 1 by ABySS) and FLX/454 (step 2
by miraEST) assemblies were merged with vector-trimmed
Sanger ESTs of Dataset IV using the miraEST program. Both
programs were run with the default settings, except for the
following parameters: for ABySS, scaffolding ‘on’ at the paired
end stage; and for miraEST: number of threads was seven and
these options specified as ‘no’: Load straindata, Enforce pres-
ence of qualities, Extra gap penalty, and Wants quality file. In
order to decrease runtime, number of processors used was
seven. Since we were interested in a consensus assembly,
the ‘Load straindata’ optionwas turned off. During the second
stage of the assembly in which FLX/454 and Sanger ESTs were
merged, there were no quality scores for the synthetic ESTs.
Therefore, ‘Enforce presence of qualities’ and ‘Wants quality
file’ options were specified to ‘no’. By turning off ‘Extra gap
penalty’, we avoided penalizing gaps during the smith water-
man alignment, especially since FLX/454 data are known to
have homopolymer errors.
In order to check for microbial contamination, BLAST of
all 21 434 CcTA v2 contigs was carried out against NCBI’s
Kudapa et al. d Transcriptome Assembly of Pigeonpea | 7
microbial genomes database (www.ncbi.nlm.nih.gov/
genomes/MICROBES/microbial_taxtree.html). The TACs of
CcTA v2 having significant hits to bacterial genomes have been
later on run against NCBI’s EST_others database (non-human,
non-mouse) to check whether they could be mapped to other
plant genomes.
Mapping of the Pigeonpea Transcriptome Assembly onto
Soybean Genome
All TACs of the CcTA v2 assembly were aligned to soybean ge-
nome (Schmutz et al., 2010) build 1.0.9 using Exonerate 2.2.0
(Slater and Birney, 2005), with parameters and flags ‘percent
25’ (to report only alignments over 25%of themaximum score
attainable by each query) and ‘refine region’ (to perform an
exhaustive alignment over the region in which the heuristic
alignment was found). Alignments were filtered to require
at least 80% alignment identity and 50% query coverage. If
this resulted in more than 12 matches for a given sequence,
the sequence was considered repetitive, and all matches were
discarded.
Mapping of BES-SSR Loci of Pigeonpea onto the Soybean
Genetic Map
All genetically mapped BES-SSR loci onto the pigeonpea ge-
netic map (Bohra et al., 2011a) were anchored to the soybean
genomeusing BLASTN (Altschul et al., 1997) of the correspond-
ing BESs (with maximum E-value 1e-8), followed by manual se-
lection for best hits with matches up to two homologous
soybean regions.
Identification of Intron Spanning Region (ISR) Markers
Alignment results of pigeonpea TACs with the soybean ge-
nomewere analyzed for identification of flanking intron junc-
tions. The Exonerate alignment of the TACs, in Exonerate
‘vulgar’ (Verbose Useful Labelled Gapped Alignment Report)
output format, was used to identify intron junctions in
the TAC fasta sequences. These junctions were used to design
the primer pairs using Primer3 (Rosen and Skaletsky, 2000) and
BatchPrimer3 (You et al., 2008). Primer pairs were remapped to
the soybean genome (to evaluate for repetitive sequences) us-
ing e-PCR (Schuler, 1997), with parameters ‘-n3 -g1 -t3 -m400
-d50-1000’. These parameters have the following effects: ‘-n3’
allows up to three mismatches per primer; ‘-g1’ allows up to
one gap per primer; ‘-t3’ specifies output in tabular format;
‘-m400’ specifies an allowable margin for the product of 400
bases; and ‘-d50-1000’ specifies the default PCR product size
range. Primer pairs with more than two alignments at these
parameters were discarded.
Putative approximate mapping positions for the identified
ISRmarkers were imputed based on anchoring points between
pigeonpea and soybean genetic maps using BES-SSR loci of
pigeonpea. Where there are two or more pigeonpea SSR
markers with proximity in both pigeonpea and soybean (i.e.
with nearby cM values in pigeonpea and nearby nucleotide
positions in soybean chromosome pseudomolecules), tenta-
tive pigeonpea linkage groups (CcLGs) were assigned for ISR
candidate markers occurring between the neighboring
pigeonpea SSR markers.
ISR Analysis
Polymerase chain reactions (PCRs) for amplification of ISR loci
were performed on eight pigeonpea genotypes (seven culti-
vated and one wild species) in a 5-ll reaction volume as
described by Gujaria et al. (2011). Amplified products were
denatured and separation was undertaken on MDE gel
electrophoresis as described earlier (Thudi et al., 2010).
Allele Re-Sequencing and SNP Detection
For detection of SNP or indel polymorphism in the case of ISR
markers, PCR products for eight pigeonpeagenotypes using six
ISR markers were sequenced in both directions using Sanger
sequencing methodology. Sequence data analysis and SNP
identification among the selected genotypes were carried
out as described in our earlier study (Gujaria et al., 2011).
SUPPLEMENTARY DATA
Supplementary Data are available at Molecular Plant Online.
FUNDING
The authors thank the CGIAR Generation Challenge Programme
(GCP), Mexico (G.D.M., R.K.V., and N.K.S.) and the Indian Council
of Agricultural Research (ICAR), India (N.K.S. and R.K.V.) for spon-
soring this research. No conflict of interest declared.
ACKNOWLEDGMENTS
The authors are thankful to Anuja Dubey and Rachit Saxena for
their help extended throughout this study.
REFERENCES
Altschul, S.F., Madden, T.L., Schaffer, A.A., Zhang, J., Zhang, Z.,
Miller, W., and Lipman, D.J. (1997). Gapped BLASTand PSI-BLAST:
a new generation of protein database search programs. Nucleic
Acids Res. 25, 3389–402.
Bohra, A., et al. (2011a). Analysis of BAC-end sequences (BESs) and
development of BES-SSR markers for genetic mapping and hy-
brid purity assessment in pigeonpea, (Cajanus spp.). BMC Plant
Biol. 11, 56.
Bohra, A., Saxena, R.K., Gnanesh, B.N., Saxena, K.B.,
Byregowda, M., Rathore, A., Kavi Kishor, P.B., Cook, D.R., and
Varshney, R.K. (2011b). An intra-specific consensus genetic
map of pigeonpea (Cajanus cajan (L.) Millspaugh) derived from
six mapping populations. BMC Genomics (submitted revised
version).
Chevreux, B., Pfisterer, T., Drescher, B., Driesel, A.J., Muller, W.E.,
Wetter, T., and Suhai, S. (2004). Using the miraEST assembler
for reliable and automated mRNA transcript assembly and SNP
detection in sequenced ESTs. Genome Res. 14, 1147–1159.
8 | Kudapa et al. d Transcriptome Assembly of Pigeonpea
at International Crops R
esearch Institute for the Semi-A
rid Tropics on O
ctober 4, 2012http://m
plant.oxfordjournals.org/D
ownloaded from
Kudapa et al. • Transcriptome Assembly of Pigeonpea 1027
TACs, and covering 27 490 genes in the soybean genome. Of
these, the majority of TACs (9863/16 622) mapped twice
against soybean genome—as expected, because of the ;13-
Mya genome duplication in soybean. Occurrence of more than
two hits in the soybean genome for a given pigeonpea TAC is
also not surprising, as ;75% of soybean genes were found in
multiple copies, due to older genomeduplications in soybean’s
history (Schmutz et al., 2010). Based on exon–intron bound-
aries, 10 009 primer pairs, designed for 5033 TACs, can be used
for checking the length or sequence polymorphism between
the parental genotypes of mapping populations. To shortlist
a set of markers that can be mapped across the pigeonpea ge-
nome, 177 anchor points were identified between the soybean
and pigeonpea genomes, with the genetically mapped
pigeonpea BES-SSR loci being placed by sequence homology
onto the soybean genome sequence. Based on this informa-
tion, 6284 ISRmarkers were identified that have putative chro-
mosomal placements in the pigeonpea genome. A subset (128)
of these markers was further analyzed for length (indel) poly-
morphism in eight parental genotypes of mapping popula-
tions segregating for three important traits, FW, SMD, and
pod borer that are significant for pigeonpea improvement.
While 90.6% (116) markers provided scorable amplicons,
54.6% (70) markers showed polymorphism with two to three
alleles in the genotypes analyzed onMDE gel. Utility of single-
strand confirmation polymorphism-based SNPs and indels has
been shown earlier in several species like common bean
(Galeano et al., 2009), pearl millet (Thudi et al., 2010), etc. Al-
though the majority of the markers showed polymorphism be-
tween ICPW 94 (C. scrabaeoides) and other genotype(s) of
cultivated species (C. cajan), only threemarkers showed length
polymorphism between the parental combinations of culti-
vated species. These results are not unexpected, as very low
levels of polymorphism in some other cultivated species have
been observed in several earlier studies (Yang et al., 2006;
Varshney et al., 2009a; Raju et al., 2010; Varshney et al.,
2010; Bohra et al., 2011a, 2011b; Dubey et al., 2011; Dutta
et al., 2011; Gnanesh et al., 2011).On the other hand, sequence
analysis of amplicons generated for six ISR markers showed
their utility for identification of SNPs and indels at sequence
level. Two common markers used for length as well as se-
quence polymorphism also confirmed the length polymor-
phism on MDE gel at sequence level. In brief, the validation
results with some markers for detection of polymorphisms
on MDE gel and sequence level underline the importance of
developed resource of ISR markers. These markers should be
useful for genetic mapping and trait mapping in breeding pro-
grams to develop the superior pigeonpea varieties with en-
hanced crop productivity.
In conclusion, the present study demonstrated a high-quality
comprehensive transcriptome assembly of the important le-
gume crop pigeonpea using Sanger and second-generation se-
quencing (FLX/454 and Illumina GA IIx) technologies. The
results deliver novel information for future genetic studies
in pigeonpea and provide a robust transcriptome assembly.
The identification of syntenic regions between the pigeonpea
and the sequence of a related phaseolid legume, soybean, pro-
vides greater insight into the gene content of pigeonpea. For
the ISR markers identified, their putative mapping positions
and parental polymorphism information will be a useful re-
source for molecular breeding programs to develop elite
pigeonpea cultivars.
METHODS
Sequence Datasets
The following four datasets were used for defining the tran-
scriptome assembly: (1) 128.9 million Illumina GA IIx short sin-
gle end reads (1x36-nt) generated from 12 genotypes at
ICRISAT and NCGR (Dubey et al., 2011; unpublished), referred
to as Dataset I; (2) 1.696 million FLX/454 reads generated from
the genotypes ‘Asha’ and ‘UPAS 120’ at NRCPB (Dutta et al.,
2011), referred to as Dataset II; (3) 494 353 FLX/454 reads gen-
erated from ‘PusaAgeti’ at ICRISATand J. Craig Venter Institute
(JCVI) (Dubey et al., 2011), referred to as Dataset III; and (4)
18 353 vector-trimmed Sanger ESTs downloaded from dbEST
(www.ncbi.nlm.nih.gov/dbEST/dbEST_summary.html) (the ma-
jority of which were generated at ICRISAT (Raju et al., 2010)
and NRCPB, referred to as Dataset IV) (see Table 1).
Sequence Assembly
Sequence datasets, asmentioned above,were assembledusing
the programs ABySS (Simpson et al., 2009) and miraEST
(Chevreux et al., 2004), using the following three steps. In
the first step, all Illumina GA IIx reads (Dataset I) from 12 gen-
otypes were pooled and assembled together using ABySS. In
the second step, FLX/454 reads from three genotypes (Datasets
II and III) were trimmed of adapter sequences and assembled
individually using the miraEST assembler. Subsequently, the
pooled Illumina GA IIx (step 1 by ABySS) and FLX/454 (step 2
by miraEST) assemblies were merged with vector-trimmed
Sanger ESTs of Dataset IV using the miraEST program. Both
programs were run with the default settings, except for the
following parameters: for ABySS, scaffolding ‘on’ at the paired
end stage; and for miraEST: number of threads was seven and
these options specified as ‘no’: Load straindata, Enforce pres-
ence of qualities, Extra gap penalty, and Wants quality file. In
order to decrease runtime, number of processors used was
seven. Since we were interested in a consensus assembly,
the ‘Load straindata’ optionwas turned off. During the second
stage of the assembly in which FLX/454 and Sanger ESTs were
merged, there were no quality scores for the synthetic ESTs.
Therefore, ‘Enforce presence of qualities’ and ‘Wants quality
file’ options were specified to ‘no’. By turning off ‘Extra gap
penalty’, we avoided penalizing gaps during the smith water-
man alignment, especially since FLX/454 data are known to
have homopolymer errors.
In order to check for microbial contamination, BLAST of
all 21 434 CcTA v2 contigs was carried out against NCBI’s
Kudapa et al. d Transcriptome Assembly of Pigeonpea | 7
microbial genomes database (www.ncbi.nlm.nih.gov/
genomes/MICROBES/microbial_taxtree.html). The TACs of
CcTA v2 having significant hits to bacterial genomes have been
later on run against NCBI’s EST_others database (non-human,
non-mouse) to check whether they could be mapped to other
plant genomes.
Mapping of the Pigeonpea Transcriptome Assembly onto
Soybean Genome
All TACs of the CcTA v2 assembly were aligned to soybean ge-
nome (Schmutz et al., 2010) build 1.0.9 using Exonerate 2.2.0
(Slater and Birney, 2005), with parameters and flags ‘percent
25’ (to report only alignments over 25%of themaximum score
attainable by each query) and ‘refine region’ (to perform an
exhaustive alignment over the region in which the heuristic
alignment was found). Alignments were filtered to require
at least 80% alignment identity and 50% query coverage. If
this resulted in more than 12 matches for a given sequence,
the sequence was considered repetitive, and all matches were
discarded.
Mapping of BES-SSR Loci of Pigeonpea onto the Soybean
Genetic Map
All genetically mapped BES-SSR loci onto the pigeonpea ge-
netic map (Bohra et al., 2011a) were anchored to the soybean
genomeusing BLASTN (Altschul et al., 1997) of the correspond-
ing BESs (with maximum E-value 1e-8), followed by manual se-
lection for best hits with matches up to two homologous
soybean regions.
Identification of Intron Spanning Region (ISR) Markers
Alignment results of pigeonpea TACs with the soybean ge-
nomewere analyzed for identification of flanking intron junc-
tions. The Exonerate alignment of the TACs, in Exonerate
‘vulgar’ (Verbose Useful Labelled Gapped Alignment Report)
output format, was used to identify intron junctions in
the TAC fasta sequences. These junctions were used to design
the primer pairs using Primer3 (Rosen and Skaletsky, 2000) and
BatchPrimer3 (You et al., 2008). Primer pairs were remapped to
the soybean genome (to evaluate for repetitive sequences) us-
ing e-PCR (Schuler, 1997), with parameters ‘-n3 -g1 -t3 -m400
-d50-1000’. These parameters have the following effects: ‘-n3’
allows up to three mismatches per primer; ‘-g1’ allows up to
one gap per primer; ‘-t3’ specifies output in tabular format;
‘-m400’ specifies an allowable margin for the product of 400
bases; and ‘-d50-1000’ specifies the default PCR product size
range. Primer pairs with more than two alignments at these
parameters were discarded.
Putative approximate mapping positions for the identified
ISRmarkers were imputed based on anchoring points between
pigeonpea and soybean genetic maps using BES-SSR loci of
pigeonpea. Where there are two or more pigeonpea SSR
markers with proximity in both pigeonpea and soybean (i.e.
with nearby cM values in pigeonpea and nearby nucleotide
positions in soybean chromosome pseudomolecules), tenta-
tive pigeonpea linkage groups (CcLGs) were assigned for ISR
candidate markers occurring between the neighboring
pigeonpea SSR markers.
ISR Analysis
Polymerase chain reactions (PCRs) for amplification of ISR loci
were performed on eight pigeonpea genotypes (seven culti-
vated and one wild species) in a 5-ll reaction volume as
described by Gujaria et al. (2011). Amplified products were
denatured and separation was undertaken on MDE gel
electrophoresis as described earlier (Thudi et al., 2010).
Allele Re-Sequencing and SNP Detection
For detection of SNP or indel polymorphism in the case of ISR
markers, PCR products for eight pigeonpeagenotypes using six
ISR markers were sequenced in both directions using Sanger
sequencing methodology. Sequence data analysis and SNP
identification among the selected genotypes were carried
out as described in our earlier study (Gujaria et al., 2011).
SUPPLEMENTARY DATA
Supplementary Data are available at Molecular Plant Online.
FUNDING
The authors thank the CGIAR Generation Challenge Programme
(GCP), Mexico (G.D.M., R.K.V., and N.K.S.) and the Indian Council
of Agricultural Research (ICAR), India (N.K.S. and R.K.V.) for spon-
soring this research. No conflict of interest declared.
ACKNOWLEDGMENTS
The authors are thankful to Anuja Dubey and Rachit Saxena for
their help extended throughout this study.
REFERENCES
Altschul, S.F., Madden, T.L., Schaffer, A.A., Zhang, J., Zhang, Z.,
Miller, W., and Lipman, D.J. (1997). Gapped BLASTand PSI-BLAST:
a new generation of protein database search programs. Nucleic
Acids Res. 25, 3389–402.
Bohra, A., et al. (2011a). Analysis of BAC-end sequences (BESs) and
development of BES-SSR markers for genetic mapping and hy-
brid purity assessment in pigeonpea, (Cajanus spp.). BMC Plant
Biol. 11, 56.
Bohra, A., Saxena, R.K., Gnanesh, B.N., Saxena, K.B.,
Byregowda, M., Rathore, A., Kavi Kishor, P.B., Cook, D.R., and
Varshney, R.K. (2011b). An intra-specific consensus genetic
map of pigeonpea (Cajanus cajan (L.) Millspaugh) derived from
six mapping populations. BMC Genomics (submitted revised
version).
Chevreux, B., Pfisterer, T., Drescher, B., Driesel, A.J., Muller, W.E.,
Wetter, T., and Suhai, S. (2004). Using the miraEST assembler
for reliable and automated mRNA transcript assembly and SNP
detection in sequenced ESTs. Genome Res. 14, 1147–1159.
8 | Kudapa et al. d Transcriptome Assembly of Pigeonpea
at International Crops R
esearch Institute for the Semi-A
rid Tropics on O
ctober 4, 2012http://m
plant.oxfordjournals.org/D
ownloaded from
1028 Kudapa et al. • Transcriptome Assembly of Pigeonpea
Dubey, A., et al. (2011). Defining the transcriptome assembly and its
use for genome dynamics and transcriptome profiling studies in
pigeonpea (Cajanus cajan L.). DNA Res. 18, 153–164.
Duke, J.A. (1981). Handbook of Legumes ofWorld Economic Impor-
tance (New York: Plenum Press), p. 345.
Dutta, S., et al. (2011). Development of genic-SSR markers by deep
transcriptome sequencing in pigeonpea (Cajanus cajan (L.)
Millspaugh). BMC Plant Biol. 11, 17.
Galeano, C.H., Fernandez, A.C., Gomez, M., and Blair, M.W. (2009).
Single strand conformation polymorphism based SNP and Indel
markers for genetic mapping and synteny analysis of common
bean (Phaseolus vulgaris L.). BMC Genomics. 10, 629.
Garg, R., Patel, R.K., Jhanwar, S., Priya, P., Bhattacharjee, A.,
Yadav, G., Bhatia, S., Chattopadhyay, D., Tyagi, A.K., and
Jain, M. (2011). Gene discovery and tissue-specific transcriptome
analysis in chickpea with massively parallel pyrosequencing and
web resource development. Plant Physiol. 156, 1661–1678.
Gnanesh, B.N., Bohra, A., Sharma, M., Byregowda, M., Pandey, S.,
Wesley, V., Saxena, R.K., Saxena, K.B., Kavi Kishor, P.B., and
Varshney, R.K. (2011). Geneticmapping and quantitative trait lo-
cus analysis of resistance to sterility mosaic disease in pigeonpea
(Cajanus cajan (L.) Millsp.). Field Crops Res. 123, 53–61.
Greilhuber, J., and Obermayer, R. (1998). Genome size variation in
Cajanus cajan (Fabaceae): a reconsideration. Plant Syst. Evol. 212,
135–141.
Gujaria, N., et al. (2011). Development and use of genic molecular
markers (GMMs) for construction of a transcript map of chickpea
(Cicer arietinum L.). Theor. Appl. Genet. 122, 1577–1589.
Raju, N.L., Gananesh, B.N., Lekha, P., Jayashree, B., Pande, S.,
Hiremath, P.J., Byregowda, M., Singh, N.K., and Varshney, R.K.
(2010). The first set of EST resource for gene discovery and
marker development in pigeonpea (Cajanus cajan L.). BMC Plant
Biol. 10, 45.
Reddy, B.V.S., Green, J.M., and Bise, S.S. (1978). Genetic male ste-
rility in pigeonpea. Crop Sci. 18, 362–364.
Rosen, S., and Skaletsky, H.J. (2000). Primer 3 on theWWW for gen-
eral users and for biologist programmers. In Bioinformatics
Methods and Protocols: Methods in Molecular Biology, Krawetz,
S., Misener, S., eds (Totowa, NJ: Humana Press), pp. 365–386.
Saxena, K.B. (2008). Genetic improvement of pigeonpea: a review.
Tropical Plant Biol. 1, 159–178.
Saxena, K.B., Wallis, E.S., and Byth, D.E. (1983). A new gene for
male sterility in pigeonpea (Cajanus cajan (L.) Millsp). Heredity.
51, 419–421.
Schatz, M.C., Delcher, A.L., and Salzberg, S.L. (2010). Assembly of
large genomes using second generation sequencing. Genome
Res. 20, 1165–1173.
Schmutz, J., et al. (2010). Genome sequence of the palaeopolyploid
soybean. Nature. 463, 178–183.
Schuler, G.D. (1997). Sequencemapping by electronic PCR. Genome
Res. 7, 541–750.
Simpson, J.T., Wong, K., Jackman, S.D., Schein, J.E., Jones, S.J., and
Birol, I. (2009). ABySS: a parallel assembler for short read se-
quence data. Genome Res. 19, 1117–1123.
Slater, G.C., and Birney, E. (2005). Automated generation of heuris-
tics for biological sequence comparison. BMC Bioinformatics.
6, 31.
Stefanovic, S., Pfeil, B.E., Palmer, J.D., and Doyle, J.J. (2009). Rela-
tionships among phaseolid legumes based on sequences from
eight chloroplast regions. Syst. Bot. 34, 115–125.
Thudi, M., Senthilvel, S., Bottley, A., Hash, C.T., Reddy, A.R.,
Feltus, A.F., Paterson, A.H., Hoisington, D.A., and Varshney, R.K.
(2010). A comparative assessment of the utility of PCR-based
marker systems in pearl millet. Euphytica. 174, 253–260.
van der Maesen, L.J.G. (1990). Pigeonpea: origin, history, evolution
and taxonomy, In Pigeonpea, Nene Y.L., Hall, S.D., and Sheila
V.K., eds (Wallingford: CAB International), pp. 15–46.
Varshney, R.K., Close, T.J., Singh, N.K., Hoisington, D.A., and
Cook, D.R. (2009a). Orphan legume crops enter the genomics
era. Curr. Opin. Plant Biol. 12, 202–210.
Varshney, R.K., et al. (2010). Pigeonpea genomics initiative (PGI): an
international effort to improve crop productivity of pigeonpea
(Cajanus cajan L.). Mol. Breeding. 26, 393–408.
Varshney, R.K., Nayak, S.N., May, G.D., and Jackson, S.A. (2009b).
Next generation sequencing technologies and their implications
for crop genetics and breeding. Trends Biotechnol. 27, 522–530.
Wanjari, K.B., and Patel, M.C. (2003). Fertility restorers isolated
from germplasm for cytoplasmic male sterility in pigeonpea.
PKV Res. J. 27, 111–113.
Yang, S., Pang, W., Ash, G., Harper, J., Carling, J., Wenzl, P.,
Huttner, E., Zong, X., and Kilian, A. (2006). A Low level of genetic
diversity in cultivated pigeonpea compared to its wild relatives is
revealed by diversity arrays technology. Theor. Appl. Genet. 113,
585–595.
You, F.M., Huo, N., Gu, Y.Q., Luo, M., Ma, Y., Hane, D., Lazo, G.R.,
Dvorak, J., and Anderson, O.D. (2008). BatchPrimer3: a high
throughput web application for PCR and sequencing primer de-
signing. BMC Bioinformatics. 9, 253.
Kudapa et al. d Transcriptome Assembly of Pigeonpea | 9
at International Crops R
esearch Institute for the Semi-A
rid Tropics on O
ctober 4, 2012http://m
plant.oxfordjournals.org/D
ownloaded from