The anatomy of health spending 2011/12 - The … · Research report Nick M. Jones and Anita...
56
Research report Nick M. Jones and Anita Charlesworth March 2013 A review of NHS expenditure and labour productivity The anatomy of health spending 2011 / 12
Transcript of The anatomy of health spending 2011/12 - The … · Research report Nick M. Jones and Anita...

Research reportNick M. Jones and Anita Charlesworth
March 2013
A review of NHS expenditure and labour productivity
The anatomyof healthspending2011/12

About this work programme
Understanding how NHS organisations manage their financial performance is critical.The unprecedented financial challenge, and the difficult decisions facing health and socialcare services in England, make it more crucial than ever to understand how the NHSspends money, and to identify areas of success and failure in financial performance.
Drawing on the accounts data of English NHS organisations, this Nuffield Trust researchprogramme, supported by PwC and McKesson, provides detailed annual analysis offinancial performance across acute hospitals (both NHS and foundation trusts) and otherproviders, as well as commissioning bodies. Although these accounts are consolidatedannually and available to the public, central bodies do not conduct detailed historicalanalysis. This research programme aims to establish the Nuffield Trust as a centre ofexpertise in the analysis of spending and productivity.
The first output from the programme, published in this report, examines financialperformance and labour productivity, using data from 2003/04 to 2011/12. At the timeof publication, data from the latest audited accounts were included. The report examinespatterns in primary care trust and acute trust spending through the reforms of the BlairGovernment and the start of austerity.
Further outputs from the programme – NHS Spending: Monitoring financial performance and productivity – are due for publication later in 2013. All research outputs will be published on the Nuffield Trust website atwww.nuffieldtrust.org.uk/nhs-spending. If you would like to receive updates on the programme, including when new research is published, please sign up for ourefficiency email alerts at www.nuffieldtrust.org.uk/newsletter.
Find out more at: www.nuffieldtrust.org.uk/nhs-spending

Contents
List of figures and tables 3
Executive summary 5
1. Introduction 7
Changing NHS organisations 8
2. NHS financial performance 10
Total health spend 10
PCT spending compared with allocations 12
PCTs’ use of health care resources 13
Trust revenue and spending 16
3. Productivity 26
Background 26
Outputs 28
Inputs 28
Trust labour productivity 29
Factors associated with labour productivity 33
4. Discussion 37
Overall financial position 37
Types of care: relative growth rates 38
Achieving QIPP 39
Labour productivity 39
Conclusion 41
Appendix 1: NHS and foundation trusts included in theproductivity analysis 42
Appendix 2: Productivity regression analysis 45
References 47
Glossary of terms and abbreviations 49
About the authors 51
About our supporters 52

List of figures
Figure 1.1: Number of organisations in the English NHS: 2003/04 to 2011/12 8
Figure 1.2: Number of NHS and foundation trusts by type, England: 2003/04 to 2011/12 9
Figure 2.1: Total health budget underspend compared with the Department of Health allocation: 2006/07 to 2011/12 11
Figure 2.2: PCT spending compared with allocations: 2003/04 to 2011/12 (in 2011/12 prices) 12
Figure 2.3: PCT spending on primary care in England: 2003/04 to 2011/12 14
Figure 2.4: PCT spending on secondary care in England: 2003/04 to 2011/12 15
Figure 2.5: Percentage changes in spending in England: 2010/11 to 2011/12 16
Figure 2.6: Aggregate financial position for NHS and foundation trusts in England: 2003/04 to 2011/12 18
Figure 2.7: Distribution of surpluses/deficits among NHS and foundation trusts: 2011/12 19
Figure 2.8: Map of aggregate retained surplus by strategic health authority: 2011/12 20
Figure 2.9: Spending on staff: 2003/04 to 2011/12 21
Figure 2.10: Spending changes by staff numbers and cost per head: 2003/04to 2011/12 22
Figure 2.11: London versus non-London spending on NHS staff in PCTs and NHS providers: 2003/04 to 2011/12 23
Figure 2.12: NHS spending on PFI interest in England: 2009/10 to 2011/12 24
Figure 3.1: Relationship between labour inputs and output in selected NHS providers in England: 2006/07 to 2011/12 29
Figure 3.2: Changes in UK health care productivity (NHS and non-NHS providers) – ONS measure: 1995 to 2010 30
Figure 3.3: Output, input and labour productivity in selected NHS providers in England – Nuffield Trust measure: 2006/07 to 2011/12 31
Figure 3.4: Map of the average labour productivity of 110 acute trusts by strategic health authority in England – Nuffield Trust measure: 2011/12 32
Figure 3.5: Variation in labour productivity at selected providers in England: 2006/07 to 2011/12 33
3
List of figures and tables

4
Figure 4.1: Overall financial position by organisation type: 2005/06 to 2011/12 37
Figure 4.2: Variation in labour productivity by region: 2011/12 40
List of tables
Table 1.1 NHS and foundation trusts in England: 2011/12 9
Table 2.1: Government spending on health in the UK: 2003/04 to 2011/12 10
Table 2.2: Spending on health in England: 2011/12 11
Table 3.1: Factors tested in the analysis of labour productivity 34
Table 3.2: Factors with statistically significant associations with acute trust labour productivity 35
Table A2.1: Average values of productivity and productivity drivers: 2006/07to 2011/12 46

The anatomy of health spending 2011/125
Executive summary
Understanding how National Health Service (NHS) organisations manage theirperformance with respect to finance and productivity is becoming increasingly importantin light of the unprecedented financial challenge facing the NHS in England. This reportpresents findings of new analysis of the financial performance of the NHS in England andthe Department of Health between 2003/04 and 2011/12. It examines recent changes inthe labour productivity of acute hospitals (both NHS and foundation trusts), identifiesthe factors associated with variations in labour productivity and develops a new measureof labour productivity. The report is the first in a series of annual reports on NHSfinances from the Nuffield Trust.
Key points:
• 2011/12 was the first year of the government’s tight financial envelope for the NHS.Spending on health in England in 2011/12 was £105.4 billion, a 0.3 per cent increasein real terms. Despite this relative squeeze, at the end of the year the health budget wasunderspent by £1.4 billion.
• Over recent years, spending on health has increased rapidly but the rate of increase hasdiffered markedly between different types of health care. Spending on communityservices has increased very rapidly – by 6.0 per cent in 2011/12 – in line with thegovernment policy of shifting more care into community settings. Spending onhospital care has also increased, at a much faster rate than primary care or mentalhealth services. Spending on hospital care grew at 1.2 per cent in 2011/12 comparedwith a 1.2 per cent real-terms reduction in spending on general practitioner (GP)services and a 0.5 per cent a year growth in mental health spending. The more rapidgrowth in hospital spending relative to primary care raises questions about whether theNHS has the right balance of services for the future.
• While NHS finances nationally look robust, the proportion of trusts in deficit hasbeen rising steadily since 2007/08 – 32 out of 250 trusts failed to achieve financialbalance in 2011/12. Seven of these trusts had reported a deficit for three years or more.A number of NHS and foundation trusts are weak financially, and several have limitedscope to resolve their financial difficulties. The financing costs of Private FinanceInitiative (PFI) contracts are a very small part of NHS spending (less than one per cent overall) but they have increased rapidly since 2009, especially in London. A small number of hospitals are spending a relatively large proportion of their budgets on the PFI.
• Spending on staff employed by the NHS fell in 2011/12 by three per cent in real terms. This was the result of a reduction in staff numbers and a real-terms fall inaverage pay.
• While measuring productivity in health care is notoriously complex, there appears tohave been relatively little improvement in the labour productivity of NHS acutehospitals in recent years. This research finds that hospitals in the South of Englandseem to have higher labour productivity than hospitals in the North of England.

The anatomy of health spending 2011/126
The exception to this is London, where hospitals appear relatively less productive,possibly due to their greater involvement in teaching and research activities.
• Measures of NHS productivity may underestimate the actual performance of the NHS as spending on community health services has been increasing rapidly but theNHS lacks a comprehensive, consistent measure of the output of these services. Given the growing importance of community health services for spending and thedelivery of health care, the NHS needs a much better understanding of the output,cost and productivity of community health services.
• Trusts with a higher proportion of medical and dental staff are more likely to havehigher labour productivity levels despite the higher labour costs that this staff mix may imply.
• Financial performance and labour productivity vary across England. This researchsupports the findings of previous research showing that the South West and East ofEngland regions seem to perform relatively well with regard to labour productivity. The South West also has financially robust hospitals and between 2003/04 and2011/12 acute care spending grew at the lowest rate of any region. Further research to understand how this region performs so well relative to others would be useful tothe NHS.
• Hospitals that have fewer potential competitors in their area appear to have a verysmall but statistically significant increase in their labour productivity.
• Larger acute hospitals appear to have lower labour productivity, though the effect is small.
• The analysis of labour productivity presents a less optimistic view of the efforts toimprove efficiency than the Department of Health headline figure of £2.85 billion ofQuality, Innovation, Productivity and Prevention (QIPP) savings from acute providers in 2011/12 would imply. The analysis would suggest that the NHS is struggling totranslate this into labour productivity improvements.
The anatomy of health spending 2011/127
The NHS faces an unprecedented financial challenge as funding is held broadly constantin real terms up to 2015 but the demands on the service continue to rise (Appleby andothers, 2010; Roberts and others, 2012). The Department of Health estimates that tomaintain the quality of care in the face of rising demands and constrained funding, theNHS will need to make recurrent efficiency savings of up to £20 billion over four yearsfrom 2011 (Department of Health, 2012a). This is often described as either the QIPPchallenge or the Nicholson challenge and is equivalent to four per cent year-on-yearefficiency savings. Nuffield Trust research suggests that the pressures on the NHS arelikely to continue to outpace funding, and without further increases in the real resourcesallocated to health beyond 2015, the NHS will need to continue to deliver efficiencysavings at this rate for at least the remainder of the decade (Roberts and others, 2012).
The ability of the NHS to deliver sustained efficiency savings without impacting on thequality of care is the key challenge facing the NHS. This challenge has been brought intosharp relief by the report of the Mid Staffordshire NHS Foundation Trust Public Inquiry (Francis, 2013), which sets out the consequences for patients in MidStaffordshire when the focus of the trust’s board was on cost control at the expense of the safety and quality of care.
This research looks at how the NHS is performing against its financial objectives. It examines the financial performance of the NHS in 2011/12, set in the context of trends in financial performance over the nine years from 2003/04. Given the importance of the productivity challenge, it then seeks to explore changes in NHS labour productivity at the acute hospital level. The analysis considers 110 acute hospitals(NHS and foundation trusts). These were selected as those that operated continuouslybetween 2006/07 and 2011/12, and were not significantly restructured over this period,particularly in relation to taking on community services formerly provided directly byprimary care trusts (PCTs). The reasons for excluding the latter of these are described inmore detail in the section entitled ‘Inputs’ in Chapter 3. We only consider 2006/07 to2011/12 for the labour productivity analysis (rather than from 2003/04 as in the rest of the report) due to availability and quality of output data.
This research is based on an analysis of annual accounts from across the English healthsector – strategic health authorities, PCTs, NHS and foundation trusts. These financialaccounts are submitted to the Department of Health by strategic health authorities,PCTs and NHS trusts1 and to Monitor by foundation trusts. They are consolidated intoannual accounts produced by the Department of Health (Department of Health, 2012b)and by Monitor (Monitor, 2012); neither organisation provides a detailed historicalanalysis. Throughout the report we have adjusted for inflation (using the HM Treasurygross domestic product (GDP) deflators as at 28 November 2012) so that all valuespresented are in 2011/12 prices.
1.Throughout this report, the term ‘NHS trust’ is used to refer to provider organisations that have not achieved foundation trust status, including acute trusts, mental health service trusts, community servicetrusts and ambulance trusts.
1. Introduction

The anatomy of health spending 2011/128
This report is intended to be the first in a series of annual reports on NHS finances. Theresearch findings use the accounts data described above to link Department of Healthfinancial performance to that of local organisations, such as provider trusts and PCTs.This work builds on the summary analyses for PCTs and NHS trusts that have beenproduced in recent years by the Audit Commission (see, for example, Audit Commission,2010). However, the role of the Audit Commission is changing and this function willcease in the future.
Changing NHS organisations
Analysing how well NHS organisations perform with respect to managing finances andproductivity is complicated. The NHS comprises many hundreds of separateorganisations, and comparing performance over time is made difficult by frequentchanges to accounting conventions as well as the organisational entities themselves, whichmay have merged or split over the period studied.
Figure 1.1 shows the number of NHS and foundation trusts (providers) and PCTs(commissioners) for each year since 2003/04.
Figure 1.1: Number of organisations in the English NHS: 2003/04 to 2011/12
350
300
250
200
150
100
50
0
Tota
l org
anisa
tions
2003
/04
2004
/05
2005
/06
2006
/07
2007
/08
2008
/09
2009
/10
2010
/11
2011
/12
Providers (NHS and foundation trusts) Commissioners (primary care trusts)
The number of PCTs has remained broadly the same since 2006/07, when the 303 PCTsreduced in number to 152 to serve larger populations. The only exception to this is inHertfordshire where the two PCTs there merged to form one in 2010/11.

The anatomy of health spending 2011/129
Figure 1.2 shows how the number and type of provider organisations within the EnglishNHS have changed from 2003/04. Following a period of significant reconfiguration ofNHS providers between 1997 and 2002, when there were 112 hospital mergers (Gaynorand others, 2012), there was a further gradual reduction in the number of acute andmental health trusts between 2003/04 and 2011/12. By 2011/12, there were 144 acuteNHS providers, of which 79 had achieved foundation trust status and 65 remained asacute NHS trusts. There was a smaller number of mental health trusts – 58 by 2011/12,of which 41 were foundation trusts. There was a small number of specialist trusts (21),with only one merger over the period – Nuffield Orthopaedic Centre merging withOxford University Hospitals.
The most significant changes to NHS providers over the past decade relate to ambulancetrusts and community health services. Ambulance trusts were reorganised from 30 truststo 11 over two years from 2006 to 2008. For community health services the TransformingCommunity Services programme separated off the community services that had beendirectly provided by PCTs from 2010/11. From then, the majority merged with acute ormental health trusts, but a small number of standalone community service trusts remained.
Table 1.1: NHS and foundation trusts in England: 2011/12
NHS trust
Foundation trust
Acute
65
79
Specialist
1
19
Mental health
17
41
Ambulance
7
4
Community
16
0
Figure 1.2: Number of NHS and foundation trusts by type, England:2003/04 to 2011/12
160
140
120
100
80
60
40
20
0
Num
bers
of t
rust
s
Acute
Mental health
2003
/04
2004
/05
2005
/06
2006
/07
2007
/08
2008
/09
2009
/10
2010
/11
2011
/12
Ambulance
Specialist
Community

The anatomy of health spending 2011/1210
Total health spend
Government spending on health across the United Kingdom (UK) in 2011/12 was£121.4 billion or 7.9 per cent of GDP (Public Expenditure Statistical Analyses, 2012).Since the formation of the NHS in 1948, this figure has increased by an average of 3.8 percent a year in real terms, with only eight financial years where there has been a real decrease(Harker, 2012). Two of these eight years were 2010/11 and 2011/12 (see Table 2.1).
2. NHS financial performance
03/04
74.9
6.5%
91.1
04/05
82.9
6.8%
98.0
+7.5%
05/06
89.8
7.0%
103.7
+5.9%
06/07
94.7
7.0%
106.5
+2.7%
07/08
102.3
7.1%
112.3
+5.4%
08/09
110.0
7.7%
117.5
+4.7%
09/10
118.2
8.3%
124.4
+5.9%
10/11
121.3
8.2%
124.1
-0.2%
11/12
121.4
7.9%
121.4
-2.2%
Table 2.1: Government spending on health in the UK: 2003/04 to 2011/12£ billion
Cash terms
Share ofGDP
Real-terms(2011/12)
Real-termschange
Of this total health spending, £105.4 billion (87 per cent) was spent on the NHS inEngland (according to the Department of Health’s Departmental Expenditure Limits(DELs) for revenue and capital). The remainder of the total was spent by the devolvedgovernments in Scotland, Wales and Northern Ireland on their health services. A smallamount went to the Department for Business, Innovation & Skills and the Departmentfor Culture, Media and Sport. This was funding for the Medical Research Council (£629 million funded through the Department for Business, Innovation & Skills) and the National Lottery Distribution Fund (£44 million funded through the Departmentfor Culture, Media and Sport) (Public Expenditure Statistical Analyses, 2012).
Revenue and capital spending on the English NHS in 2011/12 was below thegovernment’s planned level set out in the 2010 Spending Review, resulting in overallDepartment of Health underspend of around £1.4 billion. A small part of thisunderspend (£316 million) was added to the Department’s spending allocation for2013/14 but around £1 billion of the health budget had to be returned to the Treasury(Charlesworth, 2012; Department of Health, 2013). Table 2.2 compares actual aggregatehealth spending in 2011/12 with planned spending.
Source: Public Expenditure Statistical Analyses, 2012

The anatomy of health spending 2011/1211
Underspending the health budget is not a new phenomenon: it has been a feature offinancial management by the NHS and Department of Health for a number of years.Figure 2.1 shows the value of capital and revenue underspends reported by theDepartment of Health in aggregate for each of the six years from 2006/07. Prior to 2008,the Department of Health was able to carry over underspend under a system known as‘end year flexibility’. This was suspended following the financial crisis in the wider economyin 2008. By the time of the 2010 Spending Review, the Department of Health hadaccumulated a total underspend of £5.5 billion (cash) (Nuffield Trust, 2010). This was notcarried forward into the current spending review period, in line with all departments, andthe Treasury introduced a new system of more limited carryover between financial yearscalled the Budget Exchange Scheme (HM Treasury, 2011a). Under this system,departments do not have the automatic right to carry over any underspends in full andneed to reach agreement with the Treasury, subject to agreement of a prudent limit.
Table 2.2: Spending on health in England: 2011/12
£ billion
Revenue/resource
Capital
Total
Allocation
102.4
4.4
106.8
Outturn spending
101.6
3.8
105.4
Underspend
0.8
0.6
1.4
Source: Department of Health, 2013
2006/07 2007/08 2008/09 2009/10 2010/11 2011/12
Figure 2.1: Total health budget underspend compared with theDepartment of Health allocation: 2006/07 to 2011/12
2.5
2.0
1.5
1.0
0.5
0.0
Rea
l-ter
ms D
EL u
nder
spen
d (£
bill
ions
)
Revenue/resource Capital

The anatomy of health spending 2011/1212
PCT spending compared with allocations
Allocations from the Department of Health to PCTs account for the vast majority of theDepartment’s budget. In 2011/12, PCTs spent £91.0 billion, either on commissioningservices from other NHS and private providers for the population in their local areas, orthrough PCTs providing services directly themselves. The remainder was spent as follows:
• by strategic health authorities (£5.5 billion), of which the largest element was theMulti-Professional Education and Training (MPET) budget
• by the Department of Health (£4.6 billion)
• by arm’s-length bodies (£1.0 billion).
Finally, across NHS providers there was a £0.5 billion surplus in 2011/12, which countedagainst the Department of Health’s calculation of total spending.
A significant element of the total health underspend reported by the Department ofHealth in 2011/12 resulted from underspending by PCTs compared with theirallocations. In 2011/12, allocations to PCTs (revenue resource limits) were £526 million higher than spending.
Figure 2.2 shows how PCT spending compared with allocations to PCTs from 2003/04.Differences between this and Figure 2.1 therefore relate to strategic health authority andcentral departmental under- or overspends. PCTs significantly overspent from 2004/05to 2006/07 (with an average overspend of £436 million). Following the reorganisation ofPCTs in 2006/07, the financial position was much improved and, in aggregate, they havereported an underspend every year since.
Figure 2.2: PCT spending compared with allocations: 2003/04 to2011/12 (in 2011/12 prices)
95
90
85
80
75
70
65
60
55
50
Tota
l PC
T sp
endi
ng an
d al
loca
tions
(£
bill
ions
)
Net expenditure (outturn) Revenue resource limit (budget)
2003
/04
2004
/05
2005
/06
2006
/07
2007
/08
2008
/09
2009
/10
2010
/11
2011
/12

The anatomy of health spending 2011/1213
PCTs’ use of health care resources
Since 2003/04 there has been a substantial increase in spending on health care. Spending byPCTs to commission and provide health care for their local populations increased by anaverage of 3.9 per cent a year over and above inflation between 2003/04 and 2011/12.Overall spending by PCTs increased in real terms from £69 billion in 2003/04 to £91billion in 2011/12. Growth was greatest between 2003/04 and 2009/10. The year 2011/12marks a break with the recent past: spending by PCTs fell in real terms as the growth inallocations fell and PCTs did not spend all the money allocated to them to commission andprovide health services. This change in allocations reflects the movement of learningdifficulties provision from PCTs to local authorities in 2011/12; the value of this changewas £1.3 billion. On a like-for-like basis PCT allocation showed a small real-terms increase.
In addition to increases in the overall level of spending in the NHS, since 2003/04 therehave been important changes in the mix of services that PCTs have chosen to commission and provide. Throughout this period, PCTs have spent the majority of theirhealth care resources on secondary care.1 In 2011/12, this accounted for three quarters of total spend or £68.8 billion, compared with £21.6 billion on primary care. Secondarycare covers a very wide range of services from acute and specialist hospitals to communityservices such as district nursing. Primary care includes all GP services, their prescribing,and NHS-funded dental care, opticians and high-street pharmacies. PCTs also spent £1.7 billion on non-health care items, including their own running costs.
In real terms, PCT spending on primary care rose by 22 per cent (just under three per cent a year) between 2003/04 and 2011/12, increasing from £17.7 billion to £21.6 billion. Almost all of this increase occurred between 2003 and 2005 with theintroduction of the new GP contract in April 2004, which led to a 14 per cent increase in GPs’ gross earnings (across General Medical Services (GMS) and Personal MedicalServices (PMS) practices) in one year (Health and Social Care Information Centre,2012c). In comparison, PCT spending on secondary care jumped 40.1 per cent over the same period, increasing from £49.1 billion to £68.8 billion. This is equivalent to anaverage increase of over five per cent a year.
Primary carePrimary care spending as a proportion of overall spending on NHS care by PCTs reducedfrom 26 per cent to 24 per cent between 2003/04 and 2011/12. Figure 2.3 shows thedifferent types of care included within primary care. It includes spending on generalpractices (General Medical Services, Personal Medical Services and alternative providermedical services), general dental services, general ophthalmic services, and prescriptionand pharmacy services. Spending on General Medical Services and general dental servicestransferred from central government to PCTs in 2004/05 and 2007/08 respectively.
PCT spending on primary care has two key components: GP services and prescribing.Together these account for almost three quarters of spending on primary care. Despite theoverall increase in spending on health since 2003/04, spending on GP services has beenstatic since 2005. This may underestimate investment as a result of changes to the provisionof GP out-of-hours care. Prior to 2004, GPs provided such a service as part of theircontractual arrangements. The new GP contract introduced in 2004 changed thesearrangements so that GPs no longer had to provide out-of-hours services, and PCTs
1. Types of care have been grouped into primary or secondary care based on Department of Healthfinancial reporting definitions.

The anatomy of health spending 2011/1214
contracted with other providers to deliver this care. These contracts are not listed withinPCT accounts as primary care spending, but are recorded as spending on secondary care.Data from the NHS Information Centre (Health and Social Care Information Centre,2012a) show that from 2007/08 to 2011/12, PCT spending on out-of-hours care increasedby two per cent a year to £400 million a year. Including this in general practice spending byPCTs, however, does not change the overall conclusion. Since 2007/08, spending on GPservices by PCTs has fallen in real terms by an average of 0.2 per cent a year.
Spending on prescribing by general practice has changed little since 2003/04, increasingby 0.5 per cent a year between 2003/04 and 2011/12. In the past, the cost ofprescriptions has tended to increase at a faster rate than overall health care spending;however, this trend has now reversed. This relative slow-down in spending on prescribinghas been seen in most countries of the Organisation for Economic Co-operation andDevelopment (OECD) – between 2000 and 2008, health spending across the OECDgrew by four per cent a year in real terms while spending on pharmaceuticals grew by 3.5 per cent (Organisation for Economic Co-operation and Development, 2012). Thischange in prescribing spend in England is not because there are a smaller number of itemsprescribed – it is because the cost per item (net ingredient cost) has fallen (Health andSocial Care Information Centre, 2012b).
Outside of general practice, NHS spending on pharmaceutical services increased greatlybetween 2003/04 and 2011/12, rising by £814 million (7.7 per cent a year). Pharmaceuticalservices include the payments made by PCTs to high-street pharmacists to reimburse themfor their work dispensing prescription medicines. The increase in pharmaceutical servicesspending occurred primarily as a result of the new pharmacy contract introduced in
Figure 2.3: PCT spending on primary care in England: 2003/04 to 2011/12
25
20
15
10
5
0
Purc
hase
of p
rimar
y car
e (£
billi
ons)
Other
Ophthalmic services
Dental services
Prescribing costs
17.719.3
20.7 20.9 21.0 21.322.0 21.8 21.6
2003
/04
2004
/05
2005
/06
2006
/07
2007
/08
2008
/09
2009
/10
2010
/11
2011
/12
Pharmaceutical services
GP services

The anatomy of health spending 2011/1215
2006/07, which incentivised pharmacists to provide services other than prescribing,including medicine usage reviews, immunisations and stop-smoking services.
Secondary careFigure 2.4 shows how spending on the services included within secondary care haschanged. This includes all PCT spending plus an additional £1.3 billion of spending onservices for people with learning difficulties paid by the Department of Health throughthe Learning Disability and Health Reform Grant in 2011/12.
Figure 2.4: PCT spending on secondary care in England: 2003/04 to 2011/12
80
70
60
50
40
30
20
10
0
Purc
hase
of s
econ
dary
care
(£ b
illio
ns)
Other contractual
Community health services
Hospital services
Mental illness
Learning difficulties
49.154.2 53.6 52.7
56.659.6
66.2 67.6 68.8
2003
/04
2004
/05
2005
/06
2006
/07
2007
/08
2008
/09
2009
/10
2010
/11
2011
/12
Since 2003/04 there has been a £19.7 billion, or 40 per cent, real-terms increase insecondary care spending across the NHS and private providers. Around £2.8 billion ofthis has been due to the transfer of market forces factor funding from the centraldepartment to PCTs. As a result, this £2.8 billion has not led to a corresponding increasein provider income.
Just over half of the total increase (£10.8 billion) has been spent on general and acute care (an increase of 4.6 per cent a year). While our data do not allow us to remove the expenditure associated with transferring the market forces factor (for PCTs) from thetotal expenditure on general and acute services (as some of this will need to be allocatedto other categories such as accident & emergency and mental health services), we can saythat general and acute spending has increased by at least £8.0 billion in real terms (an average of 3.4 per cent a year). A further £4.0 billion of the increase has been spent oncommunity health services (an increase of 9.9 per cent a year), reflecting governmentpolicy to increase relative spending on community services in order to move care out of acute settings.

The anatomy of health spending 2011/1216
The shifting of responsibility for certain areas of spending from the Department ofHealth to PCTs makes comparisons over time difficult. However, over the last two years there have been fewer changes, hence comparisons are more valid. Figure 2.5 showshow spending has changed across four broad areas:
• GP services
• mental health
• hospital services (general and acute, accident & emergency and maternity)
• community health services.
As the figure shows, the biggest increase in PCT spending was on community healthservices, while spending on GP services fell.
Figure 2.5: Percentage changes in spending in England: 2010/11 to 2011/12
8%
4%
0%
-4%Perc
enta
ge ch
ange
in sp
endi
ng
Total GP services Mental health Hospital services Community healthservices
2010/11 2011/12
Trust revenue and spending
PCTs pay providers to deliver health care to patients in their local communities. Beyondprimary care, most of this care is provided by NHS organisations: mental health trusts,specialist trusts, acute hospitals and community trusts. In this analysis we collated the annualaccounts of all hospitals (acute and specialist) and NHS mental health and communityhealth providers. These providers can be NHS trusts or the more autonomous foundationtrusts, which are regulated by Monitor. This analysis allows us to assess the financialperformance of NHS providers and to compare this with the financial position of PCTs.
The anatomy of health spending 2011/1217
Revenue and spendingAnnual real-terms spending by NHS and foundation trusts increased from £43.8 billionin 2003/04 to £65.5 billion in 2011/12 (an increase of 49 per cent or an average of 6.2 per cent a year). Over the same period, the income of NHS and foundation trustsincreased at a faster rate, growing from a combined total of £44.6 billion in 2003/04 to£67.7 billion in 2011/12 (an increase of 52 per cent or an average of 6.5 per cent a year).
Trusts’ spending and income increased across all the English regions but this increase wasnot uniform. Spending and income increased fastest in the West Midlands, which sawspending by NHS and foundation trusts increase by 8.6 per cent a year over this period,with income growing at 9.0 per cent. Spending in the South Central region grew at theslowest rate of all English regions, increasing by 5.0 per cent each year on average over thenine-year period, with income rising by 5.3 per cent. While income and spending bothgrew in every region, there were some important differences. Income growth in the NorthEast outpaced spending by an average of 0.6 per cent a year in real terms. Conversely, inLondon trends in providers’ income and spending were much closer. Over the nine-yearperiod the income received by London trusts grew by just 0.1 per cent a year more thantheir spending.
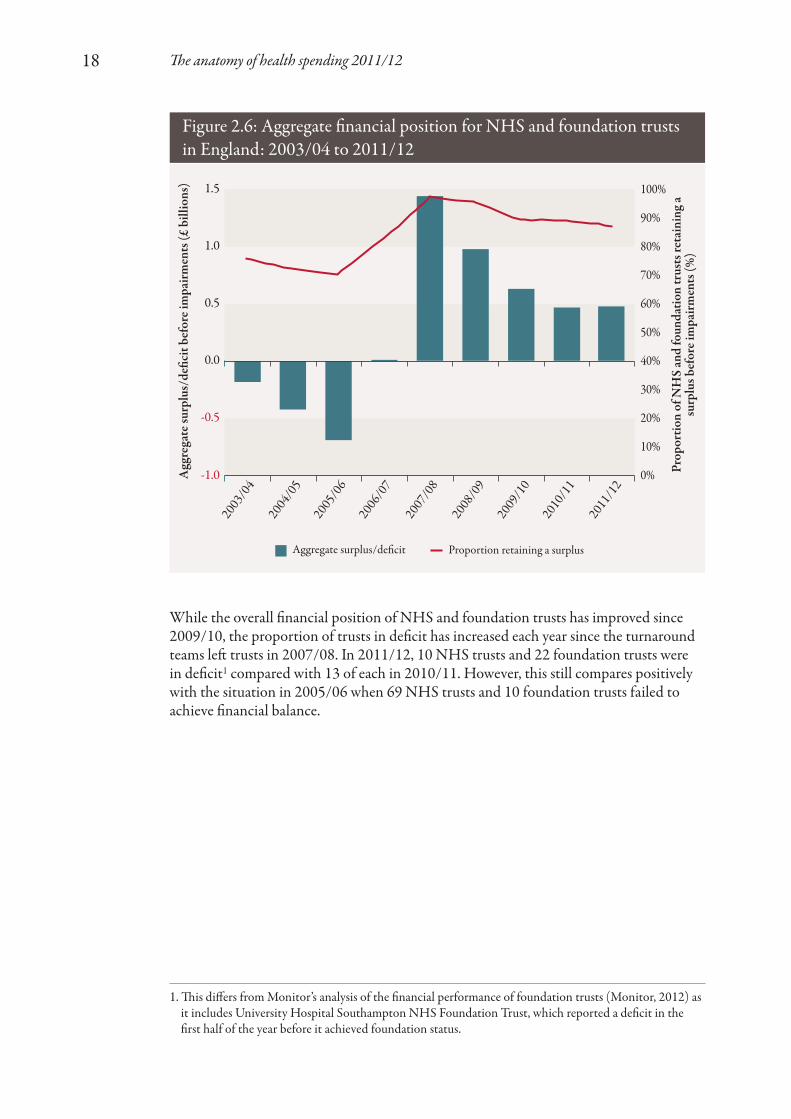
Surpluses and deficitsAs a result of trust income growing at a faster rate than spending in England as a whole,the overall financial position of the trust sector improved between 2003/04 and2011/12. Throughout this analysis we consider total spending before impairments.Impairments are accounting adjustments made to take account of one-off revaluations ofassets and, as a result, they distort year-on-year trends if they are not removed.
At the beginning of this period, the aggregate annual retained deficit before impairments actually worsened, eventually reaching a £682 million deficit in 2005/06.On 1 December 2005, the Secretary of State for Health announced that turnaroundteams would be sent into trusts with the largest deficits. Alongside these teams, there wereother significant changes to the NHS, including the advent of foundation trusts, the roll-out of Payment by Results (PbR), an increase in PCT size and a PCT assessment systemcalled ‘world class commissioning’. Following these changes, there was significantimprovement amounting to a £1.4 billion surplus by 2007/08. From 2007/08, theaggregate surplus reduced to £482 million in 2011/12. As shown in Figure 2.6, there hasbeen a slight upward trend in surplus since 2009/10, although this has been from adecreasing proportion of trusts.
The anatomy of health spending 2011/1218
While the overall financial position of NHS and foundation trusts has improved since2009/10, the proportion of trusts in deficit has increased each year since the turnaroundteams left trusts in 2007/08. In 2011/12, 10 NHS trusts and 22 foundation trusts were in deficit1 compared with 13 of each in 2010/11. However, this still compares positivelywith the situation in 2005/06 when 69 NHS trusts and 10 foundation trusts failed toachieve financial balance.
Figure 2.6: Aggregate financial position for NHS and foundation trustsin England: 2003/04 to 2011/12
1.5
1.0
0.5
0.0
-0.5
-1.0
100%
90%
80%
70%
60%
50%
40%
30%
20%
10%
0%Agg
rega
te su
rplu
s/de
ficit
befo
re im
pairm
ents
(£ b
illio
ns)
Prop
ortio
n of
NH
S an
d fo
unda
tion
trus
ts re
tain
ing
a su
rplu
s bef
ore i
mpa
irmen
ts (%
)
Aggregate surplus/deficit Proportion retaining a surplus
2003
/04
2004
/05
2005
/06
2006
/07
2007
/08
2008
/09
2009
/10
2010
/11
2011
/12
1. This differs from Monitor’s analysis of the financial performance of foundation trusts (Monitor, 2012) asit includes University Hospital Southampton NHS Foundation Trust, which reported a deficit in thefirst half of the year before it achieved foundation status.
The anatomy of health spending 2011/1219
Figure 2.7: Distribution of surpluses/deficits among NHS andfoundation trusts: 2011/12
30
20
10
0
-10
-20
-30
-40
-50
-60
-70Ret
aine
d su
rplu
s bef
ore i
mpa
irmen
ts (2
011/
12)
(£ m
illio
ns)
NHS trust
0 10 20 30 40 50 60 70 80 90 100 110 120 130 140 150
Foundation trust
Rank within trust type
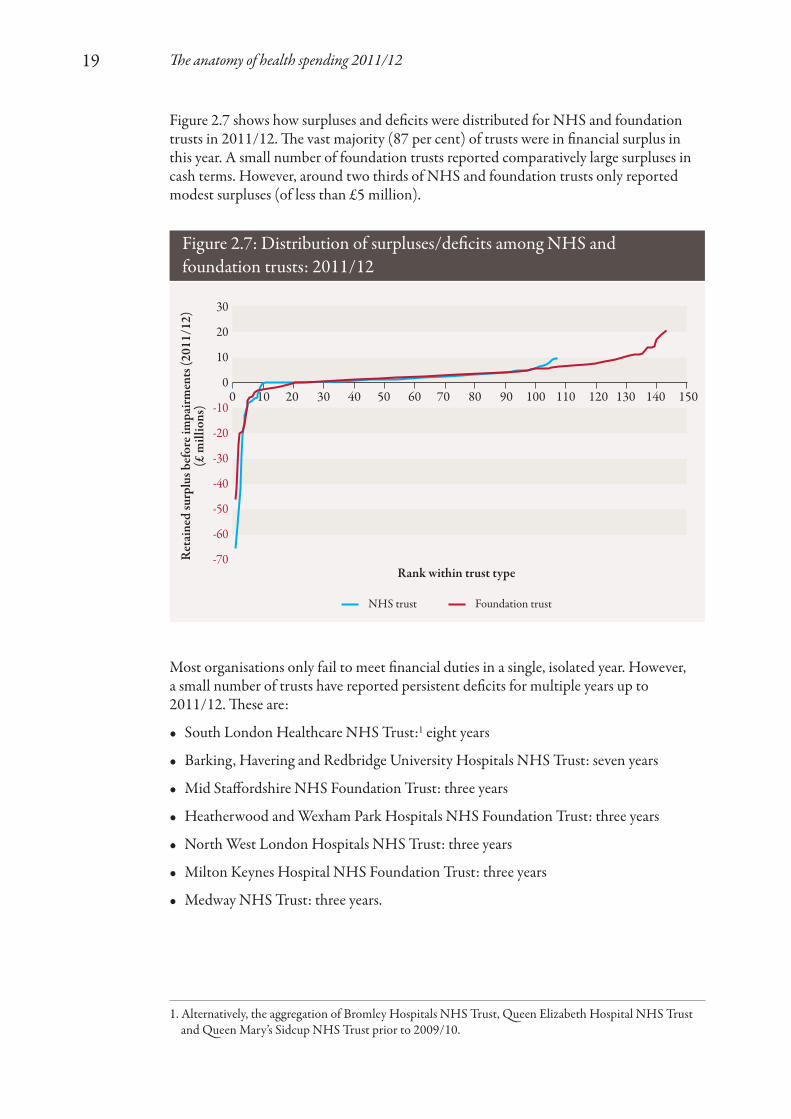
Figure 2.7 shows how surpluses and deficits were distributed for NHS and foundationtrusts in 2011/12. The vast majority (87 per cent) of trusts were in financial surplus inthis year. A small number of foundation trusts reported comparatively large surpluses incash terms. However, around two thirds of NHS and foundation trusts only reportedmodest surpluses (of less than £5 million).
Most organisations only fail to meet financial duties in a single, isolated year. However, a small number of trusts have reported persistent deficits for multiple years up to2011/12. These are:
• South London Healthcare NHS Trust:1 eight years
• Barking, Havering and Redbridge University Hospitals NHS Trust: seven years
• Mid Staffordshire NHS Foundation Trust: three years
• Heatherwood and Wexham Park Hospitals NHS Foundation Trust: three years
• North West London Hospitals NHS Trust: three years
• Milton Keynes Hospital NHS Foundation Trust: three years
• Medway NHS Trust: three years.
1. Alternatively, the aggregation of Bromley Hospitals NHS Trust, Queen Elizabeth Hospital NHS Trustand Queen Mary’s Sidcup NHS Trust prior to 2009/10.
The anatomy of health spending 2011/1220
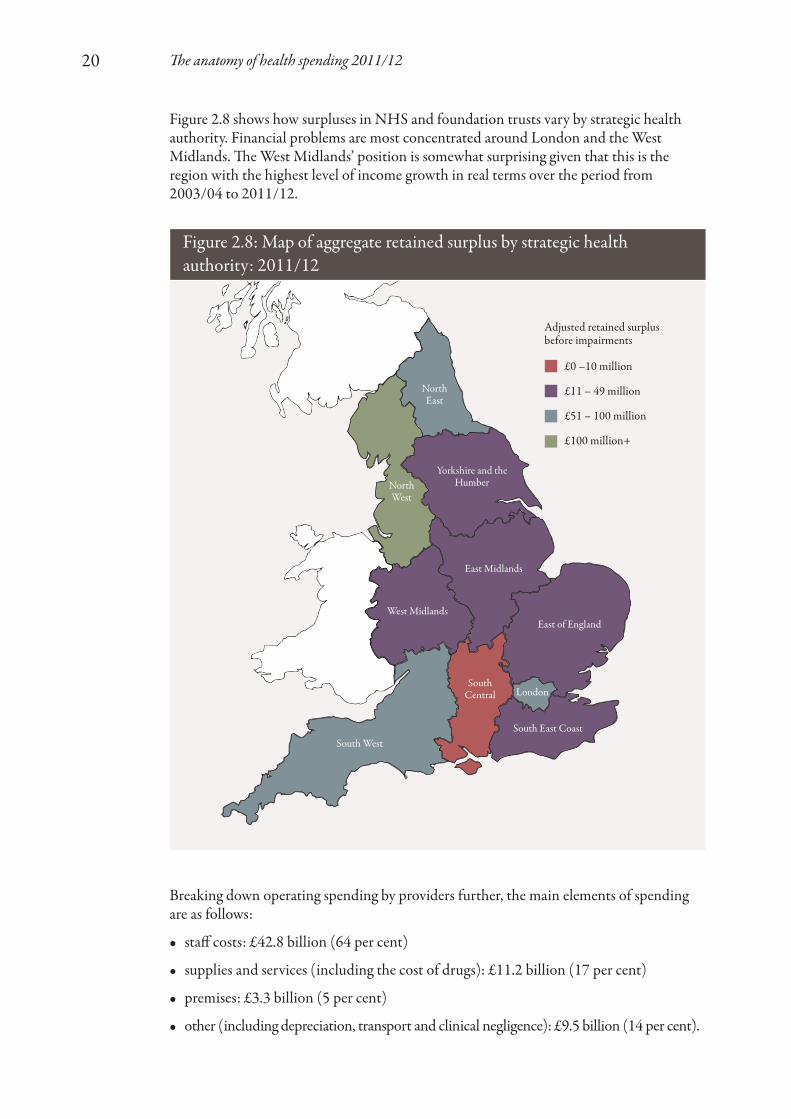
Figure 2.8 shows how surpluses in NHS and foundation trusts vary by strategic healthauthority. Financial problems are most concentrated around London and the WestMidlands. The West Midlands’ position is somewhat surprising given that this is theregion with the highest level of income growth in real terms over the period from2003/04 to 2011/12.
Figure 2.8: Map of aggregate retained surplus by strategic healthauthority: 2011/12
£0 –10 million
£11 – 49 million
£51 – 100 million
£100 million+
Adjusted retained surplus before impairments
Breaking down operating spending by providers further, the main elements of spendingare as follows:
• staff costs: £42.8 billion (64 per cent)
• supplies and services (including the cost of drugs): £11.2 billion (17 per cent)
• premises: £3.3 billion (5 per cent)
• other (including depreciation, transport and clinical negligence): £9.5 billion (14 per cent).
NorthEast
NorthWest
LondonSouth
Central
South West
East Midlands
West MidlandsEast of England
South East Coast
Yorkshire and theHumber

The anatomy of health spending 2011/1221
Spending on staffIn our analysis of spending on staff, we have included spending by PCTs as well as NHSand foundation trusts. This is in order to remove the impact of moving staff betweenPCTs and providers, which has happened particularly in recent years with theTransforming Community Services programme.
We have excluded the cost of independent contractors and their staff from this analysisbecause far less information on this is available from the accounts. This means that GPs,practice nurses, dentists and pharmacists, for example, are excluded from the workforcespending figures. This gives an artificially low proportion of spending on staff but reflectsthe different contractual status of these groups, which are not made up of staff directlyemployed by NHS organisations.
Figure 2.9: Spending on staff: 2003/04 to 2011/12
50
45
40
35
30
25
20
15
10
5
0
100%
90%
80%
70%
60%
50%
40%
30%
20%
10%
0%
Rea
l agg
rega
te w
orkf
orce
spen
d (£
bill
ions
)
Prop
ortio
n of
tota
l PC
T o
pera
ting
expe
nditu
reon
wor
kfor
ce (%
)
Real aggregate workforce spending Proportion of PCT spending
2003
/04
2004
/05
2006
/07
2007
/08
2008
/09
2009
/10
2010
/11
2011
/12
2005
/06
56% 56% 56% 55%52% 54% 52% 51% 50%
Real aggregate spend on staff increased by £10.8 billion from 2003/04 to 2011/12 but it fell by six percentage points as a proportion of total PCT spending, as shown in Figure 2.9. Figure 2.10 separates the effects of changing numbers of staff and costs perhead on overall spending between any two years. For example, between 2003/04 and2004/05, total staff numbers increased by 28,700. At the 2003/04 average cost per head(£36,000),1 this led to an increase in staff spend of £1 billion. On top of this, average cost per head increased by £2,600 (for 994,500 staff ), leading to a further increase of
1. In 2011/12 prices to allow for an inflation-adjusted comparison.

The anatomy of health spending 2011/1222
Figure 2.10: Spending changes by staff numbers and cost per head:2003/04 to 2011/12
50
48
46
44
42
40
38
36
34
32
30Rea
l agg
rega
te w
orkf
orce
spen
d (£
bill
ions
)
2003
/04
Staff
num
bers
Cost p
er he
ad20
04/0
5St
aff nu
mbe
rsCos
t per
head
2005
/06
Staff
num
bers
Cost p
er he
ad20
06/0
7St
aff nu
mbe
rsCos
t per
head
2007
/08
Staff
num
bers
Cost p
er he
ad20
08/0
9St
aff nu
mbe
rsCos
t per
head
2009
/10
Staff
num
bers
Cost p
er he
ad20
10/1
1St
aff nu
mbe
rsCos
t per
head
2011
/12
£2.5 billion. Therefore, in total, spending on staff increased by £3.6 billion1 from £34.8billion in 2003/04 to £38.4 billion in 2004/05.
Figure 2.10 demonstrates that growth in spending on staff was driven by both increasingstaff numbers and increasing salaries in most years up to 2010/11. The exceptions to thiswere 2006/07 and 2007/08, when there were small reductions in staff numbers, whichwere more than offset by increases in cost per head.
The growth in staff spending came to a halt in 2011/12. Between 2010/11 and 2011/12, there was a three per cent reduction in spending on staff (reducing spending by £1.5 billion in real terms). Of this, £1 billion was from a reduction in staff numbers (from 1,107,001 to 1,077,890) and the remaining £0.5 billion resulted from reduced cost per head (from £42,543 a year on average to £42,328). This reduction in spending on staff was probably driven by three complementary government policies:
• reductions in the cost of management and administration, which saw the costsassociated with PCT commissioning fall by 18.0 per cent in 2011/12 and the number of staff employed in NHS infrastructure support fall by 3.2 per cent (AuditCommission, 2012)
• the NHS pay freeze, which for 2011/12 led to a real-terms reduction in salaries for all staff earning more than £21,000; this real-terms reduction in cost per head is likelyto continue for at least one year.
1. Not £3.5 billion due to rounding.
Increase Decrease

The anatomy of health spending 2011/1223
• the Transforming Community Services programme, which has transferred theproviders that PCTs owned and managed to other organisations; in particular, some ofthese providers transferred to social enterprises, which no longer fall within the remitof NHS accounts, thus reducing NHS-employed staff numbers.
As one might expect, there were significant differences in the proportions of total PCTspending on staff for different regions. These differences were most pronounced betweenLondon and other parts of the country. In London, an additional 12 per cent of PCTspending was spent on staff compared to elsewhere, as shown in Figure 2.11.
Figure 2.11: London versus non-London spending on NHS staff inPCTs and NHS providers: 2003/04 to 2011/12
70%
65%
60%
55%
50%
45%
40%Perc
enta
ge o
f tot
al P
CT
ope
ratin
g ex
pend
iture
on w
orkf
orce
(%)
London Non-London
2003
/04
2004
/05
2005
/06
2006
/07
2007
/08
2008
/09
2009
/10
2010
/11
2011
/12
These differences are due in part to higher average wages in London (for which trustsshould be reimbursed through a higher market forces factor) and there is also a largenumber of teaching and research trusts based in London, which have relatively higherstaff costs.
Private Finance Initiative schemesSince 1992, most new capital investment in the NHS has been undertaken throughPrivate Finance Initiative (PFI) schemes. Under these arrangements, the private sectorfinances the design, build and operation of hospitals, which are then leased back to thepublic sector. In this analysis, we have considered spending on the interest relating to PFI debt as the other aspects of PFI payments should offset other operational spendingrelating to buildings or equipment.
Provider spending on repayments of these PFI schemes has increased substantially since2009/10 as more schemes have been completed. Furthermore, PFI charges on debtinterest are typically indexed to the Retail Price Index (RPI) or RPIX (RPI excluding

The anatomy of health spending 2011/1224
mortgage interest cost), measures of inflation that tend to be higher than other inflationmeasures (such as the GDP deflator, which is the government economy-wide measureused for public services). As a result, simply indexing charges using these measures canlead to a real-terms increase. In total, spending on PFI interest increased from £459.0million in 2009/10 to £628.7 million in 2011/12, an average increase of 18 per cent ayear (see Figure 2.12).
Figure 2.12: NHS spending on PFI interest in England: 2009/10 to 2011/12
London
West
Midlan
dsNor
th W
estNor
th East
East of
England
South
Cen
tral
Yorksh
ire an
d the H
umber
East M
idlands
South
East C
oast
South
West
160
140
120
100
80
60
40
20
0Agg
rega
te p
rovi
der e
xpen
ditu
re o
n PF
I int
eres
t(£
mill
ions
)
2009/10 2010/11 2011/12
Figure 2.12 demonstrates that these payments have not been evenly spread acrossEngland. In particular, spending in London of £143.9 million in 2011/12, was more thanfive times greater than spending in the South West (£26.9 million in 2011/12).
In recent years, the PFI debt interest payments have started to become a particular burdenfor a number of trusts. For example, in seven trusts they make up more than five per centof total revenue and two of these (South London and Barking) have reported deficits forat least the last three years:
• Dartford and Gravesham NHS Trust: 7.9 per cent of spending
• Sherwood Forest Hospitals NHS Foundation Trust: 7.0 per cent
• South London Healthcare NHS Trust: 6.0 per cent
• Norfolk and Norwich University Hospitals NHS Foundation Trust: 5.8 per cent
• Barking, Havering and Redbridge University Hospitals NHS Trust: 5.6 per cent

The anatomy of health spending 2011/1225
• Peterborough and Stamford Hospitals NHS Foundation Trust: 5.6 per cent
• St Helens and Knowsley Hospitals NHS Trust: 5.3 per cent.
Other spendingAfter staff costs, the next largest spending category is supplies and services (includingdrugs). This amounted to £11.2 billion in 2011/12, or 17 per cent of total trust spending,an increase of £5.4 billion (12 per cent a year) since 2003/04.
In 2011/12, £1.1 billion was spent by providers purchasing services from other NHSbodies (such as other NHS or foundation trusts), a decrease of £312 million in real termssince 2003/04. However, the decrease was partially offset by a £54 million increase in thevalue of services purchased from non-NHS bodies (from £462 million to £515 million).
There was also a marked increase in real-terms spending on clinical negligence, whichincreased from £286 million in 2003/04 to £892 million in 2011/12, an average increaseof 27 per cent a year.
The anatomy of health spending 2011/1226
Background
The Office for National Statistics (ONS) publishes an annual report investigatingproductivity in health care in the UK (Peñaloza and others, 2010). The latest of these wasreleased in December 2012 and estimates productivity for publicly funded health carebetween 1995 and 2010 (Massey, 2012). Measuring productivity is complex, but this isparticularly true in health care. Productivity measures aim to compare the serviceprovided with the inputs used to provide the service. Productivity increases if the serviceprovided increases at a faster rate than the inputs used. In health care, the challenge facedin estimating changes in productivity is being clear about the service provided. Inparticular, is it enough to measure the activity provided? There are two problems withfocusing on activity: first, activity alone does not capture changes in quality, yet these arevery important outputs of health services; and second, the link between activity andhealth outcomes is variable. The measurement of productivity of health services istherefore subject to much debate (Black, 2012; Grice, 2012).
The ONS measure attempts to capture quality-adjusted output. This may understateproductivity gains for a number of reasons. One key issue, which our analysis highlights,is the lack of comprehensive activity data for all secondary care services. PCTs haveincreased spending on community health services faster than other services over recentyears and this now accounts for 10 per cent of all PCT spending. There are no NHS-wideconsistent activity data for community health services, although some data are availablefrom reference cost systems. The choice and comprehensiveness of quality measures, andthe relative weight that quality is given in the productivity measure, will also impact onthe conclusions that can be drawn.
The ONS defines health care productivity as the ratio of quality-adjusted output to thevolume of inputs (Hardie and others, 2011). The outputs are measured as a cost-weightedactivity index, covering:
• hospital and community health services, including hospital inpatient, day case andoutpatient episodes, distinguished by Healthcare Resource Group
• family health services, including GP and practice nurse consultations, publicly fundeddental treatment and sight tests
• GP prescribing.
These outputs are adjusted for quality, based on the extent to which services succeed in delivering their intended outcomes and the extent to which they are responsive tousers’ needs.
The inputs are measured as spending on the following:
• labour, for example medical staff
• goods and services, such as clinical supplies and electricity
3. Productivity

The anatomy of health spending 2011/1227
• capital consumption, which is a measure of the extent to which capital stock is used up.
Notwithstanding these limitations, improving the productivity performance of the NHSis critical if it is to sustain the quality and range of health care it is able to provide over thenext few years. The Department of Health estimates that in 2011/12, the NHS deliveredefficiency savings of £5.8 billion. Half of these savings were reported as being achieved byacute health services (National Audit Office, 2012). In a review of progress in achievingefficiency savings in health, the National Audit Office found that despite the positiveaggregate position, there was limited assurance that all the savings were achieved, as PCTs do not measure or report savings in a consistent way. Moreover, it found thatcentral initiatives such as those on pay and administrative cost savings had made asubstantial contribution to the existing performance, and that while servicetransformation is fundamental to making future savings, it could find only limited evidence of such change to date.
Given the scale of savings that are required of the acute sector, and the lack of consistentdata on performance, we sought to extend the ONS productivity measure to determinefirst whether a similar measure can be calculated for individual trusts, and second howproductivity performance varies at the individual trust level.
Our measure differs from the ONS measure in the following respects:
• It only looks at the performance of the NHS in England.
• It only includes activity (inpatient admissions, outpatient and accident & emergencyattendances) undertaken in NHS and foundation trusts.
• It does not adjust for quality.
• The input measure used is labour input, not the total cost of delivering care.
The absence of quality adjustment reflects challenges in the construction of suchmeasures at the trust level. As such, this work should be viewed as an initial attempt tomeasure labour productivity at the trust level. To understand labour productivityimprovement more fully, the measure should be extended to take into account the qualityof care. For this reason, we refer to this as a measure of ‘crude’ labour productivity, and donot claim it to be comprehensive.
Despite these limitations, we believe such a measure would be worth considering.Measuring labour productivity at an individual provider level is important because itreflects the fact that situations differ greatly between trusts and allows more detailedanalysis. Our analysis considered 110 NHS acute trusts and foundation trusts. These wereselected as those that had operated continuously between 2006/07 and 2011/12, and hadnot been significantly restructured over this period, particularly in relation to taking oncommunity services formerly provided directly by PCTs. The reasons for excluding thelatter of these are described below in more detail in the section on inputs. We onlyconsidered 2006/07 to 2011/12 (rather than from 2003/04 as in the rest of the report)due to availability and quality of output data.
The anatomy of health spending 2011/1228
Outputs
This study relates to acute trusts only, so the primary care elements in the ONScalculation of output were not estimated.
Anonymised person-level hospital activity data were derived from the Hospital EpisodeStatistics dataset with costs applied according to the method used in previous analysis bythe Nuffield Trust (Dixon and others, 2011). First, the Healthcare Resource Group foreach inpatient’s whole stay in hospital was calculated, after which costs were derived byapplying PbR rules (Department of Health, 2010a) to combine the Healthcare ResourceGroup, admission method and other details of the hospital stay. This included the unitcost of the Healthcare Resource Group and any payments due because of an unexpectedlylong stay in hospital, or for any specialist care or additional treatments and tests (so-called‘unbundled payments’). Prices were drawn from the 2010/11 PbR national tariff(Department of Health, 2010b).
In cases where the secondary care activity did not have a tariff, costs were estimated fromthe 2007/08 national reference costs (Department of Health, 2009), which were used todefine the 2010/11 tariff. NHS tariff inflation was taken into account in order to makethem comparable.
Costs of outpatient care were also calculated according to the PbR rules, with theadjustments set out above.
Between 2006/07 and 2010/11, this activity measure increased by 19 per cent(approximately 4.8 per cent a year). However, in 2011/12, this trend was reversed andthere was a one per cent reduction in activity for the 110 trusts considered as part of this analysis.
Inputs
Spending on staff by NHS and foundation trusts increased in real terms from £33.2billion in 2006/07 to £43.0 billion in 2011/12 (approximately six per cent a year). NHSaccounts report data on workforce numbers in addition to their spending on staff.Analysing the staff data provided by NHS organisations (NHS trusts, foundation trustsand PCTs) shows that there has also been a significant change in the make-up of staff. In particular, there was a shift away from employing nurses, towards both relativelyhigher-cost medical staff and lower-cost health care assistants.
Overall NHS workforce spending fell in 2011/12 by three per cent in real terms.However, in the 110 acute trusts included in the labour productivity analysis, workforcecost increased in real terms. This may reflect the focus on reducing PCT commissioningspending in 2011/12 as a source of workforce savings.
A key difficulty experienced with regard to labour inputs related to the government’sTransforming Community Services programme, which transferred community servicesfrom the provider arms of PCTs to other organisations in 2010/11 and 2011/12. Theseother organisations include existing acute and mental health providers, social enterprisesand new standalone community trusts. In particular, the transfer to existing acute trustshas increased the labour costs associated with these trusts without changing their crudeoutputs (as community service activity is not included in the output measure).

The anatomy of health spending 2011/1229
In 2009/10 (before any Transforming Community Services transfers took place), thelabour costs associated with the provider arms of PCTs that were later integrated withacute trusts totalled £1.5 billion. Unfortunately, the PCTs did not separately report these costs prior to 2009/10 and, for this reason, the trusts that integrated PCT providerarms were excluded from the analysis of productivity. The impact of this exclusion isdescribed below.
Trust labour productivity
For our productivity analysis, we only included trusts where data (that is, outputs andlabour costs) were available for all years from 2006/07 to 2011/12. We also excludedspecialist trusts as these were assumed to have fundamentally different costs to non-specialist acute trusts. In particular, these trusts were more likely to take patients who require more complex, and thus relatively more costly, care. The full list of trustsincluded in the analysis can be found in Appendix 1.
As one would expect, there was a strong relationship between the input and outputmeasures, which Figure 3.1 shows. Interestingly, this relationship was not quite linear,with a distinct reduction in output relative to input for the largest trusts (those towardsthe right-hand side of the chart). Using our measure of productivity, this suggests that abigger size of trust may not always be an advantage. However, the diseconomies of scale
Figure 3.1: Relationship between labour inputs and output in selectedNHS providers in England: 2006/07 to 2011/12
Out
put
Labour input
2006/07 2007/08 2008/09 2009/10 2011/12 45 degree line
Note: larger trusts are shown towards the right-hand side of the chart.

The anatomy of health spending 2011/1230
suggested by this relationship may not reflect a lack of productivity, but rather may beassociated with the fact that the largest trusts undertake activities that are not included inour output measure (such as teaching and research).
At an aggregate level, the ONS measure (Figure 3.2) shows that between 2006 and 2010,inputs and outputs increased at broadly the same rate. As a result, UK-wide health careproductivity (including NHS and non-NHS providers) essentially remained unchangedover this period, falling by 1.4 per cent in total.
Figure 3.2: Changes in UK health care productivity (NHS and non-NHSproviders) – ONS measure: 1995 to 2010
1.3
1.2
1.1
1.0
0.9
0.8
0.7
0.6
0.5
Prod
uctiv
ity in
dex
(200
6 =
1.0
0)
Output
1995
1996
1997
1998
1999
2000
2001
2002
2003
2004
2005
2006
2007
2008
2009
2010
Input Productivity
Source: Massey, 2012
The anatomy of health spending 2011/1231
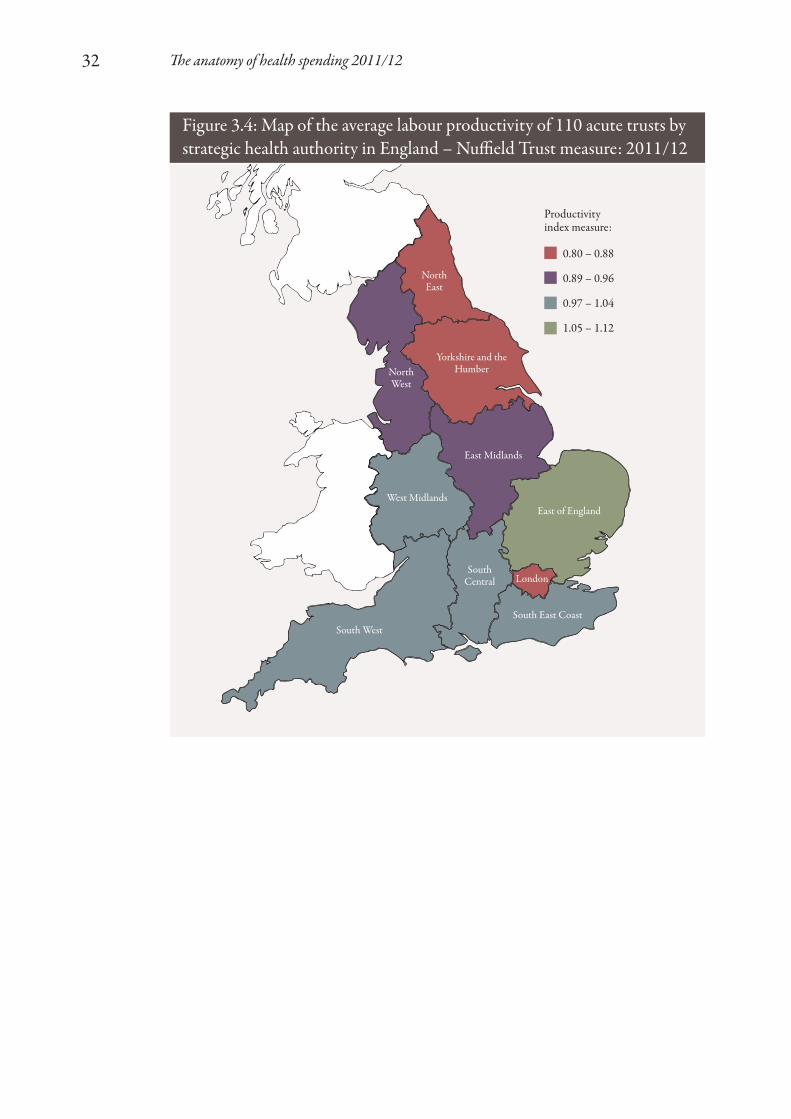
One of the key advantages of the provider-level productivity measure over the nationwideone is that it allows us to explore how much variation there is in labour productivitybetween different organisations. Figure 3.4 shows how the labour productivity indexvaries by strategic health authority, demonstrating a clear divide between relatively moreproductive trusts in the South of England and the less productive ones in the North.
The exception to this is London, where trusts were found to be relatively less productive.This is probably a similar effect to the diseconomies of scale identified in Figure 3.1, as above-average amounts of teaching and research, which are not included in our outputmeasure, take place in London, thus leading to a lower apparent labour productivity.
These geographic results differ from previous analysis undertaken at a strategic healthauthority level, which included all activity and not just non-specialist acute activity(Bojke and others, 2012a). Taking non-acute and specialist activity into account, theyfound productivity to be highest in the South West and lowest in East Midlands, SouthCentral and Yorkshire and the Humber.
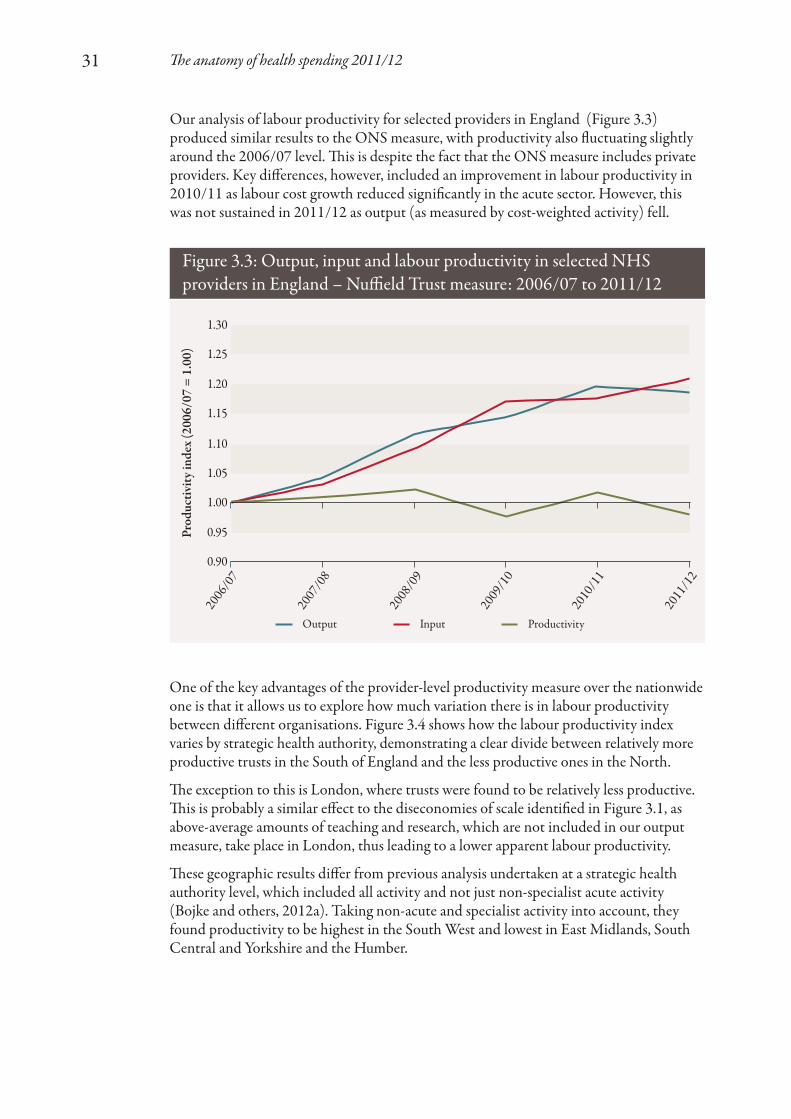
Our analysis of labour productivity for selected providers in England (Figure 3.3)produced similar results to the ONS measure, with productivity also fluctuating slightlyaround the 2006/07 level. This is despite the fact that the ONS measure includes privateproviders. Key differences, however, included an improvement in labour productivity in2010/11 as labour cost growth reduced significantly in the acute sector. However, thiswas not sustained in 2011/12 as output (as measured by cost-weighted activity) fell.
Figure 3.3: Output, input and labour productivity in selected NHSproviders in England – Nuffield Trust measure: 2006/07 to 2011/12
1.30
1.25
1.20
1.15
1.10
1.05
1.00
0.95
0.90
Prod
uctiv
ity in
dex
(200
6/07
= 1
.00)
Output
2006
/07
2007
/08
2008
/09
2009
/10
2010
/11
2011
/12
Input Productivity
The anatomy of health spending 2011/1232
Figure 3.4: Map of the average labour productivity of 110 acute trusts bystrategic health authority in England – Nuffield Trust measure: 2011/12
0.80 – 0.88
0.89 – 0.96
0.97 – 1.04
1.05 – 1.12
Productivityindex measure:
NorthEast
NorthWest
LondonSouth
Central
South West
East Midlands
West MidlandsEast of England
South East Coast
Yorkshire and theHumber

The anatomy of health spending 2011/1233
Figure 3.5 shows how this variation in labour productivity has changed since 2006/07. Fromthis analysis, we can see that the range of labour productivity values covering all providersreduced rapidly between 2006/07 and 2009/10 (from an index that spanned 0.54 to 1.60 toone that only covered 0.76 to 1.28). In particular, between 2007/08 and 2008/09, the worstperforming trusts were brought far closer to the mean labour productivity level. However,this was matched by an equivalent fall in the best performing trusts.
It is also interesting to note that while there was significant variation for the outliers, that is,those outside the 10th and 90th percentiles, the range between these percentiles and the inter-quartile ranges remained consistent throughout the period analysed. This indicates that, whileindividual trusts have been successfully targeted for performance improvement, significantlabour productivity improvements across the entire provider sector remain a challenge.
Figure 3.5: Variation in labour productivity at selected providers inEngland: 2006/07 to 2011/12
1.80
1.60
1.40
1.20
1.00
0.80
0.60
0.40
0.20
0.00Prod
uctiv
ity in
dex
by N
HS
or fo
unda
tion
trus
t
Min–Max
2006
/07
2007
/08
2008
/09
2009
/10
2010
/11
2011
/12
10%–90% Lower–Upper quartile Mean
Factors associated with labour productivity
Having observed differences between trusts in their crude labour productivityperformance, we undertook a time-series regression analysis in order to examine whetherthere were any factors that are associated with difference in labour productivity.(See Appendix 2.)
Labour productivity might be expected to vary according to the characteristics of theprovider such as its size and whether it provides other services such as teaching andresearch. More contentiously, it might also vary according to the external environment inwhich a trust operates. For example, in standard markets, economic theory would suggestthat labour productivity will be higher if organisations are subject to more competition.

The anatomy of health spending 2011/1234
We explored the relationship between measured crude labour productivity of individualtrusts, and a number of factors that relate to the characteristics of the trust and its externalenvironment. The list of factors is not definitive – there are some key gaps such as theavailability and quality of other relevant services, which could influence an acute trust’sactivity: social care, community health services and primary care. For example, a trustmight find it harder to be productive if patients have difficulty accessing appropriatesocial care or community health services to enable them to go home after an operation(so-called ‘bed blocking’). The factors we examined are shown in Table 3.1.
1. www.dh.gov.uk/en/Publicationsandstatistics/Statistics/Performancedataandstatistics/Beds
Table 3.1: Factors tested in the analysis of labour productivity
Factor
Geographic location
Market concentration
Standards of living in thesurrounding area
Market forces factor
Staff mix
Emergency readmissions at 14 days
Day case surgery rates
Outpatient follow-up appointmentsper first appointment
Outpatient did not attend (DNA)appointments
Pre-procedure elective bed-days
Pre-procedure non-elective bed-days
Potential bed-day saving if lengthof stay were reduced
Proportion of full-time equivalentslost to sickness absence
Foundation trust status
Non-clinical activity
Trust capacity
Data used
Dummy variables (1 for trusts located in a strategic healthauthority and 0 otherwise) for each strategic health authority
Herfindahl–Hirschman Index (HHI). The HHI is an indicatorof the amount of market concentration. It measures potentialprovider competition. An HHI score of 10,000 means that allpatients are treated at the same provider. An HHI score of 2,500is equivalent to four providers each sharing patients equally, andis considered a relatively concentrated market. In 2006/07, theaverage HHI score for acute providers was 5,371. The HHI wascalculated using the approach used by Gaynor and others (2010)
Index of Multiple Deprivation
Adjustment made to the national tariff based on variations in theprovision of health care costs relating to the local area, that is,staff, buildings, land and equipment
Medical and dental staff as a proportion of total staff numbers
Better Care, Better Value indicator
Better Care, Better Value indicator
Better Care, Better Value indicator
Better Care, Better Value indicator
Better Care, Better Value indicator
Better Care, Better Value indicator
Better Care, Better Value indicator
Better Care, Better Value indicator
A dummy variable (1 for foundation trusts and 0 for NHS trusts)
Proportion of total spending on education, training and research
Total available beds open overnight1

The anatomy of health spending 2011/1235
These factors were selected as:
• they include all of the Better Care, Better Value indicators relating to providers;1
these measures are purported by the NHS Institute for Innovation and Improvementto identify areas for improvement in efficiency
• factors such as strategic health authority, potential for competition, local livingstandards and the market forces factor should take account of variations due to thegeographic locations of trusts
• variables such as foundation trust status, staff mix measures (through the proportion ofmedical and dental staff ), trust capacity (through beds) and spending on education,training and research describe the underlying characteristics of a trust, which mayimpact on its productivity.
ResultsThe best regression model from our analysis is shown in Table 3.2. This model explained29 per cent of the variation in labour productivity between trusts and over time. This isrelatively low for a model of this type, reflecting the difficulties in identifying factorsexplaining labour productivity within trusts, and meaning that substantial variationremains between trusts once the effects of these factors have been taken into account.
Only those factors appearing in Table 3.1 were statistically significant at the 95 per centconfidence level, that is, there was more than a 95 per cent probability that they had ameasurable association with labour productivity. These factors had a z-statistic that wasgreater than 1.96.
Table 3.2 also shows the coefficient values associated with each factor. These are for therelationship between the factor and our labour productivity index, that is, the modelestimated that foundation trusts are, on average, 5.57 per cent more productive thanNHS trusts. All of the coefficient values shown in the table seem to have a sensible sign,that is, they improve or worsen labour productivity in the way one might expect.
1. www.productivity.nhs.uk
Coefficient
0.0557
2.03 x 10⁻⁵
-0.0846
2.03
-0.931
-6.28 x 10⁻⁵
0.937
Standard error
0.0184
5.35 x 10⁻⁶
0.02
0.309
0.232
2.02 x 10⁻⁵
0.0673
z-statistic
3.03
3.80
-4.22
6.57
-4.02
-3.11
13.92
Table 3.2: Factors with statistically significant associations with acutetrust labour productivity
Labour productivity driver
Foundation trust status
Market concentration
First to follow-up ratio
Medical and dental staff proportion
Education, training and research spend
Trust size
Constant

In summary, these results suggest the following:
• Foundation trust status is associated with higher levels of productivity than NHS trusts.
• Trusts with fewer follow-up appointments for each first outpatient appointment areassociated with higher productivity. No statistically significant impact was found forany of the other Better Care, Better Value indicators.
• Trusts with a higher proportion of medical and dental staff are more likely to havehigher productivity levels, despite the higher labour costs that this shift in staff mixmay imply.
• Trusts that undertake education, training and research are more likely to have lowerproductivity levels than those that do not. Valuing these activities and incorporatingthem into the outputs used would give an improved measure of productivity for future research.
• Trusts situated in areas where there is less competition (indicated by a higher HHIscore) are associated with higher productivity.
• Larger trusts (represented by those with a greater number of beds open overnight)experience diseconomies of scale over and above those simply caused by the higherlikelihood for them to carry out education, training and research.
The anatomy of health spending 2011/1236

The anatomy of health spending 2011/1237
Overall financial position
Since the Department of Health’s financial turnaround programme ended in 2008, theoverall financial position for organisations within the NHS is relatively healthy. However,this overall position masks some important differences within the NHS. Figure 4.1 showsthe level of surplus as the percentage of organisations’ budgets. In particular, in commonwith reports from the Audit Commission (2010; 2011; 2012), our analysis shows that:
• PCTs across the country routinely spend less than their allocation on commissioning and providing health care for their local populations, but the size of this underspend has been falling recently as the tight financial environment starts to impact on the NHS.
• NHS and foundation trusts have a marginally lower level of underspending than PCTs and an increasing minority of providers are in deficit. There is, however,significant variation between providers, with 32 out of 250 NHS or foundation trustsfailing to achieve financial balance in 2011/12, and seven of these having consistentlyreported a deficit for three years or more.
• Strategic health authorities have significantly underspent their budgets – by over 10per cent a year – since 2005/06.
4. Discussion
Figure 4.1: Overall financial position by organisation type: 2005/06to 2011/12
25%
20%
15%
10%
5%
0%
-5%
Und
er/o
vers
pend
as a
prop
ortio
n of
reve
nue r
esou
rce l
imit
(PC
Ts an
d str
ateg
ic h
ealth
auth
oriti
es) o
r sur
plus
/defi
cit b
efor
eim
pairm
ents
as a
prop
ortio
n of
ope
ratin
g inc
ome (
NH
S an
dfo
unda
tion
trus
ts)
Strategic health authorities
2006
/07
2005
/06
2007
/08
2008
/09
2009
/10
2010
/11
2011
/12
PCTs NHS and foundation trusts

The anatomy of health spending 2011/1238
As work by both the Audit Commission (2010) and the National Audit Office (2012)shows, there are a number of risks to the financial health of the NHS. In particular, muchof the saving to date has come from national, not local, initiatives. These include thegovernment’s public sector pay policy: pay awards across the NHS have been limited to£250 for staff earning below £21,000 in 2011 and 2012. All other staff have received nogeneral pay uplift and this is to be followed in 2013 and 2014 with a one per cent cap(HM Treasury, 2011b; NHS Employers, 2012). In addition, there has been a centraldrive to reduce administrative costs. The scope for further management cost savings isrestricted and there will be a limit to pay restraint, particularly as the economy starts togrow and private sector wages begin to increase in real terms.
The Health Select Committee (2012), in its report on public spending, concluded(paragraph 9–10):
The evidence submitted to the committee is therefore unambiguous. The NicholsonChallenge can only be achieved by making fundamental changes to the way care isdelivered. We are concerned, however, that evidence does not suggest that themagnitude of the challenge has been fully grasped. Although it is relatively early days,and there are certainly localised examples of welcome innovation, there is alsodisturbing evidence that the measures currently being used to try to control thefinancial situation could fairly be described as ‘short-term expedients’ or salami slicing.We are not persuaded that the actions currently being planned will allow the situationto be sustainable over the four years of the spending review.
The National Audit Office analysed progress with information for the most recentfinancial year (2011/12). It was similarly concerned about the slow progress on the morefundamental service changes, which it also concluded are a key component of futureefficiency savings.
Types of care: relative growth rates
Spending on the NHS in England has increased considerably in real terms since 2003/04.However, the types of care funded through this spending have shifted over this period,with secondary care growing from 73.5 per cent of total spend to 76.1 per cent.
In particular, community health services have experienced particularly rapid growth inspending since 2006/07. Acute spending continues to increase but spending on primarycare, and in particular GP services, has been falling in recent years. The servicetransformation that the Health Select Committee and the National Audit Office point toas being critical for the future achievement of efficiency saving is dependent on moreappropriate use of hospital services. To achieve this, effective community health servicesare important, but primary care also has a key role to play. An example of this is thevolume of admissions to hospitals for ‘ambulatory care sensitive’ conditions. These areconditions for which appropriate management, through better diagnosis and treatment,could have prevented the admission. Primary care services clearly have an important roleto play in this.

The anatomy of health spending 2011/1239
Achieving QIPP
From 2010/11 we have observed the initial impacts of the government’s Quality,Innovation, Productivity and Prevention (QIPP) programme. This is consistent with the National Audit Office and Health Select Committee’s analysis of the approach toQIPP to date. In particular, there has been a fall in real-terms spending, which is made up of the following changes:
• a reduction in the cost per NHS employee, as the government’s pay policy bites
• a fall in the number of staff employed by the NHS, with the greatest fall being in thenumber of non-clinical staff (managers and administrative staff ).
Labour productivity
Our analysis of the variation in labour productivity by acute NHS trusts has suggestedclear differences in productivity between trusts in the North and the South of England.Figure 4.2 shows that there is also significant variation between trusts in these regions.Regional differences in NHS productivity have also been found by economists at theUniversity of York looking at productivity performance in 2007/08 (Bojke and others,2012b). This work used a measure of productivity that is more consistent with the ONSmeasure: it covers all health care (not just care provided by acute hospitals); it adjusts forquality of care alongside the quantity of care provided; and it includes a wider range ofinputs (capital and intermediate inputs alongside staff ). Despite the different periodsbeing considered and difference in scope of the measure, there are a number of consistentfindings between our work and the University of York study:
• The South West and East of England both have relatively good productivityperformance compared to other regions (for their acute hospitals and across all services).
• The Yorkshire and the Humber region performs relatively poorly compared to other regions.
Beyond this, our work has a sharper north/south divide, with regions in the North havingapparent lower productivity relative to England as a whole and regions in the Southhaving higher productivity. The position of northern regions is sensitive to how inputs aremeasured. The University of York study found that if the measure was adjusted for themarket forces factor (accounting for estimates of the relative cost of staff in different partsof the country), the productivity performance of the South improved relative to Englandas a whole and some of the northern regions’ position fell correspondingly (the NorthEast and the West Midlands). Our measure of labour productivity adjusted for themarket forces factor in a similar manner. The other main difference between the findingsof the two studies is the position of London. In our analysis, London acute hospitalsappeared to have labour productivity levels below the national average. In the York study,London’s productivity was above average. The study found that quality adjustment hadthe greatest impact on the measure of health output in London. Our measure did notadjust for quality and this may account for at least some difference between the twostudies. It also reinforces the concerns expressed by Black (2012) and others regarding the sensitivity of productivity measures to both the range of quality adjustmentsconsidered and the weight given to differences in quality compared to differences in the quantity of care provided.

The anatomy of health spending 2011/1240
Thus, when considering how best to achieve gains in labour productivity, providers andcommissioners need to take account of both regional differences and how this labourproductivity varies within a given region.
At a national level, previous analysis has found that NHS productivity improved slightlybetween 2003/04 and 2009/10, with an annual average increase of 0.1 per cent a year(Bojke and others, 2012a). This study included non-hospital services and measured thechange in services as a combination of changes in the volume of activity and the quality of care.
Our analysis of labour productivity presents a less optimistic view of the efforts toimprove efficiency than the headline figure of £2.85 billion QIPP savings from acuteservices in 2011/12 would imply (National Audit Office, 2012). Our analysis suggeststhat the NHS is struggling to translate headline savings into productivity improvements.There are some real caveats to this tentative conclusion – spending on community healthservices is growing, but we have no information on the impact of this on overall levels ofhealth care activity, quality or productivity. Furthermore, our measure of acute labour
Figure 4.2: Variation in labour productivity by region: 2011/12East
of Engla
ndSou
th C
entra
lSou
th East
Coa
stSou
th W
est
London
West
Midlan
dsEast
Midlan
dsNor
th W
estNor
th East
Yorksh
ire an
d the H
umber
1.50
1.40
1.30
1.20
1.10
1.00
0.90
0.80
0.70
0.60
0.50
Prod
uctiv
ity in
dex
Although there are differences in labour productivity between NHS regions, Figure 4.2shows that there is also substantial variation between NHS trusts within a region.
Quartile range Median MeanRange

The anatomy of health spending 2011/1241
productivity does not capture improvements in the quality of hospital care, or whetherthe care that hospitals are providing is now more appropriate, with more patients beingtreated in the right setting, at the right time. It is also interesting to note that this researchfinds some evidence of diseconomies of scale, questioning whether merging providersinto larger trusts will improve financial performance.
Our regression modelling finds that observable differences in the characteristics ofproviders and the area they work in explain comparatively little of the variation in labourproductivity. In contrast with other sectors we do not find that providers that aresubjected to more competitive pressures (as measured by the HHI of marketconcentration) have higher labour productivity. Neither do we find that differences in the deprivation levels of the local population served by the hospital influence its relativelabour productivity. The factor with the greatest association is the proportion of theworkforce who are medically qualified. Our results suggest that a richer skill mix isassociated with improved labour productivity.
Conclusion
In the first year of broadly flat real-terms NHS funding, the NHS has managed to livewithin its means and is delivering headline savings. This is encouraging. But below thisheadline the financial data from the NHS show a more complex picture. On the positiveside, PCTs appear to have been investing in community health services, which will beimportant if they are to realise their QIPP objective to shift more care out of hospitals.
However, the financial data also raise concerns and questions. A number of NHS andfoundation trusts look weak financially, and several have limited scope to resolve theirfinancial difficulties, given their high spending on the financing costs of their PFI schemes– although across the NHS as a whole, the costs of financing for PFI schemes are a verysmall part of NHS spending (less than one per cent). More generally, the much morerapid growth in acute care spending relative to primary care raises questions aboutwhether the NHS has the right balance of services for the future.

The anatomy of health spending 2011/1242
The following trusts were included in the productivity analysis as we had complete datafor them between 2006/07 and 2011/12, and they are not specialist trusts:
Aintree University Hospitals NHS Foundation TrustAiredale NHS Foundation TrustAshford and St Peter’s Hospitals NHS Foundation TrustBarking, Havering and Redbridge University Hospitals NHS TrustBarnet and Chase Farm Hospitals NHS TrustBarnsley District General Hospital NHS Foundation TrustBasildon and Thurrock University Hospitals NHS Foundation TrustBasingstoke and North Hampshire Hospitals NHS Foundation TrustBedford Hospital NHS TrustBirmingham Heartlands and Solihull TrustBradford Teaching Hospitals NHS Foundation TrustBrighton and Sussex University Hospitals NHS TrustBurton Hospitals NHS Foundation TrustCalderdale and Huddersfield NHS Foundation TrustCambridge University Hospitals NHS Foundation TrustChelsea and Westminster Hospital NHS Foundation TrustChesterfield Royal Hospital NHS Foundation TrustCity Hospitals Sunderland NHS Foundation TrustColchester Hospital University NHS Foundation TrustCountess of Chester Hospital NHS Foundation TrustDartford and Gravesham NHS TrustDerby Hospitals NHS Foundation TrustDorset County Hospital NHS Foundation TrustEast and North Hertfordshire NHS TrustEast Cheshire NHS TrustEast Kent Hospitals University NHS Foundation TrustEast Lancashire Hospitals NHS TrustEast Sussex Hospitals NHS TrustEpsom and St Helier University Hospitals NHS TrustFrimley Park Hospital NHS TrustGateshead Health NHS Foundation Trust
Appendix 1: NHS andfoundation trusts included in theproductivity analysis

The anatomy of health spending 2011/1243
George Eliot Hospital NHS TrustGloucestershire Hospitals NHS Foundation TrustHarrogate and District NHS Foundation TrustHeatherwood and Wexham Park Hospitals NHS Foundation TrustHinchingbrooke Healthcare NHS TrustHull and East Yorkshire Hospitals NHS TrustIpswich Hospital NHS TrustJames Paget University Hospitals NHS Foundation TrustKettering General Hospital NHS Foundation TrustKing’s College Hospital NHS Foundation TrustKingston Hospital NHS TrustLancashire Teaching Hospitals NHS TrustLeeds Teaching Hospitals NHS TrustLuton and Dunstable Hospital NHS Foundation TrustMaidstone and Tunbridge Wells NHS TrustMedway NHS TrustMid Essex Hospital Services NHS TrustMid Staffordshire NHS Foundation TrustNewham University Hospital NHS TrustNorfolk and Norwich University Hospitals NHS Foundation TrustNorth Cumbria University Hospitals NHS TrustNorth Middlesex University Hospital NHS TrustNorth Tees and Hartlepool NHS Foundation TrustNorthampton General Hospital NHS TrustNorthern Devon Healthcare NHS TrustNottingham University Hospitals NHS TrustOxford Radcliffe Hospital NHS TrustPennine Acute Hospitals NHS TrustPeterborough and Stamford Hospitals NHS Foundation TrustPlymouth Hospitals NHS TrustPoole Hospital NHS Foundation TrustPortsmouth Hospitals NHS TrustPrincess Alexandra Hospital NHS TrustQueen Elizabeth Hospital King’s Lynn NHS Foundation TrustRoyal Berkshire Hospital NHS Foundation TrustRoyal Bournemouth and Christchurch TrustRoyal Cornwall Hospitals NHS TrustRoyal Devon and Exeter NHS Foundation TrustRoyal Free Hampstead NHS TrustRoyal Liverpool Broadgreen Hospitals NHS TrustRoyal Surrey County NHS Foundation Trust

The anatomy of health spending 2011/1244
Royal United Hospital Bath NHS TrustSalisbury NHS Foundation TrustScarborough and North East Yorkshire NHS TrustSheffield Teaching Hospitals NHS Foundation TrustSherwood Forest Hospitals NHS Foundation TrustShrewsbury and Telford Hospital NHS TrustSouth Devon Health Care NHS TrustSouthampton University Hospitals NHS TrustSouthend University Hospitals NHS Foundation TrustSouthport and Ormskirk Hospital NHS TrustSt Helens and Knowsley Hospitals NHS TrustSurrey and Sussex Healthcare NHS TrustTameside Hospital NHS Foundation TrustTaunton and Somerset NHS Foundation TrustThe Dudley Group of Hospitals NHS Foundation TrustThe Hillingdon Hospital NHS TrustThe Mid Cheshire Hospitals NHS TrustThe Rotherham NHS Foundation TrustUnited Lincolnshire Hospitals NHS TrustUniversity College London Hospitals NHS Foundation TrustUniversity Hospital Birmingham NHS Foundation TrustUniversity Hospital of North Staffordshire Hospital NHS TrustUniversity Hospital of South Manchester NHS Foundation TrustUniversity Hospitals Coventry and Warwickshire NHS TrustUniversity Hospitals of Bristol NHS Foundation TrustUniversity Hospitals of Leicester NHS TrustUniversity Hospitals of Morecambe Bay NHS Foundation TrustWarrington and Halton Hospitals NHS Foundation TrustWest Hertfordshire Hospitals NHS TrustWest Middlesex University NHS TrustWest Suffolk Hospital NHS TrustWeston Area Health NHS TrustWhipps Cross University Hospital NHS TrustWirral University Teaching Hospital NHS Foundation TrustWorcestershire Acute Hospitals NHS TrustWrightington, Wigan and Leigh NHS Foundation TrustYeovil District Hospital NHS Foundation TrustYork Hospitals NHS Trust

The anatomy of health spending 2011/1245
Cross-sectional time-series regression analysis was used to estimate the impact of ourpotential drivers of labour productivity, while taking into account the inherentrelationships between productivity from one year to the next. We chose to estimate arandom effects model; that is, a model that assumes hospital-specific time-invarianteffects are random. The formulation of our random effects model is as follows:
Yit = a0 + 𝛽Xit + ai + 𝜀it
Yit Productivity index for hospital i in year t.
𝛽 Coefficients of our productivity drivers, that is, the relationship between these and productivity.
Xit Each of the productivity drivers (as shown above) for hospital i in year t.
a0 The y-axis intercept across all trusts.
ai Hospital-specific time-invariant effects. These are assumed to be normally distributed.
𝜀it Error terms for each hospital in each time period. These are also assumed to be normally distributed and uncorrelated with the time-invariant effects.
This model used our time-series dataset, which included annual data for potential productivity drivers where these were available and single-year values otherwise. Average values are shown in Table A2.1.
Appendix 2: Productivityregression analysis
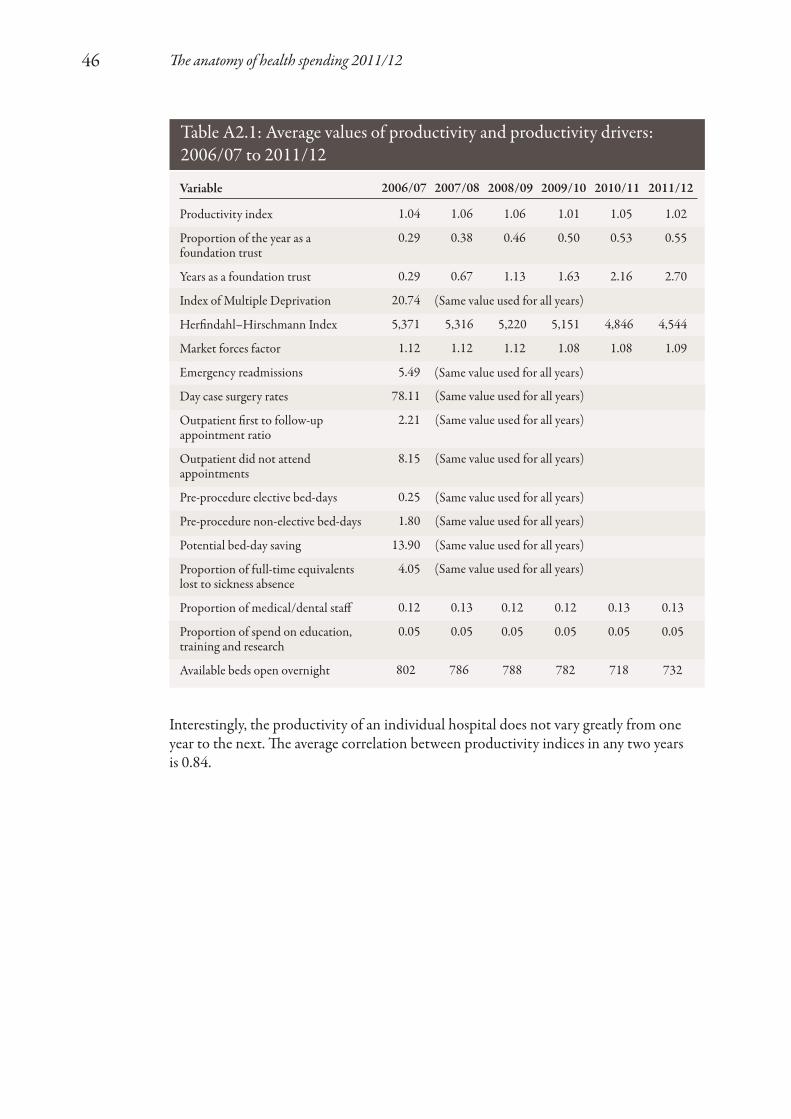
The anatomy of health spending 2011/1246
2006/07
1.04
0.29
0.29
20.74
5,371
1.12
5.49
78.11
2.21
8.15
0.25
1.80
13.90
4.05
0.12
0.05
802
2007/08
1.06
0.38
0.67
5,316
1.12
0.13
0.05
786
2008/09
1.06
0.46
1.13
5,220
1.12
0.12
0.05
788
2009/10
1.01
0.50
1.63
5,151
1.08
0.12
0.05
782
2010/11
1.05
0.53
2.16
4,846
1.08
0.13
0.05
718
2011/12
1.02
0.55
2.70
4,544
1.09
0.13
0.05
732
Table A2.1: Average values of productivity and productivity drivers: 2006/07 to 2011/12
Variable
Productivity index
Proportion of the year as afoundation trust
Years as a foundation trust
Index of Multiple Deprivation
Herfindahl–Hirschmann Index
Market forces factor
Emergency readmissions
Day case surgery rates
Outpatient first to follow-upappointment ratio
Outpatient did not attendappointments
Pre-procedure elective bed-days
Pre-procedure non-elective bed-days
Potential bed-day saving
Proportion of full-time equivalentslost to sickness absence
Proportion of medical/dental staff
Proportion of spend on education,training and research
Available beds open overnight
(Same value used for all years)
(Same value used for all years)
(Same value used for all years)
(Same value used for all years)
(Same value used for all years)
(Same value used for all years)
(Same value used for all years)
(Same value used for all years)
(Same value used for all years)
Interestingly, the productivity of an individual hospital does not vary greatly from oneyear to the next. The average correlation between productivity indices in any two years is 0.84.

The anatomy of health spending 2011/1247
ReferencesAppleby J, Ham C, Imison C and Jennings M(2010) Improving NHS Productivity: More with thesame not more of the same. The King’s Fund.
Audit Commission (2010) More for Less: NHSfinancial year 2009/10. Audit Commission.
Audit Commission (2011) NHS financial year2010/11. Audit Commission.
Audit Commission (2012) NHS financial year2011/12. Audit Commission.
Black N (2012) ‘Declining health-care productivityin England: the making of a myth’, The Lancet379(9821), 1167–9.
Bojke C, Castelli A, Goudie R, Street A and Ward P (2012a) Productivity of the English NHS2003/4 to 2009/10. CHE Research Paper no. 76.Centre for Health Economics, University of York.
Bojke C, Castelli A, Street A, Ward P andLaudicella M (2012b) ‘Regional variation in theproductivity of the English National HealthService’, Health Economics, DOI: 0.1002/hec.2794.
Charlesworth A (2012) What the Budget Means for the NHS: A bit less now, a lot less later?Nuffield Trust.
Department of Health (2009) NHS Reference Costs2007/08. Department of Health.
Department of Health (2010a) Payment by ResultsGuidance for 2010–11. Department of Health.
Department of Health (2010b) 2010-11 TariffInformation Spreadsheet. Department of Health.
Department of Health (2012a) QIPP.www.dh.gov.uk/health/category/policy-areas/nhs/quality/qipp/ . Accessed 14 November.
Department of Health (2012b) Department ofHealth: Annual report and accounts 2011/12.Department of Health.
Department of Health (2013) Additional EvidenceProvided to the Health Committee. January.Department of Health.
Dixon J, Smith P, Gravelle H, Martin S, Bardsley M, Rice N, Georghiou T, Dusheiko M,Billings J, De Lorenzo M and Sanderson C (2011)‘A person based formula for allocatingcommissioning funds to general practices inEngland: development of a statistical model’, British Medical Journal 343, d6608.
Francis R (2013) Report of the Mid StaffordshireNHS Foundation Trust Public Inquiry. The Stationery Office.
Gaynor M, Laudicella M and Propper C (2012)Can Governments do it Better? Merger mania andhospital outcomes in the English NHS. WorkingPaper no. 12/281. Centre for Market and PublicOrganisation, University of Bristol.
Gaynor M, Moreno-Serra R and Propper C (2010)Death by Market Power: Reform, competition andpatient outcomes in the National Health Service.Working Paper no. 10/242. Centre for Market andPublic Organisation, University of Bristol.
Grice J (2012) ‘The “myth” of declining health-care productivity in England’, The Lancet380(9837), 109.
Hardie M, Cheers J, Pinder C and Qaiser U (2011) Public Service Output, Inputs andProductivity: Healthcare. Office for NationalStatistics.
Harker R (2012) NHS Funding and Expenditure.Social and General Statistics, House of CommonsLibrary.
Health Select Committee (2012) PublicExpenditure:Thirteenth report of session 2010–12.The Stationery Office.
Health and Social Care Information Centre(2012a) Investment in General Practice 2007/08 to2011/12: England, Wales, Northern Ireland andScotland. Health and Social Care InformationCentre.
Health and Social Care Information Centre(2012b) Prescriptions Dispensed in the Community:England, statistics for 2001 to 2011. Health andSocial Care Information Centre.
Health and Social Care Information Centre(2012c) GP Earnings and Expenses Time Series. Health and Social Care Information Centre.
HM Treasury (2011a) Budget 2011. HC836. TheStationery Office.
HM Treasury (2011b) Autumn Statement 2011.Cm 8231. The Stationery Office.
Massey F (2012) Public Service ProductivityEstimates: Healthcare, 2010. Office for NationalStatistics.

The anatomy of health spending 2011/1248
Monitor (2012) NHS Foundation Trusts:Consolidated accounts 2011/12. HC412. The Stationery Office.
National Audit Office (2012) Progress in MakingNHS Efficiency Savings. Report by the Comptrollerand Auditor General, HC 686, Session 2012–13.The Stationery Office.
NHS Employers (2012) The NHS EmployersOrganisation Submission to the NHS Pay ReviewBody: 2013/14. NHS Employers.www.nhsemployers.org/SiteCollectionDocuments/NHSPRB%20Evidence%2022Oct%20FINAL.pdfAccessed 14 November.
Nuffield Trust (2010) NHS Resources and Reform.Nuffield Trust.
Organisation for Economic Co-operation andDevelopment (2012) OECD Factbook 2011:Economic, environmental and social statistics.Organisation for Economic Co-operation andDevelopment.
Peñaloza M-C, Hardie M, Wild R and Mills K(2010) Public Service Output, Inputs and Productivity:Healthcare. Office for National Statistics.
Public Expenditure Statistical Analyses (2012)Public Spending Statistics: October 2012 update.HM Treasury.
Roberts A, Marshall L and Charlesworth A (2012) A Decade of Austerity: The funding pressures facing the NHS from 2011/12 to 2021/22.Nuffield Trust.

The anatomy of health spending 2011/1249
Capital expenditure Spending on assets considered to have a lifetime of at least one year, for example, property, plant and equipment
DEL Departmental Expenditure Limit – the annual spending limit set by the Treasury for firm spending plans as part of a spending review covering more than one year. Includes separate revenue/resource and capital expenditure limits
GDP Gross domestic product
GP General practitioner
HHI Herfindahl–Hirschman Index (a measure of market concentration)
Impairment Revaluation of fixed assets
Market forces factor An adjustment made to the national tariff (the set price paid to hospitals for patients seen or treated) based on variations in the provision of health care costs relating to the local area, that is, staff, buildings, land and equipment
Monitor Independent regulator of NHS foundation trusts
MPET Multi-Professional Education and Training
NHS National Health Service
OECD Organisation for Economic Co-operation and Development
ONS Office for National Statistics
Over/underspend Primary care trusts and strategic health authorities have individual annual revenue and capital resource limits. These organisations are required to underspend against these limits
PbR Payment by Results – the payment system under which commissioners pay health care providers for each patient seen or treated
PCT Primary care trust
PFI Private Finance Initiative
QIPP Quality, Innovation, Productivity and Prevention
Glossary of terms andabbreviations

The anatomy of health spending 2011/1250
Real terms/cash The purchasing power of money changes over time. When comparing financial data over time they are expressed in ‘real’ terms, taking inflation into account, rather than using the nominal cash amount. This allows like-for-like comparison over time. We used the HM Treasury GDP deflators as at 28 November 2012
Revenue/resource Spending on day-to-day operating or running costsexpenditure
Surplus/deficit NHS and foundation trusts do not have a revenue spending limit.Financial performance in these organisations is measured as eithera surplus or a deficit of income against expenditure
UK United Kingdom
WTE Whole-time equivalent – the whole-time equivalent for each part-time staff member is calculated as the number of contracted hours worked divided by the standard number of hours for the role undertaken, for example, a person who is contracted for 18.5 hours while the standard for the role is 37 hours is 0.5 WTE.

The anatomy of health spending 2011/1251
Nick M. Jones
Nick is a member of PwC’s Insight and Analytics team. He specialises in building models to help organisations make robust decisions and to aid long-term planning. He has particular expertise in the transport and health sectors. From July 2012 toFebruary 2013 he was seconded to the Economics team at the Nuffield Trust, where he undertook data analysis and modelling for this report.
Prior to joining PwC, Nick was a Senior Consultant in the Transactions and Strategybusiness unit at a global transport consultancy firm, specialising in operations research.
Anita Charlesworth
Anita leads the Nuffield Trust’s work on health care financing and market mechanisms.Before joining the Trust as Chief Economist in September 2010, she was Chief Analystand Chief Scientific Adviser at the Department for Culture, Media and Sport.
Previously, Anita was Director of Public Spending at the Treasury, where she led the teamworking with Sir Derek Wanless on his reform for NHS funding in 2002. She has alsoworked as an Economic Adviser in the Department of Health and for SmithKlineBeecham pharmaceuticals in the UK and USA.
Anita is also a non-executive director of Whittington Health and a trustee of Tommy’sthe baby charity.
About the authors
This report is the first in a series of annual publications and other activities from theNuffield Trust that will examine the financial performance of the NHS in England overthe coming years. The programme NHS Spending: Monitoring financial performance andproductivity is supported by PwC and McKesson. Background information on oursupporters is detailed below.
McKesson
McKesson UK has a proud history of working in partnership with the NHS, localauthorities and other leading providers in order to transform health and social care in the UK. McKesson’s information technology and business solutions change the wayorganisations operate, communicate and collaborate to deliver better-integrated care and improve the quality and safety of their services. McKesson also operates the NHSElectronic Staff Record (ESR) – the largest integrated HR and payroll system in theworld, serving 1.5 million NHS employees and providing a range of tools to NHSemployers. McKesson’s further workforce solutions aim to accelerate efficiency andemployee engagement in support of the delivery of higher-quality, cost-effective care.
PwC
PwC provides assurance, tax and advisory services to the public sector, including aspecialist practice in health care. In 2013, PwC is working with people across the healthservice and the public to debate what the NHS will – and should – look like in 10 years’time. For more information, please see www.pwc.co.uk/nhs75.
About our supporters
The anatomy of health spending 2011/1252


For more information about the Nuffield Trust,including details of our latest research and analysis,please visit www.nuffieldtrust.org.uk
Download further copies of this research reportfrom www.nuffieldtrust.org.uk/publications
Subscribe to our newsletter:www.nuffieldtrust.org.uk/newsletter
Follow us on Twitter: Twitter.com/NuffieldTrust
Nuffield Trust is an authoritativeand independent source ofevidence-based research andpolicy analysis for improvinghealth care in the UK
59 New Cavendish StreetLondon W1G 7LPTelephone: 020 7631 8450Facsimile: 020 7631 8451Email: [email protected]
www.nuffieldtrust.org.uk
Published by the Nuffield Trust.© Nuffield Trust 2013. Not to be reproduced without permission.
ISBN: 978-1-905030-61-3