The Analysis of the Cutting Forces and Surface Layer ... · stereometry during grinding without...
16
Mechanics and Mechanical Engineering Vol. 20, No. 1 (2016) 43–57 c ⃝ Lodz University of Technology The Analysis of the Cutting Forces and Surface Layer Stereometry in the Grinding Process of Abrasion–Resisting Materials Ryszard W´ ojcik Anna Grdulska Rados law Rosik Przemys law Wejman Institute of Machine Tools and Production Engineering Lodz University of Technology Stefanowskiego 1/15, L´ od´ z, Poland [email protected] [email protected] [email protected] [email protected] Received (20 January 2016) Revised (26 January 2016) Accepted (11 February 2016) The article presents the investigation of the grinding process of flat samples made of materials that meet requirements of the lowest abrasibility, which belong to difficult to machine materials. Research enclosed measurement of cutting forces and surface layer stereometry during grinding without using cutting fluid. The tests were carried out with the aid of new generation grinding wheel, Quantum. Keywords : Quantum, wear, XAR 400, Brinar 400, Dillidur 500V, grinding. 1. Introduction There is a big variety of the materials used in surface mining. They can be charac- terized by diversified utility properties or abrasive wear, the proper level of safety as well as and environment protection [2, 7]. Among the most important aspects that have a decisive influence should be replaced strength and tensile resistance at extreme temperatures [2, 7]. They must ensure the trouble-free plastic working both cold and hot working, bearing in mind mechanical processing [1, 10]. The process of surface layer shaping has a vital importance on the final work results of steels used in those areas of the economy [4, 7]. In processes involving grinding important issue is the use of cutting fluids, which are designed to reduce friction, and thus the temperature of the process [2, 3, 7]. The parameters describing the wear resistance of the material are hardness of
Transcript of The Analysis of the Cutting Forces and Surface Layer ... · stereometry during grinding without...

Mechanics and Mechanical Engineering
Vol. 20, No. 1 (2016) 43–57c⃝ Lodz University of Technology
The Analysis of the Cutting Forces and Surface Layer Stereometryin the Grinding Process of Abrasion–Resisting Materials
Ryszard WojcikAnna GrdulskaRados law Rosik
Przemys law Wejman
Institute of Machine Tools and Production EngineeringLodz University of Technology
Stefanowskiego 1/15, Lodz, [email protected]
[email protected]@p.lodz.pl
Received (20 January 2016)
Revised (26 January 2016)
Accepted (11 February 2016)
The article presents the investigation of the grinding process of flat samples made ofmaterials that meet requirements of the lowest abrasibility, which belong to difficult tomachine materials. Research enclosed measurement of cutting forces and surface layerstereometry during grinding without using cutting fluid. The tests were carried out withthe aid of new generation grinding wheel, Quantum.
Keywords: Quantum, wear, XAR 400, Brinar 400, Dillidur 500V, grinding.
1. Introduction
There is a big variety of the materials used in surface mining. They can be charac-terized by diversified utility properties or abrasive wear, the proper level of safetyas well as and environment protection [2, 7]. Among the most important aspectsthat have a decisive influence should be replaced strength and tensile resistanceat extreme temperatures [2, 7]. They must ensure the trouble-free plastic workingboth cold and hot working, bearing in mind mechanical processing [1, 10].
The process of surface layer shaping has a vital importance on the final workresults of steels used in those areas of the economy [4, 7]. In processes involvinggrinding important issue is the use of cutting fluids, which are designed to reducefriction, and thus the temperature of the process [2, 3, 7].
The parameters describing the wear resistance of the material are hardness of
44 Wojcik, R., Grdulska, A., Rosik, R. and Wejman, P.
abrasive material To (HV) and the hardness of the grinded material Tm (HV).Where the relative durability Tw [9, 10] is described by the formula
Tw = To − Tm (1)
Wear resistance of the actual conditions depends on several factors:
- Forces which influence on the surface of the material.
- The speed and the size of the particles acting on the surface material.
- The direction of the surface of the material.
- The percentage of the individual components forming the abrasive environ-ment.
In most industrial applications of these factors combined with each other theycompose a combination leading to different levels of resistance. In some cases, toachieve high strength in combination with wear resistance requires a martensiticstructure. On the other hand getting strength, hardness and toughness requiresa phase structure: bainite, ferrite, pearlite coagulated. Because of this there arerequired technologies to provide high utility value and quality. Fig. 1 presentsan exemplary construction of the abrasive material which is a mixture of differentabrasive materials with different hardness and with proper percentage participation.
Material 2nd
type
Material 1st type
Material 3rd
type
Binder
Figure 1 Structure of abrasive affecting the abrasion–resisting materials
It means that in case of the parameter To is equal to the sum of the percentage prod-ucts of the individual solid components of material that compose in the structureof the grinded material.
Equivalent hardness of the abrasive material equals:
To = (%)1 · T1 + (%)2 · T2 + (%)3 · T3 (2)
where:
(%)1,2,3 – the percentage of the individual components of abrasive material,
T1,2,3 – hardness of each materials.
Destruction of abrasive materials is caused by many factors, both mechanical,strength or chemical. In Fig. 2 they have been taken into account [5, 8, 10].

The Analysis of the Cutting Forces and Surface Layer ... 45
Figure 2 Factors causing wear of the grinded materials [9, 10]
The processes of wear materials may be caused by the deformation, induced by thecutting process, described as D – type 1 (Fig. 3a) and D – type 2, associated withthe processes of plastic flow (Fig. 3b).
In turn, the relative vitality Zw is a parameter that defines resistance of thematerial on the surface deformation. They are associated with the impact of theabrasive material on the surface layer (SL). Relative vitality involves the relationbetween the different types of deformations.
Figure 3 Types of surface deformation of the material during abrasion: a) D – type 1,b) D – type 2
Each of the presented deformation shortens the life of the relative area. In fact,it takes into account the resistance to: tangential friction, striking abrasion andabrasion caused by the compression. Tab. 1 summarizes the abrasive processeswith the appropriate numerical coefficients and an indication of their level.
Thus, depending on the composition of abrasive material and the percentagesof the various fractions, the course and form will be different. As an example ispresented percentages of ingredients typical abrasive materials that are found indifferent natural conditions occurring in surface mining:

46 Wojcik, R., Grdulska, A., Rosik, R. and Wejman, P.
Table 1 Abrasion Resistance [9, 10]
Tangential fric-tion
Percussiveabrasion,
Abrasion causedby compression
Type abrasionresistance
Tw >1,8(D – typ 1)
Tw >1,2(D – typ 1)
Tw >1(D – typ 1)
Low
1,8>Tw >1,5(D – typ 1 i 2)
1,2>Tw >0,8(D – typ 1 i 2)
Tw ∼1(D – typ 1 i 2)
Medium
Tw <1,5(D – typ 2)
Tw <0,8(D – typ 2)
Tw <1(D – typ 2)
High
Sand – quartz 50% - 98%
Apatite – 61% quartz, 11% alumina, limestone 6%
Basalt – 40% quartz, alumina 11%, limestone 14%
Tab. 2 shows the average hardness [HV], the selected materials only.
Table 2 Materials hardness [9, 10]
Material The average hardness [HV]Fluorite 150Apatite 360Quartz 1070Corundum 1860
Among the many wear resistant materials used in the industry was selected:XAR 400 Brinar 400 Dillidur 500V. Tab. 3 presents the chemical composition ofthe particular steels that tests have been carried out.
2. Preparation for testing
The process of surface grinding were carried out on a grinding machine SPD -30b, by means of the grinding wheel 01 350x32x127 2NQ 60J VS3, and withoutusing cutting fluid. The research was carried out with the following parameters:vw = 0.2 m / s, vs = 25 m / s, ae1 = 0.01 mm and ae2 = 0.02 mm. Duringthe investigations the following samples materials were used XAR 400, Brinar 400and Dillidur 500V, uncase-hardened due to carbon content of about 0.3%. Thedimensions of samples: 10x30x100 mm. Single–pass grinding process was employedto determine the course of force components for certain allowances. During thetests grinding force components: tangential Ft and normal Fn were measured byusing dynamometer Kistler type 5019. The signal from dynamometer was sent to anamplifier type 5011, then into a data acquisition module type kusb–3108 Keithley(USA) and finally processed by means of software quick DAQ.

The Analysis of the Cutting Forces and Surface Layer ... 47
Table 3 The chemical composition of tested steels [7, 9, 10]
Steel nameChemical composition %C Si Mn P S Cr Mo Ni B
XAR 400 0,2 0,8 1,5 0,02 0,02 1,0 0,5 - 0,01Brinar 400 0,18 0,3 1,5 0,01 0,00 1,4 0,6 - -Dillidur500V
0,3 0,3 1,8 0,03 0,01 1,5 0,5 1,0 0,01
Table 4 Mechanical properties of tested steels [9, 10]
Steel Name Steel No Re
[MPa]Rm
[MPa]A% HB
XAR 400 1.8714 1050 1250 12 360-440Brinar 400 1.8715 1100 1300 12 340-440Dillidur 500V 1.8721 1300 1650 8 450-530
3. Results of study
Fig. 4 is presenting the test results obtained by grinding steels Brinar 400 (Fig. 4a),Dillidur 500V (Fig. 4b) and XAR 400 (Fig. 4.c). Parameters of the grindingprocess were given before, allowance ae = 0.02 mm. For the first two materials thestability of the grinding process wasn’t reached. At the entrance into the materialforce components increased, in the central part of the length of the sample forcesreduced. The highest values of the force components were achieved for the materialXAR 400 (Fig. 4c).
Fig. 5 collates data from plunge grinding processes of three steels, a depth ofcut ae = 0.01 mm, other parameters the same as in the previous tests.
For all tested materials obtained much lower grinding force components – adecrease approximately 50% for the depth ae = 0.01 mm. Values of force compo-nents during concurrent and backward grinding of the surfaces are shown in Fig. 5:a) Brinar 400, b) Dillidur 500V, c) XAR 400. Higher values of force componentswere obtained for the material Brinar 400. For all workpiece materials maximumforce level achieved in the middle of the sample.
4. Surface roughness measurement
To measure the surface topography profilograph Hommel Hercules Werkzeughan-del model TurboWaveline60 was used. Measuring position is shown in Fig. 6.Profilograph TurboWaveline60 with dedicated software enables the measurementroughness and waviness of the samples. By using a special software Hommel Mapbased on a given number of passes of the measuring needle is created a spatialtopographic map of the tested surface in 3D system.

48 Wojcik, R., Grdulska, A., Rosik, R. and Wejman, P.
Figure 4 Force components surface grinding, while single–pass grinding backward: a) Brinar 400,b) Dillidur 500V, c) XAR 400
Table 5 The mean value of the force component
Steel Name The mean value of theforce component Fn
The mean value of theforce component Ft
XAR 400 120 N 80 NBrinar 400 154 N 80 NDillidur 500V 120 N 76 N

The Analysis of the Cutting Forces and Surface Layer ... 49
Figure 5 Values of force components during concurrent (1) and backward (2) grinding flat surfaces:a) Brinar 400, b) Dillidur 500V, c) XAR 400
5. Results of surface layer stereometry
Tab. 6 shows the values of the SGP parameters of the grinded samples surfacelayer made of abrasion–resisting materials. They enclose selected parameters of thegeometrical surface structure: amplitude, surface and volumetric, spatial, hybridand functional.
Data presented in Fig. 7 shows that depending on the type of grinded materialthe distribution of the material at the height of the profile (distribution functionADF) and the shape of spatial curve the participation of the material are changing.Grinding Dillidur 500V (Fig. 7b) causes that much more material accumulateswithin the hills or over the line average, which may indicate the deformation of theprofile.

50 Wojcik, R., Grdulska, A., Rosik, R. and Wejman, P.
Figure 6 Measuring position- Profilograph TurboWaveline60
Table 6 Parameters of the geometrical surface structure
Parameter sign SurfaceMaterials
Binnar 400 Dillidur 500V Xar 400Amplitude parameters
Sa 0,184 µm 0,206 µm 0,185 µmSq 0,234 µm 0,289 µm 0,243 µmSp 1,170 µm 4,810 µm 3,350 µmSv 1,16 µm 1,33 µm 2,09 µmSt 2,33 µm 6,13 µm 5,44 µmSsk 0,0294 1,73 -0,0478Sku 3,56 26,5 5,73Sz 1,94 µm 4,68 µm 3,61 µm
Spacial parametersSds 25,6 pks/mm2 28 pks/mm2 28,6 pks/mm2
Str 0,0229 0,0182 0,0082Sal 2,68x10⁻⁵mm 2,13x10⁻⁵mm 9,62x10⁻⁶mm
Hybrid parametersSdq 0,039 µm/µm 0,0512
µm/µm0,0585µm/µm
Ssc 0,0165 1/µm 0,0242 1/µm 0,0244 1/µmSdr 0,0765% 0.129% 0.141
Functional parameters [mm3/mm2]Vmp 0,000157 0,000178 0,000246Vmc 0,000838 0,000952 0,000149Vvc 0,000274 0,000289 0,000267Vvv 2,74x10⁻⁵ 3,43x10⁻⁵ 3,25x10⁻⁵
The Analysis of the Cutting Forces and Surface Layer ... 51
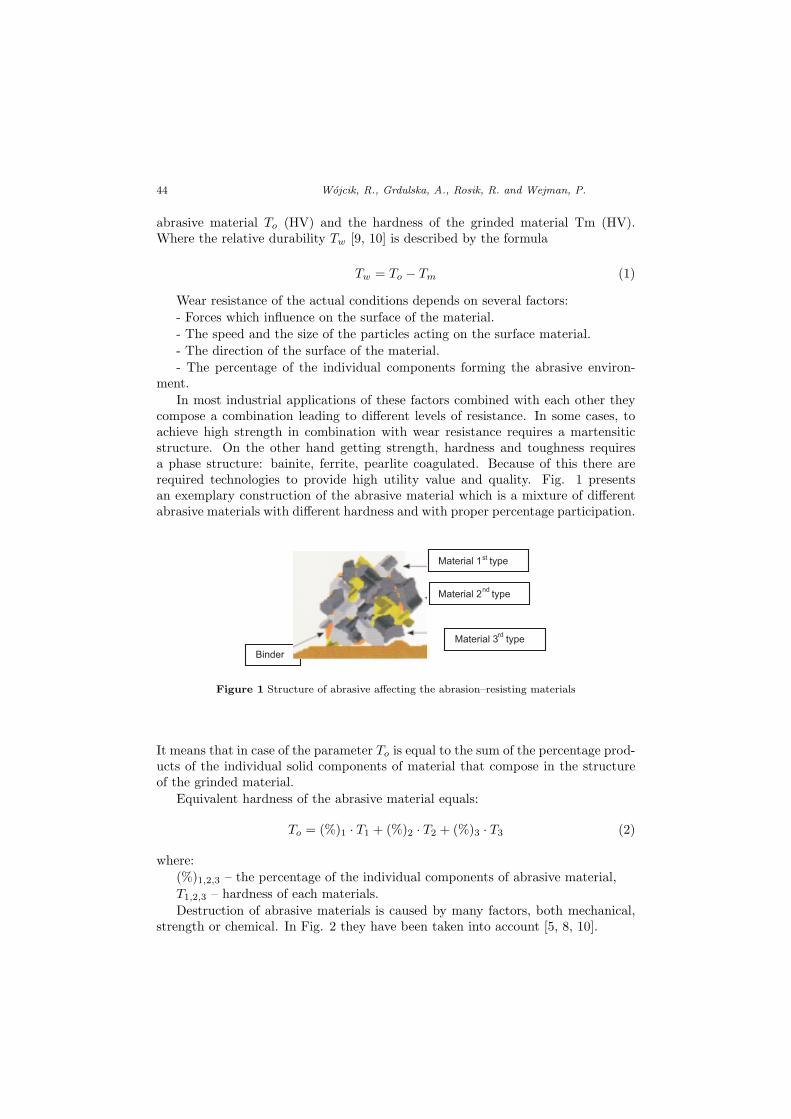
Figure 7 The value of the surface skewness Ssk: 1 – Brinnar 400, 2 – Dillidur 500V, 3 – Xar 400
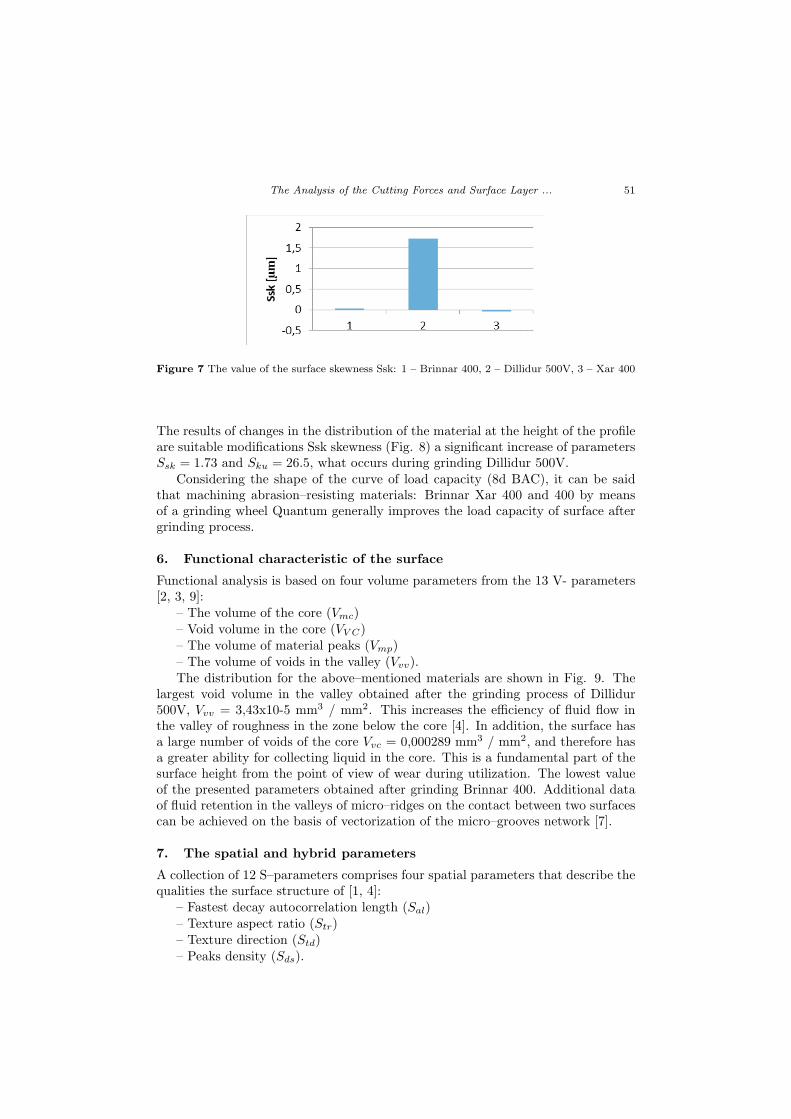
The results of changes in the distribution of the material at the height of the profileare suitable modifications Ssk skewness (Fig. 8) a significant increase of parametersSsk = 1.73 and Sku = 26.5, what occurs during grinding Dillidur 500V.
Considering the shape of the curve of load capacity (8d BAC), it can be saidthat machining abrasion–resisting materials: Brinnar Xar 400 and 400 by meansof a grinding wheel Quantum generally improves the load capacity of surface aftergrinding process.
6. Functional characteristic of the surface
Functional analysis is based on four volume parameters from the 13 V- parameters[2, 3, 9]:
– The volume of the core (Vmc)– Void volume in the core (VV C)– The volume of material peaks (Vmp)– The volume of voids in the valley (Vvv).The distribution for the above–mentioned materials are shown in Fig. 9. The
largest void volume in the valley obtained after the grinding process of Dillidur500V, Vvv = 3,43x10⁻⁵ mm3 / mm2. This increases the efficiency of fluid flow inthe valley of roughness in the zone below the core [4]. In addition, the surface hasa large number of voids of the core Vvc = 0,000289 mm3 / mm2, and therefore hasa greater ability for collecting liquid in the core. This is a fundamental part of thesurface height from the point of view of wear during utilization. The lowest valueof the presented parameters obtained after grinding Brinnar 400. Additional dataof fluid retention in the valleys of micro–ridges on the contact between two surfacescan be achieved on the basis of vectorization of the micro–grooves network [7].
7. The spatial and hybrid parameters
A collection of 12 S–parameters comprises four spatial parameters that describe thequalities the surface structure of [1, 4]:
– Fastest decay autocorrelation length (Sal)– Texture aspect ratio (Str)– Texture direction (Std)– Peaks density (Sds).
52 Wojcik, R., Grdulska, A., Rosik, R. and Wejman, P.
a)
b)
c)
Figure 8 The shape of the curves participation of the material and distribution of ADF functionsof the surface: a) Brinnar 400, b) Dilidur 500V, c) XAR 400

The Analysis of the Cutting Forces and Surface Layer ... 53
a)
b)
c)
Figure 9 The volumetric functional parameters of the grinded surface:a) Brinnar 400, b) Dilidur500V, c) XAR 400

54 Wojcik, R., Grdulska, A., Rosik, R. and Wejman, P.
a)
b)
c)
Figure 10 Directivity of the structure: a) Brinnar 400, b) Dilidur 500V, c) XAR 400

The Analysis of the Cutting Forces and Surface Layer ... 55
a)
b)
c)
Figure 11 Distribution of the autocorrelation function for surfaces: a) Brinar 400, b) Dillidur500V, c) XAR 400
The surfaces of materials Dillidur 500V and 400 XAR after grinding with depth ofcut ap = 0.01 mm contain much more peaks per unit area than after machiningBrinnar 400. However, when the same material has a larger value of Str it meansthat the grinded surface has a poorer lay texture (i.e. anisotropy) from other work-piece materials. Nevertheless, the value of the parameter Str < 0.1 still indicates ahigh anisotropy of all the grinded surface.
These properties are confirmed by surface lay diagram that is shown in Fig. 10.As can be seen, the level of isotropy of Brinnar 400 slightly exceeds 2%. Std andSal parameters are the results of the analysis of the autocorrelation function anddepend on surface stereometry. The value of the parameter Std for Brinnar 400 and
56 Wojcik, R., Grdulska, A., Rosik, R. and Wejman, P.
XAR 400 equals 92o, while for Dillidur 500V reaches 91o for grinded surface. Thevalue of this parameter indicates that the dominant cutting marks are perpendicularto the measuring direction. The greatest decay autocorrelation length Sal of thematerial was obtained for Brinnar 400 (Fig. 10a).
Whereas, on Fig. 11a and b can be seen that after grinding XAR 400 and Dillidur500V have occurred local valleys. Proper chip evacuation zone to fast gumming upof grinding wheels grinding wheel hasn’t exist. This adverse effect causes that, apartfrom cutting by means of abrasive grains, during the process further contact withthe workpiece material have glued chips, which often extend beyond the contour ofthe wheel. Consequently, during machining they leave a trail of deep scratches onthe surface.
Further in the paper were taken to analyze the next three hybrid parameters:
- Root Mean Square (RMS) Surface Slope comprising the surface, evaluated overall directions (Sdq),
- Mean Summit Curvature for the various peak structures (Ssc),
- Developed Interfacial Area Ratio (Sdr).
The surface of XAR 400 is composed of the roughness with a larger inclination(Sdq = 0.0585) than after machining Dillidur 500V (Sdq = 0.0512) and Brinnar 400(Sdq = 0.039). Also the curvature for the various peak structures are bigger whilegrinding XAR 400 (Ssc = 0.0244) than other materials. Ssc parameter values arein the range of 0.004 – 0.03 µm-1, which is the typical value for the surface shapedby grinding. A positive feature of surface Brinnar 400 is also the smallest unit ofSdr = 0.0765%.
8. Summary
The study contained the grinding process by means of the grinding wheel QuantumVitrium3 without application of cutting fluid. After observation under the micro-scope the state of surface weren’t found any damage to the surface layer in the formof burns or microcracks. Considerably smaller force components were obtained dur-ing grinding with smaller allowances, which is understandable. As a consequence ofthat, the less heat is cumulated in the grinding zone. It is associated with the factthat the wheel removes much smaller allowances.
Further research will include the grinding processes involving cutting fluid givenin two different methods: flood method by means of MQL method into the cut-ting zone. The paper presents the results of the research involving only selectedparameters of a profile characteristics and surface topography that were obtainedwhile grinding samples made of difficult to machine materials: Brinnar 400, Dillidur500V and XAR 400. The useage of different measurement techniques and visualiza-tion of the surface enables the assessment of stereometric features and exploitationproperties. The rapid development of measurement technologies, make it possibleto forecast the properties of functional of the elements, through proper selection ofgrinding conditions at various stages of the process.
The Analysis of the Cutting Forces and Surface Layer ... 57
References
[1] Adamczak, S.: Pomiary geometryczne powierzchni. Zarysy kszta ltu, falistosc i chro-powatosc, WNT (in Polish), Warsaw, 2008.
[2] Burakowski, T. and Napad lek, W.: Zarzadzanie technologiami areologicznymi.Zarzadzanie Technologia, 6–14, Gorzow Wielkopolski – Poznan, 2014.
[3] Borkowski, J.: Zuzycie i trwaosc sciernic, PWN, (in Polish), Warsaw 1990.
[4] Grzesik, W.: Wp lyw obrobki sekwencyjnej na topografi powierzchni stali utward-zonej, Mechanik, (in Polish), 5–6, p. 350–363, 2014.
[5] Grzesik, W., Rech, J. and Wanat, T.: Surface finish on hardned bearing partsproduced by superhard and abrasive tools, International Journal Maching Tools Man-ufacture, 47, pp.255–262, 2007.
[6] Grzesik, W.: Szlifowanie sciernic CBN – charakterystyka profilu i topografiipowierzchni utwardzonej stali po przeprowadzeniu procesu, cz.II, Stal, 5–6, p. 21–23, (in Polish), 2014.
[7] Oczos, K. E.: Doskonalenie techniki szlifowania. Czesc II, Mechanik, 10, (in Polish),2005.
[8] Oczos, K. E. and Liubimov, V.: Struktura geometryczna powierzchni, (in Polish),Rzeszow, 2003.
[9] Rosik, R. and Grdulska, A.: Wp lyw predkosci szlifowania na stan warstwywierzchniej w procesie szlifowania stopu tytanu, (in Polish), Mechanik, 8–9, p. 284–288, 2014.
[10] Wojcik, R.: Nowe media i sposoby doprowadzenia do strefy szlifowania, ArchiwumTechnologii Maszyn i Automatyzacji, (in Polish), 28/4, 137–145, 2008.
[11] Wojcik, R. and Gorecki, G.: Modyfikacje sciernic do szlifowania w srodowiskumg ly olejowej, XXXII Naukowa Szko la Obrobki Sciernej, (in Polish), 63–70, Koszalin– Dar lowo, 2009.
[12] http://www.htk.com.pl
[13] http:/universal–stal.pl
[14] http://www.ims–stalserwis.pl
[15] http://unionstal.pl