
THE AMERICAS ALTERNATIVE FINANCE … Ziegler E.J. Reedy Annie Le Bryan Zhang Randall S. Kroszner...
77
Tania Ziegler E.J. Reedy Annie Le Bryan Zhang Randall S. Kroszner Kieran Garvey 2017 THE AMERICAS ALTERNATIVE FINANCE INDUSTRY REPORT Hitting Stride WITH THE SUPPORT OF
Transcript of THE AMERICAS ALTERNATIVE FINANCE … Ziegler E.J. Reedy Annie Le Bryan Zhang Randall S. Kroszner...

Tania ZieglerE.J. ReedyAnnie LeBryan ZhangRandall S. KrosznerKieran Garvey
2017THE AMERICASALTERNATIVEFINANCEINDUSTRY REPORTHitting Stride
WITH THE SUPPORT OF

Executive Summary
Methodology
Main FindingsThe Size and Growth of Online Alternative Finance Market across the AmericasThe Americas Online Alternative Finance Market by Models The Geography of Online Alternative Finance in the AmericasThe Dynamics of Alternative Finance Market in the AmericasThe Use of Online Alternative Finance by BusinessesMarket Fundamentals of Online Alternative Finance in the Americas
Country specific model trendsUnited StatesCanadaMexicoChileBrazilColombiaArgentinaPeru
The regulatory landscape across the AmericasUnited StatesCanadaLatin America and the Caribbean
Perceptions of risk across the Americas
Conclusion
Acknowledgements
CONTENTS14
18 24262832364046
565658626465666666
68697070
72
74
76
T H E 2 0 1 7 A M E R I C A S A LT E R N AT I V E F I N A N C E I N D U S T R Y R E P O R T
2

RESEARCH TEAMTania ZieglerTania Ziegler is the Senior Research Manager at Cambridge Centre for Alter-native Finance at the Cambridge Judge Business School. Since joining the Cen-tre, Tania has co-authored seven alterna-tive finance industry benchmark reports and leads their global research initiative. Her research interests include small business economics and SME utilization of alternative funding models.
E.J. ReedyE.J. Reedy is a Director at the Polsky Center for Entrepreneurship and Inno-vation at the University of Chicago. He is a leading expert in small business finance, having served as a principal investigator for the Americas Alternative Finance Industry Survey, the Kauffman Firm Survey, and the American Survey of Entrepreneurs. E.J. oversees research initiatives at the Polsky Center for Entre-preneurship and Innovation, as well as FinTech initiatives.
Annie LeAnnie Le is a Senior Researcher at the Polsky Center for Entrepreneurship and Innovation at the University of Chicago. Annie is interested in exploring how technology can improve human experi-ence and productivity.
Randall S. KrosznerRandall S. Kroszner is faculty advisor to the program and Norman R. Bobins Pro-fessor of Economics at the Booth School of Business at the University of Chicago. Dr. Kroszner served as a Governor of the Federal Reserve System from 2006 until 2009 and continues to be a frequent commentator/advisor to financial institutions, government orga-nizations, and central banks throughout the world.
Bryan ZhangBryan Zhang is a Co-founder and the interim Executive Director of the Cambridge Centre for Alternative Finance and a Research Fellow at the Cambridge Judge Business School. He has co-authored eleven industry reports on alternative finance.
Kieran GarveyKieran Garvey is the Policy Programme Manager at the Cambridge Centre for Alternative Finance at Cambridge Judge Business School. Kieran has co-authored seven alternative finance industry re-ports. His research interests include the application of alternative finance within developing countries, renewable energy and early stage ventures.
Research Assistants and Contributing Writers:Andres Serrano GutierrezConnie Xu Research Assistants:Jackie AnPeter FerraraTanvi SonthaliaDaniela Campillo Valencia
H I T T I N G S T R I D E
3

FOREWORDSRandall S. KrosznerNorman R. Bobins Professor of EconomicsBooth School of Business
E.J. ReedyDirectorPolsky Center for Entrepreneurship and Innovation
FinTech is an important and evolving field where Chicago Booth and the Univer-sity of Chicago see both incredible opportunity and huge challenges in the com-ing years. While Chicago Booth and the University of Chicago have been leaders in Finance for decades, we believe that continued thought leadership, focused programming, and entrepreneurial support will be necessary in the coming years to help our students, alumni, and larger communities to realize the potential for innovation inherent in this wave of technology and restructuring.
The 2017 Americas Alternative Finance Industry Survey is one result of our ex-panded thought leadership in FinTech. Alternative finance is a critical component of FinTech, more generally, and given the rapid pace of change that it is under-going, we are pleased to continue our partnership with the Cambridge Centre on Alternative Finance on the current year’s report.
In terms of entrepreneurial support, the Polsky Center and Chicago Booth con-tinue to see very high demand from potential FinTech startup teams. For the first time during 2016-17, the Polsky Center with support from its FinTech Advisory Council, has been able to add focused programming to reach potential FinTech entrepreneurs, incubate new teams, and work towards serving the specific needs of FinTech entrepreneurs. Approaching this new vertical utilizing the many exist-ing strengths amongst our alumni community, take 2007 New Venture Challenge Winner, Braintree, as but one example, we look forward to deepening out Fin-Tech entrepreneurial impact in the coming years.
More broadly, Chicago continues to deepen its place as a center for FinTech ex-cellence, and we continue to support these efforts. Through leadership of part-ners like the CME Group, Chicago is already a major hub for global Finance, and we must continue to come together as a city around these topics.
T H E 2 0 1 7 A M E R I C A S A LT E R N AT I V E F I N A N C E I N D U S T R Y R E P O R T
4

Raghavendra RauSir Evelyn de Rothschild Professor of Finance
Director of Research, Cambridge Centre for Alternative Finance
This report continues our annual research collaboration between the Cambridge Centre for Alternative Finance and the University of Chicago Booth School of Business, in analysing online alternative finance activity across the Americas.
Over the last few years, the Cambridge Centre for Alternative Finance has re-leased benchmarking reports for every region in the world, including the UK, Europe, Africa, and the Asia Pacific regions. The Americas report is an integral part of this effort and allows us to chart the development of this rapidly-evolving industry across the globe.
The research team collected data from more than 273 country-specific online platforms in the Americas, taking the total number of platforms which partici-pated in our studies to more than 1,400 around the world. The United States is one of the world’s most advanced markets for technology-enabled online alter-native finance channels and instruments. Continued innovation, coupled with growing demand from consumers, businesses and institutional investors, led to a sustained increase in the total US volume to $34.5 billion in 2016, a 22% increase from the previous year. Our subtitle for the 2017 Americas Alternative Finance Industry Report – Hitting a Stride – attests to outcomes produced by this inno-vation. However, when compared to previous years, the yearly growth rate of the US alternative finance market has slowed considerably. While it may be prema-ture to attribute this to a maturity of the market, the decreasing rate of growth calls for continuing research effort in future years.
Our ongoing partnership with the University of Chicago augurs favourably for the continued documentation of trends in the alternative finance space in coming years.
H I T T I N G S T R I D E
5

David M. WongSenior Director, Innovation & Acceleration LabCME Group
It is easy to get excited about innovations and change. However, there are some things that continue to hold firm. In markets, the ultimate arbiter of success has consistently been trust. The core pillars of trust in successful markets have histor-ically been:
• Liquidity• Transparency• Efficiency • Safety, fairness, and reliability
Fueled by advances in technology and shifts in generational values, peer-to-peer (P2P) market platforms have rapidly grown from “cute new kids” to “admired pop stars,” with some leaping to “feared disruptors.” Clearly the P2P evolution goes far beyond financial markets to transportation, lodging, electricity, gigs, etc. In doing so, P2P and other alternative markets are earning trust and business by leaning on new pillars, including:
• Simplicity in user interface and experience• Accessibility• Agility • Purpose and soul
Although the traditional pillars of trust persist, we are clearly seeing a shift in the trust equation, especially when it comes to trusting peers. An interesting angle on this in the 2017 Edleman Trust Barometer shows that people now view peers as having an equal level of credibility as experts. Whether P2P markets reach or exceed the size of the incumbent market platforms (a la Uber and Airbnb), or not, they are driving rapid innovation and new dimensions of competition across industries. CME Group welcomes the important findings in this report and is confident that they will fuel our continued innovation to improve access to capital, mitigate risk, enhance livelihoods and advance the global economy.
T H E 2 0 1 7 A M E R I C A S A LT E R N AT I V E F I N A N C E I N D U S T R Y R E P O R T
6

Juan Antonio KettererDivision Chief, Capital Markets and FinanceThe Inter-American Development Bank
FinTech platforms are besetting the way the financial industry offers products and services to consumers all around the world. These new business models, based on convergent technological developments are challenging the incum-bents in the industry while generating new ways to create, deliver and capture value from consumers. Latin America and the Caribbean (LAC) are part of this transformation, and the FinTech industry has been growing strong across the region with more than 700 young enterprises and platforms currently deliver-ing financial solutions. More than 25% of these ventures are alternative finance platforms, which are a response to the gaps and asymmetries that persist in the region for credit allocation, mainly to Micro, Small and Medium-sized En-terprises (MSMEs).
This second edition of The Americas Alternative Finance Industry Report con-firms that the alternative finance market is growing strong in LAC, tripling the size estimated for 2015. The study shows how alternative finance is increasing in an uttermost relevant niche: business lending, accounting for 63% of the to-tal origination volume for 2016. These and other useful data and analysis from this study bring out the relevance of these entrants to the financial system in the region and the magnitude of their disruption, attending to previously unbanked and underbanked economic agents.
Furthermore, a sign of the importance of this growth is the interest of region-al policymakers and regulators on FinTech, and particularly on alternative finance. These public-sector actors are taking actions towards understand-ing the business models and the associated risks and are preparing proper responses to regulate it prudently and/or to promote the industry. The In-ter-American Development Bank has supported Argentina, Chile, Mexico, Peru and Paraguay governments as they clear the path to create appropriate regu-lations, based on the awareness created by last year’s study and an extensive dialogue with the industry.
The IDB supports this initiative with the intention to offer a deeper under-standing of the industry in the region, complementing other studies also sponsored or created by the Bank, while offering policy makers and regulators first-hand information to regulate the industry without suppressing innovation.
H I T T I N G S T R I D E
7
T H E 2 0 1 7 A M E R I C A S A LT E R N AT I V E F I N A N C E I N D U S T R Y R E P O R T
8
RESEARCH PARTNERS AND PARTICIPATING PLATFORMS
H I T T I N G S T R I D E
9
We would like to acknowledge the generous support received from the following research partners
T H E 2 0 1 7 A M E R I C A S A LT E R N AT I V E F I N A N C E I N D U S T R Y R E P O R T
10
Verde, Ref. Pantone 369C Azul, Ref. Pantone 2748C
We would like to acknowledge the generous support received from the following participating platforms

H I T T I N G S T R I D E
11

T H E 2 0 1 7 A M E R I C A S A LT E R N AT I V E F I N A N C E I N D U S T R Y R E P O R T
12

H I T T I N G S T R I D E
13
MR
R2 Capital

T H E A M E R I C A S A LT E R N AT I V E F I N A N C E B E N C H M A R K I N G R E P O R T
2 0 1 7
14
EXECUTIVE SUMMARY2016 will likely be remembered as a major transition year for the online alternative finance industry in the Americas. Entries of new platforms have slowed and many smaller platforms have exited. Competition, both internal and external, has increased with the easing of macroeconomic conditions in many developed countries across thae Americas. High profile incidents within certain segments of the market led to calls for a greater level of transparency within the industry with many platforms changing their operational practices and capital structures. Developments in regulation opened up both opportunities and challenges.
T H E 2 0 1 7 A M E R I C A S A LT E R N AT I V E F I N A N C E I N D U S T R Y R E P O R T
14
Against this backdrop, the 2017 Ameri-cas Alternative Finance Industry Report finds the industry “hit a stride” showing continued, steady growth in most seg-ments of the market. An array of crowd-funding, marketplace/peer-to-peer (P2P) lending and other online alter-native finance platforms have emerged that use technological innovations to change the way people, businesses and institutions access and invest money. Furthermore, businesses are turning to online alternative sources of funding at increasingly high numbers.
The 2017 Americas Alternative Finance Industry Report was produced jointly by the Polsky Center for Entrepreneurship and Innovation and Booth School of Business at the University of Chicago, and the Cambridge Centre for Alterna-tive Finance at the University of Cam-bridge Judge Business School. Financial support was received from the CME Group Foundation and the Inter-Ameri-can Development Bank. The 2017 Report expands on the inaugural 2016 report to chronicle and shed light on this diverse and dynamic industry. It is a part of a global suite of regional studies carried out by the Cambridge Centre for Al-ternative Finance at the University of Cambridge Judge Business School and its academic research partners.
Highlights of the 2017 Americas Alternative Finance Industry ReportMarket Size and Growth• The alternative finance market continued to grow across the United States (US), Canada and Latin Ameri-ca and the Caribbean (LAC) in 2016 to a total market volume of $35.2 billion. The 23% increase from last year was driven by growth across all regions and most market segments of the Americas. • The US continues to be one of the world’s top markets for advanced, technology-enabled, online alterna-tive finance channels and instruments. The 2016 US market volume of $34.5 billion marked a 22% year-on-year increase from 2015.
• Rapid organic growth led LAC alternative finance markets to grow by 209% to $342.1 million in 2016. LAC, collectively as a regional market, surpassed Canada’s national market in 2016, led by high volume markets in Mexico, Chile and Brazil.•Canada’s alternative finance market grew to $334.5 million, a 62% year-on-year increase from 2015.
Prevailing Online Alternative Finance Models
• Looking at the US, Marketplace/P2P Consumer Lending continued to account for the largest share of market volume with $21 billion recorded in the US in 2016 (up 17%). Balance Sheet Business Lending became the second largest mod-el in the US in 2016 with $6 billion originated, surpassing Balance Sheet Consumer Lending which had $3 billion.• For LAC, Marketplace/P2P Business Lending remained the largest alter-native finance market segment with $188.5 million registered in 2016, an increasing of 239% over 2015.• In Canada, Donation-based Crowd-funding remained the top alternative finance model with $105.9 million, but Balance Sheet Business Lending rose at a rate of 282% to $103.3 million in 2016.
Businesses Tapping Alternative Finance
• An estimated 218,188 businesses raised funds across the Americas from online alternative finance chan-nels in 2016, led by the US (143,344), but with business users increasingly common in LAC (67,499). • A total of $9.2 billion in alternative business funding was raised in 2016, which is distributed largely to the US ($8.8 billion) and to a lesser extent to LAC ($233.8 million), and Canada ($169.7 million) .• The emerging RegCF-enabled platforms are a key component of Equity-based Crowdfunding in the US. However, with many not emerg-ing until late 2016, Equity-based
H I T T I N G S T R I D E
15

Crowdfunding remained flat year-on-year and reached $569.5 million. Revenue-Sharing/Profit-Sharing Crowdfunding, also enabled by recent changes, emerged with $28.5 million in total funding to businesses. • Over two-thirds (71%) of LAC online alternative business finance came from Chile ($97.1 million) and Mexico ($69.5 million). Chile led in debt-based finance ($92.9 million) and non-investment-based business finance ($2.8 million). Mexico led in equity-based business finance ($4.9 million).
Market Dynamics • In 2016, approximately $19 billion, or 55% of the total US alternative finance volume, was provided by institutional investors, up in real terms from 2015 from $17.3 billion but down in relative contribution from 66%. • The number of newly incorporated platforms continued to decrease in 2016. • In LAC, 52% of surveyed platforms reported that they have introduced “significant new product or service” in 2016. In the US, 44% of surveyed platforms reported introduction of significant new products or services in 2016.
Regulation• In the Americas, equity-based platforms are divided between those who view the existing regulations as excessive and too strict (36%) and those who regard current regulations as adequate and appropriate (36%). • Most platforms on both the equi-ty side (59%) and debt side (36%) seem to agree that the proposed national regulations of their respec-
tive jurisdictions are adequate and appropriate.• State-level regulations in the US were perceived differently by debt-based and equity-based platforms. Fifty-one percent of debt-based plat-forms and 55% of equity-based plat-forms found existing state regulations to be adequate. However, accounts of excessive regulation rise from 18% in debt-based platforms to 41% in equity platforms at the state level.
Risks• Self-reported risk perceptions of the alternative finance industry are surprisingly similar across markets in the Americas, with the largest report-ed risk being cyber-security breach. Seventy-six percent of platform oper-ators believe there is medium to very high risk of cyber-security breach.• The “collapse of one or more well-known platforms due to mal-practice” ranked second highest in perceived risks to platforms, likely reflecting some of the repercussions of high-profile incidents within the industry in the last 12 months. Six-ty-nine percent of platforms viewed this as a medium to very high risk.• “Fraud’ and “notable increase in default or business failure” were both regarded by 64% of surveyed plat-forms to be medium to very-high risk.
Looking at the market trends illustrated in this industry report, we see a fledg-ling industry that is growing up fast, and experiencing both pleasures and pains associated with adultescence. We hope this report will provide value to the industry and market data to inform evidence-based policymaking and regu-lations.
T H E 2 0 1 7 A M E R I C A S A LT E R N AT I V E F I N A N C E I N D U S T R Y R E P O R T
16

H I T T I N G S T R I D E
17
METHODOLOGYThe 2017 Americas Alternative Finance Industry Report covers the online alternative finance markets across the United States (US), Canada, and Latin America and the Caribbean (LAC). LAC includes Anguilla, Argentina, Belize, Bolivia, Brazil, Chile, Colombia, Costa Rica, Cuba, Dom-inica, Dominican Republic, Ecuador, El Salvador, Guam, Guatemala, Haiti, Honduras, Mexico, Nicaragua, Panama, Paraguay, Peru, Puerto Rico, Uruguay, Venezuela and Vir-gin Islands. The 2016 Americas Alternative Finance In-dustry Report – Breaking New Ground was the first aca-demic-driven, large-scale benchmarking study on online alternative finance markets for the region. This study is based primarily upon the 2017 Americas Alternative Finance Industry Survey, which served as the primary data collection-tool to inform the analysis of this report.
T H E 2 0 1 7 A M E R I C A S A LT E R N AT I V E F I N A N C E I N D U S T R Y R E P O R T
18

In the 2017 Americas Alternative Fi-nance Industry Survey aggregate infor-mation about the fundraisers, funders, and platforms were collected primarily utilizing a standard online survey instru-ment.1 In order to ensure continuity, a series of compulsory questions relating to total transaction volume, number of funders or fundraisers, etc., remained constant from the previous year, to al-
low for longi-tudinal analy-sis. Platforms were also presented with a series of ‘optional’ questions, which probed key research themes teased out in the pre-vious year’s research.
Over the course of four months, a research team based in Chicago and Cambridge invited quali-fied platforms across the Americas
to respond to the survey. Qualified platforms included platforms head-quartered within the region, and that operate in at least one model in the list of alternative finance models laid out in the taxonomy of the study. A large number of industry research partners contributed to the project by identify-ing online alternative finance platforms within the region and promoting the survey.
The survey was hosted on a dedicat-ed site accessible only to the principal investigators in Chicago and Cambridge.
In cases where the survey could not obtain primary data (or where there were discrepancies in reported data), the team consulted secondary data (public information, annual reports and press releases) to inform the research. In order to obtain the most up-to-date online alternative finance volumes, the team also used web-scraping methodologies for confirmatory data and as a comple-ment to the survey. We then verified this data by matching it against plat-forms’ self-published figures. Whenever necessary, the research team validated responses by reaching out directly to platforms for clarification or to acquire detailed data breakdowns in various geographies.
The 2017 Americas Alternative Finance Industry Survey and accompanying outreach materials, were translated and distributed in English, Spanish, and Portuguese. The research team com-municated directly with surveyed online alternative finance platforms begin-ning in mid-January 2017 through April 2017, explaining the study’s objectives, providing a copy of last year’s report (http://bit.ly/AltFin16Report) and the questionnaire. Outreach was performed to 940 platforms in total. After breaking apart platforms at the country level and the addition of top-line web scraping information, a total of 273 country-spe-cific platforms were analyzed.
The research team anonymized and cleaned the data by deleting all plat-form-identifying information. For all average data points, the team applied weightings by transaction volume per question in order to produce the most accurate estimates of responding platforms by model; significant outliers were removed to maintain the accuracy and validity of the dataset. At comple-tion, data was encrypted and stored for retrieval exclusively for the use of this project and was accessible only to the research team.
FinTech is a movement that has
emerged as new technologies (usually
Internet-enabled or large-scale
computing) have been applied to the traditional Finance.
1 Survey instrument available by request.
H I T T I N G S T R I D E
19

Taxonomy of Alternative Finance in this studyFinTech is a movement that has emerged as new technologies (usually Internet-enabled or large-scale comput-ing) have been applied to the traditional. This study looks inside one particular segment of FinTech – online alternative finance.
Indeed, the term alternative finance does not have a universally agreed upon definition. Investment bankers
use alterna-tive finance in the context of alternative investments, such as non-tra-ditional asset classes, alterna-tives to stocks and bonds, or in reference to shadow bank-ing activities like private placements of corporate debt funded by institutional in-vestors instead of banks. Econ-omists study-ing developing economies use
it to describe the sources of financing and payment channels that emerge to address the needs of individuals and businesses in economies lacking a functioning banking system.
This report analyses a subset of the larger alternative finance market, spe-cifically the technology-enabled online channels or platforms that act as inter-mediaries in the demand and supply of funding (e.g. capital formation and allo-cation activities) to individuals and busi-nesses outside of the traditional banking system. We therefore exclude platforms that facilitate payments, cross-border remittances or foreign exchange trans-actions outside of the banking system. We also exclude platforms only acting as information bulletin boards, providing information about traditional or alterna-tive finance providers.
Included
Technology-enabled online platforms (or channels) that act as intermediaries in the demand and supply of funding to individuals and businesses outside of the
traditional banking system.
Excluded
Platforms that facilitate payments, cross-border remittances or
foreign exchange transactions outside of the banking system.
Platforms which function as an aggregator or as an information- only ‘bulletin board,’ providing information about traditional
or alternative finanace providers.
A key characteristic of the online alter-native finance channels we are reviewing is the principle that there exists a col-lective grouping of individual investors, commonly referred to as a “crowd” or “peers,” that pool their financial resourc-es to fund businesses, individuals and projects through small investments. Starting from this base, the online chan-nels we are observing can be broken down by specific types of models to de-scribe how platform-operators function.
This study has adopted a platform-fo-cused model-based taxonomy for online alternative finance that is derived from previous benchmarking studies de-veloped by the Cambridge Centre for Alternative Finance at the University of Cambridge Judge Business School and its research partners2 over the course of four years. Alternative finance is con-sistently evolving, and as a result, the working taxonomy has also evolved to include new models or refine definitions of existing model-types. By utilizing a taxonomy that is comparable to other regional studies, researchers will be able to compare and track the online alterna-tive finance landscape at a global scale.
T H E 2 0 1 7 A M E R I C A S A LT E R N AT I V E F I N A N C E I N D U S T R Y R E P O R T
20
There exists a collective grouping
of individual investors, that pool their
financial resources to fund businesses,
individuals and projects through
small investments.
2 (Zhang, B.Z., Wardrop, B., Rau, R. and Gray, M. 2015) Moving Mainstream: The European Alternative Finance Benchmarking Report (University of Cambridge and EY), http://www.jbs.cam.ac.uk/index.php?id=6481#.VghidvmqpBc

3 Individuals or institutions purchase securities from a company, such as shares or bonds, and share in the profits or royalties of the business.4 Individuals or institutional funders purchase debt-based securities, typically a bond or debenture, at a fixed interest rate. Unsecured retail bonds, in the form of mini-bonds, are included in this sample.
Figure 1: A Taxonomy of Alternative Finance Models
Alternative Finance Model
Definition
Inve
stm
ent-
bas
ed M
od
els
No
n-in
vest
men
t-
bas
ed m
od
els
Marketplace/P2P Consumer Lending
Balance Sheet Consumer Lending
Marketplace/P2P Business Lending
Balance Sheet Business Lending
Marketplace/P2P Property Lending
Real Estate Crowdfunding
Equity-based Crowdfunding
Other
Reward-based Crowdfunding
Donation-based Crowdfunding
Individuals or institutional funders provide a loan to a consumer borrower.
The platform entity provides a loan directly to a consumer borrower.
Individuals or institutional funders provide a loan to a business borrower.
The platform entity provides a loan directly to a business borrower.
Individuals or institutional funders provide a loan secured against a property to a consumer or busi-ness borrower.
Individuals or institutional funders provide equity or subordinated-debt financing for real estate.
Individuals or institutional funders purchase equity issued by a company.
We include two additional categories, which are not presented individually due to small sample size. They are Revenue-sharing/Profit-Sharing3, and Debt-based Securities/Debentures.4
Backers provide funding to individuals, projects or companies in exchange for non-monetary rewards or products.
Donors provide funding to individuals, projects or companies based on philanthropic or civic motivations with no expectation of monetary or material return.
H I T T I N G S T R I D E
21
Broadly speaking, this taxonomy consists of two over-arching catego-ries: non-investment-based models (Reward-based Crowdfunding and Donation-based Crowdfunding) and investment-based models (such as Equity-based Crowdfunding and Market-place/P2P Lending models) as illustrat-ed in Table 1. For each of these models, the platform functions as an interme-diary between a cohort of funders and a fundraiser, facilitating the transfer of funds between the two. In the case of the non-investment-based models, the flow of finance is a one-way street, where there is no expectation of finan-cial gain for the funder. The two models which encapsulate this category is that of Reward-based Crowdfunding and that of Donation-based Crowdfund-ing. Often referred to as the ‘orthodox’ crowdfunding model, these two mod-el-types drive significant volume across the Americas but do not often offer much in the way of innovation in capital formation with respect to the evolution of the alternative finance landscape.
Investment-based models, however, rely upon the assumption that the funders can reasonably expect a financial return based upon their investments, as they are pur-chasing a debt or equity security instru-ment. Across the Americas, the prolifera-tion of investment-based models has led to varied development, with some models resonating more prominently in some jurisdictions than the others. These invest-ment-based models can be segmented into debt-based or equity-based transac-tions. Equity-based models can be seg-mented into either Equity-based Crowd-funding or Real Estate Crowdfunding. As defined in the table above, these two models allow for investors (be it individual5
or institutional investors) to purchase eq-uity or subordinated debt products from an issuer, typically a business. The security on offer is characterized by its non-readily realizable nature, and therefore is viewed as a long-term investment.
Marketplace/P2P Lending is a general description of financing provided by way of a loan, regardless of whether the lender is an individual or an institutional investor. Platforms can employ different intermediation models. However, for funding loans, some platforms act solely as intermediaries between borrowers and lenders, in a role that is more akin to asset management than banking, with a business model that avoids taking on credit risk related to lending and relies on transaction fees paid by the inves-tors/lenders. These platforms typically screen and analyze the creditworthi-ness of loan applications, assign credit ratings to loans, and can allocate loan investments to the portfolios of individ-ual and institutional investors on their platform. Peer-to-Peer (P2P) lending is a sub-segment of marketplace lending that is more akin to asset management, and refers to the funding of loans to in-dividual or small businesses by individu-als – the “peers.” Most lending platforms in the US market promote the term “marketplace lending,” instead of P2P. To describe their industry as the partic-ipation of “peers” in the lending activity in the US market has not been as com-mon, given the high level of institutional funding in this model.
In contrast to the Marketplace/P2P Lending described above, balance sheet lenders directly fund the loans originated on their platforms and therefore assume the credit risk asso-ciated with these loans. They operate with an intermediation model that is more akin to bank lending, by financ-ing loans with equity and debt on their balance sheet and, like banks, periodi-cally refinancing by securitizing pools of the loans they have funded. Unlike regulated bank lenders, however, these balance sheet lenders do not have access to deposits to facilitate their lending activity.
T H E 2 0 1 7 A M E R I C A S A LT E R N AT I V E F I N A N C E I N D U S T R Y R E P O R T
22
5 In the United States, individual investors are categorized as either Accredited or Un-accredited investors. Accredited investors are typically defined as those with a net worth of more than $1 million or who have earned more than $200,000 consistently for the last three years.

H I T T I N G S T R I D E
23

T H E 2 0 1 7 A M E R I C A S A LT E R N AT I V E F I N A N C E I N D U S T R Y R E P O R T
24
MAIN FINDINGSOnline alternative finance, particularly in North America, has entered the mainstream, attracting growing num-bers of consumers, entrepreneurial start-ups, established small businesses and institutional investors. Not surpris-ingly, alternative finance has also drawn the attention of industries, governments and academics who are studying everything from platform formation to appropriate regu-latory frameworks, from short-term risks to the long-term impact on regional and global economies.
As this new industry evolves, stakeholders have a need for independent, systematic and reliable data on the size, growth and diversity of the various online alternative fi-nance markets around the world. Insights from this re-search will help inform policy makers, brief regulators, update the media and educate the public.
The 2017 Americas Alternative Finance Industry Report aims to track the growth and development of key alterna-tive finance markets in the Americas, to identify emerging trends and to analyze the market dynamics of specific alternative finance models in the region.

H I T T I N G S T R I D E
25

THE SIZE AND GROWTH OF THE ONLINE ALTERNATIVE FINANCE MARKET ACROSS THE AMERICASIn 2016, the online alternative finance market continued to grow across the Americas. The overall regional market volume increased by 23% from the $28.7 billion in 2015 to $35.2 billion in 2016.6 Over the last three years (2014-2016), the total online alternative finance transaction volume reached $75.6 billion.
T H E 2 0 1 7 A M E R I C A S A LT E R N AT I V E F I N A N C E I N D U S T R Y R E P O R T
26
Figure 2: Americas Alternative FinanceTotal Volume, 2014-2016 ($USD)Americas Online Alternative Finance Total Volume2014-2016 ($USD)
Canada
U.S.
LatinAmerica
5
10
15
20
25
30
35
$40 billion
201620152014
10
20
30
$40 billion
201620152014
100
200
300
$400 million
201620152014
100
200
300
$400 million
201620152014
$11.7B
$28.7B
$35.2B
Total:
$342.1M2016:
$334.5M
$34.5B

United StatesThe United States (US) is one of the world’s most advanced markets for technology-enabled online alternative finance channels and instruments. Con-tinued innovation, coupled with growing demand from consumers, businesses and institutional investors, led to a sus-tained increase in the total US volume to $34.5 billion.6 This represented a 22% increase from 2015. Despite this year-on-year increase, when compared to previous years, the yearly growth rate of the US alternative finance market has slowed-down considerably. In contrast, the US experienced triple digit rates of growth in previous years.
The US is responsible for 98% of all online alternative finance activity in the Americas. As a result, this report high-lights key findings from the US separate-ly from the rest of the region, wherever possible.
CanadaIn Canada’s online alternative finance market, transaction volume facilitated by the online alternative finance platforms grew to $334.5 million, a 62% increase from 2015’s $207 million. Canada’s econ-omy continues to be served by a tradi-tional banking system dominated by five large banks, all of which have a reputa-tion for being relatively cautious lenders. Demand from entrepreneurs, small busi-nesses and underbanked consumers is fueling the growth of alternative finance.7 Despite being the world’s 10th largest economy, the Canadian online alterna-tive finance market is much smaller than the US market based on total alternative finance volume.
Latin America and the CaribbeanThe online alternative finance industry in Latin America and the Caribbean (LAC) has expanded rapidly in a rela-tively short period of time. The indus-try’s growing popularity in LAC can be attributed to limited access to credit for many consumers and small businesses from the incumbent banking system.
From 2015 to 2016, the LAC market ex-perienced a growth of 209%, the largest recorded to-date. In comparison, be-tween 2014 and 2015, the industry in the region grew 97%. The total transaction volume in 2016 was $342.1 million, a sig-nificant increase compared to the $110.6 million in 2015 and the $56.2 million in 2014.
In LAC, the alternative finance market-place is largely focused on small busi-ness financing. Of the $342.1 million 2016 total, more than $230 million came from the alternative finance industry sectors dedicated to business finance.
With many new platforms entering the market and better survey response, several countries within LAC had levels of online alternative finance volume this year that were diversified enough to allow detailed country-level analysis – Mexico, Chile, Brazil, Colombia, Argenti-na and Peru.
6 The 2015 United States total estimated volume has been adjusted from $36.2 billion (as originally published last year) to $28.4 billion. This revision stems from a re-calculation of the total volume for two models – Marketplace/P2P Consumer Lending and Marketplace/P2P Business Lending. The research team was able to re-verify platform self-reported market volume utilized in the calculation of the 2015 figure and noted an unintentional over-estimation of approximately $7.7 billion. In the 2016 Americas Alternative Finance Industry Survey, platforms estimated 2015 Q4 volumes, as the survey was conducted during the 2015 calendar year. The current year collection was adjusted to occur after the close of the previous calendar year and to incorporate full-year actual results. Additionally, third party verification of reported statistics was increased. As a result, the revised 2015 estimates presented in this report reflect corrected data based on publicly-available, final end-of-year volumes to more accurately capture the United States market. 7 http://business.financialpost.com/entrepreneur/alternative-lending-bubbles-up-into-canadian-mainstream-and-gains-tration-among- entrepreneurs
H I T T I N G S T R I D E
27

THE AMERICAS ONLINE ALTERNATIVE FINANCE MARKET BY MODEL At the end of 2016, the Americas alternative finance industry continues to be dominated from a volume perspective by Market-place/P2P Consumer Lending (59.9%); however, the prevalence of this model shouldn’t mask the overall diversity and dynamism of the market.
T H E 2 0 1 7 A M E R I C A S A LT E R N AT I V E F I N A N C E I N D U S T R Y R E P O R T
28
Balance SheetConsumer Lending
Marketplace/P2PBusiness Lending
Marketplace/P2PProperty Lending
Real EstateCrowdfunding
1.7% Reward-basedCrowdfunding
0.2% OtherEquity-basedCrowdfunding
Donation-basedCrowdfunding
Marketplace/P2P Consumer Lending59.9% 8.6%
4.4%
3.0%
2.3%
1.6% 1%Balance Sheet Business Lending17.4%
Figure 3: Americas Alternative Finance Market Share by Model, 2016

Market Volumes by Online Alternative Finance Model The following section details the market volumes attributed to various online alterna-tive finance models in the Americas.
■ MARKETPLACE/P2P CONSUMER LENDING: In 2016, Marketplace/P2P Consumer Lending reached $21.1 billion, up 17% from the $18.0 billion in 2015. This model accounted for 59.9% of the total alter-native finance market volume in 2016 in the Americas.8
■ BALANCE SHEET CONSUMER LENDING: In 2016, Balance Sheet Consumer Lend-ing accounted for $3.0 billion, down 2% from the $3.1 billion in 2015. The model accounted for 8.6% of the total market in 2016.
■ MARKETPLACE/P2P BUSINESS LENDING: In 2016, Marketplace/P2P Business Lending registered $1.5 billion, down a considerable 42% on a year-to-year ba-sis from the $2.7 billion in 2015. Overall, this model accounted for 4.4% of the total alternative finance volume in 2016 in the Americas.
■ BALANCE SHEET BUSINESS LENDING: Balance Sheet Business Lending account-ed for $6.1 billion, up 169% compared to $2.3 billion in 2015. Over the past three years, this model grew at an average annual rate of 136%. Overall, it accounted for 17.4% of the market in 2016.
■ MARKETPLACE/P2P PROPERTY LENDING: This model was responsible for $1.1 bil-lion in 2016, up 34% from $782.6 million in 2015. Over the three-year period, this model has grown by an annual average of 257%. Marketplace/P2P Real Estate Lending accounted for 3% of the total market in 2016.
■ EQUITY-BASED CROWDFUNDING: Equity-based Crowdfunding accounted for $569.5 million in 2016, down 5% from $598.1 million in 2015. It represented 1.6% of the entire Americas market.
■ REAL ESTATE CROWDFUNDING: Real Estate Crowdfunding increased by 70% to $821.0 million in 2016 from the $483.8 million in 2015. Over the three-year period, this model saw an average annual growth rate of 160%. It account-ed for 2.3% of the total market in 2016.
■ REWARD-BASED CROWDFUNDING: Reward-based Crowdfunding declined to $596 million in 2016 from the $658.4 mil-lion recorded in 2015. Overall, it account-ed for 1.7% of the total volume in 2016.
■ DONATION-BASED CROWDFUNDING: This model saw a 57% increase to $339.2 million in 2016 from $215.6 million in 2015. Donation-based Crowdfunding has seen an annual growth rate of 40% over the past three years. It represented 1% of the total market.
■ OTHER: We also recorded a total volume of $67 million dollars raised through other alternative finance models, specifically Revenue-sharing/Profit-sharing Crowdfunding, and Debt-based Securitites/Debentures.
8 It should be noted, the research team has amended the estimated 2015 total volume for the Marketplace/P2P Consumer Lending model. In the previous year’s report, we estimated that Marketplace/P2P Consumer Lending was $25.7 billion. We have now revised this figure to $18 billion. This $7.7 billion reduction stems primarily from a change in our methodology, where the research team no longer collects estimate volume values for the final quarter of the preceding year. As such, the research team was able to re-verify 2015 Q4 figures to more accurately reflect the true size of this model in the United States.
H I T T I N G S T R I D E
29
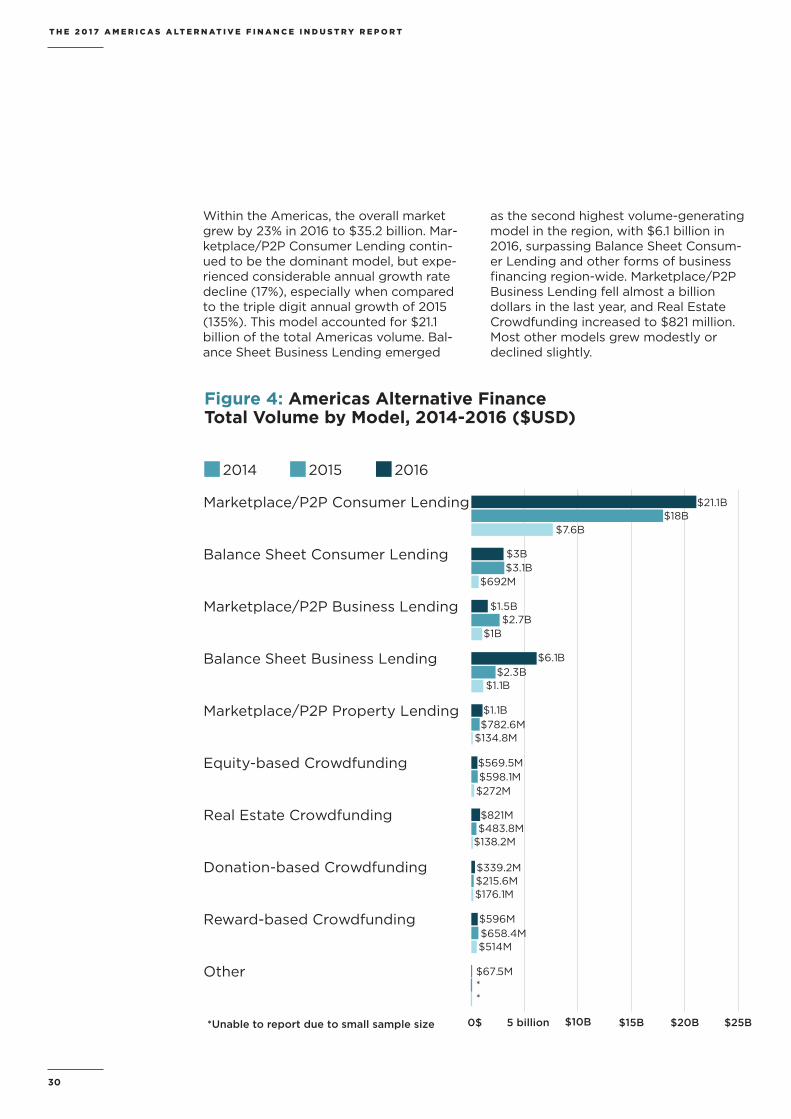
Within the Americas, the overall market grew by 23% in 2016 to $35.2 billion. Mar-ketplace/P2P Consumer Lending contin-ued to be the dominant model, but expe-rienced considerable annual growth rate decline (17%), especially when compared to the triple digit annual growth of 2015 (135%). This model accounted for $21.1 billion of the total Americas volume. Bal-ance Sheet Business Lending emerged
as the second highest volume-generating model in the region, with $6.1 billion in 2016, surpassing Balance Sheet Consum-er Lending and other forms of business financing region-wide. Marketplace/P2P Business Lending fell almost a billion dollars in the last year, and Real Estate Crowdfunding increased to $821 million. Most other models grew modestly or declined slightly.
T H E 2 0 1 7 A M E R I C A S A LT E R N AT I V E F I N A N C E I N D U S T R Y R E P O R T
30
Figure 4: Americas Alternative FinanceTotal Volume by Model, 2014-2016 ($USD)
Marketplace/P2P Consumer Lending
Balance Sheet Consumer Lending
Marketplace/P2P Business Lending
Balance Sheet Business Lending
Marketplace/P2P Property Lending
Equity-based Crowdfunding
Real Estate Crowdfunding
Donation-based Crowdfunding
Reward-based Crowdfunding
Other
0$ 5 billion $10B $15B $20B $25B
2014 2015 2016
$21.1B
$3B
$1.5B$2.7B
$1B
$6.1B$2.3B
$1.1B
$1.1B$782.6M
$134.8M
$569.5M$598.1M$272M
$821M$483.8M
$138.2M
$339.2M$215.6M$176.1M
$596M$658.4M$514M
$67.5M**
$3.1B$692M
$18B$7.6B
*Unable to report due to small sample size

H I T T I N G S T R I D E
31

THE GEOGRAPHY OF ONLINE ALTERNATIVE FINANCE IN THE AMERICASWhile the online alternative finance market continues to expand across the Americas, the United States (US) remains the largest contributor in terms of annual volume, product innovation, model diversity, institutional participation and the number of active alter-native finance platforms. In 2016, the US accounted for 98% of to-tal market volume across the Americas. Within Latin American and the Caribbean (LAC), Mexico was responsible for 33% of the total regional volume, Chile for 29%, and Brazil for 19%.
T H E 2 0 1 7 A M E R I C A S A LT E R N AT I V E F I N A N C E I N D U S T R Y R E P O R T
32

Although a majority of transaction volume occurs in the US, we find that there are significant volumes from Canada ($334.5 million), Mexico ($114.2 million), Chile ($97.8 million), Brazil ($64.4 million) and Argentina ($12.6 million). Compared to last year, all of these countries increased their annual market volumes. Most notably, Mexico surpassed both Chile and Brazil in 2016.
Many factors might also contribute to the success of specific alternative finance markets. These include differ-ential levels of GDP, strong adoption of online/mobile banking, an invest-ment climate that funds and supports technological advancement, a culture of innovation in the financial ser-vices sector, pent-up demand from unbanked and underbanked consum-ers and businesses and a generally
H I T T I N G S T R I D E
33
Americas Alternative FinanceComparative Market Volumes2016
Total Volume (2016)
$30 billion or more
$300-$350 million
$100-$150 million
$50-$100 million
$5-$10 million
UNITED STATES
CANADA
MEXICO
BRAZIL
COLOMBIA
PERU
ARGENTINA
CHILE
Figure 5: Americas Alternative FinanceComparative Market Volumes 2016
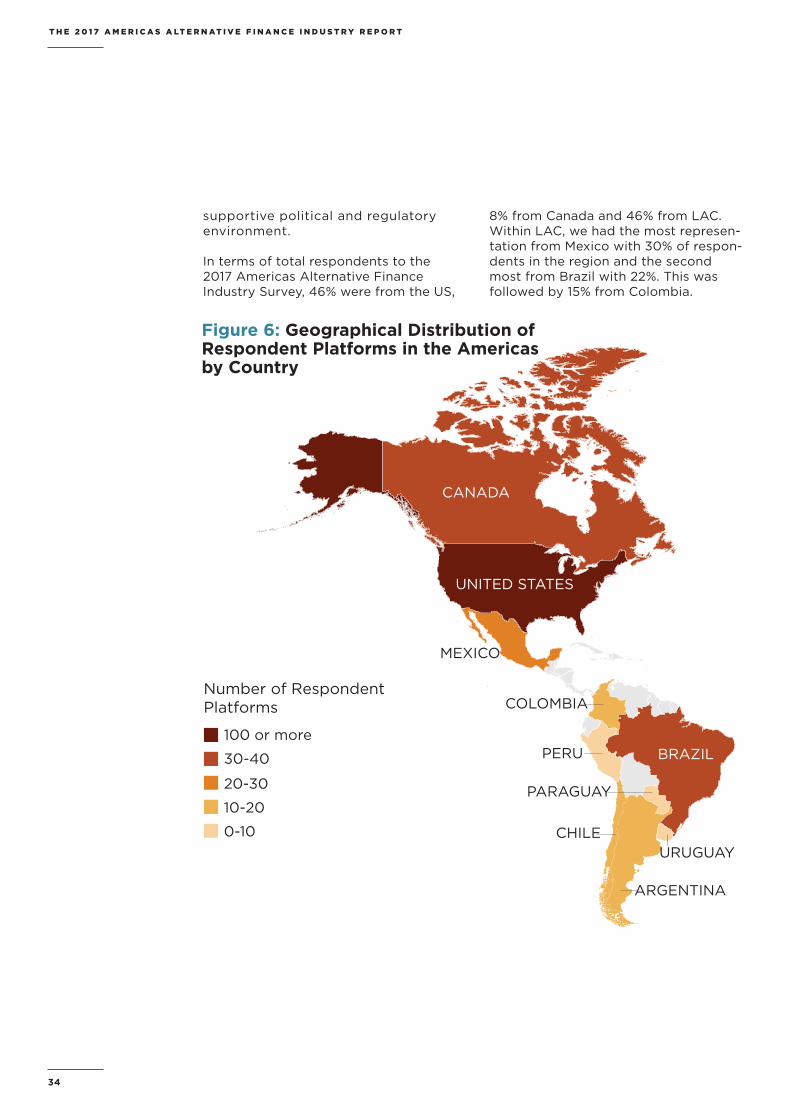
supportive political and regulatory environment.
In terms of total respondents to the 2017 Americas Alternative Finance Industry Survey, 46% were from the US,
8% from Canada and 46% from LAC. Within LAC, we had the most represen-tation from Mexico with 30% of respon-dents in the region and the second most from Brazil with 22%. This was followed by 15% from Colombia.
T H E 2 0 1 7 A M E R I C A S A LT E R N AT I V E F I N A N C E I N D U S T R Y R E P O R T
34
Geographical Distribution ofRespondent Platforms in theAmericas by Country
Number of RespondentPlatforms
100 or more
30-40
20-30
10-20
0-10
UNITED STATES
CANADA
MEXICO
BRAZIL
COLOMBIA
PERU
ARGENTINA
PARAGUAY
URUGUAYCHILE
Figure 6: Geographical Distribution of Respondent Platforms in the Americas by Country

Within the US, platforms tend to con-centrate on the East and West coasts of the country. California and New
York have the highest concentration of platform headquarters, with the rest of platforms distributed across the country.
H I T T I N G S T R I D E
35
Geographical Distribution of Respondent Platforms in theUnited States
D.C.
Number ofRespondent Platforms
1-5
6-10
20-30
More than30
AZ
UT IL
MI
IN OH
GA
FL
PA
CO
TX
WA
OR
CA
NY
MA
DEMD
Figure 7: Geographical Distribution of Respondent Platforms in the United States

THE DYNAMICS OF THE ALTERNATIVE FINANCE MARKET IN THE AMERICASThe alternative finance industry continued to evolve at a fast-pace in 2016. In this section, evidence of evolution is presented from direct survey responses, qualitative interviews completed with platforms that ceased operations in the last year, and metadata gleaned from the execution of the 2017 Americas Alternative Finance Industry Survey.
Additionally, as this industry hits its stride and begins to mature, boundaries that were once mostly clear between alternative finance, at least by our existing definitions, and traditional banking, have blurred in the last year. Some platforms have ceased operations and transitioned to being back-end technical intermediaries for the industry or traditional banking operations. And indeed, many large platforms, such as Avant and Enova,9 have recognized the business opportunities available in leveraging their technical expertise with traditional banks to service back-end loan operations.
T H E 2 0 1 7 A M E R I C A S A LT E R N AT I V E F I N A N C E I N D U S T R Y R E P O R T
36

Entry of PlatformsThe number of platforms that have newly incorporated continued to decrease in 2016, following a peak across the Americas in 2013. Look-ing at the population of platforms that have completed the Americas Alternative Finance Industry Survey in the last two years, we are able to see that incorporations peaked first in the United States (US) in 2013, but continued to grow in Canada through 2014 and Latin America and Caribbe-an (LAC) through 2015.
Turning from incorporation to the year in which platforms began trading, we see an overall peak across the Ameri-cas in first trading in 2015. The number of newly trading platforms fell by half in 2016 across the region. First trading in the US plateaued and then peaked
in 2014 and 2015, while LAC and Can-ada have steeper peaks in 2015.
These trends may be indicative of the evolving marketplace condi-tions and regulatory developments in the Americas during the last few years. Globally, venture capital dollars raised by alternative finance companies peaked in 2015 and re-treated significantly in 2016.10 While the industry continues to grow at a rapid pace by many standards, market consolidation and the ability of incumbents to scale may be limiting opportunities for some new entrants.
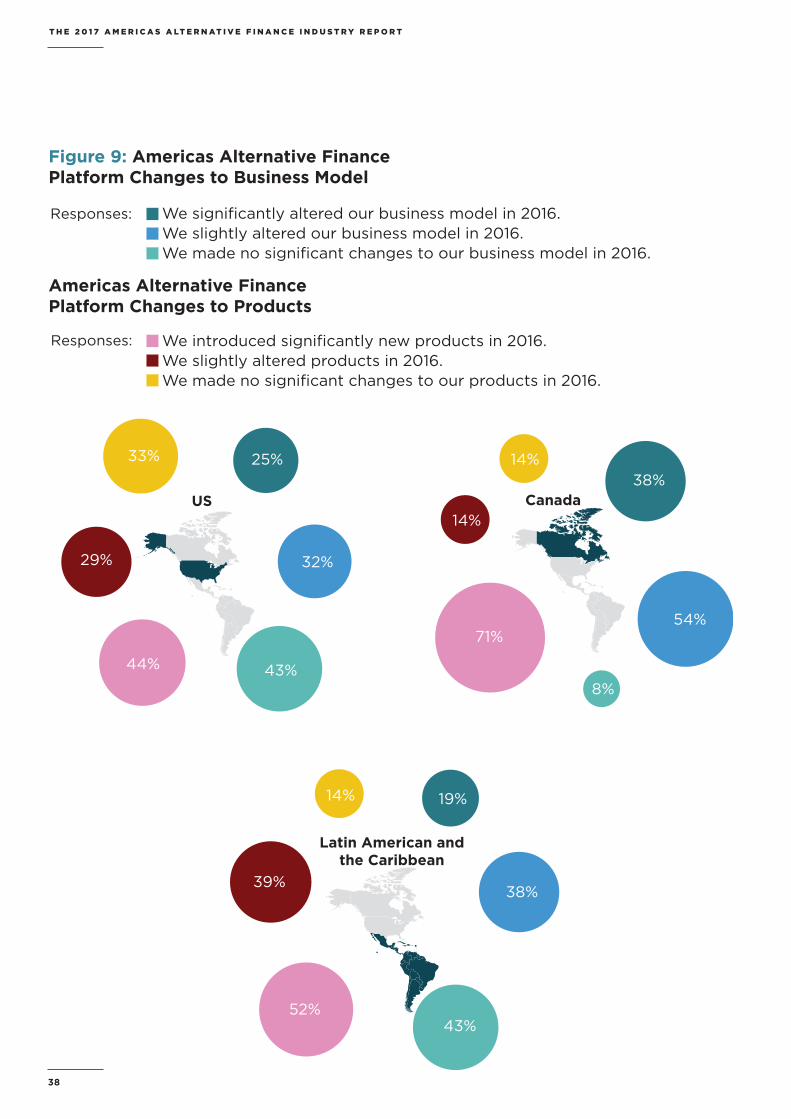
Changes to the Core Business or ProductsWhen asked explicitly if they had changed their core business, we found that in the US most re-sponding platforms indicated no significant changes to their model in 2016 (43%), followed by 32% of the platforms saying they slightly altered their business model. When we asked about new products or services, among responding plat-forms, 44% indicated that they had introduced significantly new prod-ucts or services. In Canada, 54% of responding businesses had slightly altered their model.
Similarly, for LAC, 38% of the plat-forms said that they slightly altered their model. For new products and services, LAC came in higher, with 52% of responding platforms having introduced significantly new prod-ucts or services in the last year and the remaining 39% percent indicat-ing introduction of at least a slightly altered product or service.
9 Comments made at New Developments in Consumer Finance: Research & Practice, Evanston, IL, April 27-28, 2017.10 https://www.cbinsights.com/blog/alternative-lending-FinTech-funding/
H I T T I N G S T R I D E
37
Incorporated Began trading
20
40
60
80
2017201620152014201320122011Pre-2011
Figure 8: Americas Alternative FinancePlatforms Year Incorporated vs. Year Trading
T H E 2 0 1 7 A M E R I C A S A LT E R N AT I V E F I N A N C E I N D U S T R Y R E P O R T
38
Americas Alternative Finance Platform Changes to Business Model
Americas Alternative Finance Platform Changes to Products
We slightly altered our business model in 2016.
We slightly altered products in 2016.
Responses:
Responses:
Latin American andthe Caribbean
US Canada
33% 25%38%
54%
8%
71%
19%
38%
43%52%
39%
14%
14%
14%
32%
43%44%
29%
Figure 9: Americas Alternative FinancePlatform Changes to Business Model
Americas Alternative Finance Platform Changes to Business Model
Americas Alternative Finance Platform Changes to Products
We slightly altered our business model in 2016.
We slightly altered products in 2016.
Responses:
Responses:
Latin American andthe Caribbean
US Canada
33% 25%38%
54%
8%
71%
19%
38%
43%52%
39%
14%
14%
14%
32%
43%44%
29%
Americas Alternative FinancePlatform Changes to Products
Churn in the IndustryIn the past couple of years, the alterna-tive finance industry has undergone a lot of change and growth. As of 2017, we have tracked 105 platforms that can be verified explicitly as becoming inactive in the past three years with 79 in the US, 7 in Canada and 18 in LAC. While a formal out-of-business survey was not administered, in an effort to gather additional qualitative information about some of the factors behind platform exit, 80 platforms that had become inactive were contacted to try to as-certain why their platforms had ceased operations.
Within the US, many newer platforms have struggled to pass regulatory hurdles both at federal and state lev-els while raising capital for growth and expansion. As will be further discussed later in the report, regulatory agencies have tightened their policies and in-creased the number of requirements
for new alternative finance companies entering the market.
Some alternative finance platforms that had exited recently also reported problems competing with the traditional banking system in certain areas. Some competition has been explicit as banks entered once “marginalized” markets. In other cases, the recovery of the broader economy since the Financial Crisis has meant a generalized return of liquidity to certain markets and pushed down some market rates. In the words of one recently closed platform, “Banks had eased their lending practices and provided a more efficient way for a real estate purchaser to access capital than through our platform. Thus, the market opportunity for the platform no longer existed.” Several testimonies from re-cently closed US platforms also empha-sized perceived increases in competition within the alternative finance industry itself.
H I T T I N G S T R I D E
39

THE USE OF ONLINE ALTERNATIVE FINANCE BY BUSINESSESThe use of online alternative finance by businesses across the Americas continues to grow at a rapid pace. In 2016, 218,188 businesses across the Americas utilized $9.2 billion in total online alternative business financing.
T H E 2 0 1 7 A M E R I C A S A LT E R N AT I V E F I N A N C E I N D U S T R Y R E P O R T
40
While the largest number of business fundraisers (143,344) were from the United States (US), business custom-ers were increasingly common in Lat-in America and the Caribbean (LAC) (67,499) and considerably fewer com-ing from Canada (7,345). Total volumes across the three geographies was also not surprisingly distributed unevenly, with US business funding totaling $8.8 billion, LAC coming in relatively less at $233.8 million, and Canada at $169.7 million.
In this report, alternative business funding includes transactional volumes from both investment and non-invest-ment based models, including Market-place/P2P Business Lending, Balance Sheet Business Lending, Equity-based Crowdfunding, and Revenue-sharing Crowdfunding, along with portions of the Marketplace/P2P Property Lend-ing,11 Real Estate Crowdfunding,12 and Reward-based Crowdfunding.13 While some models explicitly serve only businesses, we are also able to estimate business served by all models because all platforms were given the explicit opportunity on the questionnaire to report fundraisers served generally, as well as business fundraisers specifical-ly. Through these two questions, plat-form-specific business finance volumes and fundraisers were calculated in order to understand the reach of alternative finance among businesses in the Amer-icas. For Reward-based Crowdfunding platforms whose data, in many cases, was pulled via web-scraping, a standard 35% allocation of financing and fundrais-ers was attributed to business finance.14
Investment-based models made up the largest share of total business volume, with debt-based models driving the vast majority of finance. Across the Ameri-cas, debt-based models accounted for
The Emergence of Revenue Sharing
2016 was a big year for the emer-gence of Revenue-Sharing Crowd-funding. In 2015, we captured one platform across the Americas in this model; in 2016, we captured 12 platforms reporting total funding of $28.5 million. Revenue Sharing is a new type of debt business financing that borrows some ele-ments from equity models. Re-payment agreements are typically written to adjust repayment terms based on business revenues, allow-ing greater flexibility for business-es. While the bulk of the platforms in this space were in the US, Ca-nadian platforms reported serving more than 2,000 businesses in the last year, indicating potential-ly strong seeds being planted for this segment of the industry in the Americas for the future.
just over $8 billion, while equity-based models accounted for $891.1 million. Debt-based models include lending plat-forms (such as Marketplace/P2P Busi-ness Lending), while Equity-based mod-els include Equity-based Crowdfunding and applicable business volumes from the Real Estate Crowdfunding model.15
In the US, debt-based models accounted for $7.7 billion. Balance Sheet Business Lending in 2016 accounted for 78% of debt-based business volume, from $2.2 billion in 2015 up to $6 billion this year. By contrast, Marketplace/P2P Business Lend-ing drove much of the US volume; howev-er, in 2016, this model accounted for just 17%, generating $1.3 billion (a downward shift from 2015’s $2.5 billion volume).
10 Surveyed platforms provided a breakdown of volumes attributed to businesses. 11 Ibid12 Ibid13 This study followed the methodology used in the CCAF UK and Asia-Pacific study, which also attributed 35% of web-scrapped data towards business finance. 14 It should be noted, this survey allowed real-estate focused platforms to denote their debt-based or equity-based volumes and activity by segmenting them into either Real Estate Crowdfunding or Marketplace/P2P Property Lending.15 It should be noted, this survey allowed real-estate focused platforms to denote their debt-based or equity-based volumes and activity by segmenting them into either Real Estate Crowdfunding or Marketplace/P2P Property Lending.
H I T T I N G S T R I D E
41

Some of this shift may reflect a change in the participating survey companies, but a majority of the shift appears to reflect the rapid growth in the Balance Sheet Business Lending model from existing organic growth as well as diversification by platforms that have altered their un-derlying model. Platforms are increasingly hybrid platforms, operating in more than one model. Many Marketplace/P2P lend-ing platforms now utilize a balance-sheet approach to supplement origination not sustained exclusively by the orthodox Marketplace/P2P Lending approach.
In 2016 equity-based models accounted for $867.6 million, down from the $1.1 billion in 2015. Despite an overall decline in growth in this model in the last year, the Equity-based Crowdfunding mod-
el accounted for 63% of equity-based business volume. The emerging Regu-lation Crowdfunding (RegCF)-enabled platforms are a key component of this segment of the industry, but with many not emerging until the last part of 2016, there were not enough deals to cause a bump overall in 2016. The Real Estate Crowdfunding model accounted for 37% of business finance, providing $318.5 million to businesses.16
Although US-based alternative finance platforms drove the region’s business volumes, from year-to-year basis, the growth rate reflects considerable slow-down. From 2015 to 2016, debt-based models grew 37%, while equity-based models contracted by 18%, both down from 2014-15.
16 This figure makes up 39% of the total United States Real Estate Crowdfunding volume in 2016, as $488 million from this model did not derive from a business fundraiser.
T H E 2 0 1 7 A M E R I C A S A LT E R N AT I V E F I N A N C E I N D U S T R Y R E P O R T
42
US Alternative Finance provided to Businesses throughInvestment-based models 2014-2016 ($USD)
Debt-based models Equity-based models
2
4
6
8
$10 billion
201620152014
$2.2B
$0.9B$5.6B
$1.1B
$7.7B
$0.9B
Figure 10: US Alternative Finance provided to Businesses through Investment-based models 2014-2016 ($USD)
In Canada, 7,345 businesses received $169 million in finance through alterna-tive finance platforms. Approximate-ly 85% of this volume was driven by platforms operating in the deb-based segment (accounting for $144.2 million). In particular, the Balance Sheet Business Lending models contributed $103.3 mil-lion to business fundraisers, accounting for approximately 72% of all debt-based finance to Canadian businesses. Interest-ingly, Marketplace/P2P Business lending platforms only accounted for 16% of the
debt-based volume, with the remaining 22% derived from business fundraisers utilizing a con-sumer lend-ing platform to support their business financing needs. In the case of equity funding, 100% of Canadian equity-based business finance came from Equi-ty-based Crowdfunding, signaling that
Real Estate Crowdfunding in Canada is not being utilized by small businesses. Equity-based Crowdfunding accounted for $13.1 million, or 8% of all business finance in Canada.
Unlike the rest of the region, a consid-erable proportion of business finance in Canada is derived from the non-invest-ment models, accounting for approxi-mately $12.3 million (or 7% of all busi-ness funding). Canada’s non-investment based models, driven primarily by the Reward-based Crowdfunding, is almost as large as their entire equity-based market, signaling that Canada remains relatively nascent when compared to
other developed nations in the state of its business finance ecosystem.
Across LAC, $233.8 million in alter-native finance was utilized by 67,499 businesses in 2016, with 98% (or $228.4 million) of business volumes stem-ming from investment-based models in debt or equity. Debt-based models accounted for $218.4 million in 2016, while equity-based models accounted for $10.4 million. Although accounting for considerably less business volume as compared to the US, online alternative finance geared towards businesses grew considerably on a year-to-year basis, with an average growth of 188% from debt-based business finance from 2015’s $75.7 million. Following the regional trend, equity-based finance contracted by 38% in 2016, from $16.9 million in 2015. Nevertheless, investment-based models contributed 147% more finance in 2016 to businesses across LAC.
Over two-thirds (71%) of LAC business finance comes from Chile ($97.1 million) and Mexico ($69.5 million). Chile gener-ated 42% of the region’s business vol-ume, leading in non-investment-based business finance ($2.8 million) and debt-based finance ($92.9 million). Mexico led equity-based business finance, generat-ing approximately $4.9 million (or 48% of the segment).
With respect to debt-based business finance, unlike the US and Canada, the Marketplace/P2P Business Lending model accounted for 86% of the volume ($188.5 million), suggesting that LAC platforms still rely heavily on individual investors to support origination. The Balance Sheet Business Lending ac-counted for only 10% of the debt-based business finance.
The Equity-based Crowdfunding model accounts for 70% of the equity-based business finance in the region, with the remaining 30% derived from the Real Estate Crowdfunding model, primarily from Mexican platforms.
Unlike the rest of the region, a considerable proportion of
business finance in Canada is
derived from the non-investment
models.
H I T T I N G S T R I D E
43

Key Industries and Sectors Utilizing Alternative financeLooking in more detail at the businesses utilizing alternative finance in the US, we found that 20% of the platforms re-sponded that their most funded industry was Real Estate & Housing. This was fol-lowed by a 12% response rate for Tech-nology, a 10% response rate for Food & Drink, and 7% for Film & Entertainment and Retail & Wholesale.
For Canada, there was a 21% response rate for Technology as the most fund-ed industry. This was followed by a 14% response rate for Community & Social Enterprise, Food & Drink, Inter-net & E-Commerce, and Real Estate & Housing industries. In LAC, the most funded industry was Technology with a 12% response rate. The second and third most funded industries were Business & Professional Services and
Manufacturing & Engineering with a 9% response rate. This was followed by Construction with an 8% response rate.
The top three funded sectors for Bal-ance Sheet Business Lending models includes Retail & Wholesale (33%), Con-struction (23%) and Internet & E-com-merce (16%). Similarly, the Marketplace/P2P Business Lending model’s top fund-ed sectors include Construction (31%), Retail & Wholesale (26%) and Business & Professional Services (18%).
Much like the incumbent VC market, the Equity-based Crowdfunding model has a high proportion of funded businesses from the Technology sector (47%) and Internet & E-commerce sector (35%). In third place for this model, businesses from the Finance sector made up 16% of fundraisers.
T H E 2 0 1 7 A M E R I C A S A LT E R N AT I V E F I N A N C E I N D U S T R Y R E P O R T
44
LAC Alternative Finance provided to Businesses throughInvestment-based models 2014-2016 ($USD)
Debt-based models Equity-based models
50
100
150
200
$250 million
201620152014
$16.9M
$75.7M
$10.4M
$218M
$11.8M$1.3M
Figure 11: US Alternative Finance provided to Businesses through Investment-based models 2014-2016 ($USD)

The Revenue-sharing model tends to finance businesses from the Retail & Wholesale sector (36%), Food & Drink (36%) and Technology (19%). As busi-nesses from this sector tend to be consumer facing, and rely heavily on sales, it is not surprising that business from these sectors gravitate towards this model.
Looking to non-investment-based models, the top three sectors from the Reward-based Crowdfunding model included Art, Music & Design, Technology and Film & Entertainment. This is not all together surprising, as businesses in these sectors are easy for retail investors to understand and relate to.
Figure 12: Americas Alternative Finance Top Funded Industry sectors in 2016
United States
Real Estate & Housing
Technology
Food & Drink
Film & Entertainment
Retail & Wholesale
Canada
Technology
Community & Special Enterprise
Food & Drink
Internet & E-commerce
Retail Estate & Housing
Latin America & the Caribbean
Technology
Business & Professional Services
Manufactoring & Engineering
Construction
Other
H I T T I N G S T R I D E
45
MARKET FUNDAMENTALS OF ONLINE ALTERNATIVE FINANCE IN THE AMERICASAs we look beyond the top-line numbers of the industry and try to gather additional insights into how alternative finance platforms operate, we will examine the following topics: institutionalization, stakeholder arrangements, referral partnerships, auto-bid/auto-selection, female participation and interstate activity within the United States (US) and Latin America and the Caribbean (LAC).
InstitutionalizationA hallmark of the US online alternative fi-nance market is the continued dominance of institutional investors in the market. The US market markedly differs from other glob-al alternative finance marketplaces in that institutional investors (such as funds, banks and asset management firms) have always played a significant role in providing finance to borrowers and issuers. Unlike the UK, EU or Asia-Pacific market, where the investor co-hort is primarily composed of retail investors (i.e. individuals), US alternative finance mod-els have traditionally relied more heavily on institutional participation, due in large part to regulation which restricts or curtails accred-ited and non-accredited investor involvement. In 2016, approximately $19 billion, or 55% of the total US alternative finance volume, came
from institutional investors, up slightly from an estimated $17.3 billion in 2015. Despite an overall increase in terms of dollar value from $17.3 billion last year, it is significant to note that proportionally, institution-led US alter-native finance volume has declined slightly, from 66% in 2015 to 55% in 2016.
When analyzing US institutionalization by model, certain models rely heavily on institutional investors, while others have a more diversified investor base. US Balance Sheet Consumer Lending platforms reported 95% of their total volume derived from finance provided by an institutional investor. On the contrary, Balance Sheet Business Lending reported only 39% of their total volume coming from institutions in 2016, a stark differ-ence from 94% in 2015.
T H E 2 0 1 7 A M E R I C A S A LT E R N AT I V E F I N A N C E I N D U S T R Y R E P O R T
46

US Marketplace/P2P lending models reported significant volumes stemming from institutional participation, with 67% of Marketplace/P2P Business Lending and 57% of Marketplace/P2P Property Lending volumes derived from institu-tional investors. Yet, when compared to the previous year, the proportion of institutional finance has somewhat lessened for the Marketplace/P2P Prop-erty Lending model (previously 73%) and Marketplace/P2P Business Lending model (previously 72%). However, the Marketplace/P2P Consumer Lending
model reported 70% of volume derived from institutional investors, up from 53% in the previous year.
US Equity-based Crowdfunding and the Real Estate Crowdfunding both saw relatively smaller involvement from institutional investors, with 21% and 44%, respectively. When compared to the previous year, Equity-based Crowdfund-ing shifted down marginally, from 27% to 21%, while institutional investor activity in the Real Estate Crowdfunding model swelled from 7% last year.
In the US, results suggest greater par-ticipation of non-accredited investors in the alternative finance market in 2016. For instance, in Marketplace/P2P Con-sumer Lending, 75% of volume from investors can be attributed to non-ac-credited individuals, with the remaining 25% coming from accredited investors.
Similarly, accredited investors account for only 38% of transactions from Mar-ketplace/P2P Property Lending and 27% of Marketplace/P2P Business Lending.
Other US models remain more domi-nated by accredited investors. Just 6% of Marketplace/P2P Business Lending
H I T T I N G S T R I D E
47
Marketplace/P2P Consumer Lending
Balance Sheet Consumer Lending
Marketplace/P2P Business Lending
Balance Sheet Business Lending
Marketplace/P2P Property Lending
Equity-based Crowdfunding
Real Estate Crowdfunding
70%
53%
67%
72%
21%
27%
44%
7%
39%
57%
73%
94%
95%
99%
20162015
Figure 13: Americas Alternative Finance Proportion of Institutional Investor Activity by Model

volumes derive from individuals that are non-accredited. Of the crowdfunding models, 58% of the Real Estate Crowd-funding volume and 71% of the Equi-ty-based Crowdfunding model come from accredited individuals, with only 15% of the Equity-based Crowdfunding model derived from non-accredited indi-viduals. Though 15% might seem unre-markable, this figure will likely increase in the coming year due largely to the ability for platforms to utilize RegCF or Title III of the Jobs Act.
Across Latin America and the Caribbean (LAC), participation from institutions has been on the rise, with approximately 69% ($236 million) of LACs total volume stemming from institutional investors in 2016. This is a significant increase com-pared to last year’s 37% of LAC’s total volume.
In particular, two models stand-out in terms of institutional investor partici-pation in LAC: Balance Sheet Business Lending (with 85% of the model’s volume derived from institutional investors) and Balance Sheet Consumer Lending (93%). It should be noted, these two models emerged in LAC only in 2016, so there are no comparable data points for 2015.
While volume in LAC is certainly being driven by institutions, individual inves-tors remain the dominant force in many non-balance sheet models. The Mar-ketplace/P2P Business Lending model reported 14% of volume facilitated by institutional investors, Marketplace/P2P Consumer Lending reported 16% and Marketplace/P2P Property Lending reported 26%. Equity-based Crowdfund-ing registered 11%, though this figure is up from 5% last year.
T H E 2 0 1 7 A M E R I C A S A LT E R N AT I V E F I N A N C E I N D U S T R Y R E P O R T
48
Marketplace/P2P Consumer Lending
Balance Sheet Consumer Lending
Marketplace/P2P Business Lending
Balance Sheet Business Lending
Marketplace/P2P Property Lending
Equity-based Crowdfunding
Real Estate Crowdfunding
16%
56%
14%
53%
11%
5%
0%
0.8%
85%
26%
0.9%
*
*Model did not exist
93%
*
20162015
Figure 14: LAC Alternative Finance Proportion of Institutional Investor Activity by Model
Across LAC, the status of individu-al investors is heavily skewed to the non-accredited. This is not to suggest that these individuals lack financial sophistication, but simply that there are likely fewer regulatory restrictions on the types of individuals that can partic-
ipate in the alternative finance space. In the case of Marketplace/P2P Consumer Lending (81%), Marketplace/P2P Busi-ness Lend-ing (79%), Real Estate Crowdfunding (100%) and Equity-based Crowdfunding (89%), the clear majority of investor participation
came from non-accredited investors in LAC. Accredited investor participation is less remarkable, with Marketplace/P2P Consumer Lending registering 13% accredited participation, Marketplace/P2P Business Lending at 26% and Eq-uity-based Crowdfunding at 37%. The only model which had majority accred-ited participation was Marketplace/P2P Property Lending at 66%.
Stakeholder ArrangementsAcross the Americas, approximately 40% of responding platforms indicated no major dilution in equity stakes by minority or majority outside stakeholder investors. Among those that reported outside stakeholder investors, nearly all the US platforms indicated some involvement from a venture capital firm or angel investor. Indeed, 11% of all responding US platforms indicated a majority shareholder that is a VC or angel investor. Of those platforms, none reported also having majority or minori-ty shareholder agreements with tradi-tional financial institutions. But when examining the larger set of platforms – 38% of the US respondents – that indicated they had a minority sharehold-er that was a VC or an angel investor, then roughly a quarter also had minority shareholders that were in the traditional finance sector. In Canada, it was most common (31%) to have a majority share-holder that is a VC or a business angel. For LAC, it was most common (27%) to use a minority shareholder that’s either a VC or a business angel.
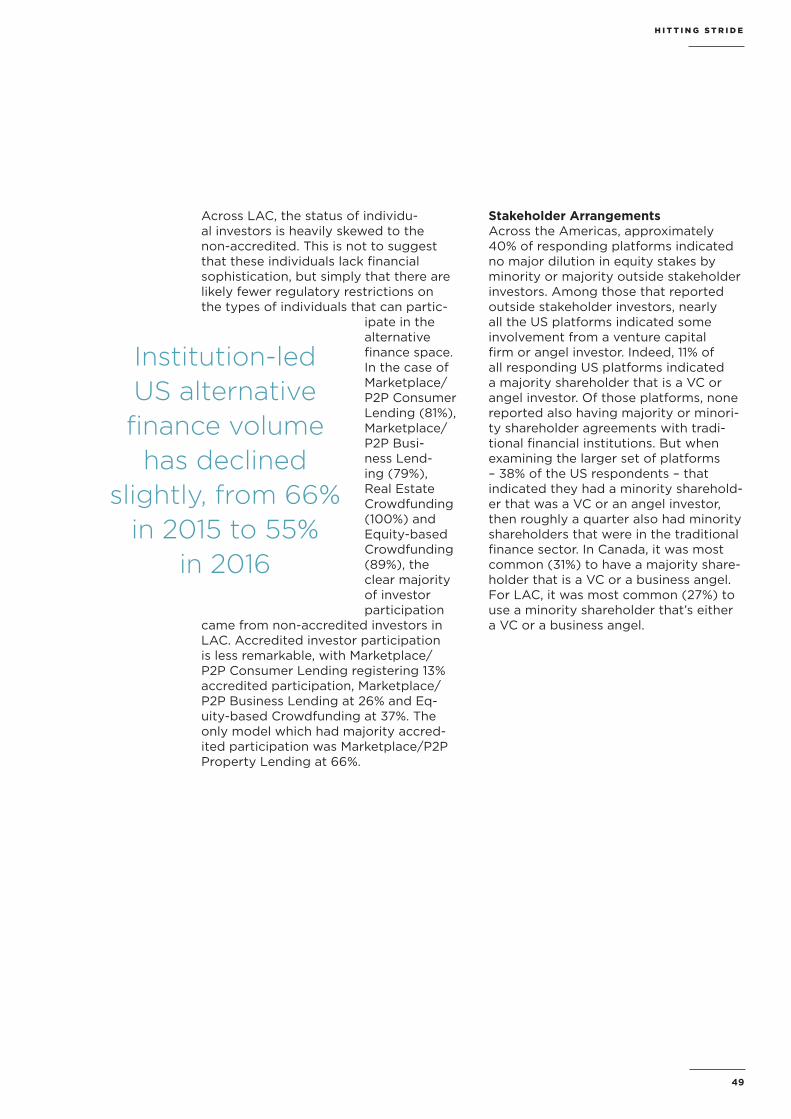
Institution-led US alternative finance volume
has declined slightly, from 66%
in 2015 to 55% in 2016
H I T T I N G S T R I D E
49

T H E 2 0 1 7 A M E R I C A S A LT E R N AT I V E F I N A N C E I N D U S T R Y R E P O R T
50
Latin Americaand the Caribbean
12%
Canada
8%
US
21%
Americas Alternative Finance Platform Stakeholder Structure
A majority shareholder that is a VC or a business angelA majority shareholder that is a fund
A minority shareholder that is either a VC or a business angel
Responses:
A minority shareholder that is a fund
OtherNot applicable
11%
31%
15%
8%
23%
8%
31%
8%12%
2%
3%
8%
26%2%
3%
40%
11%
38%9%
2%
2%
3%
33%
Figure 15: Americas Alternative FinancePlatform Stakeholder Structure

Referral Partnership ArrangementsPlatforms were asked to describe the type of referral partnership arrange-ments they had with external busi-nesses or organizations to help drive deal flow and, ultimately, origination. To ensure robust sector development, growth is contingent upon sufficient and high-quality fundraisers (i.e. busi-nesses and individuals). The issue of deal flow and origination is not simply attracting potential fundraisers, but do-ing so in a targeted manner to ensure low conversion costs and efficiency. By promoting a structure that uses a vari-ety of channels to acquire fundraisers, a platform can build a highly diver-sified source of deal flow, attracting high-quality individuals, businesses and projects to their platform.
When assessing the region at a mac-ro-level, it was most common for platforms to not utilize a referral part-nership of any kind in 2016; however, referral partnerships through a broker were sighted in the US (16%), Canada (25%), and LAC (10%). In LAC, 10% of respondents also reported E-Commerce Credit referrals.
Yet, when reviewing specific models, the emergence of referral arrangements exists with more frequency. For in-stance, 20% of marketplace/P2P Con-sumer Lending platforms have arrange-ments with e-commerce platforms to bolster deal flow. Similarly, student-fo-cused partnerships and finance brokers are utilized by 15% of these platforms. Correspondingly, 10% of Balance Sheet Consumer Lending platforms utilized a student-credit arrangement, while 15% made use of referrals from Financial Advisers.
With respect to the business-focused models, Marketplace/P2P Business Lending platforms made use of referral mechanisms to bolster deal flow from brokers (22%) and financial advisors (19%), and to a lesser extent, e-com-merce credit partnerships (11%) to sup-port origination. Interestingly, platforms
operating in the Balance Sheet Business Lending space rely heavily on broker referral partnerships (52%). Instances of platform partnerships with e-commerce hubs was approximately 22%. Finally, 71% of platforms operating within the Revenue-Sharing/Profit-Sharing Crowd-funding model had a referral arrange-ment with a financial advisor.
Auto-Bid Selection While the early alternative finance mod-els predominantly relied upon investors to self-select their investments, auto-mated selection has become common place in how institutional and individual investors participate in crowdfunding and marketplace/P2P lending plat-forms.
Auto-bid selection moves away from manual or self-selection (e.g. choosing a loan to lend to on a marketplace/P2P lending platform) towards automat-ed tools which allocate investor funds automatically to available loans or deals based on investment or lending pref-erences. While the investors specify their risk appetite, desired deal struc-ture, and investment preferences, they no longer personally review individual investment decisions.
Since Marketplace/P2P Consumer Lending first appeared in the US (and globally) it has been based upon au-to-bid selection and its strong-hold as a volume-driving model exemplifies the effectiveness of auto-bid functionality. 99% of all Marketplace/P2P Consumer Lending was fulfilled in 2016 through auto-bid processes. Fundamentally, this model standardized auto-bid invest-ment to allow the platform to auto diversify a lender’s portfolio across available loans, while also improving market efficiencies by assuring faster loan consideration and fulfilment.
Unlike Marketplace/P2P Consumer Lending, other lending models devel-oped without auto-bid selection, em-phasizing manual selection – where an individual or institutional investor select
H I T T I N G S T R I D E
51

each and every investment opportunity they wish to participate in. In this case, the investor must score the available deals on a platform, and either bid auc-tion-style to participate in the loan, or commit funds to a fixed deal and wait until the loan is fulfilled by other peers for the funds to be drawn down.
In 2016, Marketplace/P2P Business Lending registered a 30% usage of auto-bid functions across the region, while Marketplace/P2P Property Lend-ing platforms recorded only 8% of auto-bid usage. This figure is not all-to-gether surprising as the Marketplace/P2P Property Lending model is heav-ily utilized by institutional investors. Auto-bid functions tend to be utilized most by accredited and non-accredited individuals, as they are often time-poor and may lack the selection expertise inherent in institutional investors.
Outside of the lending space, Equi-ty-based Crowdfunding has also seen an increase in the use of auto-selection functionality. Across the Americas, 39% of platforms noted that investors used auto-selection when expanding their portfolio on the platform. Akin to the lending platforms, the use of auto-bid-ding changes the relationship between the investor and the platform from passive to active, acting more like a fund or portfolio manager than simply a matching site.
By moving towards auto-bid selec-tion, both investor and borrower have greater certainty that a deal will be completed quicker. From a platform’s perspective, this is highly desirable, as origination can occur at a faster pace. However, heavier reliance on auto-bid selection also poses new challenges to platforms. As the platform is responsi-ble for selecting and matching investors to appropriate deals, the importance of
due-diligence, underwriting, credit-risk scoring and management is paramount. A platform must ensure that their own underwriting and credit analytics are sufficiently robust to ensure that the investor is safeguarded against unnec-essary or unreasonable risk.
Female Market Participation within Models and GeographiesFinancial inclusion has become an im-portant topic when discussing the stake-holders in alternative finance. Across the Americas, the demographics of both funders and fundraisers indicates that women are utilizing alternative finance channels, albeit at a lesser proportion than their male counterparts.
In non-investment-based models, wom-en make up the majority of fundraisers (71%) in Donation-based Crowdfunding, and account for 50% of Reward-based Crowdfunding. Women also provide significant funding through these models, noting 32% female funders in Reward-based Crowdfunding and 65% female funders from the Dona-tion-based Crowdfunding. Among investment-based models, we note a significant amount of female participa-tion from several models. In particular, women make up 35% of investors for both Real Estate Crowdfunding and Marketplace/P2P Property Lending, and make up 36% of Marketplace/P2P Consumer lenders.
With respect to fundraising, female borrowers seem to be most active in Balance Sheet Consumer Lending, Marketplace/P2P Consumer Lending, Balance Sheet Business Lending, and Marketplace/P2P Business Lending accounting for 43%, 39%, 36%, and 30% of borrowers, respectively. Equi-ty-based Crowdfunding remains male dominated in terms of both funders and fundraisers.
T H E 2 0 1 7 A M E R I C A S A LT E R N AT I V E F I N A N C E I N D U S T R Y R E P O R T
52
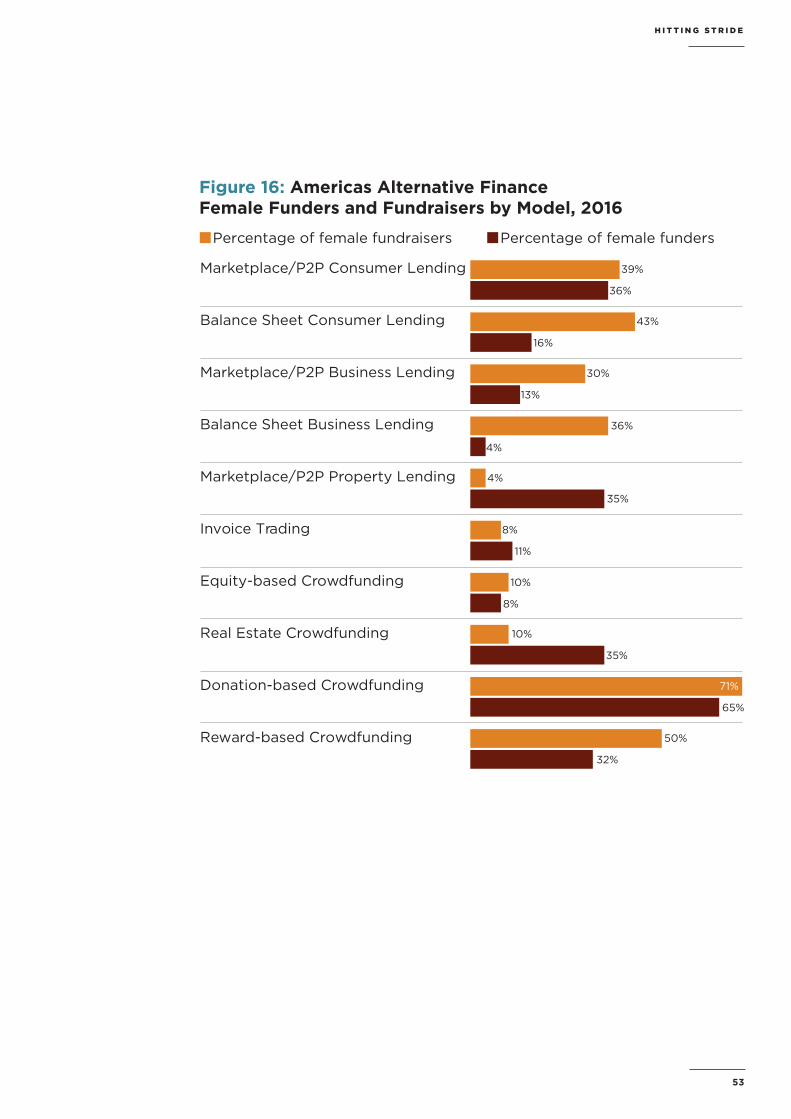
H I T T I N G S T R I D E
53
Marketplace/P2P Consumer Lending
Balance Sheet Consumer Lending
Marketplace/P2P Business Lending
Balance Sheet Business Lending
Marketplace/P2P Property Lending
Invoice Trading
Equity-based Crowdfunding
Real Estate Crowdfunding
Donation-based Crowdfunding
Reward-based Crowdfunding
39%
36%
30%
13%
8%
11%
10%
8%
10%
35%
65%
50%
32%
36%
4%
35%
4%
43%
16%
Percentage of female fundraisers Percentage of female funders
71%
Figure 16: Americas Alternative FinanceFemale Funders and Fundraisers by Model, 2016
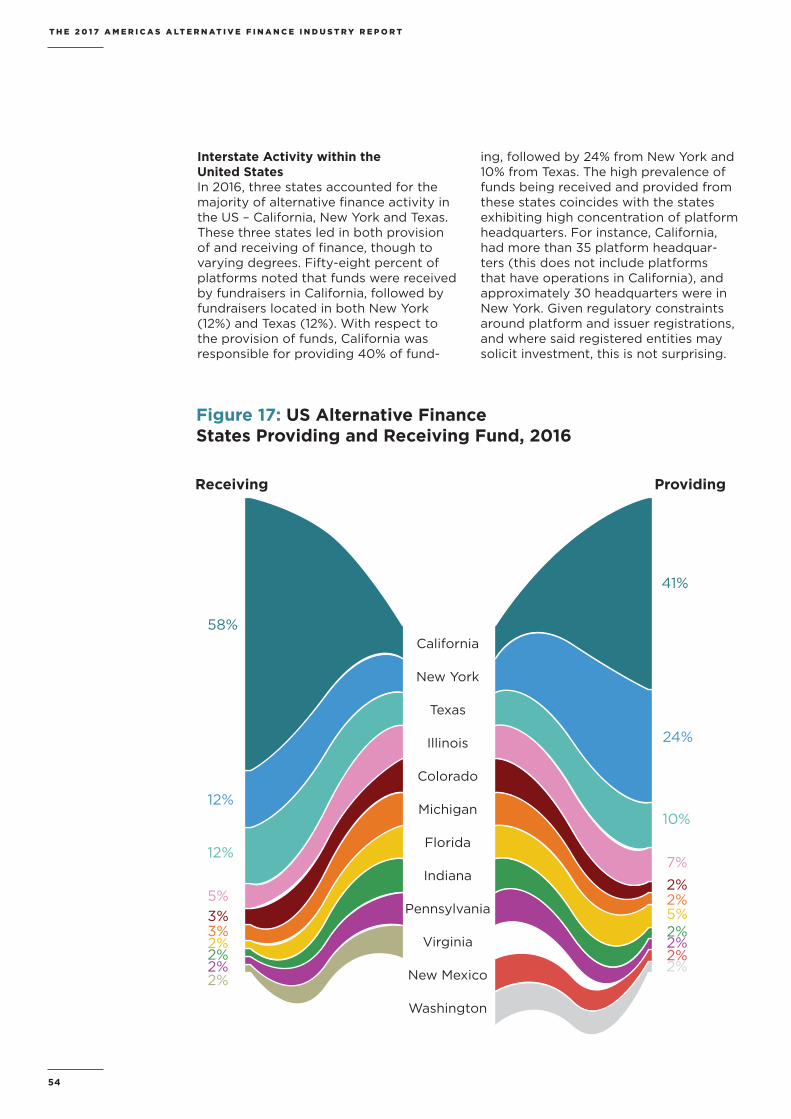
Interstate Activity within the United States In 2016, three states accounted for the majority of alternative finance activity in the US – California, New York and Texas. These three states led in both provision of and receiving of finance, though to varying degrees. Fifty-eight percent of platforms noted that funds were received by fundraisers in California, followed by fundraisers located in both New York (12%) and Texas (12%). With respect to the provision of funds, California was responsible for providing 40% of fund-
ing, followed by 24% from New York and 10% from Texas. The high prevalence of funds being received and provided from these states coincides with the states exhibiting high concentration of platform headquarters. For instance, California, had more than 35 platform headquar-ters (this does not include platforms that have operations in California), and approximately 30 headquarters were in New York. Given regulatory constraints around platform and issuer registrations, and where said registered entities may solicit investment, this is not surprising.
T H E 2 0 1 7 A M E R I C A S A LT E R N AT I V E F I N A N C E I N D U S T R Y R E P O R T
54
Figure 17: US Alternative FinanceStates Providing and Receiving Fund, 2016US Alternative Finance States Providing and Receiving Fund
in 2016
Receiving Providing
California
New York
Texas
Illinois
Colorado
Michigan
Florida
Indiana
Pennsylvania
Virginia
New Mexico
Washington
58%
12%
12%
24%
10%
5%
7%
3%
2%
3%
2%
2%
5%
2%2%2%
2%2%2%2%
41%

H I T T I N G S T R I D E
55
US Alternative Finance States Providing and Receiving Fundin 2016
Receiving Providing
California
New York
Texas
Illinois
Colorado
Michigan
Florida
Indiana
Pennsylvania
Virginia
New Mexico
Washington
58%
12%
12%
24%
10%
5%
7%
3%
2%
3%
2%
2%
5%
2%2%2%
2%2%2%2%
41%

COUNTRY-SPECIFIC MODEL TRENDS
Over the course of 2016, growth of alternative finance models in the Unit-ed States (US) has varied sizeably, with some models growing considerably and others contracting.
The Marketplace/P2P Consumer Lending model remains the prevailing online alter-native finance model in the US, account-ing for 61% of the US market. In 2016, this model generated $21.1 billion, growing by 17% from the past year. Given the con-tinued growth of this model, it is notable that the growth did not come in 2016 to all US consumer markets, with Balance Sheet Consumer Lending decreasing year-on-year (4%) to $2.9 billion. Interest-ingly, one-third of Balance Sheet Consum-er Lending platforms also operated within Marketplace/P2P Lending. So, while this particular model segment decreased, over-all consumer lending finance in the US has grown. The 2016 average loan size17 for the Marketplace/P2P Consum-er Lending in the US was approximately $28,000 compared to $19,000 for Bal-ance Sheet Consumer Lending.
The US model with the fastest year-on-year growth rate was Balance Sheet Business Lending, growing at a remark-able 167% from $2.3 billion in 2015 to $6 billion in 2016. Growth was driven pri-marily by growth from firms continually observed by the research team but also by new survey responders. Interestingly, while the Balance Sheet model exhibit-ed triple-digit growth, Marketplace/P2P Business Lending experienced the most significant year-on-year contraction,
decreasing by 49% from $2.6 billion in 2015 to $1.3 billion in 2016.18
Turning to real estate and property, most US platform operate both lend-ing-based and equity-based activities. 50% of platforms from the Marketplace/P2P Property Lending model also partic-ipating in the Real Estate Crowdfunding model. Both of these models grew in 2016,19 with Marketplace/P2P Property Lending growing by 33% from $782 million to just over $1 billion in 2016. Real Estate Crowdfunding grew at a more rapid pace (72%) from $468 million in 2015 to $807 million in 2016.
Given the considerable size of Market-place/P2P Property Lending in the US, it should be noted that the role a platform’s balance sheet plays in origination. Though our taxonomy does not include a unique “Balance Sheet Property Lending" model,20 that does not mean that Marketplace/P2P Property Lending platforms don’t rely heavily on their balance sheets. Indeed, 67% of participating platforms indicated proportions of their activity was balance sheet-based. Additionally, platforms from the Marketplace/P2P Property Lending space readily made use of referral part-nerships to drive deal flow. In this in-stance, platforms primarily partnered with a traditional finance broker (50%) and/or a mortgage specialist (60%).
Equity-based Crowdfunding saw a slight decline in the US during 2016, down 7% against the previous year. This decline is likely related to continued regulatory un-
United States
17 Unweighted Average18 Due to a small sample size, we were unable to breakout Invoice Trading as a unique category in 2016. As such, volumes from this model have been included in the 2016 Marketplace/P2P Business Lending model. Invoice Trading platforms operating experienced a 5% growth from 2015 to 2016 with respect to their volume. 19 Interestingly, only 16% of Real Estate Crowdfunding platforms also operated in the Marketplace/P2P space. 20 The responses captured by unique platforms was not sufficiently robust to present as a unique model type.
T H E 2 0 1 7 A M E R I C A S A LT E R N AT I V E F I N A N C E I N D U S T R Y R E P O R T
56
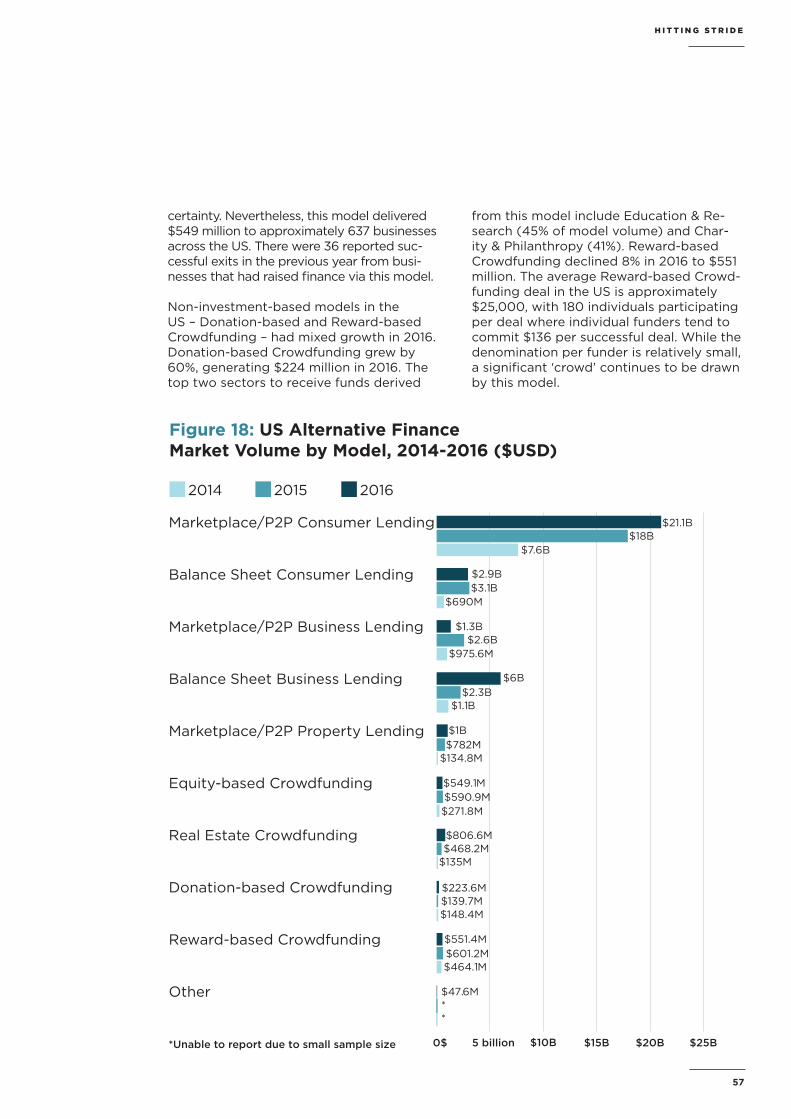
certainty. Nevertheless, this model delivered $549 million to approximately 637 businesses across the US. There were 36 reported suc-cessful exits in the previous year from busi-nesses that had raised finance via this model.
Non-investment-based models in the US – Donation-based and Reward-based Crowdfunding – had mixed growth in 2016. Donation-based Crowdfunding grew by 60%, generating $224 million in 2016. The top two sectors to receive funds derived
from this model include Education & Re-search (45% of model volume) and Char-ity & Philanthropy (41%). Reward-based Crowdfunding declined 8% in 2016 to $551 million. The average Reward-based Crowd-funding deal in the US is approximately $25,000, with 180 individuals participating per deal where individual funders tend to commit $136 per successful deal. While the denomination per funder is relatively small, a significant ‘crowd’ continues to be drawn by this model.
H I T T I N G S T R I D E
57
Figure 18: US Alternative FinanceMarket Volume by Model, 2014-2016 ($USD)
Marketplace/P2P Consumer Lending
Balance Sheet Consumer Lending
Marketplace/P2P Business Lending
Balance Sheet Business Lending
Marketplace/P2P Property Lending
Equity-based Crowdfunding
Real Estate Crowdfunding
Donation-based Crowdfunding
Reward-based Crowdfunding
Other
0$ 5 billion $10B $15B $20B $25B
2014 2015 2016
$21.1B
$2.9B
$1.3B$2.6B
$975.6M
$6B$2.3B
$1.1B
$1B$782M
$134.8M
$549.1M$590.9M$271.8M
$806.6M$468.2M
$135M
$223.6M$139.7M$148.4M
$551.4M$601.2M$464.1M
$47.6M**
$3.1B$690M
$18B$7.6B
*Unable to report due to small sample size

Canada’s performance, though at a smaller scale, mirrors many of the market dynamics that characterize the US with respect to levels of institution-alization and funder sophistication. Yet, despite many similarities at a model lev-el, Canada’s alternative finance market is markedly different in that it is driven in large part by non-investment-based models. The Canadian alternative fi-nance market grew by 62%, from $207 million in 2015, to $334.5 million in 2016.
Donation-based Crowdfunding made up the largest proportion of Canadian alter-native finance, accounting for 32% of the market. This model grew to $105.9 mil-lion in 2016. Reward-based Crowdfund-ing accounted for $35.3 million in 2016, and made up 11% of Canada’s overall volume. This model is the third largest in Canada, despite contracting by 20% in 2016 (from $44.4 million in 2015).
Balance Sheet Business Lending is the second largest model in Canada, ac-counting for 31% of Canada’s alternative finance volume and growing at a triple digit rate of 282% to $103.3 million. Much like the US, business lending is driven by the balance sheet model, with Marketplace/P2P Business Lending generating a smaller overall volume in comparison. Marketplace/P2P Business Lending in Canada grew by a 45%, from $15.6 million in 2015, to $22.5 million in 2016.
The Marketplace/P2P Consumer Lend-ing contracted in 2016, down 11% to $25 million. While no exclusively Balance Sheet Consumer Lending models in Canada were captured in 2016, there is balance-sheet activity occurring, with 65% of Marketplace/P2P Consumer Lending platforms utilizing their own native balance sheet. This model is also heavily institutional, with 72% of vol-ume driven by institutional investors in Canada.
Equity-based Crowdfunding in Canada saw rapid growth in 2016, increasing 157% to $13.1 million in 2016. Finally, the fastest growing model in Canada in 2016 was Real Estate Crowdfunding, with $11 million in activity, a 1,367% increase. Due to insufficient sample size, we are unable to report volumes attributed to Marketplace/P2P Property Lending.
Canada
T H E 2 0 1 7 A M E R I C A S A LT E R N AT I V E F I N A N C E I N D U S T R Y R E P O R T
58

H I T T I N G S T R I D E
59
Marketplace/P2P Consumer Lending
Balance Sheet Consumer Lending
Marketplace/P2P Business Lending
Balance Sheet Business Lending
Equity-based Crowdfunding
Real Estate Crowdfunding
Donation-based Crowdfunding
Reward-based Crowdfunding
Other
0$ 20 million $40M $60M $80M $100M $120M
2014 2015 2016
$25.0M
*
$22.5M$15.6M
$1.6M
$103.3M$27.0M
$13.5M
$13.1M$5.1M
$60,000
$11.0M$750,000*
$105.9M$70.7M
$25.5M
$35.3M$44.4M
$42.1M
$13.4M**
$15.5M$2.50M
$28.0M$500,000
*Unable to report due to small sample size
Figure 19: Canada Alternative FinanceMarket Volume by Model, 2014-2016 ($USD)

In 2016, total alternative finance grew substantially in Latin America and the Ca-ribbean (LAC). Platform responses were received from Anguilla, Argentina, Belize, Bolivia, Brazil, Chile, Colombia, Costa Rica,
Cuba Dominica, Dominican Republic, Ecuador, El Salvador, Guam, Guatemala, Haiti, Honduras, Mexico, Nicaragua, Pana-ma, Paraguay, Peru, Puerto Rico, Uruguay, Venezuela and the US Virgin Islands.
Latin America and the Caribbean
Activity in LAC grew by 209% last year, from $110.6 million in 2015 to $342.1 million in 2016. Much of this growth was driven by a large increase in business funding, with 57% of the region’s volume coming from the Marketplace/P2P Business Lending model ($188.5 million in 2016). This model grew by 239% in 2016. In 2016, we also captured significant activity in Balance Sheet Business Lending ($22.6 million).
The second largest model across the region was Balance Sheet Consumer Lending, accounting for 22% of regional
volume and generating $73.9 million. This is the first year that we can include estimates for this model. Despite the Balance Sheet Consumer Lending’s large size, Marketplace/P2P Consumer Lend-ing is somewhat smaller, accounting for only 5% of the region’s volume in 2016.
The fastest growing model across LAC is Equity-based Crowdfunding, up 256% to $7.3 million in 2016. While Equity-based Crowdfunding experienced an overall contraction in Canada and the US, this model is thriving across LAC.
T H E 2 0 1 7 A M E R I C A S A LT E R N AT I V E F I N A N C E I N D U S T R Y R E P O R T
60
Colombia
Argentina
Peru
Chile
Mexico
BrazilOther
$56.1M
$110.6M
$342.1M
Total:
100
200
300
$400 million
201620152014
5
10
$15 million
’16’152014
5
10
$15 million
’16’152014
5
10
$15 million
’16’152014
50
100
$150 million
’16’152014
50
100
$150 million
’16’152014
50
100
$150 million
’16’152014
$12.6M
$11.2M
$64.4M
$97.8M
$114.2M
2016:
Figure 20: LAC Alternative FinanceTotal Volume, 2014-2016 ($USD)
$9.9M

Finally, non-investment-based models – Donation-based and Reward-based Crowdfunding –made up a more mod-est proportion of the region’s overall volume, with each accounting for ap-proximately 3% of the region’s volume.
Much like the US, Reward-based Crowd-funding contracted in 2016, in this in-stance by 27% from $12.8 million to $9.3 million. Conversely, Donation-based Crowdfunding grew by 87% to $9.7 million in 2016.
H I T T I N G S T R I D E
61
Figure 21: LAC Alternative FinanceTotal Volume by Model, 2014-2016 ($USD)
Marketplace/P2P Consumer Lending
Balance Sheet Consumer Lending
Marketplace/P2P Business Lending
Balance Sheet Business Lending
Marketplace/P2P Property Lending
Equity-based Crowdfunding
Real Estate Crowdfunding
Donation-based Crowdfunding
Reward-based Crowdfunding
Other
0$ 50 million$ 100M $150M$ 200M
2014 2015 2016
$18.2M
$73.9M
$188.5M$55.7M
$39.9M
$22.6M**
$2.7M$600K*
$7.3M$2.1M
$151K
$3.4M$14.9M
$3.2M
$9.7M$5.2M
$2.2M
$9.3M$12.8M
$7.8M
$6.5M**
**
$19.4M$2.9M
*Unable to report due to small sample size

Mexico accounted for the highest total al-ternative finance market volume in 2016 in LAC ($114.2 million). In last year’s bench-mark, Mexico was the third most active LAC country, after Chile and Brazil. This year’s rapid growth – driven by both year-over-year organic growth, new entrants, and expanded survey response – has posi-tioned Mexico as the leader of the region, with an annual growth rate of 730%.
Mexico’s alternative finance volume is driven by business lending activity, with Marketplace/P2P Business Lending mak-ing up the largest model in the country. With growth of 601%, this model ac-counted for $40.6 million in 2016. Balance Sheet Business Lending accounted for $16.9 million. Together, these two business models made up 50% of Mexico’s alterna-tive finance volume.
The second largest model in Mexico is that of Balance Sheet Consumer Lending, with a total of $35.3 million raised in 2016, and accounting for 31% of the country’s volume. This is the first year that we are able to estimate this model in Mexico. Despite an overall small market share, Marketplace/P2P Consumer Lending grew substantially, from $2.8 million in 2015 to $6.8 million in 2016, a 140% annual growth.
Equity-based Crowdfunding continue to grow rapidly in Mexico, growing by 714% to $2.9 million in 2016. Real Estate Crowd-funding was measured at $2.3 million and Donation-based Crowdfunding at $2.5 million. The only Mexican model to con-tract in 2016 was Reward-based Crowd-funding, down 84% to $596 thousand.
Mexico
T H E 2 0 1 7 A M E R I C A S A LT E R N AT I V E F I N A N C E I N D U S T R Y R E P O R T
62

H I T T I N G S T R I D E
63
Figure 22: Mexico Alternative FinanceMarket Volume by Model, 2014-2016 ($USD)
Marketplace/P2P Consumer Lending
Balance Sheet Consumer Lending
Marketplace/P2P Business Lending
Balance Sheet Business Lending
Marketplace/P2P Property Lending
Equity-based Crowdfunding
Real Estate Crowdfunding
Donation-based Crowdfunding
Reward-based Crowdfunding
0 $10 million $20M $30M $40M $50M
2014 2015 2016
$6.8M
$35.3M
$40.6M$5.8M
$1.7M
$16.9M**
*$600K
*
$2.9M$350K$1K
$2.3M**
$2.5M**
$600K$3.6M
$1.7M
**
$2.8M$1.1M
*Unable to report due to small sample size

Chile represents the second largest alternative finance market in LAC with $97.8 million recorded in total transaction volume in 2016. Despite doubling in size (with a growth rate of 106%), Chile is no longer estimated to be the region’s lead-ing market for alternative finance.
Only three model-types were captured in Chile in 2016. The largest sector, account-ing for 95% of the Chilean alternative
finance market, is Marketplace/P2P Busi-ness Lending. This model doubled in 2016, from $46.5 million in 2015 to $92.9 million in 2016. In second place is Reward-based Crowdfunding, with $3.5 million in 2016, up 225% from the previous year. While Reward-based crowdfunding seems to be slowing across the region, it is clear that this model is thriving in Chile. Finally, Equity-based Crowdfunding accounted for $1.4 million in 2016.
Chile
T H E 2 0 1 7 A M E R I C A S A LT E R N AT I V E F I N A N C E I N D U S T R Y R E P O R T
64
Figure 23: Chile Alternative FinanceMarket Volume by Model, 2014-2016 ($USD)
Marketplace/P2P Consumer Lending
Marketplace/P2P Business Lending
Equity-based Crowdfunding
Reward-based Crowdfunding
0$ 20 million $40M $60M $80M $100M
2014 2015 2016
*
$92.9M$46.5M
$36.9M
$1.4M**
$3.5M$1.1M
$90K
*$470K
*Unable to report due to small sample size

In 2016, the Brazilian alternative finance market accounted for $64.4 million in total transaction volume, up by 167%, making it the third largest LAC market. The largest model in Brazil is Balance Sheet Consumer Lending, accounting for 48% of the Brazil-ian market and representing a total volume of $31.2 million. Marketplace/P2P Consum-er Lending saw a significant contraction (down 85%), from $9.6 million in 2015 to $1.4 million in 2016.
The next largest model in Brazil is Market-place/P2P Business Lending (up 409%), accounting for $10.4 million in 2016. For the
first time, we were able to capture plat-form data from the Balance Sheet Business Lending model in Brazil, which represented a total volume of $5 million.
Donation-based Crowdfunding was the third-largest model in Brazil, accounting for $7.1 million in 2016, up by 51%. Equity-based Crowdfunding also saw significant growth, from $1.7 million in 2015 to $3.1 million in 2016, representing an 82% year-on-year growth rate. Finally, the only model to contract in Brazil was that of Reward-based Crowdfunding, down 55% from $5.6 million in 2015 to $2.5 million in 2016.
Brazil
H I T T I N G S T R I D E
65
Marketplace/P2P Consumer Lending
Balance Sheet Consumer Lending
Marketplace/P2P Business Lending
Balance Sheet Business Lending
Marketplace/P2P Property Lending
Equity-based Crowdfunding
Real Estate Crowdfunding
Donation-based Crowdfunding
Reward-based Crowdfunding
0$ 5M $10M $15M $20M $25M $30M $35M
2014 2015 2015
$1.4M
$31.2
$10.4M$2.1M
$1.0M
$5.0M**
$2.7M**
$3.1M$1.7M
$150K
*$600K
*
$7.1M$4.7
$2.0M
$2.5M$5.6M
$4.4M
**
$9.6M*
*Unable to report due to small sample size
Figure 24: Brazil Alternative FinanceMarket Volume by Model, 2014-2016 ($USD)
M
Colombia grew substantially in 2016, from $334 thousand in 2015 to $11.2 million in 2016, representing a growth of 3,257%. Previous to 2016, Colombia’s market was exclusively dominated by non-investment based models. In 2016, Donation-based Crowdfunding gener-ated $37 thousand and Reward-based Crowdfunding generated $397 thousand. Together, these models accounted for less than 5% of Colombia’s alternative finance market.
It has been with the advent of invest-ment-based models that this country has experienced significant growth. Colom-bia’s alternative finance market in 2016 has been driven predominantly by Bal-ance Sheet Consumer Lending (50% of Colombia’s total volume) and the Mar-ketplace/P2P Business Lending (42%). In 2016, Balance Sheet Consumer Lending generated $5.6 million, while Market-place/P2P Business Lending accounted for $4.7 million.
Colombia
ArgentinaAlthough the Argentinian alternative finance market has been expanding in the last three years, the rate at which it has happened has slowed. Between 2014 and 2015, the market grew 246% from $2.8 million to $9.6 million. In 2016 the total transaction volume increased to $12.6 mil-lion, representing a more modest growth rate of 32%.
The largest sector in Argentina (account-ing for 76% of the market) is Marketplace/P2P Consumer Lending with $9.5 million in 2016. This model grew by 36% in 2016. Marketplace/P2P Business Lending is the second largest model, having grown by 10% and accounting for $1.3 million in 2016. Finally, Reward-based Crowdfund-ing accounted for $859 thousand.
PeruPeru’s market grew to $9.9 million in 2016, a significant jump from 2015’s estimated $276 thousand and representing an annu-al growth of 3,471% – driven by expanded survey response. Much like Colombia, Peru’s incredible growth stems from the introduction on investment-based models,
in particular Marketplace/P2P Business Lending. In 2016, this model accounted for $9.1 million and accounted for 93% of Peru’s total alternative finance volume. Reward-based Crowdfunding contracted by 64%, from $201 thousand in 2015 to $73 thousand in 2016.
T H E 2 0 1 7 A M E R I C A S A LT E R N AT I V E F I N A N C E I N D U S T R Y R E P O R T
66

H I T T I N G S T R I D E
67

THE REGULATORY LANDSCAPE ACROSS THE AMERICASIn the 2017 Americas Alternative Finance Industry Survey we included questions to inquire about the industry’s perception on regulations in the market. For practicality, we divided all plat-forms into debt-based and equity-based platforms for analysis. Non-investment models (Reward-based and Donation-based Crowdfunding) are excluded from analysis because they fall out-side of most regulatory purview.
T H E 2 0 1 7 A M E R I C A S A LT E R N AT I V E F I N A N C E I N D U S T R Y R E P O R T
68

Platforms across the Americas have a variety of opinions regarding existing national regulations in their respec-tive home countries.
The equity-based segment is clearly divided between platforms who per-ceive regulation as excessive and too strict (36%), and those who believe regulation is adequate and appropri-ate (also 36%). These rather oppos-ing views signal a major difference in experience with regulations within
the afore-mentioned segment of the alterna-tive finance industry. Debt-based platforms are similar-ly divided. While 24% think that regulation is excessive and too strict, 31% believe it is adequate and appro-priate. On the other hand, the
majority of platforms on both the equity-based (59%) and debt-based segments (36%) seem to agree that the proposed national regulations of their respective home countries are adequate and appropriate, signaling an increasingly optimistic view for the future of the market.
There are small variations in percep-tions of regulations from country to country. In the United States (US), the debt-based segment seems to be similarly divided with respect to both existing and proposed nation-al regulations. However, there is a clear consensus with regards to state regulations. While 51% of debt-based platforms think that the existing state regulations are adequate, only 18%
One Year on in the United States
The US securities crowdfund-ing market, operating under Regulation Crowdfunding (Reg CF), opened on May 16th, 2016. As of March 31st, 2017, 266 companies have started or concluded securi-ties issues through 26 reg-istered funding portals. The median company is just over 1 year old, has 3 employees, of-fered a minimum of $50,000 (Reg CF operates under an all or nothing principle), and required that investors invest at least $100. Investors have committed to purchasing $35 million in securities through 39,000 transactions. The me-dian investor invested $300 and is located 900 miles from the company headquarters. 50% of the companies suc-ceeded in raising their mini-mum. The median successful company raised $200,000 from 350 investors.
For additional market details and analysis see Abrams, 2017 “Securities Crowd-funding: More than Fam-ily, Friends, and Fools?” at https://ssrn.com/ab-stract=2902217.
While 51% of debt-based
platforms think that the existing state regulations
are adequate, only 18% consider them excessive.
consider them excessive. On the other hand, the difference for equity-based platforms is less significant: 41% think regulation is excessive and 55% be-lieve it is adequate. Once again, such polarization signals a major difference in the experiences that platforms have respective to how their activities are supervised.
H I T T I N G S T R I D E
69

In Canada, 58% of debt-based platforms perceive existing national regulation as adequate and appropriate to their activities, with only 17% viewing regula-tion as excessive and too strict. On the contrary, equity-based platforms have a significantly more pejorative view of existing national regulation, with 75% of platforms viewing regulation as exces-sive and too strict.
In LAC, the ratios of platforms that consider regulations excessive to those who think of them as adequate are also similar. It is also important to note that
the industry is largely unregulated in the region, especially the equity-based segment. However, there are differenc-es from country to country. In Mexico, 50% of debt-based platforms consider the existing national regulation to be adequate, while only 17% think of it as excessive. On the other hand, the Mex-ican equity-based segment does not have any concrete regulations in place. In Brazil, 29% of debt-based platforms answered that although there is no specific regulation in the industry, none is needed, while 24% think the current regulation is inadequate and too relaxed.
T H E 2 0 1 7 A M E R I C A S A LT E R N AT I V E F I N A N C E I N D U S T R Y R E P O R T
70
Americas Alternative Finance Platform Perceptions TowardExisting and Proposed National Regulation
U.S.-Debt-Based Platforms
LAC – Debt-Based Platforms
LAC – Equity-Based Platforms
U.S.-Equity-Based Platforms
Alternative finance (including crowdfunding & P2Plending) is not currently legalized in my countryNo Specific Regulation and neededNo Specific Regulation and not neededRegulation excessive and too strictRegulation is adequate and appropriateRegulation is inadequate and too relaxed
Responses:
Existing
Proposed
Existing
Proposed
Existing
Proposed
Existing
Proposed
12%
13% 37% 42%2%2%4%
4%
4%
29% 63%4%
44%
31%
45% 45%
14% 14% 29% 43%
9%
37% 10% 15% 10% 25%3%
14% 12% 17% 19% 6%
48%4%
4% 2%24% 22% 48%
Figure 25: Americas Alternative FinancePlatform Perceptions Toward Existing and Proposed National Regulation
H I T T I N G S T R I D E
71
Americas Alternative Finance Platform Perceptions TowardExisting and Proposed National Regulation
U.S.-Debt-Based Platforms
LAC – Debt-Based Platforms
LAC – Equity-Based Platforms
U.S.-Equity-Based Platforms
Alternative finance (including crowdfunding & P2Plending) is not currently legalized in my countryNo Specific Regulation and neededNo Specific Regulation and not neededRegulation excessive and too strictRegulation is adequate and appropriateRegulation is inadequate and too relaxed
Responses:
Existing
Proposed
Existing
Proposed
Existing
Proposed
Existing
Proposed
12%
13% 37% 42%2%2%4%
4%
4%
29% 63%4%
44%
31%
45% 45%
14% 14% 29% 43%
9%
37% 10% 15% 10% 25%3%
14% 12% 17% 19% 6%
48%4%
4% 2%24% 22% 48%
Current Regulatory Developments in Latin AmericaAcross LAC, alternative finance platforms are actively working to create more and new spaces within financial regulation and policy to ensure the development of the sector. To generate bargaining power, and public awareness, platforms are cre-ating national and international associa-tions within the context of Fintech or just Alternative Finance.21
Intergovernmental organizations, such as the Inter-American Development Bank (IDB), are collaborating with the LAC governments in their Alternative Finance and Fintech-related regulatory efforts to foster the growth of a sound ecosystem. In this sense, the bank issued a Discussion Paper focused in regulation for Alternative Finance, containing nine recommendations to properly regulate the industry in the civil law context for most of the countries within the region.22 Secondly, using the principles from such document and the experience from Spain and other countries, IDB has been working with the governments from Chile.23 Mexico, Argentina,24 Peru and Paraguay25 in efforts towards the creation of a regulatory framework for Alterna-tive Finance and Fintech in general.
Some countries are moving towards issuance of regulations for one or more of the investment-based online alterna-tive finance models, such as Argentina with their Entrepreneurship Act (Ley del Emprendedor),26 which regulates equity crowdfunding and creates legal faculties for the National Securities Commission (Comisión Nacional de Valores) to rule and provide oversight on activities. Some others are regulating Fintech in a broad-er attempt, such is the case of Mexico, where a “Fintech Act” draft is already in place and the authorities27 are currently reviewing comments from the industry and international entities. Chile, Peru and Paraguay are in the works for Alternative Finance regulations accompanied with regulatory sandbox initiatives.
Many of these efforts have been the result of the fast-growing pace of the Al-ternative Finance platforms in countries such as Chile and Mexico. In some other cases, governments are open to create a play field for entrants and are creating space using regulatory sandboxes and other regulatory and policy tools.
Governments are aware of the existence of Alternative Finance in the region and they are prudentially regulating the activity as it is growing steadily, as this study has shown.
21 A variety of industry-driven associations have emerged across LAC. The Mexican Crowdfunding Platforms Association (AFICO - Mexico http://www.afico.org), the Brazilian Equity Crowdfunding Association (EQUITY- http://equity.org.br/) and the Chilean Crowdfunding Association (AFICO-Chile http://afico.cl/), all founded in 2014, were the pioneer associations within the region. The dialogue has been widened through time and the Alternative Finance scene has been amalgamated into the broader concept of Fintech. This created the space for Fintech Associations in Brazil (Fintech Brazil- http://fintechbrazil.com), Mexico (Fintech México https://www.fintechmexico.org), Colombia (Colombia Fintech https://www.colombiafintech.co/), Uruguay (Cámara Uruguaya de Fintech),Peru (Asociación Peruana de Fintech https://cafu.org.uy/), among others. 22 Diego Herrera: “Alternative Finance (Crowdfunding) Regulation in Latin America and the Caribbean: A Balancing Act”, (BID, Washing-ton DC, September, 2016). Available at: http://dx.doi.org/10.18235/0000430. 23 See: Pulso (January, 2017): “Industria del crowdfunding celebra regulación y hace énfasis en protección del inversionista”: http://www.pulso.cl/noticia/empresa---mercado/empresa/2017/01/11-98107-9-industria-del-crowdfunding-celebra-regulacion-y-hace-enfasis-en-pro-teccion-del.shtml and El Mercurio (August, 2016): “Hacienda pide asesoría para regular el financiamiento colectivo”: http://www.elmercu-rio.com/Inversiones/Noticias/Fondos-Mutuos/2016/08/18/Hacienda-pide-asesoria-para-regular-el-financiamiento-colectivo.aspx.24 See: Comisión Nacional de Valores: “La CNV sede de XVIII Jornadas sobre Tecnología: “Ciberseguridad y las actividades FINTECH”: http://www.cnv.gob.ar/web/secciones/prensa/comunicados.aspx?id=138&p=1 25 See: ultimahora.com (January, 2017): “CNV presentaría en marzo proyecto para financiación colectiva”: http://www.ultimahora.com/cnv-presentaria-marzo-proyecto-financiacion-colectiva-n1052597.html 26 See: Ministerio de Producción: “Ley del Emprendedor”: http://www.produccion.gob.ar/quieroemprender/ 27 Finance Secretary and the Banking and Securities Commission (Comisión Nacional Bancaria y de Valores - CNBV)

PERCEPTIONS OF RISK ACROSS THE AMERICASIn the 2017 Americas Alternative Finance Industry Survey, plat-forms were asked to rate seven different factors as the perceived risk to a platform’s operations. These risk factors included fraud, increase in default rates, collapse of well-known platforms due to malpractice, cyber-security breach, crowding-out of individu-al investors, changes in national regulation, and changes in state regulation. The goal was to identify how these perceptions varied between segments of the industry, regions and countries.
T H E 2 0 1 7 A M E R I C A S A LT E R N AT I V E F I N A N C E I N D U S T R Y R E P O R T
72
Americas Alternative Finance Platform Perceptions of Risk
Very lowRisk level:
Fraud involving one or more high-profile campaigns/deals/loans
Notable increase in default rates/business failure rates
The collapse of one or more well-known platforms due to malpractice
Cyber-security breach
Potential 'crowding out' of individual investors as institutionalizationaccelerates
Changes to regulation at a national level
Changes to regulation at a state level
Low Medium High Very high
11%
10%
9%
6%
17%
17%
24% 33% 24% 12% 7%
28% 29% 17% 8%
26% 36% 16% 6%
18% 40% 25% 11%
22% 31% 28% 10%
27% 40% 17% 7%
25% 30% 23% 11%
Figure 26: Americas Alternative FinancePlatform Perceptions of Risk

Risk across the AmericasPerceived risk within the alternative finance industry remains relatively high. More than half of all surveyed alternative finance plat-forms in the Americas associate medium to very high risk with six out of the seven aforementioned factors. More specifically, 76% of platform operators believe there is
medium to very high risk in the potential of a cyber-security breach, with 36% of these platforms associating this factor with high to very high risk. This factor is viewed as the highest risk to individual companies. The “col-lapse of one or more well-known platforms due to malpractice” also ranked high, with 69% of platforms viewing this as a medium to very high risk. Interest-ingly, a slightly larger proportion (38%) of platforms rated this
factor as high to very high risk. For both the “fraud” and “notable increase in default or business failure” factors, 64% of platform operators associated medium to very high risk, though more platforms viewed “fraud” (34%) as a high to very-high risk factor.
The “potential of crowding out” is viewed as a medium to very high risk to 57% of platform operators, yet it is notable that only 21% of operators would rank this factor as high or very high risk. Given the large emphasis on institutional investors across the Americas, and especially in the United States US), this perceived risk factor was surprising. Finally, while 55% of all platforms perceive medium to very high risk in chang-es of national regulations, only 43% see a threat in changes of state policies. These statistics provide a general picture of how alternative finance platforms in the Ameri-cas perceive risk surrounding the industry. It is clear that most platforms are aware of the potential threats and particularly concerned about cyber-security breaches, collapse of well-known platforms, increase in default rates, and the possibility of fraud.
Country specific perceptions of risk The information above captures the risk perceptions of all the survey participants in the Americas. While one might expect significant variations from country to country, in reality, risk perceptions about the alternative finance industry are surpris-ingly similar across nationalities with only small deviations. For example, while 79% of platforms consider cyber-security breaches to be a source of medium to very high risk in the US and Canada, only 70% of Latin American and the Caribbean platforms associate cyber-security breach with such degree of risk. Similarly, fraud involving high-profile campaigns/loans is perceived as a medium to very high risk by 73% of Brazilian and 67% of Chilean platforms, in contrast with only 44% of Canadian platforms. Moreover, while only 52% of US platforms consider changes in national reg-ulations to be a medium to very high risk, 76% of Mexican platforms perceive it as such, which is logical given that legislation to regulate the industry is currently under review in the Mexican Congress. Apart from these minor differences, the risk percep-tions of the surveyed platforms are evenly distributed between countries.
Differences between industry segments Risk perception varies marginally more between industry segments. While 64% of platforms of all segments believe “fraud” is a medium to very high risk for their business, only 47% of real estate crowdfunding participants agreed. 64% of all platforms consider the potential increase of default rates to be a medi-um to very high risk. The percentage of respondents that consider the collapse of well-known platforms to be a threat of medium to very high risk varies widely among segments of the industry. Only 50% of Donation-based and 40% of Reward-based Crowdfunding platforms associated such factor with a medium to very high risk, but 88% of Marketplace/P2P Property Lending marked it as a source of medium to very high risk. In general, the majority of platforms across segments think of cyber-security breach-es as a medium to very high risk, and as such there is no much variation between segments of the industry.
76% of platform operators believe there is medium to very high risk
in the potential of a cyber-security
breach
H I T T I N G S T R I D E
73

CONCLUSIONFollowing a year of considerable flux, in 2016 alternative finance models in the Americas have realised steady and sustainable growth, proving the resilience of online alternative finance across the region. In the case of the United States, whilst compared to the previous year, over-all growth has slowed down noticeably, from triple digit annual growth to a more modest 22% in 2016.
T H E 2 0 1 7 A M E R I C A S A LT E R N AT I V E F I N A N C E I N D U S T R Y R E P O R T
74
Yet this slower pace may signal steadier acceleration, with incumbent alternative finance platforms achieving higher levels of competence whilst continuing to refine their model. When reviewing market trends and dynamics, we note that platforms in the United States are becoming somewhat more self-sufficient, with less reliance on institutional investor-driven volume and diversifying their underlying funding model to include a greater emphasis on bal-ance-sheet driven origination.
In Latin America and the Caribbean, rapid growth (209%) continued unabatedly. Investment-based models, especially in the debt arena, have grown considerably and make up the lion’s share of alternative finance volume. As the region develops, there is markedly less reliance on non-in-vestment-based models, especially with respect to Reward-based Crowdfunding which contracted this past year. Mexico, Chile and Brazil are the market leaders in the region, with Mexico and Chile driving business-focused finance.
Business finance has driven rapid growth across Latin America and the Caribbean. With an influx of new micro, small and me-
dium sized businesses entering the arena, continued research is necessary. Therefore, a companion report focused on business fundraisers in Mexico and Chile, supported by the Inter-American Development Bank, is forthcoming. This report will examine business-focused alternative finance in these two markets, particularly from the fundraisers’ perspective.
This report is also the first in a series of regional benchmarking reports published by the Cambridge Centre for Alternative Fi-nance and its partners in 2017. By tracking and analysing the online alternative finance at a global level, it is possible to unpack key market trends and discuss regional diver-gence with a comparative perspective. We hope that these studies will provide up-to-date and reliable market date to provide useful industry overview and enable evi-dence-based policymaking and regulations in alternative finance.

H I T T I N G S T R I D E
75

ACKNOWLEDGEMENTS
T H E 2 0 1 7 A M E R I C A S A LT E R N AT I V E F I N A N C E I N D U S T R Y R E P O R T
76
We wish to thank the CME Group Foundation, the Inter-American Development Bank and the Polsky Center for Entrepreneurship and Innovation for their financial sup-port of research into online alternative finance research. We are very thankful to the CME Group for generously committing to provide multi-year financial support for this research project. We thank Juan Antonio Ketterer of the Inter-American Development Bank (IDB) and his team for their continued support throughout the research process.
The 2017 Americas Alternative Finance Industry Report would not have been possible without the extremely able research assistance of Jackie An, Peter Ferrara, Tanvi Son-thalia, and Connie Xu. Andres Serrano Gutierrez and Daniela Campillo Valencia served both as research assistants and extremely able translators. We are grateful to the assis-tance we received from the IDB team, in particular Sylvia Gabriela Andrade and Diego Herrera Falla, for their help in translating our survey into Portuguese and Spanish. We also thank Arnobio Morelix, who helped greatly in the Portuguese translation process.
The research team at the Cambridge Center for Alternative Finance would like to thank Robert Wardrop and Raghavendra Rau for their counsel, guidance and feedback throughout the study. We would also like to thank Charles Goldsmith, Kate Belger and Alison Gibb for their contribution towards the public relations and press release. The leadership and encouragement of Professor Steven Kaplan, Professor Randy Kro-szner, and Professor Ellen Rudnick at the University of Chicago Booth School of Busi-ness were instrumental in making this year’s work possible. Associate Vice President for Entrepreneurship and Innovation, John Flavin gave us freedom to explore this burgeon-ing area of interest for the University. Polsky Center Executive Director Starr Marcello has been a day-in day-out supporter as its new research team settled in and expanded their work. Kristin Barrett and Wolf Connell were incredible partners in expanding Fin-Tech work across campus and into the city.
The grand visions and devotion of our many Booth alumni to supporting improvements at the School are a constant source of guidance and inspiration. For the first time this year, we have been lucky enough to have the support of FinTech Advisory Council. The partnership between Cambridge and Chicago would not have been possible this year without Doug Monieson who is as passionate about entrepreneurship as he is selfless with his time in helping the school and next generation of leaders. Ross Hikida, Nicholas Somers, and Brian Van Elslander provided critical guidance and insights on the chang-ing industry.

H I T T I N G S T R I D E
77
The Polsky Center is grateful for the aid and promotion from the excellent communica-tions and PR team at Booth and Polsky – Susan Guibert, Sandra Jones, Mary Naset and Micheline Pergande. And Mary Kay Loncar, Gabe Sulkes, and Yaniv Kleinman deserve special recognition.
We are very grateful for the extraordinarily generous support and help from Peter Renton, Andrew Dix, Richard Swart, Douglas Ellenoff, Scott McIntyre, Sarah Hanks and their respective organizations. We would also like to thank our research partners from organizations across the region who disseminated the survey and provided critical introductions to platforms across the Americas, including: Kim Wales (CFIRA), Craig Asano (NCFA Canada), Matt Burton (Orchard), David Beaver (Orchard), Sydney Arma-ni (CrowdFund Beat Media), Kassie Davis (CME Foundation), Andrew Dix (Crowdfund Insider), Al Goldstein (Avant), Youngro Lee (NextSeed), Gabriel Manjarrez (Mimoni/Lum-brera), Rumi Morales (CME), Daniel Gorfine (OnDeck), Samuel Guzik (CfPA), Erin Hobey (Crowdfund Insider), Oscar Jofre (KoreConX), Graham McBride (Fundthrough), Scott McIntyre (CfPA), Jorge Ortiz (Fintech Mexico), Deepak Ramachandran (Fundthrough), Morgan Mosky (Civis), Sunny Shao (NCFA Canada), Javier Castro (Latin Fintech), Nicho-las Arrella (Nexoos), Alvaro Echeverria (Facturedo), Krista Morgan (P2Bi), Edwin Zacipa (Fintech Colombia), Herbert Schulz (Becual), María Jesús Sievers (Cumplo), Tarek El Sherif (Zinobe), Justin Hughes (RealtyMogul), Nayson Rouhipour (LendingUSA), Edu-ardo Teixeira (Noverde), Jose Antonio Berrios (Broota), Ron Suber (Prosper), Rafael Pereira (Enova), Sam Graziano (Fundation) and Rodrigo Soeiro (AB Fintech).


