THE AMERICAN MINERALOGIST, VOL. 44, SEPTEMBER OCTOBER… · the american mineralogist, vol. 44,...
13
THE AMERICAN MINERALOGIST, VOL. 44, SEPTEMBER_OCTOBER, 1959 REFRACTION, ABSORPTION AND BIABSORPTION IN SYNTHETIC RUBY* Josnru A. X,LlsoenrNo Llnivers'ity of Michigan,, Ann Arbor, Michiganl ABsrRAcr Refractive indices, absorption coefficients, and biabsorption were determined for two synthetic ruby samples, one colored pink by 0.11/o CrzOz and the other colorecl deep red by 1.407o CrzOz. The refractive indices of the pink sample vary fuom n,:1.7767 and n,:1.7677 aL 480 mp to n^:1.7635 and nr:17554 at 700 ms. For the red sample, nn and rz. vary from 1 7821 and 1.7741,respectively, to 1.7696 and 1 7614 fot the same spectral region. The maximum value of the absorption coelicient for the ordinary ray occuls at 560 mp for both samples, while the maximum value for the extraordinary ray in both samples occurs at.550 mp. Values of the absorption coefficients at the peak r'vave lengths are: h.:34.9X10 6,h,:25.4X10-c (for the pink ruby) and fr.:311 0X10-6, k.:138.2X10⁻⁶ (for the red ruby) The maximum negative (k,1k.) value of biabsorption for both samples occurs at 570 mp. These biabsorption values calculated from the absorption coefficients are -104 X10 6 and -184.1X10⁻⁶ for pink and red ruby, respectively. Those obtained by the visual-matching method are -10.0X10 0 116 -l!J.Qt10 6. INrRolucrrorg In a recent paper (I'Iandarino, 1959),an att-emptwas made to stimu- late interest in the quantitative determination of absorption and biab- sorption. This paper continues the study with data on thesetwo proper- ties for synthetic ruby. Refractive index data have alsobeen included for the sake of completeness. Two samples of synthetic ruby were used:a dark red samplecontaining I.+To/a CrzOa and a pink samplecontaining o.lIo/a CrzOg. The chromium contents were determined by \,Ir. C. O. Ingamells of the Rock Analysis Laboratory, University of l.tlinnesota. The writcr wishes to thank Dr. R. W. Kebler, of the Linde Air Products Company, Indianapolis, Indiana, for furnishing the samples; Drs. N. Kalenda and A. Emory of the Chemistry Department, University of l,Iichigan, for assisting with the Cary spectrophotometer; and especially, Professor R. I{. Denning, of the X'Iineralogy Department, University of N'Iichigan, who directed the study and contributed many helpful sugges- tions. The study was supported by the Officeof Naval Research. * Contribution No. 234 from the Department of Mineralogy, University of Michigan, Ann Arbor, Michigan. f Present address:Earth Sciences Division, Royal Ontario Museum, Toronto, Ontario, Canada. 961
Transcript of THE AMERICAN MINERALOGIST, VOL. 44, SEPTEMBER OCTOBER… · the american mineralogist, vol. 44,...

THE AMERICAN MINERALOGIST, VOL. 44, SEPTEMBER_OCTOBER, 1959
REFRACTION, ABSORPTION AND BIABSORPTION IN
S Y N T H E T I C R U B Y *
Josnru A. X,LlsoenrNoLlnivers'ity of Michigan,, Ann Arbor, Michiganl
ABsrRAcr
Refractive indices, absorption coefficients, and biabsorption were determined for two
synthetic ruby samples, one colored pink by 0.11/o CrzOz and the other colorecl deep red
by 1.407o CrzOz.
The refractive indices of the pink sample vary fuom n,:1.7767 and n,:1.7677 aL
480 mp to n^:1.7635 and nr:17554 at 700 ms. For the red sample, nn and rz. vary from
1 7821 and 1.7741, respectively, to 1.7696 and 1 7614 fot the same spectral region.
The maximum value of the absorption coelicient for the ordinary ray occuls at 560
mp for both samples, while the maximum value for the extraordinary ray in both samples
occurs at.550 mp. Values of the absorption coefficients at the peak r'vave lengths are:
h. :34.9X10 6,h, :25.4X10-c ( for the pink ruby) and f r . :311 0X10-6, k. :138.2X10⁻⁶
(for the red ruby)
The maximum negative (k,1k.) value of biabsorption for both samples occurs at
570 mp. These biabsorption values calculated from the absorption coefficients are -104
X10 6 and -184.1X10⁻⁶ for pink and red ruby, respectively. Those obtained by the
visual-matching method are -10.0X10 0 116 - l !J .Qt10 6.
INrRolucrrorg
In a recent paper (I ' Iandarino, 1959), an att-empt was made to stimu-
late interest in the quantitative determination of absorption and biab-
sorption. This paper continues the study with data on these two proper-
ties for synthetic ruby. Refractive index data have also been included for
the sake of completeness.Two samples of synthetic ruby were used: a dark red sample containing
I.+To/a CrzOa and a pink sample containing o.lIo/a CrzOg. The chromium
contents were determined by \,Ir. C. O. Ingamells of the Rock Analysis
Laboratory, University of l.t l innesota.The writcr wishes to thank Dr. R. W. Kebler, of the Linde Air Products
Company, Indianapolis, Indiana, for furnishing the samples; Drs. N.
Kalenda and A. Emory of the Chemistry Department, University of
l,I ichigan, for assisting with the Cary spectrophotometer; and especially,
Professor R. I{. Denning, of the X'Iineralogy Department, University of
N'Iichigan, who directed the study and contributed many helpful sugges-
tions. The study was supported by the Office of Naval Research.
* Contribution No. 234 from the Department of Mineralogy, University of Michigan,
Ann Arbor, Michigan.
f Present address: Earth Sciences Division, Royal Ontario Museum, Toronto, Ontario,
Canada.
961
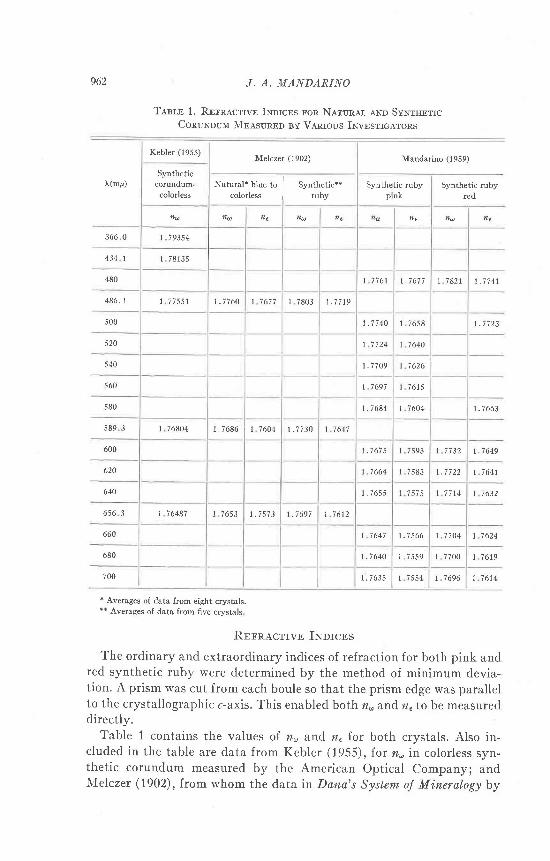
962 J. A. MANDARINO
TAsr,n 1. Rnln,tcrrvr lrorcBs lon Nerunar aNo SvNrsBrrcConunluu MusunBo sy Venrous INvesrrc.q.rons
\(mp)
Kebler (1955)Melczer (1902) Mandarino (1959)
Syntheticcotundum-
colorlessNatural* blue to
colorless
| . - - ru . . , . * *
I ruDySynthe
prtic rubynk
Synthetic rubyred
n a n e
3 6 6 . 0 r 79354
434 1 I 78135
480 L 7761 t . 7 6 7 7 r 7821 r . 7 7 4 1
485. I I 77551 1 . 7 7 6 0 1 7677 1 7803 1 . 7 7 1 9
500 t . 7 7 4 0 1 7658 r . 7 i 23
520 1 7 7 2 4 1 7640
.540 1 . 7 7 0 9 1 i626
560 1 7697 I i 6 1 5
580 1 . 7 6 8 4 r 7604 1 . 7 6 6 3
589 3 1 76804 1.7686 1 7604 r . 7 7 3 0 | 7647
600 L . 7 6 7 5 I 7593 I 7 i 3 2 1 . 7 6 4 9
620 I 7664 r 7583 t . 7 7 2 2 | 7641
640 1 . 7655 r 7714 r 7632
656 3 1 76487 l 7653 1 . 7 5 7 3 1 . 7 6 9 7 1 7612
660 | 7647 1 . i 5 6 6 1 7701 1 1624
680 1.7610 1 7559 | 7700 | 7619
700 1 .76 .35 1 7554 1 7696 1 7614
* Averages of data from eight crystals.** Averages of data from five crystals
Rrlnecrrvn fNorcBs
The ordinary and extraordinary indices of refraction for both pink andred synthetic ruby were determined by the method of minimum devia-tion. A prism was cut from each boule so that the prism edge was parallelto the crystallographic c-axis. This enabled both n, arrd n. to be measureddirectly.
Table 1 contains the values of n, and n, f.or both crystals. Also in-cluded in the table are data from Kebler (1955), Ior n,in colorless syn-thetic corundum measured by the American Optical Company; andN{elczer (1902), from whom the data in Dana's System oJ Mineratogy by
REF'RACTION AND ABSORPTION IN SYNTIIETIC RUBY
WAV E L E NG TH IN IVI ]
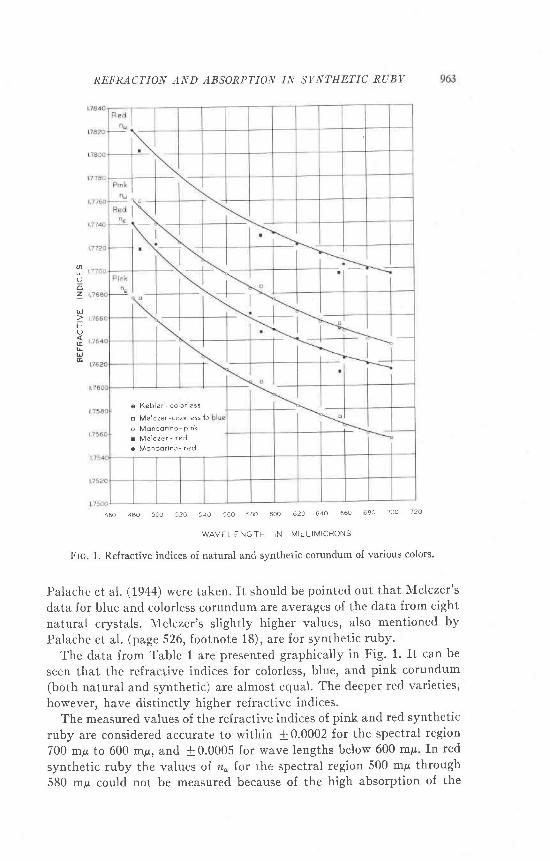
l'rc. 1. Refractive indices of natural and synthetic corundum of various colors.
Palache et al. (1944) were taken. It should be pointed out that Melczer's
data for blue and colorless corundum are averages of the data from eight
natural crystals. Melczer's slightly higher values, also mentioned by
Palache et al. (page 526, footnote 18), are for synthetic ruby.
The data from Table 1 are presented graphically in Fig. 1. It can be
seen that the refractive indices for colorless, blue, and pink corundum(both natural and synthetic) are almost equal. The deeper red varieties,
however, have distinctly higher refractive indices.The measured values of the refractive indices of pink and red synthetic
ruby are considered accurate to within + 0.0002 for the spectral region
700 mp to 600 mpr, and + 0.0005 for wave Iengths below 600 mp. In red
synthetic ruby the values ol n" for the spectral region 500 mp through580 mp could not be measured because of the high absorption of the
aUooz
U
FoG
6 K e b l e r - c o l o r l e s 5
o M e l c z e r - c o L o r l e s s l o
o M o n d o r r n o p r n k
r M e l c z e r _ r e d
. M o n d o r i n o - r e d
460 4aO 5OO 52a 540 560 5ao 6m 620 640 660 680 700 1?o
r. A. MANDARINO
T,lnr,n 2. H.qnrueNN CoNsraNrs lon PrNr< ann Rno SvNrnnrrc Rusv
Pink Synthetic Ruby
i
I{ed Synthetic RubyHartmannConstants
no | .7 507
7 9 . 5 7 43 18
202.r 295.2
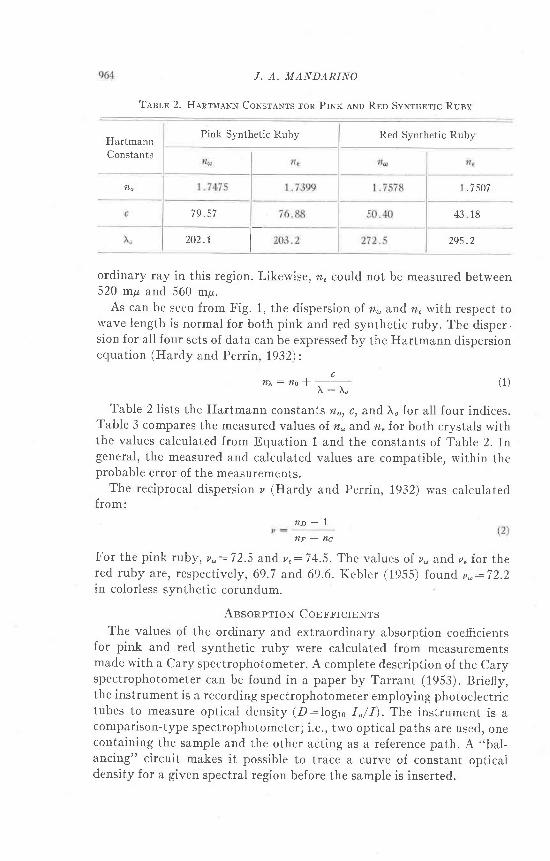
ordinary ray in this region. Likewise, n€ could not be measured between520 mp and 560 mp.
As can be seen f rom Fig. 1, the d ispers ion of naandn,wi th respect towave length is normal for both pink and red synthetic ruby. The disper-sion for all four sets of data can be expressed by the Hartmann dispersionequation (Hardy and Perrin, 1932):
e, r A - 7 r 0
I - r .
Table 2 l ists the Hartmann constants no, ct and tr, for all four indices.Table 3 compares the measured values oI nn and n,Ior both crystals withthe values calculated from Equation 1 and the constants of Table 2. Ingeneral, the measured and calculated values are compatible. within theprobable error of the measurements.
The reciprocal dispersion z (Hardy and Perrin, 1932) was calculatedfrom:
n o - l
n F - n C
For the p ink ruby, v , :72.5 &nd z. :74.5. T 'he values of z , and z. for thered ruby are, respectively, 69.7 and 69.6. Kebler (19155) Iound u.:72.2in colorless synthetic corundum.
Ansoaprtorg ConnrrcrnNtsThe values of the ordinary and extraordinary absorption coeficients
for pink and red synthetic ruby were calculated from measurementsmade with a Cary spectrophotometer. A complete description of the Caryspectrophotometer can be found in a paper by Tarrant (1953). Briefly,the instrument is a recording spectrophotometer employing photoelectrictubes to measure optical density (D:logro I,/ I '). The instrument is acomparison-type spectrophotometer; i.e., two optical paths are used, onecontaining the sample and the other acting as a reference path. A ,,bal-
ancing" circuit makes it possible to trace a curve of constant opticaldensity for a given spectral region before the sample is inserted.
(1 )

REFRACTION AND ABSORPTION IN SYNTLIETIC RUBY
Tlsr-n 3 Mnesunno eNn Calcul,trnn RetnecuvB Inorcns ol PrNr
auo Rnn SvNrnnrrc Ruev
965
Pink
calc.
I 7741
r .7683
t . 7 6 4 0
| 7632
| 7619
| . 7 6 1 4
To confine each measurement to a particular vibration direction, apolar must be placed in the sample path. A sheet of Polaroid was usedfor this purpose. The polished ruby plates (cut parallel to the c-axis) weremounted in rotatable holders so that each vibration direction of theplates could be made parallel to the vibration direction of the polar.
With only the polar in the sample path, the instrument was balancedfor an arbitrary optical density reading of 1.00 (I/1":0.100). Afterbalancing, an optical density curve was obtained for the polar alone. Thecurve covered the spectral region 440 mp to 700 mp. Values from thiscurve were converted to values of 1, and were found to deviate very l itt lefrom a value of 0.100. Next, the pink ruby plate was placed in the samplepath, and an optical density curve was obtained for the ordinary vibra-tion direction. The ruby plate was then rotated 90o in its own plane, andan optical density curve for the extraordinary vibration direction rvas ob-tained. Similarly, curves were recorded for the ordinary and extraordi-
meas
| 774r
--- ily
11664 11r6:l!llil::l

966 J. A. MANDARINO
TasrE 4. Ver-urs or Ir/1. l.:No Irf Io FoR TrrE SpBcrn.q,r nncroN440 mp-700 mp
I(mp)
440450460466469470+t .7
476480490
500510520530540550s60570580590
6006106206306406s0660670680690693
Pink Ruby (l:0.302 cm.)
.1081 t )
.160
. 1 7 2
.166
. 1 5 3
. 1 3 5
.l tg
.105094
.094
.102
.125
. 1 6 2
. 1 8 5
. 1 8 0
. 1 7 7
. l / J
. 1 7 |
. t / . )
. 1 8 5
.204
.220
.2+3
Red Ruby (t:0 073 crn.)
I,/ I.
.053
.139
.219
. 2 5 2
.240
.260
.235248209
. t / . )
. r l +
. u+/
. 1 3 0
.229
. 2 7 5
. 2 5 7
.309
.269309
.291
.265
.278
.285
.294
.301
.308
. .t r.)
.322
.330
.337
.2091 A <
.267
.282
.295
.302309
.312
.319328
. 1 4 8
.o92
.o47
.o22
.012
.007
.006
.008
. 0 1 5
.042
. 1 0 9
.205
.288
.335
.356
.368
.365
.3603723s6
.332
.372
.251
.200
. 1 5 5
.120
.102
.100
. 1 1 6
. 1 5 51 1 4
.288
.3s0
.398
.427
. + 5 1
.446
.452/.<')
.452n < 1
A < 1
.452
.463.342. J J I
nary vibration directions of the red ruby. The optical density values fromthese curves were converted (at selected wave lengths) to values of 1'.Division of 1' values by the predetermined value of 1, (0.100) resulted invalues ol I'/1" (the transmittance values uncorrected for reflectionIosses).

REFRACTION AND .IBSORPTION IN SVNTI|ETIC RUBY
50a
/"''-t
6a
Frc. 2 (left). Transmittance of pinkSample thickness:0.302 cm.
Frc. 3 (right) Transmittance of redSample thickness: 0.073 cm.
synthetic rubv corrected for reflection losses.
synthetic ruby corrected Ior reflection losses.
The corrected transmittance values (I /I ") tor the ordinary and extraor-
dinary vibration directions of both crystals were determined from thevalues oI I ' f I" ar'd n, according to the well-known Fresnel equation forreflection losses. The values ol I,fI" and I,fI. for pink and red ruby aregiven in Table 4. These data are also presented graphically in Fig. 2(pink ruby) and Fig. 3 (red ruby). For certain wave lengths, the red rubyseems to be more transparent than the pink ruby. This can be explainedby the difierence in thickness of the two samples. The pink ruby was0.302 cm. thick while the red ruby was only 0.073 cm. thick. Transmit-tances of media having difierent chromophore concentrations should notbe compared if the media have different thicknesses. Comparison of ab-sorption coefficients of such media is permissible, however, because ab-sorption coefficients are independent of thickness.
The absorption coefficients for the four sets of data were calculatedfrom the following equation:
k : - \ l"g L) Manciarino (1959) (3)4tt
Values of k, and ft. for both samples are l isted in Table 5, and these dataare presented graphically in Fig. 4.

968 J. A. MANDARINO
Taelr 5. V,tr,ues or ft. ,,r.llo fr. lon rr{E Sptc:rne.r RrcroN,[40 mp-700 mp
Pink Ruby Recl Rubytr(mp)
p, k.
440450460466469470473476480490
500510520530540550560570s80590
25.8x 10-62 3 . 22 2 . 2
2 1 . 8
2 2 . 12 2 . 6
2 3 . 625.2
2 9 . 73 2 . Os 4 234.934. 331.728.3
2 4 . 72 2 62 1 . 52 1 020.620. 520.520.62 0 420.2
20.4
26.5 x 10-62 3 . 52 2 . 3
2 l . 9
2 l . 72 1 8
2 2 . 2'23 .O
L J . I
2 4 . 525 125.42 4 92 3 . 92 3 . l2 2 . 0
2 1 . O20. 52 0 . 52 0 320.320.220.120.o1 9 . 81 9 . 8
1 9 . 8
140.9x 10-696.77 6 . 27 0 . l7 2 . 8
69.1/ - r . u7 3 . 08 3 . 5
104 01 3 2 . 6L I J . L
220.O260.0297 .O3 1 1 . 0300.02 6 5 . 0203.6
144 6105 .38 3 87 5 . 27 2 . 07 0 . 87 2 . 6l + o
/ J . J
l l . o
83 .4
7 5 . 4
146.8x 10-6100.07 3 . 96 5 . 669.4
6 0 468.261 565 .9
7 5 . 089. 1
105 .41 2 2 . 2134.4138 -2l3r.41 1 5 99 7 37 9 . 8
68.76 1 . 15 7 . 656. 65 6 . 55 6 . 4. ) / . . 1
5 8 057 .9. ) 6 - /
60.2
5 8 . 8
600610620630640650660670680690693
700
Several interesting points are i l lustrated in Fig. 4 and Table 5. In bothsamples, the absorption peaks for the ordinary ray occur at 560 mir, whilethe peaks for the extraordinary ray occur at 550 mpr. (When Vogel (1934)investigated absorption in synthetic and natural ruby, he did not presentabsorption curves for both the ordinary and extraordinary rays. He did

REFRACTION AND ABSORPTION IN SVNTHETIC RUBY 969
Fig. 4-Absorption coefficients {or pink and red synthetic rubl''
for the extraordinary ray; while for the 469 mp" and 476 mp bands, the re-
verse holds true.probably the most striking feature of the curves in Fig. 4 is the extreme
difference in pleochroism, or biabsorption (k-h.), of the two samples'
An analysis of the probable sources of error indicates that the average
total error in the calculated absorption coefficients is about three per
cent.
BtAnsonprroN
In the preceding section on absorption, the values of the absorption
coefficients fr, and ft. for pink and red synthetic ruby were presented for
the spectral region 440 mp' to 700 mpr' Biabsorption values (k,-k,) can be
calculated from the values of fr, and ft.. However, biabsorption can also be
measured directly with very l itt le equipment. Biabsorption values for
r. A. MANDARINO
T,trr,r 6. Ver,ues or BrassonprroN ron PrNr eNo Ruo SvNrurrrc RuryDntnnurNrn Vrsuer,r,y axo Pnororr,BcrRrcALly
Pink Ruby
Visual PhotometricDetermination
Red l{uby
Calculatedfrom ft.ancl ka
Visua]Photometric
Determination
, :0.073 cm
Calculatedfrom ft.and k,
l :0 .073 cm.l : 0 341 cm a :u .+ / / cm . l :0 .302 cm
440450460470480490
500510520530540JJI,,
560J / t ,
580590
660670(>80690 I
I700
]
- 0 .8x10 -6- 0 . 8
- 2 . 3- 2 . . )
- 3 . 5- 4 . 9- / . J
- 9 . 1- 1 0 . 1- 9 . 9- 8 . 8- 4 . 7
- 2 . 3- 1 . 6- 0 . 5- 0 . 7- 0 . 5- T J . J
- 2 . 7 x r 0 6- 3 . 7- 5 . 5
- 8 . 5- 9 . 3- 9 2- 7 . 9- 5 . 4
- 3 . 3- 1 8- 1 . 4- 1 . 0- 1 . 2- 7 1
+ 0 8 x 1 0 6+ 0 . 3+ 0 . 1+ 0 1- 0 . 4- o - 4
1 t
- 3 . 7- 5 . 2- 6 . 9- 8 . 8- 1 0 . 0-10.4- 8 6- 6 . 3
- 3 . 7- r 1- 1 . 0- o . 7- 0 3- 0 . 3- 0 . 4- 0 . 6- 0 . 6- o . 4
- 1 3 . 5 x 1 0 6
- 29 .5- 52.4- 7 3 . 3- 9 5 . 4-127 .3- 1 6 5 . 1- 1 9 4 . 5- 193 .0- 1 6 4 . r- 1 1 3 . 0
- 63.9- 3 0 . 4- 2 4 . 7- 2 1 . 0- 1 8 . 8- t J . /
7 . 2
+ . 5 . 9 x 1 0 - 6+ . 3 . 3
2 . 3
- 1 1 . 5- l / . o
- 29.0- 4 3 . 5- 6 7 . 8- 9 7 . 8- r 2 5 . 6- 1 5 8 . 8- r79 .6- 1 8 4 1-167 .7- 1 2 3 . 8
- 7 5 . 9- 44.2- 2 6 . 2- 1 8 . 6- 1 5 5- r 4 . 4- 1 5 3- r o . o- l . ) +- 1 8 . 9
- 1 6 6
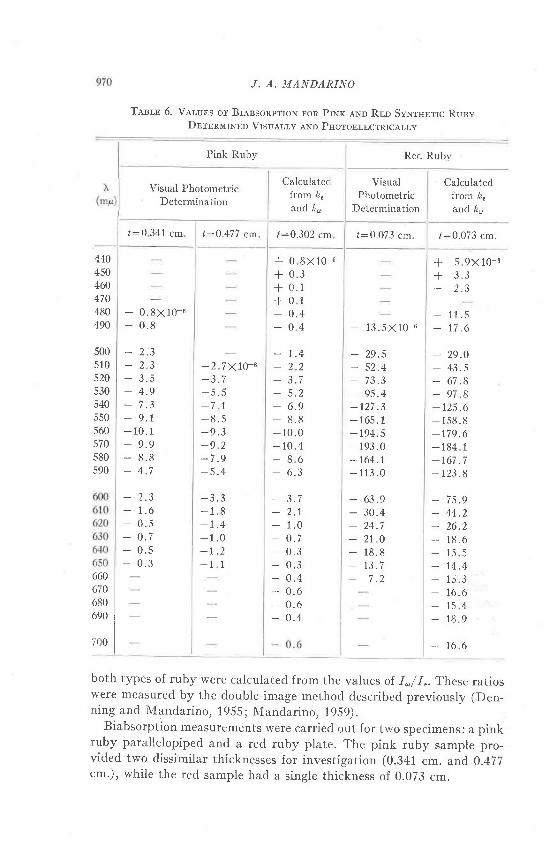
both types of ruby were calculated from the values of I.f 1,. These ratioswere measured by the double-image method described previously (Den-ning and Nfandarino, 1955; Nlandarino, 1959).
Biabsorption measurements were carried out for two specimens: a pinkruby parallelopiped and a red ruby plate. The pink ruby sample pro-vided two dissimilar thicknesses for investigation (0.341 cm. and 0.477cm.), while the red sample had a single thickness of 0.073 cm.
REFRACTION AND ABSORPTION IN SYNTHETIC RUBY 971
values of biabsorption were calculated by substituting the measured
values ol I,fI,and the appropriate constants in the following equation:
\ In(1. /1, ) ( t \Re _ Ra : _+"t -_
These biabsorption values are listed in Table 6 for two thicknesses of
pink ruby and one thickness of red ruby. Table 6 aiso includes the values
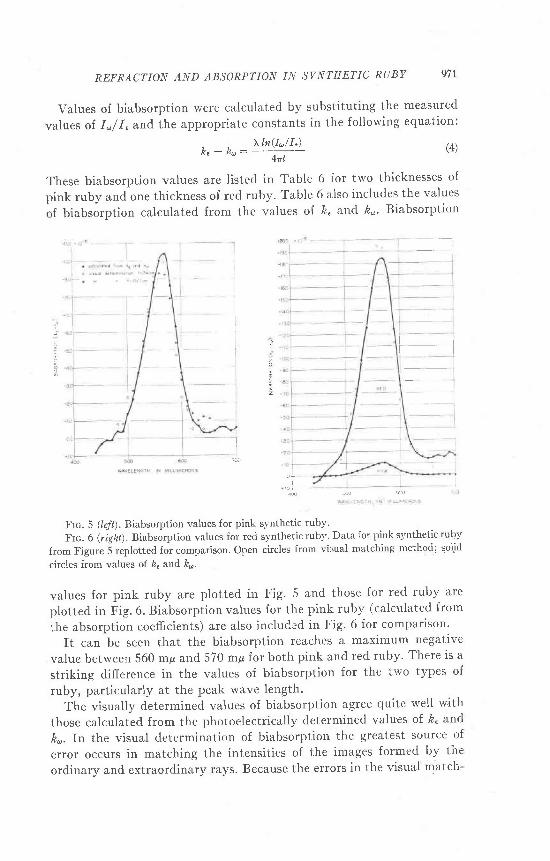
of biabsorption calculated from the values of ft. and ft, ' Biabsorption
! . .
l
Frc. 5 (IeJt). Biabsorption values for pink synthetic ruby.
Frc. 6 (right). Biabsorption vahres for red synthetic ruby. Data for pink synthetic ruby
from Figure i replotted for comparison. Open circles from visual matching methqd; solid
circles from values of h, and kr.
values for pink ruby are plotted in Fig. 5 and those for red ruby are
plotted in Fig. 6. Biabsorption values for the pink ruby (calculated from
the absorption coefficients) are also included in Fig. 6 for comparison.
It can be seen that the biabsorption reaches a maximum negativc
value between 560 mp and 570 mp {or both pink and red ruby' There is a
striking difference in the values of biabsorption for the two types of
ruby, particularly at the peak wave length.
The visually determined values of biabsorption agree quite well w'ith
those calculated from the photoelectrically determined values of ft. and
4.. In the visual determination of biabsorption the greatest source of
error occurs in matching the intensities of the images formed by the
ordinary and extraordinary rays. Because the errors in the visual match-

972 r. A, MANDARINO
Tlnr,n 7. Ppncrnr,r.cn Ennons or Br,\ssonprroN V,q.r,unslon Pnrr .q,ND Rrn SvNrrlnrrc Ruey
Pink Ruby Red Rubyr(mp)
l :0 .341 cm. l :0 .477 cm. l :0.073 cm.
4804905005105205JU
540
560s70580590600610620630640650660
40 7o4 0 %rs 7o1s%lo 707+%< o /J / A
4 %4 %4 %4+%8i%
1 7 %2 s %60 Vof f i %60 7o6 0 %
e%7 %4+%4 %3+%s%s%3+%s+7e %
1 6 %2 r %2 7 %at7 07L t / a
2 7 %
1 2 %s+%s+%2+%2 %2 7 oa o 71 / O
2 %A U. / o
2 %2 %3 %6+%8 %
lo 7o1 1 0 7L \ / O
rs+%2 6 %
ing process are largely psychological, it is difficult to derive equations forthem. However, the reproducibil i ty of the measurements can be deter-mined. Over a period of several weeks, seventy-five I.f I , values were de-termined for each sample at each wave length. A statistical analysis ofthe resulting data yielded the average values and standard deviations ofthe measurements. The effect of the error (standard deviation) in I,f I, onbiabsorption was then calculated for the samples at each wave length.The resulting errors in biabsorption are l isted in TabIe 7.In the region ofmaximum biabsorption (530 mp to 590 mp) the errors in biabsorption aregenerally well below 5/s and do not exceed 10/6.
Corrilrnurs
The next step in this study might be a correlation of the optical prop-erties with the chromium content. But a correlation based on only twoor three* samples would be highly questionable. It should be pointed out,however, that the absorption and biabsorption data for the l imited
x The third sample could be considered as pure Al2O3 with the absorption coefficientsand biabsorption being equal to zero.

REFRACTION AND ABSORPTION IN SYNTHETIC RUBY 973
range of chromium content presented here do follow Bouguer-Beer's law.
According to Sti l lwell (1926), corundum takes on a green color when
the chromium content becomes high (around 30-4570 Cr2OB) . To the
writer's knowledge, no quantitative work has been done through thisrange. It is hoped that corundum samples with higher chromium contentswill become available and thus enable this study to be extended over a
wider range of chromophore concentration.
RnlnnnNcos
DnNNrNc, R., eNn Mano'lmNo, J. (1955), Pleochroism in synthetic ruby: Am. Mineral',
40,1055-1061.H,mnv, A., aNn Prnnru,F. (1932), The Principles of Optics, McGraw-Hill Book Company,
Inc., New York.Koar.rn, R. (1955), Optical Properties of Synthetic Sapphire, Linde Air Products Com-
pany, Indianapol is , Tndiana.
M,tNol.nrNo, J. (1959), Absorption and pleochroism: tu'o much-neglected optical proper-
ties of crystals: Am. Mi.neral ,44r65-77Mnr.czrn, G. (1902), Ueber einige krystallographische Constanten des Korund: Ze?ls.
Kryst . , 35,561-581.Par,acno, C., Brnuex, H., aNn FnoNont, C. (1944), Dana's System of Mineralogy, Vol. I,
John Wilel' and Sons, Inc., New York.
Srrtr,wn'rr, C. (1926), The color of the ruby: Journ Phys. Chem.,3O, lWl-1466
TennaNr, A (1953), The Cary automatic recording spectrophotometer: Photoelectric
Spectrometry Group Bull , no. 6, 143-149.
Vocnr,, P. (1934), Optische Untersuchungen am Smaragd und einigen anderen durch
Chrom gefarbten Mineralien: Neues fafubuch, Beilage Band', Abt. A,68' 401-438'
Manuscript receited Decernber 1, 1958.