The 2015 Philippine Health Statistics
232
The 2015 Philippine Health Statistics Epidemiology Bureau Department of Health
Transcript of The 2015 Philippine Health Statistics
The 2015 Philippine Health
Statistics
Epidemiology Bureau Department of Health
Republic of the Philippines Department of Health
EPIDEMIOLOGY BUREAU Manila
FERCHITO L. AVELINO, MD, PHSAE OIC - Director IV
AGNES BENEGAS-SEGARRA, MD, PHSAE Medical Officer V
Survey, Monitoring and Evaluation Division
STATISTICS AND PUBLICATION SECTION
FE A. SINSON, MA
LEA MYLENE R. REBANAL
THERESA D. TIMBANG, MPA
v
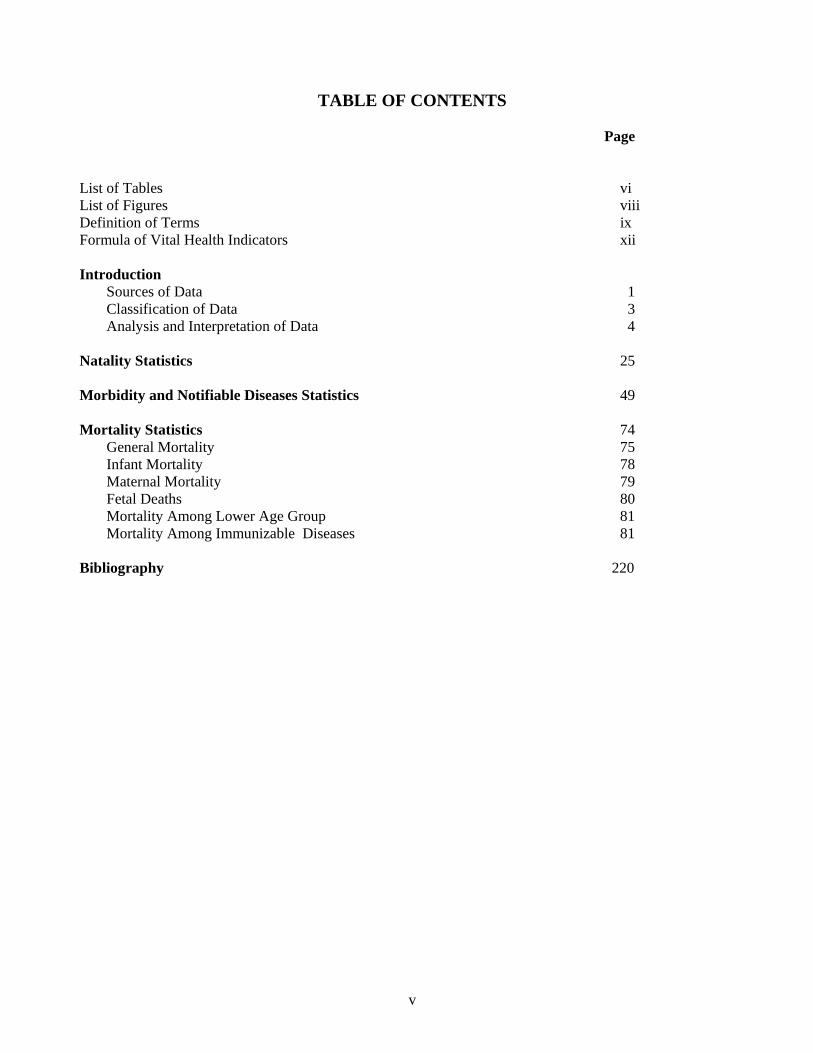
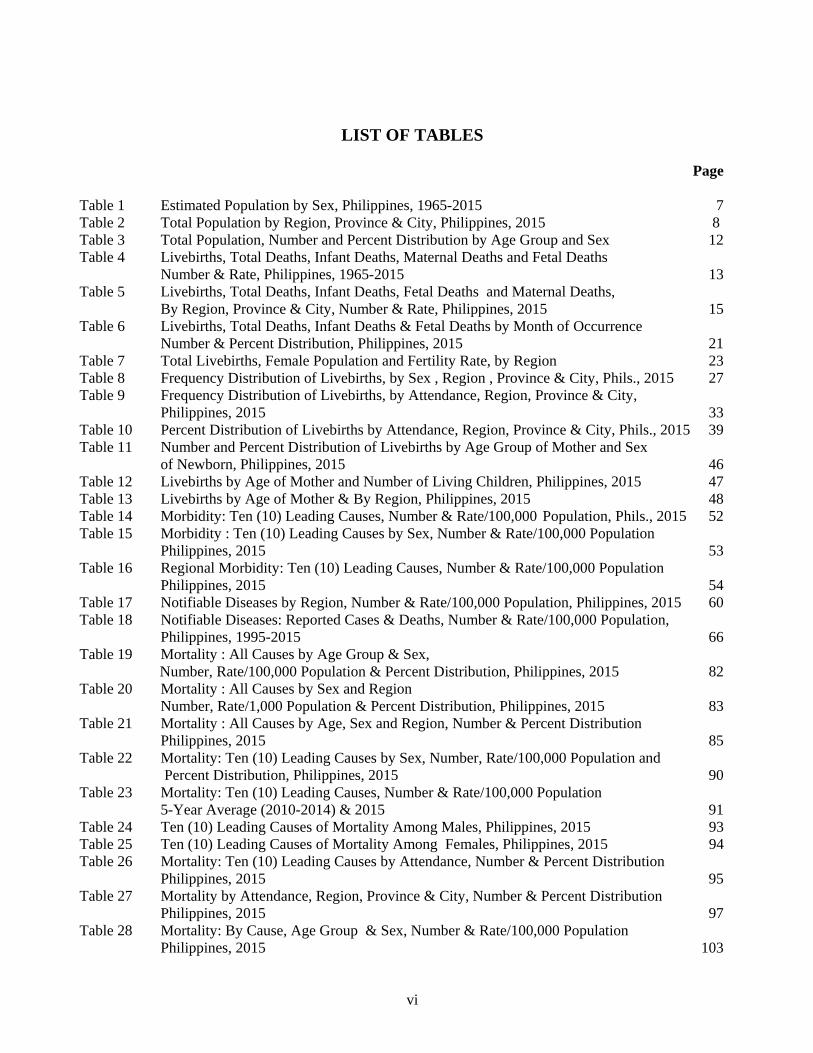
TABLE OF CONTENTS Page List of Tables vi List of Figures viii Definition of Terms ix Formula of Vital Health Indicators xii Introduction
Sources of Data 1 Classification of Data 3 Analysis and Interpretation of Data 4
Natality Statistics 25 Morbidity and Notifiable Diseases Statistics 49 Mortality Statistics 74 General Mortality 75 Infant Mortality 78 Maternal Mortality 79 Fetal Deaths 80 Mortality Among Lower Age Group 81
Mortality Among Immunizable Diseases 81 Bibliography 220
vi
LIST OF TABLES Page Table 1 Estimated Population by Sex, Philippines, 1965-2015 7 Table 2 Total Population by Region, Province & City, Philippines, 2015 8 Table 3 Total Population, Number and Percent Distribution by Age Group and Sex 12 Table 4 Livebirths, Total Deaths, Infant Deaths, Maternal Deaths and Fetal Deaths
Number & Rate, Philippines, 1965-2015 13 Table 5 Livebirths, Total Deaths, Infant Deaths, Fetal Deaths and Maternal Deaths,
By Region, Province & City, Number & Rate, Philippines, 2015 15 Table 6 Livebirths, Total Deaths, Infant Deaths & Fetal Deaths by Month of Occurrence
Number & Percent Distribution, Philippines, 2015 21 Table 7 Total Livebirths, Female Population and Fertility Rate, by Region 23 Table 8 Frequency Distribution of Livebirths, by Sex , Region , Province & City, Phils., 2015 27 Table 9 Frequency Distribution of Livebirths, by Attendance, Region, Province & City, Philippines, 2015 33 Table 10 Percent Distribution of Livebirths by Attendance, Region, Province & City, Phils., 2015 39 Table 11 Number and Percent Distribution of Livebirths by Age Group of Mother and Sex
of Newborn, Philippines, 2015 46 Table 12 Livebirths by Age of Mother and Number of Living Children, Philippines, 2015 47 Table 13 Livebirths by Age of Mother & By Region, Philippines, 2015 48 Table 14 Morbidity: Ten (10) Leading Causes, Number & Rate/100,000 Population, Phils., 2015 52 Table 15 Morbidity : Ten (10) Leading Causes by Sex, Number & Rate/100,000 Population Philippines, 2015 53 Table 16 Regional Morbidity: Ten (10) Leading Causes, Number & Rate/100,000 Population Philippines, 2015 54 Table 17 Notifiable Diseases by Region, Number & Rate/100,000 Population, Philippines, 2015 60 Table 18 Notifiable Diseases: Reported Cases & Deaths, Number & Rate/100,000 Population, Philippines, 1995-2015 66 Table 19 Mortality : All Causes by Age Group & Sex,
Number, Rate/100,000 Population & Percent Distribution, Philippines, 2015 82 Table 20 Mortality : All Causes by Sex and Region
Number, Rate/1,000 Population & Percent Distribution, Philippines, 2015 83 Table 21 Mortality : All Causes by Age, Sex and Region, Number & Percent Distribution Philippines, 2015 85 Table 22 Mortality: Ten (10) Leading Causes by Sex, Number, Rate/100,000 Population and
Percent Distribution, Philippines, 2015 90 Table 23 Mortality: Ten (10) Leading Causes, Number & Rate/100,000 Population 5-Year Average (2010-2014) & 2015 91 Table 24 Ten (10) Leading Causes of Mortality Among Males, Philippines, 2015 93 Table 25 Ten (10) Leading Causes of Mortality Among Females, Philippines, 2015 94 Table 26 Mortality: Ten (10) Leading Causes by Attendance, Number & Percent Distribution Philippines, 2015 95 Table 27 Mortality by Attendance, Region, Province & City, Number & Percent Distribution Philippines, 2015 97 Table 28 Mortality: By Cause, Age Group & Sex, Number & Rate/100,000 Population Philippines, 2015 103

vii
Table 29 Selected Causes of Death by Region, Province & City Number & Rate/100,000 Population, Philippines, 2015 143
Table 30 Mortality: 17 Cause-Groups, Number, Rate & Percent Distribution , Philippines, 2015 197 Table 31 Mortality: Communicable Diseases, Malignant Neoplasm and Diseases of the Heart
Number & Rate/100,000 Population, Philippines, 2015 198 Table 32 Mortality: Ten (10) Leading Causes, Number & Rate/100,000 Population
Philippines, 2015, 2005 & 1995 199 Table 33 Infant Mortality by Smaller Age Groups, Number, Rate/1,000 Livebirths
& Percent Distribution, 5-Year Average (2010-2014) and 2015 201 Table 34 Infant Mortality: Ten (10) Leading Causes, Number, Rate/1,000 Livebirths
& Percent Distribution, Philippines, 2015 202 Table 35 Infant Mortality by Sex and Region, Number & Rate/1,000 Livebirths, Phils., 2015 204 Table 36 Maternal Mortality by Main Cause, Number, Rate/1,000 Livebirths
& Percent Distribution, Philippines, 2015 205 Table 37 Maternal Mortality by Age Group and Region, Number, Rate/1,000 Livebirths
& Percent Distribution, Philippines, 2015 207 Table 38 Fetal Deaths by Type of Attendance and Region, Number and Percent Distribution, Philippines, 2015 212 Table 39 Leading Causes of Fetal Deaths by Birth Weight, Number & Percent Distribution Philippines, 2015 214 Table 40 Fetal Deaths by Age of Mother and Birth Order, Philippines, 2015 217 Table 41 Mortality Among Lower Age Group : Ten Leading Causes by Age Group and Sex
Number and Rate/100,000 Population, Philippines, 2015 218 Table 42 Mortality Among Immunizable Diseases (Age-group Under1; 1-4; 5-9; 10-14 years)
Number & Rate/100,000 Population, Philippines, 2015 219

viii
LIST OF FIGURES
Page Figure 1 Philippine Health Picture, 1995-2015 6 Figure 2 Estimated Population, Philippines, 1965-2015 11 Figure 3 Total Population, Percent Distribution by Age Group and Sex 11 Figure 4 Crude Birth and Death Rates, Rate /1,000 Population, Philippines, 1965-2015 14 Figure 5 Infant and Maternal Death Rates, Rate /1,000 Livebirths, Philippines, 1965-2015 14 Figure 6 Health Indices by Month of Occurrence, Percent Distribution, Philippines, 2015 22 Figure 7 Fertility Rate by Region, Philippines, 2015 24 Figure 8 Livebirths by Attendance, Philippines, 2015 24 Figure 9 Livebirths by Age of Mother and Sex of Newborn, Philippines, 2015 45 Figure 10 Livebirths by Region, Percent Distribution, Philippines, 2015 45 Figure 11 Morbidity: Ten (10) Leading Causes, Rate/100,000 Population, Philippines, 2015 51 Figure 12 Morbidity: Ten (10) Leading Causes by Sex, Rate/100,000 Population, Phils., 2015 51 Figure 13 Morbidity and Mortality Trends, Rate/ 100,000 Population, Philippines, 1995-2015 70 Figure 14 Mortality: All Causes by Age Group, Rate/1,000 Population, Philippines, 2015 84 Figure 15 Mortality: All Causes by Region, Percent Distribution, Philippines, 2015 84 Figure 16 Mortality: Ten (10) Leading Causes, Percent Distribution, Philippines, 2015 92 Figure 17 Mortality: Ten (10) Leading Causes by Sex, Percent Distribution, Philippines, 2015 92 Figure 18 Mortality: Ten (10) Leading Causes by Attendance, Percent Distribution, Phils., 2015 96 Figure 19 Mortality Trend: Communicable Diseases, Malignant Neoplasms and
Diseases of the Heart, Rate/100,000 Population, Philippines, 1965-2015 96 Figure 20 Mortality: Leading Causes, Rate/100,000 Population, Philippines, 2015, 2005 and 1995 200 Figure 21 Infant Mortality by Smaller Age-Groups, Percent Distribution, Philippines, 2015 203 Figure 22 Infant Mortality : Ten (10) Leading Causes, Rate/1,000 Livebirths, Philippines, 2015 203 Figure 23 Maternal Mortality by Main Cause, Percent Distribution, Philippines, 2015 206 Figure 24 Maternal Mortality by Region, Rate/1,000 Livebirths, Philippines, 2015 206 Figure 25 Fetal Deaths by Attendance, Percent Distribution , Philippines, 2015 213 Figure 26 Fetal Deaths by Age of Mother, Ratio / 1,000 Livebirths, Philippines, 2015 213
ix
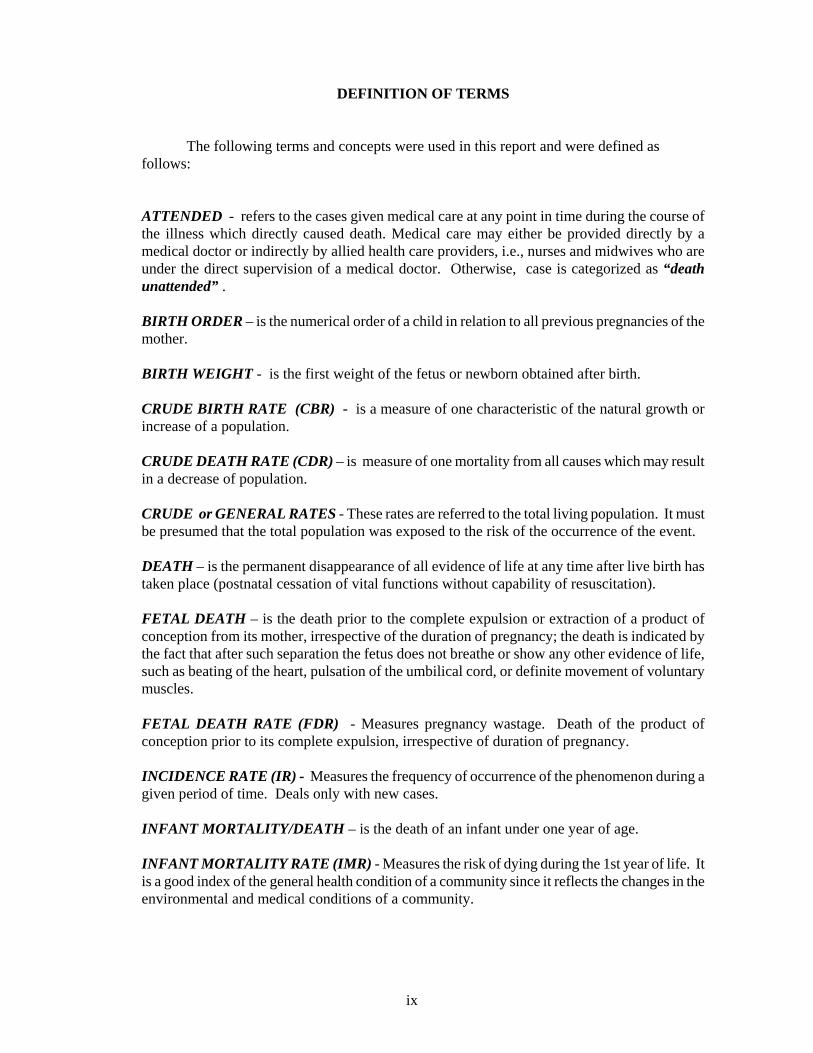
DEFINITION OF TERMS
The following terms and concepts were used in this report and were defined as follows: ATTENDED - refers to the cases given medical care at any point in time during the course of the illness which directly caused death. Medical care may either be provided directly by a medical doctor or indirectly by allied health care providers, i.e., nurses and midwives who are under the direct supervision of a medical doctor. Otherwise, case is categorized as “death unattended” . BIRTH ORDER – is the numerical order of a child in relation to all previous pregnancies of the mother. BIRTH WEIGHT - is the first weight of the fetus or newborn obtained after birth. CRUDE BIRTH RATE (CBR) - is a measure of one characteristic of the natural growth or increase of a population. CRUDE DEATH RATE (CDR) – is measure of one mortality from all causes which may result in a decrease of population. CRUDE or GENERAL RATES - These rates are referred to the total living population. It must be presumed that the total population was exposed to the risk of the occurrence of the event. DEATH – is the permanent disappearance of all evidence of life at any time after live birth has taken place (postnatal cessation of vital functions without capability of resuscitation). FETAL DEATH – is the death prior to the complete expulsion or extraction of a product of conception from its mother, irrespective of the duration of pregnancy; the death is indicated by the fact that after such separation the fetus does not breathe or show any other evidence of life, such as beating of the heart, pulsation of the umbilical cord, or definite movement of voluntary muscles. FETAL DEATH RATE (FDR) - Measures pregnancy wastage. Death of the product of conception prior to its complete expulsion, irrespective of duration of pregnancy. INCIDENCE RATE (IR) - Measures the frequency of occurrence of the phenomenon during a given period of time. Deals only with new cases. INFANT MORTALITY/DEATH – is the death of an infant under one year of age. INFANT MORTALITY RATE (IMR) - Measures the risk of dying during the 1st year of life. It is a good index of the general health condition of a community since it reflects the changes in the environmental and medical conditions of a community.

x
LATE FETAL DEATH – is the death of fetus with 28 or more completed weeks of gestation. LIVE BIRTH – is the complete expulsion or extraction from its mother of a product of conception, irrespective of the duration of the pregnancy, which after such separation, breathes or shows any other evidence of life, such as beating of the heart, pulsation of the umbilical cord, or definite movement of voluntary muscles, whether or not the umbilical cord has been cut or the placenta is attached; each product of such birth is considered liveborn. MATERNAL MORTALITY/DEATH – is the death of a woman while pregnant or within 42 days of termination of pregnancy, irrespective of the duration and the site of the pregnancy, from any cause related to or aggravated by the pregnancy or its management, but not from accidental or incidental causes. MATERNAL MORTALITY RATE (MMR) - It measures the risk of dying from causes related to pregnancy, childbirth and puerperium. It is an index of the obstetrical care needed and received by the women in a community. NEONATAL DEATH – is the death among live births during the first 28 completed days of life. NEONATAL DEATH RATE (NDR) - Measures the risk of dying during the 1st month of life. May serve as index of the effects of prenatal care and obstetrical management on the newborn. PLACE OF OCCURRENCE - refers to the place where the vital event took place. PREVALENCE RATE (PR) - Measures the proportion of the population which exhibits a particular disease at a particular time. This can only be determined following a survey of the population concerned. Deals with total (old and new) number of cases. PROPORTIONATE MORTALITY (PM) - Shows the numerical relationship between deaths from a cause (or groups of causes), age (or groups of age) etc. and the total number of deaths from all causes in all ages taken together. Not a measure of risk of dying. RATE - In Vital Statistics, a rate shows the relationship between a vital event and those persons exposed to the occurrence of said event, within a given area and during a specified unit of time. It is evident that the persons experiencing the event (the numerator) must come from the total population exposed to the risk of same event (the denominator). RATIO - It is used to describe the relationship between two (2) numerical quantities or measures of events without taking particular considerations to the time or place. These quantities need not necessarily represent the same entities, although the unit of measure must be the same for both numerator and denominator of the ratio. SPECIFIC DEATH RATE - Describes more accurately the risk of exposure of certain classes or groups to particular diseases. To understand the forces of mortality, the rates should be made specific provided the data are available for both the population and the event in their specifications. Specific rates render more comparable results and thus, reveal the problems of public health.
xi
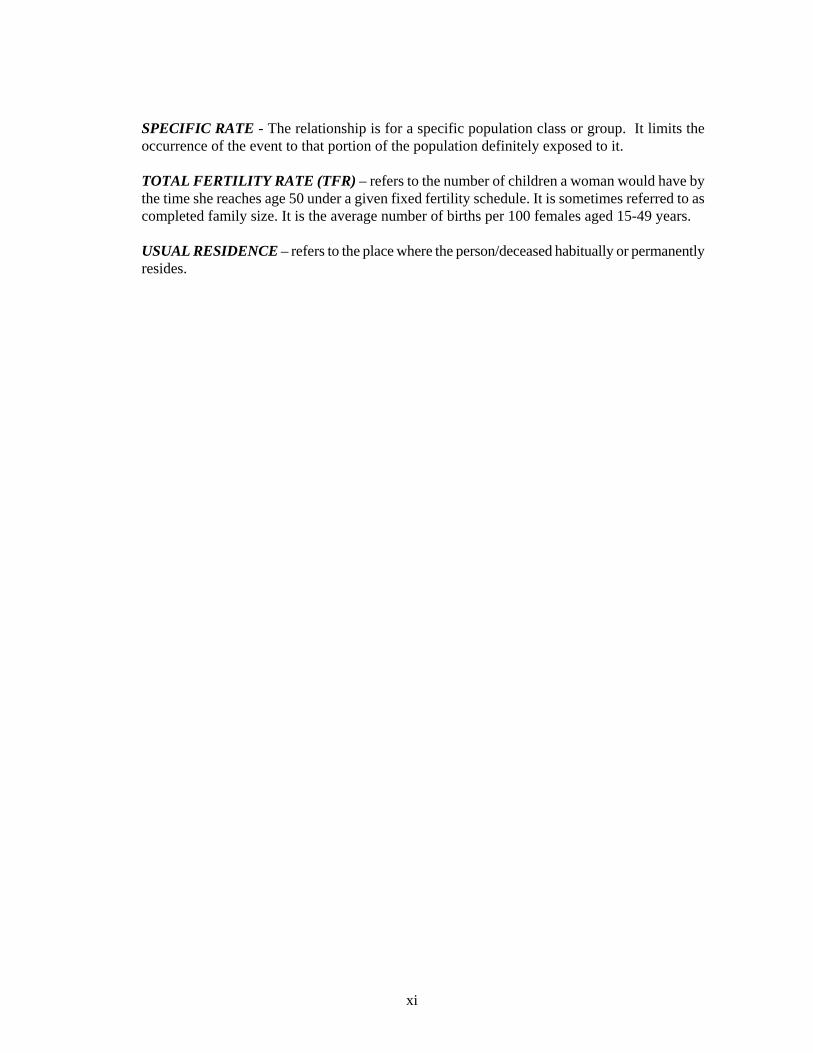
SPECIFIC RATE - The relationship is for a specific population class or group. It limits the occurrence of the event to that portion of the population definitely exposed to it. TOTAL FERTILITY RATE (TFR) – refers to the number of children a woman would have by the time she reaches age 50 under a given fixed fertility schedule. It is sometimes referred to as completed family size. It is the average number of births per 100 females aged 15-49 years. USUAL RESIDENCE – refers to the place where the person/deceased habitually or permanently resides.
xii
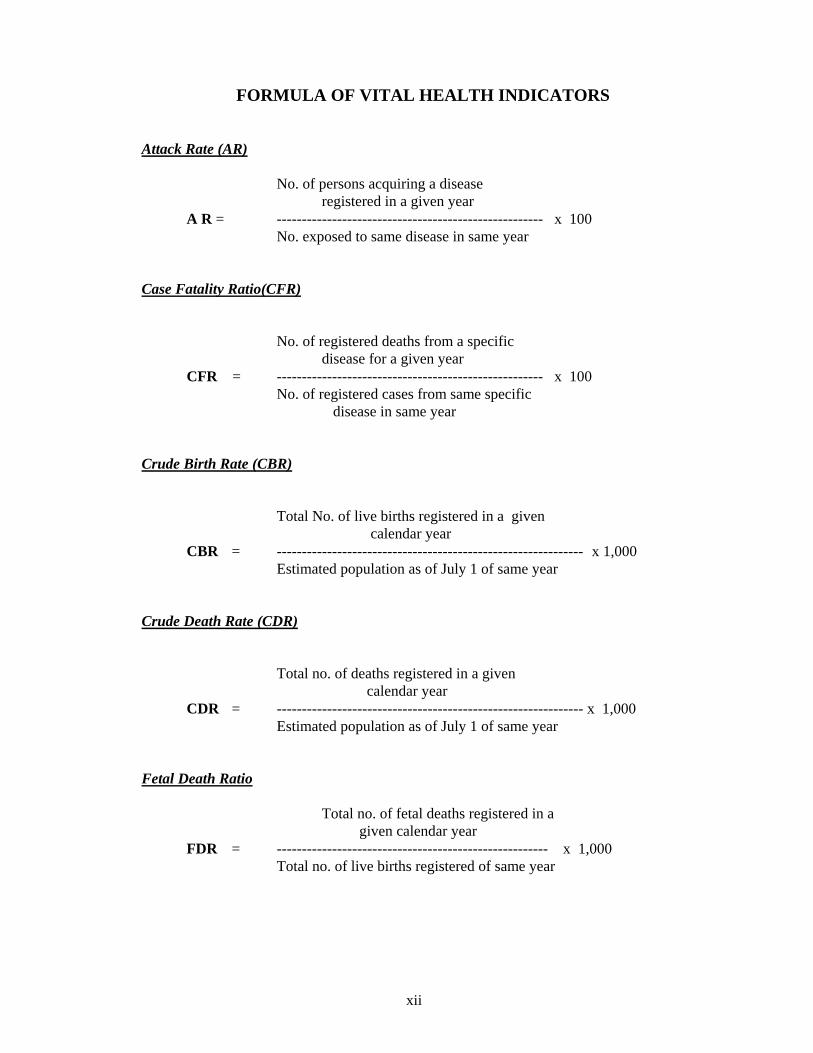
FORMULA OF VITAL HEALTH INDICATORS Attack Rate (AR) No. of persons acquiring a disease
registered in a given year A R = ----------------------------------------------------- x 100
No. exposed to same disease in same year Case Fatality Ratio(CFR)
No. of registered deaths from a specific disease for a given year
CFR = ----------------------------------------------------- x 100 No. of registered cases from same specific
disease in same year Crude Birth Rate (CBR)
Total No. of live births registered in a given calendar year
CBR = ------------------------------------------------------------- x 1,000 Estimated population as of July 1 of same year
Crude Death Rate (CDR)
Total no. of deaths registered in a given calendar year
CDR = ------------------------------------------------------------- x 1,000 Estimated population as of July 1 of same year
Fetal Death Ratio
Total no. of fetal deaths registered in a given calendar year
FDR = ------------------------------------------------------ x 1,000 Total no. of live births registered of same year

xiii
Fetal Death Rate
Total no. of fetal deaths registered in a given calendar year
FDR = ------------------------------------------------------------- x 1,000 Total no. of births (livebirths and fetal deaths) registered of same year
Incidence Rate (IR)
No. of new cases of a particular disease registered during a specified period of time
I R = ---------------------------------------------------- x 100,000 Population at risk
Infant Mortality Rate (IMR)
Total no. of deaths under 1 year of age registered in a given calendar year
IMR = --------------------------------------------------------- x 1,000 Total no. of registered live births of same
calendar year
Maternal Mortality Ratio (MMR)
Total no. of deaths from maternal causes registered for a given year
MMR = ------------------------------------------------------------- x 1,000 Total no. of live births registered of same year
Maternal Mortality Rate (MMR)
Total no. of deaths from maternal causes registered for a given year
MMR = ------------------------------------------------------------- x 1,000 Total no. of women under reproductive age
Neonatal Death Rate (NDR)
No. of deaths under 28 days of age registered in a given calendar year NDR = ------------------------------------------------------------- x 1,000
No. of live births registered of same year

xiv
Prevalence Rate (PR)
No. of new and old cases of a certain disease registered at a given time
P R = ----------------------------------------------------- x 100 Total no. of persons examined at same
given time
Proportionate Mortality (PM) No. of registered deaths from a specific cause
or age for a given calendar year P M = ------------------------------------------------------ x 100
No. of registered deaths from all causes, all ages in same year
Specific Death Rate (SDR)
Deaths in specific class or group registered in a given calendar year
Specific = --------------------------------------------------------- x 100,000 Death Rate Estimated population as of July 1 in same
specified class or group of said year
Examples: No. of deaths from a specific cause registered in a given calendar year
Cause-specific = ------------------------------------------------ x 100,000 Death Rate Estimated population as of July 1st
of same year No. of deaths in a particular age group
registered in a given calendar year Age-specific = ---------------------------------------------------- x 100,000
Death Rate Estimated population as of July 1st in same age group of same year
No. of deaths of a certain sex registered
in a given calendar year Sex-specific = ----------------------------------------------------- x 100,000 Death Rate Estimated population as of July 1 in same
sex for same year

1
INTRODUCTION
The Philippine Health Statistics (PHS) series is the Department of Health’s (DOH)
annual publication that compiles statistics on vital health events. It provides comprehensive
summary of the country’s current statistics on Natality, Morbidity and Mortality.
The PHS is a product of the collaborative and coordinated efforts of the Philippine
Statistics Authority (PSA), this Department and our partners from the local health units. The
statistical data on births, deaths and population estimates were provided by the PSA and data
on notifiable diseases were collected through the DOH’s Field Health Service Information
System (FHSIS). The data from these two sources were summarized, analyzed, interpreted
and presented in tables and graphs for a more meaningful and useful information.
In addition, morbidity and notifiable diseases data were incorporated to give a
comprehensive comparison between morbidity and mortality statistics
The PHS is intended to serve as one of the bases of health administrators at various
levels of health sectors for planning, implementation and assessment of health programs and
services. These data can also be utilized to assess costs of health care, develop and improve
health interventions, or identify targets for health programs. These are also important tools
not only for planning but also for monitoring and evaluation of health programs. Likewise,
statistical data in this publication can also be beneficial to the researchers, academicians,
local government executives and other stakeholders.
The Department of Health (DOH) through the Epidemiology Bureau (EB), as an
advocate for evidence-based decision making at all levels of the public health systems,
believes that vital health statistics provide some measures of progress of the nation, thus, the
2015 Philippine Health Statistics is hereby presented
A. SOURCES OF DATA
1. Natality and Mortality Statistics
Effective March 1973 a collaborative program was drawn with the
National Statistics Office (NSO), now known as PSA as per RA 10625,
otherwise known as the Philippine Statistical Act of 2013, whereby that Office
shall provide basic tabulation on births and deaths. Summary tables on births,
deaths, infant and fetal deaths were taken from the said Office. The basis of
the registration of vital events regarding births and deaths is Republic Act No.
3753 otherwise known as the Civil Registry Law. By virtue of Commonwealth
Act 591, the Administrator of NSO will be the concurrently Civil Registrar-
General with all local civil registrars under his supervision. In the cities, the
local civil registrars are also the officials designated in their respective city
charters, generally the City Health Officers, while in regular municipalities
and municipal districts, the municipal treasurers and municipal district
treasurers act as local civil registrar respectively. Each vital event is registered
in the office of the civil registrar of the locality where the event occurred and a

2
copy of each document is sent to the Office of the Civil Registrar General of
the PSA for processing and archiving.
Statistics were obtained from Death Certificate (Municipal Form No.
103) and Certificate of Live Birth (Municipal Form No. 102).
The Vital Statistics Division of the PSA consolidates and tabulates
total counts of registered live births and deaths. Fetal and infant deaths have
separate tables for deaths by cause, while, causes of maternal death were lifted
from deaths by age group and by cause.
By virtue of a Memorandum of Agreement between the PSA and
DOH, the former furnishes the DOH copies of summary tables of the number
of live births and deaths. The latter then computes rates and percentages of
different indicators significant to the needs of its various clients and
stakeholders. Some tables come with graphs and textual analysis for better
understanding and utilization of data.
2. Notifiable Disease Statistics
Data on Notifiable Diseases is based on information submitted by
health personnel of different Rural Health Units (RHUs), City Health Offices
(CHOs) or Municipal Health Offices (MHOs) and Provincial Health Offices
(PHOs). The Law on Reporting of Notifiable Diseases (Act 3573) mandates
the immediate reporting of any Notifiable Disease to the nearest health officer.
All field health officers, by means of established reporting mechanism
(Memorandum Order No. 51-a.s. 1960) submit weekly morbidity reports
(Forms W1-a and W1-b) to the Epidemiology Bureau (EB) where such data
received are then classified, compiled, analyzed and interpreted. The complete
report is presented in Field Health Service Information System (FHSIS)
Annual Report.
On July 27, 2001, a DOH Department Circular No. 176, series of 2001
was issued for a revised list of Notifiable or Reportable Diseases which now
includes the ICD-10 code of each case except for Acute Watery Diarrhea and
Acute Bloody Diarrhea.
3. Population Statistics
The population statistics presented in this report was the result of the
2015 Census of Population undertaken by the Philippine Statistics Authority
(PSA) in August 2015. The tables of population utilized in this report were
Regional Total Population by Province, City, Municipality and Barangay as of
August 1, 2015 and Total Population by Age Group, Sex and Region 2015.
Total population is the sum of the household population and institutional
population. It also includes Filipinos in Philippine embassies, consulates, and
mission abroad.
3
B. CLASSIFICATION OF DATA
Classification of health statistics and population statistics must be made
according to the similarly defined system and tabulated in comparable groups in
order to make use of the principal value of both data. Thus, variables common to
both, i.e., geographic area, age and sex have been similarly classified and
tabulated in this report.
1. Geographic Classification
Data on Notifiable Diseases have been classified by place of
occurrence. First by region which is a geographical division created as a result
of the reorganization of the Department of Health (DOH), then, by province
and city that were political divisions of the country. There are seventeen (17)
regions, eighty (80) provinces and one hundred twenty-one (121) cities. The
National Capital Region (NCR) has one (1) more municipality which is
Pateros. There is no classification as to whether it is rural or urban because of
the lack of established criteria.
Natality and mortality data were classified geographically either by
place of occurrence or by usual residence. Usual residence refers to the place
where the person habitually or permanently resides. Data on deaths by place of
usual residence of the deceased are used to prepare population estimates and
projections. These data include birth or death that occurred in the Philippines
and the deceased were residents of other countries which fall under
classification “foreign countries”. On the other hand, classification of data by
place of occurrence considered the actual place in the Philippines where vital
event occurred not prioritizing the usual residence of the deceased.
2. Age
There is no valid information with regard to the accuracy of age of a
reported morbid case. Regarding the registered deaths, the age of deceased is
fully determined by the date of birth. However, some of the vital records are
submitted with the age not recorded or the date of birth not indicated. Thus,
misstatement of age on vital records may be assumed to some degree. The age
classification or age groupings used in this report are consistent with those
recommended for international use by the World Health Organization.
3. Diseases and Causes of Death
The Mortality statistics was tabulated based on the underlying cause of
death documented on the medical certificate of cause of death. The underlying
cause has been defined as the disease or injury which initiated the train of
morbid events leading directly to death; or the circumstances of the accident or
violence which produced the fatal injury. The selected cause of death does not
include symptoms and modes of dying, such as heart failure or respiratory
failure.
4
On the other hand, Morbidity statistics was tabulated based on the
report submitted through FHSIS from the list of Notifiable Diseases. Other
diseases not on the list were also reported as it occurred in the population.
These were then summarized and ranked according to the number of cases per
reported disease.
The Morbidity and Mortality statistics in this publication were
classified and tabulated in accordance with the International Classification of
Diseases, Version 10 (ICD-10). Mortality Tabulation List 1 was used to
tabulate Mortality by Cause, Age Group and Sex. The structure of the ICD-10
code is alphanumeric. The first character of the code is an alpha character, A
to Z, followed by 2, 3 or 4 numeric character. Some 3 character categories are
further subdivided into sub-categories to enable coding of a disease or
condition as specific as possible
4. Sex
Classification by sex is made in relation to other factors such as age,
and geographical location. Thus, some tabulation presented in this report may
be considered as four-fold tables with sex as one of the attributes of
classifications.
C. ANALYSIS AND INTERPRETATION OF DATA
Vital statistics are essential in planning, operating and evaluating
programs not only on health but also in some aspects too like, transport,
agricultural production, employment, housing, among others. They are very
useful for a variety of administrative and research purposes. However, they
cannot correctly be interpreted unless pertinent qualifying factors are taken
into consideration.
Some of the factors limiting the use of statistical data emanate from
discrepancies in the original records or from the impracticability of tabulating
these data in very detailed items. While these defects do exist, nevertheless,
the value of these data for original purposes is indispensable. The exact
evaluation of health statistics or the analysis of small differences necessitates
careful study of a variety of related elements. However, the major trends and
differences may not be altered materially by finer analysis.
1. Small Frequencies
The number of births and deaths reported for an area or community, or
the number of ailments, represents complete counts of such events. Such
being the case, they are not subject to sampling errors although they are
subject to errors in the registration process or reporting system. When data
is used for analytical purposes, as for example, the comparison of rate over
a time period or for different areas, the number of events that actually
occurred may be considered as one of a large series of possible results that

5
could have rise under the same circumstances. In accordance with certain
statistical assumptions, the probable range of values may be estimated
from the actual figures.
2. Computation of Statistical Indices
In the computation of statistical indices for the Philippines and each
region, province and city, the standard formulae are used. Thus, the crude
birth and death rates are computed per 1,000 population; the infant,
neonatal and maternal death rates and fetal death ratio are per 1,000 live
births; and the specific diseases morbidity and mortality rates classified
either by age, sex or age and sex are computed per 100,000 population. If
it is further tabulated by age, it is computed per 100,000 population of that
specific age group.
3. Completeness of Registration and Notification
In the Philippines, although the law provides for a compulsory
registration of births, deaths and fetal deaths and the reporting of
Notifiable Diseases (Act 3573) there are deficiencies in the observance of
the law due to a variety of factors. In the interpretation of these data,
caution must be observed as the data were not adjusted for under
registration or underreporting. Marked fluctuations in vital events totals for
some specific areas do not necessarily reflect differentials in fertility or
mortality level but rather could be indications of variations in registration
coverage. In the case of notifiable diseases, sources of data are the RHUs
and BHSs in the country, thus cases identified or confirmed in hospitals
and other private facilities may not be included in the report unless these
private practitioners submit Notifiable Diseases or report to their
respective city or provincial health offices. Completeness in the reporting
of notifiable diseases varies greatly by disease and by area. In general and
from all indications, reporting is apparently incomplete.

6
Philippine Health Picture 1995- 2015
TOTAL POPULATION
Increased from 68,616,536 to 100,979,303 47% Increase
CRUDE BIRTH RATE Decreased from 24.0 to 17.3
28% Decrease
CRUDE DEATH RATE Increased from 4.7 to 5.6
19% Increase
INFANT DEATH RATE Declined from 18.6 to 11.9
36% Decrease
MATERNAL DEATH RATE Increased from 0.9 to 1.0
11% Increase
FETAL DEATH RATIO Declined from 5.9 to 4.4
25% Decrease
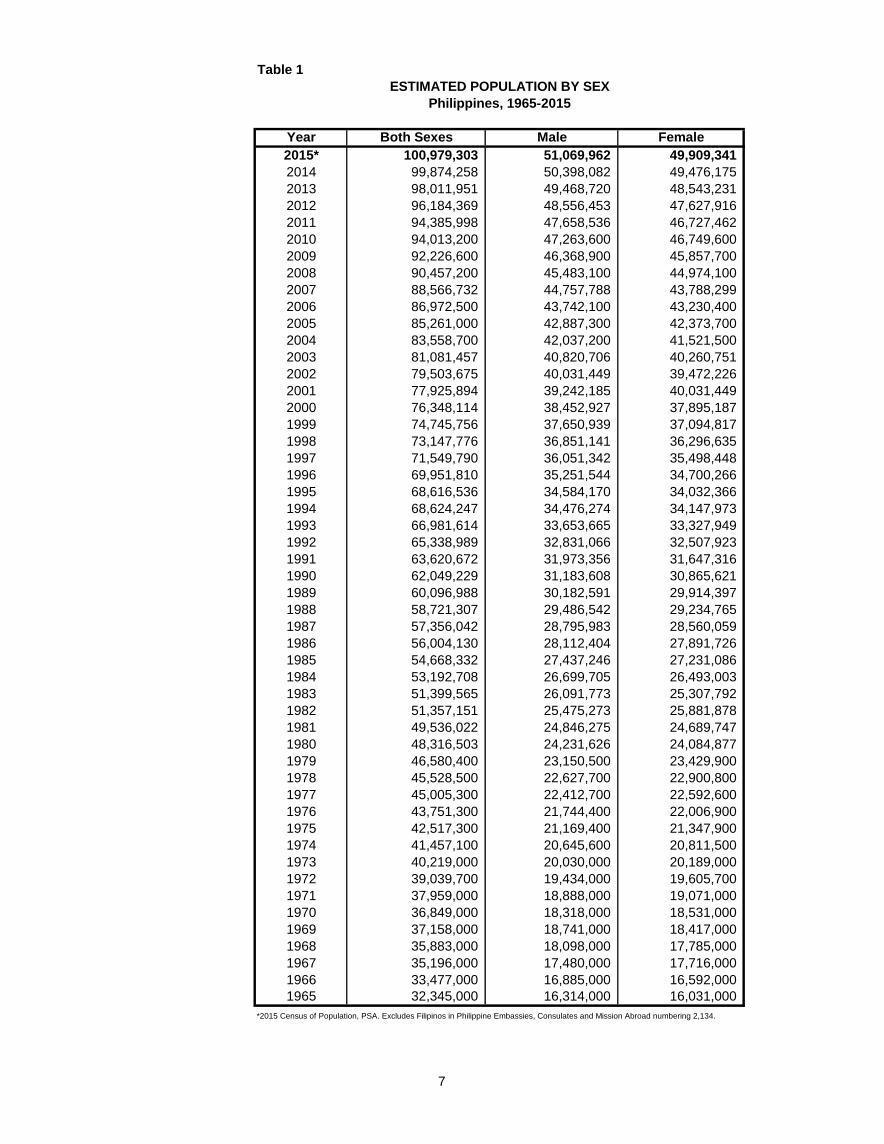
Table 1
Year Both Sexes Male Female
2015* 100,979,303 51,069,962 49,909,341
2014 99,874,258 50,398,082 49,476,175
2013 98,011,951 49,468,720 48,543,231
2012 96,184,369 48,556,453 47,627,916
2011 94,385,998 47,658,536 46,727,462
2010 94,013,200 47,263,600 46,749,600
2009 92,226,600 46,368,900 45,857,700
2008 90,457,200 45,483,100 44,974,100
2007 88,566,732 44,757,788 43,788,299
2006 86,972,500 43,742,100 43,230,400
2005 85,261,000 42,887,300 42,373,700
2004 83,558,700 42,037,200 41,521,500
2003 81,081,457 40,820,706 40,260,751
2002 79,503,675 40,031,449 39,472,226
2001 77,925,894 39,242,185 40,031,449
2000 76,348,114 38,452,927 37,895,187
1999 74,745,756 37,650,939 37,094,817
1998 73,147,776 36,851,141 36,296,635
1997 71,549,790 36,051,342 35,498,448
1996 69,951,810 35,251,544 34,700,266
1995 68,616,536 34,584,170 34,032,366
1994 68,624,247 34,476,274 34,147,973
1993 66,981,614 33,653,665 33,327,949
1992 65,338,989 32,831,066 32,507,923
1991 63,620,672 31,973,356 31,647,316
1990 62,049,229 31,183,608 30,865,621
1989 60,096,988 30,182,591 29,914,397
1988 58,721,307 29,486,542 29,234,765
1987 57,356,042 28,795,983 28,560,059
1986 56,004,130 28,112,404 27,891,726
1985 54,668,332 27,437,246 27,231,086
1984 53,192,708 26,699,705 26,493,003
1983 51,399,565 26,091,773 25,307,792
1982 51,357,151 25,475,273 25,881,878
1981 49,536,022 24,846,275 24,689,747
1980 48,316,503 24,231,626 24,084,877
1979 46,580,400 23,150,500 23,429,900
1978 45,528,500 22,627,700 22,900,800
1977 45,005,300 22,412,700 22,592,600
1976 43,751,300 21,744,400 22,006,900
1975 42,517,300 21,169,400 21,347,900
1974 41,457,100 20,645,600 20,811,500
1973 40,219,000 20,030,000 20,189,000
1972 39,039,700 19,434,000 19,605,700
1971 37,959,000 18,888,000 19,071,000
1970 36,849,000 18,318,000 18,531,000
1969 37,158,000 18,741,000 18,417,000
1968 35,883,000 18,098,000 17,785,000
1967 35,196,000 17,480,000 17,716,000
1966 33,477,000 16,885,000 16,592,000
1965 32,345,000 16,314,000 16,031,000
*2015 Census of Population, PSA. Excludes Filipinos in Philippine Embassies, Consulates and Mission Abroad numbering 2,134.
ESTIMATED POPULATION BY SEX
Philippines, 1965-2015
7

Table 2
Area Population Population
PHILIPPINES 100,981,437 Tuguegarao City 153,502City of Cauayan 129,523
NATIONAL CAPITAL REGION 12,877,253 Ilagan City 145,568City of Santiago 134,830
City of Manila 1,780,148City of Mandaluyong 386,276 REGION III - CENTRAL LUZON 11,218,177City of Marikina 450,741City of Pasig 755,300 Aurora 214,336Quezon City 2,936,116 Bataan 664,589City of San Juan 122,180 Bulacan 2,256,825Kalookan City 1,583,978 Nueva Ecija 1,476,665City of Malabon 365,525 Pampanga 1,640,652City of Navotas 249,463 Tarlac 1,023,534City of Valenzuela 620,422 Zambales 590,848City of Las Piñas 588,894City of Makati 582,602 City of Balanga 96,061City of Muntinlupa 504,509 City of Malolos 252,074City of Parañaque 665,822 City of Meycauayan 209,083Pasay City 416,522 City of San Jose Del Monte 574,089Pateros 63,840 Cabanatuan City 302,231Taguig City 804,915 City of Gapan 110,303
Science City of Muñoz 81,483CORDILLERA ADMINISTRATIVE REGION 1,722,006 Palayan City 41,041
San Jose City 139,738Abra 241,160 Angeles City 411,634Apayao 119,184 Mabalacat City 250,799Benguet 446,224 City of San Fernando 306,659Ifugao 202,802 City of Tarlac 342,493Kalinga 212,680 Olangapo City 233,040Mt. Province 154,590
REGION IVA - CALABARZON 14,414,774Baguio City 345,366
Batangas 1,858,709REGION I - ILOCOS 5,026,128 Cavite 1,370,885
Laguna 993,178Ilocos Norte 426,755 Quezon 1,756,803Ilocos Sur 575,166 Rizal 2,107,841La Union 664,841Pangasinan 2,374,236 Batangas City 329,874
Lipa City 332,386City of Batac 55,201 City of Tanauan 173,366Laoag City 111,125 Bacoor City 600,609City of Candon 60,623 Cavite City 102,806City of Vigan 53,879 City of Dasmariñas 659,019City of San Fernando 121,812 City of General Trias 314,303City of Alaminos 89,708 Imus City 403,785Dagupan City 171,271 Tagaytay City 71,181San Carlos City 188,571 Trece Martires City 155,713City of Urdaneta 132,940 City of Biñan 333,028
Cabuyao City 308,745REGION II - CAGAYAN VALLEY 3,451,410 City of Calamba 454,486
San Pablo City 266,068Batanes 17,246 City of San Pedro 325,809Cagayan 1,045,818 City of Santa Rosa 353,767Isabela 1,183,645 City of Tayabas 99,779Nueva Vizcaya 452,287 Lucena City 266,248Quirino 188,991 City of Antipolo 776,386
Population counts for the regions do not add up to the national total. The national total includes 2,134 Filipinos in Philippine Embassies,Consulates and Mission Abroad who were not included in regional counts.
TOTAL POPULATIONBy Region, Province & City
Philippines, 2015
Area
Source: Philippine Statistics Authority, 2015 Census of Population
8
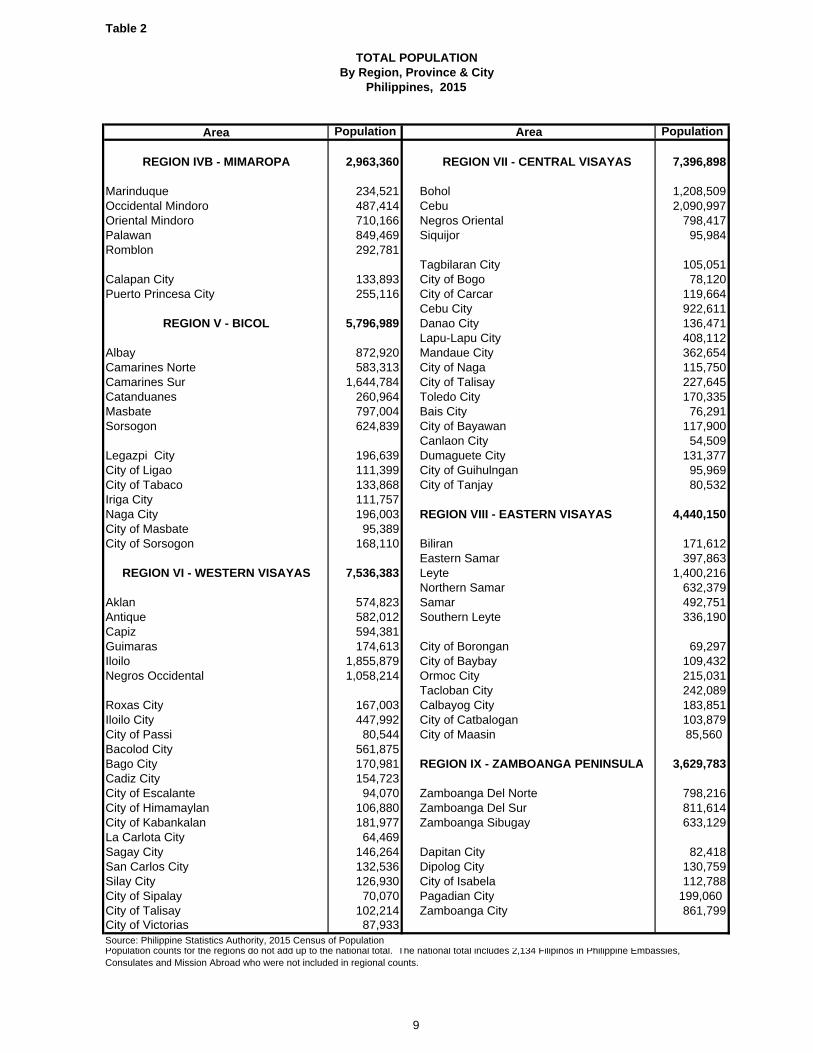
Table 2
Area Population Population
REGION IVB - MIMAROPA 2,963,360 REGION VII - CENTRAL VISAYAS 7,396,898
Marinduque 234,521 Bohol 1,208,509Occidental Mindoro 487,414 Cebu 2,090,997Oriental Mindoro 710,166 Negros Oriental 798,417Palawan 849,469 Siquijor 95,984Romblon 292,781
Tagbilaran City 105,051Calapan City 133,893 City of Bogo 78,120Puerto Princesa City 255,116 City of Carcar 119,664
Cebu City 922,611REGION V - BICOL 5,796,989 Danao City 136,471
Lapu-Lapu City 408,112Albay 872,920 Mandaue City 362,654Camarines Norte 583,313 City of Naga 115,750Camarines Sur 1,644,784 City of Talisay 227,645Catanduanes 260,964 Toledo City 170,335Masbate 797,004 Bais City 76,291Sorsogon 624,839 City of Bayawan 117,900
Canlaon City 54,509Legazpi City 196,639 Dumaguete City 131,377City of Ligao 111,399 City of Guihulngan 95,969City of Tabaco 133,868 City of Tanjay 80,532Iriga City 111,757Naga City 196,003 REGION VIII - EASTERN VISAYAS 4,440,150City of Masbate 95,389City of Sorsogon 168,110 Biliran 171,612
Eastern Samar 397,863REGION VI - WESTERN VISAYAS 7,536,383 Leyte 1,400,216
Northern Samar 632,379Aklan 574,823 Samar 492,751Antique 582,012 Southern Leyte 336,190Capiz 594,381Guimaras 174,613 City of Borongan 69,297Iloilo 1,855,879 City of Baybay 109,432Negros Occidental 1,058,214 Ormoc City 215,031
Tacloban City 242,089Roxas City 167,003 Calbayog City 183,851Iloilo City 447,992 City of Catbalogan 103,879City of Passi 80,544 City of Maasin 85,560 Bacolod City 561,875Bago City 170,981 REGION IX - ZAMBOANGA PENINSULA 3,629,783Cadiz City 154,723City of Escalante 94,070 Zamboanga Del Norte 798,216City of Himamaylan 106,880 Zamboanga Del Sur 811,614City of Kabankalan 181,977 Zamboanga Sibugay 633,129La Carlota City 64,469Sagay City 146,264 Dapitan City 82,418San Carlos City 132,536 Dipolog City 130,759Silay City 126,930 City of Isabela 112,788City of Sipalay 70,070 Pagadian City 199,060 City of Talisay 102,214 Zamboanga City 861,799City of Victorias 87,933
Area
Source: Philippine Statistics Authority, 2015 Census of PopulationPopulation counts for the regions do not add up to the national total. The national total includes 2,134 Filipinos in Philippine Embassies,Consulates and Mission Abroad who were not included in regional counts.
TOTAL POPULATION
Philippines, 2015By Region, Province & City
9

Table 2
Area Population Population
REGION X - NORTHERN MINDANAO 4,689,302 REGION XII - SOCCSKSARGEN 4,545,276
Bukidnon 1,047,608 Cotabato 1,239,552Camiguin 88,478 Saranggani 544,261Lanao del Norte 676,395 South Cotabato 740,347Misamis Occidental 326,530 Sultan Kudarat 713,779Misamis Oriental 763,861
Cotabato City 299,438City of Malaybalay 174,625 City of Kidapawan 140,195City of Valencia 192,993 General Santos City 594,446Iligan City 342,618 City of Koronadal 174,942Oroquieta City 70,757 City of Tacurong 98,316Ozamis City 141,828Tangub City 63,011 REGION XIII - CARAGA 2,596,709Cagayan de Oro City 675,950Gingoog City 124,648 Agusan del Norte 280,864
Agusan del Sur 597,451REGION XI - DAVAO 4,893,318 Surigao del Norte 330,951
Surigao del Sur 441,351Compostela Valley 736,107 Dinagat Islands 127,152Davao 468,166Davao Del Sur 463,195 City of Cabadbaran 73,639Davao Oriental 417,817 Butuan City 337,063Davao Occidental 316,342 City of Bayugan 103,202
Surigao City 154,137City of Panabo 184,599 City of Bislig 94,535Island Garden City of Samal 104,123 City of Tandag 56,364City of Tagum 259,444Davao City 1,632,991 AUTONOMOUS REGION OF MUSLIM MINDANAO 3,781,387City of Digos 169,393City of Mati 141,141 Basilan 271,797
Lanao del Sur 843,644Maguindanao 1,173,933Sulu 824,731Tawi-tawi 390,715
City of Lamitan 74,782Marawi City 201,785
Source: Philippine Statistics Authority, 2015 Census of PopulationPopulation counts for the regions do not add up to the national total. The national total includes 2,134 Filipinos in Philippine Embassies,Consulates and Mission Abroad who were not included in regional counts.
By Region, Province & City
Area
Philippines, 2015
TOTAL POPULATION
10
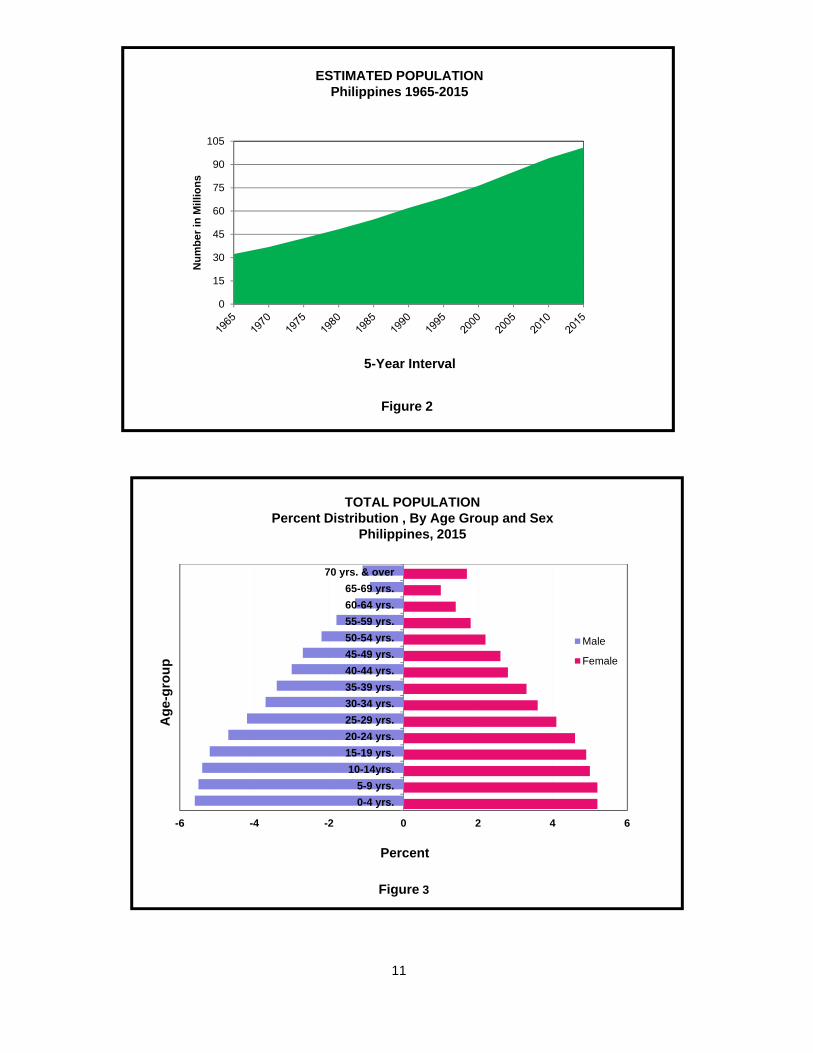
Figure 2
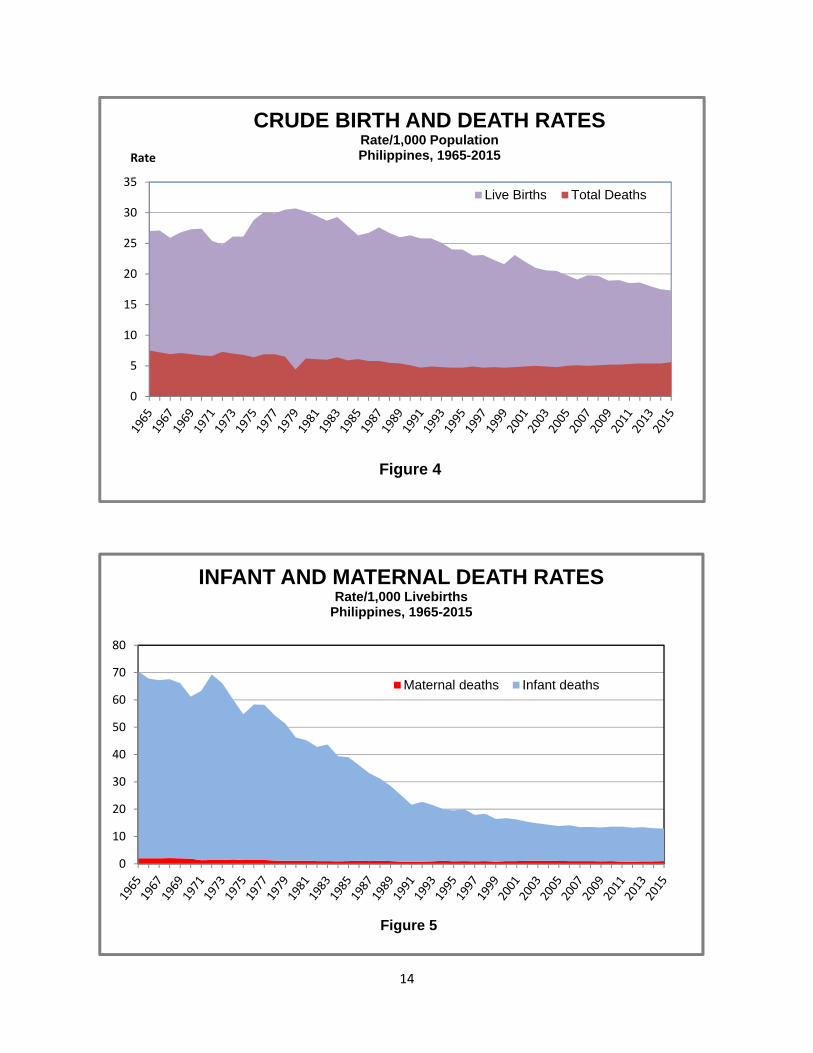
TOTAL POPULATIONPercent Distribution , By Age Group and Sex
Philippines, 2015
Figure 3
11
ESTIMATED POPULATIONPhilippines 1965-2015
0
15
30
45
60
75
90
105
Nu
mb
er i
n M
illio
ns
5-Year Interval
-6 -4 -2 0 2 4 6
0-4 yrs.
5-9 yrs.
10-14yrs.
15-19 yrs.
20-24 yrs.
25-29 yrs.
30-34 yrs.
35-39 yrs.
40-44 yrs.
45-49 yrs.
50-54 yrs.
55-59 yrs.
60-64 yrs.
65-69 yrs.
70 yrs. & over
Percent
Ag
e-g
rou
p
Male
Female

Table 3
Male Female Both Sexes Male Female Both Sexes
All Ages 51,069,962 49,909,341 100,979,303 50.6 49.4 100.0
Under 1 yr. 1,073,401 1,002,614 2,076,015 1.1 1.0 2.1
1 - 4 yr. 4,517,084 4,225,832 8,742,916 4.5 4.2 8.7
5 - 9 yrs. 5,596,837 5,246,083 10,842,920 5.5 5.2 10.7
10 - 14 yrs. 5,405,418 5,088,524 10,493,942 5.4 5.0 10.4
15 - 19 yrs. 5,202,239 4,988,946 10,191,185 5.2 4.9 10.1
20 - 24 yrs. 4,795,772 4,671,722 9,467,494 4.7 4.6 9.4
25 - 29 yrs. 4,252,817 4,107,630 8,360,447 4.2 4.1 8.3
30 - 34 yrs. 3,755,963 3,585,931 7,341,894 3.7 3.6 7.3
35 - 39 yrs. 3,447,349 3,295,338 6,742,687 3.4 3.3 6.7
40 - 44 yrs. 2,995,391 2,853,937 5,849,328 3.0 2.8 5.8
45 - 49 yrs. 2,680,464 2,603,861 5,284,325 2.7 2.6 5.2
50 - 54 yrs. 2,227,579 2,202,968 4,430,547 2.2 2.2 4.4
55 - 59 yrs. 1,785,436 1,821,398 3,606,834 1.8 1.8 3.6
60 - 64 yrs. 1,325,815 1,435,368 2,761,183 1.3 1.4 2.7
65 - 69 yrs. 878,327 1,037,798 1,916,125 0.9 1.0 1.9
70 yrs. & Over 1,130,070 1,741,391 2,871,461 1.1 1.7 2.8*The 2015 total population excludes Filipinos in Philippine Embassies, Consulates and Mission Abroad numbering 2,134.
Source: Philippine Statistics Authority, 2015 Census of Population
**Percent share to total population
Total Population* Percent**Age Group
TOTAL POPULATION
By Age Group and SexPhilippines, 2015
Number and Percent Distribution
12

Table 4
Number Rate* Number Rate* Number Rate** Number Rate** Number Ratio**2015 1,744,767 17.3 560,605 5.6 20,750 11.9 1,721 1.0 7,676 4.42014 1,748,857 17.5 536,999 5.4 21,108 12.1 1,570 0.9 7,664 4.42013 1,761,602 18.0 531,280 5.4 21,992 12.5 1,522 0.9 7,474 4.22012 1,790,367 18.6 514,745 5.4 22,254 12.4 1,447 0.8 7,862 4.42011 1,746,684 18.5 498,486 5.3 22,283 12.8 1,469 0.8 8,173 4.72010 1,782,981 19.0 488,265 5.2 22,476 12.6 1,719 1.0 8,095 4.52009 1,745,585 18.9 480,820 5.2 21,659 12.4 1,599 0.9 8,043 4.62008 1,784,316 19.7 461,581 5.1 22,351 12.5 1,731 1.0 8,306 4.72007 1,749,878 19.8 441,956 5.0 21,720 12.4 1,672 1.0 8,191 4.72006 1,663,029 19.1 441,036 5.1 21,764 13.1 1,721 1.0 8,458 5.12005 1,688,918 19.8 426,054 5.0 21,674 12.8 1,732 1.0 10,351 6.12004 1,710,994 20.5 403,191 4.8 22,557 13.2 1,833 1.1 8,935 5.22003 1,669,442 20.6 396,331 4.9 22,844 13.7 1,798 1.1 8,986 5.42002 1,666,773 21.0 396,297 5.0 23,778 14.3 1,804 1.1 9,341 5.62001 1,714,093 22.0 381,834 4.9 26,129 15.2 1,768 1.0 9,625 5.62000 1,766,440 23.1 366,931 4.8 27,714 15.7 1,698 1.0 10,360 5.91999 1,613,335 21.6 347,989 4.7 25,168 15.6 1,348 0.8 9,841 6.11998 1,632,859 22.3 352,992 4.8 28,196 17.3 1,579 1.0 6,232 3.81997 1,653,236 23.1 339,400 4.7 28,061 17.0 1,513 0.9 9,706 5.91996 1,608,468 23.0 344,363 4.9 30,550 19.0 1,557 1.0 9,693 6.01995 1,645,043 24.0 324,737 4.7 30,631 18.6 1,488 0.9 9,731 5.91994 1,643,707 24.0 321,440 4.7 31,073 18.9 1,791 1.1 9,291 5.71993 1,680,896 25.1 318,546 4.8 34,673 20.6 1,548 0.9 9,338 5.61992 1,684,395 25.8 319,575 4.9 36,814 21.9 1,394 0.8 8,631 5.11991 1,643,296 25.8 298,063 4.7 34,332 20.9 1,144 0.7 10,776 6.61990 1,631,069 26.3 313,890 5.1 39,633 24.3 1,307 0.8 11,915 7.31989 1,565,254 26.0 325,621 5.4 43,026 27.5 1,579 1.0 11,423 7.31988 1,565,372 26.7 325,098 5.5 47,187 30.1 1,745 1.1 10,641 6.81987 1,582,469 27.6 335,254 5.8 50,803 32.1 1,611 1.0 10,515 6.61986 1,493,995 26.7 326,749 5.8 52,263 35.0 1,573 1.1 8,400 5.61985 1,437,157 26.3 334,663 6.1 54,613 38.0 1,489 1.0 8,948 6.21984 1,478,205 27.8 313,359 5.9 56,897 38.5 1,379 0.9 11,884 8.01983 1,506,356 29.3 327,260 6.4 64,267 42.7 1,502 1.0 14,780 9.81982 1,474,491 28.7 308,758 6.0 61,655 41.8 1,425 1.0 13,465 9.11981 1,461,204 29.5 301,117 6.1 64,415 44.1 1,542 1.1 13,343 9.11980 1,456,860 30.2 298,006 6.2 65,700 45.1 1,607 1.1 13,965 9.61979 1,429,814 30.7 206,427 4.4 71,772 50.2 1,635 1.1 14,586 10.21978 1,387,588 30.5 297,034 6.5 73,640 53.1 1,734 1.2 14,365 10.41977 1,344,836 29.9 308,904 6.9 76,330 56.8 1,909 1.4 14,589 10.81976 1,314,860 30.1 299,861 6.9 74,792 56.9 1,862 1.4 14,865 11.31975 1,223,837 28.8 271,136 6.4 65,263 53.3 1,753 1.4 13,764 11.21974 1,081,073 26.1 283,975 6.8 63,491 58.7 1,690 1.6 13,451 12.41973 1,049,290 26.1 283,475 7.0 67,881 64.7 1,488 1.4 10,808 10.31972 968,385 24.8 285,761 7.3 65,719 67.9 1,379 1.4 13,577 14.01971 963,749 25.4 250,139 6.6 59,730 62.0 1,261 1.3 12,969 13.51970 1,008,504 27.4 248,251 6.7 59,774 59.3 1,950 1.9 7,384 7.31969 1,015,784 27.3 255,785 6.9 65,142 64.1 2,047 2.0 7,290 7.21968 961,646 26.8 253,841 7.1 62,994 65.5 1,979 2.1 6,855 7.11967 911,872 25.9 241,548 6.9 59,448 65.2 1,822 2.0 7,468 8.21966 908,826 27.1 240,865 7.2 59,810 65.8 1,829 2.0 6,166 6.81965 871,715 27.0 241,305 7.5 59,733 68.5 1,757 2.0 6,143 7.0* Per 1000 Population
** Per 1000 Livebirths
Infant DeathsFetal
Deaths
LIVEBIRTHS, TOTAL DEATHS, INFANT DEATHS, MATERNAL DEATHS & FETAL DEATHSNumber & Rate
Philippines, 1965- 2015
YearLivebirths Total Deaths
MaternalDeaths
13
14
0
5
10
15
20
25
30
35
Rate
CRUDE BIRTH AND DEATH RATESRate/1,000 PopulationPhilippines, 1965-2015
Live Births Total Deaths
0
10
20
30
40
50
60
70
80
INFANT AND MATERNAL DEATH RATESRate/1,000 Livebirths
Philippines, 1965-2015
Maternal deaths Infant deaths
Figure 5
Figure 4
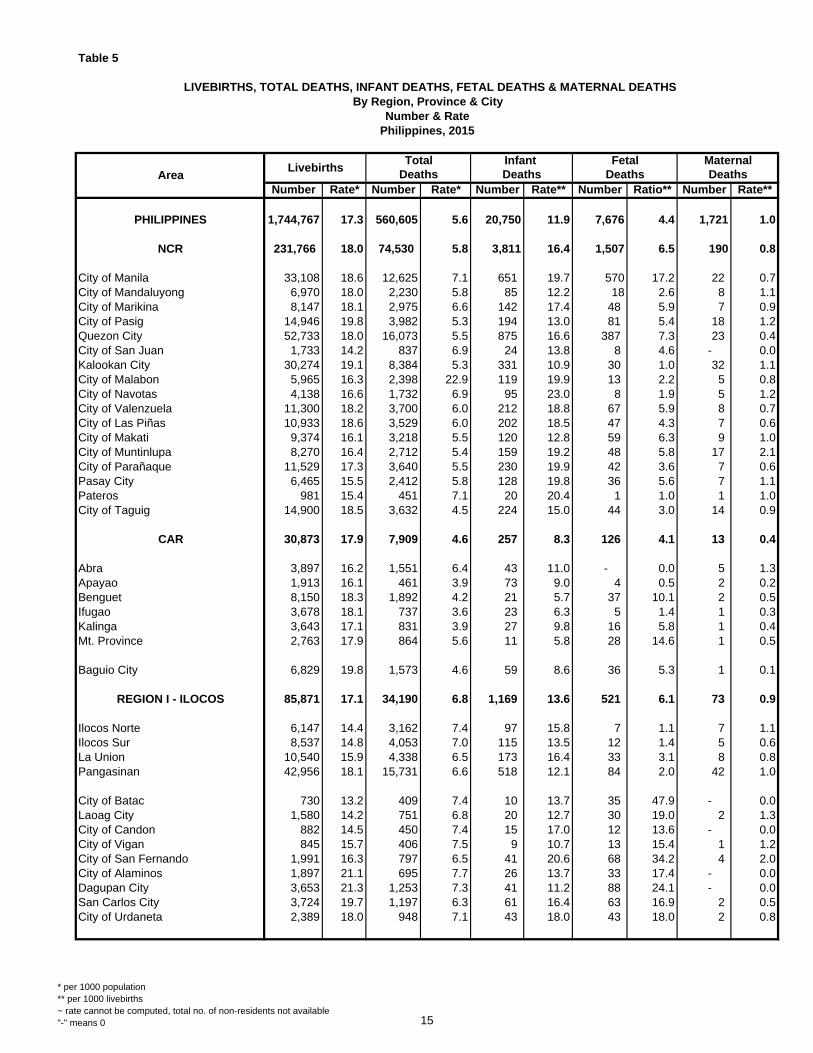
Table 5
Number Rate* Number Rate* Number Rate** Number Ratio** Number Rate**
PHILIPPINES 1,744,767 17.3 560,605 5.6 20,750 11.9 7,676 4.4 1,721 1.0
NCR 231,766 18.0 74,530 5.8 3,811 16.4 1,507 6.5 190 0.8
City of Manila 33,108 18.6 12,625 7.1 651 19.7 570 17.2 22 0.7City of Mandaluyong 6,970 18.0 2,230 5.8 85 12.2 18 2.6 8 1.1City of Marikina 8,147 18.1 2,975 6.6 142 17.4 48 5.9 7 0.9City of Pasig 14,946 19.8 3,982 5.3 194 13.0 81 5.4 18 1.2Quezon City 52,733 18.0 16,073 5.5 875 16.6 387 7.3 23 0.4City of San Juan 1,733 14.2 837 6.9 24 13.8 8 4.6 - 0.0Kalookan City 30,274 19.1 8,384 5.3 331 10.9 30 1.0 32 1.1City of Malabon 5,965 16.3 2,398 22.9 119 19.9 13 2.2 5 0.8City of Navotas 4,138 16.6 1,732 6.9 95 23.0 8 1.9 5 1.2City of Valenzuela 11,300 18.2 3,700 6.0 212 18.8 67 5.9 8 0.7City of Las Piñas 10,933 18.6 3,529 6.0 202 18.5 47 4.3 7 0.6City of Makati 9,374 16.1 3,218 5.5 120 12.8 59 6.3 9 1.0City of Muntinlupa 8,270 16.4 2,712 5.4 159 19.2 48 5.8 17 2.1City of Parañaque 11,529 17.3 3,640 5.5 230 19.9 42 3.6 7 0.6Pasay City 6,465 15.5 2,412 5.8 128 19.8 36 5.6 7 1.1Pateros 981 15.4 451 7.1 20 20.4 1 1.0 1 1.0City of Taguig 14,900 18.5 3,632 4.5 224 15.0 44 3.0 14 0.9
CAR 30,873 17.9 7,909 4.6 257 8.3 126 4.1 13 0.4
Abra 3,897 16.2 1,551 6.4 43 11.0 - 0.0 5 1.3Apayao 1,913 16.1 461 3.9 73 9.0 4 0.5 2 0.2Benguet 8,150 18.3 1,892 4.2 21 5.7 37 10.1 2 0.5Ifugao 3,678 18.1 737 3.6 23 6.3 5 1.4 1 0.3Kalinga 3,643 17.1 831 3.9 27 9.8 16 5.8 1 0.4Mt. Province 2,763 17.9 864 5.6 11 5.8 28 14.6 1 0.5
Baguio City 6,829 19.8 1,573 4.6 59 8.6 36 5.3 1 0.1
REGION I - ILOCOS 85,871 17.1 34,190 6.8 1,169 13.6 521 6.1 73 0.9
Ilocos Norte 6,147 14.4 3,162 7.4 97 15.8 7 1.1 7 1.1Ilocos Sur 8,537 14.8 4,053 7.0 115 13.5 12 1.4 5 0.6La Union 10,540 15.9 4,338 6.5 173 16.4 33 3.1 8 0.8Pangasinan 42,956 18.1 15,731 6.6 518 12.1 84 2.0 42 1.0
City of Batac 730 13.2 409 7.4 10 13.7 35 47.9 - 0.0Laoag City 1,580 14.2 751 6.8 20 12.7 30 19.0 2 1.3City of Candon 882 14.5 450 7.4 15 17.0 12 13.6 - 0.0City of Vigan 845 15.7 406 7.5 9 10.7 13 15.4 1 1.2City of San Fernando 1,991 16.3 797 6.5 41 20.6 68 34.2 4 2.0City of Alaminos 1,897 21.1 695 7.7 26 13.7 33 17.4 - 0.0Dagupan City 3,653 21.3 1,253 7.3 41 11.2 88 24.1 - 0.0San Carlos City 3,724 19.7 1,197 6.3 61 16.4 63 16.9 2 0.5City of Urdaneta 2,389 18.0 948 7.1 43 18.0 43 18.0 2 0.8
LIVEBIRTHS, TOTAL DEATHS, INFANT DEATHS, FETAL DEATHS & MATERNAL DEATHSBy Region, Province & City
Number & RatePhilippines, 2015
Fetal MaternalDeaths Deaths Deaths DeathsArea
LivebirthsTotal Infant
* per 1000 population** per 1000 livebirths~ rate cannot be computed, total no. of non-residents not available"-" means 0 15
Table 5
Number Rate* Number Rate* Number Rate** Number Ratio** Number Rate**
LIVEBIRTHS, TOTAL DEATHS, INFANT DEATHS, FETAL DEATHS & MATERNAL DEATHSBy Region, Province & City
Number & RatePhilippines, 2015
Fetal MaternalDeaths Deaths Deaths DeathsArea
LivebirthsTotal Infant
REGION II - CAGAYAN VALLEY 60,511 17.5 20,212 5.9 581 9.6 127 2.1 44 0.7
Batanes 286 16.6 125 7.2 5 17.5 4 14.0 1 3.5Cagayan 17,226 16.5 6,629 6.3 187 10.9 15 0.9 7 0.4Isabela 19,523 16.5 6,437 5.4 150 7.7 9 0.5 16 0.8Nueva Vizcaya 9,196 20.3 2,553 5.6 71 7.7 32 3.5 7 0.8Quirino 3,556 18.8 993 5.3 53 14.9 19 5.3 2 0.6
Tuguegarao City 2,634 17.2 1,006 6.6 34 12.9 13 4.9 2 0.8City of Cauayan 2,396 18.5 802 6.2 25 10.4 8 3.3 3 1.3Ilagan City 2,513 17.3 777 5.3 18 7.2 8 3.2 2 0.8City of Santiago 3,181 23.6 890 6.6 38 11.9 19 6.0 4 1.3
REGION III - CENTRAL LUZON 196,217 17.5 65,540 5.8 2,368 12.1 666 3.4 165 0.8
Aurora 3,741 17.5 1,120 5.2 29 7.8 10 2.7 7 1.9Bataan 13,199 19.9 3,817 5.7 165 12.5 13 1.0 9 0.7Bulacan 37,736 16.7 12,977 5.7 583 15.4 109 2.9 39 1.0Nueva Ecija 21,647 14.7 8,630 5.8 207 9.6 7 0.3 13 0.6Pampanga 29,718 18.1 8,554 5.2 179 6.0 39 1.3 19 0.6Tarlac 15,134 14.8 5,678 5.5 132 8.7 26 1.7 5 0.3Zambales 11,991 20.3 3,923 6.6 176 14.7 70 5.8 20 1.7
City of Balanga 1,904 19.8 560 5.8 19 10.0 84 44.1 1 0.5City of Malolos 3,681 14.6 1,588 6.3 70 19.0 119 32.3 5 1.4City of Meycauayan 3,930 18.8 1,293 6.2 71 18.1 12 3.1 4 1.0City of San Jose Del Monte 9,710 16.9 3,050 5.3 141 14.5 19 2.0 6 0.6Cabanatuan City 4,609 15.2 1,928 6.4 80 17.4 54 11.7 4 0.9City of Gapan 1,862 16.9 757 6.9 41 22.0 3 1.6 1 0.5Science City of Muñoz 1,121 13.8 538 6.6 15 13.4 - 0.0 1 0.9Palayan City 547 13.3 247 6.0 9 16.5 - 0.0 - 0.0San Jose City 2,501 17.9 936 6.7 42 16.8 21 8.4 1 0.4Angeles City 7,710 18.7 2,368 5.8 100 13.0 42 5.4 7 0.9Mabalacat City 5,174 20.6 1,377 5.5 42 8.1 8 1.5 5 1.0City of San Fernando 6,253 20.4 1,681 5.5 49 7.8 2 0.3 6 1.0City of Tarlac 9,495 27.7 3,082 9.0 172 18.1 - 0.0 10 1.1Olangapo City 4,554 19.5 1,436 6.2 46 10.1 28 6.1 2 0.4
REGION IVA - CALABARZON 260,339 18.1 80,778 5.6 3,657 14.0 1,351 5.2 263 1.0
Batangas 30,971 16.7 10,640 5.7 442 14.3 189 6.1 21 0.7Cavite 23,983 17.5 7,849 5.7 359 15.0 61 2.5 19 0.8Laguna 17,622 17.7 6,283 6.3 205 11.6 88 5.0 12 0.7Quezon 30,672 17.5 10,522 6.0 452 14.7 113 3.7 51 1.7Rizal 39,690 18.8 11,095 501 151 39
Batangas City 5,354 16.2 1,994 6.0 71 13.3 63 11.8 6 1.1Lipa City 6,594 19.8 1,856 5.6 87 13.2 51 7.7 6 0.9City of Tanauan 3,340 19.3 1,042 6.0 50 15.0 43 12.9 3 0.9Bacoor City 10,532 17.5 2,882 4.8 156 14.8 7 0.7 5 0.5Cavite City 1,814 17.6 878 8.5 29 16.0 16 8.8 1 0.6
* per 1000 population** per 1000 livebirths~ rate cannot be computed, total no. of non-residents not available"-" means 0 16

Table 5
Number Rate* Number Rate* Number Rate** Number Ratio** Number Rate**
LIVEBIRTHS, TOTAL DEATHS, INFANT DEATHS, FETAL DEATHS & MATERNAL DEATHSBy Region, Province & City
Number & RatePhilippines, 2015
Fetal MaternalDeaths Deaths Deaths DeathsArea
LivebirthsTotal Infant
City of Dasmariñas 10,708 16.2 3,485 5.3 193 18.0 50 4.7 4 0.4City of General Trias 5,365 17.1 1,249 4.0 64 11.9 25 4.7 5 0.9Imus City 6,509 16.1 1,913 4.7 63 9.7 17 2.6 9 1.4Tagaytay City 1,240 17.4 329 4.6 7 5.6 - 0.0 1 0.8Trece Martires City 3,034 19.5 700 4.5 65 21.4 84 27.7 9 3.0City of Biñan 6,213 18.7 1,760 5.3 69 11.1 28 4.5 5 0.8Cabuyao City 5,688 18.4 1,404 4.5 71 12.5 16 2.8 7 1.2City of Calamba 9,258 20.4 2,569 5.7 166 17.9 90 9.7 10 1.1San Pablo City 5,171 19.4 1,772 6.7 53 10.2 50 9.7 2 0.4City of San Pedro 5,732 17.6 1,824 5.6 88 15.4 6 1.0 5 0.9City of Santa Rosa 6,635 18.8 1,793 5.1 103 15.5 49 7.4 14 2.1City of Tayabas 1,733 17.4 620 6.2 28 16.2 8 4.6 - 0.0Lucena City 4,840 18.2 1,818 6.8 55 11.4 86 17.8 5 1.0City of Antipolo 17,641 22.7 4,501 5.8 280 15.9 60 3.4 24 1.4
REGION IVB - MIMAROPA 50,122 16.9 15,012 5.1 675 13.5 221 4.4 49 1.0
Marinduque 4,165 17.8 1,679 7.2 69 16.6 58 13.9 6 1.4Occidental Mindoro 8,906 18.3 2,400 4.9 123 13.8 58 6.5 10 1.1Oriental Mindoro 11,706 16.5 3,693 5.2 167 14.3 16 1.4 10 0.9Palawan 13,440 15.8 3,217 3.8 138 10.3 31 2.3 12 0.9Romblon 4,876 16.7 1,968 6.7 65 13.3 14 2.9 5 1.0
Calapan City 2,302 17.2 869 6.5 40 17.4 44 19.1 1 0.4Puerto Princesa City 4,727 18.5 1,186 4.6 73 15.4 - 0.0 5 1.1
REGION V - BICOL 115,210 19.9 35,086 6.1 1,311 11.4 588 5.1 114 1.0
Albay 16,812 19.3 5,464 6.3 172 10.2 76 4.5 12 0.7Camarines Norte 13,017 22.3 3,747 6.4 183 14.1 127 9.8 11 0.8Camarines Sur 34,681 21.1 9,643 5.9 370 10.7 75 2.2 39 1.1Catanduanes 5,271 20.2 1,782 6.8 65 12.3 29 5.5 8 1.5Masbate 13,024 16.3 3,499 4.4 145 11.1 2 0.2 10 0.8Sorsogon 11,876 19.0 3,892 6.2 109 9.2 15 1.3 9 0.8
Legazpi City 3,715 18.9 1,502 7.6 58 15.6 62 16.7 8 2.2City of Ligao 2,503 22.5 728 6.5 32 12.8 20 8.0 1 0.4City of Tabaco 2,714 20.3 889 6.6 34 12.5 18 6.6 1 0.4Iriga City 2,207 19.7 757 6.8 26 11.8 9 4.1 1 0.5Naga City 4,135 21.1 1,345 6.9 57 13.8 152 36.8 4 1.0City of Masbate 1,988 20.8 650 6.8 30 15.1 3 1.5 5 2.5City of Sorsogon 3,267 19.4 1,188 7.1 30 9.2 - 0.0 5 1.5
REGION VI - WESTERN VISAYAS 118,788 15.8 49,711 6.6 1,365 11.5 471 4.0 109 0.9
Aklan 10,388 18.1 3,727 6.5 131 12.6 35 3.4 12 1.2Antique 9,131 15.7 3,992 6.9 133 14.6 54 5.9 9 1.0Capiz 9,060 15.2 3,529 5.9 77 8.5 8 0.9 6 0.7Guimaras 2,686 15.4 1,010 5.8 30 11.2 9 3.4 2 0.7Iloilo 28,776 15.5 12,064 6.5 380 13.2 90 3.1 24 0.8Negros Occidental 16,853 15.9 6,678 6.3 137 8.1 27 1.6 13 0.8
* per 1000 population** per 1000 livebirths~ rate cannot be computed, total no. of non-residents not available"-" means 0 17

Table 5
Number Rate* Number Rate* Number Rate** Number Ratio** Number Rate**
LIVEBIRTHS, TOTAL DEATHS, INFANT DEATHS, FETAL DEATHS & MATERNAL DEATHSBy Region, Province & City
Number & RatePhilippines, 2015
Fetal MaternalDeaths Deaths Deaths DeathsArea
LivebirthsTotal Infant
Roxas City 2,908 17.4 990 5.9 22 7.6 1 0.3 - 0.0Iloilo City 6,771 15.1 3,231 7.2 100 14.8 61 9.0 7 1.0City of Passi 1,345 16.7 539 6.7 22 16.4 1 0.7 - 0.0Bacolod City 7,834 13.9 4,095 7.3 87 11.1 35 4.5 13 1.7Bago City 2,067 12.1 1,190 7.0 29 14.0 4 1.9 1 0.5Cadiz City 2,758 17.8 1,045 6.8 22 8.0 8 2.9 4 1.5City of Escalante 1,714 18.2 649 6.9 24 14.0 8 4.7 2 1.2City of Himamaylan 1,780 16.7 729 6.8 24 13.5 3 1.7 3 1.7City of Kabankalan 3,162 17.4 1,118 6.1 38 12.0 19 6.0 4 1.3La Carlota City 939 14.6 556 8.6 7 7.5 1 1.1 - 0.0Sagay City 2,555 17.5 890 6.1 13 5.1 3 1.2 2 0.8San Carlos City 2,090 15.8 827 6.2 21 10.0 19 9.1 1 0.5Silay City 2,054 16.2 949 7.5 19 9.3 63 30.7 1 0.5City of Sipalay 1,065 15.2 443 6.3 14 13.1 10 9.4 2 1.9City of Talisay 1,477 14.5 724 7.1 15 10.2 2 1.4 3 2.0City of Victorias 1,375 15.6 736 8.4 20 14.5 10 7.3 - 0.0
REGION VII - CENTRAL VISAYAS 148,319 20.1 47,096 6.4 1,588 10.7 873 5.9 211 1.4
Bohol 21,272 17.6 8,263 6.8 242 11.4 46 2.2 23 1.1Cebu 42,677 20.4 12,982 6.2 465 10.9 125 2.9 69 1.6Negros Oriental 13,834 17.3 5,003 6.3 152 11.0 17 1.2 20 1.4Siquijor 1,345 14.0 794 8.3 17 12.6 1 0.7 4 3.0
Tagbilaran City 1,596 15.2 619 5.9 19 11.9 73 45.7 1 0.6City of Bogo 1,599 20.5 585 7.5 32 20.0 42 26.3 2 1.3City of Carcar 2,874 24.0 686 5.7 17 5.9 13 4.5 3 1.0Cebu City 20,953 22.7 6,649 7.2 215 10.3 322 15.4 30 1.4Danao City 3,306 24.2 823 6.0 35 10.6 20 6.0 1 0.3Lapu-Lapu City 9,812 24.0 2,227 5.5 90 9.2 40 4.1 20 2.0Mandaue City 8,074 22.3 1,780 4.9 100 12.4 64 7.9 13 1.6City of Naga 2,722 23.5 674 5.8 16 5.9 14 5.1 3 1.1City of Talisay 4,538 19.9 1,356 6.0 54 11.9 10 2.2 9 2.0Toledo City 4,202 24.7 1,140 6.7 34 8.1 13 3.1 4 1.0Bais City 1,368 17.9 469 6.1 12 8.8 - 0.0 1 0.7City of Bayawan 1,688 14.3 593 5.0 26 15.4 11 6.5 4 2.4Canlaon City 1,022 18.7 331 6.1 18 17.6 6 5.9 1 1.0Dumaguete City 2,275 17.3 1,065 8.1 20 8.8 53 23.3 1 0.4City of Guihulngan 2,045 21.3 479 5.0 12 5.9 - 0.0 1 0.5City of Tanjay 1,117 13.9 578 7.2 12 10.7 3 2.7 1 0.9
REGION VIII - EASTERN VISAYAS 76,771 17.3 23,658 5.3 563 7.3 206 2.7 88 1.1
Biliran 3,434 20.0 1,149 6.7 37 10.8 21 6.1 6 1.7Eastern Samar 6,568 16.5 1,568 3.9 13 2.0 3 0.5 3 0.5Leyte 26,640 19.0 7,428 5.3 172 6.5 39 1.5 29 1.1Northern Samar 9,608 15.2 3,624 5.7 137 14.3 28 2.9 15 1.6Samar 7,111 14.4 1,884 3.8 28 3.9 2 0.3 11 1.5Southern Leyte 5,059 15.0 2,354 7.0 51 10.1 13 2.6 3 0.6
* per 1000 population** per 1000 livebirths~ rate cannot be computed, total no. of non-residents not available"-" means 0 18

Table 5
Number Rate* Number Rate* Number Rate** Number Ratio** Number Rate**
LIVEBIRTHS, TOTAL DEATHS, INFANT DEATHS, FETAL DEATHS & MATERNAL DEATHSBy Region, Province & City
Number & RatePhilippines, 2015
Fetal MaternalDeaths Deaths Deaths DeathsArea
LivebirthsTotal Infant
City of Borongan 1,032 14.9 369 5.3 4 3.9 4 3.9 2 1.9City of Baybay 2,128 19.4 749 6.8 14 6.6 7 3.3 1 0.5Ormoc City 4,144 19.3 1,150 5.3 36 8.7 2 0.5 7 1.7Tacloban City 4,150 17.1 1,125 4.6 31 7.5 26 6.3 3 0.7Calbayog City 3,102 16.9 1,064 5.8 18 5.8 9 2.9 7 2.3City of Catbalogan 2,523 24.3 611 5.9 9 3.6 9 3.6 1 0.4City of Maasin 1,272 14.9 583 6.8 13 10.2 43 33.8 - 0.0
REGION IX - ZAMBOANGA PENINSULA 58,109 16.0 16,573 4.6 529 9.1 133 2.3 63 1.1
Zamboanga Del Norte 12,660 15.9 3,608 4.5 98 7.7 4 0.3 12 0.9Zamboanga Del Sur 13,738 16.9 3,202 3.9 77 5.6 3 0.2 6 0.4Zamboanga Sibugay 10,712 16.9 2,365 3.7 63 5.9 18 1.7 9 0.8
Dapitan City 1,286 15.6 565 6.9 10 7.8 5 3.9 2 1.6Dipolog City 1,840 14.1 845 6.5 18 9.8 18 9.8 5 2.7City of Isabela 300 2.7 103 0.7 2 6.7 - 0.0 - 0.0Pagadian City 3,822 19.2 1,020 5.1 33 8.6 31 8.1 8 2.1Zamboanga City 13,751 16.0 4,865 5.6 228 16.6 54 3.9 21 1.5
REGION X - NORTHERN MINDANAO 87,155 18.6 24,551 5.2 806 9.2 272 3.1 76 0.9
Bukidnon 21,384 20.4 4,344 4.1 121 5.7 34 1.6 12 0.6Camiguin 1,664 18.8 567 6.4 14 8.4 9 5.4 1 0.6Lanao del Norte 9,537 14.1 2,342 3.5 64 6.7 11 1.2 7 0.7Misamis Occidental 5,392 16.5 2,163 6.6 36 6.7 - 0.0 5 0.9Misamis Oriental 13,567 17.8 4,308 5.6 129 9.5 19 1.4 11 0.8
City of Malaybalay 4,018 23.0 1,070 6.1 54 13.4 34 8.5 7 1.7City of Valencia 4,141 21.5 1,091 5.7 49 11.8 7 1.7 3 0.7Iligan City 5,734 16.7 2,186 6.4 114 19.9 42 7.3 11 1.9Oroquieta City 1,116 15.8 560 7.9 15 13.4 4 3.6 - 0.0Ozamis City 2,676 18.9 971 6.8 22 8.2 43 16.1 5 1.9Tangub City 1,212 19.2 379 6.0 14 11.6 - 0.0 2 1.7Cagayan de Oro City 14,390 21.3 3,777 5.6 129 9.0 54 3.8 9 0.6Gingoog City 2,324 18.6 793 6.4 45 19.4 15 6.5 3 1.3
REGION XI - DAVAO 90,009 18.4 27,549 5.6 892 9.9 316 3.5 112 1.2
Compostela Valley 13,400 18.2 3,930 5.3 164 12.2 10 0.7 14 1.0Davao 8,839 18.9 2,455 5.2 93 10.5 12 1.4 6 0.7Davao Del Sur 10,821 23.4 3,795 8.2 85 7.9 15 1.4 20 1.8Davao Oriental 6,351 15.2 2,252 5.4 71 11.2 3 0.5 17 2.7Davao Occidental - 0.0 - 0.0 - 0.0 - 0.0 - 0.0
City of Panabo 3,762 20.4 1,091 5.9 31 8.2 8 2.1 6 1.6Island Garden City of Samal 2,026 19.5 663 6.4 18 8.9 7 3.5 - 0.0City of Tagum 5,246 20.2 1,819 7.0 72 13.7 92 17.5 6 1.1Davao City 33,786 20.7 9,507 5.8 301 8.9 103 3.0 34 1.0City of Digos 3,204 18.9 1,128 6.7 40 12.5 53 16.5 2 0.6City of Mati 2,574 18.2 909 6.4 17 6.6 13 5.1 7 2.7
* per 1000 population** per 1000 livebirths~ rate cannot be computed, total no. of non-residents not available"-" means 0 19

Table 5
Number Rate* Number Rate* Number Rate** Number Ratio** Number Rate**
LIVEBIRTHS, TOTAL DEATHS, INFANT DEATHS, FETAL DEATHS & MATERNAL DEATHSBy Region, Province & City
Number & RatePhilippines, 2015
Fetal MaternalDeaths Deaths Deaths DeathsArea
LivebirthsTotal Infant
REGION XII - SOCCSKSARGEN 77,479 17.0 20,547 4.5 637 8.2 196 2.5 79 1.0
Cotabato 22,510 18.2 5,459 4.4 156 6.9 10 0.4 21 0.9Saranggani 8,197 15.1 2,087 3.8 39 4.8 2 0.2 11 1.3South Cotabato 11,671 15.8 4,041 5.5 122 10.5 22 1.9 17 1.5Sultan Kudarat 9,633 13.5 2,499 3.5 58 6.0 16 1.7 11 1.1
Cotabato City 2,666 8.9 633 2.1 9 3.4 - 0.0 1 0.4City of Kidapawan 3,315 23.6 857 6.1 27 8.1 6 1.8 4 1.2General Santos City 14,804 24.9 3,202 5.4 165 11.1 98 6.6 8 0.5City of Koronadal 2,873 16.4 1,136 6.5 42 14.6 36 12.5 4 1.4City of Tacurong 1,810 18.4 633 6.4 19 10.5 6 3.3 2 1.1
REGION XIII - CARAGA 42,304 16.3 14,387 5.5 344 8.1 96 2.3 53 1.3
Agusan del Norte 4,649 16.6 1,608 5.7 27 5.8 1 0.2 4 0.9Agusan del Sur 9,336 15.6 2,553 4.3 71 0.0 19 0.0 17 1.8Surigao del Norte 4,885 14.8 1,997 6.0 54 11.1 6 1.2 5 1.0Surigao del Sur 7,835 17.8 2,450 5.6 54 6.9 8 1.0 5 0.6Dinagat Islands 1,386 10.9 640 5.0 15 10.8 - 0.0 3 2.2
City of Cabadbaran 1,273 17.3 484 6.6 6 4.7 4 3.1 1 0.8Butuan City 5,581 16.6 2,086 6.2 64 11.5 23 4.1 11 2.0City of Bayugan 1,951 18.9 578 5.6 9 4.6 1 0.5 4 2.1Surigao City 2,662 17.3 1,040 6.7 24 9.0 22 8.3 1 0.4City of Bislig 1,725 18.2 597 6.3 12 7.0 2 1.2 - 0.0City of Tandag 1,021 18.1 354 6.3 8 7.8 10 9.8 2 2.0
ARMM 14784 3.9 2,938 0.8 196 13.3 5 0.3 19 1.3
Basilan 153 0.6 103 0.5 1 6.5 - 0.0 1 6.5Lanao del Sur 3,535 4.2 658 0.8 49 13.9 4 1.1 4 1.1Maguindanao 9,531 8.1 1,137 1.0 69 7.2 - 0.0 8 0.8Sulu 101 0.1 433 0.5 23 227.7 1 9.9 3 29.7Tawi-tawi 132 0.3 123 0.3 10 75.8 - 0.0 3 22.7
City of Lamitan 102 1.4 234 3.1 2 19.6 - 0.0 - 0.0Marawi City 1,230 6.1 250 1.2 42 34.1 - 0.0 - 0.0
Foreign Country 140 65.6 338 161.2 1 7.1 1 7.1 - -
* per 1000 population** per 1000 livebirths~ rate cannot be computed, total no. of non-residents not available"-" means 0 20

Table 6
Number Percent Number Percent Number Percent Number Percent
January 149,993 8.6 50,381 9.0 1,708 8.2 588 7.7
February 114,965 6.6 44,540 7.9 1,452 7.0 538 7.0
March 125,275 7.2 46,452 8.3 1,558 7.5 577 7.5
April 133,241 7.6 44,421 7.9 1,499 7.2 585 7.6
May 143,648 8.2 46,953 8.4 1,648 7.9 604 7.9
June 140,646 8.1 44,172 7.9 1,592 7.7 657 8.6
July 145,873 8.4 47,618 8.5 1,899 9.2 675 8.8
August 146,929 8.4 48,511 8.7 1,899 9.2 631 8.2
September 164,006 9.4 45,777 8.2 1,842 8.9 811 10.6
October 167,469 9.6 48,404 8.6 2,062 9.9 770 10.0
November 157,051 9.0 45,610 8.1 1,864 9.0 615 8.0
December 155,671 8.9 47,766 8.5 1,727 8.3 625 8.1
Total 1,744,767 100.0 560,605 100.0 20,750 100.0 7,676 100.0 Note: Percentages may not add up to 100 due to rounding off
InfantDeaths
FetalDeathsMonth
LIVEBIRTHS, TOTAL DEATHS, INFANT DEATHS & FETAL DEATHSBy Month of Occurrence
Number & Percent DistributionPhilippines, 2015
Livebirths Total Deaths
21
0
1
2
3
4
5
6
7
8
9
10
Jan Feb March April May June July Aug Sept Oct Nov Dec
LIVEBIRTHS Percent
0.0
1.0
2.0
3.0
4.0
5.0
6.0
7.0
8.0
9.0
10.0
Jan Feb March April May June July Aug Sept Oct Nov Dec
TOTAL DEATHSPercent
0.0
1.0
2.0
3.0
4.0
5.0
6.0
7.0
8.0
9.0
10.0
Jan Feb March April May June July Aug Sept Oct Nov Dec
INFANT DEATHSPercent
HEALTH INDICES BY MONTH OF OCCURRENCEPercent Distribution, Philippines, 2015
Figure 6
22
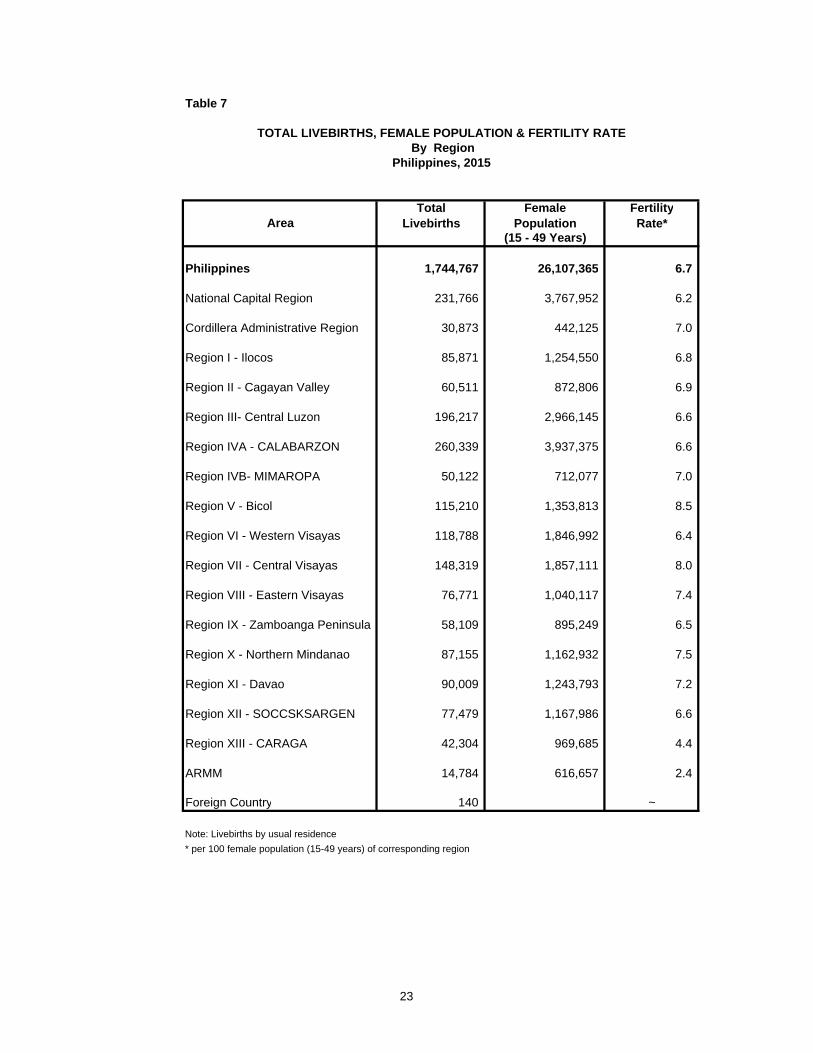
Table 7
Total Female FertilityLivebirths Population Rate*
(15 - 49 Years)
Philippines 1,744,767 26,107,365 6.7
National Capital Region 231,766 3,767,952 6.2
Cordillera Administrative Region 30,873 442,125 7.0
Region I - Ilocos 85,871 1,254,550 6.8
Region II - Cagayan Valley 60,511 872,806 6.9
Region III- Central Luzon 196,217 2,966,145 6.6
Region IVA - CALABARZON 260,339 3,937,375 6.6
Region IVB- MIMAROPA 50,122 712,077 7.0
Region V - Bicol 115,210 1,353,813 8.5
Region VI - Western Visayas 118,788 1,846,992 6.4
Region VII - Central Visayas 148,319 1,857,111 8.0
Region VIII - Eastern Visayas 76,771 1,040,117 7.4
Region IX - Zamboanga Peninsula 58,109 895,249 6.5
Region X - Northern Mindanao 87,155 1,162,932 7.5
Region XI - Davao 90,009 1,243,793 7.2
Region XII - SOCCSKSARGEN 77,479 1,167,986 6.6
Region XIII - CARAGA 42,304 969,685 4.4
ARMM 14,784 616,657 2.4
Foreign Country 140 ~
Note: Livebirths by usual residence
* per 100 female population (15-49 years) of corresponding region
Area
TOTAL LIVEBIRTHS, FEMALE POPULATION & FERTILITY RATE By Region
Philippines, 2015
23
0 1 2 3 4 5 6 7 8 9
NCRCAR
IlocosCagayan Valley
Central LuzonCALABARZON
MIMAROPABicol
Western VisayasCentral VisayasEastern Visayas
Zamboanga PeninsulaNorthern Mindanao
DavaoSOCCSKSARGEN
CARAGAARMM
Region
Figure 7
Rate
FERTILITY RATE BY REGIONPhilippines, 2015
M.D57.1%
Nurse1.9%
Midwife31.2%
Traditional Birth Attendants
9.1%
Others0.5%
Not Stated0.2%
LIVEBIRTHS BY ATTENDANCEPhilippines, 2015
Figure 8
24
25
NATALITY STATISTICS
Birth statistics presented in this report were obtained from the Certificates of Live Birth (Municipal Form 102) transmitted by the City/Municipal Civil Registrars to the Philippine Statistics Authority (PSA). Statistics presented include only those births which occurred in 2015 and were registered from January 2015 to March 2016. Births that were registered after March 2016 and those that were not registered at all were not included in the report. There were 1,744,767 live births registered in 2015 with corresponding Crude Birth Rate (CBR) of 17.3 live births per 1000 population. This is 1.4% decrease in last year’s CBR, with a decrease of 4,090 livebirths in number. More than three babies are born alive per minute, which corresponds to a daily average of 4,780 live births. (Table 4) Figure 4 shows a slight difference in CBR every year. A continuous decrease in CBR is evident during the past five years, except for a slight increase from year 2011 to 2012. The average difference over a 10-year period (from 2006 to 2015) in CBR is 0.2 per thousand population. However, this difference in CBR doesn’t solely depend on the increase or decrease of number of live births but , remember that it is computed against the population. The lower the population the higher is the CBR and vice versa. While the increase or decrease in population can be attributed not only to number of livebirths but also to other factors such as mortality and migration.
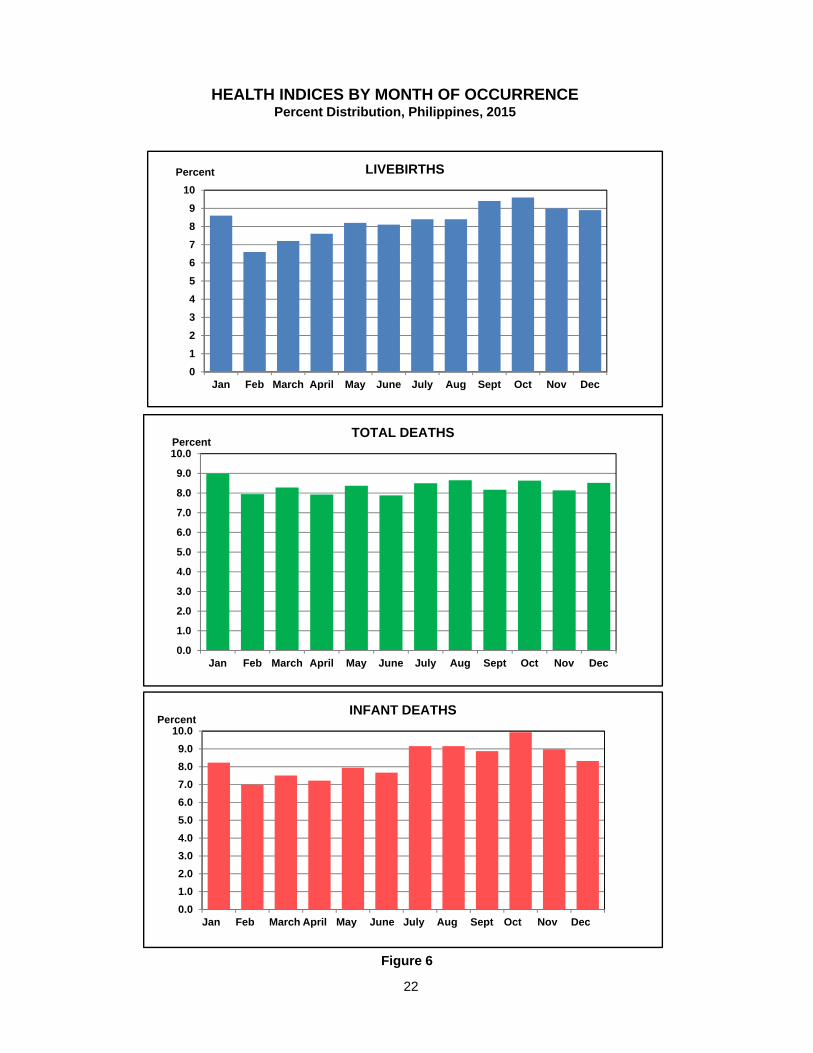
The Region of Central Visayas was highest in CBR in 2015 with 20.1 live births per thousand population. Second in rank was Bicol Region with a CBR of 19.9. It was followed by Northern Mindanao Region (18.6) and Davao Region (18.4). The Autonomous Region of Muslim Mindanao (ARMM) was still at the bottom with CBR of only 3.9. There were ten (10) regions out of 17 with CBR higher than or equal to the national rate of 17.3. (Table 5) In 2015, the month with the highest number of babies born alive was in October. There were 167,469 live births which comprised a 9.6% of total live births. The daily average of babies born alive during this month was about 5,402. The lowest live birth occurrence was still in February with 114,965 live births which was 6.6% of the total live births and an average of daily live births at 4,106. (Table 6)
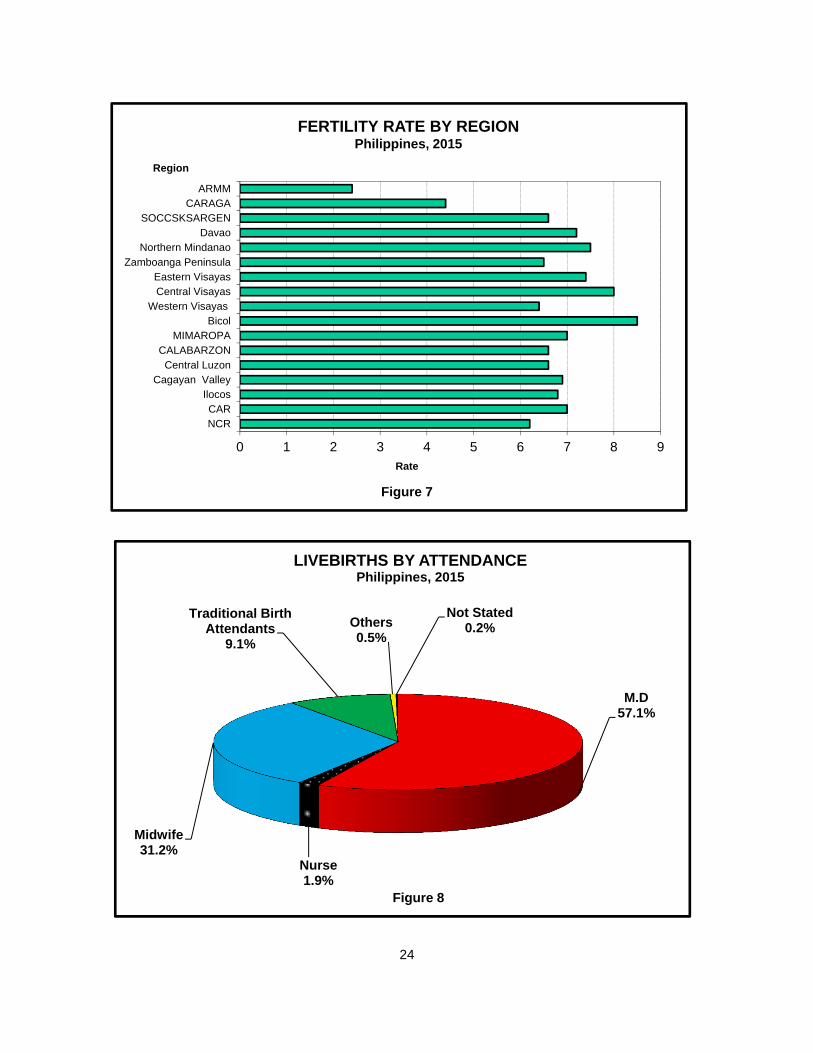
The country’s fertility rate in 2015 was computed at 6.7. This was translated as to
at least six (6) babies born alive per 100 female of reproductive age 15-49 years. Regions of Bicol (8.5) and Central Visayas (8.0) had highest fertility rates. There were seven more regions which had higher fertility rates as compared to the national fertility rate. While, ARMM had the lowest with 2.4. (Table 7)
More male babies were born alive in 2015 (910,877 or 52.0%) than female babies
(833,890 or 48.0%) for a sex ratio of 109 males per 100 females. This ratio means that for every 109 alive baby boys born, there correspond 100 alive baby girls born in 2015. For

26
over a decade now, statistics show that for all live births, the number of male babies always exceeds the number of female babies. Consistently, the estimated population revealed that Philippines was a male dominating country in terms of number.
Among the 17 regions, Eastern Visayas had the highest sex ratio of 111 males per
100 females, while, CALABARZON and Western Visayas were the lowest with 108 males per 100 females. (Table 8)
More than half (57.0%) of live births were attended by a medical doctor. About
three (3) in every ten (10) babies or 31.2% of the total live births were attended by a midwife. In 2015, medically attended births (90.1%) is 2.7 percentage points higher than in 2014 (87.4%). Eleven (11) out of 17 regions in the country, had more than 50% of births attended by a physician. The highest of which is CAR (80.7%); followed by the Ilocos Region (75.9%) and NCR (68.0%).
However, there was a decrease of 22.0% of live births attended by traditional
birth attendants, from 11.8% in 2014 to 9.1% in 2015. Overall, there were 158,178 live births attended by traditional birth attendants. Across all regions, ARMM (35.9%) and MIMAROPA (16.1%) were reported to consistently have the highest proportion of live births attended by traditional birth attendants. (Tables 9 and 10)
About 207,830 or 11.9% of live births were born to mothers under 20 years old.
This would be translated to about three (3) live births in every twenty-five (25) livebirths were born by teenage mothers.
Almost three out of ten (28.6%) live born were from mothers belonging to age-group 20-24 years and consequently, had the most number of live births with 498,927 babies. It is closely followed by mothers of age-group 25-29 years with 439,320 live births or 25.18%. While, only 367 or 0.02% live births were born to mothers beyond reproductive age (50 years and over). (Table 11)
Across all regions, CALABARZON had the highest share on the number of live
births born by women of age-group 20-24. Out of the total babies born by mothers of said age group (498,927), CALABARZON had 71,049 live births, followed by NCR with 61,742 live births. The two regions interchange ranks for number of live births born by younger mothers, under 15 years of age. Out of 1,986 babies, NCR had 363 and CALABARZON had 285 live births. (Table 13)
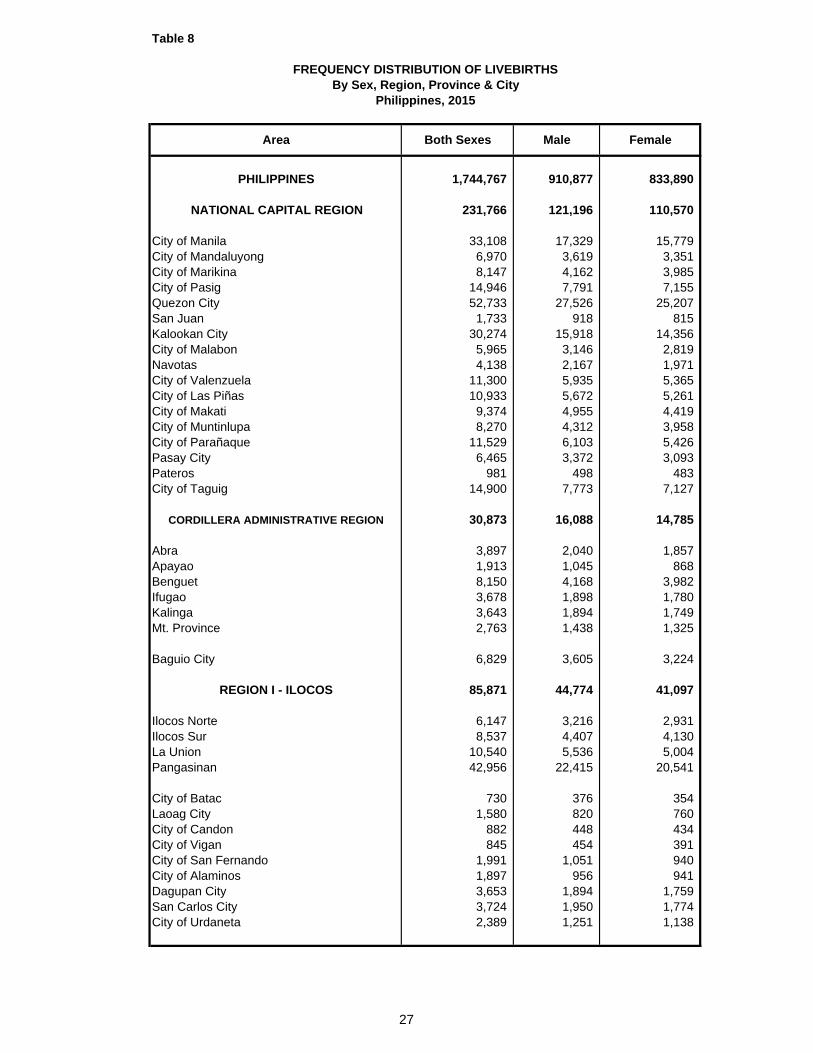
Table 8
PHILIPPINES 1,744,767 910,877 833,890
NATIONAL CAPITAL REGION 231,766 121,196 110,570
City of Manila 33,108 17,329 15,779 City of Mandaluyong 6,970 3,619 3,351 City of Marikina 8,147 4,162 3,985 City of Pasig 14,946 7,791 7,155 Quezon City 52,733 27,526 25,207 San Juan 1,733 918 815 Kalookan City 30,274 15,918 14,356 City of Malabon 5,965 3,146 2,819 Navotas 4,138 2,167 1,971 City of Valenzuela 11,300 5,935 5,365 City of Las Piñas 10,933 5,672 5,261 City of Makati 9,374 4,955 4,419 City of Muntinlupa 8,270 4,312 3,958 City of Parañaque 11,529 6,103 5,426 Pasay City 6,465 3,372 3,093 Pateros 981 498 483 City of Taguig 14,900 7,773 7,127
CORDILLERA ADMINISTRATIVE REGION 30,873 16,088 14,785
Abra 3,897 2,040 1,857 Apayao 1,913 1,045 868 Benguet 8,150 4,168 3,982 Ifugao 3,678 1,898 1,780 Kalinga 3,643 1,894 1,749 Mt. Province 2,763 1,438 1,325
Baguio City 6,829 3,605 3,224
REGION I - ILOCOS 85,871 44,774 41,097
Ilocos Norte 6,147 3,216 2,931 Ilocos Sur 8,537 4,407 4,130 La Union 10,540 5,536 5,004 Pangasinan 42,956 22,415 20,541
City of Batac 730 376 354 Laoag City 1,580 820 760 City of Candon 882 448 434 City of Vigan 845 454 391 City of San Fernando 1,991 1,051 940 City of Alaminos 1,897 956 941 Dagupan City 3,653 1,894 1,759 San Carlos City 3,724 1,950 1,774 City of Urdaneta 2,389 1,251 1,138
FREQUENCY DISTRIBUTION OF LIVEBIRTHSBy Sex, Region, Province & City
Philippines, 2015
Area Both Sexes Male Female
27
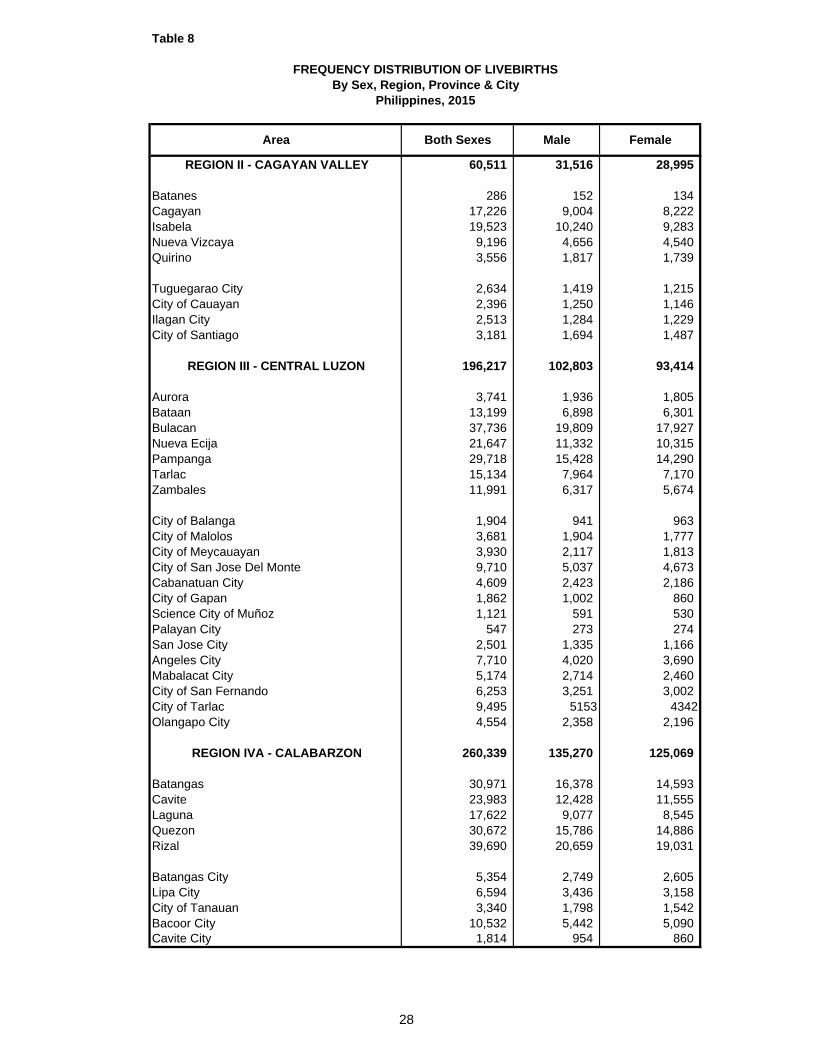
Table 8
FREQUENCY DISTRIBUTION OF LIVEBIRTHSBy Sex, Region, Province & City
Philippines, 2015
Area Both Sexes Male Female
REGION II - CAGAYAN VALLEY 60,511 31,516 28,995
Batanes 286 152 134 Cagayan 17,226 9,004 8,222 Isabela 19,523 10,240 9,283 Nueva Vizcaya 9,196 4,656 4,540 Quirino 3,556 1,817 1,739
Tuguegarao City 2,634 1,419 1,215 City of Cauayan 2,396 1,250 1,146 Ilagan City 2,513 1,284 1,229 City of Santiago 3,181 1,694 1,487
REGION III - CENTRAL LUZON 196,217 102,803 93,414
Aurora 3,741 1,936 1,805 Bataan 13,199 6,898 6,301 Bulacan 37,736 19,809 17,927 Nueva Ecija 21,647 11,332 10,315 Pampanga 29,718 15,428 14,290 Tarlac 15,134 7,964 7,170 Zambales 11,991 6,317 5,674
City of Balanga 1,904 941 963 City of Malolos 3,681 1,904 1,777 City of Meycauayan 3,930 2,117 1,813 City of San Jose Del Monte 9,710 5,037 4,673 Cabanatuan City 4,609 2,423 2,186 City of Gapan 1,862 1,002 860 Science City of Muñoz 1,121 591 530 Palayan City 547 273 274 San Jose City 2,501 1,335 1,166 Angeles City 7,710 4,020 3,690 Mabalacat City 5,174 2,714 2,460 City of San Fernando 6,253 3,251 3,002 City of Tarlac 9,495 5153 4342Olangapo City 4,554 2,358 2,196
REGION IVA - CALABARZON 260,339 135,270 125,069
Batangas 30,971 16,378 14,593 Cavite 23,983 12,428 11,555 Laguna 17,622 9,077 8,545 Quezon 30,672 15,786 14,886 Rizal 39,690 20,659 19,031
Batangas City 5,354 2,749 2,605 Lipa City 6,594 3,436 3,158 City of Tanauan 3,340 1,798 1,542 Bacoor City 10,532 5,442 5,090 Cavite City 1,814 954 860
28

Table 8
FREQUENCY DISTRIBUTION OF LIVEBIRTHSBy Sex, Region, Province & City
Philippines, 2015
Area Both Sexes Male Female
City of Dasmariñas 10,708 5,534 5,174 City of General Trias 5,365 2,782 2,583 Imus City 6,509 3,388 3,121 Tagaytay City 1,240 651 589 Trece Martires City 3,034 1,582 1,452 City of Biñan 6,213 3167 3046Cabuyao City 5,688 2,957 2,731 City of Calamba 9,258 4,839 4,419 San Pablo City 5,171 2,673 2,498 City of San Pedro 5,732 2,998 2,734 City of Santa Rosa 6,635 3,413 3,222 City of Tayabas 1,733 893 840 Lucena City 4,840 2,452 2,388 City of Antipolo 17,641 9,234 8,407
REGION IVB - MIMAROPA 50,122 26,092 24,030
Marinduque 4,165 2,225 1,940 Occidental Mindoro 8,906 4,649 4,257 Oriental Mindoro 11,706 6,080 5,626 Palawan 13,440 6,997 6,443 Romblon 4,876 2,508 2,368
Calapan City 2,302 1,202 1,100 Puerto Princesa City 4,727 2,431 2,296
REGION V - BICOL 115,210 60,250 54,960
Albay 16,812 8,725 8,087 Camarines Norte 13,017 6,968 6,049 Camarines Sur 34,681 18,088 16,593 Catanduanes 5,271 2,748 2,523 Masbate 13,024 6,786 6,238 Sorsogon 11,876 6204 5672
Legazpi City 3,715 1,998 1,717 City of Ligao 2,503 1,261 1,242 City of Tabaco 2,714 1,454 1,260 Iriga City 2,207 1,124 1,083 Naga City 4,135 2,150 1,985 City of Masbate 1,988 1,023 965 City of Sorsogon 3,267 1,721 1,546
REGION VI - WESTERN VISAYAS 118,788 61,622 57,166
Aklan 10,388 5,401 4,987 Antique 9,131 4,772 4,359 Capiz 9,060 4,641 4,419 Guimaras 2,686 1,382 1,304 Iloilo 28,776 15,002 13,774 Negros Occidental 16,853 8,710 8,143
29
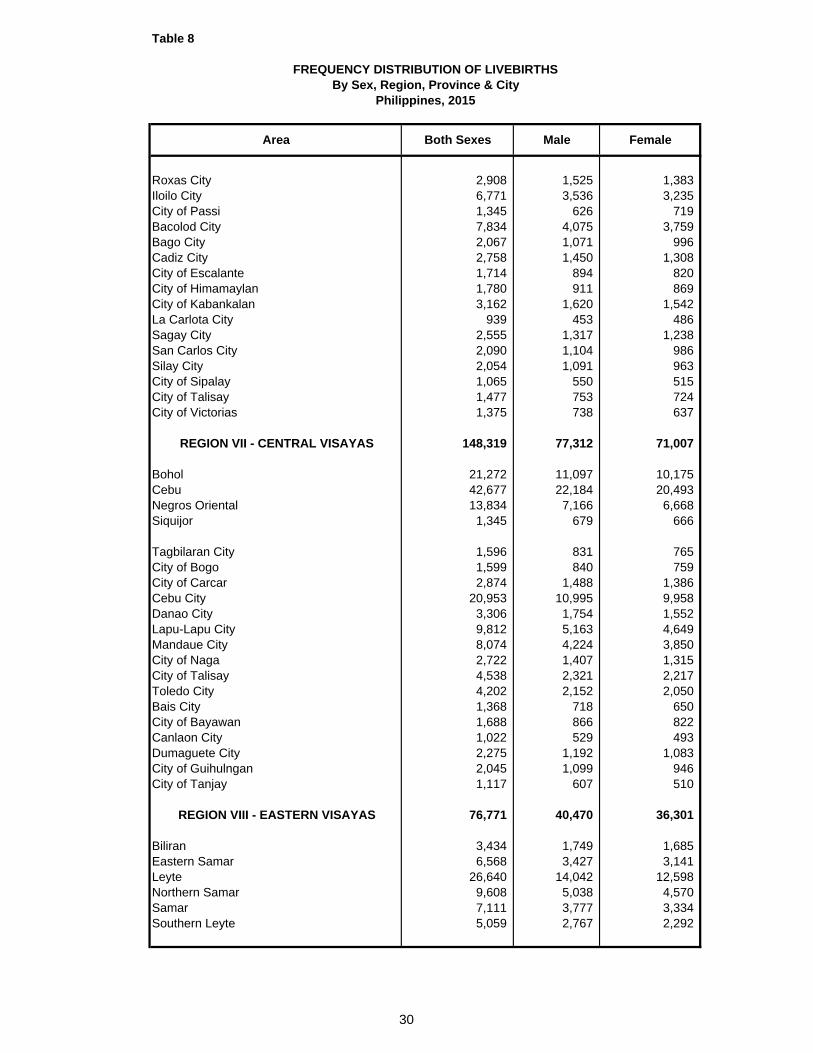
Table 8
FREQUENCY DISTRIBUTION OF LIVEBIRTHSBy Sex, Region, Province & City
Philippines, 2015
Area Both Sexes Male Female
Roxas City 2,908 1,525 1,383 Iloilo City 6,771 3,536 3,235 City of Passi 1,345 626 719 Bacolod City 7,834 4,075 3,759 Bago City 2,067 1,071 996 Cadiz City 2,758 1,450 1,308 City of Escalante 1,714 894 820 City of Himamaylan 1,780 911 869 City of Kabankalan 3,162 1,620 1,542 La Carlota City 939 453 486 Sagay City 2,555 1,317 1,238 San Carlos City 2,090 1,104 986 Silay City 2,054 1,091 963 City of Sipalay 1,065 550 515 City of Talisay 1,477 753 724 City of Victorias 1,375 738 637
REGION VII - CENTRAL VISAYAS 148,319 77,312 71,007
Bohol 21,272 11,097 10,175 Cebu 42,677 22,184 20,493 Negros Oriental 13,834 7,166 6,668 Siquijor 1,345 679 666
Tagbilaran City 1,596 831 765 City of Bogo 1,599 840 759 City of Carcar 2,874 1,488 1,386 Cebu City 20,953 10,995 9,958 Danao City 3,306 1,754 1,552 Lapu-Lapu City 9,812 5,163 4,649 Mandaue City 8,074 4,224 3,850 City of Naga 2,722 1,407 1,315 City of Talisay 4,538 2,321 2,217 Toledo City 4,202 2,152 2,050 Bais City 1,368 718 650 City of Bayawan 1,688 866 822 Canlaon City 1,022 529 493 Dumaguete City 2,275 1,192 1,083 City of Guihulngan 2,045 1,099 946 City of Tanjay 1,117 607 510
REGION VIII - EASTERN VISAYAS 76,771 40,470 36,301
Biliran 3,434 1,749 1,685 Eastern Samar 6,568 3,427 3,141 Leyte 26,640 14,042 12,598 Northern Samar 9,608 5,038 4,570 Samar 7,111 3,777 3,334 Southern Leyte 5,059 2,767 2,292
30

Table 8
FREQUENCY DISTRIBUTION OF LIVEBIRTHSBy Sex, Region, Province & City
Philippines, 2015
Area Both Sexes Male Female
City of Borongan 1,032 546 486 City of Baybay 2,128 1,106 1,022 Ormoc City 4,144 2,201 1,943 Tacloban City 4,150 2,185 1,965 Calbayog City 3,102 1,602 1,500 City of Catbalogan 2,523 1,369 1,154 City of Maasin 1,272 661 611
REGION IX - ZAMBOANGA PENINSULA 58,109 30,281 27,828
Zamboanga Del Norte 12,660 6,626 6,034 Zamboanga Del Sur 13,738 7,185 6,553 Zamboanga Sibugay 10,712 5,541 5,171
Dapitan City 1,286 682 604 Dipolog City 1,840 969 871 City of Isabela 300 158 142 Pagadian City 3,822 1,958 1,864 Zamboanga City 13,751 7,162 6,589
REGION X - NORTHERN MINDANAO 87,155 45,628 41,527
Bukidnon 21,384 11,141 10,243 Camiguin 1,664 919 745 Lanao del Norte 9,537 5,039 4,498 Misamis Occidental 5,392 2,825 2,567 Misamis Oriental 13,567 7,142 6,425
City of Malaybalay 4,018 2,077 1,941 City of Valencia 4,141 2,132 2,009 Iligan City 5,734 2,988 2,746 Oroquieta City 1,116 591 525 Ozamis City 2,676 1,370 1,306 Tangub City 1,212 643 569 Cagayan de Oro City 14,390 7,572 6,818 Gingoog City 2,324 1,189 1,135
REGION XI - DAVAO 90,009 47,209 42,800
Compostela Valley 13,400 6,968 6,432 Davao 8,839 4,623 4,216 Davao Del Sur 8,247 4,433 3,814 Davao Oriental 8,925 4,670 4,255 Davao Occidental - - -
City of Panabo 3,762 1,918 1,844 Island Garden City of Samal 2,026 1,052 974 City of Tagum 5,246 2,819 2,427 Davao City 33,786 17,668 16,118 City of Digos 3,204 1,713 1,491 City of Mati 2,574 1,345 1,229
31
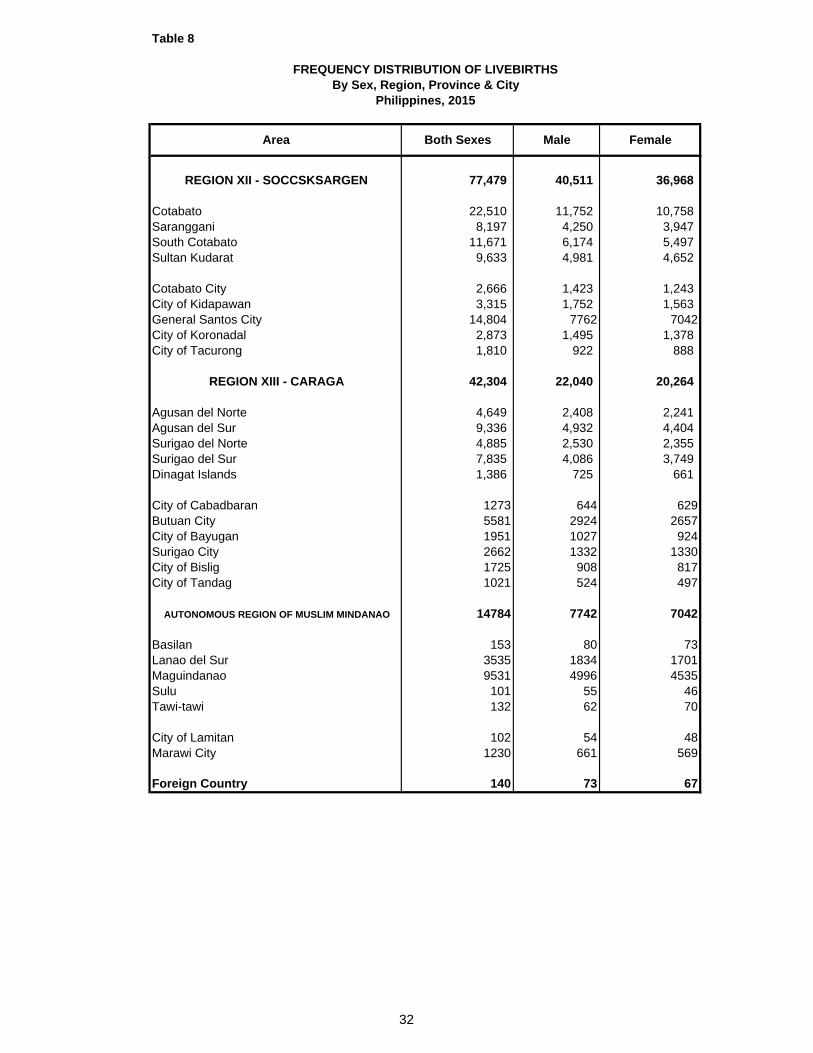
Table 8
FREQUENCY DISTRIBUTION OF LIVEBIRTHSBy Sex, Region, Province & City
Philippines, 2015
Area Both Sexes Male Female
REGION XII - SOCCSKSARGEN 77,479 40,511 36,968
Cotabato 22,510 11,752 10,758 Saranggani 8,197 4,250 3,947 South Cotabato 11,671 6,174 5,497 Sultan Kudarat 9,633 4,981 4,652
Cotabato City 2,666 1,423 1,243 City of Kidapawan 3,315 1,752 1,563 General Santos City 14,804 7762 7042City of Koronadal 2,873 1,495 1,378 City of Tacurong 1,810 922 888
REGION XIII - CARAGA 42,304 22,040 20,264
Agusan del Norte 4,649 2,408 2,241 Agusan del Sur 9,336 4,932 4,404 Surigao del Norte 4,885 2,530 2,355 Surigao del Sur 7,835 4,086 3,749 Dinagat Islands 1,386 725 661
City of Cabadbaran 1273 644 629Butuan City 5581 2924 2657City of Bayugan 1951 1027 924Surigao City 2662 1332 1330City of Bislig 1725 908 817City of Tandag 1021 524 497
AUTONOMOUS REGION OF MUSLIM MINDANAO 14784 7742 7042
Basilan 153 80 73Lanao del Sur 3535 1834 1701Maguindanao 9531 4996 4535Sulu 101 55 46Tawi-tawi 132 62 70
City of Lamitan 102 54 48Marawi City 1230 661 569
Foreign Country 140 73 67
32

Table 9
M.D. Nurse Midwife Traditional Others NotBirth Attendants Stated
PHILIPPINES 1,744,767 994,438 33,981 545,209 158,178 8,663 4,298
NATIONAL CAPITAL REGION 231,766 157,672 944 62,704 10,086 280 80
City of Manila 33,108 27,065 84 5,175 722 52 10 City of Mandaluyong 6,970 6,388 45 439 95 1 2 City of Marikina 8,147 4,757 33 3,144 203 6 4 City of Pasig 14,946 9,733 55 4,029 1,124 3 2 Quezon City 52,733 34,775 223 15,569 2,056 92 18 San Juan 1,733 1,547 42 130 10 2 2 Kalookan City 30,274 17,158 152 11,159 1,787 6 12 City of Malabon 5,965 4,167 18 1,534 245 1 - City of Navotas 4,138 2,504 5 1,518 109 1 1 City of Valenzuela 11,300 7,736 71 3,157 332 3 1 City of Las Piñas 10,933 6,042 36 3,811 996 43 5 City of Makati 9,374 7,848 9 1,449 52 16 - City of Muntinlupa 8,270 5,450 17 1,919 872 5 7 City of Parañaque 11,529 8,069 83 2,974 384 17 2 Pasay City 6,465 5,830 11 479 130 4 11 Pateros 981 452 - 527 1 1 - City of Taguig 14,900 8,151 60 5,691 968 27 3
CORDILLERA ADMINISTRATIVE REGION 30,873 24,900 752 3,217 530 1,395 79
Abra 3,897 3,168 92 436 171 12 18 Apayao 1,913 1,347 63 284 86 115 18 Benguet 8,150 7,228 75 352 31 452 12 Ifugao 3,678 2,011 216 1,039 76 333 3 Kalinga 3,643 2,382 190 712 84 261 14 Mt. Province 2,763 1,987 111 378 77 200 10
Baguio City 6,829 6,777 5 16 5 22 4
REGION I - ILOCOS 85,871 65,219 731 17,053 2,273 172 423
Ilocos Norte 6,147 5,558 32 507 43 4 3 Ilocos Sur 8,537 7,660 28 608 175 62 4 La Union 10,540 8,373 81 1,812 243 16 15 Pangasinan 42,956 29,799 340 11,194 1,303 68 252
City of Batac 730 719 3 - 6 2 - Laoag City 1,580 1,543 6 10 18 1 2 City of Candon 882 797 - 75 6 3 1 City of Vigan 845 812 2 30 1 - - City of San Fernando 1,991 1,544 200 244 3 - - City of Alaminos 1,897 1,730 3 29 129 3 3 Dagupan City 3,653 1,928 3 1,602 92 3 25 San Carlos City 3,724 3,025 1 394 188 7 109 City of Urdaneta 2,389 1,731 32 548 66 3 9
FREQUENCY DISTRIBUTION OF LIVEBIRTHSBy Attendance, Region, Province & City
Philippines, 2015
AREATotal
Livebirths
Attendant at Birth
33
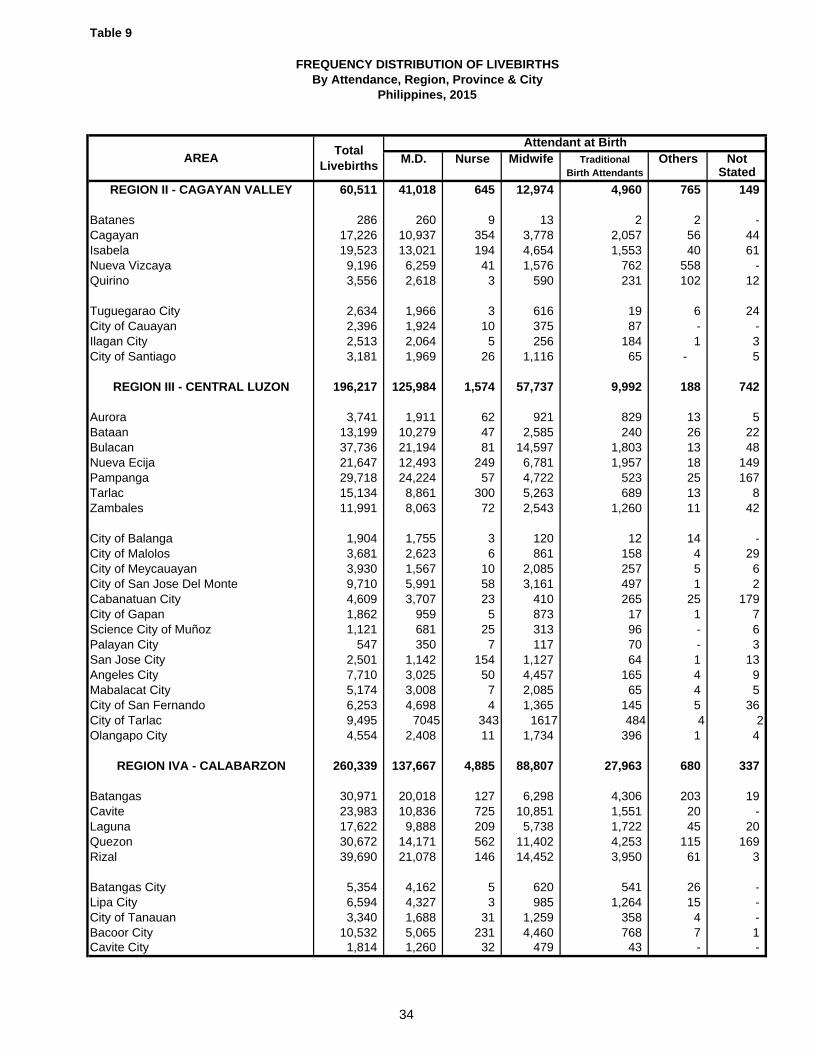
Table 9
M.D. Nurse Midwife Traditional Others NotBirth Attendants Stated
FREQUENCY DISTRIBUTION OF LIVEBIRTHSBy Attendance, Region, Province & City
Philippines, 2015
AREATotal
Livebirths
Attendant at Birth
REGION II - CAGAYAN VALLEY 60,511 41,018 645 12,974 4,960 765 149
Batanes 286 260 9 13 2 2 - Cagayan 17,226 10,937 354 3,778 2,057 56 44 Isabela 19,523 13,021 194 4,654 1,553 40 61 Nueva Vizcaya 9,196 6,259 41 1,576 762 558 - Quirino 3,556 2,618 3 590 231 102 12
Tuguegarao City 2,634 1,966 3 616 19 6 24 City of Cauayan 2,396 1,924 10 375 87 - - Ilagan City 2,513 2,064 5 256 184 1 3 City of Santiago 3,181 1,969 26 1,116 65 - 5
REGION III - CENTRAL LUZON 196,217 125,984 1,574 57,737 9,992 188 742
Aurora 3,741 1,911 62 921 829 13 5 Bataan 13,199 10,279 47 2,585 240 26 22 Bulacan 37,736 21,194 81 14,597 1,803 13 48 Nueva Ecija 21,647 12,493 249 6,781 1,957 18 149 Pampanga 29,718 24,224 57 4,722 523 25 167 Tarlac 15,134 8,861 300 5,263 689 13 8 Zambales 11,991 8,063 72 2,543 1,260 11 42
City of Balanga 1,904 1,755 3 120 12 14 - City of Malolos 3,681 2,623 6 861 158 4 29 City of Meycauayan 3,930 1,567 10 2,085 257 5 6 City of San Jose Del Monte 9,710 5,991 58 3,161 497 1 2 Cabanatuan City 4,609 3,707 23 410 265 25 179 City of Gapan 1,862 959 5 873 17 1 7 Science City of Muñoz 1,121 681 25 313 96 - 6 Palayan City 547 350 7 117 70 - 3 San Jose City 2,501 1,142 154 1,127 64 1 13 Angeles City 7,710 3,025 50 4,457 165 4 9 Mabalacat City 5,174 3,008 7 2,085 65 4 5 City of San Fernando 6,253 4,698 4 1,365 145 5 36 City of Tarlac 9,495 7045 343 1617 484 4 2Olangapo City 4,554 2,408 11 1,734 396 1 4
REGION IVA - CALABARZON 260,339 137,667 4,885 88,807 27,963 680 337
Batangas 30,971 20,018 127 6,298 4,306 203 19 Cavite 23,983 10,836 725 10,851 1,551 20 - Laguna 17,622 9,888 209 5,738 1,722 45 20 Quezon 30,672 14,171 562 11,402 4,253 115 169 Rizal 39,690 21,078 146 14,452 3,950 61 3
Batangas City 5,354 4,162 5 620 541 26 - Lipa City 6,594 4,327 3 985 1,264 15 - City of Tanauan 3,340 1,688 31 1,259 358 4 - Bacoor City 10,532 5,065 231 4,460 768 7 1 Cavite City 1,814 1,260 32 479 43 - -
34
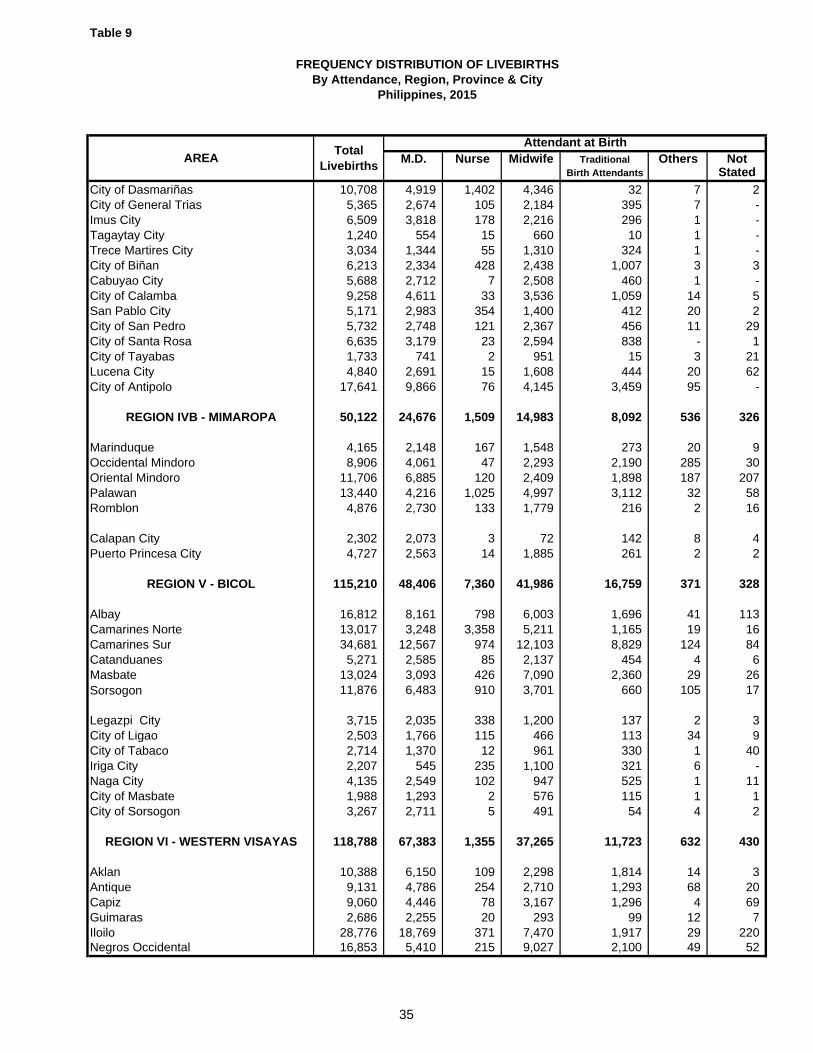
Table 9
M.D. Nurse Midwife Traditional Others NotBirth Attendants Stated
FREQUENCY DISTRIBUTION OF LIVEBIRTHSBy Attendance, Region, Province & City
Philippines, 2015
AREATotal
Livebirths
Attendant at Birth
City of Dasmariñas 10,708 4,919 1,402 4,346 32 7 2 City of General Trias 5,365 2,674 105 2,184 395 7 - Imus City 6,509 3,818 178 2,216 296 1 - Tagaytay City 1,240 554 15 660 10 1 - Trece Martires City 3,034 1,344 55 1,310 324 1 - City of Biñan 6,213 2,334 428 2,438 1,007 3 3 Cabuyao City 5,688 2,712 7 2,508 460 1 - City of Calamba 9,258 4,611 33 3,536 1,059 14 5 San Pablo City 5,171 2,983 354 1,400 412 20 2 City of San Pedro 5,732 2,748 121 2,367 456 11 29 City of Santa Rosa 6,635 3,179 23 2,594 838 - 1 City of Tayabas 1,733 741 2 951 15 3 21 Lucena City 4,840 2,691 15 1,608 444 20 62 City of Antipolo 17,641 9,866 76 4,145 3,459 95 -
REGION IVB - MIMAROPA 50,122 24,676 1,509 14,983 8,092 536 326
Marinduque 4,165 2,148 167 1,548 273 20 9 Occidental Mindoro 8,906 4,061 47 2,293 2,190 285 30 Oriental Mindoro 11,706 6,885 120 2,409 1,898 187 207 Palawan 13,440 4,216 1,025 4,997 3,112 32 58 Romblon 4,876 2,730 133 1,779 216 2 16
Calapan City 2,302 2,073 3 72 142 8 4 Puerto Princesa City 4,727 2,563 14 1,885 261 2 2
REGION V - BICOL 115,210 48,406 7,360 41,986 16,759 371 328
Albay 16,812 8,161 798 6,003 1,696 41 113 Camarines Norte 13,017 3,248 3,358 5,211 1,165 19 16 Camarines Sur 34,681 12,567 974 12,103 8,829 124 84 Catanduanes 5,271 2,585 85 2,137 454 4 6 Masbate 13,024 3,093 426 7,090 2,360 29 26 Sorsogon 11,876 6,483 910 3,701 660 105 17
Legazpi City 3,715 2,035 338 1,200 137 2 3 City of Ligao 2,503 1,766 115 466 113 34 9 City of Tabaco 2,714 1,370 12 961 330 1 40 Iriga City 2,207 545 235 1,100 321 6 - Naga City 4,135 2,549 102 947 525 1 11 City of Masbate 1,988 1,293 2 576 115 1 1 City of Sorsogon 3,267 2,711 5 491 54 4 2
REGION VI - WESTERN VISAYAS 118,788 67,383 1,355 37,265 11,723 632 430
Aklan 10,388 6,150 109 2,298 1,814 14 3 Antique 9,131 4,786 254 2,710 1,293 68 20 Capiz 9,060 4,446 78 3,167 1,296 4 69 Guimaras 2,686 2,255 20 293 99 12 7 Iloilo 28,776 18,769 371 7,470 1,917 29 220 Negros Occidental 16,853 5,410 215 9,027 2,100 49 52
35
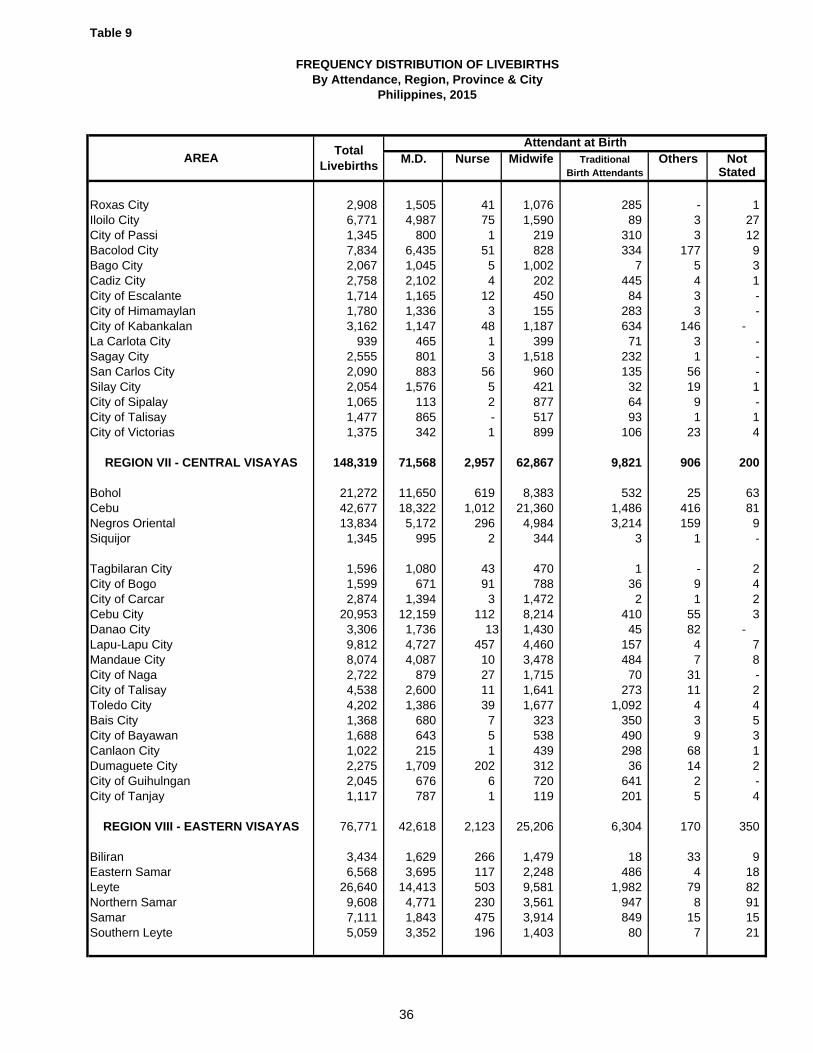
Table 9
M.D. Nurse Midwife Traditional Others NotBirth Attendants Stated
FREQUENCY DISTRIBUTION OF LIVEBIRTHSBy Attendance, Region, Province & City
Philippines, 2015
AREATotal
Livebirths
Attendant at Birth
Roxas City 2,908 1,505 41 1,076 285 - 1 Iloilo City 6,771 4,987 75 1,590 89 3 27 City of Passi 1,345 800 1 219 310 3 12 Bacolod City 7,834 6,435 51 828 334 177 9 Bago City 2,067 1,045 5 1,002 7 5 3 Cadiz City 2,758 2,102 4 202 445 4 1 City of Escalante 1,714 1,165 12 450 84 3 - City of Himamaylan 1,780 1,336 3 155 283 3 - City of Kabankalan 3,162 1,147 48 1,187 634 146 - La Carlota City 939 465 1 399 71 3 - Sagay City 2,555 801 3 1,518 232 1 - San Carlos City 2,090 883 56 960 135 56 - Silay City 2,054 1,576 5 421 32 19 1 City of Sipalay 1,065 113 2 877 64 9 - City of Talisay 1,477 865 - 517 93 1 1 City of Victorias 1,375 342 1 899 106 23 4
REGION VII - CENTRAL VISAYAS 148,319 71,568 2,957 62,867 9,821 906 200
Bohol 21,272 11,650 619 8,383 532 25 63 Cebu 42,677 18,322 1,012 21,360 1,486 416 81 Negros Oriental 13,834 5,172 296 4,984 3,214 159 9 Siquijor 1,345 995 2 344 3 1 -
Tagbilaran City 1,596 1,080 43 470 1 - 2 City of Bogo 1,599 671 91 788 36 9 4 City of Carcar 2,874 1,394 3 1,472 2 1 2 Cebu City 20,953 12,159 112 8,214 410 55 3 Danao City 3,306 1,736 13 1,430 45 82 - Lapu-Lapu City 9,812 4,727 457 4,460 157 4 7 Mandaue City 8,074 4,087 10 3,478 484 7 8 City of Naga 2,722 879 27 1,715 70 31 - City of Talisay 4,538 2,600 11 1,641 273 11 2 Toledo City 4,202 1,386 39 1,677 1,092 4 4 Bais City 1,368 680 7 323 350 3 5 City of Bayawan 1,688 643 5 538 490 9 3 Canlaon City 1,022 215 1 439 298 68 1 Dumaguete City 2,275 1,709 202 312 36 14 2 City of Guihulngan 2,045 676 6 720 641 2 - City of Tanjay 1,117 787 1 119 201 5 4
REGION VIII - EASTERN VISAYAS 76,771 42,618 2,123 25,206 6,304 170 350
Biliran 3,434 1,629 266 1,479 18 33 9 Eastern Samar 6,568 3,695 117 2,248 486 4 18 Leyte 26,640 14,413 503 9,581 1,982 79 82 Northern Samar 9,608 4,771 230 3,561 947 8 91 Samar 7,111 1,843 475 3,914 849 15 15 Southern Leyte 5,059 3,352 196 1,403 80 7 21
36
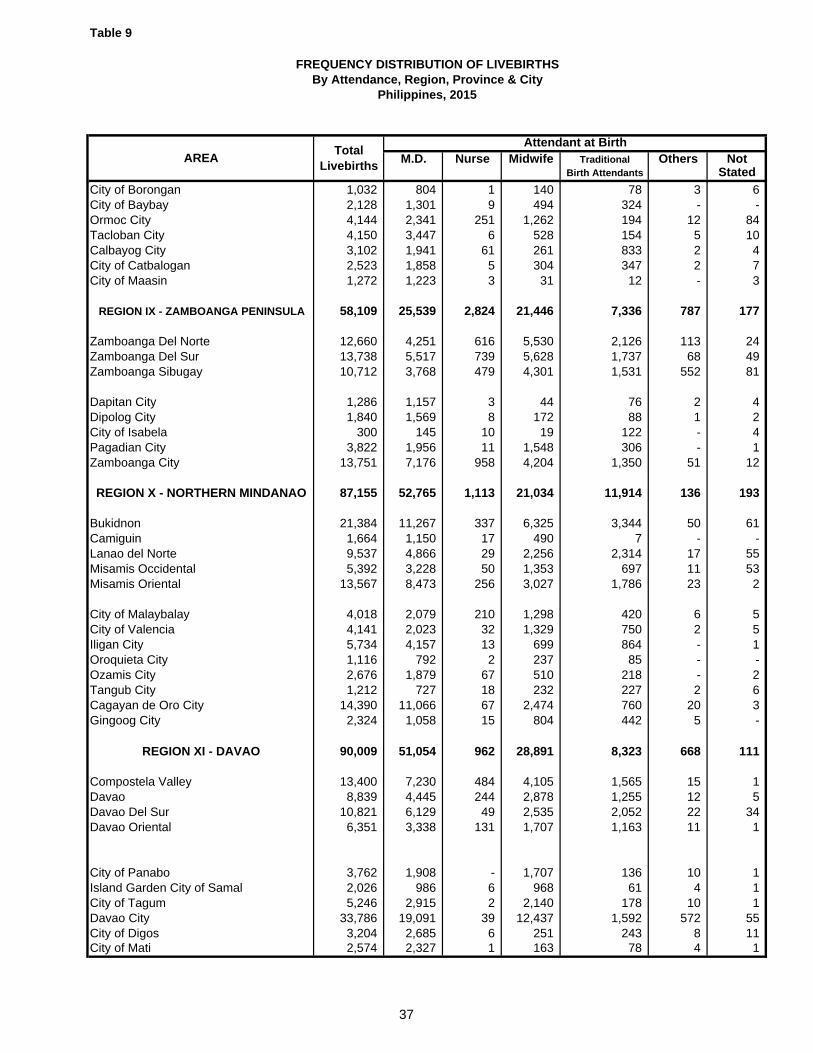
Table 9
M.D. Nurse Midwife Traditional Others NotBirth Attendants Stated
FREQUENCY DISTRIBUTION OF LIVEBIRTHSBy Attendance, Region, Province & City
Philippines, 2015
AREATotal
Livebirths
Attendant at Birth
City of Borongan 1,032 804 1 140 78 3 6 City of Baybay 2,128 1,301 9 494 324 - - Ormoc City 4,144 2,341 251 1,262 194 12 84 Tacloban City 4,150 3,447 6 528 154 5 10 Calbayog City 3,102 1,941 61 261 833 2 4 City of Catbalogan 2,523 1,858 5 304 347 2 7 City of Maasin 1,272 1,223 3 31 12 - 3
REGION IX - ZAMBOANGA PENINSULA 58,109 25,539 2,824 21,446 7,336 787 177
Zamboanga Del Norte 12,660 4,251 616 5,530 2,126 113 24 Zamboanga Del Sur 13,738 5,517 739 5,628 1,737 68 49 Zamboanga Sibugay 10,712 3,768 479 4,301 1,531 552 81
Dapitan City 1,286 1,157 3 44 76 2 4 Dipolog City 1,840 1,569 8 172 88 1 2 City of Isabela 300 145 10 19 122 - 4 Pagadian City 3,822 1,956 11 1,548 306 - 1 Zamboanga City 13,751 7,176 958 4,204 1,350 51 12
REGION X - NORTHERN MINDANAO 87,155 52,765 1,113 21,034 11,914 136 193
Bukidnon 21,384 11,267 337 6,325 3,344 50 61 Camiguin 1,664 1,150 17 490 7 - - Lanao del Norte 9,537 4,866 29 2,256 2,314 17 55 Misamis Occidental 5,392 3,228 50 1,353 697 11 53 Misamis Oriental 13,567 8,473 256 3,027 1,786 23 2
City of Malaybalay 4,018 2,079 210 1,298 420 6 5 City of Valencia 4,141 2,023 32 1,329 750 2 5 Iligan City 5,734 4,157 13 699 864 - 1 Oroquieta City 1,116 792 2 237 85 - - Ozamis City 2,676 1,879 67 510 218 - 2 Tangub City 1,212 727 18 232 227 2 6 Cagayan de Oro City 14,390 11,066 67 2,474 760 20 3 Gingoog City 2,324 1,058 15 804 442 5 -
REGION XI - DAVAO 90,009 51,054 962 28,891 8,323 668 111
Compostela Valley 13,400 7,230 484 4,105 1,565 15 1 Davao 8,839 4,445 244 2,878 1,255 12 5 Davao Del Sur 10,821 6,129 49 2,535 2,052 22 34 Davao Oriental 6,351 3,338 131 1,707 1,163 11 1
City of Panabo 3,762 1,908 - 1,707 136 10 1 Island Garden City of Samal 2,026 986 6 968 61 4 1 City of Tagum 5,246 2,915 2 2,140 178 10 1 Davao City 33,786 19,091 39 12,437 1,592 572 55 City of Digos 3,204 2,685 6 251 243 8 11 City of Mati 2,574 2,327 1 163 78 4 1
37

Table 9
M.D. Nurse Midwife Traditional Others NotBirth Attendants Stated
FREQUENCY DISTRIBUTION OF LIVEBIRTHSBy Attendance, Region, Province & City
Philippines, 2015
AREATotal
Livebirths
Attendant at Birth
REGION XII - SOCCSKSARGEN 77,479 29,133 2,806 32,580 11,981 795 184
Cotabato 22,510 7,520 1,036 7,017 6,513 399 25 Saranggani 8,197 1,504 579 4,883 1,168 56 7 South Cotabato 11,671 6,010 199 3,766 1,357 252 87 Sultan Kudarat 9,633 2,854 241 5,092 1,387 52 7
Cotabato City 2,666 1,299 122 710 527 5 3 City of Kidapawan 3,315 1,952 163 1,082 109 5 4 General Santos City 14,804 5132 447 8523 680 16 6City of Koronadal 2,873 1,930 6 664 224 4 45 City of Tacurong 1,810 932 13 843 16 6 -
REGION XIII - CARAGA 42,304 23,626 832 12,802 4,811 75 158
Agusan del Norte 4,649 2,298 13 1,562 734 12 30 Agusan del Sur 9,336 3,602 97 3,360 2,257 19 1 Surigao del Norte 4,885 2,566 379 1,663 272 4 1 Surigao del Sur 7,835 5,876 62 1,179 606 11 101 Dinagat Islands 1,386 493 17 663 202 4 7
City of Cabadbaran 1,273 1,172 - 95 4 - 2 Butuan City 5,581 2,963 243 2,341 27 - 7 City of Bayugan 1,951 492 12 938 508 - 1 Surigao City 2,662 1,560 9 906 161 25 1 City of Bislig 1,725 1,598 - 91 29 - 7 City of Tandag 1,021 1,006 - 4 11 - -
ARMM 14784 5,089 607 3,646 5,304 107 31
Basilan 153 58 - 10 85 - - Lanao del Sur 3,535 1,779 236 578 927 13 2 Maguindanao 9,531 2,029 335 2,968 4,081 91 27 Sulu 101 85 - 11 5 - - Tawi-tawi 132 81 3 21 27 - -
City of Lamitan 102 60 - 25 16 1 - Marawi City 1,230 997 33 33 163 2 2
Foreign Country 140 121 2 11 6 - -
38
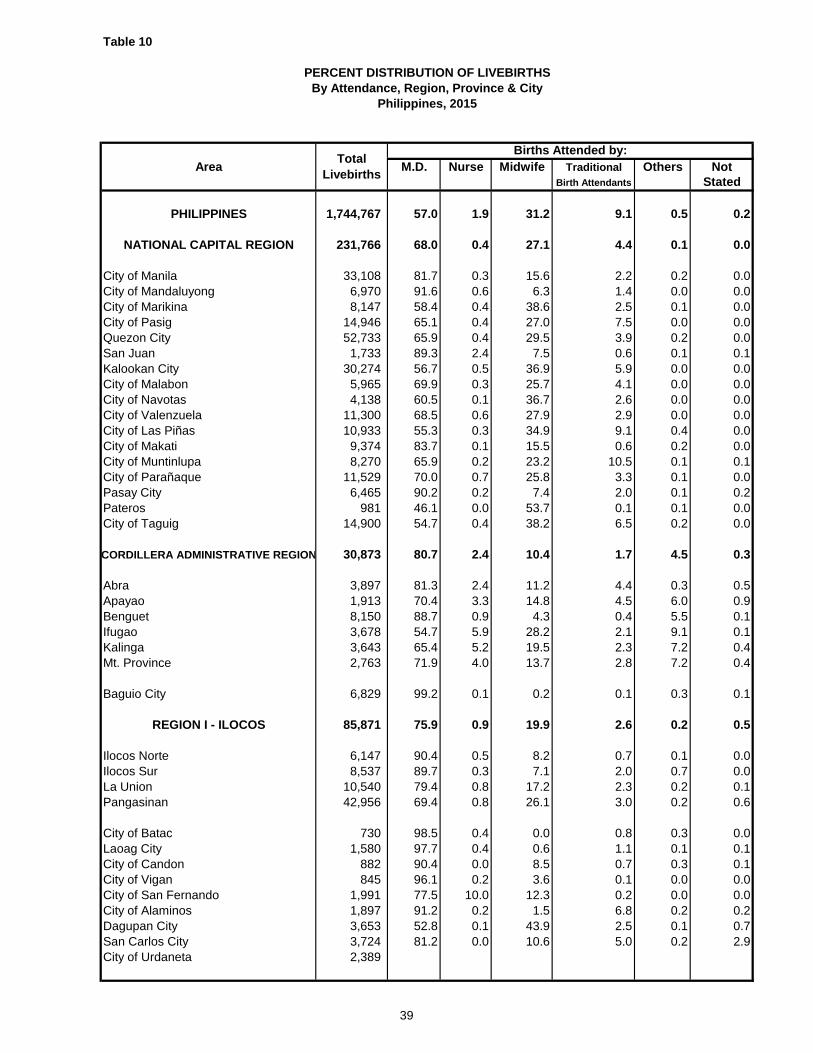
Table 10
Area M.D. Nurse Midwife Traditional Others NotBirth Attendants Stated
PHILIPPINES 1,744,767 57.0 1.9 31.2 9.1 0.5 0.2
NATIONAL CAPITAL REGION 231,766 68.0 0.4 27.1 4.4 0.1 0.0
City of Manila 33,108 81.7 0.3 15.6 2.2 0.2 0.0City of Mandaluyong 6,970 91.6 0.6 6.3 1.4 0.0 0.0City of Marikina 8,147 58.4 0.4 38.6 2.5 0.1 0.0City of Pasig 14,946 65.1 0.4 27.0 7.5 0.0 0.0Quezon City 52,733 65.9 0.4 29.5 3.9 0.2 0.0San Juan 1,733 89.3 2.4 7.5 0.6 0.1 0.1Kalookan City 30,274 56.7 0.5 36.9 5.9 0.0 0.0City of Malabon 5,965 69.9 0.3 25.7 4.1 0.0 0.0City of Navotas 4,138 60.5 0.1 36.7 2.6 0.0 0.0City of Valenzuela 11,300 68.5 0.6 27.9 2.9 0.0 0.0City of Las Piñas 10,933 55.3 0.3 34.9 9.1 0.4 0.0City of Makati 9,374 83.7 0.1 15.5 0.6 0.2 0.0City of Muntinlupa 8,270 65.9 0.2 23.2 10.5 0.1 0.1City of Parañaque 11,529 70.0 0.7 25.8 3.3 0.1 0.0Pasay City 6,465 90.2 0.2 7.4 2.0 0.1 0.2Pateros 981 46.1 0.0 53.7 0.1 0.1 0.0City of Taguig 14,900 54.7 0.4 38.2 6.5 0.2 0.0
CORDILLERA ADMINISTRATIVE REGION 30,873 80.7 2.4 10.4 1.7 4.5 0.3
Abra 3,897 81.3 2.4 11.2 4.4 0.3 0.5Apayao 1,913 70.4 3.3 14.8 4.5 6.0 0.9Benguet 8,150 88.7 0.9 4.3 0.4 5.5 0.1Ifugao 3,678 54.7 5.9 28.2 2.1 9.1 0.1Kalinga 3,643 65.4 5.2 19.5 2.3 7.2 0.4Mt. Province 2,763 71.9 4.0 13.7 2.8 7.2 0.4
Baguio City 6,829 99.2 0.1 0.2 0.1 0.3 0.1
REGION I - ILOCOS 85,871 75.9 0.9 19.9 2.6 0.2 0.5
Ilocos Norte 6,147 90.4 0.5 8.2 0.7 0.1 0.0Ilocos Sur 8,537 89.7 0.3 7.1 2.0 0.7 0.0La Union 10,540 79.4 0.8 17.2 2.3 0.2 0.1Pangasinan 42,956 69.4 0.8 26.1 3.0 0.2 0.6
City of Batac 730 98.5 0.4 0.0 0.8 0.3 0.0Laoag City 1,580 97.7 0.4 0.6 1.1 0.1 0.1City of Candon 882 90.4 0.0 8.5 0.7 0.3 0.1City of Vigan 845 96.1 0.2 3.6 0.1 0.0 0.0City of San Fernando 1,991 77.5 10.0 12.3 0.2 0.0 0.0City of Alaminos 1,897 91.2 0.2 1.5 6.8 0.2 0.2Dagupan City 3,653 52.8 0.1 43.9 2.5 0.1 0.7San Carlos City 3,724 81.2 0.0 10.6 5.0 0.2 2.9City of Urdaneta 2,389
Births Attended by:
PERCENT DISTRIBUTION OF LIVEBIRTHSBy Attendance, Region, Province & City
Philippines, 2015
Total Livebirths
39
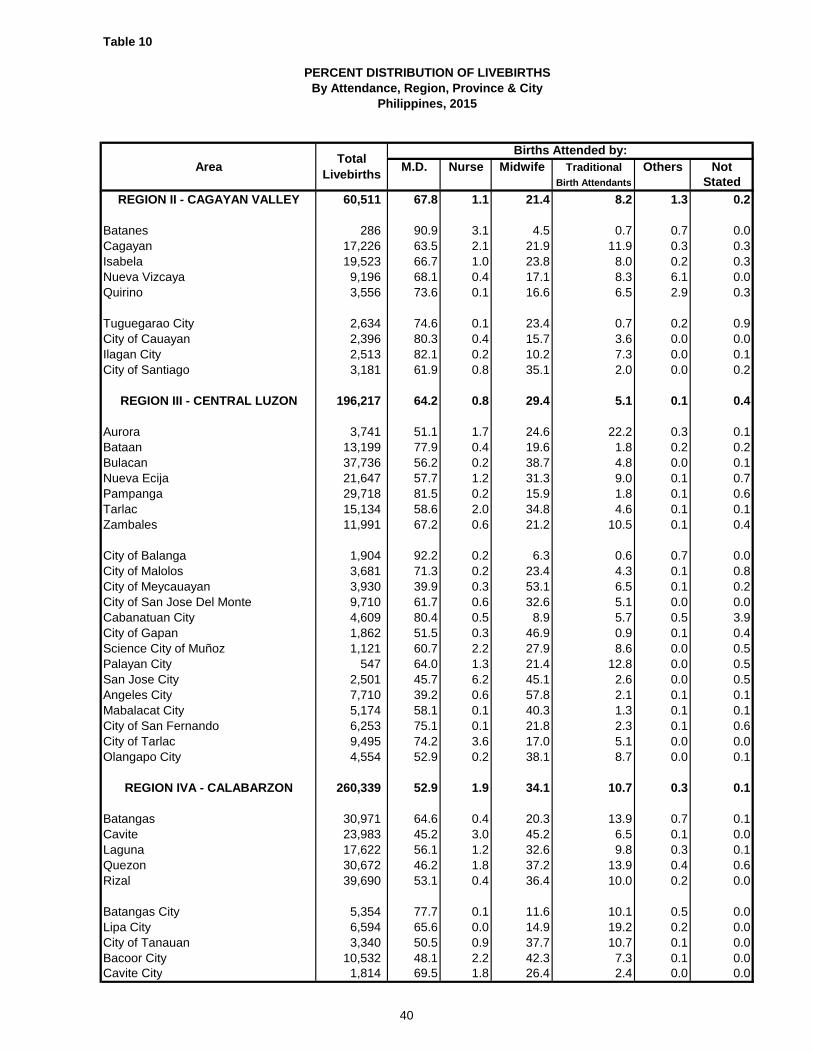
Table 10
Area M.D. Nurse Midwife Traditional Others NotBirth Attendants Stated
Births Attended by:
PERCENT DISTRIBUTION OF LIVEBIRTHSBy Attendance, Region, Province & City
Philippines, 2015
Total Livebirths
REGION II - CAGAYAN VALLEY 60,511 67.8 1.1 21.4 8.2 1.3 0.2
Batanes 286 90.9 3.1 4.5 0.7 0.7 0.0Cagayan 17,226 63.5 2.1 21.9 11.9 0.3 0.3Isabela 19,523 66.7 1.0 23.8 8.0 0.2 0.3Nueva Vizcaya 9,196 68.1 0.4 17.1 8.3 6.1 0.0Quirino 3,556 73.6 0.1 16.6 6.5 2.9 0.3
Tuguegarao City 2,634 74.6 0.1 23.4 0.7 0.2 0.9City of Cauayan 2,396 80.3 0.4 15.7 3.6 0.0 0.0Ilagan City 2,513 82.1 0.2 10.2 7.3 0.0 0.1City of Santiago 3,181 61.9 0.8 35.1 2.0 0.0 0.2
REGION III - CENTRAL LUZON 196,217 64.2 0.8 29.4 5.1 0.1 0.4
Aurora 3,741 51.1 1.7 24.6 22.2 0.3 0.1Bataan 13,199 77.9 0.4 19.6 1.8 0.2 0.2Bulacan 37,736 56.2 0.2 38.7 4.8 0.0 0.1Nueva Ecija 21,647 57.7 1.2 31.3 9.0 0.1 0.7Pampanga 29,718 81.5 0.2 15.9 1.8 0.1 0.6Tarlac 15,134 58.6 2.0 34.8 4.6 0.1 0.1Zambales 11,991 67.2 0.6 21.2 10.5 0.1 0.4
City of Balanga 1,904 92.2 0.2 6.3 0.6 0.7 0.0City of Malolos 3,681 71.3 0.2 23.4 4.3 0.1 0.8City of Meycauayan 3,930 39.9 0.3 53.1 6.5 0.1 0.2City of San Jose Del Monte 9,710 61.7 0.6 32.6 5.1 0.0 0.0Cabanatuan City 4,609 80.4 0.5 8.9 5.7 0.5 3.9City of Gapan 1,862 51.5 0.3 46.9 0.9 0.1 0.4Science City of Muñoz 1,121 60.7 2.2 27.9 8.6 0.0 0.5Palayan City 547 64.0 1.3 21.4 12.8 0.0 0.5San Jose City 2,501 45.7 6.2 45.1 2.6 0.0 0.5Angeles City 7,710 39.2 0.6 57.8 2.1 0.1 0.1Mabalacat City 5,174 58.1 0.1 40.3 1.3 0.1 0.1City of San Fernando 6,253 75.1 0.1 21.8 2.3 0.1 0.6City of Tarlac 9,495 74.2 3.6 17.0 5.1 0.0 0.0Olangapo City 4,554 52.9 0.2 38.1 8.7 0.0 0.1
REGION IVA - CALABARZON 260,339 52.9 1.9 34.1 10.7 0.3 0.1
Batangas 30,971 64.6 0.4 20.3 13.9 0.7 0.1Cavite 23,983 45.2 3.0 45.2 6.5 0.1 0.0Laguna 17,622 56.1 1.2 32.6 9.8 0.3 0.1Quezon 30,672 46.2 1.8 37.2 13.9 0.4 0.6Rizal 39,690 53.1 0.4 36.4 10.0 0.2 0.0
Batangas City 5,354 77.7 0.1 11.6 10.1 0.5 0.0Lipa City 6,594 65.6 0.0 14.9 19.2 0.2 0.0City of Tanauan 3,340 50.5 0.9 37.7 10.7 0.1 0.0Bacoor City 10,532 48.1 2.2 42.3 7.3 0.1 0.0Cavite City 1,814 69.5 1.8 26.4 2.4 0.0 0.0
40

Table 10
Area M.D. Nurse Midwife Traditional Others NotBirth Attendants Stated
Births Attended by:
PERCENT DISTRIBUTION OF LIVEBIRTHSBy Attendance, Region, Province & City
Philippines, 2015
Total Livebirths
City of Dasmariñas 10,708 45.9 13.1 40.6 0.3 0.1 0.0City of General Trias 5,365 49.8 2.0 40.7 7.4 0.1 0.0Imus City 6,509 58.7 2.7 34.0 4.5 0.0 0.0Tagaytay City 1,240 44.7 1.2 53.2 0.8 0.1 0.0Trece Martires City 3,034 44.3 1.8 43.2 10.7 0.0 0.0City of Biñan 6,213 37.6 6.9 39.2 16.2 0.0 0.0Cabuyao City 5,688 47.7 0.1 44.1 8.1 0.0 0.0City of Calamba 9,258 49.8 0.4 38.2 11.4 0.2 0.1San Pablo City 5,171 57.7 6.8 27.1 8.0 0.4 0.0City of San Pedro 5,732 47.9 2.1 41.3 8.0 0.2 0.5City of Santa Rosa 6,635 47.9 0.3 39.1 12.6 0.0 0.0City of Tayabas 1,733 42.8 0.1 54.9 0.9 0.2 1.2Lucena City 4,840 55.6 0.3 33.2 9.2 0.4 1.3City of Antipolo 17,641 55.9 0.4 23.5 19.6 0.5 0.0
REGION IVB - MIMAROPA 50,122 49.2 3.0 29.9 16.1 1.1 0.7
Marinduque 4,165 51.6 4.0 37.2 6.6 0.5 0.2Occidental Mindoro 8,906 45.6 0.5 25.7 24.6 3.2 0.3Oriental Mindoro 11,706 58.8 1.0 20.6 16.2 1.6 1.8Palawan 13,440 31.4 7.6 37.2 23.2 0.2 0.4Romblon 4,876 56.0 2.7 36.5 4.4 0.0 0.3
Calapan City 2,302 90.1 0.1 3.1 6.2 0.3 0.2Puerto Princesa City 4,727 54.2 0.3 39.9 5.5 0.0 0.0
REGION V - BICOL 115,210 42.0 6.4 36.4 14.5 0.3 0.3
Albay 16,812 48.5 4.7 35.7 10.1 0.2 0.7Camarines Norte 13,017 25.0 25.8 40.0 8.9 0.1 0.1Camarines Sur 34,681 36.2 2.8 34.9 25.5 0.4 0.2Catanduanes 5,271 49.0 1.6 40.5 8.6 0.1 0.1Masbate 13,024 23.7 3.3 54.4 18.1 0.2 0.2Sorsogon 11,876 54.6 7.7 31.2 5.6 0.9 0.1
Legazpi City 3,715 54.8 9.1 32.3 3.7 0.1 0.1City of Ligao 2,503 70.6 4.6 18.6 4.5 1.4 0.4City of Tabaco 2,714 50.5 0.4 35.4 12.2 0.0 1.5Iriga City 2,207 24.7 10.6 49.8 14.5 0.3 0.0Naga City 4,135 61.6 2.5 22.9 12.7 0.0 0.3City of Masbate 1,988 65.0 0.1 29.0 5.8 0.1 0.1City of Sorsogon 3,267 83.0 0.2 15.0 1.7 0.1 0.1
REGION VI - WESTERN VISAYAS 118,788 56.7 1.1 31.4 9.9 0.5 0.4
Aklan 10,388 59.2 1.0 22.1 17.5 0.1 0.0Antique 9,131 52.4 2.8 29.7 14.2 0.7 0.2Capiz 9,060 49.1 0.9 35.0 14.3 0.0 0.8Guimaras 2,686 84.0 0.7 10.9 3.7 0.4 0.3Iloilo 28,776 65.2 1.3 26.0 6.7 0.1 0.8Negros Occidental 16,853 32.1 1.3 53.6 12.5 0.3 0.3
41
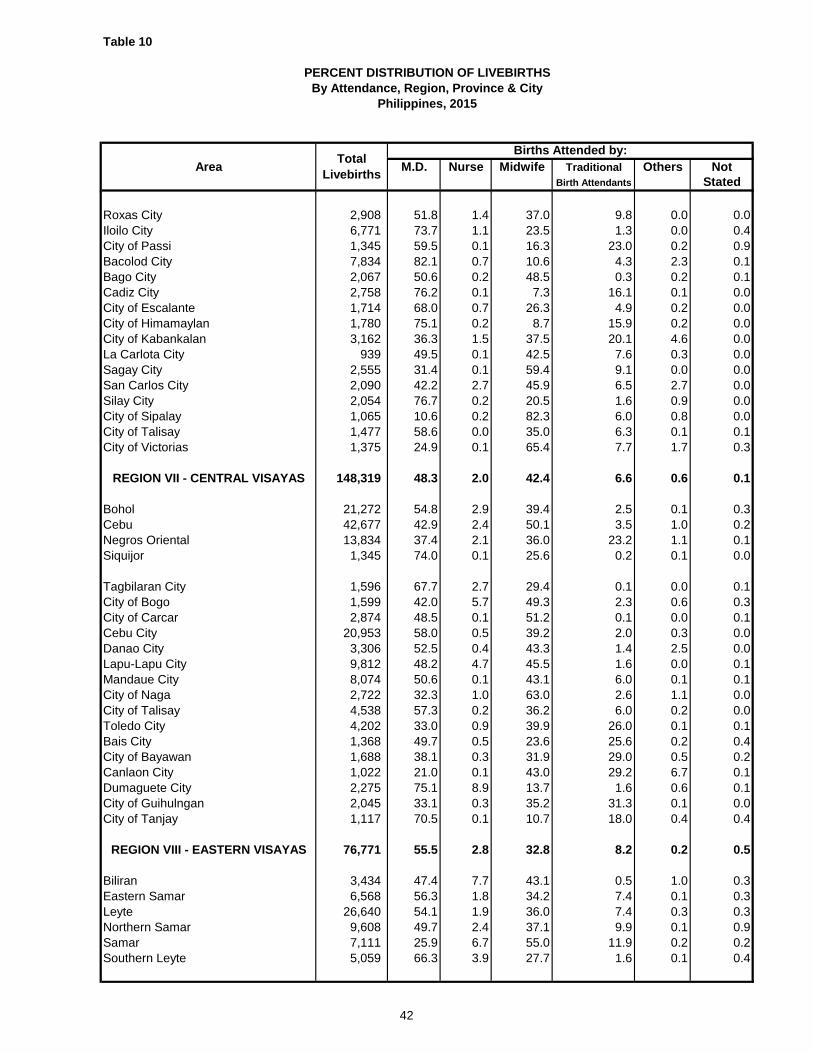
Table 10
Area M.D. Nurse Midwife Traditional Others NotBirth Attendants Stated
Births Attended by:
PERCENT DISTRIBUTION OF LIVEBIRTHSBy Attendance, Region, Province & City
Philippines, 2015
Total Livebirths
Roxas City 2,908 51.8 1.4 37.0 9.8 0.0 0.0Iloilo City 6,771 73.7 1.1 23.5 1.3 0.0 0.4City of Passi 1,345 59.5 0.1 16.3 23.0 0.2 0.9Bacolod City 7,834 82.1 0.7 10.6 4.3 2.3 0.1Bago City 2,067 50.6 0.2 48.5 0.3 0.2 0.1Cadiz City 2,758 76.2 0.1 7.3 16.1 0.1 0.0City of Escalante 1,714 68.0 0.7 26.3 4.9 0.2 0.0City of Himamaylan 1,780 75.1 0.2 8.7 15.9 0.2 0.0City of Kabankalan 3,162 36.3 1.5 37.5 20.1 4.6 0.0La Carlota City 939 49.5 0.1 42.5 7.6 0.3 0.0Sagay City 2,555 31.4 0.1 59.4 9.1 0.0 0.0San Carlos City 2,090 42.2 2.7 45.9 6.5 2.7 0.0Silay City 2,054 76.7 0.2 20.5 1.6 0.9 0.0City of Sipalay 1,065 10.6 0.2 82.3 6.0 0.8 0.0City of Talisay 1,477 58.6 0.0 35.0 6.3 0.1 0.1City of Victorias 1,375 24.9 0.1 65.4 7.7 1.7 0.3
REGION VII - CENTRAL VISAYAS 148,319 48.3 2.0 42.4 6.6 0.6 0.1
Bohol 21,272 54.8 2.9 39.4 2.5 0.1 0.3Cebu 42,677 42.9 2.4 50.1 3.5 1.0 0.2Negros Oriental 13,834 37.4 2.1 36.0 23.2 1.1 0.1Siquijor 1,345 74.0 0.1 25.6 0.2 0.1 0.0
Tagbilaran City 1,596 67.7 2.7 29.4 0.1 0.0 0.1City of Bogo 1,599 42.0 5.7 49.3 2.3 0.6 0.3City of Carcar 2,874 48.5 0.1 51.2 0.1 0.0 0.1Cebu City 20,953 58.0 0.5 39.2 2.0 0.3 0.0Danao City 3,306 52.5 0.4 43.3 1.4 2.5 0.0Lapu-Lapu City 9,812 48.2 4.7 45.5 1.6 0.0 0.1Mandaue City 8,074 50.6 0.1 43.1 6.0 0.1 0.1City of Naga 2,722 32.3 1.0 63.0 2.6 1.1 0.0City of Talisay 4,538 57.3 0.2 36.2 6.0 0.2 0.0Toledo City 4,202 33.0 0.9 39.9 26.0 0.1 0.1Bais City 1,368 49.7 0.5 23.6 25.6 0.2 0.4City of Bayawan 1,688 38.1 0.3 31.9 29.0 0.5 0.2Canlaon City 1,022 21.0 0.1 43.0 29.2 6.7 0.1Dumaguete City 2,275 75.1 8.9 13.7 1.6 0.6 0.1City of Guihulngan 2,045 33.1 0.3 35.2 31.3 0.1 0.0City of Tanjay 1,117 70.5 0.1 10.7 18.0 0.4 0.4
REGION VIII - EASTERN VISAYAS 76,771 55.5 2.8 32.8 8.2 0.2 0.5
Biliran 3,434 47.4 7.7 43.1 0.5 1.0 0.3Eastern Samar 6,568 56.3 1.8 34.2 7.4 0.1 0.3Leyte 26,640 54.1 1.9 36.0 7.4 0.3 0.3Northern Samar 9,608 49.7 2.4 37.1 9.9 0.1 0.9Samar 7,111 25.9 6.7 55.0 11.9 0.2 0.2Southern Leyte 5,059 66.3 3.9 27.7 1.6 0.1 0.4
42
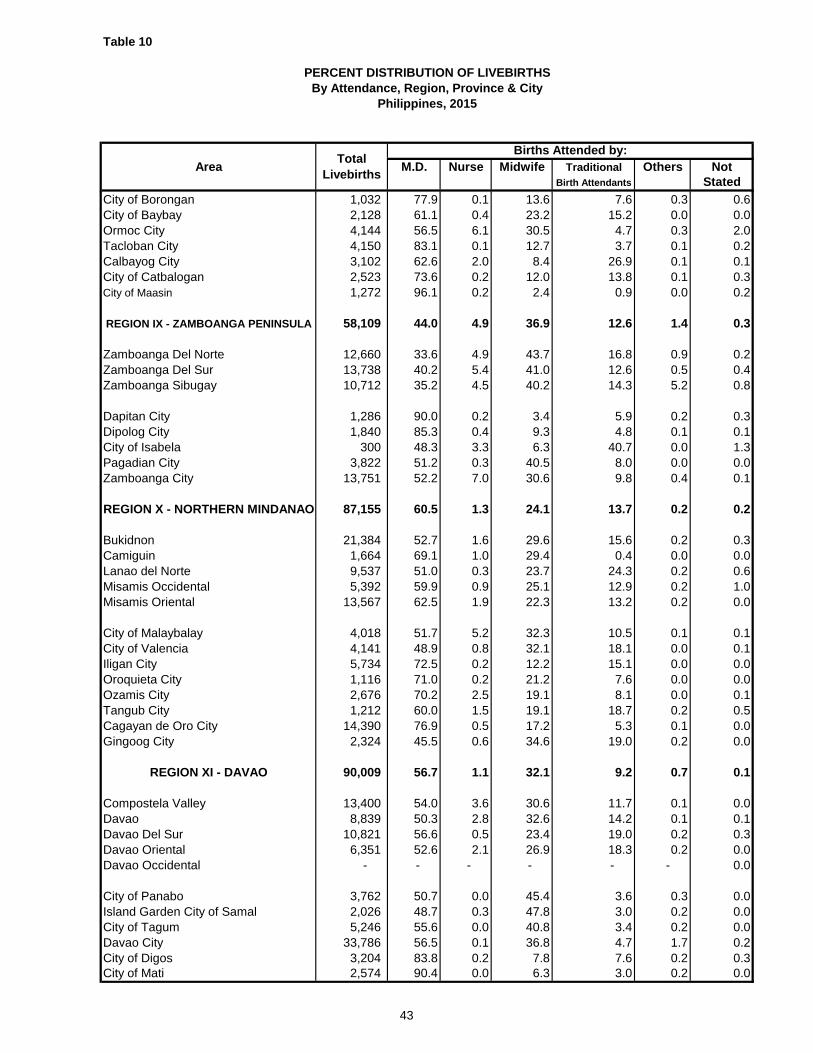
Table 10
Area M.D. Nurse Midwife Traditional Others NotBirth Attendants Stated
Births Attended by:
PERCENT DISTRIBUTION OF LIVEBIRTHSBy Attendance, Region, Province & City
Philippines, 2015
Total Livebirths
City of Borongan 1,032 77.9 0.1 13.6 7.6 0.3 0.6City of Baybay 2,128 61.1 0.4 23.2 15.2 0.0 0.0Ormoc City 4,144 56.5 6.1 30.5 4.7 0.3 2.0Tacloban City 4,150 83.1 0.1 12.7 3.7 0.1 0.2Calbayog City 3,102 62.6 2.0 8.4 26.9 0.1 0.1City of Catbalogan 2,523 73.6 0.2 12.0 13.8 0.1 0.3City of Maasin 1,272 96.1 0.2 2.4 0.9 0.0 0.2
REGION IX - ZAMBOANGA PENINSULA 58,109 44.0 4.9 36.9 12.6 1.4 0.3
Zamboanga Del Norte 12,660 33.6 4.9 43.7 16.8 0.9 0.2Zamboanga Del Sur 13,738 40.2 5.4 41.0 12.6 0.5 0.4Zamboanga Sibugay 10,712 35.2 4.5 40.2 14.3 5.2 0.8
Dapitan City 1,286 90.0 0.2 3.4 5.9 0.2 0.3Dipolog City 1,840 85.3 0.4 9.3 4.8 0.1 0.1City of Isabela 300 48.3 3.3 6.3 40.7 0.0 1.3Pagadian City 3,822 51.2 0.3 40.5 8.0 0.0 0.0Zamboanga City 13,751 52.2 7.0 30.6 9.8 0.4 0.1
REGION X - NORTHERN MINDANAO 87,155 60.5 1.3 24.1 13.7 0.2 0.2
Bukidnon 21,384 52.7 1.6 29.6 15.6 0.2 0.3Camiguin 1,664 69.1 1.0 29.4 0.4 0.0 0.0Lanao del Norte 9,537 51.0 0.3 23.7 24.3 0.2 0.6Misamis Occidental 5,392 59.9 0.9 25.1 12.9 0.2 1.0Misamis Oriental 13,567 62.5 1.9 22.3 13.2 0.2 0.0
City of Malaybalay 4,018 51.7 5.2 32.3 10.5 0.1 0.1City of Valencia 4,141 48.9 0.8 32.1 18.1 0.0 0.1Iligan City 5,734 72.5 0.2 12.2 15.1 0.0 0.0Oroquieta City 1,116 71.0 0.2 21.2 7.6 0.0 0.0Ozamis City 2,676 70.2 2.5 19.1 8.1 0.0 0.1Tangub City 1,212 60.0 1.5 19.1 18.7 0.2 0.5Cagayan de Oro City 14,390 76.9 0.5 17.2 5.3 0.1 0.0Gingoog City 2,324 45.5 0.6 34.6 19.0 0.2 0.0
REGION XI - DAVAO 90,009 56.7 1.1 32.1 9.2 0.7 0.1
Compostela Valley 13,400 54.0 3.6 30.6 11.7 0.1 0.0Davao 8,839 50.3 2.8 32.6 14.2 0.1 0.1Davao Del Sur 10,821 56.6 0.5 23.4 19.0 0.2 0.3Davao Oriental 6,351 52.6 2.1 26.9 18.3 0.2 0.0Davao Occidental - - - - - - 0.0
City of Panabo 3,762 50.7 0.0 45.4 3.6 0.3 0.0Island Garden City of Samal 2,026 48.7 0.3 47.8 3.0 0.2 0.0City of Tagum 5,246 55.6 0.0 40.8 3.4 0.2 0.0Davao City 33,786 56.5 0.1 36.8 4.7 1.7 0.2City of Digos 3,204 83.8 0.2 7.8 7.6 0.2 0.3City of Mati 2,574 90.4 0.0 6.3 3.0 0.2 0.0
43

Table 10
Area M.D. Nurse Midwife Traditional Others NotBirth Attendants Stated
Births Attended by:
PERCENT DISTRIBUTION OF LIVEBIRTHSBy Attendance, Region, Province & City
Philippines, 2015
Total Livebirths
REGION XII - SOCCSKSARGEN 77,479 37.6 3.6 42.1 15.5 1.0 0.2
Cotabato 22,510 33.4 4.6 31.2 28.9 1.8 0.1Saranggani 8,197 18.3 7.1 59.6 14.2 0.7 0.1South Cotabato 11,671 51.5 1.7 32.3 11.6 2.2 0.7Sultan Kudarat 9,633 29.6 2.5 52.9 14.4 0.5 0.1
Cotabato City 2,666 48.7 4.6 26.6 19.8 0.2 0.1City of Kidapawan 3,315 58.9 4.9 32.6 3.3 0.2 0.1General Santos City 14,804 34.7 3.0 57.6 4.6 0.1 0.0City of Koronadal 2,873 67.2 0.2 23.1 7.8 0.1 1.6City of Tacurong 1,810 51.5 0.7 46.6 0.9 0.3 0.0
REGION XIII - CARAGA 42,304 55.8 2.0 30.3 11.4 0.2 0.4
Agusan del Norte 4,649 49.4 0.3 33.6 15.8 0.3 0.6Agusan del Sur 9,336 38.6 1.0 36.0 24.2 0.2 0.0Surigao del Norte 4,885 52.5 7.8 34.0 5.6 0.1 0.0Surigao del Sur 7,835 75.0 0.8 15.0 7.7 0.1 1.3Dinagat Islands 1,386 35.6 1.2 47.8 14.6 0.3 0.5
City of Cabadbaran 1,273 92.1 0.0 7.5 0.3 0.0 0.2Butuan City 5,581 53.1 4.4 41.9 0.5 0.0 0.1City of Bayugan 1,951 25.2 0.6 48.1 26.0 0.0 0.1Surigao City 2,662 58.6 0.3 34.0 6.0 0.9 0.0City of Bislig 1,725 92.6 0.0 5.3 1.7 0.0 0.4City of Tandag 1,021 98.5 0.0 0.4 1.1 0.0 0.0
ARMM 14784 34.4 4.1 24.7 35.9 0.7 0.2
Basilan 153 37.9 0.0 6.5 55.6 0.0 0.0Lanao del Sur 3,535 50.3 6.7 16.4 26.2 0.4 0.1Maguindanao 9,531 21.3 3.5 31.1 42.8 1.0 0.3Sulu 101 84.2 0.0 10.9 5.0 0.0 0.0Tawi-tawi 132 61.4 2.3 15.9 20.5 0.0 0.0
City of Lamitan 102 58.8 0.0 24.5 15.7 1.0 0.0Marawi City 1,230 81.1 2.7 2.7 13.3 0.2 0.2
Foreign Country 140 86.4 1.4 7.9 4.3 0.0 0.0
44
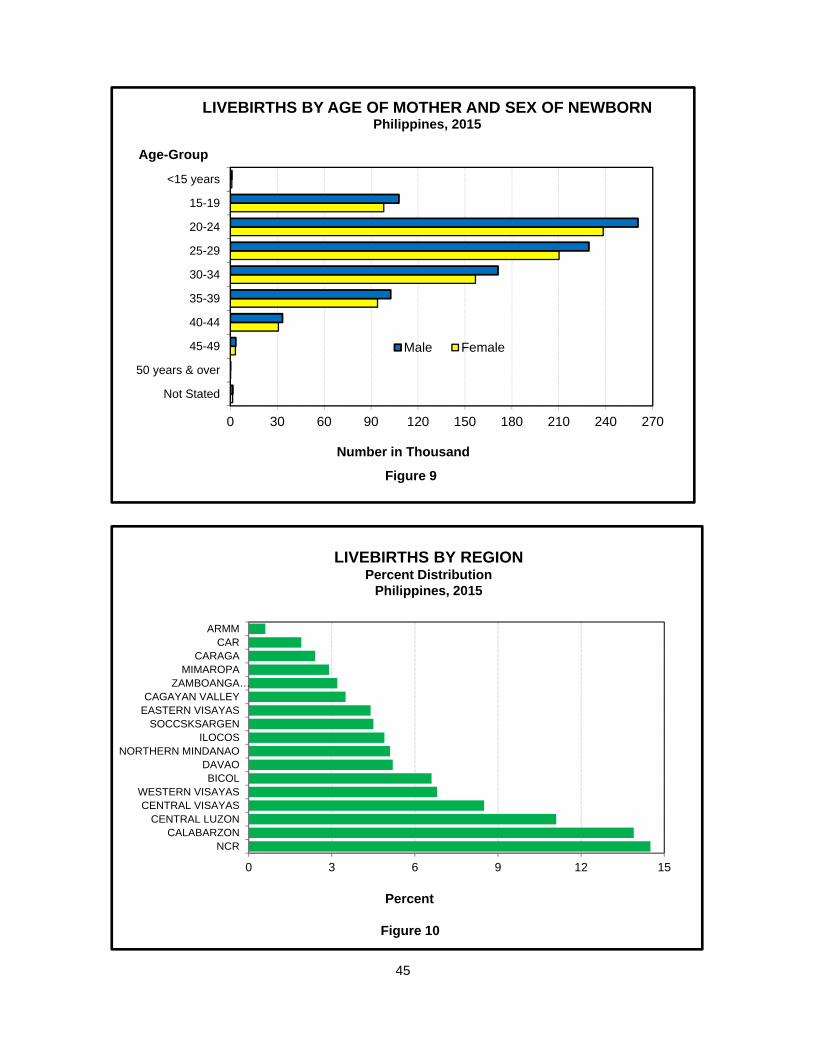
0 30 60 90 120 150 180 210 240 270
Not Stated
50 years & over
45-49
40-44
35-39
30-34
25-29
20-24
15-19
<15 years
Age-Group
LIVEBIRTHS BY AGE OF MOTHER AND SEX OF NEWBORNPhilippines, 2015
Male Female
Number in Thousand
Figure 9
0 3 6 9 12 15
NCRCALABARZON
CENTRAL LUZONCENTRAL VISAYAS
WESTERN VISAYAS BICOL
DAVAONORTHERN MINDANAO
ILOCOSSOCCSKSARGEN
EASTERN VISAYAS CAGAYAN VALLEY
ZAMBOANGA…MIMAROPA
CARAGACAR
ARMM
LIVEBIRTHS BY REGIONPercent Distribution
Philippines, 2015
Figure 10
Percent
45
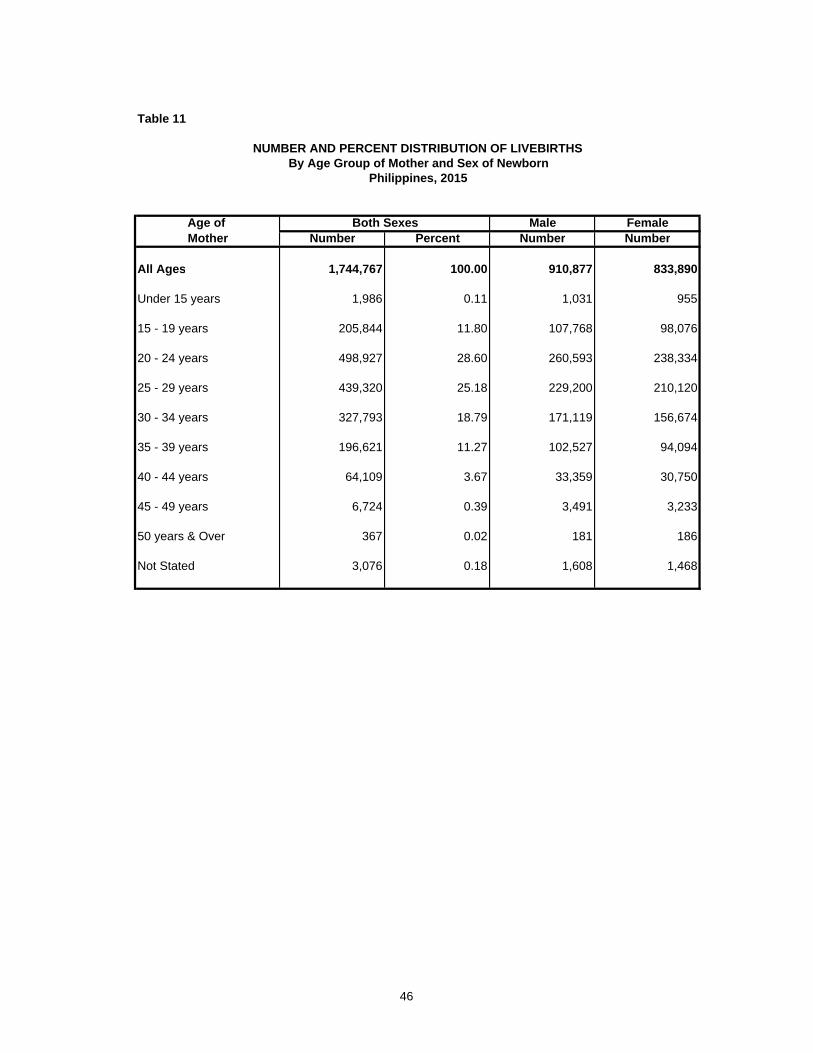
Table 11
Age of Male FemaleMother Number Percent Number Number
All Ages 1,744,767 100.00 910,877 833,890
Under 15 years 1,986 0.11 1,031 955
15 - 19 years 205,844 11.80 107,768 98,076
20 - 24 years 498,927 28.60 260,593 238,334
25 - 29 years 439,320 25.18 229,200 210,120
30 - 34 years 327,793 18.79 171,119 156,674
35 - 39 years 196,621 11.27 102,527 94,094
40 - 44 years 64,109 3.67 33,359 30,750
45 - 49 years 6,724 0.39 3,491 3,233
50 years & Over 367 0.02 181 186
Not Stated 3,076 0.18 1,608 1,468
NUMBER AND PERCENT DISTRIBUTION OF LIVEBIRTHSBy Age Group of Mother and Sex of Newborn
Philippines, 2015
Both Sexes
46
Table 12
Age of Mother Total(In Years) Livebirths 1 2 3 4 5
All Ages 1,744,767 628,351 487,095 294,066 155,106 80,483
Under 15 years 1,986 1,979 6 - - - 15 - 19 years 205,844 172,398 30,933 2,343 80 13 20 - 24 years 498,927 254,089 172,841 57,570 12,061 1,81425 - 29 years 439,320 120,978 149,538 100,216 46,369 16,10730 - 34 years 327,793 53,865 90,023 79,624 51,022 28,19835 - 39 years 196,621 19,119 36,082 43,236 34,372 24,29840 - 44 years 64,109 4,451 6,501 9,733 9,978 8,92845 - 49 years 6,724 668 501 751 777 82450 years & over 367 71 66 48 43 40Not Stated 3,076 733 604 545 404 261
Age of Mother(In Years) 6 7 8 9 10 & Over Not Stated
All Ages 44,582 25,427 13,979 7,639 7,232 807
Under 15 years - - - - - 1 15 - 19 years 3 2 - - - 72 20 - 24 years 265 58 22 6 9 192 25 - 29 years 4,459 1,138 264 54 24 173 30 - 34 years 14,537 6,650 2,514 837 375 148 35 - 39 years 16,927 10,797 6,131 3,226 2330 103 40 - 44 years 7,411 5,968 4,397 3,019 3,678 45 45 - 49 years 775 670 560 443 750 5 50 years & over 26 24 17 12 20 - Not Stated 179 120 74 42 46 68 Note: "-" means 0
Number of Living Children
Number of Living Children
LIVEBIRTHS BY AGE OF MOTHER & NUMBER OF LIVING CHILDRENPhilippines, 2015
47

Table 13
PHILIPPINES 1,744,767 1,986 205,844 498,927 439,320 327,793 196,621 64,109 6,724 367 3,076
NCR 231,766 363 24,836 61,742 61,002 48,809 27,076 7,073 622 48 195
CAR 30,873 33 3,543 8,706 7,971 5,924 3,435 1,064 129 4 64
Ilocos 85,871 104 10,004 24,777 21,307 16,363 9,664 3,209 308 12 123
Cagayan Valley 60,511 78 8,716 18,262 14,471 10,475 6,110 2,067 232 11 89
Central Luzon 196,217 237 24,336 55,642 50,072 36,886 21,744 6,313 723 57 207
Calabarzon 260,339 285 28,327 71,049 66,245 52,710 31,409 9,226 883 54 151
Mimaropa 50,122 48 6,355 14,957 12,207 8,657 5,373 1,941 253 19 312
Bicol 115,210 75 12,423 33,574 28,205 20,521 14,135 5,531 605 25 116
Western Visayas 118,788 99 12,792 33,370 29,751 22,416 14,218 5,364 583 30 165
Central Visayas 148,319 130 15,718 44,026 38,972 27,353 16,062 5,414 491 17 136
Eastern Visayas 76,771 66 9,483 23,242 18,370 13,476 8,546 3,150 305 10 123
Zamboanga Peninsula 58,109 52 7,559 17,629 13,763 10,068 6,327 2,354 247 20 90
Northern Mindanao 87,155 117 11,811 26,244 21,196 14,676 9,179 3,300 362 13 257
Davao 90,009 160 12,908 26,996 22,421 15,370 8,864 2,939 278 11 62
SOCCSKSARGEN 77,479 104 10,861 22,939 19,063 13,437 7,921 2,756 343 19 36
CARAGA 42,304 27 4,885 12,622 10,701 7,485 4,631 1,742 186 5 20
ARMM 14,784 8 1,280 3,133 3,568 3,128 1,894 658 174 12 929
Foreign Country 140 - 7 17 35 39 33 8 - - 1
Note: Table by usual residence
LIVEBIRTHS BY AGE OF MOTHER & REGIONPhilippines, 2015
35-39 40-4415-19 20-24 25-29 30-34AREA
45-49
Age of Mother
50 & over
TotalUnder
15Not
Stated
48

49
MORBIDITY AND NOTIFIABLE DISEASES STATISTICS
The Department of Health (DOH) mandates the reporting of the following diseases preferably within 72 hours of occurrence of the case: AIDS/HIV Infection, Bronchitis, Cholera, Chickenpox, Dengue H-Fever, Diarrheas, Diphtheria, Diseases of the Heart, Filariasis, Viral Hepatitis, Influenza, Leprosy, Malaria, Malignant Neoplasms, Measles, Pneumonias, Poliomyelitis, Schistosomiasis, Syphilis, Gonorrhea, Tetanus Neonatorum, Non-Neonatal Tetanus, Typhoid and Paratyphoid, TB Respiratory, TB Meningitis, TB other forms, Whooping Cough, Hypertension, Rabies, Meningitis, Leptospirosis, Poisoning, Meningococcemia, and other diseases with unusual occurrence.
This mandatory reporting of diseases was by virtue of Republic Act 3573 or
otherwise known as the Law on Reporting of Communicable Diseases. The source of the Morbidity data presented in this report is the 2015 Field Health Service Information System (FHSIS) Annual Report. The FHSIS data were based on the weekly notifiable disease reports from Barangay Health Stations (BHSs) and Rural Health Units (RHUs). These were consolidated at the provincial/city and regional levels and then submitted to the Epidemiology Bureau (EB) for the national morbidity report. The Morbidity statistics is then published as one of the components of the FHSIS Annual Report. The PHS presents summary tables of morbidity statistics. Morbidity rates for each morbid condition were computed per 100,000 of the national and regional population. The population used was the 2015 Census of Population from the Philippine Statistics Authority (PSA). The 2015 PHS presented the ten (10) leading causes of morbidity. The top five diseases reported were Acute Respiratory Infection with a total of 2,115,018 cases or a rate of 2,094.5 per 100,000 population. This is a 46.3% and 44.7% increase in number and rate respectively, from the 2014 rate of 1,447.1 per 100,000 population with 1,445,320 cases. However, the 2013 number of cases and rate were still higher as compared to 2015 number of cases and rate. Hypertension is second on the list with 601,173 cases and a rate 595.3 per 100,000 population. It is followed by Acute Lower Respiratory Tract Infection (ALRTI) and Pneumonia (474,406, ; 469.8), Urinary Tract Infection (298,200; 295.3) and Bronchitis (202,343; 200.4). The same top five diseases were recorded last year, however, Hypertension interchanged ranks with ALRTI with 26% increase in cases. Table 15 shows the ten leading causes of morbidity separately for male and female. The same morbid conditions have been identified for both sexes, which only differ in rates and consequently a slight difference in ranks. Infectious conditions are most common to both sexes.

50
Respiratory conditions like ARI, ALRTI and Pneumonia, Bronchitis and Tuberculosis were common to both sexes. However, in terms of the rate of occurrence, females tend to be more ill with these conditions than males except for respiratory TB. In summary, eight out of the ten leading causes of morbidity common to both sexes have higher rates in female than in male.
The 2015 report on notifiable diseases showed a large variation in morbidity rates
by type of morbid conditions across regions except for Central Visayas and ARMM which had no report by the time this publication was developed. Nevertheless, the nationwide top leading causes of morbidity were consistent with the reported leading causes of morbidity per region, except for at least five regions which included Diseases of the heart and Chickenpox in the list of top ten causes of morbidity. (Table 16)
Table 18 and Figure 13 show disease trends as to the number of cases and deaths
from 1995 to 2015. Dengue showed the highest increase in both number of cases and number of deaths, as compared to 2014. It is 2.5 times higher as compared with 2014 cases. It records a 247% increase from 3.8 cases per 100,000 population in 2014 to 13.2 per 100,000 population in 2015.
Other diseases which recorded an increase both in numbers of cases and deaths
were Diarrheas, Leprosy, Tetanus and Filariasis. Further, Malaria cases also increased and was recorded to be 25 times higher than last year, but, the number of deaths decreased from 22 in 2014 to 19 in 2015. While Schistosomiasis, Typhoid and paratyphoid fevers, Viral hepatitis and Whooping cough recorded an increase in number of deaths but not in number of cases. The reasons for the recorded increase and decrease should be subjected for study or program evaluation.
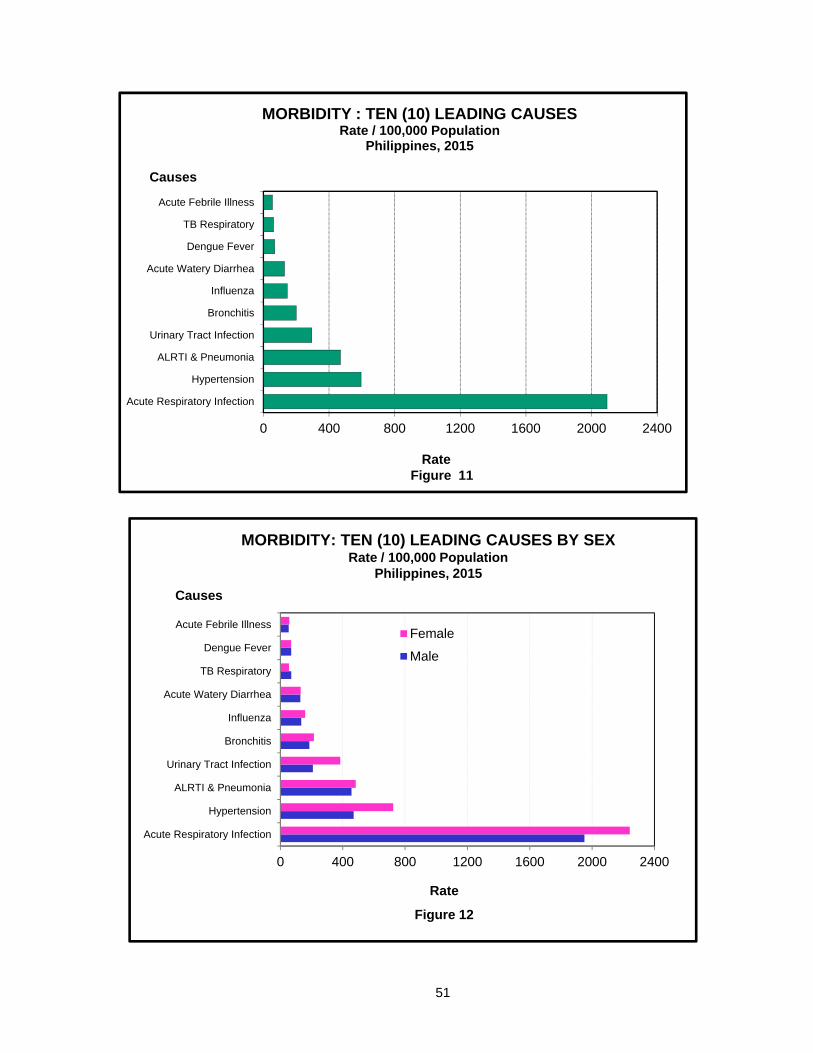
0 400 800 1200 1600 2000 2400
Acute Respiratory Infection
Hypertension
ALRTI & Pneumonia
Urinary Tract Infection
Bronchitis
Influenza
Acute Watery Diarrhea
Dengue Fever
TB Respiratory
Acute Febrile Illness
Causes
MORBIDITY : TEN (10) LEADING CAUSESRate / 100,000 Population
Philippines, 2015
Figure 11Rate
0 400 800 1200 1600 2000 2400
Acute Respiratory Infection
Hypertension
ALRTI & Pneumonia
Urinary Tract Infection
Bronchitis
Influenza
Acute Watery Diarrhea
TB Respiratory
Dengue Fever
Acute Febrile IllnessFemale
Male
MORBIDITY: TEN (10) LEADING CAUSES BY SEXRate / 100,000 Population
Philippines, 2015
Causes
Figure 12
Rate
51
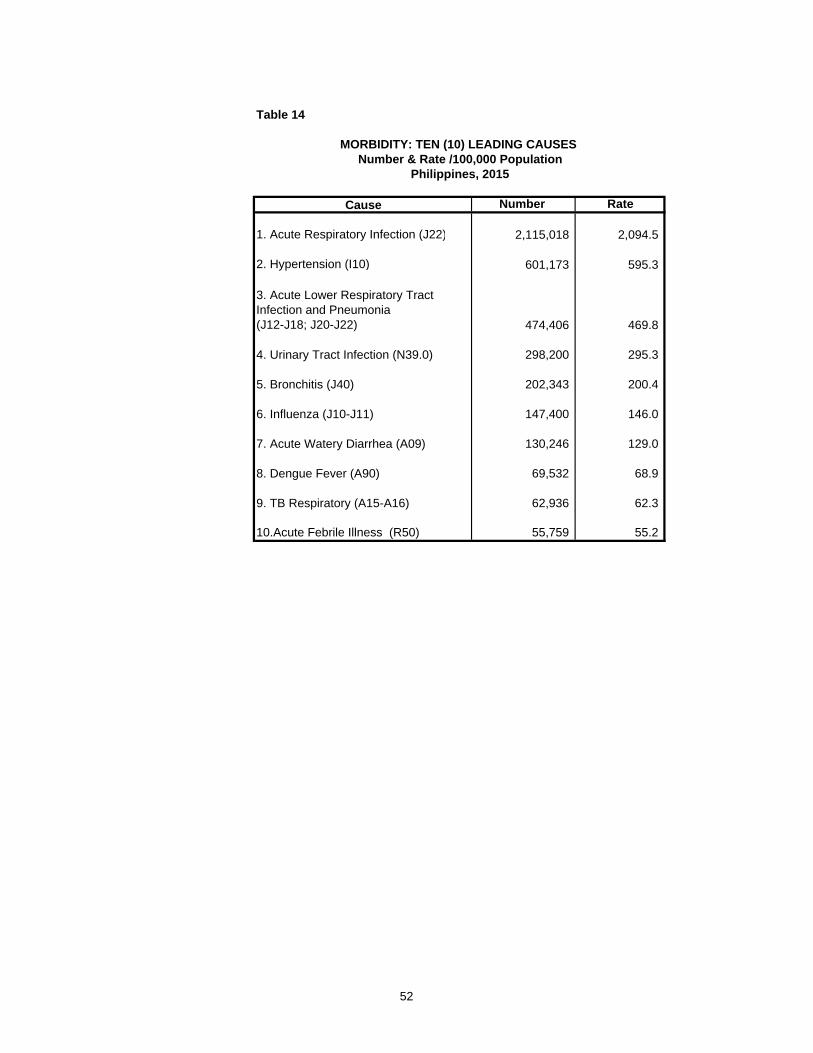
Table 14
Cause Number Rate
1. Acute Respiratory Infection (J22) 2,115,018 2,094.5
2. Hypertension (I10) 601,173 595.3
3. Acute Lower Respiratory Tract Infection and Pneumonia (J12-J18; J20-J22) 474,406 469.8
4. Urinary Tract Infection (N39.0) 298,200 295.3
5. Bronchitis (J40) 202,343 200.4
6. Influenza (J10-J11) 147,400 146.0
7. Acute Watery Diarrhea (A09) 130,246 129.0
8. Dengue Fever (A90) 69,532 68.9
9. TB Respiratory (A15-A16) 62,936 62.3
10.Acute Febrile Illness (R50) 55,759 55.2
MORBIDITY: TEN (10) LEADING CAUSES Number & Rate /100,000 Population
Philippines, 2015
52

Table 15
Number* Rate
1. Acute Respiratory Infection 996,291 1,950.8
2. Hypertension 240,008 470.0
3. Acute Lower Respiratory Tract Infection and Pneumonia
233,049 456.3
4. Urinary Tract Infection 106,550 208.6
5. Bronchitis 94,881 185.8
6. Influenza 68,112 133.4
7. Acute Watery Diarrhea 65,331 127.9
8. TB Respiratory 35,515 69.5
9. Dengue Fever 35,330 69.2
10. Acute Febrille Illness 27,225 53.3
Number* Rate
1. Acute Respiratory Infection 1,118,727 2,241.5
2. Hypertension 361,165 723.6
3. Acute Lower Respiratory Tract Infection and Pneumonia
241,357 483.6
4. Urinary Tract Infection 191,650 384.0
5. Bronchitis 107,462 215.3
6. Influenza 79,288 158.9
7. Acute Watery Diarrhea 64,915 130.1
8. Dengue Fever 34,202 68.5
9. Acute Febrile Illness 28,534 57.2
10. TB Respiratory 27,421 54.9
* Based on total number of reported cases with sex disaggregation only.
MORBIDITY: TEN (10) LEADING CAUSES BY SEXNumber & Rate /100,000 Population
Philippines, 2015
CauseFemale
CauseMale
53

Table 16
Number Rate1 Acute Watery Diarrhea 1,797 14.0 2 Acute Hemorrhagic Fever 272 2.1 3 Measles 127 1.0 4 Acute Bloody Diarrhea 25 0.2 5 Acute Febrile Illness 14 0.1 6 Typhoid Fever 8 0.1 7 Viral Hepatitis 8 0.1 8 Leptospirosis 5 0.0 9 Leprosy 3 0.0
10 Cholera 1 0.0
Number Rate1 Hypertension 76,490 4,441.9 2 Urinary Tract Infection 43,696 2,537.5 3 Acute Watery Diarrhea 39,090 2,270.0 4 Bronchitis 38,994 2,264.5 5 Acute Febrile Illness 15,042 873.5 6 ALRTI and Pneumonia 14,647 850.6 7 Influenza 13,300 772.4 8 Acute Respiratory Infection 7,992 464.1 9 Chickenpox 1,918 111.4
10 TB Other Forms 1,106 64.2
Number Rate1 Acute Respiratory Infection 536,402 10,672.32 Hypertension 135,216 2690.33 Urinary Tract Infection 45,322 901.74 Dengue Fever 34,526 686.95 Bronchitis 32,892 654.46 Influenza 24,752 492.57 Acute Watery Diarrhea 22,147 440.68 Diseases of the Heart 11,836 235.59 TB Respiratory 10,642 211.7
10 ALRTI and Pneumonia 10,296 204.8* population of respective region
Causes
Causes
CAR
Ilocos
REGIONAL MORBIDITY: TEN (10) LEADING CAUSESNumber & Rate/100,000 Population*
Philippines, 2015
CausesNational Capital Region
54
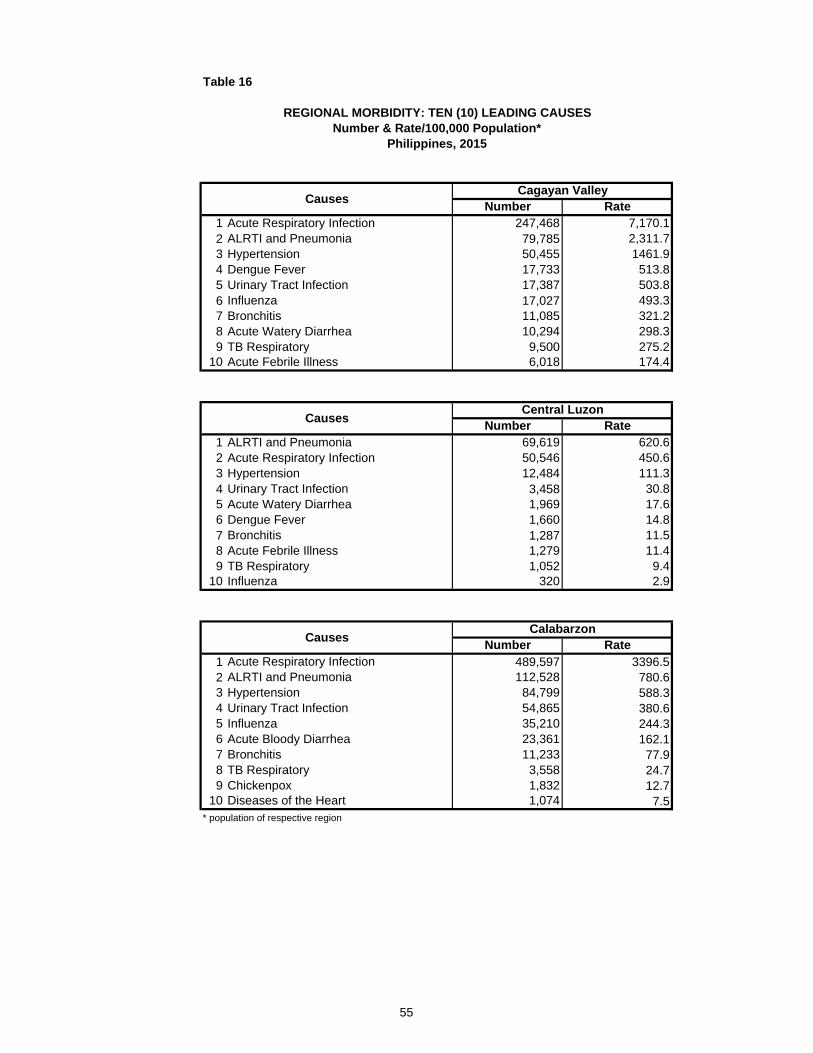
Number Rate1 Acute Respiratory Infection 247,468 7,170.12 ALRTI and Pneumonia 79,785 2,311.73 Hypertension 50,455 1461.94 Dengue Fever 17,733 513.85 Urinary Tract Infection 17,387 503.86 Influenza 17,027 493.37 Bronchitis 11,085 321.28 Acute Watery Diarrhea 10,294 298.39 TB Respiratory 9,500 275.2
10 Acute Febrile Illness 6,018 174.4
Number Rate1 ALRTI and Pneumonia 69,619 620.62 Acute Respiratory Infection 50,546 450.63 Hypertension 12,484 111.34 Urinary Tract Infection 3,458 30.85 Acute Watery Diarrhea 1,969 17.66 Dengue Fever 1,660 14.87 Bronchitis 1,287 11.58 Acute Febrile Illness 1,279 11.49 TB Respiratory 1,052 9.4
10 Influenza 320 2.9
Number Rate1 Acute Respiratory Infection 489,597 3396.52 ALRTI and Pneumonia 112,528 780.63 Hypertension 84,799 588.34 Urinary Tract Infection 54,865 380.65 Influenza 35,210 244.36 Acute Bloody Diarrhea 23,361 162.17 Bronchitis 11,233 77.98 TB Respiratory 3,558 24.79 Chickenpox 1,832 12.7
10 Diseases of the Heart 1,074 7.5* population of respective region
Table 16
REGIONAL MORBIDITY: TEN (10) LEADING CAUSESNumber & Rate/100,000 Population*
Philippines, 2015
Cagayan ValleyCauses
Central Luzon
Calabarzon
Causes
Causes
55

Number Rate1 Acute Respiratory Infection 116,784 3,940.92 Hypertension 18,898 637.73 Urinary Tract Infection 14,019 473.14 Acute Bloody Diarrhea 10,392 350.75 ALRTI and Pneumonia 8,148 275.06 Malaria 4,942 166.87 Influenza 4,701 158.68 Bronchitis 2,862 96.69 TB Respiratory 1,784 60.2
10 TB Other Forms 777 26.2
Number Rate1 Acute Respiratory Infection 81,447 1,405.0 2 Hypertension 26,174 451.5 3 Urinary Tract Infection 11,488 198.2 4 Influenza 9,813 169.3 5 ALRTI and Pneumonia 8,992 155.1 6 Bronchitis 5,939 102.4 7 TB Other Forms 4,166 71.9 8 TB Respiratory 1,290 22.3 9 Acute Watery Diarrhea 822 14.2
10 Diseases of the Heart 425 7.3
Number Rate1 ALRTI and Pneumonia 43,042 571.1 2 Hypertension 25,136 333.5 3 Acute Respiratory Infection 23,751 315.2 4 Bronchitis 18,752 248.8 5 Urinary Tract Infection 16,656 221.0 6 TB Respiratory 12,607 167.3 7 Influenza 7,342 97.4 8 Acute Watery Diarrhea 5,681 75.4 9 Chickenpox 1,551 20.6
10 Acute Hemorrhagic Fever 1,329 17.6 * population of respective region
Table 16
MimaropaCauses
REGIONAL MORBIDITY: TEN (10) LEADING CAUSESNumber & Rate/100,000 Population*
Philippines, 2015
Bicol
Western Visayas
Causes
Causes
56

Number Rate1 - 2 - 3 - 4 NO DATA - 5 - 6 - 7 - 8 - 9 -
10 -
Number Rate1 Acute Respiratory Infection 198,056 4,460.6 2 Hypertension 42,978 967.9 3 ALRTI and Pneumonia 41,609 937.1 4 Bronchitis 40,372 909.2 5 Urinary Tract Infection 19,121 430.6 6 Diseases of the Heart 15,373 346.2 7 Acute Watery Diarrhea 15,239 343.2 8 Acute Febrile Illness 12,950 291.7 9 Influenza 6,201 139.7
10 TB Respiratory 4,698 105.8
Number Rate1 Acute Respiratory Infection 125,230 3,450.1 2 Hypertension 26,538 731.1 3 Urinary Tract Infection 10,481 288.8 4 ALRTI and Pneumonia 7,103 195.7 5 Influenza 6,280 173.0 6 Bronchitis 5,462 150.5 7 TB Respiratory 3,276 90.3 8 Typhoid Fever 1,366 37.6 9 Dengue Fever 1,212 33.4
10 Acute Watery Diarrhea 1,089 30.0 * population of respective region
Causes
Causes
REGIONAL MORBIDITY: TEN (10) LEADING CAUSESNumber & Rate/100,000 Population*
Philippines, 2015
Table 16
Eastern Visayas
Zamboanga Peninsula
Central Visayas
Causes
57

Number Rate1 Acute Respiratory Infection 160,708 3,427.12 Hypertension 53,201 1134.53 ALRTI and Pneumonia 30,695 654.64 Urinary Tract Infection 26,197 558.75 Influenza 14,039 299.46 Bronchitis 11,304 241.17 Acute Watery Diarrhea 2,818 60.18 TB Respiratory 2,361 50.39 Chickenpox 1,635 34.9
10 TB Other Forms 914 19.5
Number Rate1 ALRTI and Pneumonia 26,457 540.7 2 Acute Respiratory Infection 14,793 302.3 3 Hypertension 12,108 247.4 4 Diseases of the Heart 5,367 109.7 5 Acute Hemorrhagic Fever 5,142 105.1 6 TB Respiratory 3,265 66.7 7 Influenza 2,734 55.9 8 Dengue Fever 1,635 33.4 9 Whooping Cough 524 10.7
10 Chickenpox 510 10.4
Number Rate1 Acute Respiratory Infection 48,710 1,071.7 2 Hypertension 38,663 850.6 3 ALRTI and Pneumonia 35,227 775.0 4 Urinary Tract Infection 23,229 511.1 5 Acute Watery Diarrhea 22,019 484.4 6 Acute Febrile Illness 20,407 449.0 7 Bronchitis 18,088 398.0 8 Dengue Fever 9,884 217.5 9 TB Respiratory 9,101 200.2
10 Typhoid Fever 4,054 89.2 * population of respective region
Table 16
REGIONAL MORBIDITY: TEN (10) LEADING CAUSESNumber & Rate/100,000 Population*
Philippines, 2015
CausesNorthern Mindanao
CausesDavao
CausesSOCCSKSARGEN
58
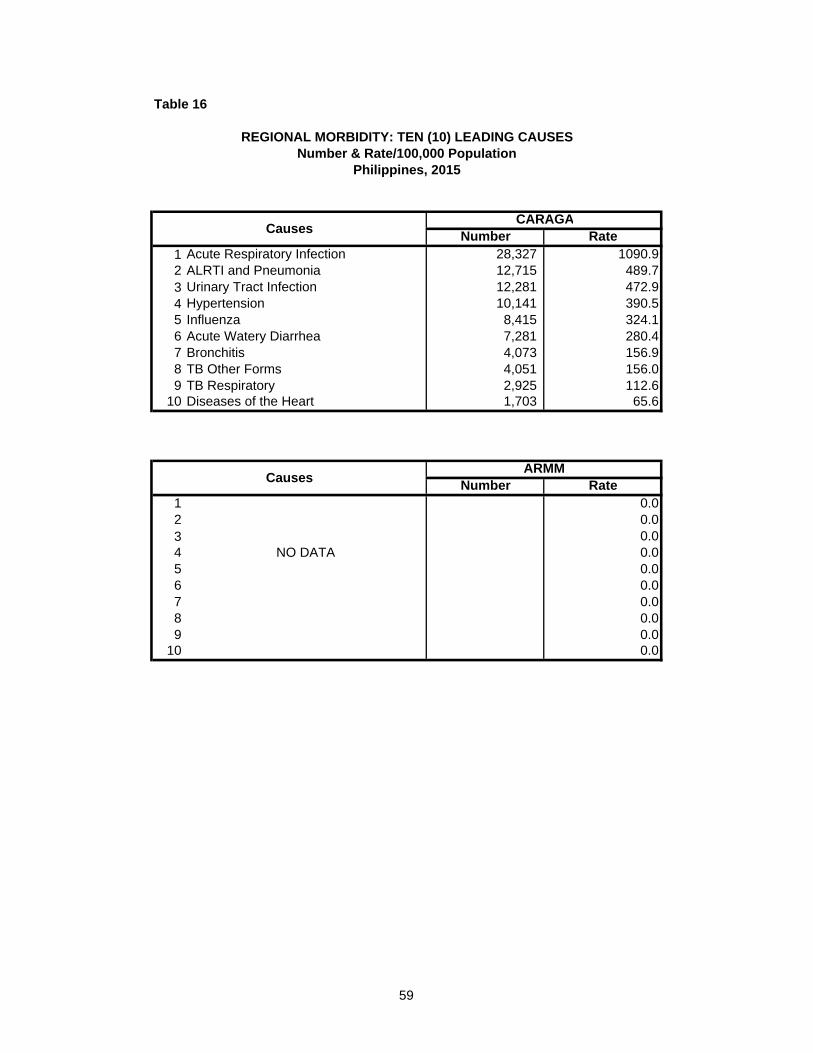
Number Rate1 Acute Respiratory Infection 28,327 1090.92 ALRTI and Pneumonia 12,715 489.73 Urinary Tract Infection 12,281 472.94 Hypertension 10,141 390.55 Influenza 8,415 324.16 Acute Watery Diarrhea 7,281 280.47 Bronchitis 4,073 156.98 TB Other Forms 4,051 156.09 TB Respiratory 2,925 112.6
10 Diseases of the Heart 1,703 65.6
Number Rate1 0.02 0.03 0.04 NO DATA 0.05 0.06 0.07 0.08 0.09 0.0
10 0.0
Table 16
REGIONAL MORBIDITY: TEN (10) LEADING CAUSESNumber & Rate/100,000 Population
Philippines, 2015
CausesCARAGA
CausesARMM
59

Table 17
NOTIFIABLE DISEASES BY REGION Number and Rate/100,000 Population
Philippines, 2015
Number Rate Number Rate Number Rate Number Rate
Philippines 130,246 129.0 36,255 35.9 86 0.1 11,369 11.3
NCR 1,797 14.0 25 0.2 1 0.0 29 0.2
CAR 39,090 2,270.0 474 27.5 - 0.0 214 12.4
Ilocos 22,147 440.6 71 1.4 - 0.0 2,550 50.7
Cagayan Valley 10,294 298.3 341 9.9 5 0.1 1,312 38.0
Central Luzon 1,969 17.6 65 0.6 1 0.0 35 0.3
Calabarzon - 0.0 23,361 162.1 7 0.0 97 0.7
Mimaropa - 0.0 10,392 350.7 - 0.0 58 2.0
Bicol 822 14.2 48 0.8 2 0.0 93 1.6
Western Visayas 5,681 75.4 104 1.4 - 0.0 551 7.3
Central Visayas - 0.0 - 0.0 - 0.0 - 0.0
Eastern Visayas 15,239 343.2 604 13.6 - 0.0 407 9.2
Zamboanga Peninsula 1,089 30.0 13 0.4 - 0.0 1,366 37.6
Northern Mindanao 2,818 60.1 - 0.0 - 0.0 323 6.9
Davao - 0.0 212 4.3 - 0.0 193 3.9
SOCCSKSARGEN 22,019 484.4 545 12.0 70 1.5 4,054 89.2
ARMM - 0.0 - 0.0 - 0.0 - 0.0
CARAGA 7,281 280.4 - 0.0 - 0.0 87 3.4
Cholera (A00)Area
Acute Watery Diarrhea
Acute Bloody Diarrhea
Typhoid and Paratyphoid Fever
(A01)
60

Table 17
NOTIFIABLE DISEASES BY REGION Number and Rate/100,000 Population
Philippines, 2015
Philippines
NCR
CAR
Ilocos
Cagayan Valley
Central Luzon
Calabarzon
Mimaropa
Bicol
Western Visayas
Central Visayas
Eastern Visayas
Zamboanga Peninsula
Northern Mindanao
Davao
SOCCSKSARGEN
ARMM
CARAGA
Area
Number Rate Number Rate Number Rate* Number Rate
398 0.4 225 0.2 34 0.0 404 0.4
5 0.0 3 0.0 - 0.0 - 0.0
- 0.0 4 0.2 - 0.0 - 0.0
144 2.9 - 0.0 - 0.0 77 1.5
24 0.7 3 0.1 5 0.1 15 0.4
50 0.4 1 0.0 - 0.0 4 0.0
- 0.0 7 0.0 - 0.0 4 0.0
- 0.0 13 0.4 - 0.0 - 0.0
- 0.0 - 0.0 - 0.0 2 0.0
19 0.3 8 0.1 - 0.0 3 0.0
- 0.0 - 0.0 - 0.0 - 0.0
99 2.2 152 3.4 - 0.0 - 0.0
- 0.0 12 0.3 - 0.0 - 0.0
- 0.0 19 0.4 - 0.0 165 3.5
47 1.0 1 0.0 10 0.1 47 1.0
7 0.2 - 0.0 19 0.2 87 1.9
- 0.0 - 0.0 - 0.0 - 0.0
3 0.1 2 0.1 - 0.0 - 0.0
* per 1000 livebirth
Leprosy (A30)
Neonatal Tetanus (A33)
Leptospirosis (A27)
Non-Neonatal Tetanus
(A35)
61

Table 17
NOTIFIABLE DISEASES BY REGION Number and Rate/100,000 Population
Philippines, 2015
Philippines
NCR
CAR
Ilocos
Cagayan Valley
Central Luzon
Calabarzon
Mimaropa
Bicol
Western Visayas
Central Visayas
Eastern Visayas
Zamboanga Peninsula
Northern Mindanao
Davao
SOCCSKSARGEN
ARMM
CARAGA
Area
Number Rate Number Rate Number Rate Number Rate
1 0.0 688 0.7 11 0.0 176 0.2
- 0.0 4 0.0 - 0.0 1 0.0
- 0.0 - 0.0 - 0.0 8 0.5
- 0.0 - 0.0 2 0.0 25 0.5
- 0.0 - 0.0 - 0.0 10 0.3
1 0.0 - 0.0 1 0.0 16 0.1
- 0.0 28 0.2 - 0.0 53 0.4
- 0.0 3 0.1 - 0.0 - 0.0
- 0.0 - 0.0 - 0.0 - 0.0
- 0.0 - 0.0 - 0.0 1 0.0
- 0.0 - 0.0 - 0.0 - 0.0
- 0.0 9 0.2 - 0.0 6 0.1
- 0.0 - 0.0 - 0.0 - 0.0
- 0.0 - 0.0 - 0.0 5 0.1
- 0.0 524 10.7 8 0.2 16 0.3
- 0.0 120 2.6 - 0.0 24 0.5
- 0.0 - 0.0 - 0.0 - 0.0
- 0.0 - 0.0 - 0.0 11 0.4
Meningococcal Infection
(A39)
Rabies (Human) (A82)
Whooping Cough (A37)
Diphtheria (A36)
62
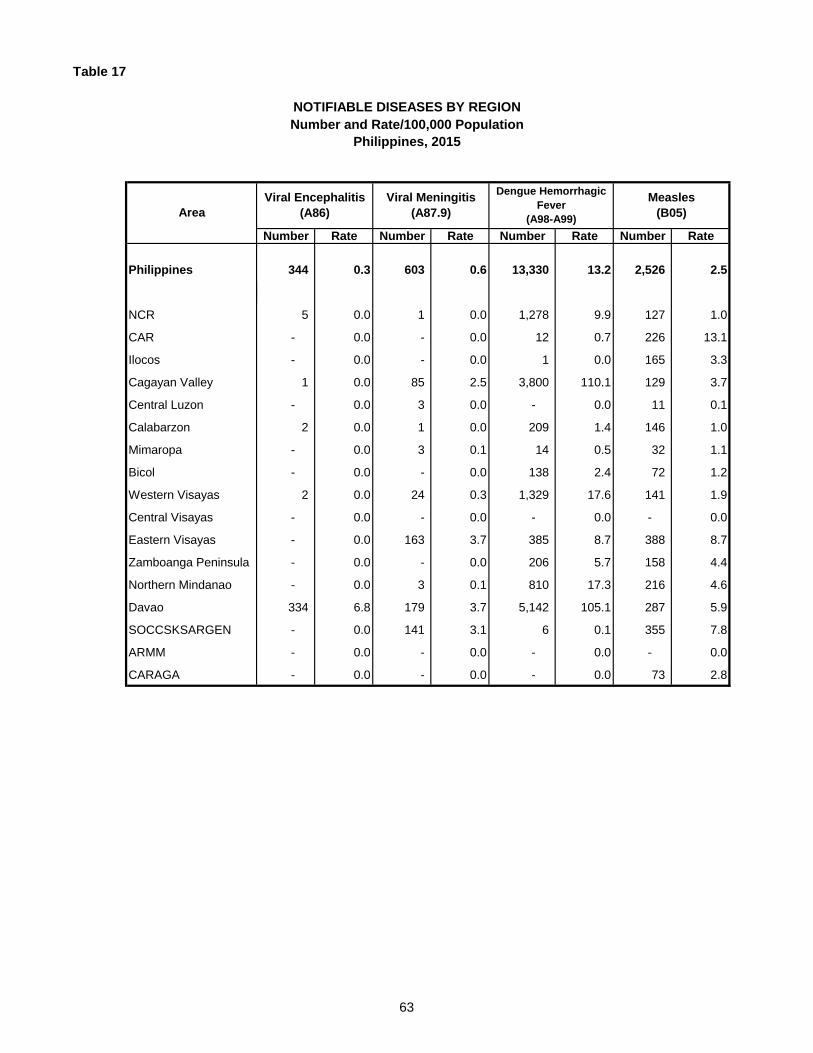
Table 17
NOTIFIABLE DISEASES BY REGION Number and Rate/100,000 Population
Philippines, 2015
Philippines
NCR
CAR
Ilocos
Cagayan Valley
Central Luzon
Calabarzon
Mimaropa
Bicol
Western Visayas
Central Visayas
Eastern Visayas
Zamboanga Peninsula
Northern Mindanao
Davao
SOCCSKSARGEN
ARMM
CARAGA
Area
Number Rate Number Rate Number Rate Number Rate
344 0.3 603 0.6 13,330 13.2 2,526 2.5
5 0.0 1 0.0 1,278 9.9 127 1.0
- 0.0 - 0.0 12 0.7 226 13.1
- 0.0 - 0.0 1 0.0 165 3.3
1 0.0 85 2.5 3,800 110.1 129 3.7
- 0.0 3 0.0 - 0.0 11 0.1
2 0.0 1 0.0 209 1.4 146 1.0
- 0.0 3 0.1 14 0.5 32 1.1
- 0.0 - 0.0 138 2.4 72 1.2
2 0.0 24 0.3 1,329 17.6 141 1.9
- 0.0 - 0.0 - 0.0 - 0.0
- 0.0 163 3.7 385 8.7 388 8.7
- 0.0 - 0.0 206 5.7 158 4.4
- 0.0 3 0.1 810 17.3 216 4.6
334 6.8 179 3.7 5,142 105.1 287 5.9
- 0.0 141 3.1 6 0.1 355 7.8
- 0.0 - 0.0 - 0.0 - 0.0
- 0.0 - 0.0 - 0.0 73 2.8
Measles (B05)
Viral Encephalitis (A86)
Viral Meningitis (A87.9)
Dengue Hemorrhagic Fever
(A98-A99)
63
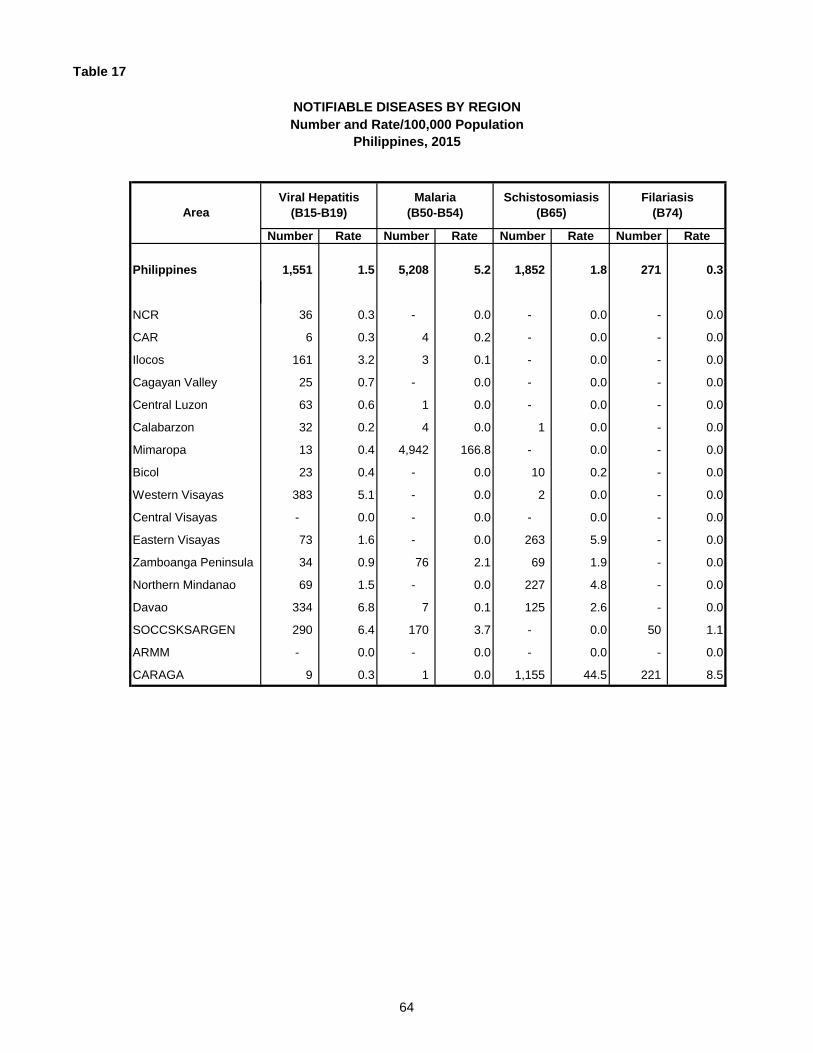
Table 17
NOTIFIABLE DISEASES BY REGION Number and Rate/100,000 Population
Philippines, 2015
Philippines
NCR
CAR
Ilocos
Cagayan Valley
Central Luzon
Calabarzon
Mimaropa
Bicol
Western Visayas
Central Visayas
Eastern Visayas
Zamboanga Peninsula
Northern Mindanao
Davao
SOCCSKSARGEN
ARMM
CARAGA
Area
Number Rate Number Rate Number Rate Number Rate
1,551 1.5 5,208 5.2 1,852 1.8 271 0.3
36 0.3 - 0.0 - 0.0 - 0.0
6 0.3 4 0.2 - 0.0 - 0.0
161 3.2 3 0.1 - 0.0 - 0.0
25 0.7 - 0.0 - 0.0 - 0.0
63 0.6 1 0.0 - 0.0 - 0.0
32 0.2 4 0.0 1 0.0 - 0.0
13 0.4 4,942 166.8 - 0.0 - 0.0
23 0.4 - 0.0 10 0.2 - 0.0
383 5.1 - 0.0 2 0.0 - 0.0
- 0.0 - 0.0 - 0.0 - 0.0
73 1.6 - 0.0 263 5.9 - 0.0
34 0.9 76 2.1 69 1.9 - 0.0
69 1.5 - 0.0 227 4.8 - 0.0
334 6.8 7 0.1 125 2.6 - 0.0
290 6.4 170 3.7 - 0.0 50 1.1
- 0.0 - 0.0 - 0.0 - 0.0
9 0.3 1 0.0 1,155 44.5 221 8.5
Viral Hepatitis (B15-B19)
Malaria (B50-B54)
Schistosomiasis (B65)
Filariasis (B74)
64
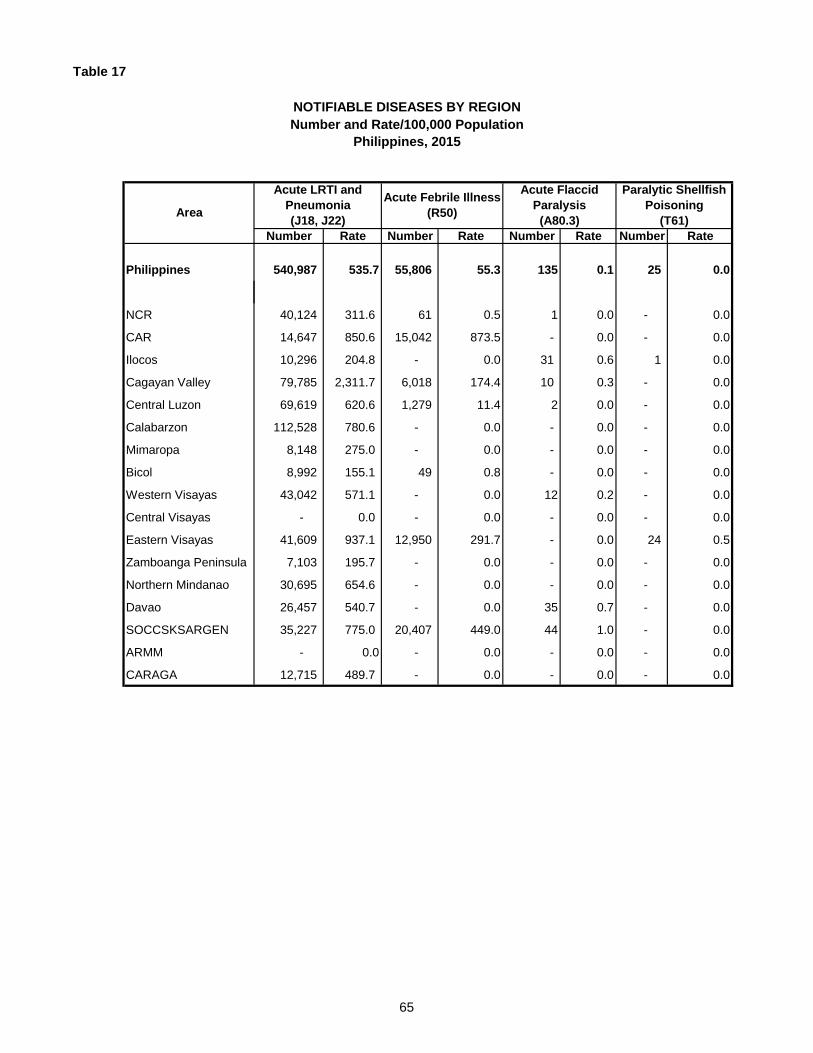
Table 17
NOTIFIABLE DISEASES BY REGION Number and Rate/100,000 Population
Philippines, 2015
Philippines
NCR
CAR
Ilocos
Cagayan Valley
Central Luzon
Calabarzon
Mimaropa
Bicol
Western Visayas
Central Visayas
Eastern Visayas
Zamboanga Peninsula
Northern Mindanao
Davao
SOCCSKSARGEN
ARMM
CARAGA
Area
Number Rate Number Rate Number Rate Number Rate
540,987 535.7 55,806 55.3 135 0.1 25 0.0
40,124 311.6 61 0.5 1 0.0 - 0.0
14,647 850.6 15,042 873.5 - 0.0 - 0.0
10,296 204.8 - 0.0 31 0.6 1 0.0
79,785 2,311.7 6,018 174.4 10 0.3 - 0.0
69,619 620.6 1,279 11.4 2 0.0 - 0.0
112,528 780.6 - 0.0 - 0.0 - 0.0
8,148 275.0 - 0.0 - 0.0 - 0.0
8,992 155.1 49 0.8 - 0.0 - 0.0
43,042 571.1 - 0.0 12 0.2 - 0.0
- 0.0 - 0.0 - 0.0 - 0.0
41,609 937.1 12,950 291.7 - 0.0 24 0.5
7,103 195.7 - 0.0 - 0.0 - 0.0
30,695 654.6 - 0.0 - 0.0 - 0.0
26,457 540.7 - 0.0 35 0.7 - 0.0
35,227 775.0 20,407 449.0 44 1.0 - 0.0
- 0.0 - 0.0 - 0.0 - 0.0
12,715 489.7 - 0.0 - 0.0 - 0.0
Paralytic Shellfish Poisoning
(T61)
Acute LRTI and Pneumonia (J18, J22)
Acute Flaccid Paralysis (A80.3)
Acute Febrile Illness (R50)
65
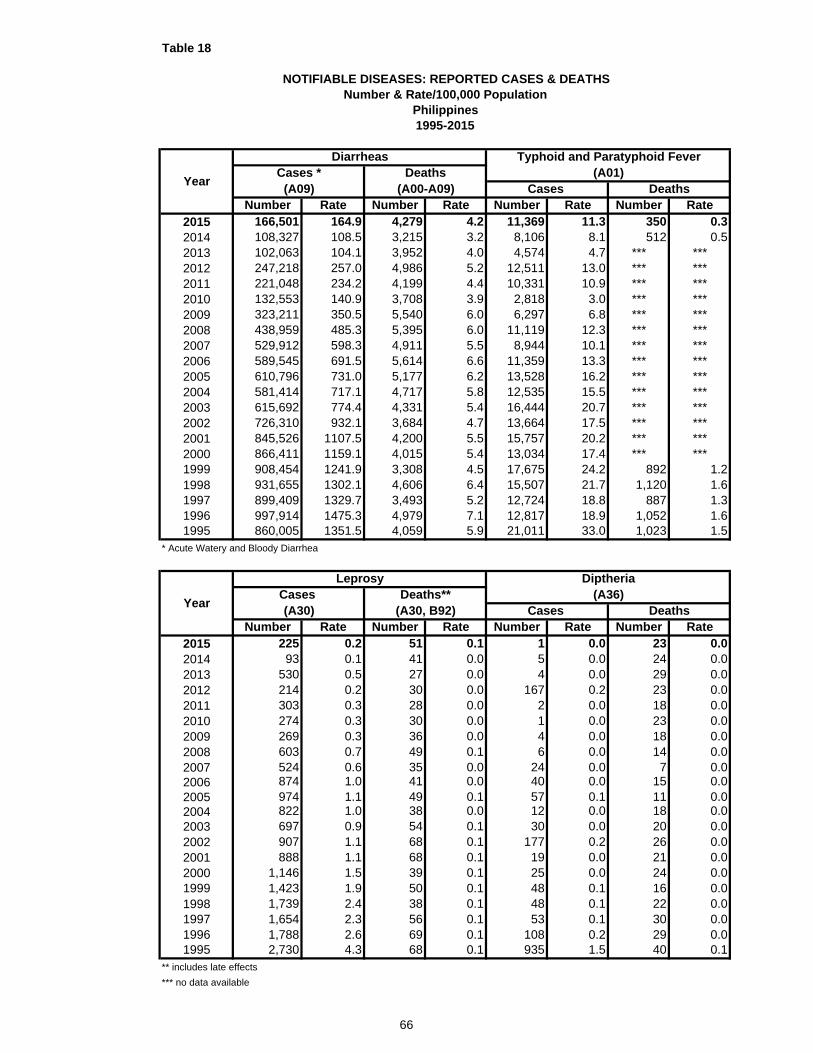
Table 18
Number Rate Number Rate Number Rate Number Rate2015 166,501 164.9 4,279 4.2 11,369 11.3 350 0.32014 108,327 108.5 3,215 3.2 8,106 8.1 512 0.52013 102,063 104.1 3,952 4.0 4,574 4.7 *** ***2012 247,218 257.0 4,986 5.2 12,511 13.0 *** ***2011 221,048 234.2 4,199 4.4 10,331 10.9 *** ***2010 132,553 140.9 3,708 3.9 2,818 3.0 *** ***2009 323,211 350.5 5,540 6.0 6,297 6.8 *** ***2008 438,959 485.3 5,395 6.0 11,119 12.3 *** ***2007 529,912 598.3 4,911 5.5 8,944 10.1 *** ***2006 589,545 691.5 5,614 6.6 11,359 13.3 *** ***2005 610,796 731.0 5,177 6.2 13,528 16.2 *** ***2004 581,414 717.1 4,717 5.8 12,535 15.5 *** ***2003 615,692 774.4 4,331 5.4 16,444 20.7 *** ***2002 726,310 932.1 3,684 4.7 13,664 17.5 *** ***2001 845,526 1107.5 4,200 5.5 15,757 20.2 *** ***2000 866,411 1159.1 4,015 5.4 13,034 17.4 *** ***1999 908,454 1241.9 3,308 4.5 17,675 24.2 892 1.21998 931,655 1302.1 4,606 6.4 15,507 21.7 1,120 1.61997 899,409 1329.7 3,493 5.2 12,724 18.8 887 1.31996 997,914 1475.3 4,979 7.1 12,817 18.9 1,052 1.61995 860,005 1351.5 4,059 5.9 21,011 33.0 1,023 1.5
* Acute Watery and Bloody Diarrhea
Number Rate Number Rate Number Rate Number Rate2015 225 0.2 51 0.1 1 0.0 23 0.02014 93 0.1 41 0.0 5 0.0 24 0.02013 530 0.5 27 0.0 4 0.0 29 0.02012 214 0.2 30 0.0 167 0.2 23 0.02011 303 0.3 28 0.0 2 0.0 18 0.02010 274 0.3 30 0.0 1 0.0 23 0.02009 269 0.3 36 0.0 4 0.0 18 0.02008 603 0.7 49 0.1 6 0.0 14 0.02007 524 0.6 35 0.0 24 0.0 7 0.02006 874 1.0 41 0.0 40 0.0 15 0.02005 974 1.1 49 0.1 57 0.1 11 0.02004 822 1.0 38 0.0 12 0.0 18 0.02003 697 0.9 54 0.1 30 0.0 20 0.02002 907 1.1 68 0.1 177 0.2 26 0.02001 888 1.1 68 0.1 19 0.0 21 0.02000 1,146 1.5 39 0.1 25 0.0 24 0.01999 1,423 1.9 50 0.1 48 0.1 16 0.01998 1,739 2.4 38 0.1 48 0.1 22 0.01997 1,654 2.3 56 0.1 53 0.1 30 0.01996 1,788 2.6 69 0.1 108 0.2 29 0.01995 2,730 4.3 68 0.1 935 1.5 40 0.1
** includes late effects
*** no data available
Typhoid and Paratyphoid Fever
Cases Deaths
Diarrheas
(A09)(A01)Cases * Deaths
(A30)Cases Deaths**
(A30, B92) Cases Deaths(A36)
Year
Leprosy
(A00-A09)Year
NOTIFIABLE DISEASES: REPORTED CASES & DEATHS
1995-2015Philippines
Number & Rate/100,000 Population
Diptheria
66

Table 18
Number Rate Number Rate Number Rate Number Rate2015 688 0.7 5 0.0 438 0.4 565 0.62014 1,308 1.3 3 0.0 270 0.3 521 0.52013 328 0.3 17 0.0 189 0.2 555 0.62012 35 0.0 0 0.0 103 0.1 572 0.62011 118 0.1 2 0.0 81 0.1 598 0.62010 1 0.0 3 0.0 21 0.0 590 0.62009 813 0.9 4 0.0 168 0.2 575 0.62008 615 0.7 4 0.0 276 0.3 661 0.72007 154 0.2 1 0.0 75 0.1 667 0.82006 516 0.6 2 0.0 212 0.2 697 0.82005 132 0.2 1 0.0 229 0.3 720 0.82004 2,087 2.5 1 0.0 965 1.2 786 0.92003 944 1.2 2 0.0 347 0.4 759 0.92002 2,542 3.2 1 0.0 34 0.0 748 0.92001 739 0.9 3 0.0 113 0.1 741 1.02000 942 1.2 2 0.0 340 0.4 799 1.01999 1,327 1.8 1 0.0 178 0.2 733 1.01998 673 0.9 6 0.0 391 0.5 751 1.01997 1,004 1.4 6 0.0 677 0.9 684 1.01996 2,554 3.8 9 0.0 1,011 1.5 758 1.11995 4,324 6.8 12 0.0 3,054 4.8 803 1.2
Number Rate Number Rate Number Rate Number Rate
2015 1,852 1.8 295 0.3 271 0.3 5 0.02014 2,348 2.4 245 0.2 2 0.0 3 0.02013 638 0.7 264 0.3 8 0.0 8 0.02012 1,372 1.4 237 0.2 96 0.1 6 0.02011 494 0.5 255 0.3 49 0.1 3 0.02010 638 0.7 203 0.2 158 0.2 6 0.02009 2,703 2.9 228 0.2 15 0.0 9 0.02008 8,918 9.9 269 0.3 39 0.0 7 0.02007 3,058 3.5 240 0.3 154 0.2 8 0.02006 3,517 4.0 253 0.3 114 0.1 12 0.02005 9,383 11.0 241 0.3 439 0.5 11 0.02004 6,628 7.9 260 0.3 104 0.1 9 0.02003 5,967 7.4 304 0.4 406 0.5 9 0.02002 7,426 9.3 272 0.3 2,095 2.6 10 0.02001 4,240 5.4 260 0.3 668 0.9 7 0.02000 4,240 5.6 260 0.3 668 0.9 7 0.01999 11,572 15.5 227 0.3 398 0.5 1 0.01998 10,986 15.0 191 0.3 391 0.5 7 0.01997 12,524 17.5 238 0.3 1,025 1.4 3 0.01996 9,069 13.4 267 0.4 401 0.6 6 0.01995 8,795 13.8 231 0.3 636 1.0 4 0.0
Cases Deaths Cases Deaths(B65) (B74)
Cases Deaths(A37) (A33-A35)
Whooping Cough Tetanus
Cases Deaths
Year
Schistosomiasis Filariasis
NOTIFIABLE DISEASES: REPORTED CASES & DEATHS
Philippines1995-2015
Number & Rate/100,000 Population
Year
67
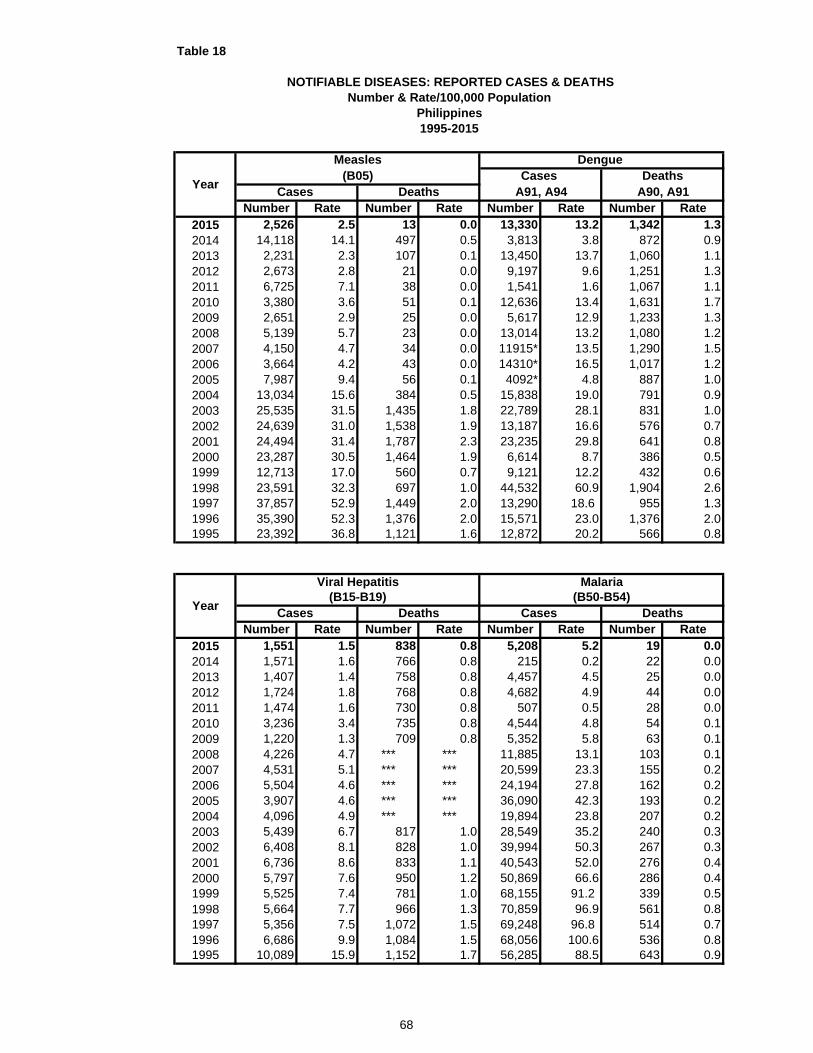
Table 18
Number Rate Number Rate Number Rate Number Rate2015 2,526 2.5 13 0.0 13,330 13.2 1,342 1.32014 14,118 14.1 497 0.5 3,813 3.8 872 0.92013 2,231 2.3 107 0.1 13,450 13.7 1,060 1.12012 2,673 2.8 21 0.0 9,197 9.6 1,251 1.32011 6,725 7.1 38 0.0 1,541 1.6 1,067 1.12010 3,380 3.6 51 0.1 12,636 13.4 1,631 1.72009 2,651 2.9 25 0.0 5,617 12.9 1,233 1.32008 5,139 5.7 23 0.0 13,014 13.2 1,080 1.22007 4,150 4.7 34 0.0 11915* 13.5 1,290 1.52006 3,664 4.2 43 0.0 14310* 16.5 1,017 1.22005 7,987 9.4 56 0.1 4092* 4.8 887 1.02004 13,034 15.6 384 0.5 15,838 19.0 791 0.92003 25,535 31.5 1,435 1.8 22,789 28.1 831 1.02002 24,639 31.0 1,538 1.9 13,187 16.6 576 0.72001 24,494 31.4 1,787 2.3 23,235 29.8 641 0.82000 23,287 30.5 1,464 1.9 6,614 8.7 386 0.51999 12,713 17.0 560 0.7 9,121 12.2 432 0.61998 23,591 32.3 697 1.0 44,532 60.9 1,904 2.61997 37,857 52.9 1,449 2.0 13,290 18.6 955 1.31996 35,390 52.3 1,376 2.0 15,571 23.0 1,376 2.01995 23,392 36.8 1,121 1.6 12,872 20.2 566 0.8
Number Rate Number Rate Number Rate Number Rate2015 1,551 1.5 838 0.8 5,208 5.2 19 0.02014 1,571 1.6 766 0.8 215 0.2 22 0.02013 1,407 1.4 758 0.8 4,457 4.5 25 0.02012 1,724 1.8 768 0.8 4,682 4.9 44 0.02011 1,474 1.6 730 0.8 507 0.5 28 0.02010 3,236 3.4 735 0.8 4,544 4.8 54 0.12009 1,220 1.3 709 0.8 5,352 5.8 63 0.12008 4,226 4.7 *** *** 11,885 13.1 103 0.12007 4,531 5.1 *** *** 20,599 23.3 155 0.22006 5,504 4.6 *** *** 24,194 27.8 162 0.22005 3,907 4.6 *** *** 36,090 42.3 193 0.22004 4,096 4.9 *** *** 19,894 23.8 207 0.22003 5,439 6.7 817 1.0 28,549 35.2 240 0.32002 6,408 8.1 828 1.0 39,994 50.3 267 0.32001 6,736 8.6 833 1.1 40,543 52.0 276 0.42000 5,797 7.6 950 1.2 50,869 66.6 286 0.41999 5,525 7.4 781 1.0 68,155 91.2 339 0.51998 5,664 7.7 966 1.3 70,859 96.9 561 0.81997 5,356 7.5 1,072 1.5 69,248 96.8 514 0.71996 6,686 9.9 1,084 1.5 68,056 100.6 536 0.81995 10,089 15.9 1,152 1.7 56,285 88.5 643 0.9
Cases Deaths Cases Deaths(B15-B19) (B50-B54)
Deaths A91, A94 A90, A91(B05)
Viral Hepatitis Malaria
Cases Deaths
NOTIFIABLE DISEASES: REPORTED CASES & DEATHS
Philippines1995-2015
Number & Rate/100,000 Population
Year
Year
Measles Dengue
Cases
68
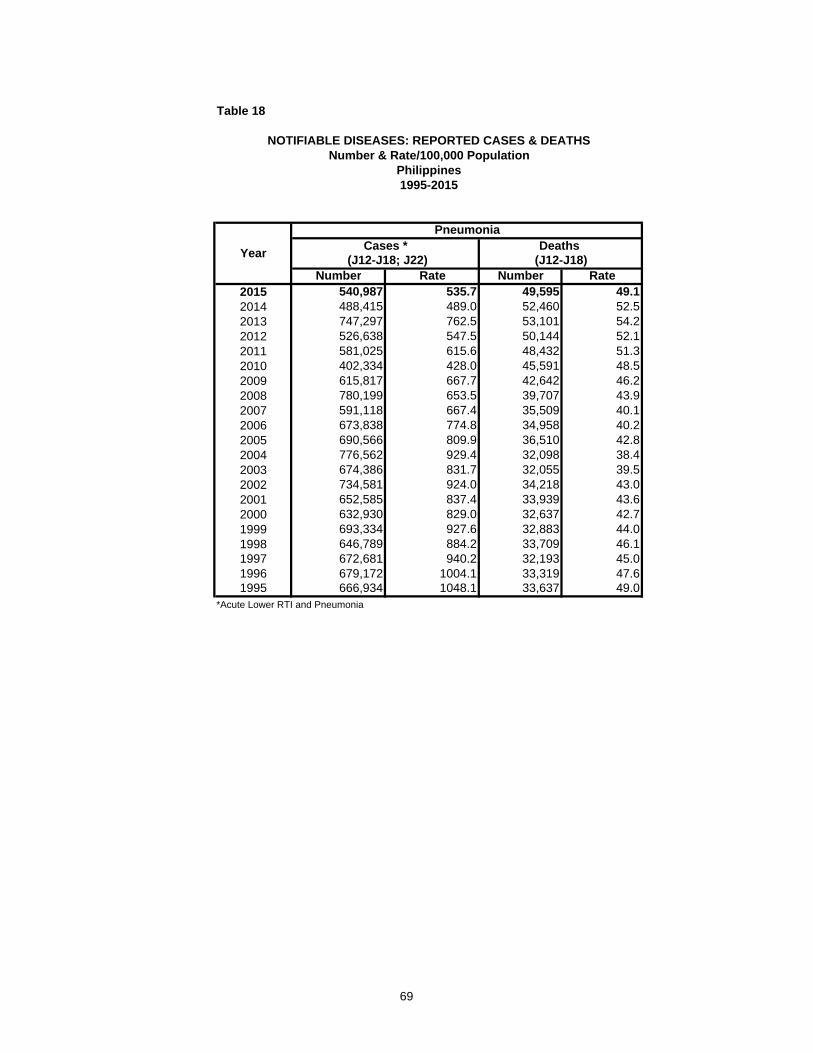
Table 18
Number Rate Number Rate2015 540,987 535.7 49,595 49.12014 488,415 489.0 52,460 52.52013 747,297 762.5 53,101 54.22012 526,638 547.5 50,144 52.12011 581,025 615.6 48,432 51.32010 402,334 428.0 45,591 48.52009 615,817 667.7 42,642 46.22008 780,199 653.5 39,707 43.92007 591,118 667.4 35,509 40.12006 673,838 774.8 34,958 40.22005 690,566 809.9 36,510 42.82004 776,562 929.4 32,098 38.42003 674,386 831.7 32,055 39.52002 734,581 924.0 34,218 43.02001 652,585 837.4 33,939 43.62000 632,930 829.0 32,637 42.71999 693,334 927.6 32,883 44.01998 646,789 884.2 33,709 46.11997 672,681 940.2 32,193 45.01996 679,172 1004.1 33,319 47.61995 666,934 1048.1 33,637 49.0
*Acute Lower RTI and Pneumonia
Deaths (J12-J18; J22) (J12-J18)
Year
NOTIFIABLE DISEASES: REPORTED CASES & DEATHS
Philippines1995-2015
Pneumonia
Number & Rate/100,000 Population
Cases *
69
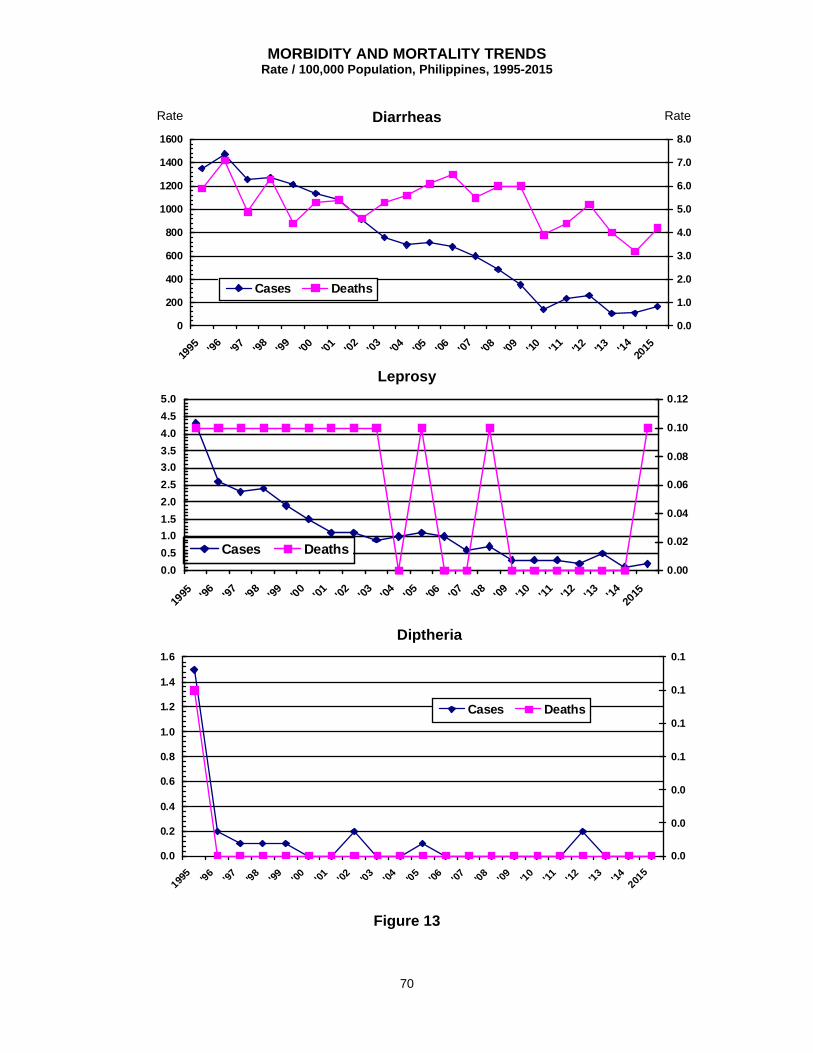
70
MORBIDITY AND MORTALITY TRENDS Rate / 100,000 Population, Philippines, 1995-2015
Diarrheas
0
200
400
600
800
1000
1200
1400
1600
1995 '9
6'97 '9
8'9
9'00 '01 '0
2'0
3'04 '05 '06 '0
7'08 '09 '10 '1
1'12 '13 '1
420
15
0.0
1.0
2.0
3.0
4.0
5.0
6.0
7.0
8.0
Cases Deaths
Leprosy
0.0
0.5
1.0
1.5
2.0
2.5
3.0
3.5
4.0
4.5
5.0
1995 '9
6'9
7'9
8'9
9'0
0'0
1'0
2'0
3'0
4'0
5'06 '0
7'0
8'0
9'1
0'1
1'1
2'1
3'1
420
15
0.00
0.02
0.04
0.06
0.08
0.10
0.12
Cases Deaths
Diptheria
0.0
0.2
0.4
0.6
0.8
1.0
1.2
1.4
1.6
1995
'96
'97
'98
'99
'00
'01
'02
'03
'04
'05
'06
'07
'08
'09
'10
'11
'12
'13
'14
2015
0.0
0.0
0.0
0.1
0.1
0.1
0.1
Cases Deaths
Figure 13
Rate Rate
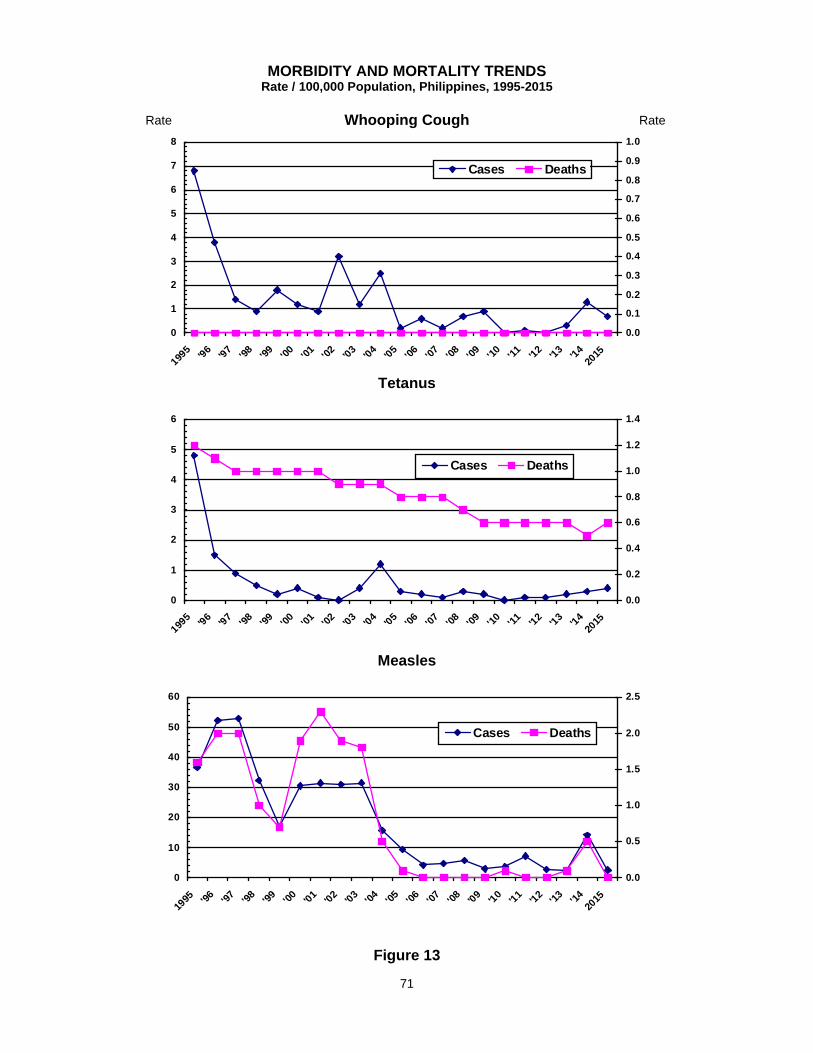
71
MORBIDITY AND MORTALITY TRENDS
Rate / 100,000 Population, Philippines, 1995-2015
Whooping Cough
0
1
2
3
4
5
6
7
8
1995
'96
'97
'98
'99
'00
'01
'02
'03
'04
'05
'06
'07
'08
'09
'10
'11
'12
'13
'14
2015
0.0
0.1
0.2
0.3
0.4
0.5
0.6
0.7
0.8
0.9
1.0
Cases Deaths
Tetanus
0
1
2
3
4
5
6
1995
'96
'97
'98
'99
'00
'01
'02
'03
'04
'05
'06
'07
'08
'09
'10
'11
'12
'13
'14
2015
0.0
0.2
0.4
0.6
0.8
1.0
1.2
1.4
Cases Deaths
Measles
0
10
20
30
40
50
60
1995 '9
6'9
7'9
8'9
9'0
0'0
1'0
2'0
3'0
4'0
5'0
6'0
7'0
8'0
9'1
0'1
1'1
2'1
3'1
420
15
0.0
0.5
1.0
1.5
2.0
2.5
Cases Deaths
Figure 13
Rate Rate
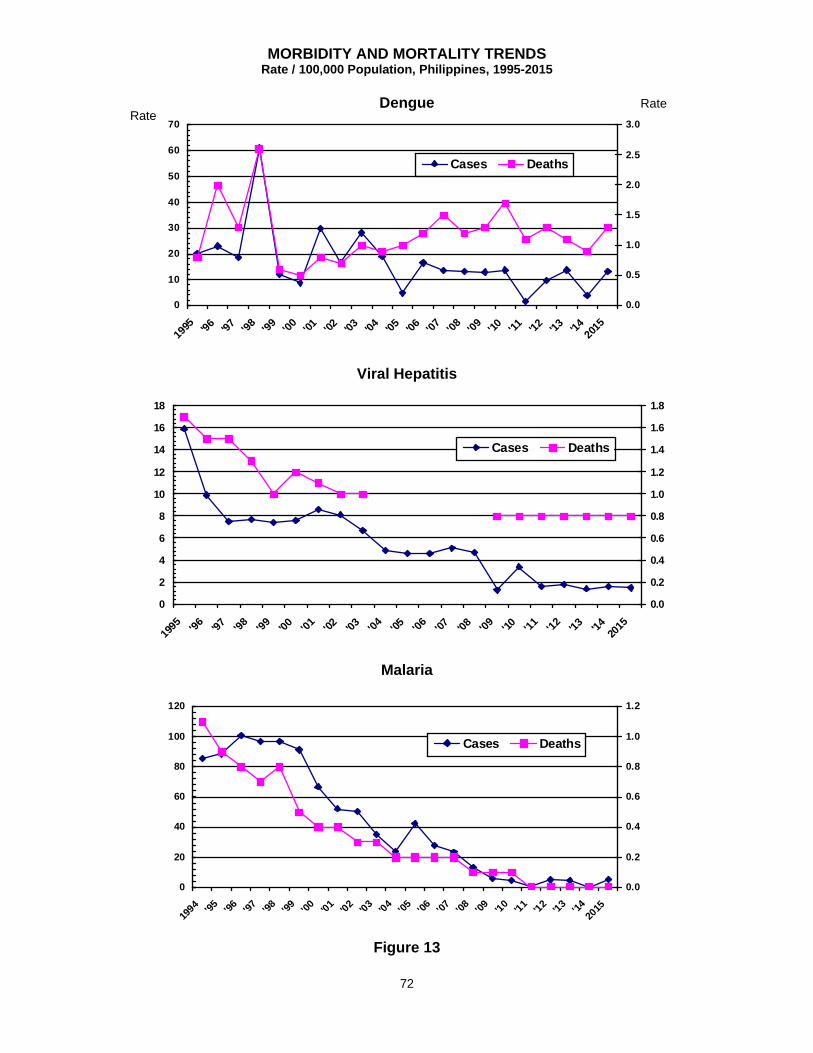
72
MORBIDITY AND MORTALITY TRENDS Rate / 100,000 Population, Philippines, 1995-2015
Dengue
0
10
20
30
40
50
60
70
1995 '96 '97 '9
8'9
9'0
0'01 '02 '03 '04 '05 '06 '0
7'0
8'0
9'10 '11 '12 '13 '14
2015
0.0
0.5
1.0
1.5
2.0
2.5
3.0
Cases Deaths
Viral Hepatitis
0
2
4
6
8
10
12
14
16
18
1995 '9
6'97 '9
8'9
9'00 '0
1'02 '03 '0
4'05 '0
6'07 '08 '0
9'10 '1
1'1
2'13 '14
2015
0.0
0.2
0.4
0.6
0.8
1.0
1.2
1.4
1.6
1.8
Cases Deaths
Malaria
0
20
40
60
80
100
120
1994 '9
5'9
6'9
7'9
8'9
9'0
0'0
1'0
2'0
3'0
4'0
5'0
6'0
7'0
8'0
9'1
0'1
1'1
2'1
3'1
420
15
0.0
0.2
0.4
0.6
0.8
1.0
1.2
Cases Deaths
Figure 13
Rate Rate
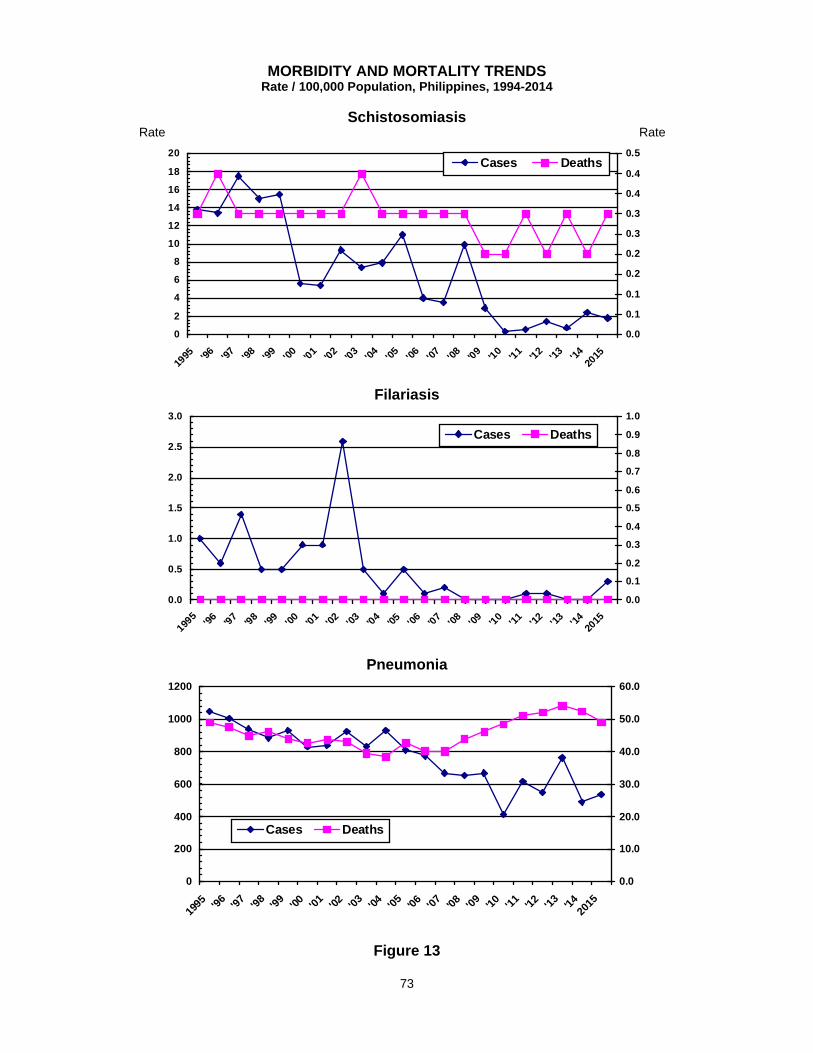
73
MORBIDITY AND MORTALITY TRENDS
Rate / 100,000 Population, Philippines, 1994-2014
Schistosomiasis
0
2
4
6
8
10
12
14
16
18
20
1995 '9
6'9
7'9
8'9
9'0
0'0
1'0
2'0
3'0
4'0
5'0
6'0
7'0
8'0
9'1
0'1
1'1
2'1
3'1
420
15
0.0
0.1
0.1
0.2
0.2
0.3
0.3
0.4
0.4
0.5Cases Deaths
Filariasis
0.0
0.5
1.0
1.5
2.0
2.5
3.0
1995
'96
'97
'98
'99
'00
'01
'02
'03
'04
'05 '06
'07
'08
'09
'10
'11
'12
'13
'14
2015
0.0
0.1
0.2
0.3
0.4
0.5
0.6
0.7
0.8
0.9
1.0
Cases Deaths
Pneumonia
0
200
400
600
800
1000
1200
1995 '9
6'9
7'9
8'9
9'00 '0
1'02 '0
3'04 '0
5'06 '0
7'08 '0
9'10 '1
1'12 '1
3'14
2015
0.0
10.0
20.0
30.0
40.0
50.0
60.0
Cases Deaths
Figure 13
Rate Rate
74
MORTALITY STATISTICS
Mortality data are fundamental source of demographic, geographic, and cause-of-death information. Although mortality data reflect just the opposite of the state of health of a population, specific age and sex mortality rates are important indicators of the health status of a population. It plays a vital role in understanding the health status of the population. It provides a basis for studying the occurrence of disease, its severity and how it affects the quality of life before death. Mortality statistics such as deaths by leading causes could already reveal the most prevalent life-threatening diseases. It helps detect the population’s vulnerability to certain illnesses. Measuring and comparing mortality rates across populations also helps to highlight health differences among different groups of people.
Mortality statistics provide a baseline indicator that could define government
priorities in terms of health policy formulation and service provision. It supplies basic information for planning appropriate preventive measures, stimulating medical research and highlighting topics of relevance in health education of the public. Further, examining trends of mortality over time assists in the evaluation of the health system.
Presented in this report were data on registered deaths that occurred in 2015 and were registered from January 2015 to March 2016. Deaths that were registered after March 2015 and those that were not registered at all were not included. The numbers were provided by the Vital Statistics Division of the Philippine Statistics Authority (PSA) through information obtained from Death Certificates (Municipal Form No. 103) transmitted by the City/Municipal Civil Registrars to the Office of the Civil Registrar General for processing and archiving. No adjustments for under registration or for delay in the submission of these certificates were made in the analysis.
The 2015 Philippine Health Statistics (PHS) presents different indicators on mortality such as Crude Death Rate (CDR), Infant Mortality Rate (IMR), Maternal Mortality Ratio (MMR), Age-Specific Death Rate (ASDR) and percentage of death by leading cause. The CDR and deaths by leading cause include deaths occurring in the entire population from all ages. The ASDR indicates rates of death at different ages or the relative exposure of population of subgroups to the risk of dying. The IMR considers death to the most tender age, age less than one year old, when infants have not fully developed their immunity to certain diseases. The MMR is an important indicator of women’s health before, during and after childbirth. In addition to these indicators, special tables which feature the ten leading causes of death among lower age groups; 1-4, 5-9 and 10-14. These were intended for stakeholders who may be interested for the disease-causing death of children population which is 1-14 years old. This report also included tables for fetal deaths.

75
GENERAL MORTALITY In the Philippines, there were 560,605 deaths registered in 2015. This is equivalent to more than five deaths for every one thousand population. Of these deaths, 57.0% or 321,624 were males and 43.0% or 238,981 were females. For every 100 female deaths, there correspond 134 male deaths and which constituted to a death sex ratio of 1.34. The 2015 Crude Death Rate (CDR) per one thousand population was computed at 5.6 deaths. There is a 3.7% increase in last year’s CDR. The two-decade trend of CDR from 1995 to 2015 is slowly but steadily increases, from 4.7 deaths to 5.6 deaths per thousand population. (Table 4) It is consistent that number of male deaths are greater than female deaths. Consequently, males always have higher death rate than females. In 2015, CDR for male is 6.3 versus CDR for female, which is 4.8 per thousand population of each sex group. Reports also showed that the highest occurrence of deaths were among the elderly persons, 70 years and over. It comprised about 38.1% of total deaths with 213,770 deaths. However, death occurrence was least among age group 10-14 years with 0.8%. Mortality among under 1 year old is more than twice (20,750 or 3.7%) the number of deaths in ages 1-4 years (9,150 or 1.7%) The proportion of deaths is higher to people in older age groups, as shown in Table 19. Reports showed that the highest incidence of death (by place of occurrence) was in CALABARZON with 80,776 or 14.4% of the total deaths, followed by NCR with 74,530 deaths or 13.3% and Central Luzon with 65,540 deaths or 11.7%. Percentage of deaths from these three regions alone, already comprised to almost 40 percent (39.4%) of the total deaths.
On the other hand, Autonomous Region of Muslim Mindanao (ARMM) reported the least number of deaths with 2,967 or 0.5% only. While, Cordillera Administrative Region (CAR) and CARAGA followed with a share of 1.4% and 2.6% respectively. These three regions were consistently low in terms of the number of deaths registered, which maybe a result of either effective health intervention or under registration. On the other hand, Ilocos Region reported the highest CDR with 6.8 deaths per thousand of regional population. It is followed by Western Visayas with CDR of 6.6 deaths per thousand of the regional population. Whereas, ARMM posted the lowest CDR with only 0.8 deaths per thousand of regional population. Eight (8) out of seventeen (17) regions in the country exceeded the national CDR of 5.6; and the rest of the nine (9) regions were either have equal to or less than national CDR. (Table 20)
76
Across all regions and in all age groups, except for 70 years and over, numbers of male deaths were generally higher than female deaths. The difference of 15.1 deaths per 100,000 population between male and female, could be attributable to the difference of 5.53 years in life expectancy between male and female. The 2015 projected life expectancy of male was 68.81 years and 74.34 years for female. (Philippine Statistics Authority, 2015)
The month of January recorded the highest number of deaths with 50,381 or 9.0
percent share from the total national deaths. While, June was the month with the least percent share of only 7.9 or 44,172 deaths.
In 2015, there were 64 deaths per hour. On the average, 1,536 deaths occurred
daily. Further, the months of the year with average daily deaths lower than 1,536 were March (1,498), April (1,481), May (1,515), June (1,472), September (1,526) and November (1,520).
Out of 560,605 deaths registered in 2015, about 84.5 percent (473,986) were
attributed to the top ten leading causes of death for the year. Mortality from all other causes comprised 15.5 percent of total deaths or 86,619 deaths. One in every four deaths was caused by Diseases of the heart making it the number one leading cause of death. Diseases of the heart remained to be the leading cause with 136,879 deaths and with a computed rate of 135.5 deaths per 100,000 population. It recorded a 24.4 percent share from total deaths.
Diseases of the heart had been consistently the number one cause of death for
several years now. The 2015 number of deaths from this condition is 4,054 deaths (3.05%) higher than what was reported in 2014 which had 132,825 deaths. More males than females die from this cause. Out of 136,879 deaths reported, 77,496 or 56.6 percent were males and 59,383 or 43.4 percent were females. Thus, the death sex ratio for Diseases of the heart was 1.3 or 130 male deaths in every 100 female deaths. (Table 22)
Diseases of the heart came in many forms such as acute rheumatic fever and
chronic rheumatic heart diseases, hypertensive diseases, and ischemic heart diseases. Deaths from ischemic heart diseases had the highest number of deaths (68,572; 50.0%) or half of deaths from diseases of the heart died specifically from ischemic heart disease. Three out of five deaths from ischemic heart diseases were males (41,284; 60.0%) while, the rest were females (27,288; 40.0%). Deaths from hypertensive diseases followed with 34,506 deaths or 25.2 percent.
Most fatalities from ischemic heart diseases elderly, belonging to age group 70
years and over with 29,652 deaths or 43.2 percent. The 2015 mortality statistics showed that deaths due to most heart diseases were higher for men than women for age groups less than 70 years old. However, more women than men age 70 years and older die from the said condition. (Table 28)

77
The next four diseases in the list, which remained in their respective rankings for the past five years already were, Diseases of the vascular system (61,198; 10.9%), Malignant neoplasm (58,715; 10.5%), Pneumonia (49,595; 8.8%) and Accidents (39,256; 7.0%).
Seven out of the ten leading causes of deaths were male dominated. Female
deaths were only higher than male deaths for Malignant neoplasms, Pneumonia and Diabetes mellitus. Furthermore, number of male deaths from Accidents were significantly higher than female, it was more than four times higher. From the total 39,256 deaths from Accidents, 80.1 percent or 31,783 deaths were male and only 19.9 percent or 7,473 were female. (Table 22)
Nonetheless, the same killer diseases were identified as the ten leading causes of
death for separate groups of male and female, which differed only in ranks when tabulated by sex. (Tables 24 and 25).
In 2015, majority of deaths from the ten leading causes of mortality were
unattended by a medical doctor or any allied health officer in anytime during their illness or injury. Reports show that people who died from pulmonary diseases such as Pneumonia (69.2%) and Chronic lower respiratory diseases (71.6%) were commonly not seen by a health practitioner anytime during their illness or injury (Table 26).
Across all regions, NCR is the only region in the country where at least 54.1% of
its deaths were attended by a medical doctor at the time of death than not. It was still, however low, when we consider that NCR is a highly urbanized region and where both public and private health facilities are accessible. If accessibility is not a problem in this region due to numerous health facilities, we may look into the affordability issue of accessing health care. Dying without the attention of a medical doctor could be somehow an evidence of unaffordable health cost in the country. (Table 27)
The table on number of deaths distributed into 17 cause-groups, reflected the
proportion of deaths in reference to the ten leading causes of mortality. The group of Diseases of the circulatory system had the highest percent share to total deaths with 35.0 or 198,077 deaths. This group included the top two killer diseases, Diseases of the heart and Diseases of the vascular system. (Table 30) Table 31 showed that the 2015 death rates from Communicable Diseases decreased as compared to last year’s rates. However, rate of the Diseases of the heart is continuously increasing for the past three decades. (Table 31) The ten leading causes of mortality in a ten-year-period interval; 2015, 2005 and 1995 were shown in Table 32. For the past three decades, Filipinos died of mostly the same kind of diseases, Diseases of the heart, Diseases of the vascular system, Malignant neoplasm and Pneumonia. It can be noted from the three tables that the rate of dying from those same conditions increased from 2005 to 2015.

78
INFANT MORTALITY The infant mortality rate (IMR) slightly decreased by 1.6%, from 12.1 infant deaths per one thousand live births in 2014 to 11.9 in 2015. The 20,750 infant deaths comprised 3.7 percent of the total deaths (560,605) registered during the year. This represented a daily average of 57 infant deaths and more than 2 infant deaths per hour. Statistics showed a decreasing trend in IMR from 1965 to 2015 although there were minimal increases at some point. (Table 4) The National Capital Region (NCR) posted the highest IMR with 16.4 deaths per thousand live births or 3,811 deaths. The regions of CALABARZON and Ilocos followed with IMR of 14.0 and 13.6 respectively. In contrary, Eastern Visayas Region recorded the lowest IMR of 7.3 with 563 infant deaths. Majority of the 17 regions (11 regions) fall below the national IMR of 11.9 deaths per thousand live births. (Table 5) October recorded the highest number of infant deaths in 2015 with a share of 9.9 percent in total infant deaths or with 2,062 infant deaths. This was translated to about 66 infant deaths per day. While, the month of April had the least number of infant deaths with 1,499 deaths or 7.2 percent of total infant deaths and an average of 50 infant deaths per day of that month. (Table 6) More deaths occurred to infants less than 28 days old with 56.9 percent or 11,802 infant deaths as compared to infants one month to less than one year old with 43.1 percent or 8,948 infant deaths. (Table 33) The top three leading causes of infant mortality were Pneumonia (2,370; 11.4%); Respiratory distress of newborn (2,276; 11.0%); and Bacterial sepsis of newborn (2,157; 10.4%). The listed top five leading causes of infant mortality in 2015 were the same with what was recorded in 2014, which differed only in ranks. The numbers of infant deaths from respiratory distress and congenital malformation of the heart were higher in 2015 than in 2014. (Table 34)
Numbers of infant deaths were generally higher among male babies across all regions with 12,086 deaths or 58.2 percent than female babies with only 8,664 deaths or 41.8 percent with respect to total infant deaths. The infant death sex ratio was computed at 139 males per 100 female babies. (Table 35)

79
MATERNAL MORTALITY Maternal health refers to the health of women during pregnancy, childhood and postpartum period. While motherhood is often a positive and fulfilling experience, for too many women it is associated with suffering, ill-health and even death. (World Health Organization) On the other hand, maternal mortality is a mirror of a woman’s health and nutritional status during pregnancy, at childbirth, or in the period after childbirth. It also highlights her access to professional medical services before, during and even after childbirth. Women die as a result of complication during and following pregnancy and childbirth. Most of these complications develop during pregnancy and most are preventable or treatable. Other complications may exist before pregnancy but are worsened during pregnancy, especially if not managed as part of the woman’s care. (World Health Organization) Statistics for this vital event are based on information obtained from the Death Certificates (Municipal Form No. 103) transmitted by the City/Municipal Civil Registrars to the Philippine Statistics Authority for processing and archiving. Included in this report are registered maternal deaths that occurred in 2015. No adjustments for under registration were done in the presentation. In 2015, there were at least four maternal deaths occurred daily. The number of registered maternal deaths reached to a total of 1,721. The Maternal Mortality Ratio (MMR) is 1.0 per one thousand live birth. (Table 4) The region with the highest recorded MMR in 2015 was Central Visayas with 1.4 maternal deaths per thousand live birth. It is followed by the regions of Caraga and ARMM with both MMR of 1.3. In contrary, CAR had the lowest MMR of 0.4 maternal deaths per thousand live birth. Six (6) out of 17 regions had MMR higher than the national MMR of 1.0. (Table 5)
Statistics showed that the ten leading causes of maternal deaths comprised 86.2 percent of total maternal deaths. Leading the list is Eclampsia with 337 deaths, while Premature separation of placenta and Puerperal sepsis, both on the tenth place which had 40 cases each. (Table 36)
Statistics also showed that MMR was highest in women 50 years old and over,
with ratio of 5.4 maternal deaths per 1000 live births. However, in terms of number, maternal deaths from age-group 35-39 was highest, with 362 deaths. (Table 37)

80
FETAL DEATHS
The information presented herein was obtained from the fetal death certificates (Municipal Form No. 103A) submitted by the City/Municipal Registrars from all over the country to the Office of the Civil Registrar General for processing and archiving purposes. There was no adjustment for under registration in the presentation. The total numbers of registered fetal deaths were 7,676 which was equivalent to a fetal death ratio (FDR) of 4.4 per one thousand livebirth. This was translated to an average of 21 fetal deaths per day for the year 2015. (Table 4) The FDR was highest in NCR with 6.5 fetal deaths per thousand live births. The Ilocos and Central Visayas regions followed with FDR of 6.1 and 5.9 fetal deaths per thousand live births, respectively. Two (2) more regions recorded a higher FDR than the national FDR of 4.4 fetal deaths per thousand live births. These were Calabarzon (5.2) and Bicol (5.1). (Table 5) Highest incidence of fetal deaths in 2015 was in September with 811 fetal deaths or 10.6 percent. The months of October and July followed with a percentage share of ten percent or with 743 fetal deaths and 8.8 % with 675 fetal deaths respectively. (Table 6) Almost all (99.3%) of fetal deaths were attended by qualified medical professionals such as physician (97.8%), nurse (0.2%) and midwife (1.3%). The rest were attended by hilot or unlicensed midwife. (Table 38) One in every five fetal death was caused by disorders related to short gestation and low birth weight (1,738; 22.6% deaths). However, 20.8 percent or 1,601 fetal deaths still died from an unspecified cause. (Table 39). Most number of fetal deaths occurred to mothers in age-group 25-29 years, with 1,753 reported deaths or 22.8 percent of total fetal deaths. High number of fetal deaths were also registered to mothers of ages 20-24 years (1,636; 21.3%) and 30-34 years (1,669; 21.7%). However, statistics show that older mother (40-49 years old) had higher risk of having fetal deaths than the younger ones. The ratio of fetal deaths to livebirths was high on mothers 50 years and older (8.2) and 40-44 years old. (8.0). (Table 40)
81
MORTALITY AMONG LOWER AGE GROUPS The 2015 ten leading causes of mortality among lower age groups, specifically to age groups 1-4; 5-9; 10-14 years were presented in Table 41. Pneumonia was the number one cause of death among children in age groups 1-4 and 10-14 years old. Drowning is the most common cause of death among children 5-9 years old, Pneumonia was only second in the list. Deaths from vehicular accidents were also common among 5-14 years old. (Table 41) MORTALITY AMONG IMMUNIZABLE DISEASES The number of deaths from Tuberculosis was still highest among mortalities from immunizable diseases of children up to 14 years old in 2015. It registered 509 deaths or 1.6 deaths per 100,000 population of children less than one year to 14 years old. It was followed by Tetanus and Diptheria with 95 and 17 deaths respectively.
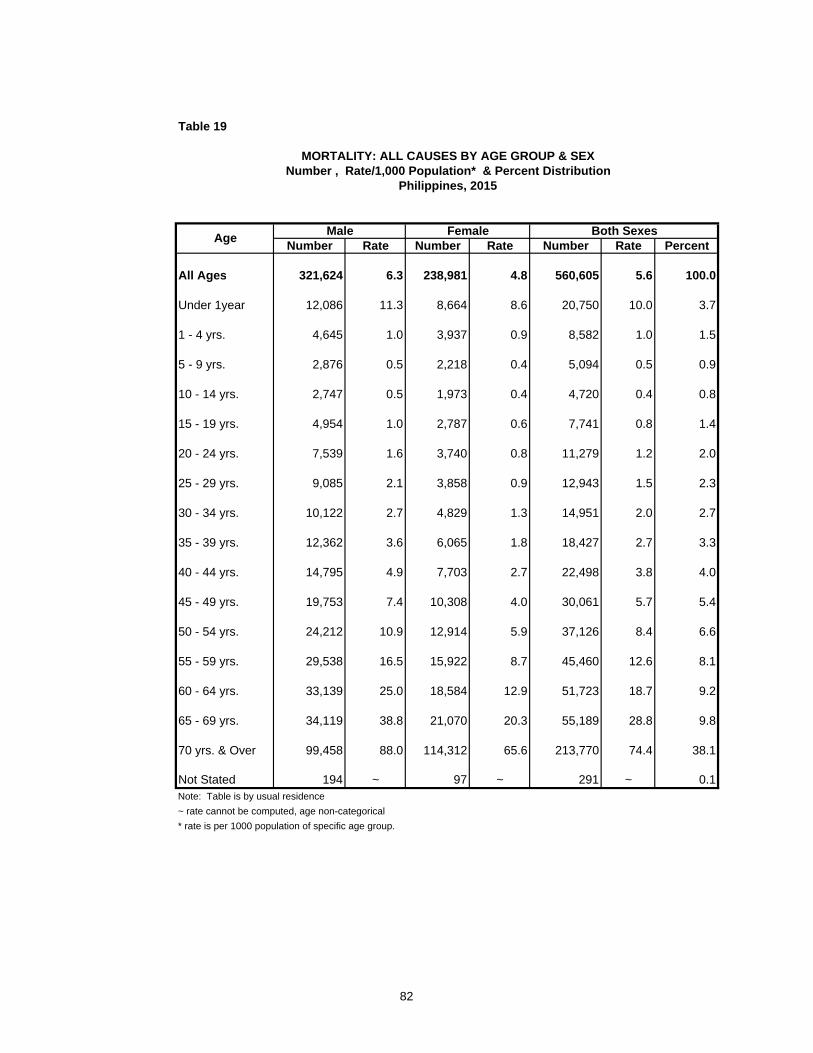
Table 19
Number Rate Number Rate Number Rate Percent
All Ages 321,624 6.3 238,981 4.8 560,605 5.6 100.0
Under 1year 12,086 11.3 8,664 8.6 20,750 10.0 3.7
1 - 4 yrs. 4,645 1.0 3,937 0.9 8,582 1.0 1.5
5 - 9 yrs. 2,876 0.5 2,218 0.4 5,094 0.5 0.9
10 - 14 yrs. 2,747 0.5 1,973 0.4 4,720 0.4 0.8
15 - 19 yrs. 4,954 1.0 2,787 0.6 7,741 0.8 1.4
20 - 24 yrs. 7,539 1.6 3,740 0.8 11,279 1.2 2.0
25 - 29 yrs. 9,085 2.1 3,858 0.9 12,943 1.5 2.3
30 - 34 yrs. 10,122 2.7 4,829 1.3 14,951 2.0 2.7
35 - 39 yrs. 12,362 3.6 6,065 1.8 18,427 2.7 3.3
40 - 44 yrs. 14,795 4.9 7,703 2.7 22,498 3.8 4.0
45 - 49 yrs. 19,753 7.4 10,308 4.0 30,061 5.7 5.4
50 - 54 yrs. 24,212 10.9 12,914 5.9 37,126 8.4 6.6
55 - 59 yrs. 29,538 16.5 15,922 8.7 45,460 12.6 8.1
60 - 64 yrs. 33,139 25.0 18,584 12.9 51,723 18.7 9.2
65 - 69 yrs. 34,119 38.8 21,070 20.3 55,189 28.8 9.8
70 yrs. & Over 99,458 88.0 114,312 65.6 213,770 74.4 38.1
Not Stated 194 ~ 97 ~ 291 ~ 0.1Note: Table is by usual residence
~ rate cannot be computed, age non-categorical
* rate is per 1000 population of specific age group.
MORTALITY: ALL CAUSES BY AGE GROUP & SEXNumber , Rate/1,000 Population* & Percent Distribution
Philippines, 2015
Male Female Both SexesAge
82
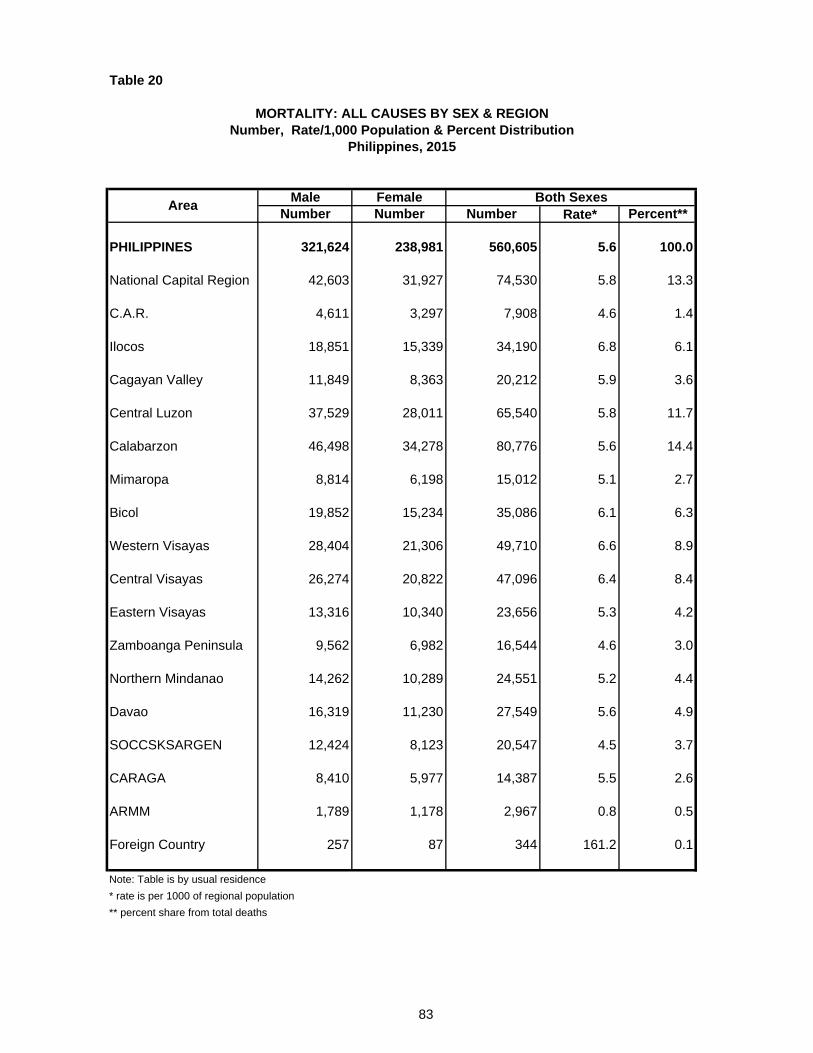
Table 20
Male FemaleNumber Number Number Rate* Percent**
PHILIPPINES 321,624 238,981 560,605 5.6 100.0
National Capital Region 42,603 31,927 74,530 5.8 13.3
C.A.R. 4,611 3,297 7,908 4.6 1.4
Ilocos 18,851 15,339 34,190 6.8 6.1
Cagayan Valley 11,849 8,363 20,212 5.9 3.6
Central Luzon 37,529 28,011 65,540 5.8 11.7
Calabarzon 46,498 34,278 80,776 5.6 14.4
Mimaropa 8,814 6,198 15,012 5.1 2.7
Bicol 19,852 15,234 35,086 6.1 6.3
Western Visayas 28,404 21,306 49,710 6.6 8.9
Central Visayas 26,274 20,822 47,096 6.4 8.4
Eastern Visayas 13,316 10,340 23,656 5.3 4.2
Zamboanga Peninsula 9,562 6,982 16,544 4.6 3.0
Northern Mindanao 14,262 10,289 24,551 5.2 4.4
Davao 16,319 11,230 27,549 5.6 4.9
SOCCSKSARGEN 12,424 8,123 20,547 4.5 3.7
CARAGA 8,410 5,977 14,387 5.5 2.6
ARMM 1,789 1,178 2,967 0.8 0.5
Foreign Country 257 87 344 161.2 0.1
Note: Table is by usual residence
* rate is per 1000 of regional population
** percent share from total deaths
MORTALITY: ALL CAUSES BY SEX & REGIONNumber, Rate/1,000 Population & Percent Distribution
Philippines, 2015
AreaBoth Sexes
83

0 15 30 45 60 75
70 & over65-6960-6455-5950-5445-4940-4435-3930-3425-2920-2415-1910-14
5-91-4
Under 1
Rate
MORTALITY : ALL CAUSES BY AGE GROUPRate / 1,000 Population
Philippines, 2015
Figure 14
Age-Group
84
0 3 6 9 12 15
CALABARZONNCR
Central LuzonWestern VisayasCentral Visayas
BicolIlocos
DavaoNorthern Mindanao
Eastern VisayasSOCCSKSARGEN
Cagayan ValleyZamboanga Peninsula
MIMAROPACARAGA
CARARMM
Rate
MORTALITY : ALL CAUSES BY REGIONPercent Distribution
Philippines, 2015
Figure 15
Region

Table 21
AgeGroup Male Female Male Female
Number Number Number Percent Number Number Number Percent
All Ages 42,603 31,927 74,530 100.0 4,611 3,297 7,908 100.0Under 1 year 2,252 1,559 3,811 5.1 149 108 257 3.21 - 4 yrs. 631 544 1,175 1.6 43 38 81 1.05 - 9 yrs. 304 270 574 0.8 44 37 81 1.010 - 14 yrs. 338 231 569 0.8 40 18 58 0.715 - 19 yrs. 595 332 927 1.2 86 26 112 1.420 - 24 yrs. 1,050 573 1,623 2.2 105 40 145 1.825 - 29 yrs. 1,396 560 1,956 2.6 123 35 158 2.030 - 34 yrs. 1,455 711 2,166 2.9 135 45 180 2.335 - 39 yrs. 1,832 908 2,740 3.7 144 70 214 2.740 - 44 yrs. 2,152 1,170 3,322 4.5 177 77 254 3.245 - 49 yrs. 3,001 1,530 4,531 6.1 272 130 402 5.150 - 54 yrs. 3,694 2,067 5,761 7.7 287 152 439 5.655 - 59 yrs. 4,383 2,423 6,806 9.1 421 210 631 8.060 - 64 yrs. 4,645 2,699 7,344 9.9 426 225 651 8.265 - 69 yrs. 4,570 2,905 7,475 10.0 422 240 662 8.470 yrs. & Over 10,271 13,425 23,696 31.8 1,732 1,845 3,577 45.2Not Stated 34 20 54 0.1 5 1 6 0.1
AgeGroup Male Female Male Female
Number Number Number Percent Number Number Number Percent
All Ages 18,851 15,339 34,190 100.0 11,849 8,363 20,212 100.0Under 1 year 668 501 1,169 3.4 346 235 581 2.91 - 4 yrs. 244 179 423 1.2 152 97 249 1.25 - 9 yrs. 135 116 251 0.7 99 70 169 0.810 - 14 yrs. 158 93 251 0.7 112 61 173 0.915 - 19 yrs. 265 142 407 1.2 204 82 286 1.420 - 24 yrs. 390 194 584 1.7 284 133 417 2.125 - 29 yrs. 451 191 642 1.9 329 114 443 2.230 - 34 yrs. 525 242 767 2.2 374 136 510 2.535 - 39 yrs. 620 294 914 2.7 427 171 598 3.040 - 44 yrs. 762 417 1,179 3.4 543 241 784 3.945 - 49 yrs. 1,055 582 1,637 4.8 676 368 1,044 5.250 - 54 yrs. 1,234 663 1,897 5.5 900 469 1,369 6.855 - 59 yrs. 1,566 827 2,393 7.0 1,090 531 1,621 8.060 - 64 yrs. 1,812 1,072 2,884 8.4 1,247 666 1,913 9.565 - 69 yrs. 2,103 1,213 3,316 9.7 1,221 752 1,973 9.870 yrs. & Over 6,856 8,606 15,462 45.2 3,842 4,235 8,077 40.0Not Stated 7 7 14 0.0 3 2 5 0.0
National Capital Region Cordillera Administrative Region(N.C.R.) (C.A.R.)
MORTALITY: ALL CAUSES BY AGE, SEX & REGIONNumber & Percent Distribution
Philippines, 2015
Both Sexes Both Sexes
Both Sexes Both Sexes
Region 2Cagayan Valley
Region 1Ilocos
85
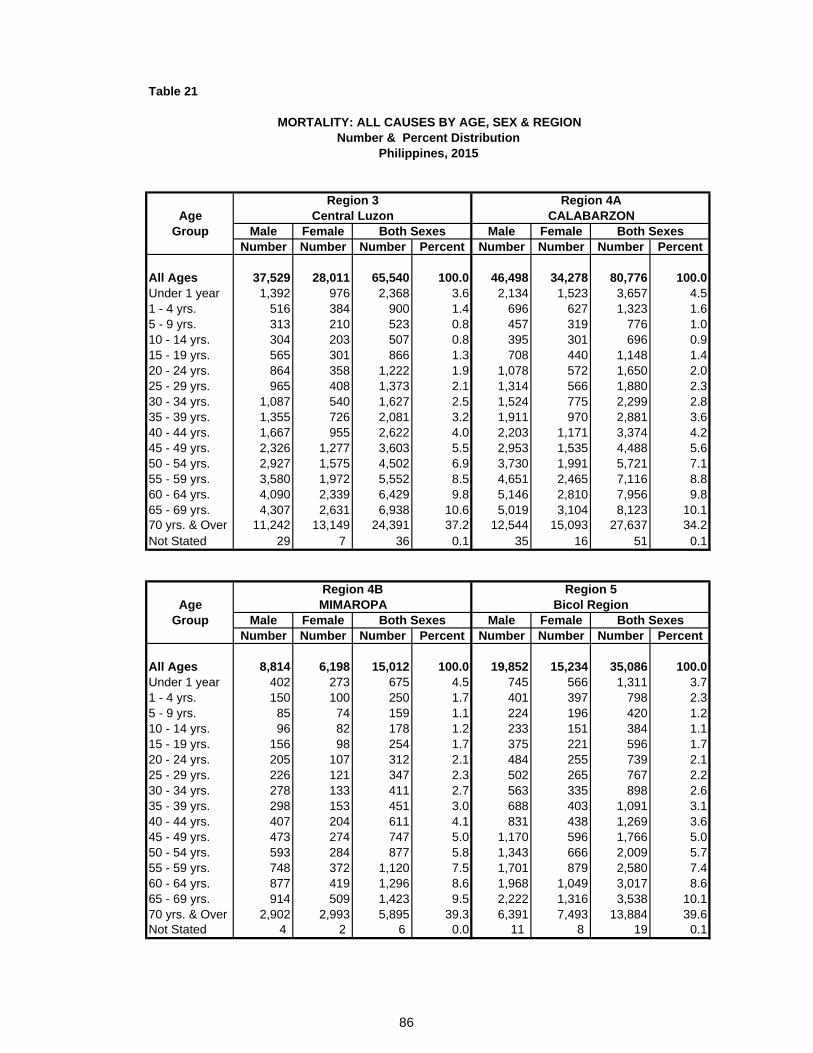
Table 21
AgeGroup Male Female Male Female
Number Number Number Percent Number Number Number Percent
All Ages 37,529 28,011 65,540 100.0 46,498 34,278 80,776 100.0Under 1 year 1,392 976 2,368 3.6 2,134 1,523 3,657 4.51 - 4 yrs. 516 384 900 1.4 696 627 1,323 1.65 - 9 yrs. 313 210 523 0.8 457 319 776 1.010 - 14 yrs. 304 203 507 0.8 395 301 696 0.915 - 19 yrs. 565 301 866 1.3 708 440 1,148 1.420 - 24 yrs. 864 358 1,222 1.9 1,078 572 1,650 2.025 - 29 yrs. 965 408 1,373 2.1 1,314 566 1,880 2.330 - 34 yrs. 1,087 540 1,627 2.5 1,524 775 2,299 2.835 - 39 yrs. 1,355 726 2,081 3.2 1,911 970 2,881 3.640 - 44 yrs. 1,667 955 2,622 4.0 2,203 1,171 3,374 4.245 - 49 yrs. 2,326 1,277 3,603 5.5 2,953 1,535 4,488 5.650 - 54 yrs. 2,927 1,575 4,502 6.9 3,730 1,991 5,721 7.155 - 59 yrs. 3,580 1,972 5,552 8.5 4,651 2,465 7,116 8.860 - 64 yrs. 4,090 2,339 6,429 9.8 5,146 2,810 7,956 9.865 - 69 yrs. 4,307 2,631 6,938 10.6 5,019 3,104 8,123 10.170 yrs. & Over 11,242 13,149 24,391 37.2 12,544 15,093 27,637 34.2Not Stated 29 7 36 0.1 35 16 51 0.1
AgeGroup Male Female Male Female
Number Number Number Percent Number Number Number Percent
All Ages 8,814 6,198 15,012 100.0 19,852 15,234 35,086 100.0Under 1 year 402 273 675 4.5 745 566 1,311 3.71 - 4 yrs. 150 100 250 1.7 401 397 798 2.35 - 9 yrs. 85 74 159 1.1 224 196 420 1.210 - 14 yrs. 96 82 178 1.2 233 151 384 1.115 - 19 yrs. 156 98 254 1.7 375 221 596 1.720 - 24 yrs. 205 107 312 2.1 484 255 739 2.125 - 29 yrs. 226 121 347 2.3 502 265 767 2.230 - 34 yrs. 278 133 411 2.7 563 335 898 2.635 - 39 yrs. 298 153 451 3.0 688 403 1,091 3.140 - 44 yrs. 407 204 611 4.1 831 438 1,269 3.645 - 49 yrs. 473 274 747 5.0 1,170 596 1,766 5.050 - 54 yrs. 593 284 877 5.8 1,343 666 2,009 5.755 - 59 yrs. 748 372 1,120 7.5 1,701 879 2,580 7.460 - 64 yrs. 877 419 1,296 8.6 1,968 1,049 3,017 8.665 - 69 yrs. 914 509 1,423 9.5 2,222 1,316 3,538 10.170 yrs. & Over 2,902 2,993 5,895 39.3 6,391 7,493 13,884 39.6Not Stated 4 2 6 0.0 11 8 19 0.1
Both SexesMIMAROPA Bicol Region
Both Sexes
MORTALITY: ALL CAUSES BY AGE, SEX & REGIONNumber & Percent Distribution
Philippines, 2015
Region 4B Region 5
Both Sexes
Region 3Central Luzon
Region 4ACALABARZON
Both Sexes
86

Table 21
AgeGroup Male Female Male Female
Number Number Number Percent Number Number Number Percent
All Ages 28,404 21,306 49,710 100.0 26,274 20,822 47,096 100.0Under 1 year 748 617 1,365 2.7 903 685 1,588 3.41 - 4 yrs. 307 280 587 1.2 406 363 769 1.65 - 9 yrs. 227 150 377 0.8 237 196 433 0.910 - 14 yrs. 228 143 371 0.7 188 176 364 0.815 - 19 yrs. 378 215 593 1.2 350 245 595 1.320 - 24 yrs. 609 264 873 1.8 576 315 891 1.925 - 29 yrs. 743 285 1,028 2.1 715 354 1,069 2.330 - 34 yrs. 850 370 1,220 2.5 829 361 1,190 2.535 - 39 yrs. 1,039 416 1,455 2.9 980 496 1,476 3.140 - 44 yrs. 1,213 557 1,770 3.6 1,165 614 1,779 3.845 - 49 yrs. 1,679 754 2,433 4.9 1,543 788 2,331 4.950 - 54 yrs. 2,001 966 2,967 6.0 1,817 1,076 2,893 6.155 - 59 yrs. 2,440 1,226 3,666 7.4 2,186 1,226 3,412 7.260 - 64 yrs. 2,874 1,483 4,357 8.8 2,456 1,551 4,007 8.565 - 69 yrs. 2,965 1,751 4,716 9.5 2,694 1,800 4,494 9.570 yrs. & Over 10,096 11,820 21,916 44.1 9,218 10,572 19,790 42.0Not Stated 7 9 16 0.0 11 4 15 0.0
AgeGroup Male Female Male Female
Number Number Number Percent Number Number Number Percent
All Ages 13,316 10,340 23,656 100.0 9,562 6,982 16,544 100.0Under 1 year 352 211 563 2.4 323 206 529 3.21 - 4 yrs. 160 150 310 1.3 143 133 276 1.75 - 9 yrs. 118 86 204 0.9 99 82 181 1.110 - 14 yrs. 114 104 218 0.9 89 70 159 1.015 - 19 yrs. 232 124 356 1.5 127 89 216 1.320 - 24 yrs. 302 162 464 2.0 215 111 326 2.025 - 29 yrs. 351 173 524 2.2 250 114 364 2.230 - 34 yrs. 355 177 532 2.2 355 188 543 3.335 - 39 yrs. 464 227 691 2.9 406 170 576 3.540 - 44 yrs. 539 297 836 3.5 451 236 687 4.245 - 49 yrs. 703 404 1,107 4.7 609 329 938 5.750 - 54 yrs. 836 447 1,283 5.4 719 418 1,137 6.955 - 59 yrs. 1,092 591 1,683 7.1 863 485 1,348 8.160 - 64 yrs. 1,285 709 1,994 8.4 951 560 1,511 9.165 - 69 yrs. 1,396 968 2,364 10.0 929 605 1,534 9.370 yrs. & Over 5,008 5,506 10,514 44.4 3,015 3,183 6,198 37.5Not Stated 9 4 13 0.1 18 3 21 0.1
Region 7Western Visayas Central Visayas
Region 6
Both Sexes Both Sexes
Both Sexes
Region 8 Region 9Eastern Visayas Zamboanga Peninsula
MORTALITY: ALL CAUSES BY AGE, SEX & REGIONNumber & Percent Distribution
Philippines, 2015
Both Sexes
87

Table 21
AgeGroup Male Female Male Female
Number Number Number Percent Number Number Number Percent
All Ages 14,262 10,289 24,551 100.0 16,319 11,230 27,549 100.0Under 1 year 462 344 806 3.3 515 377 892 3.21 - 4 yrs. 219 201 420 1.7 242 172 414 1.55 - 9 yrs. 139 126 265 1.1 163 115 278 1.010 - 14 yrs. 122 79 201 0.8 119 108 227 0.815 - 19 yrs. 235 122 357 1.5 262 148 410 1.520 - 24 yrs. 374 184 558 2.3 420 190 610 2.225 - 29 yrs. 465 146 611 2.5 540 225 765 2.830 - 34 yrs. 481 212 693 2.8 558 259 817 3.035 - 39 yrs. 537 276 813 3.3 662 350 1,012 3.740 - 44 yrs. 703 346 1,049 4.3 766 414 1,180 4.345 - 49 yrs. 860 442 1,302 5.3 954 546 1,500 5.450 - 54 yrs. 1,025 609 1,634 6.7 1,324 674 1,998 7.355 - 59 yrs. 1,294 730 2,024 8.2 1,481 895 2,376 8.660 - 64 yrs. 1,447 828 2,275 9.3 1,700 931 2,631 9.665 - 69 yrs. 1,469 882 2,351 9.6 1,664 1,026 2,690 9.870 yrs. & Over 4,423 4,759 9,182 37.4 4,948 4,798 9,746 35.4Not Stated 7 3 10 0.0 1 2 3 0.0
AgeGroup Male Female Male Female
Number Number Number Percent Number Number Number Percent
All Ages 12,424 8,123 20,547 100.0 1,789 1,178 2,967 100.0Under 1 year 368 269 637 3.1 111 85 196 6.61 - 4 yrs. 188 147 335 1.6 42 27 69 2.35 - 9 yrs. 112 81 193 0.9 15 19 34 1.110 - 14 yrs. 112 87 199 1.0 24 11 35 1.215 - 19 yrs. 231 99 330 1.6 44 25 69 2.320 - 24 yrs. 320 152 472 2.3 48 24 72 2.425 - 29 yrs. 408 167 575 2.8 72 39 111 3.730 - 34 yrs. 411 179 590 2.9 69 41 110 3.735 - 39 yrs. 565 214 779 3.8 99 55 154 5.240 - 44 yrs. 665 299 964 4.7 108 74 182 6.145 - 49 yrs. 807 407 1,214 5.9 131 78 209 7.050 - 54 yrs. 1,002 434 1,436 7.0 138 83 221 7.455 - 59 yrs. 1,094 578 1,672 8.1 163 100 263 8.960 - 64 yrs. 1,247 673 1,920 9.3 174 79 253 8.565 - 69 yrs. 1,208 714 1,922 9.4 160 99 259 8.770 yrs. & Over 3,682 3,620 7,302 35.5 387 334 721 24.3Not Stated 4 3 7 0.0 4 5 9 0.3
Region 10 Region 11Davao
Both Sexes Both Sexes
MORTALITY: ALL CAUSES BY AGE, SEX & REGIONNumber & Percent Distribution
Philippines, 2015
Northern Mindanao
Both Sexes Both Sexes
Autonomous Region for Muslim Mindanao
(A.R.M.M.)Region 12
SOCCSKSARGEN
88
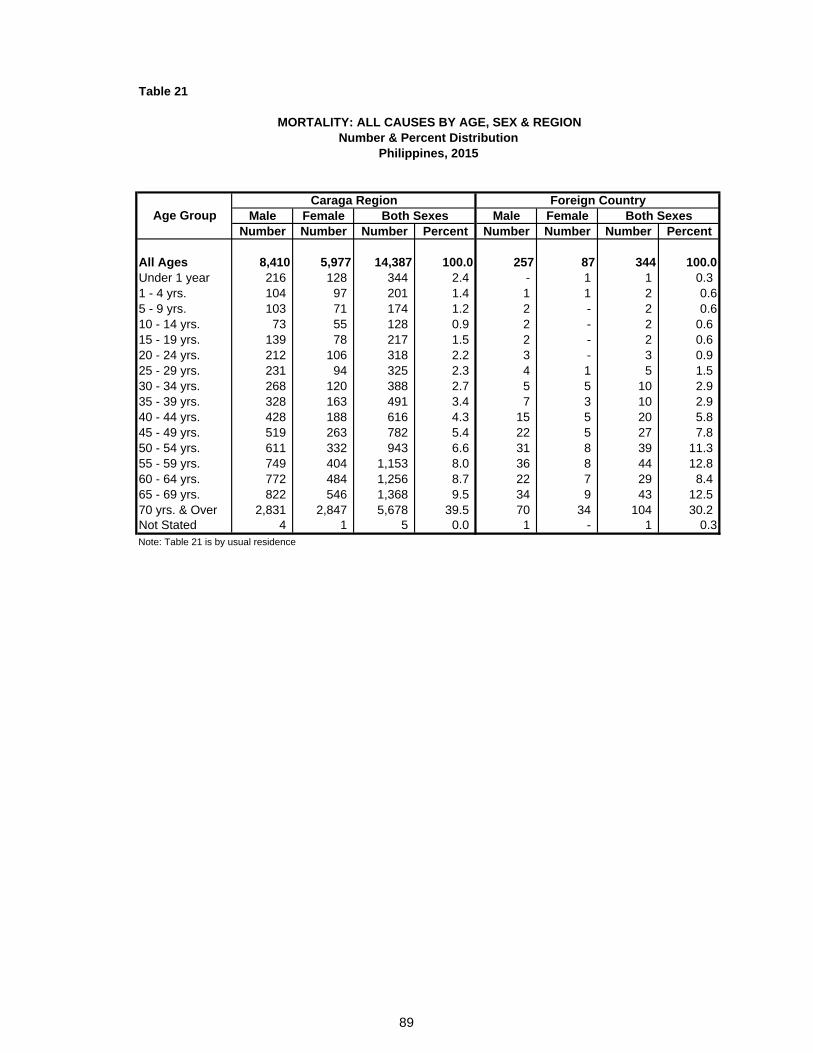
Table 21
Male Female Male FemaleNumber Number Number Percent Number Number Number Percent
All Ages 8,410 5,977 14,387 100.0 257 87 344 100.0Under 1 year 216 128 344 2.4 - 1 1 0.3 1 - 4 yrs. 104 97 201 1.4 1 1 2 0.65 - 9 yrs. 103 71 174 1.2 2 - 2 0.610 - 14 yrs. 73 55 128 0.9 2 - 2 0.6 15 - 19 yrs. 139 78 217 1.5 2 - 2 0.6 20 - 24 yrs. 212 106 318 2.2 3 - 3 0.9 25 - 29 yrs. 231 94 325 2.3 4 1 5 1.5 30 - 34 yrs. 268 120 388 2.7 5 5 10 2.9 35 - 39 yrs. 328 163 491 3.4 7 3 10 2.9 40 - 44 yrs. 428 188 616 4.3 15 5 20 5.8 45 - 49 yrs. 519 263 782 5.4 22 5 27 7.8 50 - 54 yrs. 611 332 943 6.6 31 8 39 11.3 55 - 59 yrs. 749 404 1,153 8.0 36 8 44 12.8 60 - 64 yrs. 772 484 1,256 8.7 22 7 29 8.4 65 - 69 yrs. 822 546 1,368 9.5 34 9 43 12.5 70 yrs. & Over 2,831 2,847 5,678 39.5 70 34 104 30.2 Not Stated 4 1 5 0.0 1 - 1 0.3Note: Table 21 is by usual residence
Foreign CountryBoth Sexes
MORTALITY: ALL CAUSES BY AGE, SEX & REGIONNumber & Percent Distribution
Philippines, 2015
Age GroupCaraga Region
Both Sexes
89
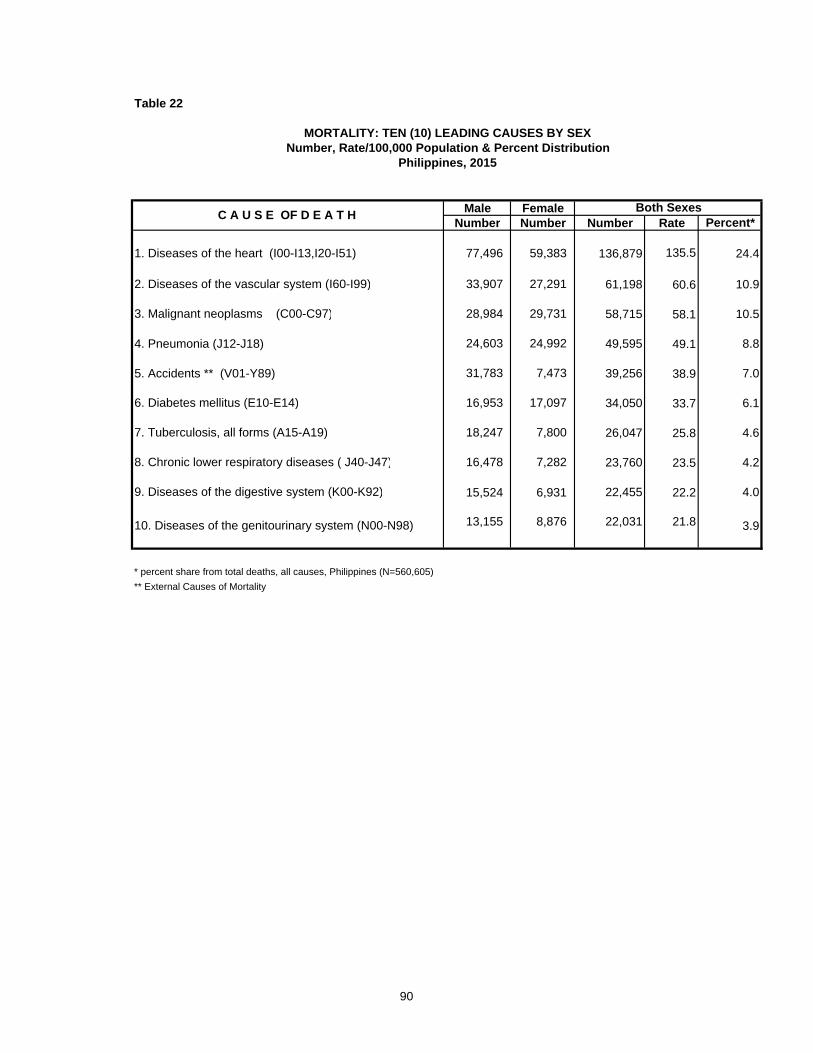
Table 22
Male FemaleNumber Number Number Rate Percent*
1. Diseases of the heart (I00-I13,I20-I51) 77,496 59,383 136,879 135.5 24.4
2. Diseases of the vascular system (I60-I99) 33,907 27,291 61,198 60.6 10.9
3. Malignant neoplasms (C00-C97) 28,984 29,731 58,715 58.1 10.5
4. Pneumonia (J12-J18) 24,603 24,992 49,595 49.1 8.8
5. Accidents ** (V01-Y89) 31,783 7,473 39,256 38.9 7.0
6. Diabetes mellitus (E10-E14) 16,953 17,097 34,050 33.7 6.1
7. Tuberculosis, all forms (A15-A19) 18,247 7,800 26,047 25.8 4.6
8. Chronic lower respiratory diseases ( J40-J47) 16,478 7,282 23,760 23.5 4.2
9. Diseases of the digestive system (K00-K92) 15,524 6,931 22,455 22.2 4.0
10. Diseases of the genitourinary system (N00-N98) 13,155 8,876 22,031 21.8 3.9
* percent share from total deaths, all causes, Philippines (N=560,605)
** External Causes of Mortality
C A U S E OF D E A T H Both Sexes
MORTALITY: TEN (10) LEADING CAUSES BY SEXNumber, Rate/100,000 Population & Percent Distribution
Philippines, 2015
90
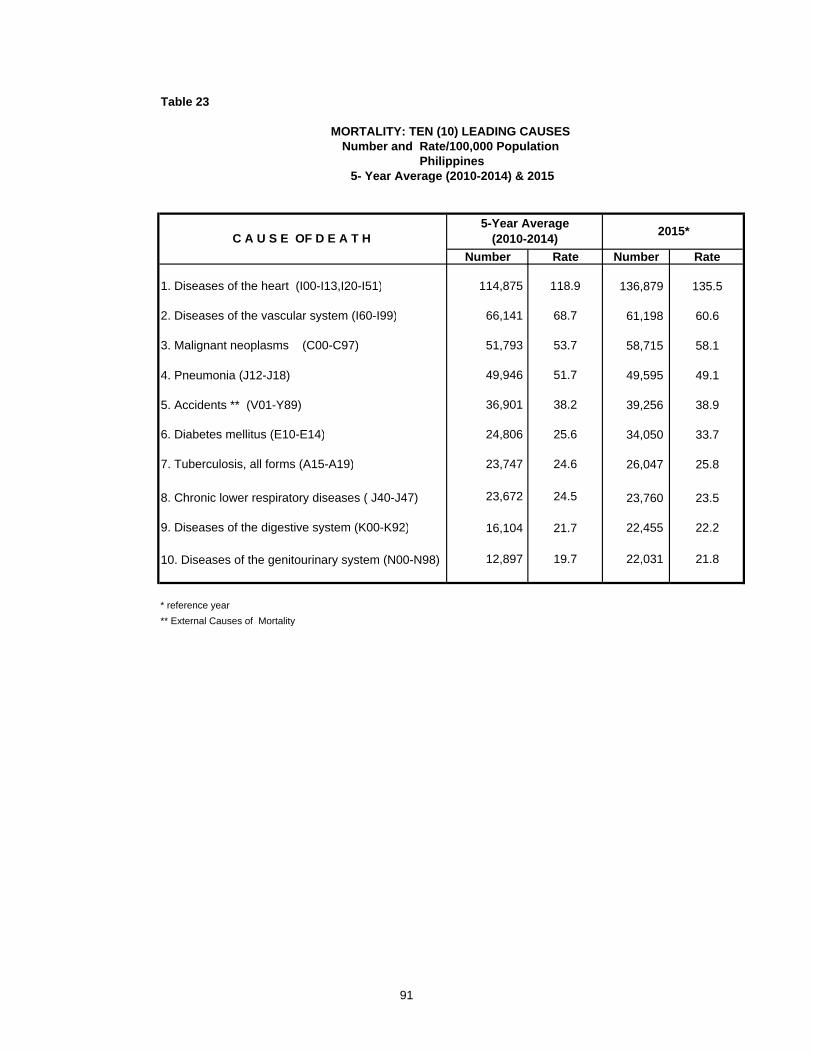
Table 23
Number Rate Number Rate
1. Diseases of the heart (I00-I13,I20-I51) 114,875 118.9 136,879 135.5
2. Diseases of the vascular system (I60-I99) 66,141 68.7 61,198 60.6
3. Malignant neoplasms (C00-C97) 51,793 53.7 58,715 58.1
4. Pneumonia (J12-J18) 49,946 51.7 49,595 49.1
5. Accidents ** (V01-Y89) 36,901 38.2 39,256 38.9
6. Diabetes mellitus (E10-E14) 24,806 25.6 34,050 33.7
7. Tuberculosis, all forms (A15-A19) 23,747 24.6 26,047 25.8
8. Chronic lower respiratory diseases ( J40-J47) 23,672 24.5 23,760 23.5
9. Diseases of the digestive system (K00-K92) 16,104 21.7 22,455 22.2
10. Diseases of the genitourinary system (N00-N98) 12,897 19.7 22,031 21.8
* reference year
** External Causes of Mortality
C A U S E OF D E A T H
MORTALITY: TEN (10) LEADING CAUSES Number and Rate/100,000 Population
Philippines5- Year Average (2010-2014) & 2015
5-Year Average (2010-2014)
2015*
91

0 5 10 15 20 25
Disease of the Heart
Disease of the Vascular System
Malignant Neoplasm
Pneumonia
Accidents
Diabetes Mellitus
TB All Forms
Chronic lower respiratorydiseases
Diseases of the Digestive System
Diseases of the GenitourinarySystem
Leading Causes
MORTALITY: TEN (10) LEADING CAUSESPercent Distribution
Philippines, 2015
Percent
Figure 16
0 5 10 15 20 25
Disease of the heart
Disease of the vascular system
Accidents
Malignant neoplasm
Pneumonia
TB all forms
Diabetes mellitus
Chronic lower respiratory diseases
Diseases of the digestive system
Diseases of the genitourinary system
Female Male
Percent
MORTALITY: TEN (10) LEADING CAUSES BY SEXPercent Distribution
Philippines, 2015
Leading Causes
Figure 17
92

Table 24
Cause Number Percent* Rate
1. Diseases of the heart (I00-I13,I20-I51) 77,496 24.1 151.7
2. Diseases of the vascular system (I60-I99) 33,907 10.5 66.4
3. Accidents ** (V01-Y89) 31,783 9.9 62.2
4. Malignant neoplasms (C00-C97) 28,984 9.0 56.8
5. Pneumonia (J12-J18) 24,603 7.6 48.2
6. Tuberculosis, all forms (A15-A19) 18,247 5.7 35.7
7. Diabetes mellitus (E10-E14) 16,953 5.3 33.2
8. Chronic lower respiratory diseases ( J40-J47) 16,478 5.1 32.3
9. Diseases of the digestive system (K00-K92) 15,524 4.8 30.4
10. Diseases of the genitourinary system (N00-N98) 13,155 4.1 25.8
** External Causes of Mortality
* percent share from total male deaths, all causes, Philippines (N=321,624)
TEN (10) LEADING CAUSES OF MORTALITY AMONG MALESNumber, Percent & Rate /100,000 Male Population
Philippines, 2015
93
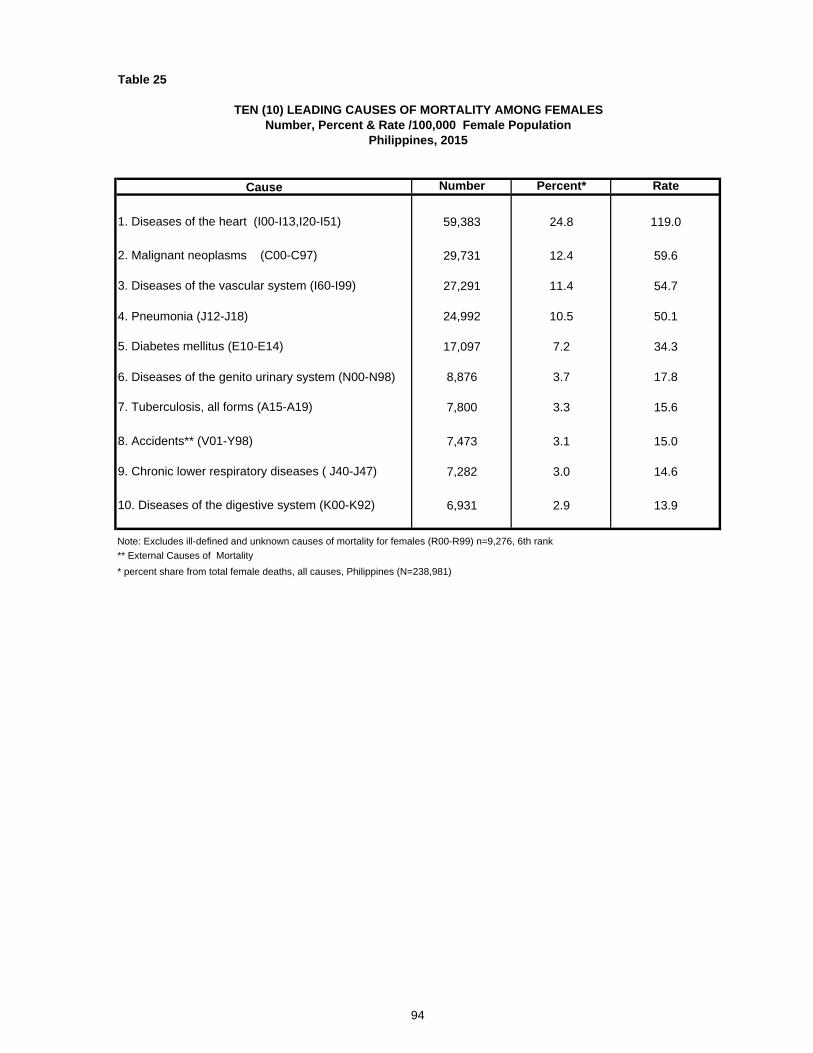
Table 25
Cause Number Percent* Rate
1. Diseases of the heart (I00-I13,I20-I51) 59,383 24.8 119.0
2. Malignant neoplasms (C00-C97) 29,731 12.4 59.6
3. Diseases of the vascular system (I60-I99) 27,291 11.4 54.7
4. Pneumonia (J12-J18) 24,992 10.5 50.1
5. Diabetes mellitus (E10-E14) 17,097 7.2 34.3
6. Diseases of the genito urinary system (N00-N98) 8,876 3.7 17.8
7. Tuberculosis, all forms (A15-A19) 7,800 3.3 15.6
8. Accidents** (V01-Y98) 7,473 3.1 15.0
9. Chronic lower respiratory diseases ( J40-J47) 7,282 3.0 14.6
10. Diseases of the digestive system (K00-K92) 6,931 2.9 13.9
** External Causes of Mortality
* percent share from total female deaths, all causes, Philippines (N=238,981)
Note: Excludes ill-defined and unknown causes of mortality for females (R00-R99) n=9,276, 6th rank
TEN (10) LEADING CAUSES OF MORTALITY AMONG FEMALESNumber, Percent & Rate /100,000 Female Population
Philippines, 2015
94

Table 26
TotalDeaths Number Percent Number Percent Number Percent
1. Diseases of the heart (I00-I13,I20-I51) 136,879 49,817 36.4 86,677 63.3 385 0.3
2. Diseases of the vascular system (I60-I99) 61,198 27,584 45.1 33,478 54.7 136 0.2
3. Malignant neoplasms (C00-C97) 58,715 23,421 39.9 35,166 59.9 128 0.2
4. Pneumonia (J12-J18) 49,595 15,135 30.5 34,334 69.2 126 0.3
5. Accidents * (V01-Y89) 39,256 14,638 37.3 24,461 62.3 157 0.4
6. Diabetes mellitus (E10-E14) 34,050 14,924 43.8 19,034 55.9 92 0.3
7. Tuberculosis, all forms (A15-A19) 26,047 11,932 45.8 14,064 54.0 51 0.2
8. Chronic lower respiratory diseases ( J40-J47) 23,760 6,701 28.2 17,004 71.6 55 0.2
9. Diseases of the digestive system (K00-K92) 22,455 10,456 46.6 11,950 53.2 49 0.2
10. Diseases of the genitourinary system (N00-N98) 22,031 10,070 45.7 11,909 54.1 52 0.2
* External Causes of Mortality
Cause
MORTALITY: TEN (10) LEADING CAUSES BY ATTENDANCENumber & Percent Distribution
Philippines, 2015
Attended Not StatedNot Attended
95
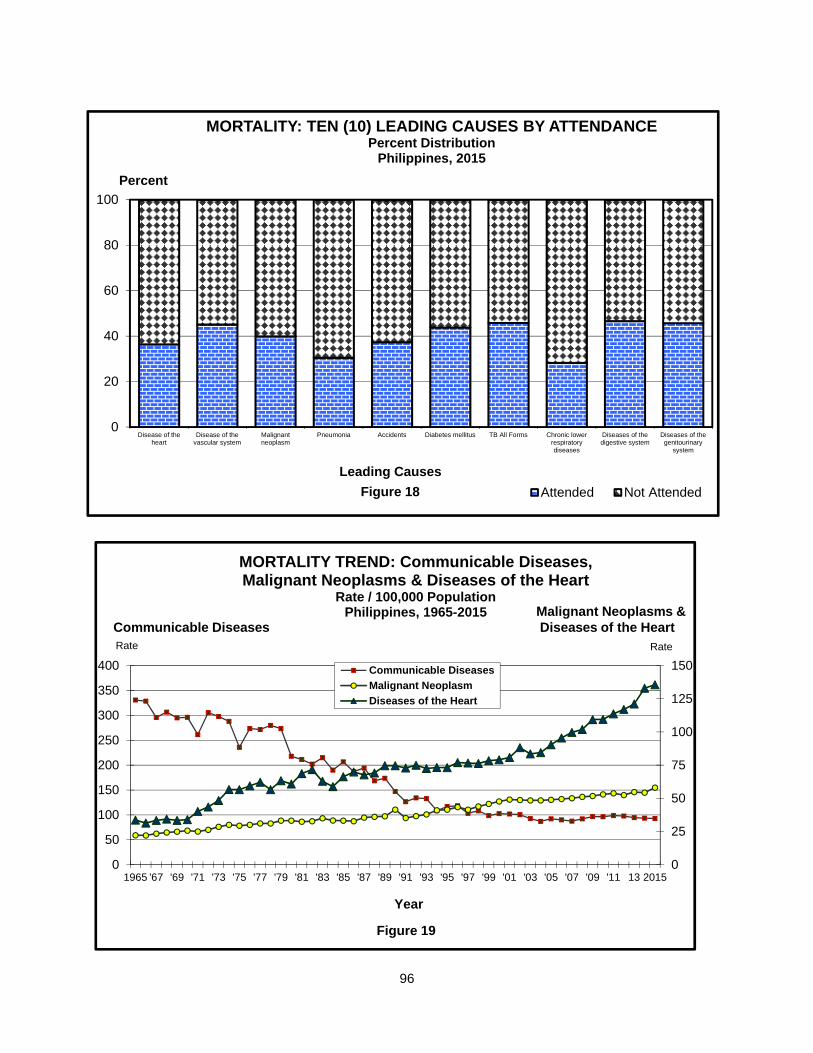
0
25
50
75
100
125
150
0
50
100
150
200
250
300
350
400
1965 '67 '69 '71 '73 '75 '77 '79 '81 '83 '85 '87 '89 '91 '93 '95 '97 '99 '01 '03 '05 '07 '09 '11 13 2015
RateRate
Year
MORTALITY TREND: Communicable Diseases, Malignant Neoplasms & Diseases of the Heart
Rate / 100,000 PopulationPhilippines, 1965-2015
Communicable Diseases
Malignant Neoplasm
Diseases of the Heart
Figure 19
Communicable DiseasesMalignant Neoplasms &Diseases of the Heart
0
20
40
60
80
100
Disease of theheart
Disease of thevascular system
Malignantneoplasm
Pneumonia Accidents Diabetes mellitus TB All Forms Chronic lowerrespiratorydiseases
Diseases of thedigestive system
Diseases of thegenitourinary
system
Leading Causes
MORTALITY: TEN (10) LEADING CAUSES BY ATTENDANCEPercent Distribution
Philippines, 2015
Attended Not AttendedFigure 18
Percent
96

Table 27
TotalNumber Percent Number Percent Number Percent
PHILIPPINES 560,605 227,217 40.5 331,874 59.2 1,514 0.3
NATIONAL CAPITAL REGION 74,530 40,289 54.1 33,876 45.5 365 0.5
City of Manila 12,625 6,945 55.0 5,668 44.9 12 0.1City of Mandaluyong 2,230 1,266 56.8 961 43.1 3 0.1City of Marikina 2,975 1,998 67.2 892 30.0 85 2.9City of Pasig 3,982 2,423 60.8 1,557 39.1 2 0.1Quezon City 16,073 8,236 51.2 7,644 47.6 193 1.2City of San Juan 837 635 75.9 200 23.9 2 0.2Kalookan City 8,384 3,739 44.6 4,636 55.3 9 0.1City of Malabon 2,398 972 40.5 1,425 59.4 1 0.0City of Navotas 1,732 678 39.1 1,053 60.8 1 0.1City of Valenzuela 3,700 1,709 46.2 1,989 53.8 2 0.1City of Las Piñas 3,529 2,301 65.2 1,209 34.3 19 0.5City of Makati 3,218 2,093 65.0 1,123 34.9 2 0.1City of Muntinlupa 2,712 1,481 54.6 1,229 45.3 2 0.1City of Parañaque 3,640 1,956 53.7 1,654 45.4 30 0.8Pasay City 2,412 1,514 62.8 898 37.2 - 0.0Pateros 451 290 64.3 161 35.7 - 0.0City of Taguig 3,632 2,053 56.5 1,577 43.4 2 0.1
CAR 7,909 3,061 38.7 4,832 61.1 15 0.2
Abra 1,551 575 37.1 972 62.7 4 0.3Apayao 461 172 37.3 281 61.0 8 1.7Benguet 1,892 645 34.1 1,247 65.9 - 0.0Ifugao 737 230 31.2 507 68.8 - 0.0Kalinga 831 286 34.4 544 65.5 1 0.1Mt. Province 864 251 29.1 611 70.7 2 0.2
Baguio City 1,573 903 57.4 670 42.6 - 0.0
REGION I - ILOCOS 34,190 12,528 36.6 21,573 63.1 89 0.3
Ilocos Norte 3,162 1,258 39.8 1,904 60.2 - 0.0Ilocos Sur 4,053 1,890 46.6 2,162 53.3 1 0.0La Union 4,338 1,837 42.3 2,497 57.6 4 0.1Pangasinan 15,731 4,628 29.4 11,023 70.1 80 0.5
City of Batac 409 202 49.4 207 50.6 - 0.0Laoag City 751 329 43.8 422 56.2 - 0.0City of Candon 450 206 45.8 244 54.2 - 0.0City of Vigan 406 222 54.7 184 45.3 - 0.0City of San Fernando 797 385 48.3 412 51.7 - 0.0City of Alaminos 695 250 36.0 442 63.6 3 0.4Dagupan City 1,253 598 47.7 655 52.3 - 0.0San Carlos City 1,197 376 31.4 821 68.6 - 0.0City of Urdaneta 948 347 36.6 600 63.3 1 0.1
AreaAttendance
MORTALITY BY ATTENDANCE, REGION, PROVINCE & CITYNumber & Percent Distribution
Philippines, 2015
Attended Not StatedNot Attended
97
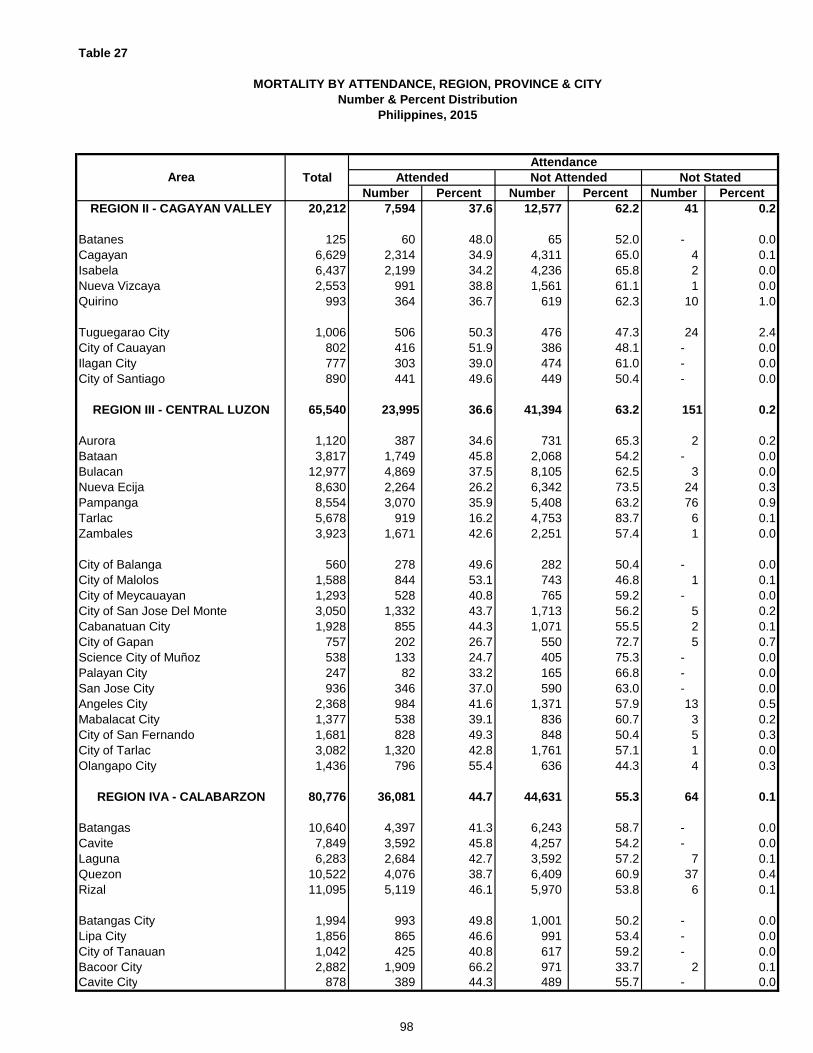
Table 27
TotalNumber Percent Number Percent Number Percent
AreaAttendance
MORTALITY BY ATTENDANCE, REGION, PROVINCE & CITYNumber & Percent Distribution
Philippines, 2015
Attended Not StatedNot Attended
REGION II - CAGAYAN VALLEY 20,212 7,594 37.6 12,577 62.2 41 0.2
Batanes 125 60 48.0 65 52.0 - 0.0Cagayan 6,629 2,314 34.9 4,311 65.0 4 0.1Isabela 6,437 2,199 34.2 4,236 65.8 2 0.0Nueva Vizcaya 2,553 991 38.8 1,561 61.1 1 0.0Quirino 993 364 36.7 619 62.3 10 1.0
Tuguegarao City 1,006 506 50.3 476 47.3 24 2.4City of Cauayan 802 416 51.9 386 48.1 - 0.0Ilagan City 777 303 39.0 474 61.0 - 0.0City of Santiago 890 441 49.6 449 50.4 - 0.0
REGION III - CENTRAL LUZON 65,540 23,995 36.6 41,394 63.2 151 0.2
Aurora 1,120 387 34.6 731 65.3 2 0.2Bataan 3,817 1,749 45.8 2,068 54.2 - 0.0Bulacan 12,977 4,869 37.5 8,105 62.5 3 0.0Nueva Ecija 8,630 2,264 26.2 6,342 73.5 24 0.3Pampanga 8,554 3,070 35.9 5,408 63.2 76 0.9Tarlac 5,678 919 16.2 4,753 83.7 6 0.1Zambales 3,923 1,671 42.6 2,251 57.4 1 0.0
City of Balanga 560 278 49.6 282 50.4 - 0.0City of Malolos 1,588 844 53.1 743 46.8 1 0.1City of Meycauayan 1,293 528 40.8 765 59.2 - 0.0City of San Jose Del Monte 3,050 1,332 43.7 1,713 56.2 5 0.2Cabanatuan City 1,928 855 44.3 1,071 55.5 2 0.1City of Gapan 757 202 26.7 550 72.7 5 0.7Science City of Muñoz 538 133 24.7 405 75.3 - 0.0Palayan City 247 82 33.2 165 66.8 - 0.0San Jose City 936 346 37.0 590 63.0 - 0.0Angeles City 2,368 984 41.6 1,371 57.9 13 0.5Mabalacat City 1,377 538 39.1 836 60.7 3 0.2City of San Fernando 1,681 828 49.3 848 50.4 5 0.3City of Tarlac 3,082 1,320 42.8 1,761 57.1 1 0.0Olangapo City 1,436 796 55.4 636 44.3 4 0.3
REGION IVA - CALABARZON 80,776 36,081 44.7 44,631 55.3 64 0.1
Batangas 10,640 4,397 41.3 6,243 58.7 - 0.0Cavite 7,849 3,592 45.8 4,257 54.2 - 0.0Laguna 6,283 2,684 42.7 3,592 57.2 7 0.1Quezon 10,522 4,076 38.7 6,409 60.9 37 0.4Rizal 11,095 5,119 46.1 5,970 53.8 6 0.1
Batangas City 1,994 993 49.8 1,001 50.2 - 0.0Lipa City 1,856 865 46.6 991 53.4 - 0.0City of Tanauan 1,042 425 40.8 617 59.2 - 0.0Bacoor City 2,882 1,909 66.2 971 33.7 2 0.1Cavite City 878 389 44.3 489 55.7 - 0.0
98

Table 27
TotalNumber Percent Number Percent Number Percent
AreaAttendance
MORTALITY BY ATTENDANCE, REGION, PROVINCE & CITYNumber & Percent Distribution
Philippines, 2015
Attended Not StatedNot Attended
City of Dasmariñas 3,485 1,189 34.1 2,296 65.9 - 0.0City of General Trias 1,249 422 33.8 827 66.2 - 0.0Imus City 1,913 1,026 53.6 886 46.3 1 0.1Tagaytay City 329 233 70.8 96 29.2 - 0.0Trece Martires City 700 387 55.3 313 44.7 - 0.0City of Biñan 1,760 788 44.8 972 55.2 0 0.0Cabuyao City 1,404 607 43.2 797 56.8 - 0.0City of Calamba 2,569 1,197 46.6 1,372 53.4 0 0.0San Pablo City 1,772 738 41.6 1,033 58.3 1 0.1City of San Pedro 1,824 833 45.7 988 54.2 3 0.2City of Santa Rosa 1,793 1,042 58.1 750 41.8 1 0.1City of Tayabas 620 209 33.7 411 66.3 - 0.0Lucena City 1,818 1,000 55.0 816 44.9 2 0.1City of Antipolo 4,499 1,961 43.6 2,534 56.3 4 0.1
REGION IVB - MIMAROPA 15,012 5,157 34.4 9,727 64.8 128 0.9
Marinduque 1,679 502 29.9 1,172 69.8 5 0.3Occidental Mindoro 2,400 856 35.7 1,530 63.8 14 0.6Oriental Mindoro 3,693 1,101 29.8 2,527 68.4 65 1.8Palawan 3,217 1,102 34.3 2,113 65.7 2 0.1Romblon 1,968 642 32.6 1,319 67.0 7 0.4
Calapan City 869 366 42.1 468 53.9 35 4.0Puerto Princesa City 1,186 588 49.6 598 50.4 - 0.0
REGION V - BICOL 35,086 12,857 36.6 22,155 63.1 74 0.2
Albay 5,464 2,343 42.9 3,073 56.2 48 0.9Camarines Norte 3,747 1,302 34.7 2,443 65.2 2 0.1Camarines Sur 9,643 2,912 30.2 6,718 69.7 13 0.1Catanduanes 1,782 668 37.5 1,113 62.5 1 0.1Masbate 3,499 868 24.8 2,626 75.1 5 0.1Sorsogon 3,892 1,169 30.0 2,722 69.9 1 0.0
Legazpi City 1,502 1,080 71.9 422 28.1 - 0.0City of Ligao 728 519 71.3 209 28.7 - 0.0City of Tabaco 889 342 38.5 546 61.4 1 0.1Iriga City 757 244 32.2 511 67.5 2 0.3Naga City 1,345 668 49.7 676 50.3 1 0.1City of Masbate 650 259 39.8 391 60.2 - 0.0City of Sorsogon 1,188 483 40.7 705 59.3 - 0.0
REGION VI - WESTERN VISAYAS 49,711 20,337 40.9 29,254 58.8 120 0.2
Aklan 3,727 1,628 43.7 2,096 56.2 3 0.1Antique 3,992 1,363 34.1 2,628 65.8 1 0.0Capiz 3,529 1,149 32.6 2,379 67.4 1 0.0Guimaras 1,010 401 39.7 609 60.3 - 0.0Iloilo 12,064 4,776 39.6 7,209 59.8 79 0.7Negros Occidental 6,678 2,454 36.7 4,215 63.1 9 0.1
99
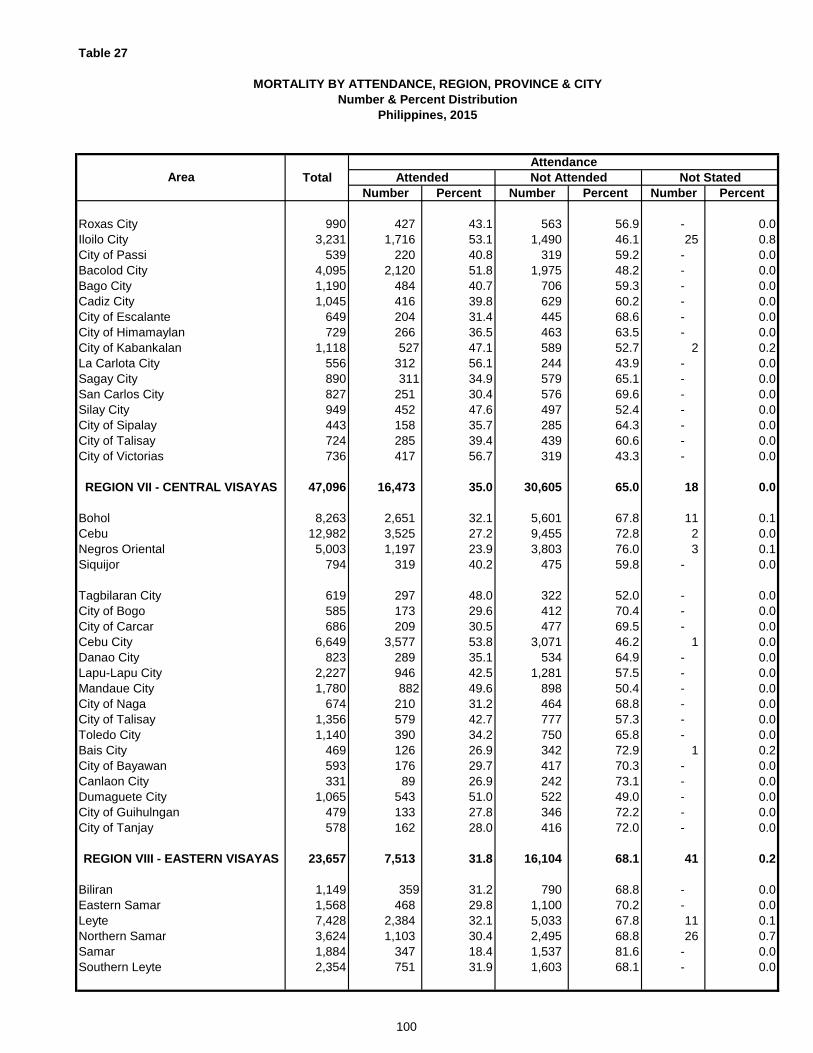
Table 27
TotalNumber Percent Number Percent Number Percent
AreaAttendance
MORTALITY BY ATTENDANCE, REGION, PROVINCE & CITYNumber & Percent Distribution
Philippines, 2015
Attended Not StatedNot Attended
Roxas City 990 427 43.1 563 56.9 - 0.0Iloilo City 3,231 1,716 53.1 1,490 46.1 25 0.8City of Passi 539 220 40.8 319 59.2 - 0.0Bacolod City 4,095 2,120 51.8 1,975 48.2 - 0.0Bago City 1,190 484 40.7 706 59.3 - 0.0Cadiz City 1,045 416 39.8 629 60.2 - 0.0City of Escalante 649 204 31.4 445 68.6 - 0.0City of Himamaylan 729 266 36.5 463 63.5 - 0.0City of Kabankalan 1,118 527 47.1 589 52.7 2 0.2La Carlota City 556 312 56.1 244 43.9 - 0.0Sagay City 890 311 34.9 579 65.1 - 0.0San Carlos City 827 251 30.4 576 69.6 - 0.0Silay City 949 452 47.6 497 52.4 - 0.0City of Sipalay 443 158 35.7 285 64.3 - 0.0City of Talisay 724 285 39.4 439 60.6 - 0.0City of Victorias 736 417 56.7 319 43.3 - 0.0
REGION VII - CENTRAL VISAYAS 47,096 16,473 35.0 30,605 65.0 18 0.0
Bohol 8,263 2,651 32.1 5,601 67.8 11 0.1Cebu 12,982 3,525 27.2 9,455 72.8 2 0.0Negros Oriental 5,003 1,197 23.9 3,803 76.0 3 0.1Siquijor 794 319 40.2 475 59.8 - 0.0
Tagbilaran City 619 297 48.0 322 52.0 - 0.0City of Bogo 585 173 29.6 412 70.4 - 0.0City of Carcar 686 209 30.5 477 69.5 - 0.0Cebu City 6,649 3,577 53.8 3,071 46.2 1 0.0Danao City 823 289 35.1 534 64.9 - 0.0Lapu-Lapu City 2,227 946 42.5 1,281 57.5 - 0.0Mandaue City 1,780 882 49.6 898 50.4 - 0.0City of Naga 674 210 31.2 464 68.8 - 0.0City of Talisay 1,356 579 42.7 777 57.3 - 0.0Toledo City 1,140 390 34.2 750 65.8 - 0.0Bais City 469 126 26.9 342 72.9 1 0.2City of Bayawan 593 176 29.7 417 70.3 - 0.0Canlaon City 331 89 26.9 242 73.1 - 0.0Dumaguete City 1,065 543 51.0 522 49.0 - 0.0City of Guihulngan 479 133 27.8 346 72.2 - 0.0City of Tanjay 578 162 28.0 416 72.0 - 0.0
REGION VIII - EASTERN VISAYAS 23,657 7,513 31.8 16,104 68.1 41 0.2
Biliran 1,149 359 31.2 790 68.8 - 0.0Eastern Samar 1,568 468 29.8 1,100 70.2 - 0.0Leyte 7,428 2,384 32.1 5,033 67.8 11 0.1Northern Samar 3,624 1,103 30.4 2,495 68.8 26 0.7Samar 1,884 347 18.4 1,537 81.6 - 0.0Southern Leyte 2,354 751 31.9 1,603 68.1 - 0.0
100
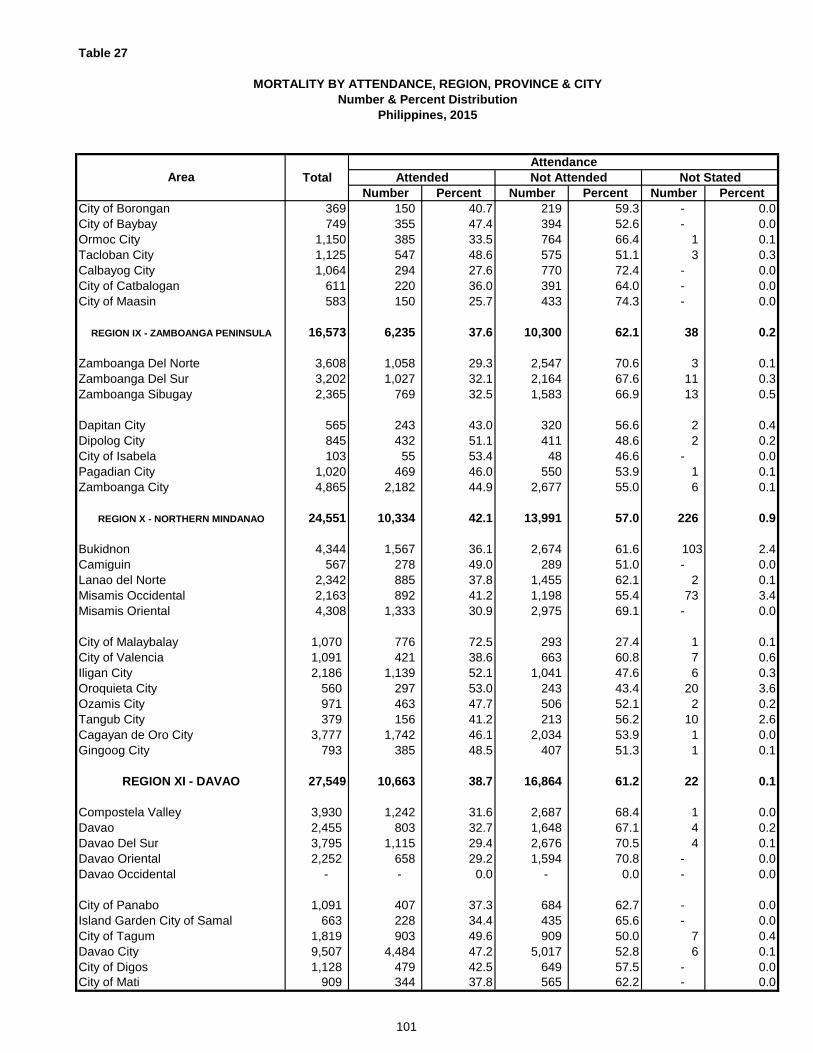
Table 27
TotalNumber Percent Number Percent Number Percent
AreaAttendance
MORTALITY BY ATTENDANCE, REGION, PROVINCE & CITYNumber & Percent Distribution
Philippines, 2015
Attended Not StatedNot Attended
City of Borongan 369 150 40.7 219 59.3 - 0.0City of Baybay 749 355 47.4 394 52.6 - 0.0Ormoc City 1,150 385 33.5 764 66.4 1 0.1Tacloban City 1,125 547 48.6 575 51.1 3 0.3Calbayog City 1,064 294 27.6 770 72.4 - 0.0City of Catbalogan 611 220 36.0 391 64.0 - 0.0City of Maasin 583 150 25.7 433 74.3 - 0.0
REGION IX - ZAMBOANGA PENINSULA 16,573 6,235 37.6 10,300 62.1 38 0.2
Zamboanga Del Norte 3,608 1,058 29.3 2,547 70.6 3 0.1Zamboanga Del Sur 3,202 1,027 32.1 2,164 67.6 11 0.3Zamboanga Sibugay 2,365 769 32.5 1,583 66.9 13 0.5
Dapitan City 565 243 43.0 320 56.6 2 0.4Dipolog City 845 432 51.1 411 48.6 2 0.2City of Isabela 103 55 53.4 48 46.6 - 0.0Pagadian City 1,020 469 46.0 550 53.9 1 0.1Zamboanga City 4,865 2,182 44.9 2,677 55.0 6 0.1
REGION X - NORTHERN MINDANAO 24,551 10,334 42.1 13,991 57.0 226 0.9
Bukidnon 4,344 1,567 36.1 2,674 61.6 103 2.4Camiguin 567 278 49.0 289 51.0 - 0.0Lanao del Norte 2,342 885 37.8 1,455 62.1 2 0.1Misamis Occidental 2,163 892 41.2 1,198 55.4 73 3.4Misamis Oriental 4,308 1,333 30.9 2,975 69.1 - 0.0
City of Malaybalay 1,070 776 72.5 293 27.4 1 0.1City of Valencia 1,091 421 38.6 663 60.8 7 0.6Iligan City 2,186 1,139 52.1 1,041 47.6 6 0.3Oroquieta City 560 297 53.0 243 43.4 20 3.6Ozamis City 971 463 47.7 506 52.1 2 0.2Tangub City 379 156 41.2 213 56.2 10 2.6Cagayan de Oro City 3,777 1,742 46.1 2,034 53.9 1 0.0Gingoog City 793 385 48.5 407 51.3 1 0.1
REGION XI - DAVAO 27,549 10,663 38.7 16,864 61.2 22 0.1
Compostela Valley 3,930 1,242 31.6 2,687 68.4 1 0.0Davao 2,455 803 32.7 1,648 67.1 4 0.2Davao Del Sur 3,795 1,115 29.4 2,676 70.5 4 0.1Davao Oriental 2,252 658 29.2 1,594 70.8 - 0.0Davao Occidental - - 0.0 - 0.0 - 0.0
City of Panabo 1,091 407 37.3 684 62.7 - 0.0Island Garden City of Samal 663 228 34.4 435 65.6 - 0.0City of Tagum 1,819 903 49.6 909 50.0 7 0.4Davao City 9,507 4,484 47.2 5,017 52.8 6 0.1City of Digos 1,128 479 42.5 649 57.5 - 0.0City of Mati 909 344 37.8 565 62.2 - 0.0
101

Table 27
TotalNumber Percent Number Percent Number Percent
AreaAttendance
MORTALITY BY ATTENDANCE, REGION, PROVINCE & CITYNumber & Percent Distribution
Philippines, 2015
Attended Not StatedNot Attended
REGION XII - SOCCSKSARGEN 20,547 7,223 35.2 13,264 64.6 60 0.3
Cotabato 5,459 1,468 26.9 3,985 73.0 6 0.1Saranggani 2,087 616 29.5 1,470 70.4 1 0.0South Cotabato 4,041 1,643 40.7 2,392 59.2 6 0.1Sultan Kudarat 2,499 710 28.4 1,788 71.5 1 0.0
Cotabato City 633 330 52.1 302 47.7 1 0.2City of Kidapawan 857 282 32.9 575 67.1 - 0.0General Santos City 3,202 1,376 43.0 1,781 55.6 45 1.4City of Koronadal 1,136 569 50.1 567 49.9 - 0.0City of Tacurong 633 229 36.2 404 63.8 0 0.0
REGION XIII - CARAGA 14,387 5,613 39.0 8,758 60.9 16 0.1
Agusan del Norte 1,608 667 41.5 940 58.5 1 0.1Agusan del Sur 2,553 864 33.8 1,689 66.2 - 0.0Surigao del Norte 1,997 586 29.3 1,411 70.7 - 0.0Surigao del Sur 2,450 885 36.1 1,561 63.7 4 0.2Dinagat Islands 640 168 26.3 464 72.5 8 1.3
City of Cabadbaran 484 279 57.6 205 42.4 0 0.0Butuan City 2,086 1,114 53.4 972 46.6 0 0.0City of Bayugan 578 189 32.7 388 67.1 1 0.2Surigao City 1,040 420 40.4 620 59.6 0 0.0City of Bislig 597 228 38.2 369 61.8 0 0.0City of Tandag 354 213 60.2 139 39.3 2 0.6
ARMM 2,938 1,062 36.1 1,831 62.3 45 1.5
Basilan 103 20 19.4 82 79.6 1 0.8Lanao del Sur 658 234 35.6 405 61.6 19 2.9Maguindanao 1,137 359 31.6 768 67.5 10 0.9Sulu 433 182 42.0 250 57.7 1 0.2Tawi-tawi 123 40 32.5 73 59.3 10 8.1
City of Lamitan 234 76 32.5 157 67.1 1 0.4Marawi City 250 151 60.4 96 38.4 3 1.2
Foreign Country 338 200 59.2 137 40.5 1 0.3
102
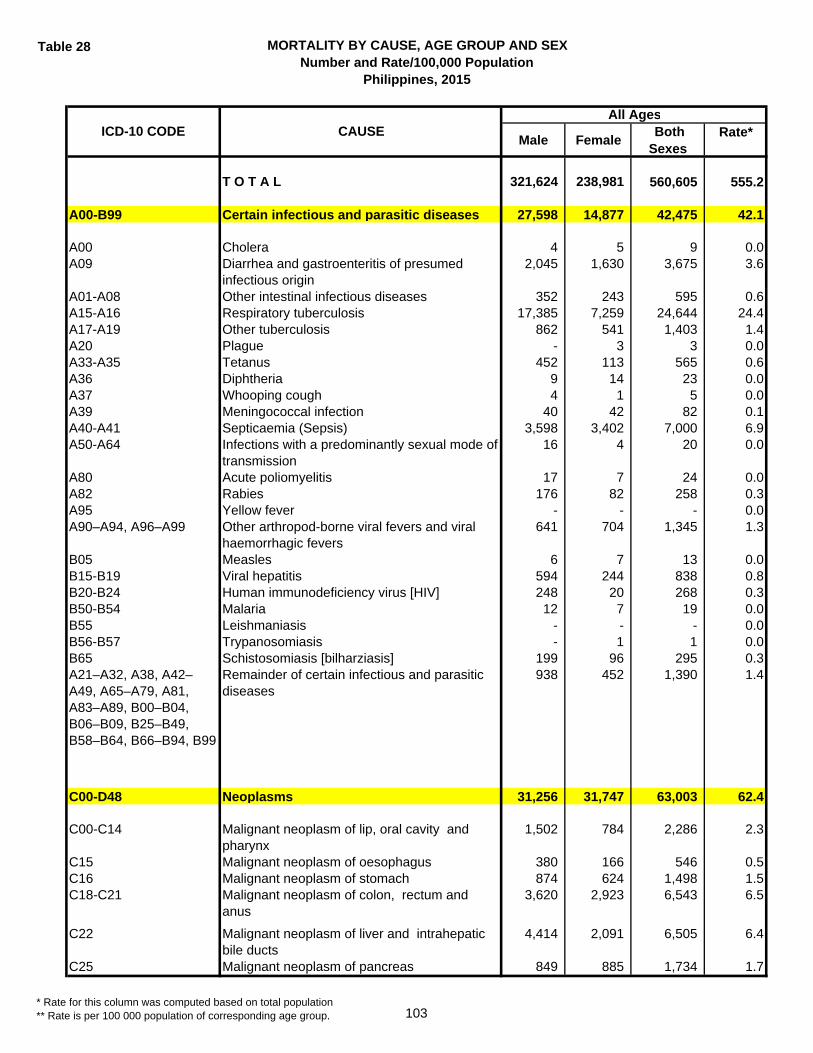
Table 28 MORTALITY BY CAUSE, AGE GROUP AND SEXNumber and Rate/100,000 Population
Philippines, 2015
Male Female Both Sexes
Rate*
T O T A L 321,624 238,981 560,605 555.2
A00-B99 Certain infectious and parasitic diseases 27,598 14,877 42,475 42.1
A00 Cholera 4 5 9 0.0A09 Diarrhea and gastroenteritis of presumed
infectious origin2,045 1,630 3,675 3.6
A01-A08 Other intestinal infectious diseases 352 243 595 0.6A15-A16 Respiratory tuberculosis 17,385 7,259 24,644 24.4A17-A19 Other tuberculosis 862 541 1,403 1.4A20 Plague - 3 3 0.0A33-A35 Tetanus 452 113 565 0.6A36 Diphtheria 9 14 23 0.0A37 Whooping cough 4 1 5 0.0A39 Meningococcal infection 40 42 82 0.1A40-A41 Septicaemia (Sepsis) 3,598 3,402 7,000 6.9A50-A64 Infections with a predominantly sexual mode of
transmission16 4 20 0.0
A80 Acute poliomyelitis 17 7 24 0.0A82 Rabies 176 82 258 0.3A95 Yellow fever - - - 0.0A90–A94, A96–A99 Other arthropod-borne viral fevers and viral
haemorrhagic fevers641 704 1,345 1.3
B05 Measles 6 7 13 0.0B15-B19 Viral hepatitis 594 244 838 0.8B20-B24 Human immunodeficiency virus [HIV] 248 20 268 0.3B50-B54 Malaria 12 7 19 0.0B55 Leishmaniasis - - - 0.0B56-B57 Trypanosomiasis - 1 1 0.0B65 Schistosomiasis [bilharziasis] 199 96 295 0.3A21–A32, A38, A42– A49, A65–A79, A81, A83–A89, B00–B04, B06–B09, B25–B49, B58–B64, B66–B94, B99
Remainder of certain infectious and parasitic diseases
938 452 1,390 1.4
C00-D48 Neoplasms 31,256 31,747 63,003 62.4
C00-C14 Malignant neoplasm of lip, oral cavity and pharynx
1,502 784 2,286 2.3
C15 Malignant neoplasm of oesophagus 380 166 546 0.5C16 Malignant neoplasm of stomach 874 624 1,498 1.5C18-C21 Malignant neoplasm of colon, rectum and
anus 3,620 2,923 6,543 6.5
C22 Malignant neoplasm of liver and intrahepatic bile ducts
4,414 2,091 6,505 6.4
C25 Malignant neoplasm of pancreas 849 885 1,734 1.7
ICD-10 CODE CAUSEAll Ages
* Rate for this column was computed based on total population ** Rate is per 100 000 population of corresponding age group. 103
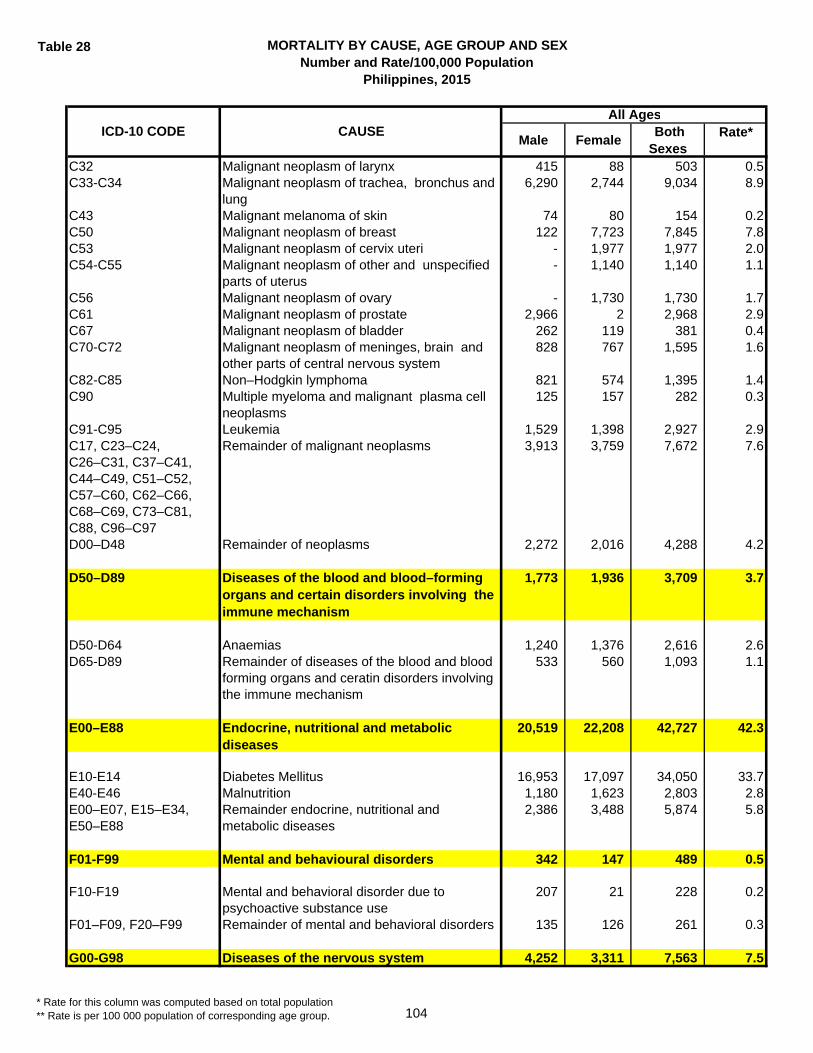
Table 28 MORTALITY BY CAUSE, AGE GROUP AND SEXNumber and Rate/100,000 Population
Philippines, 2015
Male Female Both Sexes
Rate*ICD-10 CODE CAUSEAll Ages
C32 Malignant neoplasm of larynx 415 88 503 0.5C33-C34 Malignant neoplasm of trachea, bronchus and
lung 6,290 2,744 9,034 8.9
C43 Malignant melanoma of skin 74 80 154 0.2C50 Malignant neoplasm of breast 122 7,723 7,845 7.8C53 Malignant neoplasm of cervix uteri - 1,977 1,977 2.0C54-C55 Malignant neoplasm of other and unspecified
parts of uterus - 1,140 1,140 1.1
C56 Malignant neoplasm of ovary - 1,730 1,730 1.7C61 Malignant neoplasm of prostate 2,966 2 2,968 2.9C67 Malignant neoplasm of bladder 262 119 381 0.4C70-C72 Malignant neoplasm of meninges, brain and
other parts of central nervous system 828 767 1,595 1.6
C82-C85 Non–Hodgkin lymphoma 821 574 1,395 1.4C90 Multiple myeloma and malignant plasma cell
neoplasms 125 157 282 0.3
C91-C95 Leukemia 1,529 1,398 2,927 2.9C17, C23–C24, C26–C31, C37–C41, C44–C49, C51–C52, C57–C60, C62–C66, C68–C69, C73–C81, C88, C96–C97
Remainder of malignant neoplasms 3,913 3,759 7,672 7.6
D00–D48 Remainder of neoplasms 2,272 2,016 4,288 4.2
D50–D89 Diseases of the blood and blood–forming organs and certain disorders involving the immune mechanism
1,773 1,936 3,709 3.7
D50-D64 Anaemias 1,240 1,376 2,616 2.6D65-D89 Remainder of diseases of the blood and blood
forming organs and ceratin disorders involving the immune mechanism
533 560 1,093 1.1
E00–E88 Endocrine, nutritional and metabolic diseases
20,519 22,208 42,727 42.3
E10-E14 Diabetes Mellitus 16,953 17,097 34,050 33.7E40-E46 Malnutrition 1,180 1,623 2,803 2.8E00–E07, E15–E34, E50–E88
Remainder endocrine, nutritional and metabolic diseases
2,386 3,488 5,874 5.8
F01-F99 Mental and behavioural disorders 342 147 489 0.5
F10-F19 Mental and behavioral disorder due to psychoactive substance use
207 21 228 0.2
F01–F09, F20–F99 Remainder of mental and behavioral disorders 135 126 261 0.3
G00-G98 Diseases of the nervous system 4,252 3,311 7,563 7.5
* Rate for this column was computed based on total population ** Rate is per 100 000 population of corresponding age group. 104

Table 28 MORTALITY BY CAUSE, AGE GROUP AND SEXNumber and Rate/100,000 Population
Philippines, 2015
Male Female Both Sexes
Rate*ICD-10 CODE CAUSEAll Ages
G00-G03 Meningitis 947 660 1,607 1.6G30 Alzheimer's disease 132 273 405 0.4G04–G25, G31–G98 Remainder diseases of the nervous system 3,173 2,378 5,551 5.5
H00-H57 Diseases of the eye and adnexa 13 6 19 0.0
H60-H93 Diseases of the ear and mastoid process 23 14 37 0.0
I00-199 Diseases of the circulatory system 111,403 86,674 198,077 196.2
I00-I09 Acute rheumatic fever and chronic rheumatic heart diseases
849 1,224 2,073 2.1
I10-I13 Hypertensive diseases 18,922 15,584 34,506 34.2I20-I25 Ischaemic heart diseases 41,284 27,288 68,572 67.9I26-I51 Other heart diseases 16,441 15,287 31,728 31.4I60-I69 Cerebrosvascular diseases 32,393 25,917 58,310 57.7I70 Atherosclerosis 444 667 1,111 1.1I71-I99 Remainder of diseases of the circulatory
system1,070 707 1,777 1.8
J00-J98 Diseases of the respiratory system 44,111 34,746 78,857 78.1
J09-J11 Influenza 28 21 49 0.0J12-J18 Pneumonia 24,603 24,992 49,595 49.1J20-J22 Other acute lower respiratory infections 54 32 86 0.1J40-J47 Chronic lower respiratory infections 16,478 7,282 23,760 23.5J00–J06, J30–J39, J60– J98
Remainder of diseases of the respiratory system
2,948 2,419 5,367 5.3
K00-K92 Diseases of the digestive system 15,524 6,931 22,455 22.2
K25-K27 Gastric and duodenal ulcer 3,800 1,898 5,698 5.6K70-K76 Diseases of the liver 6,583 2,456 9,039 9.0K00–K22, K28–K66, K80–K92
Remainder of diseases of the digestive system 5,141 2,577 7,718 7.6
L00-L98 Diseases of the skin and subcutaneous tissue
953 1,374 2,327 2.3
M00-M99 Diseases of the muscuskeletal system and connective tissue
883 1,327 2,210 2.2
N00-N98 Diseases of the genitourinary system 13,155 8,876 22,031 21.8
N00-N15 Glomerular and renal tubulo-interstitial diseases
2,341 1,629 3,970 3.9
N17-N98 Remainder of diseases of the genitourinary system
10,814 7,247 18,061 17.9
* Rate for this column was computed based on total population ** Rate is per 100 000 population of corresponding age group. 105
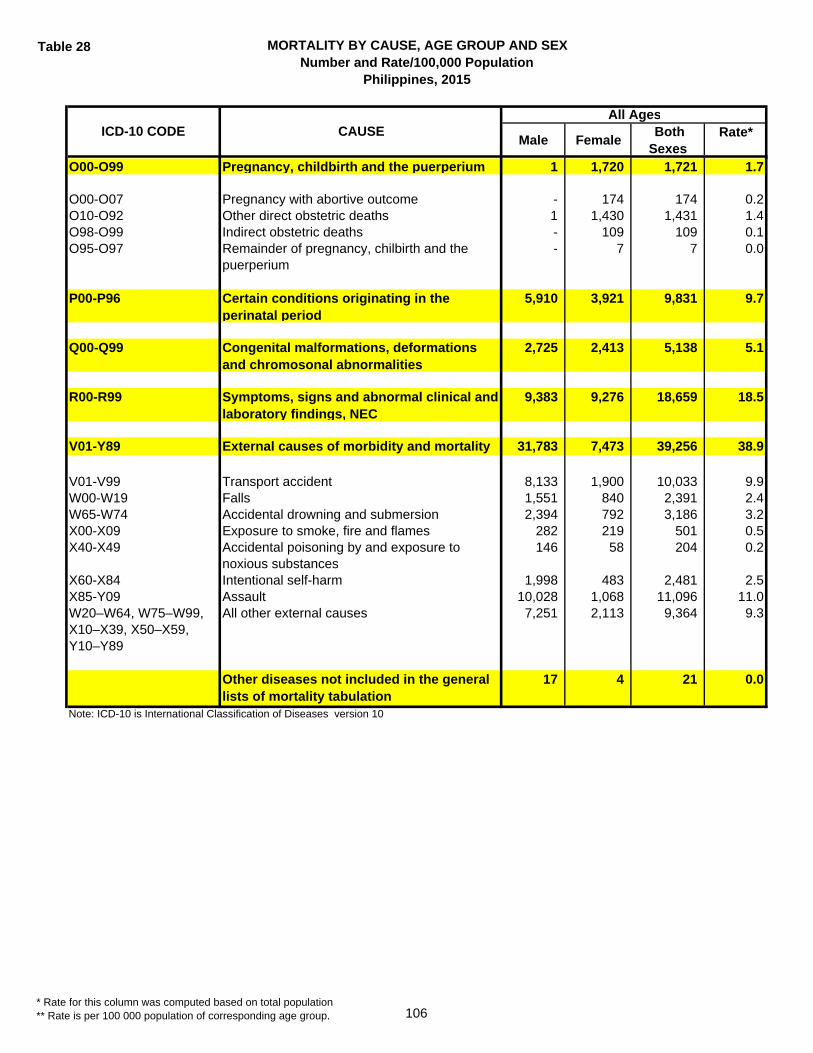
Table 28 MORTALITY BY CAUSE, AGE GROUP AND SEXNumber and Rate/100,000 Population
Philippines, 2015
Male Female Both Sexes
Rate*ICD-10 CODE CAUSEAll Ages
O00-O99 Pregnancy, childbirth and the puerperium 1 1,720 1,721 1.7
O00-O07 Pregnancy with abortive outcome - 174 174 0.2O10-O92 Other direct obstetric deaths 1 1,430 1,431 1.4O98-O99 Indirect obstetric deaths - 109 109 0.1O95-O97 Remainder of pregnancy, chilbirth and the
puerperium- 7 7 0.0
P00-P96 Certain conditions originating in the perinatal period
5,910 3,921 9,831 9.7
Q00-Q99 Congenital malformations, deformations and chromosonal abnormalities
2,725 2,413 5,138 5.1
R00-R99 Symptoms, signs and abnormal clinical and laboratory findings, NEC
9,383 9,276 18,659 18.5
V01-Y89 External causes of morbidity and mortality 31,783 7,473 39,256 38.9
V01-V99 Transport accident 8,133 1,900 10,033 9.9W00-W19 Falls 1,551 840 2,391 2.4W65-W74 Accidental drowning and submersion 2,394 792 3,186 3.2X00-X09 Exposure to smoke, fire and flames 282 219 501 0.5X40-X49 Accidental poisoning by and exposure to
noxious substances146 58 204 0.2
X60-X84 Intentional self-harm 1,998 483 2,481 2.5X85-Y09 Assault 10,028 1,068 11,096 11.0W20–W64, W75–W99, X10–X39, X50–X59, Y10–Y89
All other external causes 7,251 2,113 9,364 9.3
Other diseases not included in the general lists of mortality tabulation
17 4 21 0.0
Note: ICD-10 is International Classification of Diseases version 10
* Rate for this column was computed based on total population ** Rate is per 100 000 population of corresponding age group. 106

Table 28 MORTALITY BY CAUSE, AGE GROUP AND SEXNumber and Rate/100,000 Population
Philippines, 2015
CAUSE
Male Female Both Sexes
Rate** Male Female Both Sexes
Rate**
T O T A L 12,086 8,664 20,750 999.5 4,645 3,937 8,582 98.2
Certain infectious and parasitic diseases 1,019 788 1,807 87.0 988 909 1,897 21.7
Cholera - - - 0.0 - - - 0.0Diarrhea and gastroenteritis of presumed infectious origin
481 343 824 39.7 431 349 780 8.9
Other intestinal infectious diseases 13 19 32 1.5 25 17 42 0.5Respiratory tuberculosis 8 12 20 1.0 28 17 45 0.5Other tuberculosis 5 7 12 0.6 56 48 104 1.2Plague - 1 1 0.0 - - - 0.0
Tetanus 9 13 22 1.1 9 8 17 0.2
Diphtheria 2 - 2 0.1 4 4 8 0.1Whooping cough 3 1 4 0.2 1 - 1 0.0Meningococcal infection 6 9 15 0.7 15 12 27 0.3Septicaemia (Sepsis) 428 321 749 36.1 174 163 337 3.9Infections with a predominantly sexual mode of transmission
2 1 3 0.1 - - - 0.0
Acute poliomyelitis - - - 0.0 - - - 0.0Rabies - - - 0.0 3 3 6 0.1Yellow fever - - - 0.0 - - - 0.0Other arthropod-borne viral fevers and viral haemorrhagic fevers
21 27 48 2.3 144 196 340 3.9
Measles 2 4 6 0.3 1 1 2 0.0
Viral hepatitis 2 - 2 0.1 2 3 5 0.1
Human immunodeficiency virus [HIV] 1 1 2 0.1 2 - 2 0.0
Malaria - - - 0.0 - 1 1 0.0
Leishmaniasis - - - 0.0 - - - 0.0Trypanosomiasis - - - 0.0 - - - 0.0Schistosomiasis [bilharziasis] - - - 0.0 - - - 0.0Remainder of certain infectious and parasitic diseases
36 29 65 3.1 93 87 180 2.1
Neoplasms 20 19 39 1.9 292 208 500 5.7
Malignant neoplasm of lip, oral cavity and pharynx
- - - 0.0 2 1 3 0.0
Malignant neoplasm of oesophagus - - - 0.0 - - - 0.0Malignant neoplasm of stomach - - - 0.0 2 - 2 0.0Malignant neoplasm of colon, rectum and anus
- - - 0.0 3 - 3 0.0
Malignant neoplasm of liver and intrahepatic bile ducts
- - - 0.0 11 7 18 0.2
Malignant neoplasm of pancreas - - - 0.0 - 1 1 0.0Malignant neoplasm of larynx - - - 0.0 - 1 1 0.0Malignant neoplasm of trachea, bronchus and lung
- - - 0.0 5 2 7 0.1
Malignant melanoma of skin - - - 0.0 - - - 0.0
UNDER 1 1 -4 YEARS
* Rate for this column was computed based on total population ** Rate is per 100 000 population of corresponding age group. 107

Table 28 MORTALITY BY CAUSE, AGE GROUP AND SEXNumber and Rate/100,000 Population
Philippines, 2015
CAUSE
Male Female Both Sexes
Rate** Male Female Both Sexes
Rate**
UNDER 1 1 -4 YEARS
Malignant neoplasm of breast - - - 0.0 - - - 0.0Malignant neoplasm of cervix uteri - - - 0.0 - - - 0.0Malignant neoplasm of other and unspecified parts of uterus
- - - 0.0 - - - 0.0
Malignant neoplasm of ovary - - - 0.0 - - - 0.0Malignant neoplasm of prostate - - - 0.0 - - - 0.0Malignant neoplasm of bladder - - - 0.0 - - - 0.0
Malignant neoplasm of meninges, brain and other parts of central nervous system
- 1 1 0.0 18 19 37 0.4
Non–Hodgkin lymphoma - - - 0.0 7 4 11 0.1Multiple myeloma and malignant plasma cell neoplasms
- - - 0.0 - - - 0.0
Leukemia 4 7 11 0.5 127 93 220 2.5Remainder of malignant neoplasms 5 - 5 0.2 83 55 138 1.6Remainder of Neoplasms 11 11 22 1.1 34 25 59 0.7
Diseases of the blood and blood–forming organs and certain disorders involving the immune mechanism
132 94 226 10.9 77 64 141 1.6
Anaemias 42 22 64 3.1 26 33 59 0.7Remainder of diseases of the blood and blood forming organs and ceratin disorders involving the immune mechanism
90 72 162 7.8 51 31 82 0.9
Endocrine, nutritional and metabolic diseases
185 141 326 15.7 205 201 406 4.6
Diabetes Mellitus 3 3 6 0.3 6 - 6 0.1Malnutrition 45 56 101 4.9 113 117 230 2.6Remainder endocrine, nutritional and metabolic diseases
137 82 219 10.5 86 84 170 1.9
Mental and behavioural disorders - - - 0.0 - - - 0.0
Mental and behavioral disorder due to psychoactive substance use
- - - 0.0 - - - 0.0
Remainder of mental and behavioral disorders
- - - 0.0 - - - 0.0
Diseases of the nervous system 409 301 710 34.2 485 394 879 10.1
Meningitis 185 144 329 15.8 177 127 304 3.5Alzheimer's disease - - - 0.0 - - - 0.0Remainder diseases of the nervous system
224 157 381 18.4 308 267 575 6.6
* Rate for this column was computed based on total population ** Rate is per 100 000 population of corresponding age group. 108

Table 28 MORTALITY BY CAUSE, AGE GROUP AND SEXNumber and Rate/100,000 Population
Philippines, 2015
CAUSE
Male Female Both Sexes
Rate** Male Female Both Sexes
Rate**
UNDER 1 1 -4 YEARS
Diseases of the eye and adnexa 1 1 2 0.1 - - - 0.0
Diseases of the ear and mastoid process
2 1 3 0.1 3 1 4 0.0
Diseases of the circulatory system 178 140 318 15.3 142 122 264 3.0
Acute rheumatic fever and chronic rheumatic heart diseases
4 1 5 0.2 10 4 14 0.2
Hypertensive diseases 5 3 8 0.4 1 1 2 0.0Ischaemic heart diseases 16 10 26 1.3 8 12 20 0.2Other heart diseases 127 102 229 11.0 98 96 194 2.2Cerebrosvascular diseases 21 20 41 2.0 21 7 28 0.3Atherosclerosis - - - 0.0 - - - 0.0Remainder of diseases of the circulatory system
5 4 9 0.4 4 2 6 0.1
Diseases of the respiratory system 1,765 1,279 3,044 146.6 1,084 1,003 2,087 23.9
Influenza - - - 0.0 1 - 1 0.0Pneumonia 1,401 969 2,370 114.2 737 715 1,452 16.6Other acute lower respiratory infections 2 4 6 0.3 8 1 9 0.1Chronic lower respiratory infections 58 56 114 5.5 205 197 402 4.6Remainder of diseases of the respiratory system
304 250 554 26.7 133 90 223 2.6
Diseases of the digestive system 141 80 221 10.6 87 60 147 1.7
Gastric and duodenal ulcer - 1 1 0.0 1 1 2 0.0Diseases of the liver 30 17 47 2.3 23 23 46 0.5
Remainder of diseases of the digestive system
111 62 173 8.3 63 36 99 1.1
Diseases of the skin and subcutaneous tissue
16 9 25 1.2 23 18 41 0.5
Diseases of the musculoskeletal system and connective tissue
2 - 2 0.1 5 2 7 0.1
Diseases of the genitourinary system 32 15 47 2.3 80 61 141 1.6
Glomerular and renal tubulo-interstitial diseases
7 5 12 0.6 44 24 68 0.8
Remainder of diseases of the genitourinary system
25 10 35 1.7 36 37 73 0.8
Pregnancy, childbirth and the puerperium
- - - 0.0 - - - 0.0
* Rate for this column was computed based on total population ** Rate is per 100 000 population of corresponding age group. 109
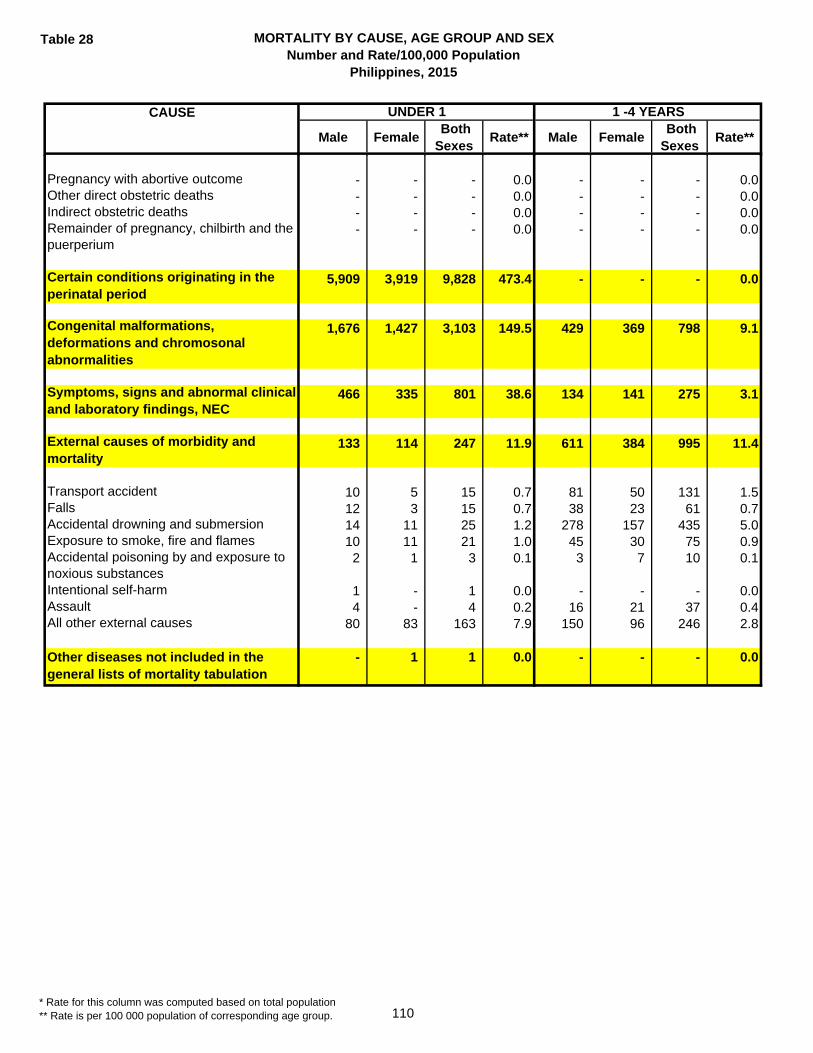
Table 28 MORTALITY BY CAUSE, AGE GROUP AND SEXNumber and Rate/100,000 Population
Philippines, 2015
CAUSE
Male Female Both Sexes
Rate** Male Female Both Sexes
Rate**
UNDER 1 1 -4 YEARS
Pregnancy with abortive outcome - - - 0.0 - - - 0.0Other direct obstetric deaths - - - 0.0 - - - 0.0Indirect obstetric deaths - - - 0.0 - - - 0.0Remainder of pregnancy, chilbirth and the puerperium
- - - 0.0 - - - 0.0
Certain conditions originating in the perinatal period
5,909 3,919 9,828 473.4 - - - 0.0
Congenital malformations, deformations and chromosonal abnormalities
1,676 1,427 3,103 149.5 429 369 798 9.1
Symptoms, signs and abnormal clinical and laboratory findings, NEC
466 335 801 38.6 134 141 275 3.1
External causes of morbidity and mortality
133 114 247 11.9 611 384 995 11.4
Transport accident 10 5 15 0.7 81 50 131 1.5Falls 12 3 15 0.7 38 23 61 0.7Accidental drowning and submersion 14 11 25 1.2 278 157 435 5.0Exposure to smoke, fire and flames 10 11 21 1.0 45 30 75 0.9Accidental poisoning by and exposure to noxious substances
2 1 3 0.1 3 7 10 0.1
Intentional self-harm 1 - 1 0.0 - - - 0.0Assault 4 - 4 0.2 16 21 37 0.4All other external causes 80 83 163 7.9 150 96 246 2.8
Other diseases not included in the general lists of mortality tabulation
- 1 1 0.0 - - - 0.0
* Rate for this column was computed based on total population ** Rate is per 100 000 population of corresponding age group. 110
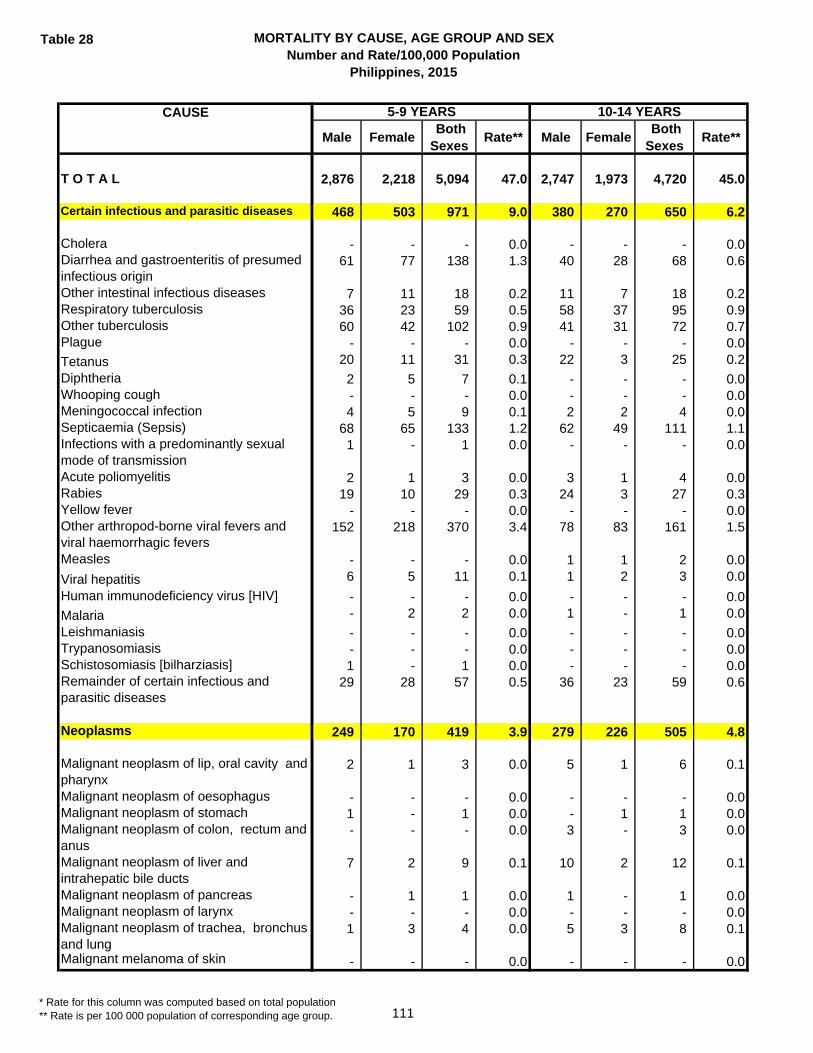
Table 28 MORTALITY BY CAUSE, AGE GROUP AND SEXNumber and Rate/100,000 Population
Philippines, 2015
CAUSE
T O T A L
Certain infectious and parasitic diseases
CholeraDiarrhea and gastroenteritis of presumed infectious originOther intestinal infectious diseasesRespiratory tuberculosisOther tuberculosisPlague
TetanusDiphtheriaWhooping coughMeningococcal infectionSepticaemia (Sepsis)Infections with a predominantly sexual mode of transmissionAcute poliomyelitisRabiesYellow feverOther arthropod-borne viral fevers and viral haemorrhagic feversMeasles
Viral hepatitisHuman immunodeficiency virus [HIV]
MalariaLeishmaniasisTrypanosomiasisSchistosomiasis [bilharziasis]Remainder of certain infectious and parasitic diseases
Neoplasms
Malignant neoplasm of lip, oral cavity and pharynx Malignant neoplasm of oesophagus Malignant neoplasm of stomach Malignant neoplasm of colon, rectum and anus Malignant neoplasm of liver and intrahepatic bile ducts Malignant neoplasm of pancreas Malignant neoplasm of larynx Malignant neoplasm of trachea, bronchus and lung Malignant melanoma of skin
Male Female Both Sexes
Rate** Male Female Both Sexes
Rate**
2,876 2,218 5,094 47.0 2,747 1,973 4,720 45.0
468 503 971 9.0 380 270 650 6.2
- - - 0.0 - - - 0.061 77 138 1.3 40 28 68 0.6
7 11 18 0.2 11 7 18 0.236 23 59 0.5 58 37 95 0.960 42 102 0.9 41 31 72 0.7
- - - 0.0 - - - 0.020 11 31 0.3 22 3 25 0.2
2 5 7 0.1 - - - 0.0- - - 0.0 - - - 0.04 5 9 0.1 2 2 4 0.0
68 65 133 1.2 62 49 111 1.11 - 1 0.0 - - - 0.0
2 1 3 0.0 3 1 4 0.019 10 29 0.3 24 3 27 0.3
- - - 0.0 - - - 0.0152 218 370 3.4 78 83 161 1.5
- - - 0.0 1 1 2 0.06 5 11 0.1 1 2 3 0.0
- - - 0.0 - - - 0.0- 2 2 0.0 1 - 1 0.0
- - - 0.0 - - - 0.0- - - 0.0 - - - 0.01 - 1 0.0 - - - 0.0
29 28 57 0.5 36 23 59 0.6
249 170 419 3.9 279 226 505 4.8
2 1 3 0.0 5 1 6 0.1
- - - 0.0 - - - 0.01 - 1 0.0 - 1 1 0.0- - - 0.0 3 - 3 0.0
7 2 9 0.1 10 2 12 0.1
- 1 1 0.0 1 - 1 0.0- - - 0.0 - - - 0.01 3 4 0.0 5 3 8 0.1
- - - 0.0 - - - 0.0
5-9 YEARS 10-14 YEARS
* Rate for this column was computed based on total population ** Rate is per 100 000 population of corresponding age group. 111
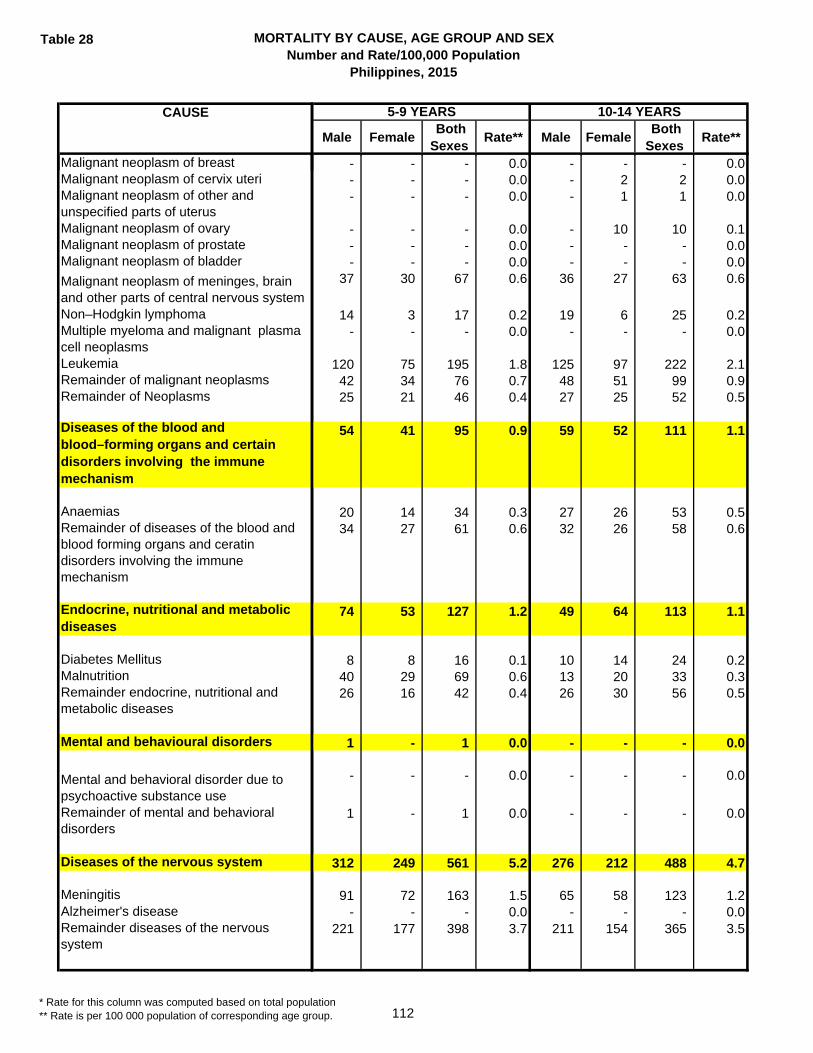
Table 28 MORTALITY BY CAUSE, AGE GROUP AND SEXNumber and Rate/100,000 Population
Philippines, 2015
CAUSE
Malignant neoplasm of breast Malignant neoplasm of cervix uteri Malignant neoplasm of other and unspecified parts of uterus Malignant neoplasm of ovary Malignant neoplasm of prostate Malignant neoplasm of bladder
Malignant neoplasm of meninges, brain and other parts of central nervous system Non–Hodgkin lymphoma Multiple myeloma and malignant plasma cell neoplasms LeukemiaRemainder of malignant neoplasms Remainder of Neoplasms
Diseases of the blood and blood–forming organs and certain disorders involving the immune mechanism
AnaemiasRemainder of diseases of the blood and blood forming organs and ceratin disorders involving the immune mechanism
Endocrine, nutritional and metabolic diseases
Diabetes MellitusMalnutritionRemainder endocrine, nutritional and metabolic diseases
Mental and behavioural disorders
Mental and behavioral disorder due to psychoactive substance useRemainder of mental and behavioral disorders
Diseases of the nervous system
MeningitisAlzheimer's diseaseRemainder diseases of the nervous system
Male Female Both Sexes
Rate** Male Female Both Sexes
Rate**
5-9 YEARS 10-14 YEARS
- - - 0.0 - - - 0.0- - - 0.0 - 2 2 0.0- - - 0.0 - 1 1 0.0
- - - 0.0 - 10 10 0.1- - - 0.0 - - - 0.0- - - 0.0 - - - 0.0
37 30 67 0.6 36 27 63 0.6
14 3 17 0.2 19 6 25 0.2- - - 0.0 - - - 0.0
120 75 195 1.8 125 97 222 2.142 34 76 0.7 48 51 99 0.925 21 46 0.4 27 25 52 0.5
54 41 95 0.9 59 52 111 1.1
20 14 34 0.3 27 26 53 0.534 27 61 0.6 32 26 58 0.6
74 53 127 1.2 49 64 113 1.1
8 8 16 0.1 10 14 24 0.240 29 69 0.6 13 20 33 0.326 16 42 0.4 26 30 56 0.5
1 - 1 0.0 - - - 0.0
- - - 0.0 - - - 0.0
1 - 1 0.0 - - - 0.0
312 249 561 5.2 276 212 488 4.7
91 72 163 1.5 65 58 123 1.2- - - 0.0 - - - 0.0
221 177 398 3.7 211 154 365 3.5
* Rate for this column was computed based on total population ** Rate is per 100 000 population of corresponding age group. 112
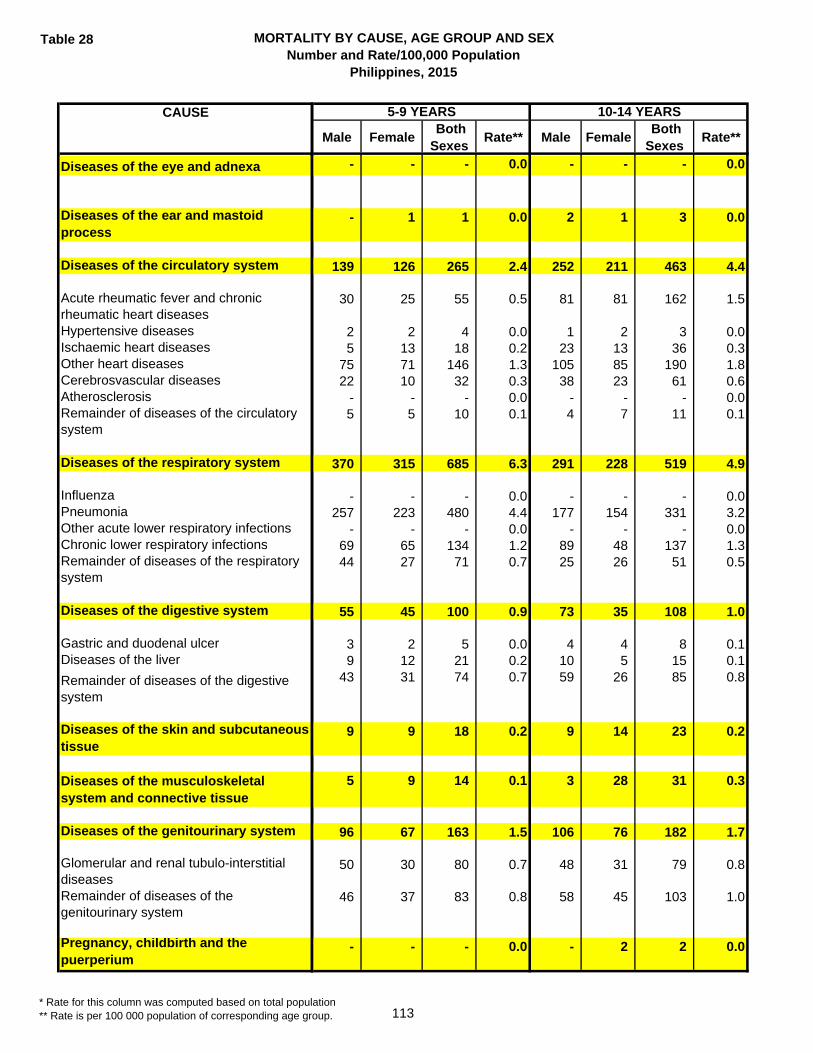
Table 28 MORTALITY BY CAUSE, AGE GROUP AND SEXNumber and Rate/100,000 Population
Philippines, 2015
CAUSE
Diseases of the eye and adnexa
Diseases of the ear and mastoid process
Diseases of the circulatory system
Acute rheumatic fever and chronic rheumatic heart diseasesHypertensive diseasesIschaemic heart diseasesOther heart diseasesCerebrosvascular diseasesAtherosclerosisRemainder of diseases of the circulatory system
Diseases of the respiratory system
InfluenzaPneumoniaOther acute lower respiratory infectionsChronic lower respiratory infectionsRemainder of diseases of the respiratory system
Diseases of the digestive system
Gastric and duodenal ulcerDiseases of the liver
Remainder of diseases of the digestive system
Diseases of the skin and subcutaneous tissue
Diseases of the musculoskeletal system and connective tissue
Diseases of the genitourinary system
Glomerular and renal tubulo-interstitial diseasesRemainder of diseases of the genitourinary system
Pregnancy, childbirth and the puerperium
Male Female Both Sexes
Rate** Male Female Both Sexes
Rate**
5-9 YEARS 10-14 YEARS
- - - 0.0 - - - 0.0
- 1 1 0.0 2 1 3 0.0
139 126 265 2.4 252 211 463 4.4
30 25 55 0.5 81 81 162 1.5
2 2 4 0.0 1 2 3 0.05 13 18 0.2 23 13 36 0.3
75 71 146 1.3 105 85 190 1.822 10 32 0.3 38 23 61 0.6
- - - 0.0 - - - 0.05 5 10 0.1 4 7 11 0.1
370 315 685 6.3 291 228 519 4.9
- - - 0.0 - - - 0.0257 223 480 4.4 177 154 331 3.2
- - - 0.0 - - - 0.069 65 134 1.2 89 48 137 1.344 27 71 0.7 25 26 51 0.5
55 45 100 0.9 73 35 108 1.0
3 2 5 0.0 4 4 8 0.19 12 21 0.2 10 5 15 0.1
43 31 74 0.7 59 26 85 0.8
9 9 18 0.2 9 14 23 0.2
5 9 14 0.1 3 28 31 0.3
96 67 163 1.5 106 76 182 1.7
50 30 80 0.7 48 31 79 0.8
46 37 83 0.8 58 45 103 1.0
- - - 0.0 - 2 2 0.0
* Rate for this column was computed based on total population ** Rate is per 100 000 population of corresponding age group. 113
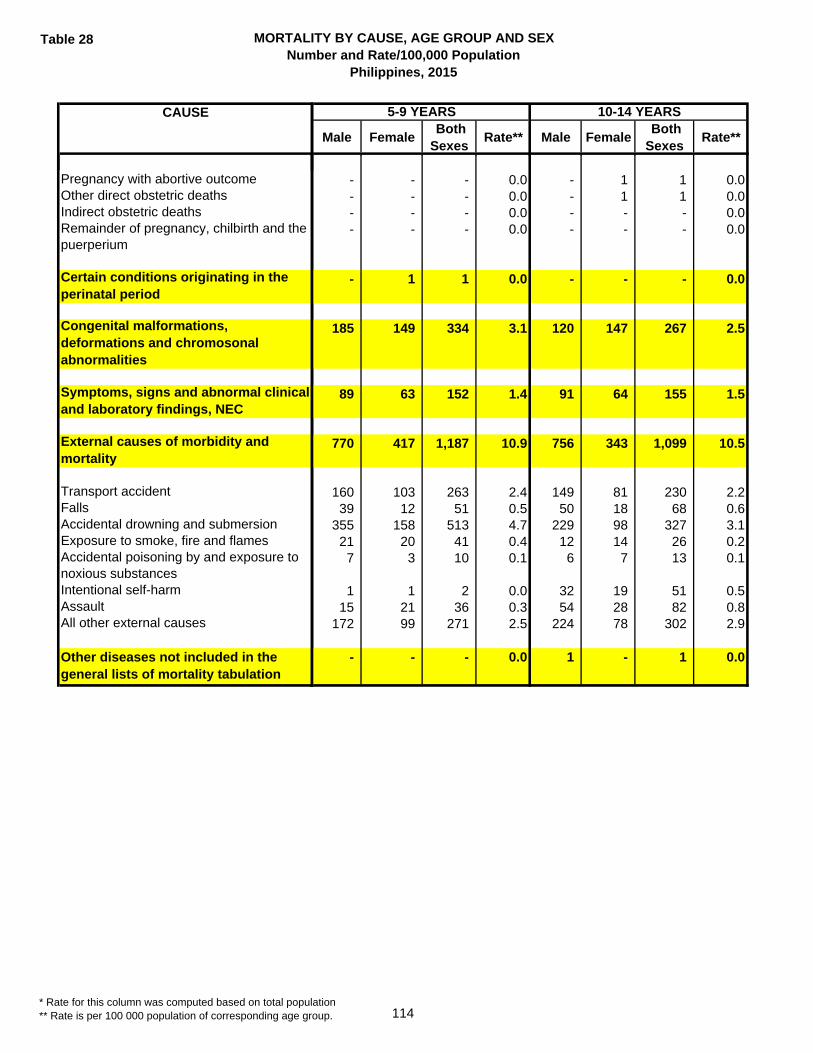
Table 28 MORTALITY BY CAUSE, AGE GROUP AND SEXNumber and Rate/100,000 Population
Philippines, 2015
CAUSE
Pregnancy with abortive outcomeOther direct obstetric deathsIndirect obstetric deathsRemainder of pregnancy, chilbirth and the puerperium
Certain conditions originating in the perinatal period
Congenital malformations, deformations and chromosonal abnormalities
Symptoms, signs and abnormal clinical and laboratory findings, NEC
External causes of morbidity and mortality
Transport accidentFallsAccidental drowning and submersionExposure to smoke, fire and flamesAccidental poisoning by and exposure to noxious substancesIntentional self-harmAssaultAll other external causes
Other diseases not included in the general lists of mortality tabulation
Male Female Both Sexes
Rate** Male Female Both Sexes
Rate**
5-9 YEARS 10-14 YEARS
- - - 0.0 - 1 1 0.0- - - 0.0 - 1 1 0.0- - - 0.0 - - - 0.0- - - 0.0 - - - 0.0
- 1 1 0.0 - - - 0.0
185 149 334 3.1 120 147 267 2.5
89 63 152 1.4 91 64 155 1.5
770 417 1,187 10.9 756 343 1,099 10.5
160 103 263 2.4 149 81 230 2.239 12 51 0.5 50 18 68 0.6
355 158 513 4.7 229 98 327 3.121 20 41 0.4 12 14 26 0.27 3 10 0.1 6 7 13 0.1
1 1 2 0.0 32 19 51 0.515 21 36 0.3 54 28 82 0.8
172 99 271 2.5 224 78 302 2.9
- - - 0.0 1 - 1 0.0
* Rate for this column was computed based on total population ** Rate is per 100 000 population of corresponding age group. 114
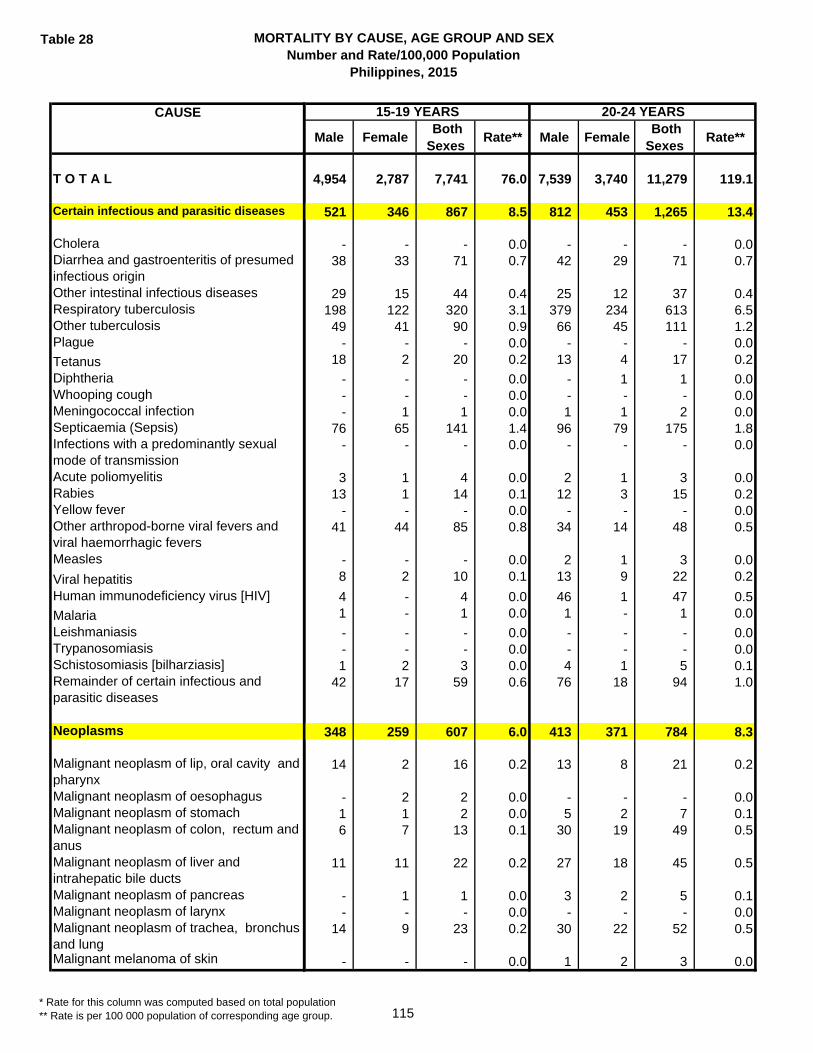
Table 28 MORTALITY BY CAUSE, AGE GROUP AND SEXNumber and Rate/100,000 Population
Philippines, 2015
CAUSE
T O T A L
Certain infectious and parasitic diseases
CholeraDiarrhea and gastroenteritis of presumed infectious originOther intestinal infectious diseasesRespiratory tuberculosisOther tuberculosisPlague
TetanusDiphtheriaWhooping coughMeningococcal infectionSepticaemia (Sepsis)Infections with a predominantly sexual mode of transmissionAcute poliomyelitisRabiesYellow feverOther arthropod-borne viral fevers and viral haemorrhagic feversMeasles
Viral hepatitisHuman immunodeficiency virus [HIV]
MalariaLeishmaniasisTrypanosomiasisSchistosomiasis [bilharziasis]Remainder of certain infectious and parasitic diseases
Neoplasms
Malignant neoplasm of lip, oral cavity and pharynx Malignant neoplasm of oesophagus Malignant neoplasm of stomach Malignant neoplasm of colon, rectum and anus Malignant neoplasm of liver and intrahepatic bile ducts Malignant neoplasm of pancreas Malignant neoplasm of larynx Malignant neoplasm of trachea, bronchus and lung Malignant melanoma of skin
Male Female Both Sexes
Rate** Male Female Both Sexes
Rate**
4,954 2,787 7,741 76.0 7,539 3,740 11,279 119.1
521 346 867 8.5 812 453 1,265 13.4
- - - 0.0 - - - 0.038 33 71 0.7 42 29 71 0.7
29 15 44 0.4 25 12 37 0.4198 122 320 3.1 379 234 613 6.549 41 90 0.9 66 45 111 1.2
- - - 0.0 - - - 0.018 2 20 0.2 13 4 17 0.2
- - - 0.0 - 1 1 0.0- - - 0.0 - - - 0.0- 1 1 0.0 1 1 2 0.0
76 65 141 1.4 96 79 175 1.8- - - 0.0 - - - 0.0
3 1 4 0.0 2 1 3 0.013 1 14 0.1 12 3 15 0.2
- - - 0.0 - - - 0.041 44 85 0.8 34 14 48 0.5
- - - 0.0 2 1 3 0.08 2 10 0.1 13 9 22 0.2
4 - 4 0.0 46 1 47 0.51 - 1 0.0 1 - 1 0.0
- - - 0.0 - - - 0.0- - - 0.0 - - - 0.01 2 3 0.0 4 1 5 0.1
42 17 59 0.6 76 18 94 1.0
348 259 607 6.0 413 371 784 8.3
14 2 16 0.2 13 8 21 0.2
- 2 2 0.0 - - - 0.01 1 2 0.0 5 2 7 0.16 7 13 0.1 30 19 49 0.5
11 11 22 0.2 27 18 45 0.5
- 1 1 0.0 3 2 5 0.1- - - 0.0 - - - 0.0
14 9 23 0.2 30 22 52 0.5
- - - 0.0 1 2 3 0.0
15-19 YEARS 20-24 YEARS
* Rate for this column was computed based on total population ** Rate is per 100 000 population of corresponding age group. 115

Table 28 MORTALITY BY CAUSE, AGE GROUP AND SEXNumber and Rate/100,000 Population
Philippines, 2015
CAUSE
Malignant neoplasm of breast Malignant neoplasm of cervix uteri Malignant neoplasm of other and unspecified parts of uterus Malignant neoplasm of ovary Malignant neoplasm of prostate Malignant neoplasm of bladder
Malignant neoplasm of meninges, brain and other parts of central nervous system Non–Hodgkin lymphoma Multiple myeloma and malignant plasma cell neoplasms LeukemiaRemainder of malignant neoplasms Remainder of Neoplasms
Diseases of the blood and blood–forming organs and certain disorders involving the immune mechanism
AnaemiasRemainder of diseases of the blood and blood forming organs and ceratin disorders involving the immune mechanism
Endocrine, nutritional and metabolic diseases
Diabetes MellitusMalnutritionRemainder endocrine, nutritional and metabolic diseases
Mental and behavioural disorders
Mental and behavioral disorder due to psychoactive substance useRemainder of mental and behavioral disorders
Diseases of the nervous system
MeningitisAlzheimer's diseaseRemainder diseases of the nervous system
Male Female Both Sexes
Rate** Male Female Both Sexes
Rate**
15-19 YEARS 20-24 YEARS
2 4 6 0.1 1 12 13 0.1- 2 2 0.0 - 8 8 0.1- 2 2 0.0 - 9 9 0.1
- 17 17 0.2 - 26 26 0.3- - - 0.0 - - - 0.0- - - 0.0 1 - 1 0.0
25 16 41 0.4 29 19 48 0.5
29 12 41 0.4 39 19 58 0.61 - 1 0.0 - - - 0.0
107 77 184 1.8 108 68 176 1.9100 60 160 1.6 81 87 168 1.838 36 74 0.7 45 50 95 1.0
52 80 132 1.3 63 72 135 1.4
26 44 70 0.7 35 47 82 0.926 36 62 0.6 28 25 53 0.6
105 124 229 2.2 155 174 329 3.5
27 47 74 0.7 46 47 93 1.016 16 32 0.3 23 11 34 0.462 61 123 1.2 86 116 202 2.1
4 3 7 0.1 13 3 16 0.2
3 - 3 0.0 8 - 8 0.1
1 3 4 0.0 5 3 8 0.1
331 188 519 5.1 260 182 442 4.7
63 45 108 1.1 49 42 91 1.0- - - 0.0 - - - 0.0
268 143 411 4.0 211 140 351 3.7
* Rate for this column was computed based on total population ** Rate is per 100 000 population of corresponding age group. 116
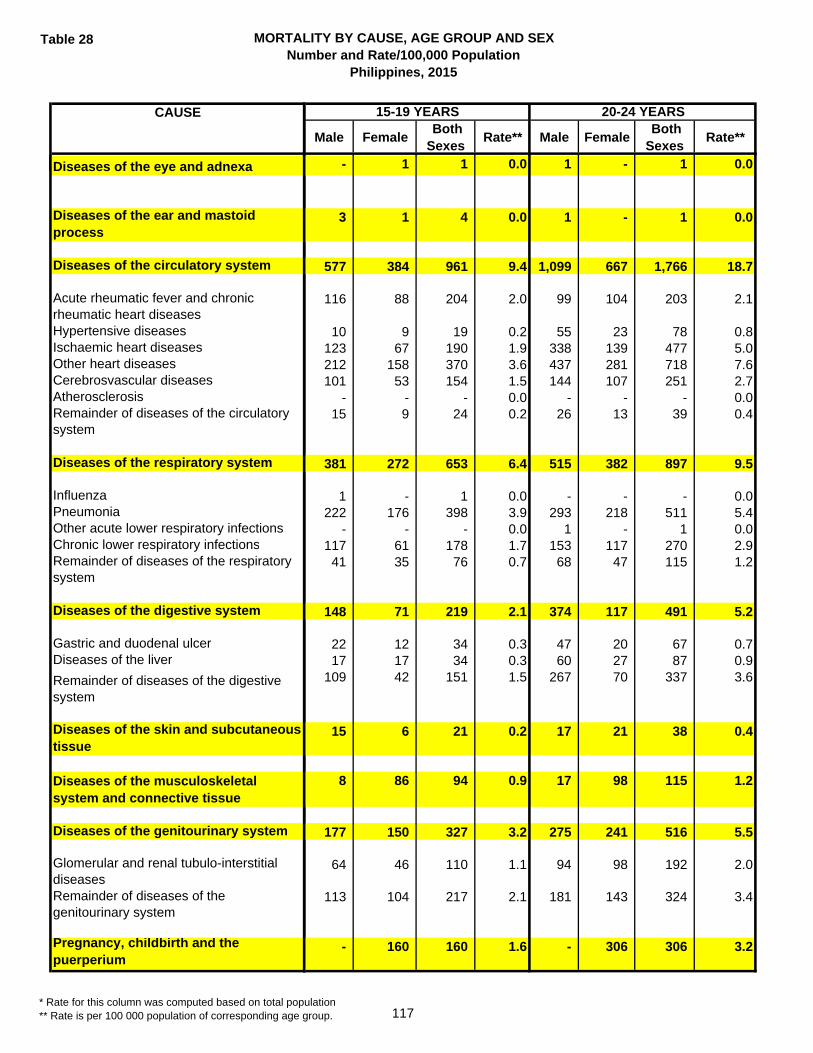
Table 28 MORTALITY BY CAUSE, AGE GROUP AND SEXNumber and Rate/100,000 Population
Philippines, 2015
CAUSE
Diseases of the eye and adnexa
Diseases of the ear and mastoid process
Diseases of the circulatory system
Acute rheumatic fever and chronic rheumatic heart diseasesHypertensive diseasesIschaemic heart diseasesOther heart diseasesCerebrosvascular diseasesAtherosclerosisRemainder of diseases of the circulatory system
Diseases of the respiratory system
InfluenzaPneumoniaOther acute lower respiratory infectionsChronic lower respiratory infectionsRemainder of diseases of the respiratory system
Diseases of the digestive system
Gastric and duodenal ulcerDiseases of the liver
Remainder of diseases of the digestive system
Diseases of the skin and subcutaneous tissue
Diseases of the musculoskeletal system and connective tissue
Diseases of the genitourinary system
Glomerular and renal tubulo-interstitial diseasesRemainder of diseases of the genitourinary system
Pregnancy, childbirth and the puerperium
Male Female Both Sexes
Rate** Male Female Both Sexes
Rate**
15-19 YEARS 20-24 YEARS
- 1 1 0.0 1 - 1 0.0
3 1 4 0.0 1 - 1 0.0
577 384 961 9.4 1,099 667 1,766 18.7
116 88 204 2.0 99 104 203 2.1
10 9 19 0.2 55 23 78 0.8123 67 190 1.9 338 139 477 5.0212 158 370 3.6 437 281 718 7.6101 53 154 1.5 144 107 251 2.7
- - - 0.0 - - - 0.015 9 24 0.2 26 13 39 0.4
381 272 653 6.4 515 382 897 9.5
1 - 1 0.0 - - - 0.0222 176 398 3.9 293 218 511 5.4
- - - 0.0 1 - 1 0.0117 61 178 1.7 153 117 270 2.941 35 76 0.7 68 47 115 1.2
148 71 219 2.1 374 117 491 5.2
22 12 34 0.3 47 20 67 0.717 17 34 0.3 60 27 87 0.9
109 42 151 1.5 267 70 337 3.6
15 6 21 0.2 17 21 38 0.4
8 86 94 0.9 17 98 115 1.2
177 150 327 3.2 275 241 516 5.5
64 46 110 1.1 94 98 192 2.0
113 104 217 2.1 181 143 324 3.4
- 160 160 1.6 - 306 306 3.2
* Rate for this column was computed based on total population ** Rate is per 100 000 population of corresponding age group. 117
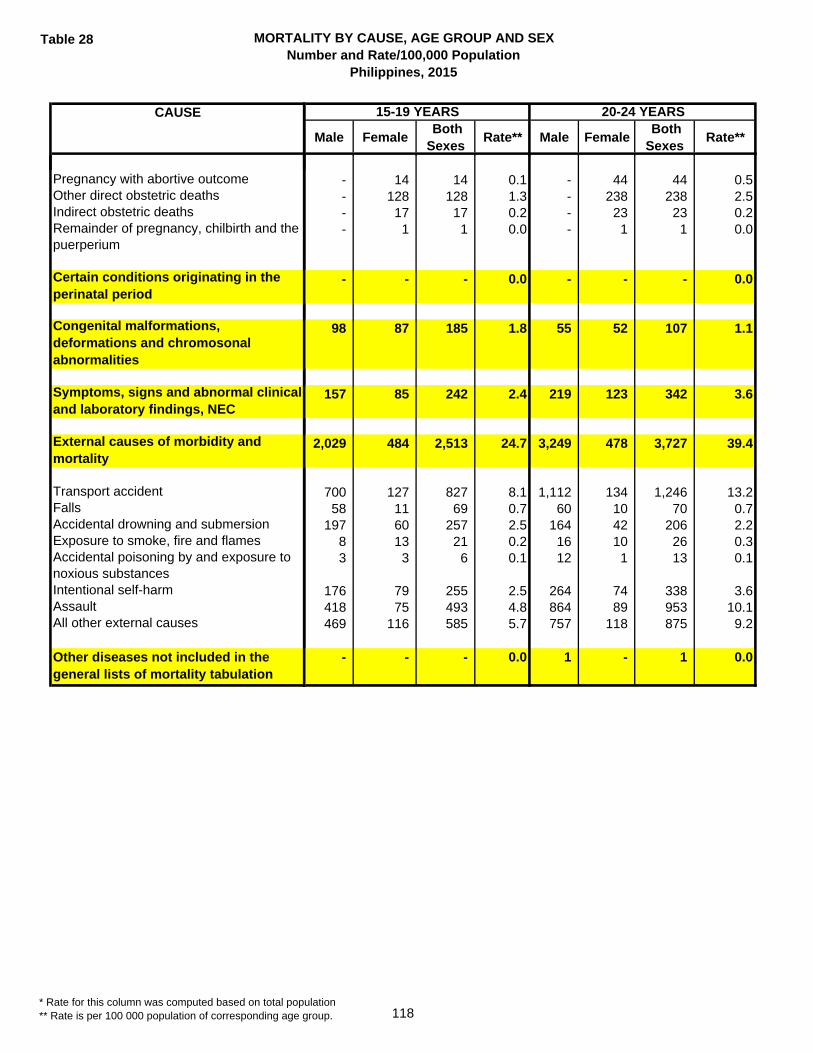
Table 28 MORTALITY BY CAUSE, AGE GROUP AND SEXNumber and Rate/100,000 Population
Philippines, 2015
CAUSE
Pregnancy with abortive outcomeOther direct obstetric deathsIndirect obstetric deathsRemainder of pregnancy, chilbirth and the puerperium
Certain conditions originating in the perinatal period
Congenital malformations, deformations and chromosonal abnormalities
Symptoms, signs and abnormal clinical and laboratory findings, NEC
External causes of morbidity and mortality
Transport accidentFallsAccidental drowning and submersionExposure to smoke, fire and flamesAccidental poisoning by and exposure to noxious substancesIntentional self-harmAssaultAll other external causes
Other diseases not included in the general lists of mortality tabulation
Male Female Both Sexes
Rate** Male Female Both Sexes
Rate**
15-19 YEARS 20-24 YEARS
- 14 14 0.1 - 44 44 0.5- 128 128 1.3 - 238 238 2.5- 17 17 0.2 - 23 23 0.2- 1 1 0.0 - 1 1 0.0
- - - 0.0 - - - 0.0
98 87 185 1.8 55 52 107 1.1
157 85 242 2.4 219 123 342 3.6
2,029 484 2,513 24.7 3,249 478 3,727 39.4
700 127 827 8.1 1,112 134 1,246 13.258 11 69 0.7 60 10 70 0.7
197 60 257 2.5 164 42 206 2.28 13 21 0.2 16 10 26 0.33 3 6 0.1 12 1 13 0.1
176 79 255 2.5 264 74 338 3.6418 75 493 4.8 864 89 953 10.1469 116 585 5.7 757 118 875 9.2
- - - 0.0 1 - 1 0.0
* Rate for this column was computed based on total population ** Rate is per 100 000 population of corresponding age group. 118

Table 28 MORTALITY BY CAUSE, AGE GROUP AND SEXNumber and Rate/100,000 Population
Philippines, 2015
CAUSE
T O T A L
Certain infectious and parasitic diseases
CholeraDiarrhea and gastroenteritis of presumed infectious originOther intestinal infectious diseasesRespiratory tuberculosisOther tuberculosisPlague
TetanusDiphtheriaWhooping coughMeningococcal infectionSepticaemia (Sepsis)Infections with a predominantly sexual mode of transmissionAcute poliomyelitisRabiesYellow feverOther arthropod-borne viral fevers and viral haemorrhagic feversMeasles
Viral hepatitisHuman immunodeficiency virus [HIV]
MalariaLeishmaniasisTrypanosomiasisSchistosomiasis [bilharziasis]Remainder of certain infectious and parasitic diseases
Neoplasms
Malignant neoplasm of lip, oral cavity and pharynx Malignant neoplasm of oesophagus Malignant neoplasm of stomach Malignant neoplasm of colon, rectum and anus Malignant neoplasm of liver and intrahepatic bile ducts Malignant neoplasm of pancreas Malignant neoplasm of larynx Malignant neoplasm of trachea, bronchus and lung Malignant melanoma of skin
Male Female Both Sexes
Rate** Male Female Both Sexes
Rate**
9,085 3,858 12,943 154.8 10,122 4,829 14,951 203.6
1,090 483 1,573 18.8 1,138 507 1,645 22.4
- - - 0.0 - - - 0.058 32 90 1.1 50 26 76 1.0
27 11 38 0.5 15 11 26 0.4596 266 862 10.3 687 299 986 13.483 49 132 1.6 70 41 111 1.5
- - - 0.0 - - - 0.018 2 20 0.2 20 3 23 0.3
- - - 0.0 - 1 1 0.0- - - 0.0 - - - 0.02 - 2 0.0 - - - 0.0
94 66 160 1.9 85 71 156 2.1- - - 0.0 - - - 0.0
1 1 2 0.0 2 - 2 0.09 6 15 0.2 10 3 13 0.2- - - 0.0 - - - 0.0
20 17 37 0.4 17 11 28 0.4
- - - 0.0 - - - 0.018 10 28 0.3 38 10 48 0.7
73 2 75 0.9 49 4 53 0.7- - - 0.0 1 3 4 0.1
- - - 0.0 - - - 0.0- - - 0.0 - - - 0.05 2 7 0.1 7 1 8 0.1
86 19 105 1.3 87 23 110 1.5
473 464 937 11.2 651 798 1,449 19.7
17 12 29 0.3 35 17 52 0.7
2 4 6 0.1 6 4 10 0.13 4 7 0.1 19 12 31 0.4
47 24 71 0.8 67 61 128 1.7
43 11 54 0.6 106 51 157 2.1
9 4 13 0.2 16 9 25 0.31 - 1 0.0 3 1 4 0.1
47 19 66 0.8 60 34 94 1.3
1 2 3 0.0 3 1 4 0.1
25-29 YEARS 30-34 YEARS
* Rate for this column was computed based on total population ** Rate is per 100 000 population of corresponding age group. 119
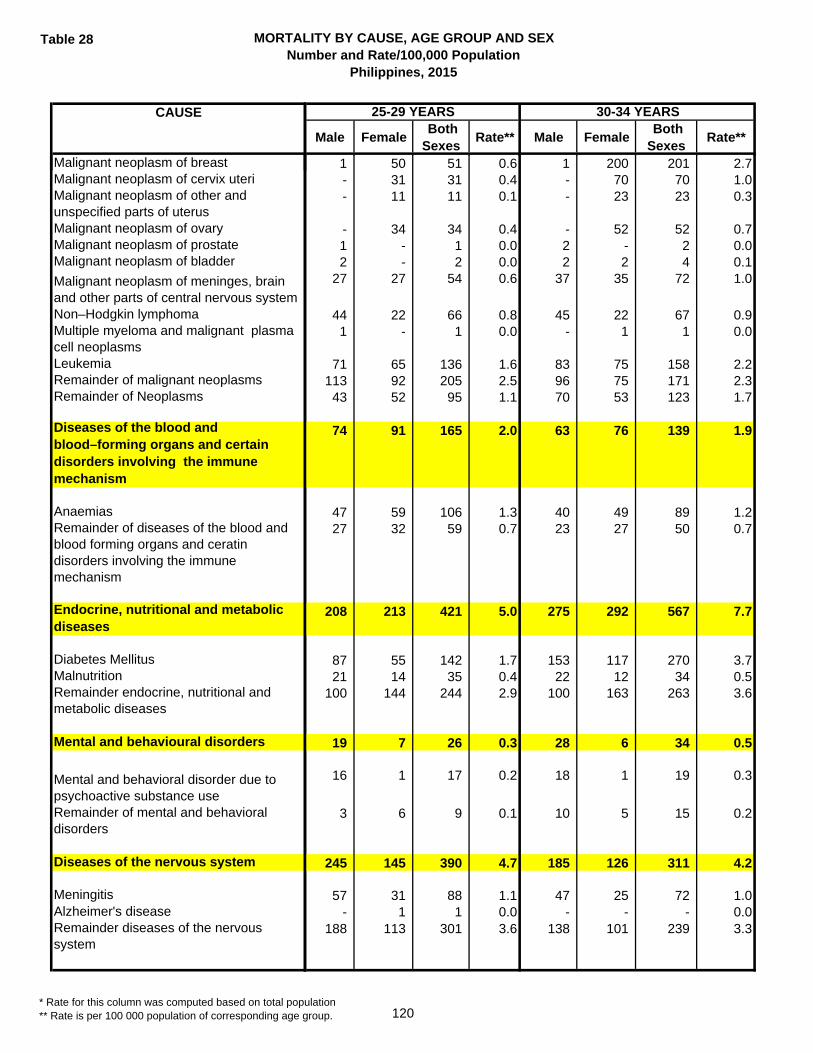
Table 28 MORTALITY BY CAUSE, AGE GROUP AND SEXNumber and Rate/100,000 Population
Philippines, 2015
CAUSE
Malignant neoplasm of breast Malignant neoplasm of cervix uteri Malignant neoplasm of other and unspecified parts of uterus Malignant neoplasm of ovary Malignant neoplasm of prostate Malignant neoplasm of bladder
Malignant neoplasm of meninges, brain and other parts of central nervous system Non–Hodgkin lymphoma Multiple myeloma and malignant plasma cell neoplasms LeukemiaRemainder of malignant neoplasms Remainder of Neoplasms
Diseases of the blood and blood–forming organs and certain disorders involving the immune mechanism
AnaemiasRemainder of diseases of the blood and blood forming organs and ceratin disorders involving the immune mechanism
Endocrine, nutritional and metabolic diseases
Diabetes MellitusMalnutritionRemainder endocrine, nutritional and metabolic diseases
Mental and behavioural disorders
Mental and behavioral disorder due to psychoactive substance useRemainder of mental and behavioral disorders
Diseases of the nervous system
MeningitisAlzheimer's diseaseRemainder diseases of the nervous system
Male Female Both Sexes
Rate** Male Female Both Sexes
Rate**
25-29 YEARS 30-34 YEARS
1 50 51 0.6 1 200 201 2.7- 31 31 0.4 - 70 70 1.0- 11 11 0.1 - 23 23 0.3
- 34 34 0.4 - 52 52 0.71 - 1 0.0 2 - 2 0.02 - 2 0.0 2 2 4 0.1
27 27 54 0.6 37 35 72 1.0
44 22 66 0.8 45 22 67 0.91 - 1 0.0 - 1 1 0.0
71 65 136 1.6 83 75 158 2.2113 92 205 2.5 96 75 171 2.343 52 95 1.1 70 53 123 1.7
74 91 165 2.0 63 76 139 1.9
47 59 106 1.3 40 49 89 1.227 32 59 0.7 23 27 50 0.7
208 213 421 5.0 275 292 567 7.7
87 55 142 1.7 153 117 270 3.721 14 35 0.4 22 12 34 0.5
100 144 244 2.9 100 163 263 3.6
19 7 26 0.3 28 6 34 0.5
16 1 17 0.2 18 1 19 0.3
3 6 9 0.1 10 5 15 0.2
245 145 390 4.7 185 126 311 4.2
57 31 88 1.1 47 25 72 1.0- 1 1 0.0 - - - 0.0
188 113 301 3.6 138 101 239 3.3
* Rate for this column was computed based on total population ** Rate is per 100 000 population of corresponding age group. 120
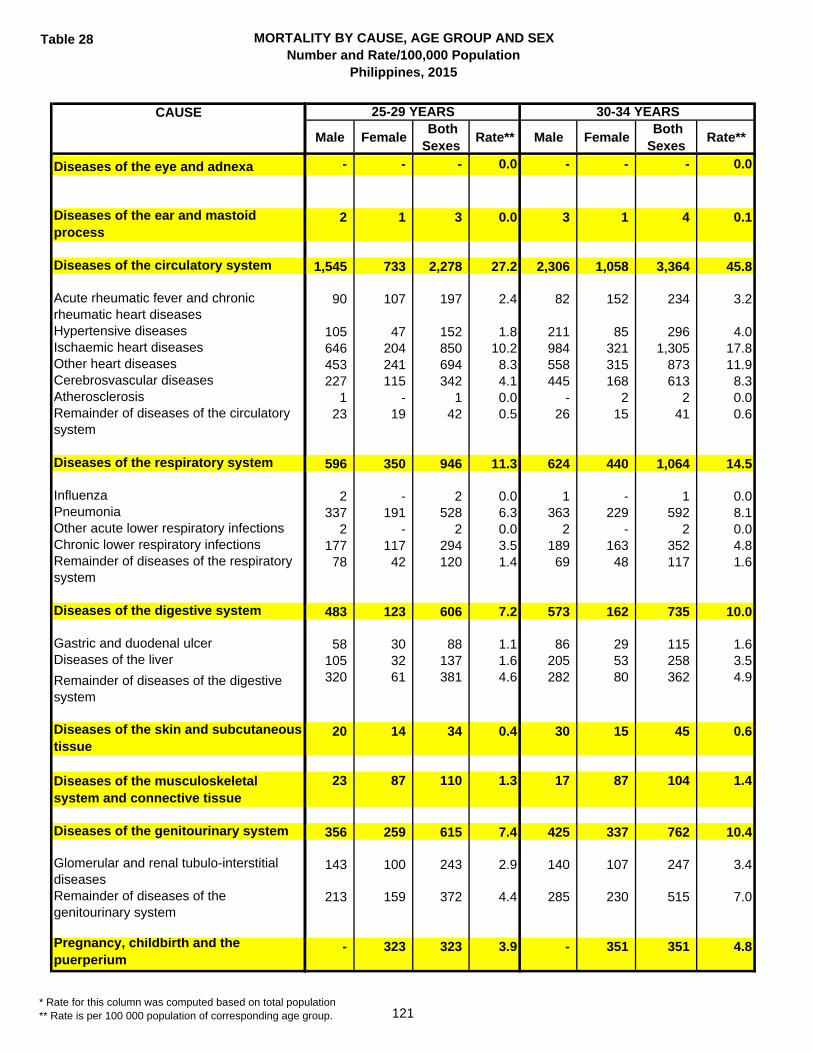
Table 28 MORTALITY BY CAUSE, AGE GROUP AND SEXNumber and Rate/100,000 Population
Philippines, 2015
CAUSE
Diseases of the eye and adnexa
Diseases of the ear and mastoid process
Diseases of the circulatory system
Acute rheumatic fever and chronic rheumatic heart diseasesHypertensive diseasesIschaemic heart diseasesOther heart diseasesCerebrosvascular diseasesAtherosclerosisRemainder of diseases of the circulatory system
Diseases of the respiratory system
InfluenzaPneumoniaOther acute lower respiratory infectionsChronic lower respiratory infectionsRemainder of diseases of the respiratory system
Diseases of the digestive system
Gastric and duodenal ulcerDiseases of the liver
Remainder of diseases of the digestive system
Diseases of the skin and subcutaneous tissue
Diseases of the musculoskeletal system and connective tissue
Diseases of the genitourinary system
Glomerular and renal tubulo-interstitial diseasesRemainder of diseases of the genitourinary system
Pregnancy, childbirth and the puerperium
Male Female Both Sexes
Rate** Male Female Both Sexes
Rate**
25-29 YEARS 30-34 YEARS
- - - 0.0 - - - 0.0
2 1 3 0.0 3 1 4 0.1
1,545 733 2,278 27.2 2,306 1,058 3,364 45.8
90 107 197 2.4 82 152 234 3.2
105 47 152 1.8 211 85 296 4.0646 204 850 10.2 984 321 1,305 17.8453 241 694 8.3 558 315 873 11.9227 115 342 4.1 445 168 613 8.3
1 - 1 0.0 - 2 2 0.023 19 42 0.5 26 15 41 0.6
596 350 946 11.3 624 440 1,064 14.5
2 - 2 0.0 1 - 1 0.0337 191 528 6.3 363 229 592 8.1
2 - 2 0.0 2 - 2 0.0177 117 294 3.5 189 163 352 4.878 42 120 1.4 69 48 117 1.6
483 123 606 7.2 573 162 735 10.0
58 30 88 1.1 86 29 115 1.6105 32 137 1.6 205 53 258 3.5320 61 381 4.6 282 80 362 4.9
20 14 34 0.4 30 15 45 0.6
23 87 110 1.3 17 87 104 1.4
356 259 615 7.4 425 337 762 10.4
143 100 243 2.9 140 107 247 3.4
213 159 372 4.4 285 230 515 7.0
- 323 323 3.9 - 351 351 4.8
* Rate for this column was computed based on total population ** Rate is per 100 000 population of corresponding age group. 121
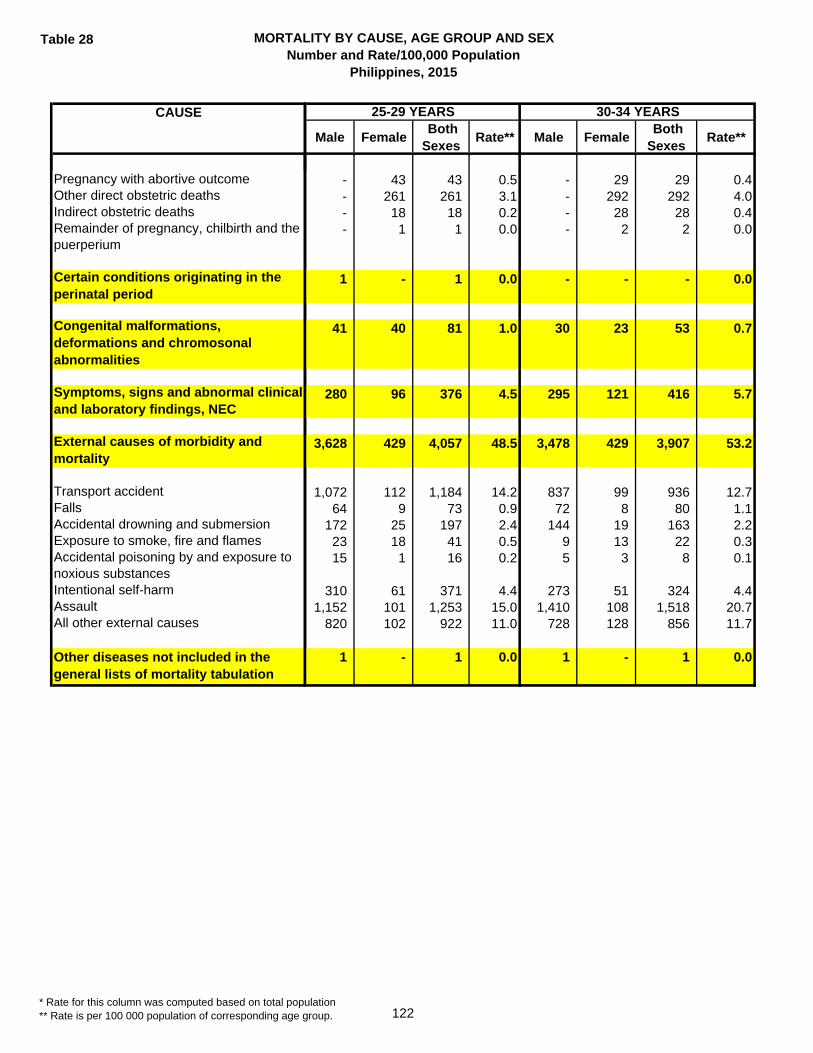
Table 28 MORTALITY BY CAUSE, AGE GROUP AND SEXNumber and Rate/100,000 Population
Philippines, 2015
CAUSE
Pregnancy with abortive outcomeOther direct obstetric deathsIndirect obstetric deathsRemainder of pregnancy, chilbirth and the puerperium
Certain conditions originating in the perinatal period
Congenital malformations, deformations and chromosonal abnormalities
Symptoms, signs and abnormal clinical and laboratory findings, NEC
External causes of morbidity and mortality
Transport accidentFallsAccidental drowning and submersionExposure to smoke, fire and flamesAccidental poisoning by and exposure to noxious substancesIntentional self-harmAssaultAll other external causes
Other diseases not included in the general lists of mortality tabulation
Male Female Both Sexes
Rate** Male Female Both Sexes
Rate**
25-29 YEARS 30-34 YEARS
- 43 43 0.5 - 29 29 0.4- 261 261 3.1 - 292 292 4.0- 18 18 0.2 - 28 28 0.4- 1 1 0.0 - 2 2 0.0
1 - 1 0.0 - - - 0.0
41 40 81 1.0 30 23 53 0.7
280 96 376 4.5 295 121 416 5.7
3,628 429 4,057 48.5 3,478 429 3,907 53.2
1,072 112 1,184 14.2 837 99 936 12.764 9 73 0.9 72 8 80 1.1
172 25 197 2.4 144 19 163 2.223 18 41 0.5 9 13 22 0.315 1 16 0.2 5 3 8 0.1
310 61 371 4.4 273 51 324 4.41,152 101 1,253 15.0 1,410 108 1,518 20.7
820 102 922 11.0 728 128 856 11.7
1 - 1 0.0 1 - 1 0.0
* Rate for this column was computed based on total population ** Rate is per 100 000 population of corresponding age group. 122
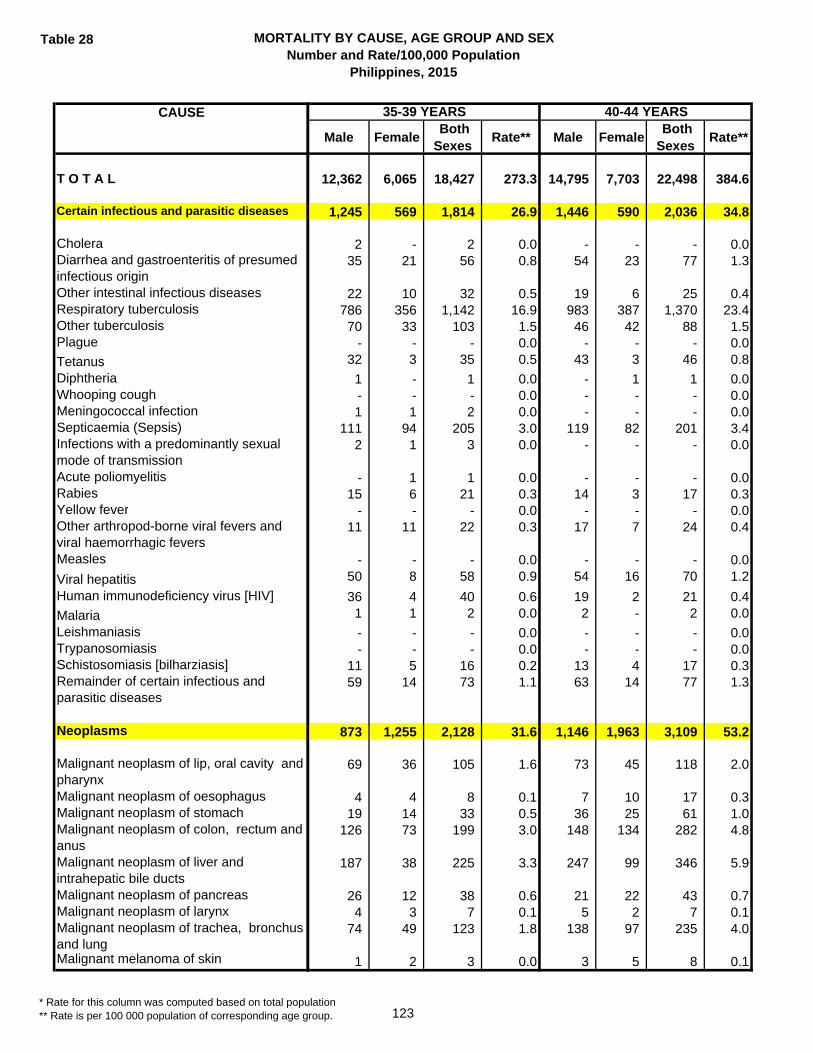
Table 28 MORTALITY BY CAUSE, AGE GROUP AND SEXNumber and Rate/100,000 Population
Philippines, 2015
CAUSE
T O T A L
Certain infectious and parasitic diseases
CholeraDiarrhea and gastroenteritis of presumed infectious originOther intestinal infectious diseasesRespiratory tuberculosisOther tuberculosisPlague
TetanusDiphtheriaWhooping coughMeningococcal infectionSepticaemia (Sepsis)Infections with a predominantly sexual mode of transmissionAcute poliomyelitisRabiesYellow feverOther arthropod-borne viral fevers and viral haemorrhagic feversMeasles
Viral hepatitisHuman immunodeficiency virus [HIV]
MalariaLeishmaniasisTrypanosomiasisSchistosomiasis [bilharziasis]Remainder of certain infectious and parasitic diseases
Neoplasms
Malignant neoplasm of lip, oral cavity and pharynx Malignant neoplasm of oesophagus Malignant neoplasm of stomach Malignant neoplasm of colon, rectum and anus Malignant neoplasm of liver and intrahepatic bile ducts Malignant neoplasm of pancreas Malignant neoplasm of larynx Malignant neoplasm of trachea, bronchus and lung Malignant melanoma of skin
Male Female Both Sexes
Rate** Male Female Both Sexes
Rate**
12,362 6,065 18,427 273.3 14,795 7,703 22,498 384.6
1,245 569 1,814 26.9 1,446 590 2,036 34.8
2 - 2 0.0 - - - 0.035 21 56 0.8 54 23 77 1.3
22 10 32 0.5 19 6 25 0.4786 356 1,142 16.9 983 387 1,370 23.470 33 103 1.5 46 42 88 1.5
- - - 0.0 - - - 0.032 3 35 0.5 43 3 46 0.8
1 - 1 0.0 - 1 1 0.0- - - 0.0 - - - 0.01 1 2 0.0 - - - 0.0
111 94 205 3.0 119 82 201 3.42 1 3 0.0 - - - 0.0
- 1 1 0.0 - - - 0.015 6 21 0.3 14 3 17 0.3
- - - 0.0 - - - 0.011 11 22 0.3 17 7 24 0.4
- - - 0.0 - - - 0.050 8 58 0.9 54 16 70 1.2
36 4 40 0.6 19 2 21 0.41 1 2 0.0 2 - 2 0.0
- - - 0.0 - - - 0.0- - - 0.0 - - - 0.0
11 5 16 0.2 13 4 17 0.359 14 73 1.1 63 14 77 1.3
873 1,255 2,128 31.6 1,146 1,963 3,109 53.2
69 36 105 1.6 73 45 118 2.0
4 4 8 0.1 7 10 17 0.319 14 33 0.5 36 25 61 1.0
126 73 199 3.0 148 134 282 4.8
187 38 225 3.3 247 99 346 5.9
26 12 38 0.6 21 22 43 0.74 3 7 0.1 5 2 7 0.1
74 49 123 1.8 138 97 235 4.0
1 2 3 0.0 3 5 8 0.1
35-39 YEARS 40-44 YEARS
* Rate for this column was computed based on total population ** Rate is per 100 000 population of corresponding age group. 123
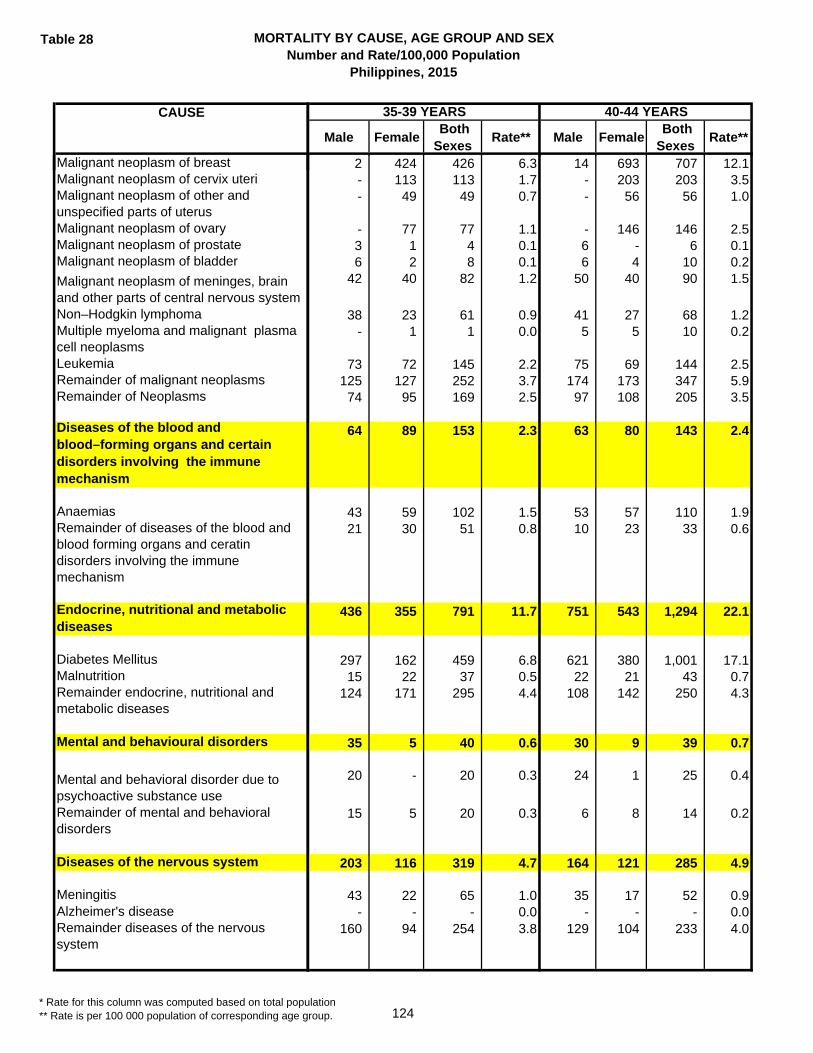
Table 28 MORTALITY BY CAUSE, AGE GROUP AND SEXNumber and Rate/100,000 Population
Philippines, 2015
CAUSE
Malignant neoplasm of breast Malignant neoplasm of cervix uteri Malignant neoplasm of other and unspecified parts of uterus Malignant neoplasm of ovary Malignant neoplasm of prostate Malignant neoplasm of bladder
Malignant neoplasm of meninges, brain and other parts of central nervous system Non–Hodgkin lymphoma Multiple myeloma and malignant plasma cell neoplasms LeukemiaRemainder of malignant neoplasms Remainder of Neoplasms
Diseases of the blood and blood–forming organs and certain disorders involving the immune mechanism
AnaemiasRemainder of diseases of the blood and blood forming organs and ceratin disorders involving the immune mechanism
Endocrine, nutritional and metabolic diseases
Diabetes MellitusMalnutritionRemainder endocrine, nutritional and metabolic diseases
Mental and behavioural disorders
Mental and behavioral disorder due to psychoactive substance useRemainder of mental and behavioral disorders
Diseases of the nervous system
MeningitisAlzheimer's diseaseRemainder diseases of the nervous system
Male Female Both Sexes
Rate** Male Female Both Sexes
Rate**
35-39 YEARS 40-44 YEARS
2 424 426 6.3 14 693 707 12.1- 113 113 1.7 - 203 203 3.5- 49 49 0.7 - 56 56 1.0
- 77 77 1.1 - 146 146 2.53 1 4 0.1 6 - 6 0.16 2 8 0.1 6 4 10 0.2
42 40 82 1.2 50 40 90 1.5
38 23 61 0.9 41 27 68 1.2- 1 1 0.0 5 5 10 0.2
73 72 145 2.2 75 69 144 2.5125 127 252 3.7 174 173 347 5.974 95 169 2.5 97 108 205 3.5
64 89 153 2.3 63 80 143 2.4
43 59 102 1.5 53 57 110 1.921 30 51 0.8 10 23 33 0.6
436 355 791 11.7 751 543 1,294 22.1
297 162 459 6.8 621 380 1,001 17.115 22 37 0.5 22 21 43 0.7
124 171 295 4.4 108 142 250 4.3
35 5 40 0.6 30 9 39 0.7
20 - 20 0.3 24 1 25 0.4
15 5 20 0.3 6 8 14 0.2
203 116 319 4.7 164 121 285 4.9
43 22 65 1.0 35 17 52 0.9- - - 0.0 - - - 0.0
160 94 254 3.8 129 104 233 4.0
* Rate for this column was computed based on total population ** Rate is per 100 000 population of corresponding age group. 124
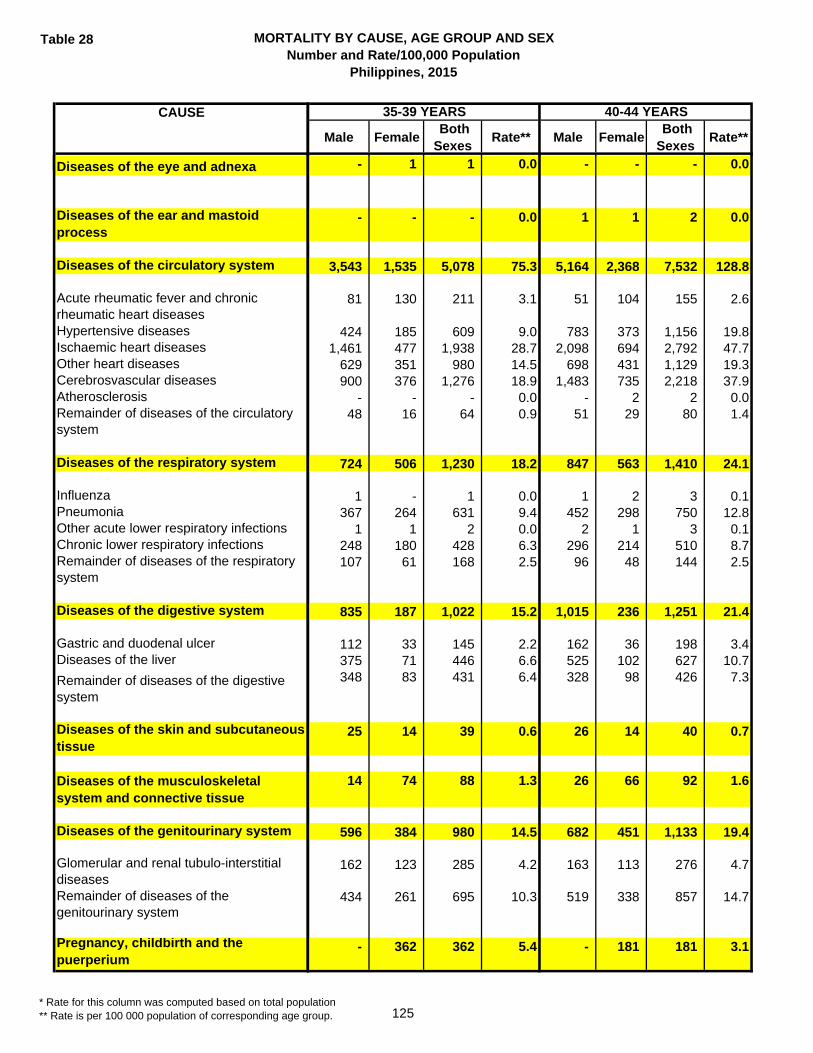
Table 28 MORTALITY BY CAUSE, AGE GROUP AND SEXNumber and Rate/100,000 Population
Philippines, 2015
CAUSE
Diseases of the eye and adnexa
Diseases of the ear and mastoid process
Diseases of the circulatory system
Acute rheumatic fever and chronic rheumatic heart diseasesHypertensive diseasesIschaemic heart diseasesOther heart diseasesCerebrosvascular diseasesAtherosclerosisRemainder of diseases of the circulatory system
Diseases of the respiratory system
InfluenzaPneumoniaOther acute lower respiratory infectionsChronic lower respiratory infectionsRemainder of diseases of the respiratory system
Diseases of the digestive system
Gastric and duodenal ulcerDiseases of the liver
Remainder of diseases of the digestive system
Diseases of the skin and subcutaneous tissue
Diseases of the musculoskeletal system and connective tissue
Diseases of the genitourinary system
Glomerular and renal tubulo-interstitial diseasesRemainder of diseases of the genitourinary system
Pregnancy, childbirth and the puerperium
Male Female Both Sexes
Rate** Male Female Both Sexes
Rate**
35-39 YEARS 40-44 YEARS
- 1 1 0.0 - - - 0.0
- - - 0.0 1 1 2 0.0
3,543 1,535 5,078 75.3 5,164 2,368 7,532 128.8
81 130 211 3.1 51 104 155 2.6
424 185 609 9.0 783 373 1,156 19.81,461 477 1,938 28.7 2,098 694 2,792 47.7
629 351 980 14.5 698 431 1,129 19.3900 376 1,276 18.9 1,483 735 2,218 37.9
- - - 0.0 - 2 2 0.048 16 64 0.9 51 29 80 1.4
724 506 1,230 18.2 847 563 1,410 24.1
1 - 1 0.0 1 2 3 0.1367 264 631 9.4 452 298 750 12.8
1 1 2 0.0 2 1 3 0.1248 180 428 6.3 296 214 510 8.7107 61 168 2.5 96 48 144 2.5
835 187 1,022 15.2 1,015 236 1,251 21.4
112 33 145 2.2 162 36 198 3.4375 71 446 6.6 525 102 627 10.7348 83 431 6.4 328 98 426 7.3
25 14 39 0.6 26 14 40 0.7
14 74 88 1.3 26 66 92 1.6
596 384 980 14.5 682 451 1,133 19.4
162 123 285 4.2 163 113 276 4.7
434 261 695 10.3 519 338 857 14.7
- 362 362 5.4 - 181 181 3.1
* Rate for this column was computed based on total population ** Rate is per 100 000 population of corresponding age group. 125
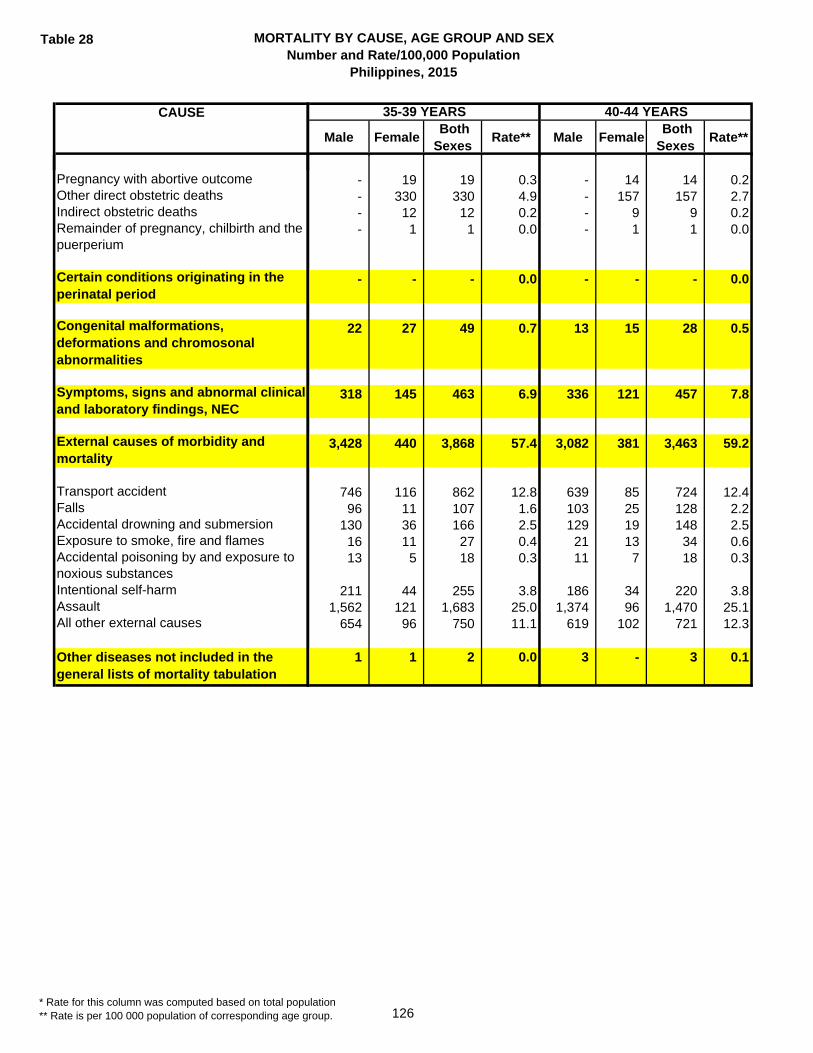
Table 28 MORTALITY BY CAUSE, AGE GROUP AND SEXNumber and Rate/100,000 Population
Philippines, 2015
CAUSE
Pregnancy with abortive outcomeOther direct obstetric deathsIndirect obstetric deathsRemainder of pregnancy, chilbirth and the puerperium
Certain conditions originating in the perinatal period
Congenital malformations, deformations and chromosonal abnormalities
Symptoms, signs and abnormal clinical and laboratory findings, NEC
External causes of morbidity and mortality
Transport accidentFallsAccidental drowning and submersionExposure to smoke, fire and flamesAccidental poisoning by and exposure to noxious substancesIntentional self-harmAssaultAll other external causes
Other diseases not included in the general lists of mortality tabulation
Male Female Both Sexes
Rate** Male Female Both Sexes
Rate**
35-39 YEARS 40-44 YEARS
- 19 19 0.3 - 14 14 0.2- 330 330 4.9 - 157 157 2.7- 12 12 0.2 - 9 9 0.2- 1 1 0.0 - 1 1 0.0
- - - 0.0 - - - 0.0
22 27 49 0.7 13 15 28 0.5
318 145 463 6.9 336 121 457 7.8
3,428 440 3,868 57.4 3,082 381 3,463 59.2
746 116 862 12.8 639 85 724 12.496 11 107 1.6 103 25 128 2.2
130 36 166 2.5 129 19 148 2.516 11 27 0.4 21 13 34 0.613 5 18 0.3 11 7 18 0.3
211 44 255 3.8 186 34 220 3.81,562 121 1,683 25.0 1,374 96 1,470 25.1
654 96 750 11.1 619 102 721 12.3
1 1 2 0.0 3 - 3 0.1
* Rate for this column was computed based on total population ** Rate is per 100 000 population of corresponding age group. 126
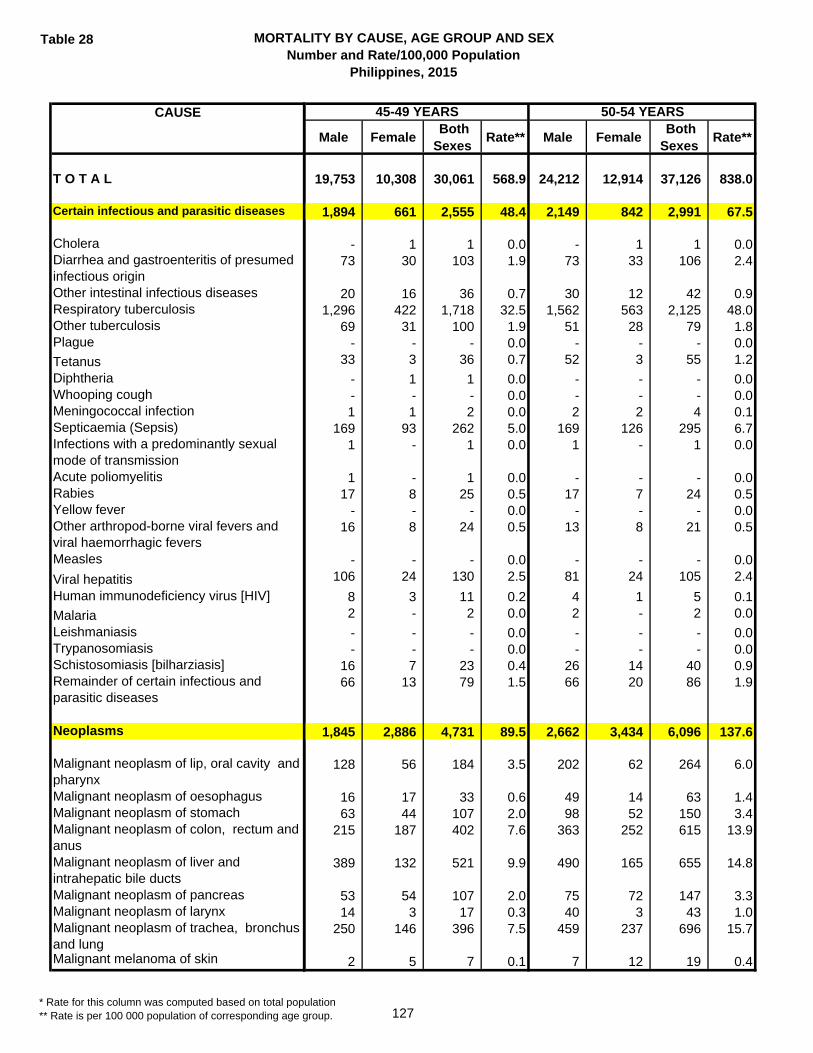
Table 28 MORTALITY BY CAUSE, AGE GROUP AND SEXNumber and Rate/100,000 Population
Philippines, 2015
CAUSE
T O T A L
Certain infectious and parasitic diseases
CholeraDiarrhea and gastroenteritis of presumed infectious originOther intestinal infectious diseasesRespiratory tuberculosisOther tuberculosisPlague
TetanusDiphtheriaWhooping coughMeningococcal infectionSepticaemia (Sepsis)Infections with a predominantly sexual mode of transmissionAcute poliomyelitisRabiesYellow feverOther arthropod-borne viral fevers and viral haemorrhagic feversMeasles
Viral hepatitisHuman immunodeficiency virus [HIV]
MalariaLeishmaniasisTrypanosomiasisSchistosomiasis [bilharziasis]Remainder of certain infectious and parasitic diseases
Neoplasms
Malignant neoplasm of lip, oral cavity and pharynx Malignant neoplasm of oesophagus Malignant neoplasm of stomach Malignant neoplasm of colon, rectum and anus Malignant neoplasm of liver and intrahepatic bile ducts Malignant neoplasm of pancreas Malignant neoplasm of larynx Malignant neoplasm of trachea, bronchus and lung Malignant melanoma of skin
Male Female Both Sexes
Rate** Male Female Both Sexes
Rate**
19,753 10,308 30,061 568.9 24,212 12,914 37,126 838.0
1,894 661 2,555 48.4 2,149 842 2,991 67.5
- 1 1 0.0 - 1 1 0.073 30 103 1.9 73 33 106 2.4
20 16 36 0.7 30 12 42 0.91,296 422 1,718 32.5 1,562 563 2,125 48.0
69 31 100 1.9 51 28 79 1.8- - - 0.0 - - - 0.0
33 3 36 0.7 52 3 55 1.2
- 1 1 0.0 - - - 0.0- - - 0.0 - - - 0.01 1 2 0.0 2 2 4 0.1
169 93 262 5.0 169 126 295 6.71 - 1 0.0 1 - 1 0.0
1 - 1 0.0 - - - 0.017 8 25 0.5 17 7 24 0.5
- - - 0.0 - - - 0.016 8 24 0.5 13 8 21 0.5
- - - 0.0 - - - 0.0106 24 130 2.5 81 24 105 2.4
8 3 11 0.2 4 1 5 0.12 - 2 0.0 2 - 2 0.0
- - - 0.0 - - - 0.0- - - 0.0 - - - 0.0
16 7 23 0.4 26 14 40 0.966 13 79 1.5 66 20 86 1.9
1,845 2,886 4,731 89.5 2,662 3,434 6,096 137.6
128 56 184 3.5 202 62 264 6.0
16 17 33 0.6 49 14 63 1.463 44 107 2.0 98 52 150 3.4
215 187 402 7.6 363 252 615 13.9
389 132 521 9.9 490 165 655 14.8
53 54 107 2.0 75 72 147 3.314 3 17 0.3 40 3 43 1.0
250 146 396 7.5 459 237 696 15.7
2 5 7 0.1 7 12 19 0.4
50-54 YEARS45-49 YEARS
* Rate for this column was computed based on total population ** Rate is per 100 000 population of corresponding age group. 127

Table 28 MORTALITY BY CAUSE, AGE GROUP AND SEXNumber and Rate/100,000 Population
Philippines, 2015
CAUSE
Malignant neoplasm of breast Malignant neoplasm of cervix uteri Malignant neoplasm of other and unspecified parts of uterus Malignant neoplasm of ovary Malignant neoplasm of prostate Malignant neoplasm of bladder
Malignant neoplasm of meninges, brain and other parts of central nervous system Non–Hodgkin lymphoma Multiple myeloma and malignant plasma cell neoplasms LeukemiaRemainder of malignant neoplasms Remainder of Neoplasms
Diseases of the blood and blood–forming organs and certain disorders involving the immune mechanism
AnaemiasRemainder of diseases of the blood and blood forming organs and ceratin disorders involving the immune mechanism
Endocrine, nutritional and metabolic diseases
Diabetes MellitusMalnutritionRemainder endocrine, nutritional and metabolic diseases
Mental and behavioural disorders
Mental and behavioral disorder due to psychoactive substance useRemainder of mental and behavioral disorders
Diseases of the nervous system
MeningitisAlzheimer's diseaseRemainder diseases of the nervous system
Male Female Both Sexes
Rate** Male Female Both Sexes
Rate**
50-54 YEARS45-49 YEARS
10 1,031 1,041 19.7 17 1,127 1,144 25.8- 269 269 5.1 - 288 288 6.5- 96 96 1.8 - 159 159 3.6
- 205 205 3.9 - 244 244 5.526 - 26 0.5 68 1 69 1.68 6 14 0.3 13 12 25 0.6
69 59 128 2.4 74 78 152 3.4
52 42 94 1.8 68 40 108 2.417 16 33 0.6 15 15 30 0.7
80 83 163 3.1 77 86 163 3.7295 270 565 10.7 355 335 690 15.6158 165 323 6.1 192 180 372 8.4
98 97 195 3.7 92 106 198 4.5
67 69 136 2.6 72 81 153 3.531 28 59 1.1 20 25 45 1.0
1,324 913 2,237 42.3 2,033 1,444 3,477 78.5
1,166 708 1,874 35.5 1,900 1,250 3,150 71.130 20 50 0.9 33 26 59 1.3
128 185 313 5.9 100 168 268 6.0
39 6 45 0.9 38 14 52 1.2
26 2 28 0.5 31 3 34 0.8
13 4 17 0.3 7 11 18 0.4
196 118 314 5.9 197 92 289 6.5
32 14 46 0.9 30 11 41 0.9- 1 1 0.0 - - - 0.0
164 103 267 5.1 167 81 248 5.6
* Rate for this column was computed based on total population ** Rate is per 100 000 population of corresponding age group. 128
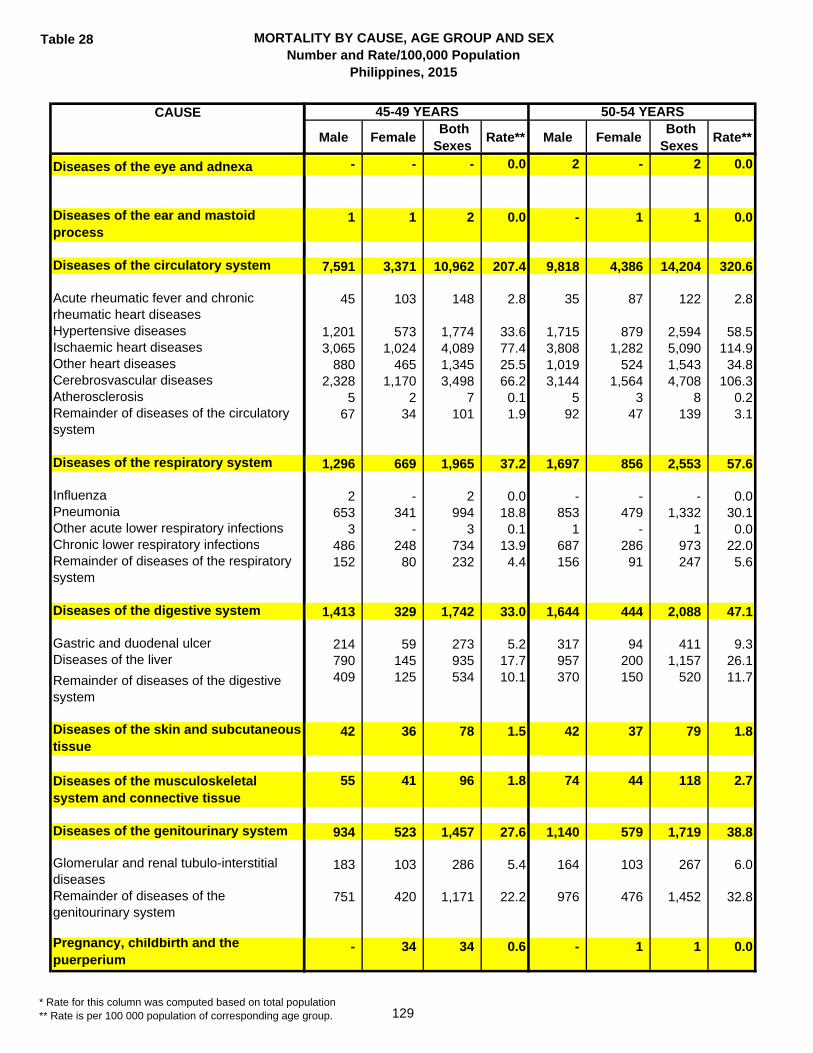
Table 28 MORTALITY BY CAUSE, AGE GROUP AND SEXNumber and Rate/100,000 Population
Philippines, 2015
CAUSE
Diseases of the eye and adnexa
Diseases of the ear and mastoid process
Diseases of the circulatory system
Acute rheumatic fever and chronic rheumatic heart diseasesHypertensive diseasesIschaemic heart diseasesOther heart diseasesCerebrosvascular diseasesAtherosclerosisRemainder of diseases of the circulatory system
Diseases of the respiratory system
InfluenzaPneumoniaOther acute lower respiratory infectionsChronic lower respiratory infectionsRemainder of diseases of the respiratory system
Diseases of the digestive system
Gastric and duodenal ulcerDiseases of the liver
Remainder of diseases of the digestive system
Diseases of the skin and subcutaneous tissue
Diseases of the musculoskeletal system and connective tissue
Diseases of the genitourinary system
Glomerular and renal tubulo-interstitial diseasesRemainder of diseases of the genitourinary system
Pregnancy, childbirth and the puerperium
Male Female Both Sexes
Rate** Male Female Both Sexes
Rate**
50-54 YEARS45-49 YEARS
- - - 0.0 2 - 2 0.0
1 1 2 0.0 - 1 1 0.0
7,591 3,371 10,962 207.4 9,818 4,386 14,204 320.6
45 103 148 2.8 35 87 122 2.8
1,201 573 1,774 33.6 1,715 879 2,594 58.53,065 1,024 4,089 77.4 3,808 1,282 5,090 114.9
880 465 1,345 25.5 1,019 524 1,543 34.82,328 1,170 3,498 66.2 3,144 1,564 4,708 106.3
5 2 7 0.1 5 3 8 0.267 34 101 1.9 92 47 139 3.1
1,296 669 1,965 37.2 1,697 856 2,553 57.6
2 - 2 0.0 - - - 0.0653 341 994 18.8 853 479 1,332 30.1
3 - 3 0.1 1 - 1 0.0486 248 734 13.9 687 286 973 22.0152 80 232 4.4 156 91 247 5.6
1,413 329 1,742 33.0 1,644 444 2,088 47.1
214 59 273 5.2 317 94 411 9.3790 145 935 17.7 957 200 1,157 26.1409 125 534 10.1 370 150 520 11.7
42 36 78 1.5 42 37 79 1.8
55 41 96 1.8 74 44 118 2.7
934 523 1,457 27.6 1,140 579 1,719 38.8
183 103 286 5.4 164 103 267 6.0
751 420 1,171 22.2 976 476 1,452 32.8
- 34 34 0.6 - 1 1 0.0
* Rate for this column was computed based on total population ** Rate is per 100 000 population of corresponding age group. 129

Table 28 MORTALITY BY CAUSE, AGE GROUP AND SEXNumber and Rate/100,000 Population
Philippines, 2015
CAUSE
Pregnancy with abortive outcomeOther direct obstetric deathsIndirect obstetric deathsRemainder of pregnancy, chilbirth and the puerperium
Certain conditions originating in the perinatal period
Congenital malformations, deformations and chromosonal abnormalities
Symptoms, signs and abnormal clinical and laboratory findings, NEC
External causes of morbidity and mortality
Transport accidentFallsAccidental drowning and submersionExposure to smoke, fire and flamesAccidental poisoning by and exposure to noxious substancesIntentional self-harmAssaultAll other external causes
Other diseases not included in the general lists of mortality tabulation
Male Female Both Sexes
Rate** Male Female Both Sexes
Rate**
50-54 YEARS45-49 YEARS
- 10 10 0.2 - - - 0.0- 22 22 0.4 - 1 1 0.0- 2 2 0.0 - - - 0.0- - - 0.0 - - - 0.0
- - - 0.0 - - - 0.0
14 15 29 0.5 10 11 21 0.5
396 180 576 10.9 475 193 668 15.1
2,614 428 3,042 57.6 2,137 430 2,567 57.9
585 136 721 13.6 523 132 655 14.8104 18 122 2.3 101 25 126 2.895 23 118 2.2 102 28 130 2.918 9 27 0.5 11 6 17 0.416 3 19 0.4 11 3 14 0.3
160 23 183 3.5 112 32 144 3.31,073 101 1,174 22.2 812 83 895 20.2
563 115 678 12.8 465 121 586 13.2
1 - 1 0.0 2 - 2 0.0
* Rate for this column was computed based on total population ** Rate is per 100 000 population of corresponding age group. 130
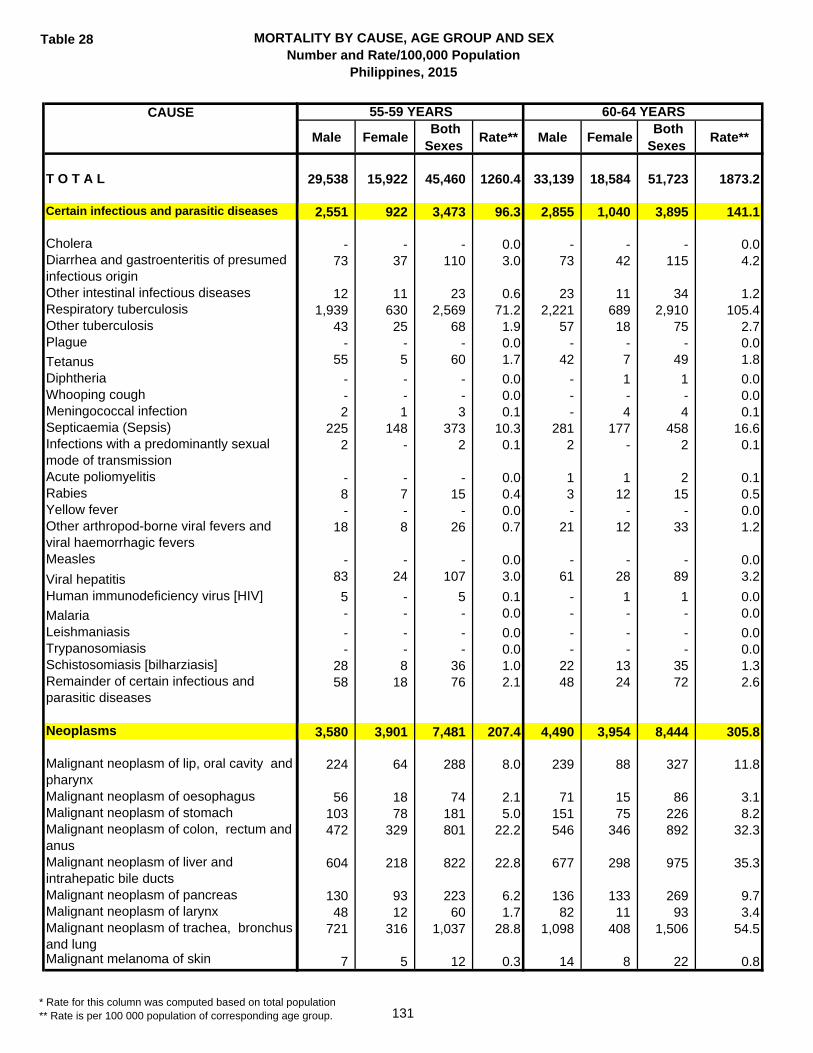
Table 28 MORTALITY BY CAUSE, AGE GROUP AND SEXNumber and Rate/100,000 Population
Philippines, 2015
CAUSE
T O T A L
Certain infectious and parasitic diseases
CholeraDiarrhea and gastroenteritis of presumed infectious originOther intestinal infectious diseasesRespiratory tuberculosisOther tuberculosisPlague
TetanusDiphtheriaWhooping coughMeningococcal infectionSepticaemia (Sepsis)Infections with a predominantly sexual mode of transmissionAcute poliomyelitisRabiesYellow feverOther arthropod-borne viral fevers and viral haemorrhagic feversMeasles
Viral hepatitisHuman immunodeficiency virus [HIV]
MalariaLeishmaniasisTrypanosomiasisSchistosomiasis [bilharziasis]Remainder of certain infectious and parasitic diseases
Neoplasms
Malignant neoplasm of lip, oral cavity and pharynx Malignant neoplasm of oesophagus Malignant neoplasm of stomach Malignant neoplasm of colon, rectum and anus Malignant neoplasm of liver and intrahepatic bile ducts Malignant neoplasm of pancreas Malignant neoplasm of larynx Malignant neoplasm of trachea, bronchus and lung Malignant melanoma of skin
Male Female Both Sexes
Rate** Male Female Both Sexes
Rate**
29,538 15,922 45,460 1260.4 33,139 18,584 51,723 1873.2
2,551 922 3,473 96.3 2,855 1,040 3,895 141.1
- - - 0.0 - - - 0.073 37 110 3.0 73 42 115 4.2
12 11 23 0.6 23 11 34 1.21,939 630 2,569 71.2 2,221 689 2,910 105.4
43 25 68 1.9 57 18 75 2.7- - - 0.0 - - - 0.0
55 5 60 1.7 42 7 49 1.8
- - - 0.0 - 1 1 0.0- - - 0.0 - - - 0.02 1 3 0.1 - 4 4 0.1
225 148 373 10.3 281 177 458 16.62 - 2 0.1 2 - 2 0.1
- - - 0.0 1 1 2 0.18 7 15 0.4 3 12 15 0.5- - - 0.0 - - - 0.0
18 8 26 0.7 21 12 33 1.2
- - - 0.0 - - - 0.083 24 107 3.0 61 28 89 3.2
5 - 5 0.1 - 1 1 0.0- - - 0.0 - - - 0.0
- - - 0.0 - - - 0.0- - - 0.0 - - - 0.0
28 8 36 1.0 22 13 35 1.358 18 76 2.1 48 24 72 2.6
3,580 3,901 7,481 207.4 4,490 3,954 8,444 305.8
224 64 288 8.0 239 88 327 11.8
56 18 74 2.1 71 15 86 3.1103 78 181 5.0 151 75 226 8.2472 329 801 22.2 546 346 892 32.3
604 218 822 22.8 677 298 975 35.3
130 93 223 6.2 136 133 269 9.748 12 60 1.7 82 11 93 3.4
721 316 1,037 28.8 1,098 408 1,506 54.5
7 5 12 0.3 14 8 22 0.8
55-59 YEARS 60-64 YEARS
* Rate for this column was computed based on total population ** Rate is per 100 000 population of corresponding age group. 131
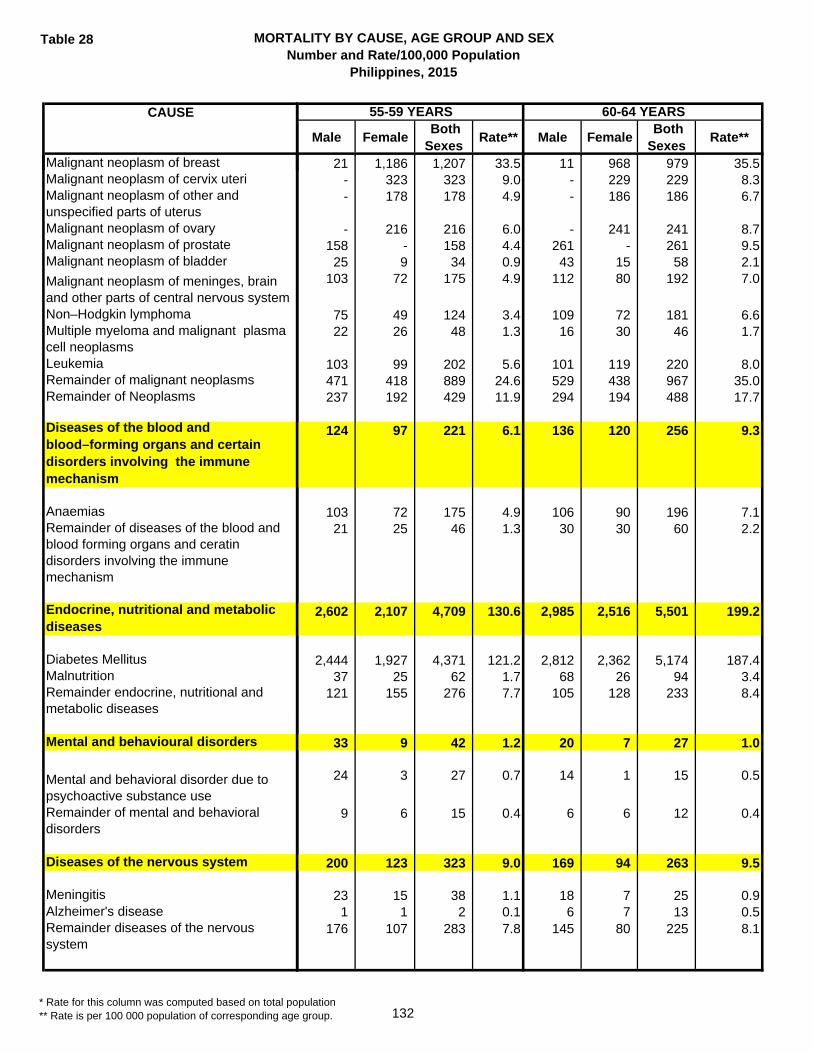
Table 28 MORTALITY BY CAUSE, AGE GROUP AND SEXNumber and Rate/100,000 Population
Philippines, 2015
CAUSE
Malignant neoplasm of breast Malignant neoplasm of cervix uteri Malignant neoplasm of other and unspecified parts of uterus Malignant neoplasm of ovary Malignant neoplasm of prostate Malignant neoplasm of bladder
Malignant neoplasm of meninges, brain and other parts of central nervous system Non–Hodgkin lymphoma Multiple myeloma and malignant plasma cell neoplasms LeukemiaRemainder of malignant neoplasms Remainder of Neoplasms
Diseases of the blood and blood–forming organs and certain disorders involving the immune mechanism
AnaemiasRemainder of diseases of the blood and blood forming organs and ceratin disorders involving the immune mechanism
Endocrine, nutritional and metabolic diseases
Diabetes MellitusMalnutritionRemainder endocrine, nutritional and metabolic diseases
Mental and behavioural disorders
Mental and behavioral disorder due to psychoactive substance useRemainder of mental and behavioral disorders
Diseases of the nervous system
MeningitisAlzheimer's diseaseRemainder diseases of the nervous system
Male Female Both Sexes
Rate** Male Female Both Sexes
Rate**
55-59 YEARS 60-64 YEARS
21 1,186 1,207 33.5 11 968 979 35.5- 323 323 9.0 - 229 229 8.3- 178 178 4.9 - 186 186 6.7
- 216 216 6.0 - 241 241 8.7158 - 158 4.4 261 - 261 9.525 9 34 0.9 43 15 58 2.1
103 72 175 4.9 112 80 192 7.0
75 49 124 3.4 109 72 181 6.622 26 48 1.3 16 30 46 1.7
103 99 202 5.6 101 119 220 8.0471 418 889 24.6 529 438 967 35.0237 192 429 11.9 294 194 488 17.7
124 97 221 6.1 136 120 256 9.3
103 72 175 4.9 106 90 196 7.121 25 46 1.3 30 30 60 2.2
2,602 2,107 4,709 130.6 2,985 2,516 5,501 199.2
2,444 1,927 4,371 121.2 2,812 2,362 5,174 187.437 25 62 1.7 68 26 94 3.4
121 155 276 7.7 105 128 233 8.4
33 9 42 1.2 20 7 27 1.0
24 3 27 0.7 14 1 15 0.5
9 6 15 0.4 6 6 12 0.4
200 123 323 9.0 169 94 263 9.5
23 15 38 1.1 18 7 25 0.91 1 2 0.1 6 7 13 0.5
176 107 283 7.8 145 80 225 8.1
* Rate for this column was computed based on total population ** Rate is per 100 000 population of corresponding age group. 132

Table 28 MORTALITY BY CAUSE, AGE GROUP AND SEXNumber and Rate/100,000 Population
Philippines, 2015
CAUSE
Diseases of the eye and adnexa
Diseases of the ear and mastoid process
Diseases of the circulatory system
Acute rheumatic fever and chronic rheumatic heart diseasesHypertensive diseasesIschaemic heart diseasesOther heart diseasesCerebrosvascular diseasesAtherosclerosisRemainder of diseases of the circulatory system
Diseases of the respiratory system
InfluenzaPneumoniaOther acute lower respiratory infectionsChronic lower respiratory infectionsRemainder of diseases of the respiratory system
Diseases of the digestive system
Gastric and duodenal ulcerDiseases of the liver
Remainder of diseases of the digestive system
Diseases of the skin and subcutaneous tissue
Diseases of the musculoskeletal system and connective tissue
Diseases of the genitourinary system
Glomerular and renal tubulo-interstitial diseasesRemainder of diseases of the genitourinary system
Pregnancy, childbirth and the puerperium
Male Female Both Sexes
Rate** Male Female Both Sexes
Rate**
55-59 YEARS 60-64 YEARS
1 - 1 0.0 - 1 1 0.0
1 2 3 0.1 - 2 2 0.1
12,353 5,780 18,133 502.7 13,488 7,064 20,552 744.3
31 71 102 2.8 33 53 86 3.1
2,190 1,122 3,312 91.8 2,516 1,417 3,933 142.44,830 1,879 6,709 186.0 5,101 2,285 7,386 267.51,277 666 1,943 53.9 1,490 797 2,287 82.83,907 1,989 5,896 163.5 4,222 2,444 6,666 241.4
8 3 11 0.3 13 4 17 0.6110 50 160 4.4 113 64 177 6.4
2,457 1,108 3,565 98.8 3,783 1,556 5,339 193.4
2 - 2 0.1 2 - 2 0.11,115 615 1,730 48.0 1,725 913 2,638 95.5
3 - 3 0.1 4 2 6 0.21,137 373 1,510 41.9 1,814 501 2,315 83.8
200 120 320 8.9 238 140 378 13.7
1,769 533 2,302 63.8 1,691 650 2,341 84.8
400 101 501 13.9 452 153 605 21.9934 259 1,193 33.1 848 321 1,169 42.3435 173 608 16.9 391 176 567 20.5
79 34 113 3.1 74 60 134 4.9
82 46 128 3.5 72 33 105 3.8
1,323 652 1,975 54.8 1,470 776 2,246 81.3
192 103 295 8.2 192 120 312 11.3
1,131 549 1,680 46.6 1,278 656 1,934 70.0
- - - 0.0 - - - 0.0
* Rate for this column was computed based on total population ** Rate is per 100 000 population of corresponding age group. 133

Table 28 MORTALITY BY CAUSE, AGE GROUP AND SEXNumber and Rate/100,000 Population
Philippines, 2015
CAUSE
Pregnancy with abortive outcomeOther direct obstetric deathsIndirect obstetric deathsRemainder of pregnancy, chilbirth and the puerperium
Certain conditions originating in the perinatal period
Congenital malformations, deformations and chromosonal abnormalities
Symptoms, signs and abnormal clinical and laboratory findings, NEC
External causes of morbidity and mortality
Transport accidentFallsAccidental drowning and submersionExposure to smoke, fire and flamesAccidental poisoning by and exposure to noxious substancesIntentional self-harmAssaultAll other external causes
Other diseases not included in the general lists of mortality tabulation
Male Female Both Sexes
Rate** Male Female Both Sexes
Rate**
55-59 YEARS 60-64 YEARS
- - - 0.0 - - - 0.0- - - 0.0 - - - 0.0- - - 0.0 - - - 0.0- - - 0.0 - - - 0.0
- - - 0.0 - - - 0.0
14 11 25 0.7 6 9 15 0.5
542 223 765 21.2 597 317 914 33.1
1,824 374 2,198 60.9 1,302 385 1,687 61.1
484 128 612 17.0 358 120 478 17.3147 26 173 4.8 112 46 158 5.7116 21 137 3.8 82 20 102 3.712 3 15 0.4 7 8 15 0.514 1 15 0.4 12 2 14 0.5
75 23 98 2.7 63 15 78 2.8578 76 654 18.1 327 63 390 14.1398 96 494 13.7 341 111 452 16.4
3 - 3 0.1 1 - 1 0.0
* Rate for this column was computed based on total population ** Rate is per 100 000 population of corresponding age group. 134
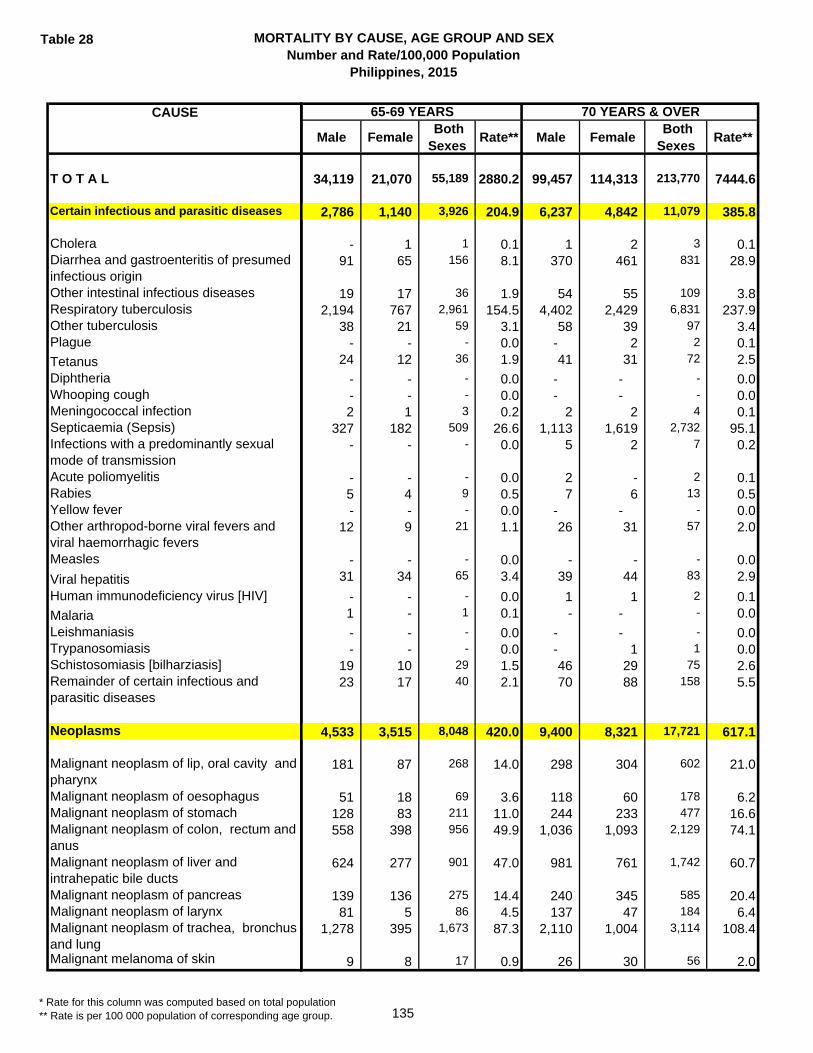
Table 28 MORTALITY BY CAUSE, AGE GROUP AND SEXNumber and Rate/100,000 Population
Philippines, 2015
CAUSE
T O T A L
Certain infectious and parasitic diseases
CholeraDiarrhea and gastroenteritis of presumed infectious originOther intestinal infectious diseasesRespiratory tuberculosisOther tuberculosisPlague
TetanusDiphtheriaWhooping coughMeningococcal infectionSepticaemia (Sepsis)Infections with a predominantly sexual mode of transmissionAcute poliomyelitisRabiesYellow feverOther arthropod-borne viral fevers and viral haemorrhagic feversMeasles
Viral hepatitisHuman immunodeficiency virus [HIV]
MalariaLeishmaniasisTrypanosomiasisSchistosomiasis [bilharziasis]Remainder of certain infectious and parasitic diseases
Neoplasms
Malignant neoplasm of lip, oral cavity and pharynx Malignant neoplasm of oesophagus Malignant neoplasm of stomach Malignant neoplasm of colon, rectum and anus Malignant neoplasm of liver and intrahepatic bile ducts Malignant neoplasm of pancreas Malignant neoplasm of larynx Malignant neoplasm of trachea, bronchus and lung Malignant melanoma of skin
Male Female Both Sexes
Rate** Male Female Both Sexes
Rate**
34,119 21,070 55,189 2880.2 99,457 114,313 213,770 7444.6
2,786 1,140 3,926 204.9 6,237 4,842 11,079 385.8
- 1 1 0.1 1 2 3 0.191 65 156 8.1 370 461 831 28.9
19 17 36 1.9 54 55 109 3.82,194 767 2,961 154.5 4,402 2,429 6,831 237.9
38 21 59 3.1 58 39 97 3.4- - - 0.0 - 2 2 0.1
24 12 36 1.9 41 31 72 2.5
- - - 0.0 - - - 0.0- - - 0.0 - - - 0.02 1 3 0.2 2 2 4 0.1
327 182 509 26.6 1,113 1,619 2,732 95.1- - - 0.0 5 2 7 0.2
- - - 0.0 2 - 2 0.15 4 9 0.5 7 6 13 0.5- - - 0.0 - - - 0.0
12 9 21 1.1 26 31 57 2.0
- - - 0.0 - - - 0.031 34 65 3.4 39 44 83 2.9
- - - 0.0 1 1 2 0.11 - 1 0.1 - - - 0.0
- - - 0.0 - - - 0.0- - - 0.0 - 1 1 0.0
19 10 29 1.5 46 29 75 2.623 17 40 2.1 70 88 158 5.5
4,533 3,515 8,048 420.0 9,400 8,321 17,721 617.1
181 87 268 14.0 298 304 602 21.0
51 18 69 3.6 118 60 178 6.2128 83 211 11.0 244 233 477 16.6558 398 956 49.9 1,036 1,093 2,129 74.1
624 277 901 47.0 981 761 1,742 60.7
139 136 275 14.4 240 345 585 20.481 5 86 4.5 137 47 184 6.4
1,278 395 1,673 87.3 2,110 1,004 3,114 108.4
9 8 17 0.9 26 30 56 2.0
65-69 YEARS 70 YEARS & OVER
* Rate for this column was computed based on total population ** Rate is per 100 000 population of corresponding age group. 135
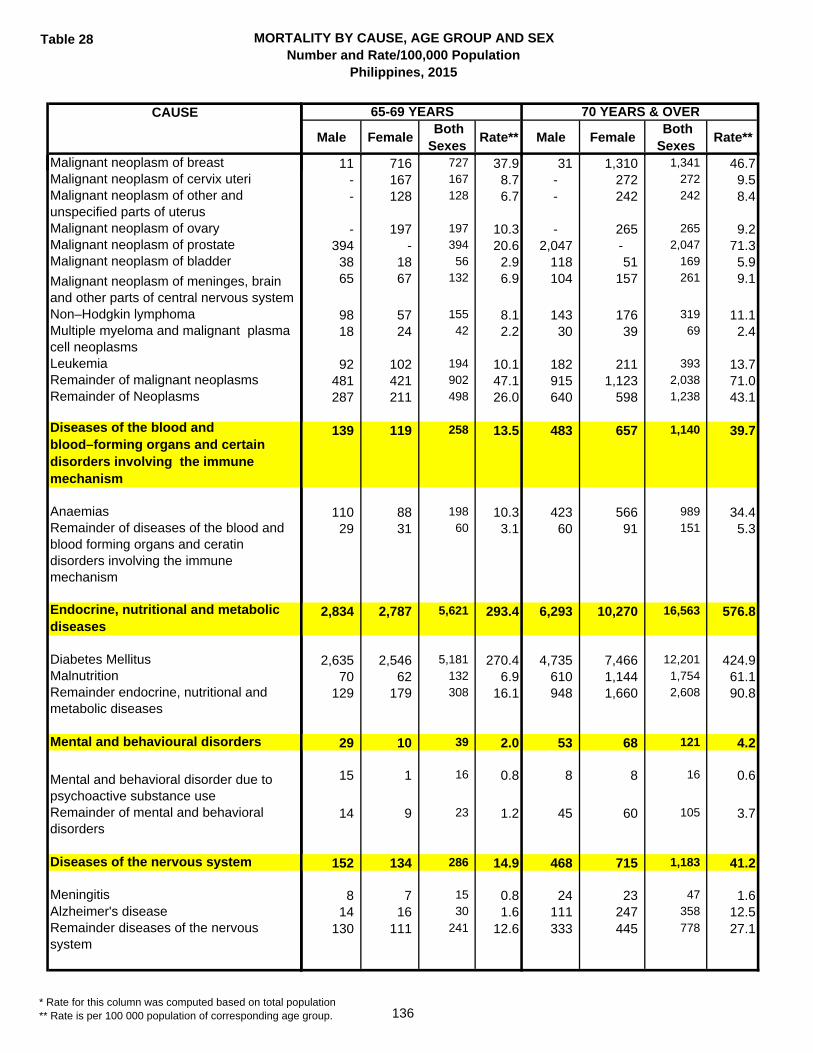
Table 28 MORTALITY BY CAUSE, AGE GROUP AND SEXNumber and Rate/100,000 Population
Philippines, 2015
CAUSE
Malignant neoplasm of breast Malignant neoplasm of cervix uteri Malignant neoplasm of other and unspecified parts of uterus Malignant neoplasm of ovary Malignant neoplasm of prostate Malignant neoplasm of bladder
Malignant neoplasm of meninges, brain and other parts of central nervous system Non–Hodgkin lymphoma Multiple myeloma and malignant plasma cell neoplasms LeukemiaRemainder of malignant neoplasms Remainder of Neoplasms
Diseases of the blood and blood–forming organs and certain disorders involving the immune mechanism
AnaemiasRemainder of diseases of the blood and blood forming organs and ceratin disorders involving the immune mechanism
Endocrine, nutritional and metabolic diseases
Diabetes MellitusMalnutritionRemainder endocrine, nutritional and metabolic diseases
Mental and behavioural disorders
Mental and behavioral disorder due to psychoactive substance useRemainder of mental and behavioral disorders
Diseases of the nervous system
MeningitisAlzheimer's diseaseRemainder diseases of the nervous system
Male Female Both Sexes
Rate** Male Female Both Sexes
Rate**
65-69 YEARS 70 YEARS & OVER
11 716 727 37.9 31 1,310 1,341 46.7- 167 167 8.7 - 272 272 9.5- 128 128 6.7 - 242 242 8.4
- 197 197 10.3 - 265 265 9.2394 - 394 20.6 2,047 - 2,047 71.338 18 56 2.9 118 51 169 5.965 67 132 6.9 104 157 261 9.1
98 57 155 8.1 143 176 319 11.118 24 42 2.2 30 39 69 2.4
92 102 194 10.1 182 211 393 13.7481 421 902 47.1 915 1,123 2,038 71.0287 211 498 26.0 640 598 1,238 43.1
139 119 258 13.5 483 657 1,140 39.7
110 88 198 10.3 423 566 989 34.429 31 60 3.1 60 91 151 5.3
2,834 2,787 5,621 293.4 6,293 10,270 16,563 576.8
2,635 2,546 5,181 270.4 4,735 7,466 12,201 424.970 62 132 6.9 610 1,144 1,754 61.1
129 179 308 16.1 948 1,660 2,608 90.8
29 10 39 2.0 53 68 121 4.2
15 1 16 0.8 8 8 16 0.6
14 9 23 1.2 45 60 105 3.7
152 134 286 14.9 468 715 1,183 41.2
8 7 15 0.8 24 23 47 1.614 16 30 1.6 111 247 358 12.5
130 111 241 12.6 333 445 778 27.1
* Rate for this column was computed based on total population ** Rate is per 100 000 population of corresponding age group. 136

Table 28 MORTALITY BY CAUSE, AGE GROUP AND SEXNumber and Rate/100,000 Population
Philippines, 2015
CAUSE
Diseases of the eye and adnexa
Diseases of the ear and mastoid process
Diseases of the circulatory system
Acute rheumatic fever and chronic rheumatic heart diseasesHypertensive diseasesIschaemic heart diseasesOther heart diseasesCerebrosvascular diseasesAtherosclerosisRemainder of diseases of the circulatory system
Diseases of the respiratory system
InfluenzaPneumoniaOther acute lower respiratory infectionsChronic lower respiratory infectionsRemainder of diseases of the respiratory system
Diseases of the digestive system
Gastric and duodenal ulcerDiseases of the liver
Remainder of diseases of the digestive system
Diseases of the skin and subcutaneous tissue
Diseases of the musculoskeletal system and connective tissue
Diseases of the genitourinary system
Glomerular and renal tubulo-interstitial diseasesRemainder of diseases of the genitourinary system
Pregnancy, childbirth and the puerperium
Male Female Both Sexes
Rate** Male Female Both Sexes
Rate**
65-69 YEARS 70 YEARS & OVER
1 - 1 0.1 7 2 9 0.3
3 - 3 0.2 1 - 1 0.0
13,956 8,756 22,712 1185.3 39,216 49,951 89,167 3105.3
28 33 61 3.2 33 81 114 4.0
2,632 1,845 4,477 233.6 7,064 9,018 16,082 560.15,228 2,734 7,962 415.5 13,530 16,122 29,652 1032.61,580 1,076 2,656 138.6 6,796 9,625 16,421 571.94,358 3,002 7,360 384.1 11,030 14,127 25,157 876.1
11 6 17 0.9 401 645 1,046 36.4119 60 179 9.3 362 333 695 24.2
4,895 2,143 7,038 367.3 22,767 23,066 45,833 1596.2
3 1 4 0.2 12 18 30 1.02,181 1,275 3,456 180.4 13,457 17,923 31,380 1092.8
3 5 8 0.4 22 18 40 1.42,474 699 3,173 165.6 8,275 3,956 12,231 426.0
234 163 397 20.7 1,001 1,151 2,152 74.9
1,661 728 2,389 124.7 3,555 3,129 6,684 232.8
505 183 688 35.9 1,415 1,139 2,554 88.9706 312 1,018 53.1 985 859 1,844 64.2450 233 683 35.6 1,155 1,131 2,286 79.6
77 83 160 8.4 449 990 1,439 50.1
86 48 134 7.0 394 578 972 33.9
1,368 866 2,234 116.6 4,091 3,436 7,527 262.1
205 119 324 16.9 490 404 894 31.1
1,163 747 1,910 99.7 3,601 3,032 6,633 231.0
- - - 0.0 - 1 1 0.0
* Rate for this column was computed based on total population ** Rate is per 100 000 population of corresponding age group. 137
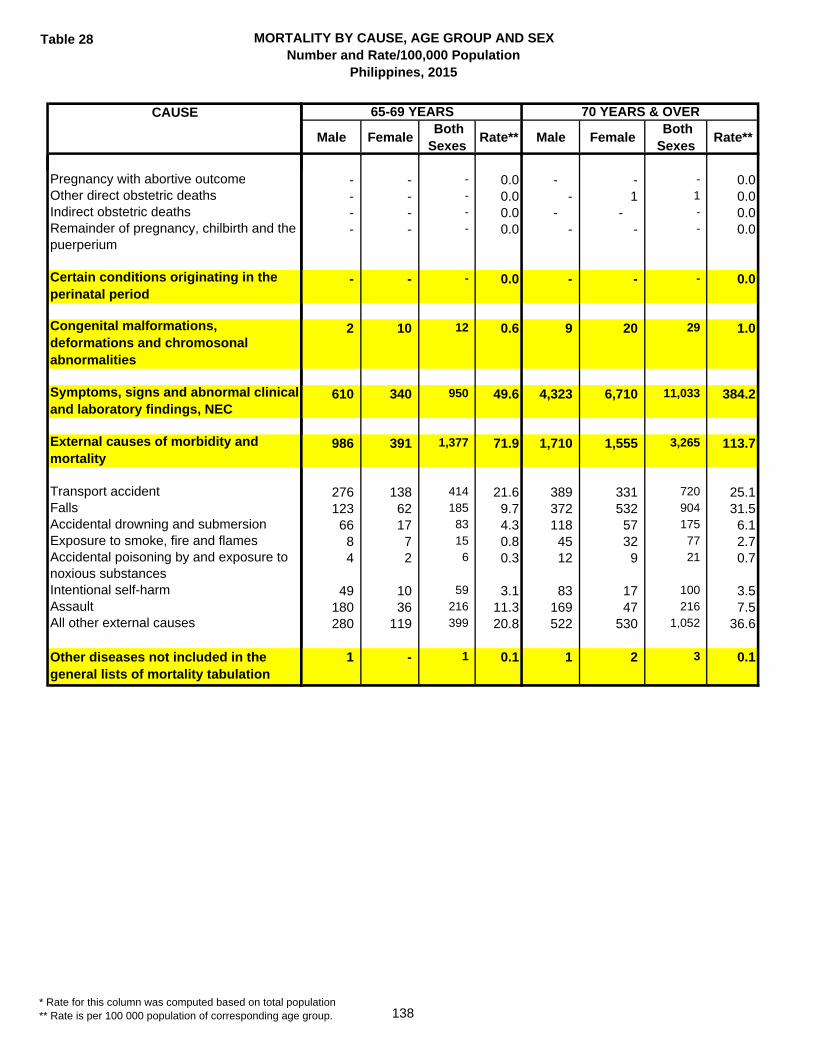
Table 28 MORTALITY BY CAUSE, AGE GROUP AND SEXNumber and Rate/100,000 Population
Philippines, 2015
CAUSE
Pregnancy with abortive outcomeOther direct obstetric deathsIndirect obstetric deathsRemainder of pregnancy, chilbirth and the puerperium
Certain conditions originating in the perinatal period
Congenital malformations, deformations and chromosonal abnormalities
Symptoms, signs and abnormal clinical and laboratory findings, NEC
External causes of morbidity and mortality
Transport accidentFallsAccidental drowning and submersionExposure to smoke, fire and flamesAccidental poisoning by and exposure to noxious substancesIntentional self-harmAssaultAll other external causes
Other diseases not included in the general lists of mortality tabulation
Male Female Both Sexes
Rate** Male Female Both Sexes
Rate**
65-69 YEARS 70 YEARS & OVER
- - - 0.0 - - - 0.0- - - 0.0 - 1 1 0.0- - - 0.0 - - - 0.0- - - 0.0 - - - 0.0
- - - 0.0 - - - 0.0
2 10 12 0.6 9 20 29 1.0
610 340 950 49.6 4,323 6,710 11,033 384.2
986 391 1,377 71.9 1,710 1,555 3,265 113.7
276 138 414 21.6 389 331 720 25.1123 62 185 9.7 372 532 904 31.566 17 83 4.3 118 57 175 6.18 7 15 0.8 45 32 77 2.74 2 6 0.3 12 9 21 0.7
49 10 59 3.1 83 17 100 3.5180 36 216 11.3 169 47 216 7.5280 119 399 20.8 522 530 1,052 36.6
1 - 1 0.1 1 2 3 0.1
* Rate for this column was computed based on total population ** Rate is per 100 000 population of corresponding age group. 138
Table 28 MORTALITY BY CAUSE, AGE GROUP AND SEXNumber and Rate/100,000 Population
Philippines, 2015
CAUSE
T O T A L
Certain infectious and parasitic diseases
CholeraDiarrhea and gastroenteritis of presumed infectious originOther intestinal infectious diseasesRespiratory tuberculosisOther tuberculosisPlague
TetanusDiphtheriaWhooping coughMeningococcal infectionSepticaemia (Sepsis)Infections with a predominantly sexual mode of transmissionAcute poliomyelitisRabiesYellow feverOther arthropod-borne viral fevers and viral haemorrhagic feversMeasles
Viral hepatitisHuman immunodeficiency virus [HIV]
MalariaLeishmaniasisTrypanosomiasisSchistosomiasis [bilharziasis]Remainder of certain infectious and parasitic diseases
Neoplasms
Malignant neoplasm of lip, oral cavity and pharynx Malignant neoplasm of oesophagus Malignant neoplasm of stomach Malignant neoplasm of colon, rectum and anus Malignant neoplasm of liver and intrahepatic bile ducts Malignant neoplasm of pancreas Malignant neoplasm of larynx Malignant neoplasm of trachea, bronchus and lung Malignant melanoma of skin
Male FemaleBoth
Sexes
194 97 291
19 12 31
1 - 12 1 3
1 2 312 6 18
- - 0- - 01 - 1
- - 0- - 0- - 01 2 3- - 0
- - 0- - 0
- - 0- - 0
- - 01 1 2
- - 0- - 0
- - 0- - 0- - 0- - 0
2 3 5
- - 0
- - 01 - 1- - 0
- 1 1
- - 0- - 0- - 0
- - 0
AGE NOT STATED
* Rate for this column was computed based on total population ** Rate is per 100 000 population of corresponding age group. 139
Table 28 MORTALITY BY CAUSE, AGE GROUP AND SEXNumber and Rate/100,000 Population
Philippines, 2015
CAUSE
Malignant neoplasm of breast Malignant neoplasm of cervix uteri Malignant neoplasm of other and unspecified parts of uterus Malignant neoplasm of ovary Malignant neoplasm of prostate Malignant neoplasm of bladder
Malignant neoplasm of meninges, brain and other parts of central nervous system Non–Hodgkin lymphoma Multiple myeloma and malignant plasma cell neoplasms LeukemiaRemainder of malignant neoplasms Remainder of Neoplasms
Diseases of the blood and blood–forming organs and certain disorders involving the immune mechanism
AnaemiasRemainder of diseases of the blood and blood forming organs and ceratin disorders involving the immune mechanism
Endocrine, nutritional and metabolic diseases
Diabetes MellitusMalnutritionRemainder endocrine, nutritional and metabolic diseases
Mental and behavioural disorders
Mental and behavioral disorder due to psychoactive substance useRemainder of mental and behavioral disorders
Diseases of the nervous system
MeningitisAlzheimer's diseaseRemainder diseases of the nervous system
Male FemaleBoth
Sexes
AGE NOT STATED
- 2 2- - 0- - 0
- - 0- - 0- - 0- - 0
- - 0- - 0
1 - 1- - 0- - 0
- 1 1
- - 0- 1 1
5 11 16
3 5 82 2 4- 4 4
- - 0
- - 0
- - 0
- 1 1
- - 0- - 0- 1 1
* Rate for this column was computed based on total population ** Rate is per 100 000 population of corresponding age group. 140
Table 28 MORTALITY BY CAUSE, AGE GROUP AND SEXNumber and Rate/100,000 Population
Philippines, 2015
CAUSE
Diseases of the eye and adnexa
Diseases of the ear and mastoid process
Diseases of the circulatory system
Acute rheumatic fever and chronic rheumatic heart diseasesHypertensive diseasesIschaemic heart diseasesOther heart diseasesCerebrosvascular diseasesAtherosclerosisRemainder of diseases of the circulatory system
Diseases of the respiratory system
InfluenzaPneumoniaOther acute lower respiratory infectionsChronic lower respiratory infectionsRemainder of diseases of the respiratory system
Diseases of the digestive system
Gastric and duodenal ulcerDiseases of the liver
Remainder of diseases of the digestive system
Diseases of the skin and subcutaneous tissue
Diseases of the musculoskeletal system and connective tissue
Diseases of the genitourinary system
Glomerular and renal tubulo-interstitial diseasesRemainder of diseases of the genitourinary system
Pregnancy, childbirth and the puerperium
Male FemaleBoth
Sexes
AGE NOT STATED
- - 0
- - 0
36 22 58
- - 0
7 - 720 12 327 3 102 7 9
- - 0- - 0
19 10 29
- - 013 9 22
- - 04 1 52 - 2
7 2 9
2 1 34 1 51 - 1
- - 0
- - 0
4 3 7
- - 0
4 3 7
- - 0
* Rate for this column was computed based on total population ** Rate is per 100 000 population of corresponding age group. 141

Table 28 MORTALITY BY CAUSE, AGE GROUP AND SEXNumber and Rate/100,000 Population
Philippines, 2015
CAUSE
Pregnancy with abortive outcomeOther direct obstetric deathsIndirect obstetric deathsRemainder of pregnancy, chilbirth and the puerperium
Certain conditions originating in the perinatal period
Congenital malformations, deformations and chromosonal abnormalities
Symptoms, signs and abnormal clinical and laboratory findings, NEC
External causes of morbidity and mortality
Transport accidentFallsAccidental drowning and submersionExposure to smoke, fire and flamesAccidental poisoning by and exposure to noxious substancesIntentional self-harmAssaultAll other external causes
Other diseases not included in the general lists of mortality tabulation
Male FemaleBoth
Sexes
AGE NOT STATED
- - 0- - 0- - 0- - 0
- 1 1
1 1 2
55 19 74
46 11 57
12 3 15- 1 1
3 1 4- 1 1
- - 0
2 - 220 2 229 3 12
- - 0
* Rate for this column was computed based on total population ** Rate is per 100 000 population of corresponding age group. 142

Table 29
SELECTED CAUSES OF DEATHBy Region, Province and City
Number and Rate/100,000 PopulationPhilippines, 2015
AREANo. Rate No. Rate No. Rate
PHILIPPINES 4,279 4.2 26,047 25.8 7,000 6.9
NATIONAL CAPITAL REGION 422 3.3 3,884 30.2 1,363 10.6
City of Manila 63 3.5 743 41.7 625 35.1City of Mandaluyong 15 3.9 133 34.4 28 7.2City of Marikina 10 2.2 137 30.4 23 5.1City of Pasig 15 2.0 203 26.9 55 7.3Quezon City 81 2.8 833 28.4 207 7.1San Juan 4 3.3 31 25.4 14 11.5Kalookan City 57 3.6 536 33.8 72 4.5City of Malabon 12 3.3 119 32.6 17 4.7Navotas 9 3.6 109 43.7 16 6.4City of Valenzuela 10 1.6 182 29.3 40 6.4City of Las Piñas 21 3.6 171 29.0 51 8.7City of Makati 9 1.5 88 15.1 31 5.3City of Muntinlupa 30 5.9 153 30.3 29 5.7City of Parañaque 35 5.3 183 27.5 51 7.7Pasay City 12 2.9 90 21.6 44 10.6Pateros 2 3.1 24 37.6 3 4.7City of Taguig 37 4.6 149 18.5 57 7.1
CORDILLERA ADMINISTRATIVE REGION 45 2.6 178 10.3 38 2.2
Abra 6 2.5 43 17.8 12 5.0Apayao 2 1.7 18 15.1 2 1.7Benguet 8 1.8 18 4.0 6 1.3Ifugao 3 1.5 24 11.8 2 1.0Kalinga 8 3.8 25 11.8 4 1.9Mt. Province 11 7.1 20 12.9 5 3.2
Baguio City 7 2.0 30 8.7 7 2.0
REGION I - ILOCOS 214 4.3 1,046 20.8 237 4.7
Ilocos Norte 22 5.2 78 18.3 14 3.3Ilocos Sur 11 1.9 99 17.2 22 3.8La Union 36 5.4 182 27.4 23 3.5Pangasinan 103 4.3 489 20.6 124 5.2
City of Batac 2 3.6 12 21.7 1 1.8Laoag City - 0.0 14 12.6 1 0.9City of Candon - 0.0 5 8.2 3 4.9City of Vigan 3 5.6 6 11.1 4 7.4City of San Fernando 1 0.8 26 21.3 2 1.6City of Alaminos 4 4.5 26 29.0 9 10.0Dagupan City 18 10.5 40 23.4 12 7.0San Carlos City 11 5.8 40 21.2 17 9.0City of Urdaneta 3 2.3 29 21.8 5 3.8
Intestinal Infectious Diseases
(A00-A09)
TB All Forms
(A15-A19; B90)
Septicemia
(A40-A41)
143

Table 29
SELECTED CAUSES OF DEATHBy Region, Province and City
Number and Rate/100,000 PopulationPhilippines, 2015
AREANo. Rate No. Rate No. Rate
Intestinal Infectious Diseases
(A00-A09)
TB All Forms
(A15-A19; B90)
Septicemia
(A40-A41)
REGION II - CAGAYAN VALLEY 138 4.0 684 19.8 168 4.9
Batanes 2 11.6 6 34.8 1 5.8Cagayan 57 5.5 209 20.0 54 5.2Isabela 36 3.0 234 19.8 66 5.6Nueva Vizcaya 18 4.0 90 19.9 6 1.3Quirino 4 2.1 19 10.1 15 7.9
Tuguegarao City 7 4.6 26 16.9 6 3.9City of Cauayan 8 6.2 40 30.9 9 6.9Ilagan City 4 2.6 34 23.4 1 0.7City of Santiago 2 1.5 26 19.3 10 7.4
REGION III - CENTRAL LUZON 349 3.1 2,389 21.3 643 5.7
Aurora 11 5.1 32 14.9 8 3.7Bataan 22 3.3 179 26.9 40 6.0Bulacan 58 2.6 441 19.5 149 6.6Nueva Ecija 38 2.6 182 12.3 73 4.9Pampanga 32 2.0 204 12.4 42 2.6Tarlac 28 2.7 187 18.3 75 7.3Zambales 30 5.1 209 35.4 27 4.6
City of Balanga 1 1.0 27 28.1 10 10.4City of Malolos 6 2.4 62 24.6 27 10.7City of Meycauayan 4 1.9 84 40.2 15 7.2City of San Jose Del Monte 28 4.9 202 35.2 40 7.0Cabanatuan City 8 2.6 56 18.5 28 9.3City of Gapan 5 4.5 11 10.0 13 11.8Science City of Muñoz 4 4.9 7 8.6 2 2.5Palayan City 1 2.4 3 7.3 4 9.7San Jose City 9 6.4 35 25.0 9 6.4Angeles City 14 3.4 112 27.2 17 4.1Mabalacat City 6 2.4 63 25.1 8 3.2City of San Fernando 7 2.3 69 22.5 16 5.2City of Tarlac 22 6.4 115 33.6 21 6.1Olangapo City 15 6.4 109 46.8 19 8.2
REGION IVA - CALABARZON 527 3.7 3,862 26.8 810 5.6
Batangas 79 4.3 328 17.6 104 5.6Cavite 52 3.8 279 20.4 48 3.5Laguna 36 3.6 336 33.8 54 5.4Quezon 84 4.8 466 26.5 93 5.3Rizal 67 3.2 728 34.5 179 8.5
Batangas City 7 2.1 48 14.6 18 5.5Lipa City 6 1.8 91 27.4 12 3.6City of Tanauan 5 2.9 48 27.7 10 5.8Bacoor City 25 4.2 154 25.6 40 6.7Cavite City 3 2.9 41 39.9 6 5.8
144

Table 29
SELECTED CAUSES OF DEATHBy Region, Province and City
Number and Rate/100,000 PopulationPhilippines, 2015
AREANo. Rate No. Rate No. Rate
Intestinal Infectious Diseases
(A00-A09)
TB All Forms
(A15-A19; B90)
Septicemia
(A40-A41)
City of Dasmariñas 24 3.6 194 29.4 32 4.9City of General Trias 13 4.1 41 13.0 9 2.9Imus City 8 2.0 70 17.3 11 2.7Tagaytay City 3 4.2 23 32.3 3 4.2Trece Martires City 10 6.4 32 20.6 9 5.8City of Biñan 3 0.9 50 15.0 16 4.8Cabuyao City 3 1.0 46 14.9 19 6.2City of Calamba 20 4.4 143 31.5 20 4.4San Pablo City 16 6.0 106 39.8 8 3.0City of San Pedro 4 1.2 131 40.2 22 6.8City of Santa Rosa 7 2.0 105 29.7 23 6.5Lucena City 9 3.4 85 31.9 16 6.0City of Tayabas 2 2.0 19 19.0 2 2.0City of Antipolo 41 5.3 298 38.4 56 7.2
REGION IVB - MIMAROPA 118 4.0 1,033 34.9 182 6.1
Marinduque 9 3.8 93 39.7 6 2.6Occidental Mindoro 29 5.9 205 42.1 25 5.1Oriental Mindoro 24 3.4 285 40.1 55 7.7Palawan 31 3.6 194 22.8 47 5.5Romblon 15 5.1 134 45.8 27 9.2
Calapan City 2 1.5 62 46.3 12 9.0Puerto Princesa City 8 3.1 60 23.5 10 3.9
REGION V - BICOL 306 5.3 1,995 34.4 389 6.7
Albay 28 3.2 284 32.5 44 5.0Camarines Norte 36 6.2 243 41.7 54 9.3Camarines Sur 96 5.8 566 34.4 75 4.6Catanduanes 12 4.6 76 29.1 12 4.6Masbate 50 6.3 205 25.7 70 8.8Sorsogon 28 4.5 196 31.4 42 6.7
Legazpi City 7 3.6 117 59.5 9 4.6City of Ligao 1 0.9 49 44.0 16 14.4City of Tabaco 4 3.0 59 44.1 6 4.5Iriga City 5 4.5 27 24.2 8 7.2Naga City 14 7.1 81 41.3 17 8.7City of Masbate 13 13.6 47 49.3 21 22.0City of Sorsogon 12 7.1 45 26.8 15 8.9
REGION VI - WESTERN VISAYAS 400 5.3 3,189 42.3 706 9.4
Aklan 26 4.5 81 14.1 55 9.6Antique 29 5.0 195 33.5 49 8.4Capiz 13 2.2 95 16.0 66 11.1Guimaras 8 4.6 42 24.1 6 3.4Iloilo 73 3.9 526 28.3 205 11.0Negros Occidental 74 7.0 566 53.5 107 10.1
145
Table 29
SELECTED CAUSES OF DEATHBy Region, Province and City
Number and Rate/100,000 PopulationPhilippines, 2015
AREANo. Rate No. Rate No. Rate
Intestinal Infectious Diseases
(A00-A09)
TB All Forms
(A15-A19; B90)
Septicemia
(A40-A41)
Roxas City 7 4.2 44 26.3 11 6.6Iloilo City 24 5.4 139 31.0 45 10.0City of Passi 7 8.7 27 33.5 3 3.7Bacolod City 38 6.8 528 94.0 15 2.7Bago City 15 8.8 160 93.6 18 10.5Cadiz City 11 7.1 115 74.3 10 6.5City of Escalante 4 4.3 43 45.7 7 7.4City of Himamaylan 8 7.5 78 73.0 9 8.4City of Kabankalan 15 8.2 68 37.4 24 13.2La Carlota City 6 9.3 49 76.0 25 38.8Sagay City 7 4.8 94 64.3 9 6.2San Carlos City 12 9.1 26 19.6 17 12.8Silay City 7 5.5 94 74.1 10 7.9City of Sipalay 4 5.7 46 65.6 3 4.3City of Talisay 4 3.9 62 60.7 6 5.9City of Victorias 8 9.1 111 126.2 6 6.8
REGION VII - CENTRAL VISAYAS 492 6.7 1,696 22.9 718 9.7
Bohol 71 5.9 197 16.3 111 9.2Cebu 127 6.1 353 16.9 236 11.3Negros Oriental 49 6.1 190 23.8 105 13.2Siquijor 5 5.2 28 29.2 35 36.5
Tagbilaran City 2 1.9 13 12.4 11 10.5City of Bogo 7 9.0 12 15.4 9 11.5City of Carcar 8 6.7 13 10.9 2 1.7Cebu City 84 9.1 493 53.4 75 8.1Danao City 8 5.9 23 16.9 7 5.1Lapu-Lapu City 33 8.1 107 26.2 19 4.7Mandaue City 24 6.6 47 13.0 19 5.2City of Naga 10 8.6 19 16.4 1 0.9City of Talisay 21 9.2 60 26.4 15 6.6Toledo City 13 7.6 15 8.8 15 8.8Bais City 3 3.9 14 18.4 6 7.9City of Bayawan 5 4.2 24 20.4 3 2.5Canlaon City - 0.0 20 36.7 10 18.3Dumaguete City 7 5.3 54 41.1 14 10.7City of Guihulngan 4 4.2 7 7.3 23 24.0City of Tanjay 11 13.7 7 8.7 2 2.5
REGION VIII - EASTERN VISAYAS 263 5.9 1,218 27.4 319 7.2
Biliran 15 8.7 69 40.2 12 7.0Eastern Samar 15 3.8 67 16.8 25 6.3Leyte 66 4.7 400 28.6 91 6.5Northern Samar 63 10.0 179 28.3 52 8.2Samar 33 6.7 95 19.3 25 5.1Southern Leyte 13 3.9 132 39.3 25 7.4
146

Table 29
SELECTED CAUSES OF DEATHBy Region, Province and City
Number and Rate/100,000 PopulationPhilippines, 2015
AREANo. Rate No. Rate No. Rate
Intestinal Infectious Diseases
(A00-A09)
TB All Forms
(A15-A19; B90)
Septicemia
(A40-A41)
City of Borongan 3 4.3 15 21.6 8 11.5City of Baybay 11 10.1 40 36.6 8 7.3Ormoc City 15 7.0 59 27.4 23 10.7Tacloban City 12 5.0 63 26.0 22 9.1Calbayog City 12 6.5 60 32.6 5 2.7City of Catbalogan 3 2.9 22 21.2 17 16.4City of Maasin 2 2.3 17 19.9 6 7.0
REGION IX - ZAMBOANGA PENINSULA 217 6.0 905 24.9 257 7.1
Zamboanga Del Norte 52 6.5 194 24.3 63 7.9Zamboanga Del Sur 30 3.7 196 24.1 45 5.5Zamboanga Sibugay 28 4.4 155 24.5 44 6.9
Dapitan City 12 14.6 23 27.9 4 4.9Dipolog City 5 3.8 43 32.9 13 9.9City of Isabela 2 1.8 3 2.7 1 0.9Pagadian City 12 6.0 46 23.1 30 15.1Zamboanga City 76 8.8 245 28.4 57 6.6
REGION X - NORTHERN MINDANAO 237 5.1 1,067 22.8 300 6.4
Bukidnon 42 4.0 136 13.0 52 5.0Camiguin 3 3.4 20 22.6 4 4.5Lanao del Norte 24 3.5 155 22.9 33 4.9Misamis Occidental 19 5.8 90 27.6 23 7.0Misamis Oriental 35 4.6 133 17.4 56 7.3
City of Malaybalay 10 5.7 26 14.9 17 9.7City of Valencia 15 7.8 30 15.5 9 4.7Iligan City 29 8.5 117 34.1 51 14.9Oroquieta City 4 5.7 37 52.3 9 12.7Ozamis City 8 5.6 61 43.0 14 9.9Tangub City 1 1.6 19 30.2 3 4.8Cagayan de Oro City 39 5.8 208 30.8 23 3.4Gingoog City 8 6.4 35 28.1 6 4.8
REGION XI - DAVAO 173 3.5 1,206 24.6 222 4.5
Compostela Valley 18 2.4 223 30.3 33 4.5Davao 14 3.0 95 20.3 29 6.2Davao Del Sur 17 3.7 84 18.1 35 7.6Davao Oriental 13 3.1 78 18.7 18 4.3Davao Occidental 17 5.4 22 7.0 6 1.9
City of Panabo 10 5.4 19 10.3 9 4.9Island Garden City of Samal 4 3.8 27 25.9 2 1.9City of Tagum 6 2.3 125 48.2 14 5.4Davao City 54 3.3 453 27.7 55 3.4City of Digos 13 7.7 37 21.8 14 8.3City of Mati 7 5.0 43 30.5 7 5.0
147

Table 29
SELECTED CAUSES OF DEATHBy Region, Province and City
Number and Rate/100,000 PopulationPhilippines, 2015
AREANo. Rate No. Rate No. Rate
Intestinal Infectious Diseases
(A00-A09)
TB All Forms
(A15-A19; B90)
Septicemia
(A40-A41)
REGION XII - SOCCSKSARGEN 202 4.4 923 20.3 299 6.6
Cotabato 53 4.3 189 15.2 98 7.9Saranggani 41 7.5 87 16.0 16 2.9South Cotabato 27 3.6 149 20.1 84 11.3Sultan Kudarat 23 3.2 91 12.7 15 2.1
Cotabato City 4 1.3 32 10.7 7 2.3City of Kidapawan 2 1.4 52 37.1 20 14.3General Santos City 36 6.1 221 37.2 29 4.9City of Koronadal 13 7.4 68 38.9 19 10.9City of Tacurong 3 3.1 34 34.6 11 11.2
REGION XIII - CARAGA 113 4.4 650 25.0 299 11.5
Agusan del Norte 12 4.3 57 20.3 27 9.6Agusan del Sur 16 2.7 89 14.9 36 6.0Surigao del Norte 13 3.9 100 30.2 46 13.9Surigao del Sur 15 3.4 110 24.9 65 14.7Dinagat Island 8 6.3 36 28.3 17 13.4
Butuan City 24 7.1 91 27.0 48 14.2City of Cabadbaran 1 1.4 16 21.7 7 9.5City of Bayugan 6 5.8 34 32.9 9 8.7Surigao City 10 6.5 64 41.5 36 23.4City of Bislig 6 6.3 31 32.8 4 4.2City of Tandag 2 3.5 22 39.0 4 7.1
ARMM 61 1.6 119 3.1 42 1.1
Basilan 2 0.7 3 1.1 2 0.7Lanao del Sur 10 1.2 24 2.8 15 1.8Maguindanao 18 1.5 45 3.8 16 1.4Sulu 20 2.4 19 2.3 3 0.4Tawi-tawi 5 1.3 3 0.8 3 0.8
City of Lamitan 2 2.7 11 14.7 1 1.3Marawi City 4 2.0 14 6.9 2 1.0
FOREIGN COUNTRY 2 93.7 3 140.6 8 374.9
148
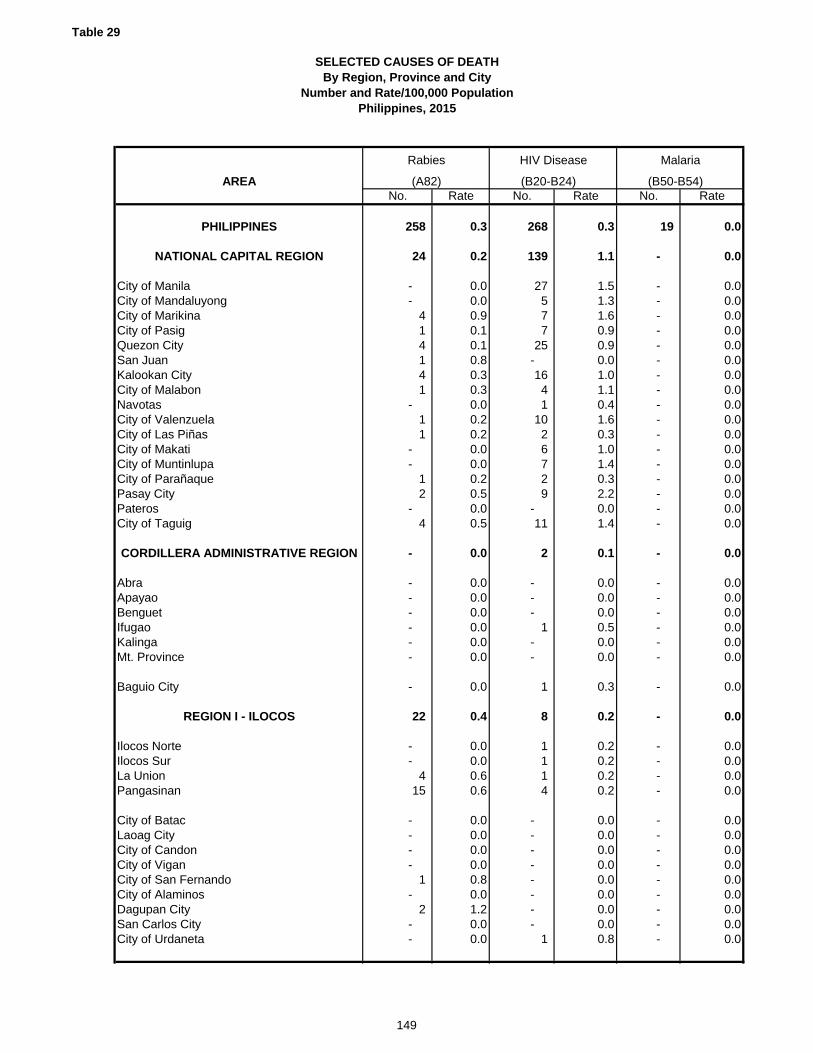
Table 29
SELECTED CAUSES OF DEATHBy Region, Province and City
Number and Rate/100,000 PopulationPhilippines, 2015
AREA
PHILIPPINES
NATIONAL CAPITAL REGION
City of Manila City of MandaluyongCity of MarikinaCity of PasigQuezon CitySan JuanKalookan CityCity of MalabonNavotasCity of ValenzuelaCity of Las PiñasCity of MakatiCity of MuntinlupaCity of ParañaquePasay CityPaterosCity of Taguig
CORDILLERA ADMINISTRATIVE REGION
AbraApayaoBenguetIfugaoKalingaMt. Province
Baguio City
REGION I - ILOCOS
Ilocos NorteIlocos SurLa UnionPangasinan
City of BatacLaoag CityCity of CandonCity of ViganCity of San FernandoCity of AlaminosDagupan CitySan Carlos CityCity of Urdaneta
No. Rate No. Rate No. Rate
258 0.3 268 0.3 19 0.0
24 0.2 139 1.1 - 0.0
- 0.0 27 1.5 - 0.0- 0.0 5 1.3 - 0.0
4 0.9 7 1.6 - 0.01 0.1 7 0.9 - 0.04 0.1 25 0.9 - 0.01 0.8 - 0.0 - 0.04 0.3 16 1.0 - 0.01 0.3 4 1.1 - 0.0
- 0.0 1 0.4 - 0.01 0.2 10 1.6 - 0.01 0.2 2 0.3 - 0.0
- 0.0 6 1.0 - 0.0- 0.0 7 1.4 - 0.0
1 0.2 2 0.3 - 0.02 0.5 9 2.2 - 0.0
- 0.0 - 0.0 - 0.04 0.5 11 1.4 - 0.0
- 0.0 2 0.1 - 0.0
- 0.0 - 0.0 - 0.0- 0.0 - 0.0 - 0.0- 0.0 - 0.0 - 0.0- 0.0 1 0.5 - 0.0- 0.0 - 0.0 - 0.0- 0.0 - 0.0 - 0.0
- 0.0 1 0.3 - 0.0
22 0.4 8 0.2 - 0.0
- 0.0 1 0.2 - 0.0- 0.0 1 0.2 - 0.0
4 0.6 1 0.2 - 0.015 0.6 4 0.2 - 0.0
- 0.0 - 0.0 - 0.0- 0.0 - 0.0 - 0.0- 0.0 - 0.0 - 0.0- 0.0 - 0.0 - 0.0
1 0.8 - 0.0 - 0.0- 0.0 - 0.0 - 0.0
2 1.2 - 0.0 - 0.0- 0.0 - 0.0 - 0.0- 0.0 1 0.8 - 0.0
Rabies
(A82)
HIV Disease
(B20-B24)
Malaria
(B50-B54)
149
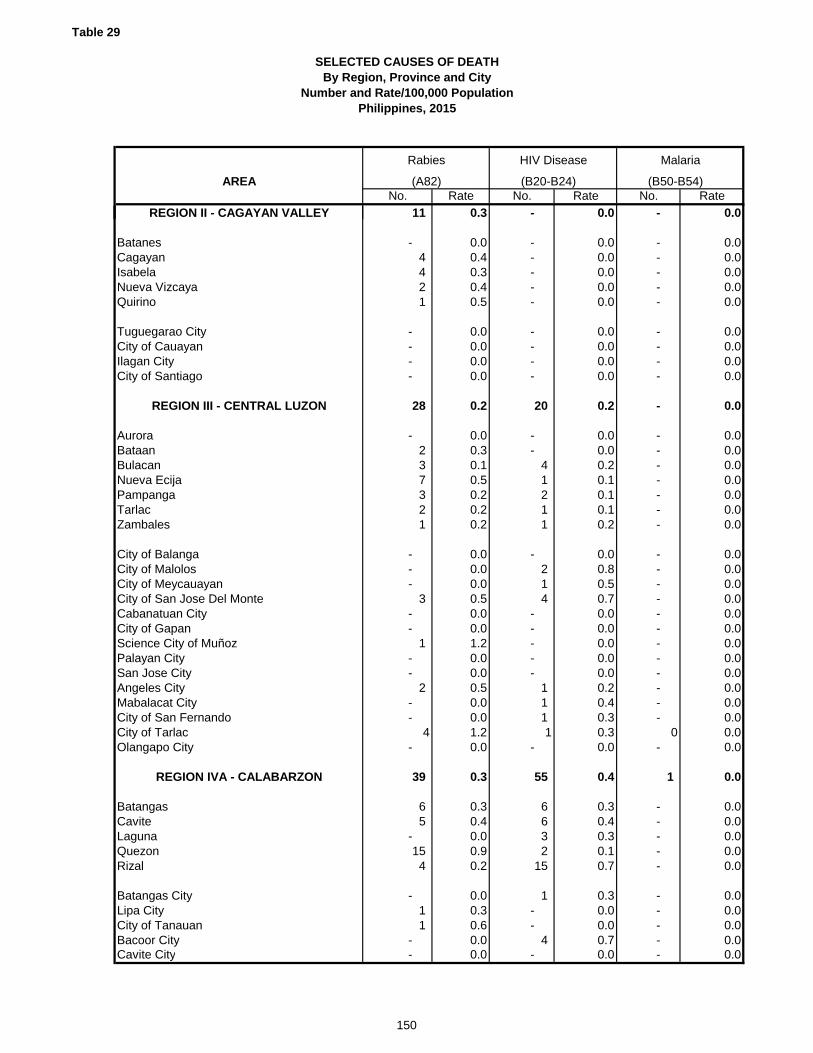
Table 29
SELECTED CAUSES OF DEATHBy Region, Province and City
Number and Rate/100,000 PopulationPhilippines, 2015
AREA
REGION II - CAGAYAN VALLEY
BatanesCagayanIsabelaNueva VizcayaQuirino
Tuguegarao CityCity of CauayanIlagan CityCity of Santiago
REGION III - CENTRAL LUZON
AuroraBataanBulacanNueva EcijaPampangaTarlacZambales
City of BalangaCity of MalolosCity of MeycauayanCity of San Jose Del MonteCabanatuan CityCity of GapanScience City of MuñozPalayan CitySan Jose CityAngeles CityMabalacat CityCity of San FernandoCity of TarlacOlangapo City
REGION IVA - CALABARZON
BatangasCaviteLagunaQuezon Rizal
Batangas CityLipa CityCity of TanauanBacoor CityCavite City
No. Rate No. Rate No. Rate
Rabies
(A82)
HIV Disease
(B20-B24)
Malaria
(B50-B54)
11 0.3 - 0.0 - 0.0
- 0.0 - 0.0 - 0.04 0.4 - 0.0 - 0.04 0.3 - 0.0 - 0.02 0.4 - 0.0 - 0.01 0.5 - 0.0 - 0.0
- 0.0 - 0.0 - 0.0- 0.0 - 0.0 - 0.0- 0.0 - 0.0 - 0.0- 0.0 - 0.0 - 0.0
28 0.2 20 0.2 - 0.0
- 0.0 - 0.0 - 0.02 0.3 - 0.0 - 0.03 0.1 4 0.2 - 0.07 0.5 1 0.1 - 0.03 0.2 2 0.1 - 0.02 0.2 1 0.1 - 0.01 0.2 1 0.2 - 0.0
- 0.0 - 0.0 - 0.0- 0.0 2 0.8 - 0.0- 0.0 1 0.5 - 0.0
3 0.5 4 0.7 - 0.0- 0.0 - 0.0 - 0.0- 0.0 - 0.0 - 0.0
1 1.2 - 0.0 - 0.0- 0.0 - 0.0 - 0.0- 0.0 - 0.0 - 0.0
2 0.5 1 0.2 - 0.0- 0.0 1 0.4 - 0.0- 0.0 1 0.3 - 0.0
4 1.2 1 0.3 0 0.0- 0.0 - 0.0 - 0.0
39 0.3 55 0.4 1 0.0
6 0.3 6 0.3 - 0.05 0.4 6 0.4 - 0.0
- 0.0 3 0.3 - 0.015 0.9 2 0.1 - 0.04 0.2 15 0.7 - 0.0
- 0.0 1 0.3 - 0.01 0.3 - 0.0 - 0.01 0.6 - 0.0 - 0.0
- 0.0 4 0.7 - 0.0- 0.0 - 0.0 - 0.0
150
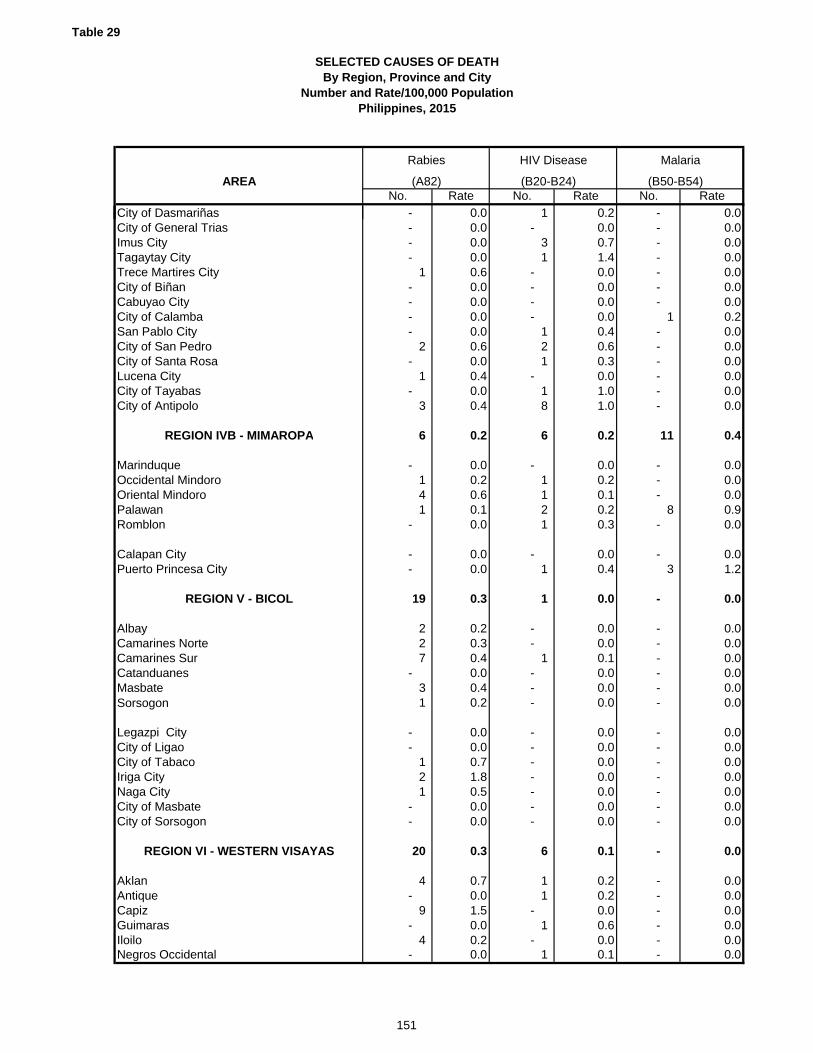
Table 29
SELECTED CAUSES OF DEATHBy Region, Province and City
Number and Rate/100,000 PopulationPhilippines, 2015
AREA
City of DasmariñasCity of General TriasImus CityTagaytay CityTrece Martires CityCity of BiñanCabuyao CityCity of CalambaSan Pablo CityCity of San PedroCity of Santa RosaLucena City City of TayabasCity of Antipolo
REGION IVB - MIMAROPA
MarinduqueOccidental MindoroOriental MindoroPalawanRomblon
Calapan CityPuerto Princesa City
REGION V - BICOL
AlbayCamarines NorteCamarines SurCatanduanesMasbateSorsogon
Legazpi CityCity of LigaoCity of TabacoIriga CityNaga CityCity of MasbateCity of Sorsogon
REGION VI - WESTERN VISAYAS
AklanAntiqueCapizGuimarasIloiloNegros Occidental
No. Rate No. Rate No. Rate
Rabies
(A82)
HIV Disease
(B20-B24)
Malaria
(B50-B54)
- 0.0 1 0.2 - 0.0- 0.0 - 0.0 - 0.0- 0.0 3 0.7 - 0.0- 0.0 1 1.4 - 0.0
1 0.6 - 0.0 - 0.0- 0.0 - 0.0 - 0.0- 0.0 - 0.0 - 0.0- 0.0 - 0.0 1 0.2- 0.0 1 0.4 - 0.0
2 0.6 2 0.6 - 0.0- 0.0 1 0.3 - 0.0
1 0.4 - 0.0 - 0.0- 0.0 1 1.0 - 0.0
3 0.4 8 1.0 - 0.0
6 0.2 6 0.2 11 0.4
- 0.0 - 0.0 - 0.01 0.2 1 0.2 - 0.04 0.6 1 0.1 - 0.01 0.1 2 0.2 8 0.9
- 0.0 1 0.3 - 0.0
- 0.0 - 0.0 - 0.0- 0.0 1 0.4 3 1.2
19 0.3 1 0.0 - 0.0
2 0.2 - 0.0 - 0.02 0.3 - 0.0 - 0.07 0.4 1 0.1 - 0.0
- 0.0 - 0.0 - 0.03 0.4 - 0.0 - 0.01 0.2 - 0.0 - 0.0
- 0.0 - 0.0 - 0.0- 0.0 - 0.0 - 0.0
1 0.7 - 0.0 - 0.02 1.8 - 0.0 - 0.01 0.5 - 0.0 - 0.0
- 0.0 - 0.0 - 0.0- 0.0 - 0.0 - 0.0
20 0.3 6 0.1 - 0.0
4 0.7 1 0.2 - 0.0- 0.0 1 0.2 - 0.0
9 1.5 - 0.0 - 0.0- 0.0 1 0.6 - 0.0
4 0.2 - 0.0 - 0.0- 0.0 1 0.1 - 0.0
151
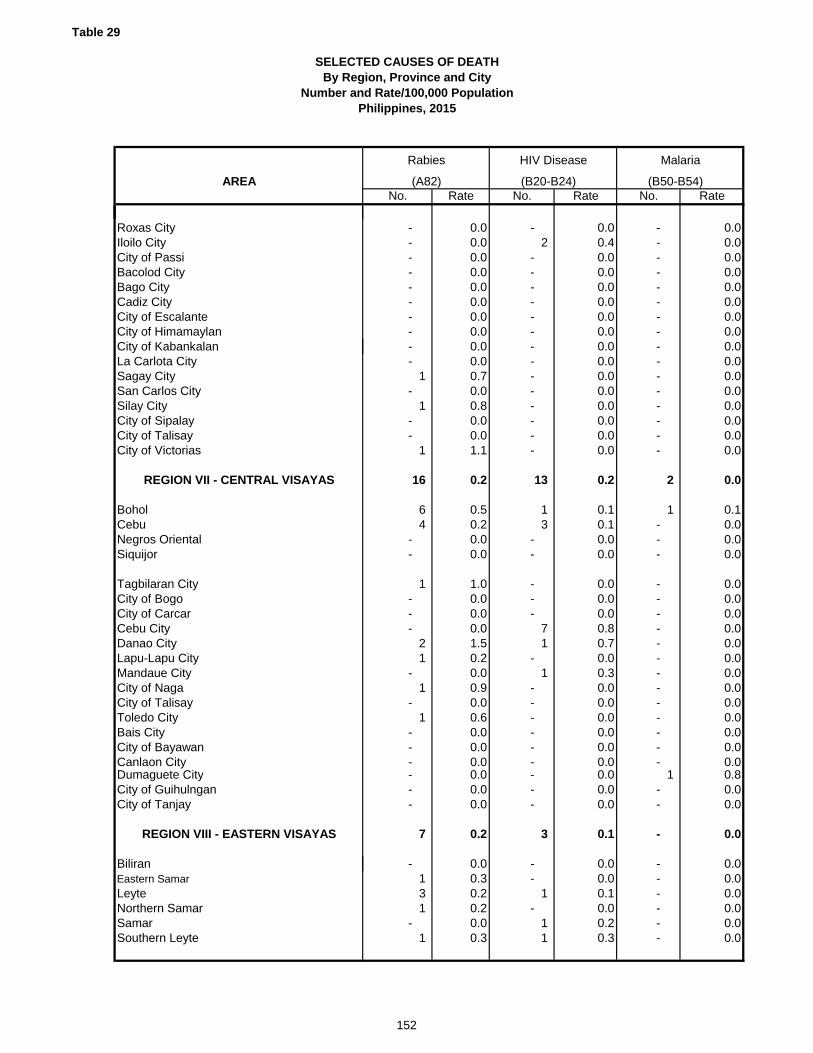
Table 29
SELECTED CAUSES OF DEATHBy Region, Province and City
Number and Rate/100,000 PopulationPhilippines, 2015
AREA
Roxas CityIloilo CityCity of PassiBacolod CityBago CityCadiz CityCity of EscalanteCity of HimamaylanCity of KabankalanLa Carlota CitySagay CitySan Carlos CitySilay CityCity of SipalayCity of TalisayCity of Victorias
REGION VII - CENTRAL VISAYAS
BoholCebuNegros OrientalSiquijor
Tagbilaran CityCity of BogoCity of CarcarCebu CityDanao CityLapu-Lapu CityMandaue CityCity of NagaCity of TalisayToledo CityBais CityCity of BayawanCanlaon CityDumaguete CityCity of GuihulnganCity of Tanjay
REGION VIII - EASTERN VISAYAS
BiliranEastern SamarLeyteNorthern SamarSamarSouthern Leyte
No. Rate No. Rate No. Rate
Rabies
(A82)
HIV Disease
(B20-B24)
Malaria
(B50-B54)
- 0.0 - 0.0 - 0.0- 0.0 2 0.4 - 0.0- 0.0 - 0.0 - 0.0- 0.0 - 0.0 - 0.0- 0.0 - 0.0 - 0.0- 0.0 - 0.0 - 0.0- 0.0 - 0.0 - 0.0- 0.0 - 0.0 - 0.0- 0.0 - 0.0 - 0.0- 0.0 - 0.0 - 0.0
1 0.7 - 0.0 - 0.0- 0.0 - 0.0 - 0.0
1 0.8 - 0.0 - 0.0- 0.0 - 0.0 - 0.0- 0.0 - 0.0 - 0.0
1 1.1 - 0.0 - 0.0
16 0.2 13 0.2 2 0.0
6 0.5 1 0.1 1 0.14 0.2 3 0.1 - 0.0
- 0.0 - 0.0 - 0.0- 0.0 - 0.0 - 0.0
1 1.0 - 0.0 - 0.0- 0.0 - 0.0 - 0.0- 0.0 - 0.0 - 0.0- 0.0 7 0.8 - 0.0
2 1.5 1 0.7 - 0.01 0.2 - 0.0 - 0.0
- 0.0 1 0.3 - 0.01 0.9 - 0.0 - 0.0
- 0.0 - 0.0 - 0.01 0.6 - 0.0 - 0.0
- 0.0 - 0.0 - 0.0- 0.0 - 0.0 - 0.0- 0.0 - 0.0 - 0.0- 0.0 - 0.0 1 0.8- 0.0 - 0.0 - 0.0- 0.0 - 0.0 - 0.0
7 0.2 3 0.1 - 0.0
- 0.0 - 0.0 - 0.01 0.3 - 0.0 - 0.03 0.2 1 0.1 - 0.01 0.2 - 0.0 - 0.0
- 0.0 1 0.2 - 0.01 0.3 1 0.3 - 0.0
152
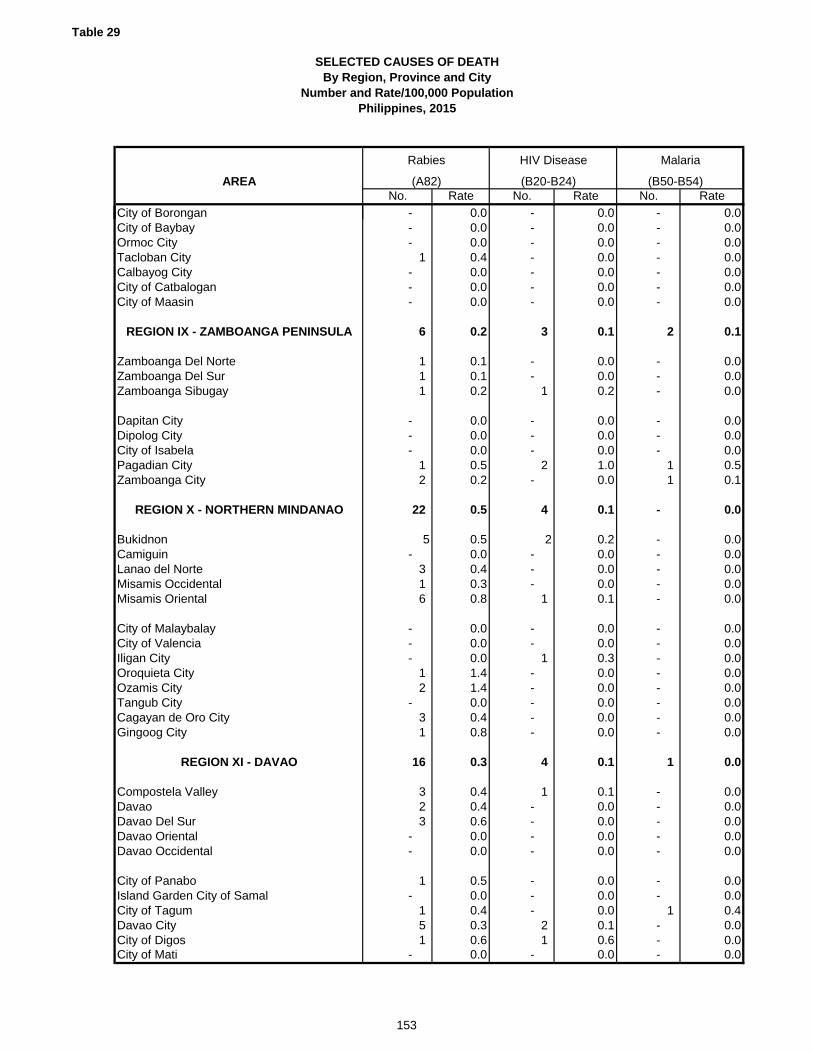
Table 29
SELECTED CAUSES OF DEATHBy Region, Province and City
Number and Rate/100,000 PopulationPhilippines, 2015
AREA
City of BoronganCity of BaybayOrmoc CityTacloban CityCalbayog CityCity of CatbaloganCity of Maasin
REGION IX - ZAMBOANGA PENINSULA
Zamboanga Del NorteZamboanga Del SurZamboanga Sibugay
Dapitan CityDipolog CityCity of IsabelaPagadian CityZamboanga City
REGION X - NORTHERN MINDANAO
BukidnonCamiguinLanao del NorteMisamis OccidentalMisamis Oriental
City of MalaybalayCity of ValenciaIligan CityOroquieta CityOzamis CityTangub CityCagayan de Oro CityGingoog City
REGION XI - DAVAO
Compostela ValleyDavaoDavao Del SurDavao OrientalDavao Occidental
City of PanaboIsland Garden City of SamalCity of TagumDavao CityCity of DigosCity of Mati
No. Rate No. Rate No. Rate
Rabies
(A82)
HIV Disease
(B20-B24)
Malaria
(B50-B54)
- 0.0 - 0.0 - 0.0- 0.0 - 0.0 - 0.0- 0.0 - 0.0 - 0.0
1 0.4 - 0.0 - 0.0- 0.0 - 0.0 - 0.0- 0.0 - 0.0 - 0.0- 0.0 - 0.0 - 0.0
6 0.2 3 0.1 2 0.1
1 0.1 - 0.0 - 0.01 0.1 - 0.0 - 0.01 0.2 1 0.2 - 0.0
- 0.0 - 0.0 - 0.0- 0.0 - 0.0 - 0.0- 0.0 - 0.0 - 0.0
1 0.5 2 1.0 1 0.52 0.2 - 0.0 1 0.1
22 0.5 4 0.1 - 0.0
5 0.5 2 0.2 - 0.0- 0.0 - 0.0 - 0.0
3 0.4 - 0.0 - 0.01 0.3 - 0.0 - 0.06 0.8 1 0.1 - 0.0
- 0.0 - 0.0 - 0.0- 0.0 - 0.0 - 0.0- 0.0 1 0.3 - 0.0
1 1.4 - 0.0 - 0.02 1.4 - 0.0 - 0.0
- 0.0 - 0.0 - 0.03 0.4 - 0.0 - 0.01 0.8 - 0.0 - 0.0
16 0.3 4 0.1 1 0.0
3 0.4 1 0.1 - 0.02 0.4 - 0.0 - 0.03 0.6 - 0.0 - 0.0
- 0.0 - 0.0 - 0.0- 0.0 - 0.0 - 0.0
1 0.5 - 0.0 - 0.0- 0.0 - 0.0 - 0.0
1 0.4 - 0.0 1 0.45 0.3 2 0.1 - 0.01 0.6 1 0.6 - 0.0
- 0.0 - 0.0 - 0.0
153
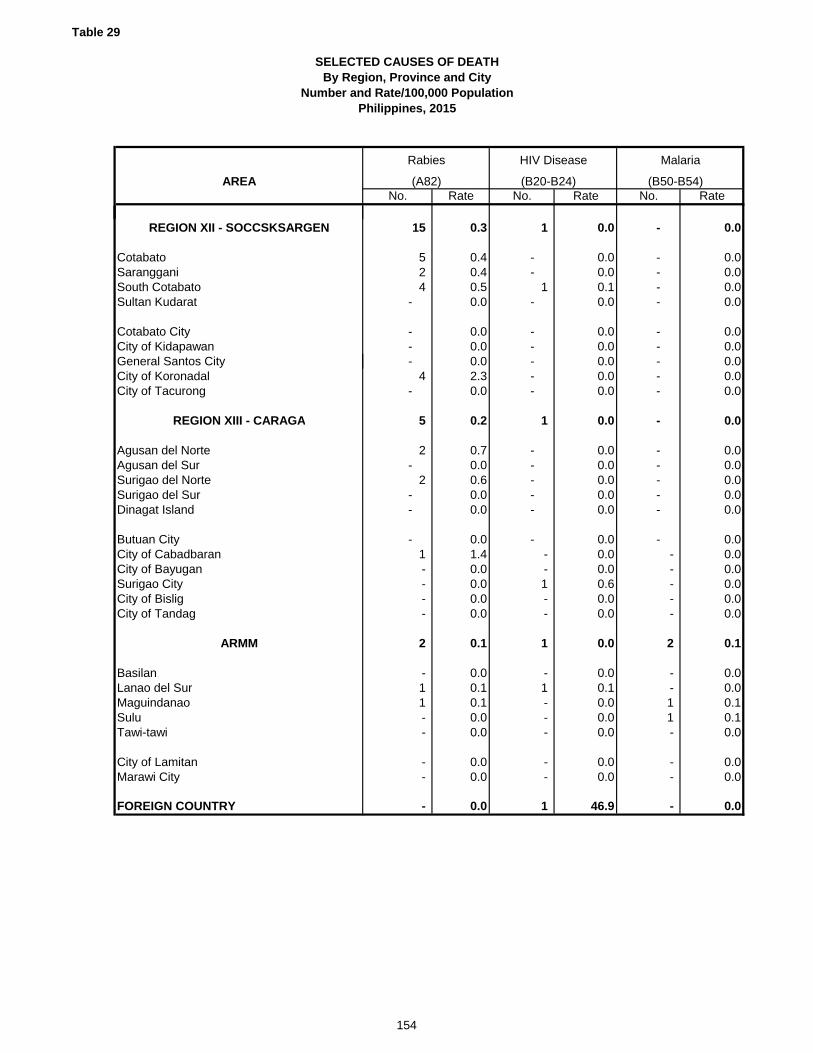
Table 29
SELECTED CAUSES OF DEATHBy Region, Province and City
Number and Rate/100,000 PopulationPhilippines, 2015
AREA
REGION XII - SOCCSKSARGEN
CotabatoSarangganiSouth CotabatoSultan Kudarat
Cotabato CityCity of KidapawanGeneral Santos CityCity of KoronadalCity of Tacurong
REGION XIII - CARAGA
Agusan del NorteAgusan del SurSurigao del NorteSurigao del SurDinagat Island
Butuan CityCity of Cabadbaran City of BayuganSurigao CityCity of BisligCity of Tandag
ARMM
BasilanLanao del SurMaguindanaoSulu Tawi-tawi
City of LamitanMarawi City
FOREIGN COUNTRY
No. Rate No. Rate No. Rate
Rabies
(A82)
HIV Disease
(B20-B24)
Malaria
(B50-B54)
15 0.3 1 0.0 - 0.0
5 0.4 - 0.0 - 0.02 0.4 - 0.0 - 0.04 0.5 1 0.1 - 0.0
- 0.0 - 0.0 - 0.0
- 0.0 - 0.0 - 0.0- 0.0 - 0.0 - 0.0- 0.0 - 0.0 - 0.0
4 2.3 - 0.0 - 0.0- 0.0 - 0.0 - 0.0
5 0.2 1 0.0 - 0.0
2 0.7 - 0.0 - 0.0- 0.0 - 0.0 - 0.0
2 0.6 - 0.0 - 0.0- 0.0 - 0.0 - 0.0- 0.0 - 0.0 - 0.0
- 0.0 - 0.0 - 0.01 1.4 - 0.0 - 0.0- 0.0 - 0.0 - 0.0- 0.0 1 0.6 - 0.0- 0.0 - 0.0 - 0.0- 0.0 - 0.0 - 0.0
2 0.1 1 0.0 2 0.1
- 0.0 - 0.0 - 0.01 0.1 1 0.1 - 0.01 0.1 - 0.0 1 0.1- 0.0 - 0.0 1 0.1- 0.0 - 0.0 - 0.0
- 0.0 - 0.0 - 0.0- 0.0 - 0.0 - 0.0
- 0.0 1 46.9 - 0.0
154

Table 29
SELECTED CAUSES OF DEATHBy Region, Province and City
Number and Rate/100,000 PopulationPhilippines, 2015
AREA
PHILIPPINES
NATIONAL CAPITAL REGION
City of Manila City of MandaluyongCity of MarikinaCity of PasigQuezon CitySan JuanKalookan CityCity of MalabonNavotasCity of ValenzuelaCity of Las PiñasCity of MakatiCity of MuntinlupaCity of ParañaquePasay CityPaterosCity of Taguig
CORDILLERA ADMINISTRATIVE REGION
AbraApayaoBenguetIfugaoKalingaMt. Province
Baguio City
REGION I - ILOCOS
Ilocos NorteIlocos SurLa UnionPangasinan
City of BatacLaoag CityCity of CandonCity of ViganCity of San FernandoCity of AlaminosDagupan CitySan Carlos CityCity of Urdaneta
No. Rate No. Rate No. Rate
58,715 58.1 34,050 33.7 2,803 2.8
9,408 73.1 4,978 38.7 208 1.6
1,478 83.0 697 39.2 27 1.5324 83.9 193 50.0 15 3.9380 84.3 212 47.0 6 1.3547 72.4 268 35.5 15 2.0
2,206 75.1 1,056 36.0 26 0.9122 99.9 58 47.5 1 0.8892 56.3 541 34.2 21 1.3279 76.3 147 40.2 5 1.4181 72.6 98 39.3 3 1.2433 69.8 249 40.1 6 1.0473 80.3 262 44.5 7 1.2511 87.7 217 37.2 25 4.3319 63.2 196 38.8 16 3.2482 72.4 299 44.9 10 1.5305 73.2 189 45.4 7 1.755 86.2 42 65.8 - 0.0
421 52.3 254 31.6 18 2.2
1,061 61.6 344 20.0 40 2.3
171 70.9 53 22.0 10 4.148 40.3 9 7.6 7 5.9
287 64.3 92 20.6 5 1.188 43.4 16 7.9 5 2.598 46.1 24 11.3 4 1.998 63.4 26 16.8 4 2.6
271 78.5 124 35.9 5 1.4
3,707 73.8 1,910 38.0 108 2.1
362 84.8 124 29.1 18 4.2445 77.4 191 33.2 23 4.0500 75.2 202 30.4 4 0.6
1,674 70.5 945 39.8 39 1.6
42 76.1 19 34.4 1 1.891 81.9 47 42.3 1 0.937 61.0 17 28.0 - 0.054 100.2 15 27.8 1 1.9
121 99.3 43 35.3 3 2.571 79.1 66 73.6 - 0.0
128 74.7 116 67.7 5 2.9108 57.3 77 40.8 12 6.474 55.7 48 36.1 1 0.8
Malignant Neoplasm
(C00-C97)
Diabetes Mellitus
(E10-E14)
Nutritional Deficiency
(E40-E64)
155

Table 29
SELECTED CAUSES OF DEATHBy Region, Province and City
Number and Rate/100,000 PopulationPhilippines, 2015
AREA
REGION II - CAGAYAN VALLEY
BatanesCagayanIsabelaNueva VizcayaQuirino
Tuguegarao CityCity of CauayanIlagan CityCity of Santiago
REGION III - CENTRAL LUZON
AuroraBataanBulacanNueva EcijaPampangaTarlacZambales
City of BalangaCity of MalolosCity of MeycauayanCity of San Jose Del MonteCabanatuan CityCity of GapanScience City of MuñozPalayan CitySan Jose CityAngeles CityMabalacat CityCity of San FernandoCity of TarlacOlangapo City
REGION IVA - CALABARZON
BatangasCaviteLagunaQuezon Rizal
Batangas CityLipa CityCity of TanauanBacoor CityCavite City
No. Rate No. Rate No. Rate
Malignant Neoplasm
(C00-C97)
Diabetes Mellitus
(E10-E14)
Nutritional Deficiency
(E40-E64)
2,175 63.0 749 21.7 104 3.0
13 75.4 5 29.0 3 17.4644 61.6 230 22.0 43 4.1740 62.5 230 19.4 37 3.1279 61.7 94 20.8 11 2.4120 63.5 28 14.8 - 0.0
124 80.8 56 36.5 1 0.778 60.2 27 20.8 4 3.181 55.6 34 23.4 3 2.196 71.2 45 33.4 2 1.5
7,587 67.6 4,746 42.3 283 2.5
98 45.7 64 29.9 6 2.8501 75.4 309 46.5 18 2.7
1,636 72.5 959 42.5 37 1.6901 61.0 527 35.7 13 0.9
1,121 68.3 778 47.4 33 2.0589 57.5 313 30.6 17 1.7416 70.4 217 36.7 19 3.2
77 80.2 50 52.1 2 2.1189 75.0 135 53.6 4 1.6184 88.0 90 43.0 2 1.0285 49.6 164 28.6 25 4.4214 70.8 170 56.2 19 6.399 89.8 54 49.0 6 5.450 61.4 30 36.8 22 27.024 58.5 16 39.0 - 0.091 65.1 61 43.7 12 8.6
283 68.8 221 53.7 13 3.2161 64.2 158 63.0 7 2.8234 76.3 151 49.2 4 1.3272 79.4 169 49.3 19 5.5
162 69.5 110 47.2 5 2.1
8,652 60.0 5,702 39.6 542 3.8
1,192 64.1 743 40.0 57 3.1862 62.9 612 44.6 37 2.7650 65.4 543 54.7 43 4.3980 55.8 437 24.9 94 5.4
1,213 57.5 869 41.2 67 3.2
222 67.3 131 39.7 45 13.6217 65.3 97 29.2 8 2.4109 62.9 88 50.8 3 1.7375 62.4 226 37.6 13 2.2104 101.2 83 80.7 2 1.9
156
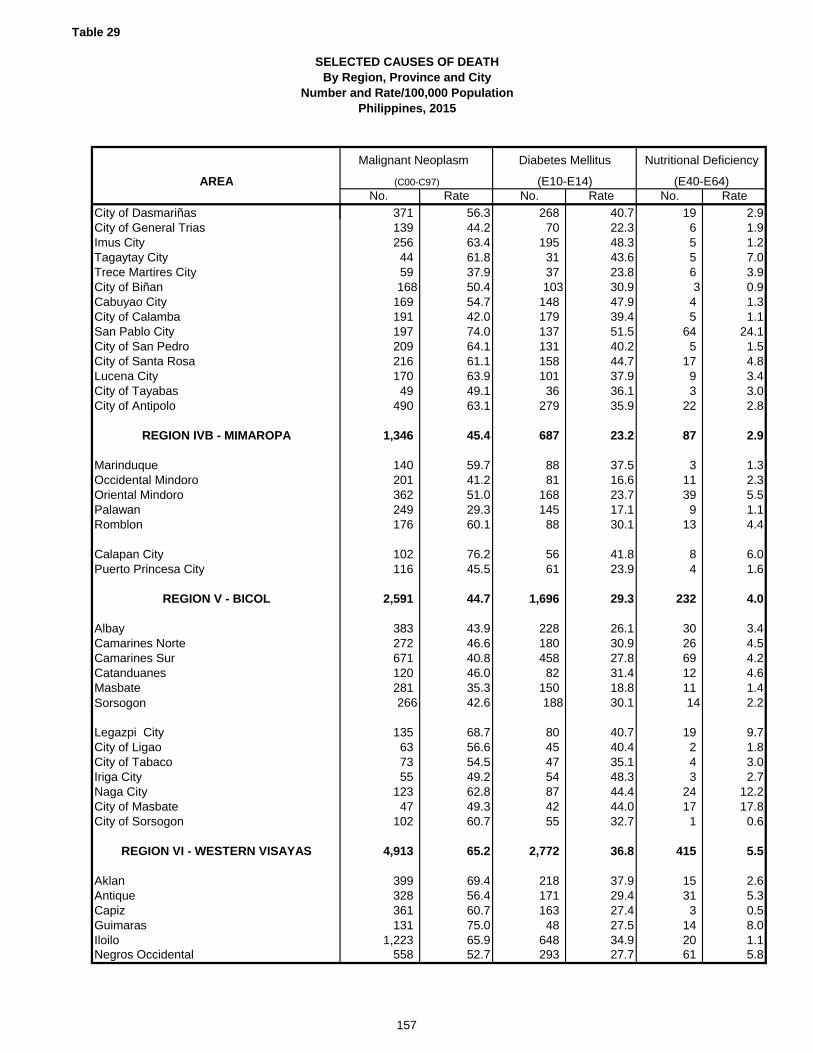
Table 29
SELECTED CAUSES OF DEATHBy Region, Province and City
Number and Rate/100,000 PopulationPhilippines, 2015
AREA
City of DasmariñasCity of General TriasImus CityTagaytay CityTrece Martires CityCity of BiñanCabuyao CityCity of CalambaSan Pablo CityCity of San PedroCity of Santa RosaLucena City City of TayabasCity of Antipolo
REGION IVB - MIMAROPA
MarinduqueOccidental MindoroOriental MindoroPalawanRomblon
Calapan CityPuerto Princesa City
REGION V - BICOL
AlbayCamarines NorteCamarines SurCatanduanesMasbateSorsogon
Legazpi CityCity of LigaoCity of TabacoIriga CityNaga CityCity of MasbateCity of Sorsogon
REGION VI - WESTERN VISAYAS
AklanAntiqueCapizGuimarasIloiloNegros Occidental
No. Rate No. Rate No. Rate
Malignant Neoplasm
(C00-C97)
Diabetes Mellitus
(E10-E14)
Nutritional Deficiency
(E40-E64)
371 56.3 268 40.7 19 2.9139 44.2 70 22.3 6 1.9256 63.4 195 48.3 5 1.244 61.8 31 43.6 5 7.059 37.9 37 23.8 6 3.9168 50.4 103 30.9 3 0.9
169 54.7 148 47.9 4 1.3191 42.0 179 39.4 5 1.1197 74.0 137 51.5 64 24.1209 64.1 131 40.2 5 1.5216 61.1 158 44.7 17 4.8170 63.9 101 37.9 9 3.449 49.1 36 36.1 3 3.0
490 63.1 279 35.9 22 2.8
1,346 45.4 687 23.2 87 2.9
140 59.7 88 37.5 3 1.3201 41.2 81 16.6 11 2.3362 51.0 168 23.7 39 5.5249 29.3 145 17.1 9 1.1176 60.1 88 30.1 13 4.4
102 76.2 56 41.8 8 6.0116 45.5 61 23.9 4 1.6
2,591 44.7 1,696 29.3 232 4.0
383 43.9 228 26.1 30 3.4272 46.6 180 30.9 26 4.5671 40.8 458 27.8 69 4.2120 46.0 82 31.4 12 4.6281 35.3 150 18.8 11 1.4266 42.6 188 30.1 14 2.2
135 68.7 80 40.7 19 9.763 56.6 45 40.4 2 1.873 54.5 47 35.1 4 3.055 49.2 54 48.3 3 2.7
123 62.8 87 44.4 24 12.247 49.3 42 44.0 17 17.8
102 60.7 55 32.7 1 0.6
4,913 65.2 2,772 36.8 415 5.5
399 69.4 218 37.9 15 2.6328 56.4 171 29.4 31 5.3361 60.7 163 27.4 3 0.5131 75.0 48 27.5 14 8.0
1,223 65.9 648 34.9 20 1.1558 52.7 293 27.7 61 5.8
157
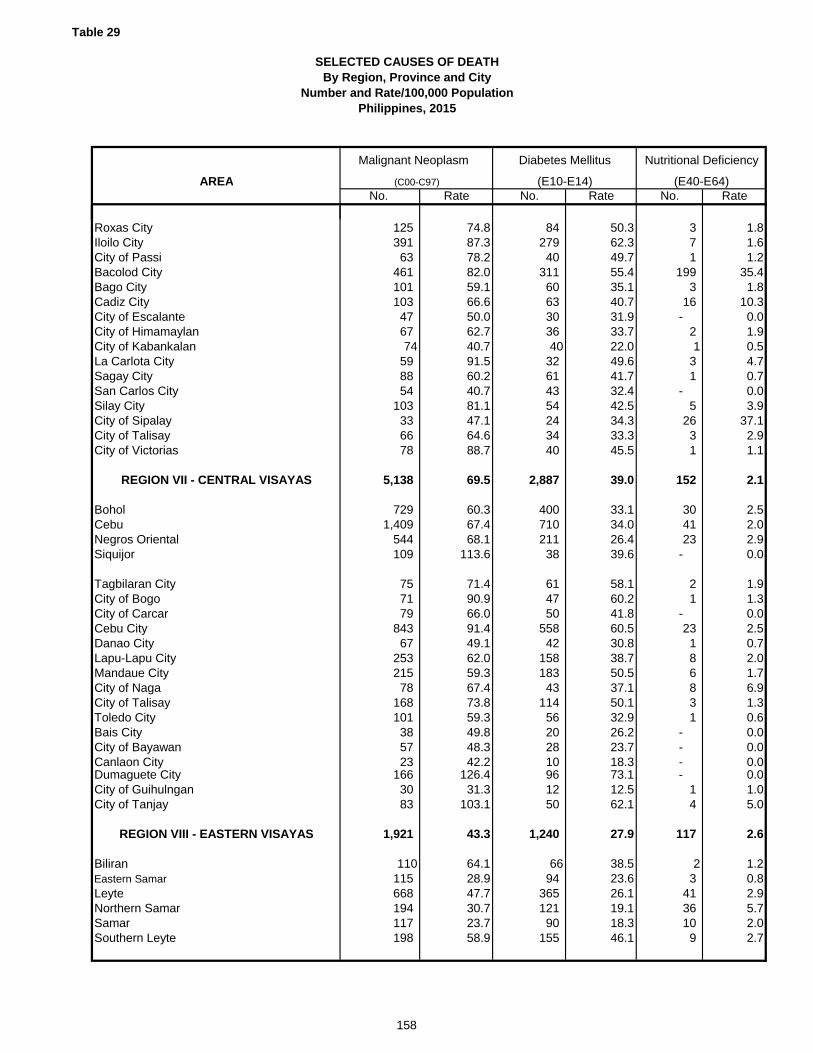
Table 29
SELECTED CAUSES OF DEATHBy Region, Province and City
Number and Rate/100,000 PopulationPhilippines, 2015
AREA
Roxas CityIloilo CityCity of PassiBacolod CityBago CityCadiz CityCity of EscalanteCity of HimamaylanCity of KabankalanLa Carlota CitySagay CitySan Carlos CitySilay CityCity of SipalayCity of TalisayCity of Victorias
REGION VII - CENTRAL VISAYAS
BoholCebuNegros OrientalSiquijor
Tagbilaran CityCity of BogoCity of CarcarCebu CityDanao CityLapu-Lapu CityMandaue CityCity of NagaCity of TalisayToledo CityBais CityCity of BayawanCanlaon CityDumaguete CityCity of GuihulnganCity of Tanjay
REGION VIII - EASTERN VISAYAS
BiliranEastern SamarLeyteNorthern SamarSamarSouthern Leyte
No. Rate No. Rate No. Rate
Malignant Neoplasm
(C00-C97)
Diabetes Mellitus
(E10-E14)
Nutritional Deficiency
(E40-E64)
125 74.8 84 50.3 3 1.8391 87.3 279 62.3 7 1.663 78.2 40 49.7 1 1.2
461 82.0 311 55.4 199 35.4101 59.1 60 35.1 3 1.8103 66.6 63 40.7 16 10.347 50.0 30 31.9 - 0.067 62.7 36 33.7 2 1.974 40.7 40 22.0 1 0.5
59 91.5 32 49.6 3 4.788 60.2 61 41.7 1 0.754 40.7 43 32.4 - 0.0
103 81.1 54 42.5 5 3.933 47.1 24 34.3 26 37.166 64.6 34 33.3 3 2.978 88.7 40 45.5 1 1.1
5,138 69.5 2,887 39.0 152 2.1
729 60.3 400 33.1 30 2.51,409 67.4 710 34.0 41 2.0
544 68.1 211 26.4 23 2.9109 113.6 38 39.6 - 0.0
75 71.4 61 58.1 2 1.971 90.9 47 60.2 1 1.379 66.0 50 41.8 - 0.0
843 91.4 558 60.5 23 2.567 49.1 42 30.8 1 0.7
253 62.0 158 38.7 8 2.0215 59.3 183 50.5 6 1.778 67.4 43 37.1 8 6.9
168 73.8 114 50.1 3 1.3101 59.3 56 32.9 1 0.638 49.8 20 26.2 - 0.057 48.3 28 23.7 - 0.023 42.2 10 18.3 - 0.0
166 126.4 96 73.1 - 0.030 31.3 12 12.5 1 1.083 103.1 50 62.1 4 5.0
1,921 43.3 1,240 27.9 117 2.6
110 64.1 66 38.5 2 1.2115 28.9 94 23.6 3 0.8668 47.7 365 26.1 41 2.9194 30.7 121 19.1 36 5.7117 23.7 90 18.3 10 2.0198 58.9 155 46.1 9 2.7
158

Table 29
SELECTED CAUSES OF DEATHBy Region, Province and City
Number and Rate/100,000 PopulationPhilippines, 2015
AREA
City of BoronganCity of BaybayOrmoc CityTacloban CityCalbayog CityCity of CatbaloganCity of Maasin
REGION IX - ZAMBOANGA PENINSULA
Zamboanga Del NorteZamboanga Del SurZamboanga Sibugay
Dapitan CityDipolog CityCity of IsabelaPagadian CityZamboanga City
REGION X - NORTHERN MINDANAO
BukidnonCamiguinLanao del NorteMisamis OccidentalMisamis Oriental
City of MalaybalayCity of ValenciaIligan CityOroquieta CityOzamis CityTangub CityCagayan de Oro CityGingoog City
REGION XI - DAVAO
Compostela ValleyDavaoDavao Del SurDavao OrientalDavao Occidental
City of PanaboIsland Garden City of SamalCity of TagumDavao CityCity of DigosCity of Mati
No. Rate No. Rate No. Rate
Malignant Neoplasm
(C00-C97)
Diabetes Mellitus
(E10-E14)
Nutritional Deficiency
(E40-E64)
27 39.0 26 37.5 - 0.080 73.1 34 31.1 2 1.8
116 53.9 103 47.9 7 3.3120 49.6 66 27.3 3 1.278 42.4 50 27.2 2 1.151 49.1 26 25.0 1 1.047 54.9 44 51.4 1 1.2
1,591 43.8 867 23.9 72 2.0
347 43.5 136 17.0 20 2.5288 35.5 166 20.5 11 1.4206 32.5 105 16.6 17 2.7
67 81.3 28 34.0 - 0.0102 78.0 62 47.4 2 1.5
5 4.4 6 5.3 - 0.099 49.7 70 35.2 4 2.0
477 55.3 294 34.1 18 2.1
2,418 51.6 1,568 33.4 123 2.6
377 36.0 168 16.0 14 1.351 57.6 50 56.5 1 1.1
191 28.2 124 18.3 23 3.4194 59.4 163 49.9 8 2.5498 65.2 241 31.6 32 4.2
88 50.4 45 25.8 6 3.4109 56.5 62 32.1 2 1.0199 58.1 176 51.4 6 1.850 70.7 37 52.3 4 5.7
105 74.0 85 59.9 3 2.132 50.8 12 19.0 - 0.0
462 68.3 350 51.8 22 3.362 49.7 55 44.1 2 1.6
2,762 56.4 1,725 35.3 82 1.7
309 42.0 183 24.9 14 1.9211 45.1 124 26.5 10 2.1277 59.8 122 26.3 6 1.3216 51.7 137 32.8 18 4.374 23.4 34 10.7 1 0.3
110 59.6 116 62.8 2 1.175 72.0 41 39.4 1 1.0
184 70.9 134 51.6 - 0.01,114 68.2 684 41.9 26 1.6
110 64.9 73 43.1 4 2.482 58.1 77 54.6 - 0.0
159

Table 29
SELECTED CAUSES OF DEATHBy Region, Province and City
Number and Rate/100,000 PopulationPhilippines, 2015
AREA
REGION XII - SOCCSKSARGEN
CotabatoSarangganiSouth CotabatoSultan Kudarat
Cotabato CityCity of KidapawanGeneral Santos CityCity of KoronadalCity of Tacurong
REGION XIII - CARAGA
Agusan del NorteAgusan del SurSurigao del NorteSurigao del SurDinagat Island
Butuan CityCity of Cabadbaran City of BayuganSurigao CityCity of BisligCity of Tandag
ARMM
BasilanLanao del SurMaguindanaoSulu Tawi-tawi
City of LamitanMarawi City
FOREIGN COUNTRY
No. Rate No. Rate No. Rate
Malignant Neoplasm
(C00-C97)
Diabetes Mellitus
(E10-E14)
Nutritional Deficiency
(E40-E64)
1,860 40.9 1,199 26.4 151 3.3
469 37.8 258 20.8 20 1.6174 32.0 93 17.1 4 0.7375 50.7 217 29.3 15 2.0214 30.0 143 20.0 17 2.4
61 20.4 58 19.4 2 0.785 60.6 43 30.7 6 4.3326 54.8 273 45.9 86 14.5
101 57.7 79 45.2 - 0.055 55.9 35 35.6 1 1.0
1,296 49.9 835 32.2 73 2.8
168 59.8 115 40.9 15 5.3172 28.8 95 15.9 14 2.3160 48.3 120 36.3 15 4.5199 45.1 154 34.9 6 1.465 51.1 27 21.2 4 3.1
242 71.8 139 41.2 7 2.152 70.6 22 29.9 - 0.051 49.4 32 31.0 1 1.0
102 66.2 71 46.1 3 1.956 59.2 37 39.1 1 1.129 51.5 23 40.8 7 12.4
231 6.1 124 3.3 14 0.4
5 1.8 5 1.8 - 0.065 7.7 28 3.3 2 0.281 6.9 36 3.1 7 0.627 3.3 17 2.1 3 0.49 2.3 4 1.0 - 0.0
22 29.4 17 22.7 2 2.722 10.9 17 8.4 - 0.0
58 2,717.9 21 984.1 - 0.0
160

Table 29
SELECTED CAUSES OF DEATHBy Region, Province and City
Number and Rate/100,000 PopulationPhilippines, 2015
AREA
PHILIPPINES
NATIONAL CAPITAL REGION
City of Manila City of MandaluyongCity of MarikinaCity of PasigQuezon CitySan JuanKalookan CityCity of MalabonNavotasCity of ValenzuelaCity of Las PiñasCity of MakatiCity of MuntinlupaCity of ParañaquePasay CityPaterosCity of Taguig
CORDILLERA ADMINISTRATIVE REGION
AbraApayaoBenguetIfugaoKalingaMt. Province
Baguio City
REGION I - ILOCOS
Ilocos NorteIlocos SurLa UnionPangasinan
City of BatacLaoag CityCity of CandonCity of ViganCity of San FernandoCity of AlaminosDagupan CitySan Carlos CityCity of Urdaneta
No. Rate No. Rate
136,879 135.6 58,310 57.7
21,724 168.7 6,265 48.7
3,847 216.1 848 47.6556 143.9 239 61.9763 169.3 303 67.2
1,047 138.6 387 51.24,480 152.6 1,388 47.3
314 257.0 55 45.02,875 181.5 693 43.8
881 241.0 168 46.0573 229.7 109 43.7
1,208 194.7 282 45.5850 144.3 309 52.5983 168.7 297 51.0704 139.5 263 52.1922 138.5 272 40.9756 181.5 163 39.1123 192.7 62 97.1842 104.6 427 53.0
1,666 96.7 1,061 61.6
270 112.0 249 103.384 70.5 31 26.0
432 96.8 299 67.0142 70.0 95 46.8163 76.6 74 34.8184 119.0 121 78.3
391 113.2 192 55.6
8,217 163.5 4,044 80.5
740 173.4 363 85.1866 150.6 431 74.9
1,052 158.2 537 80.83,950 166.4 1,884 79.4
174 315.2 50 90.6160 144.0 112 100.8184 303.5 49 80.871 131.8 35 65.0
160 131.3 91 74.7181 201.8 80 89.2203 118.5 174 101.6293 155.4 124 65.8183 137.7 114 85.8
Diseases of the Heart
(I00-I51)
Cerebro Vascular Disease
(I60-I69)
161

Table 29
SELECTED CAUSES OF DEATHBy Region, Province and City
Number and Rate/100,000 PopulationPhilippines, 2015
AREA
REGION II - CAGAYAN VALLEY
BatanesCagayanIsabelaNueva VizcayaQuirino
Tuguegarao CityCity of CauayanIlagan CityCity of Santiago
REGION III - CENTRAL LUZON
AuroraBataanBulacanNueva EcijaPampangaTarlacZambales
City of BalangaCity of MalolosCity of MeycauayanCity of San Jose Del MonteCabanatuan CityCity of GapanScience City of MuñozPalayan CitySan Jose CityAngeles CityMabalacat CityCity of San FernandoCity of TarlacOlangapo City
REGION IVA - CALABARZON
BatangasCaviteLagunaQuezon Rizal
Batangas CityLipa CityCity of TanauanBacoor CityCavite City
No. Rate No. Rate
Diseases of the Heart
(I00-I51)
Cerebro Vascular Disease
(I60-I69)
4,901 142.0 2,076 60.1
19 110.2 15 87.01,636 156.4 665 63.61,526 128.9 646 54.6
609 134.6 277 61.2228 120.6 87 46.0
307 200.0 116 75.6175 135.1 102 78.8176 120.9 90 61.8225 166.9 78 57.9
17,862 159.2 7,549 67.3
203 94.7 184 85.8870 130.9 325 48.9
3,641 161.3 1,370 60.72,427 164.4 1,196 81.02,560 156.0 997 60.81,387 135.5 842 82.3
956 161.8 411 69.6
171 178.0 50 52.1501 198.8 150 59.5341 163.1 96 45.9795 138.5 346 60.3498 164.8 227 75.1197 178.6 90 81.695 116.6 68 83.572 175.4 27 65.8
266 190.4 106 75.9604 146.7 217 52.7352 140.4 169 67.4490 159.8 164 53.5
1,074 313.6 354 103.4362 155.3 160 68.7
20,741 143.9 8,072 56.0
2,555 137.5 1,042 56.12,083 151.9 621 45.31,569 158.0 744 74.92,744 156.2 1,300 74.02,980 141.4 1,140 54.1
358 108.5 188 57.0 434 130.6 192 57.8 233 134.4 90 51.9 801 133.4 233 38.8 291 283.1 65 63.2
162
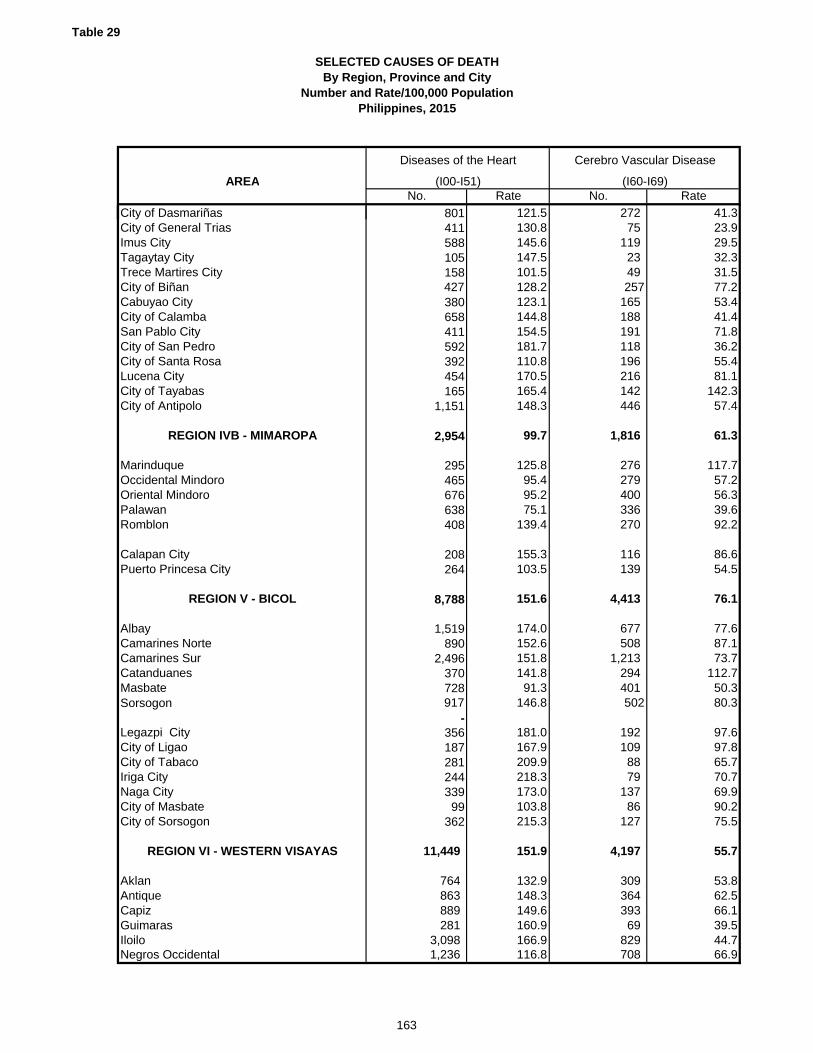
Table 29
SELECTED CAUSES OF DEATHBy Region, Province and City
Number and Rate/100,000 PopulationPhilippines, 2015
AREA
City of DasmariñasCity of General TriasImus CityTagaytay CityTrece Martires CityCity of BiñanCabuyao CityCity of CalambaSan Pablo CityCity of San PedroCity of Santa RosaLucena City City of TayabasCity of Antipolo
REGION IVB - MIMAROPA
MarinduqueOccidental MindoroOriental MindoroPalawanRomblon
Calapan CityPuerto Princesa City
REGION V - BICOL
AlbayCamarines NorteCamarines SurCatanduanesMasbateSorsogon
Legazpi CityCity of LigaoCity of TabacoIriga CityNaga CityCity of MasbateCity of Sorsogon
REGION VI - WESTERN VISAYAS
AklanAntiqueCapizGuimarasIloiloNegros Occidental
No. Rate No. Rate
Diseases of the Heart
(I00-I51)
Cerebro Vascular Disease
(I60-I69)
801 121.5 272 41.3 411 130.8 75 23.9 588 145.6 119 29.5 105 147.5 23 32.3 158 101.5 49 31.5
427 128.2 257 77.2 380 123.1 165 53.4 658 144.8 188 41.4 411 154.5 191 71.8 592 181.7 118 36.2 392 110.8 196 55.4 454 170.5 216 81.1 165 165.4 142 142.3 1,151 148.3 446 57.4
2,954 99.7 1,816 61.3
295 125.8 276 117.7 465 95.4 279 57.2 676 95.2 400 56.3 638 75.1 336 39.6 408 139.4 270 92.2
208 155.3 116 86.6 264 103.5 139 54.5
8,788 151.6 4,413 76.1
1,519 174.0 677 77.6 890 152.6 508 87.1 2,496 151.8 1,213 73.7 370 141.8 294 112.7 728 91.3 401 50.3
917 146.8 502 80.3 - 356 181.0 192 97.6 187 167.9 109 97.8 281 209.9 88 65.7 244 218.3 79 70.7 339 173.0 137 69.9 99 103.8 86 90.2 362 215.3 127 75.5
11,449 151.9 4,197 55.7
764 132.9 309 53.8863 148.3 364 62.5889 149.6 393 66.1281 160.9 69 39.5
3,098 166.9 829 44.71,236 116.8 708 66.9
163
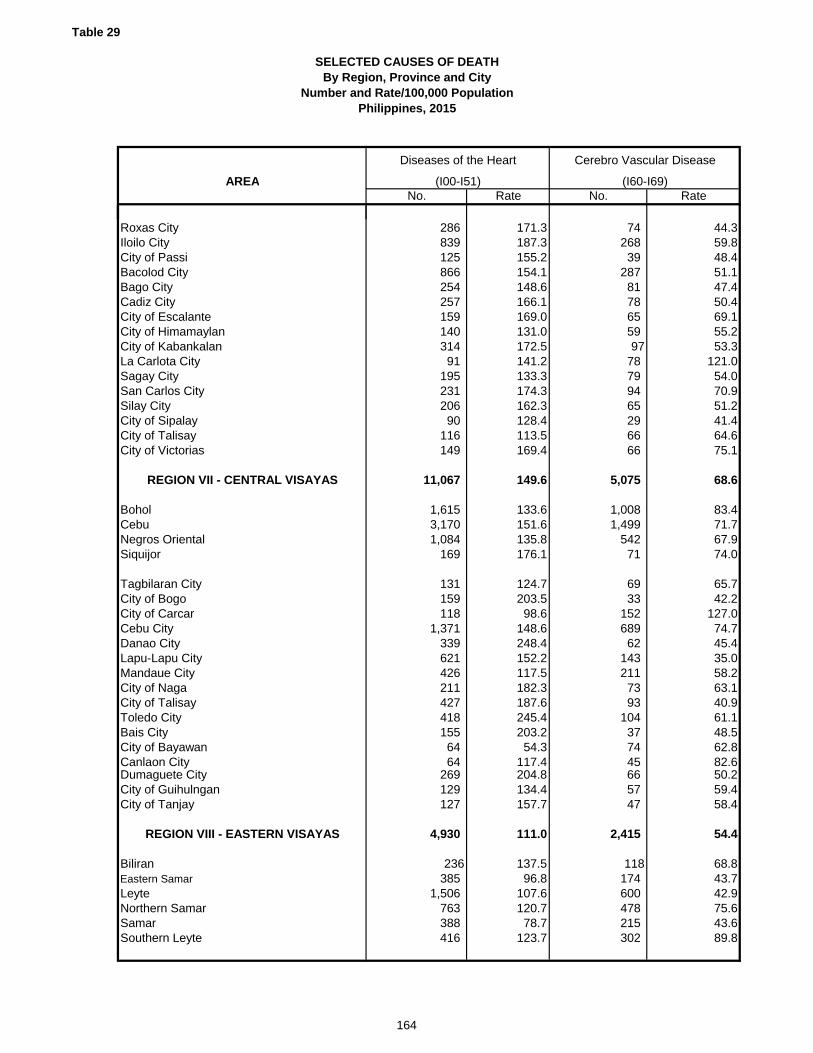
Table 29
SELECTED CAUSES OF DEATHBy Region, Province and City
Number and Rate/100,000 PopulationPhilippines, 2015
AREA
Roxas CityIloilo CityCity of PassiBacolod CityBago CityCadiz CityCity of EscalanteCity of HimamaylanCity of KabankalanLa Carlota CitySagay CitySan Carlos CitySilay CityCity of SipalayCity of TalisayCity of Victorias
REGION VII - CENTRAL VISAYAS
BoholCebuNegros OrientalSiquijor
Tagbilaran CityCity of BogoCity of CarcarCebu CityDanao CityLapu-Lapu CityMandaue CityCity of NagaCity of TalisayToledo CityBais CityCity of BayawanCanlaon CityDumaguete CityCity of GuihulnganCity of Tanjay
REGION VIII - EASTERN VISAYAS
BiliranEastern SamarLeyteNorthern SamarSamarSouthern Leyte
No. Rate No. Rate
Diseases of the Heart
(I00-I51)
Cerebro Vascular Disease
(I60-I69)
286 171.3 74 44.3839 187.3 268 59.8125 155.2 39 48.4866 154.1 287 51.1254 148.6 81 47.4257 166.1 78 50.4159 169.0 65 69.1140 131.0 59 55.2314 172.5 97 53.391 141.2 78 121.0
195 133.3 79 54.0231 174.3 94 70.9206 162.3 65 51.290 128.4 29 41.4
116 113.5 66 64.6149 169.4 66 75.1
11,067 149.6 5,075 68.6
1,615 133.6 1,008 83.43,170 151.6 1,499 71.71,084 135.8 542 67.9
169 176.1 71 74.0
131 124.7 69 65.7159 203.5 33 42.2118 98.6 152 127.0
1,371 148.6 689 74.7339 248.4 62 45.4621 152.2 143 35.0426 117.5 211 58.2211 182.3 73 63.1427 187.6 93 40.9418 245.4 104 61.1155 203.2 37 48.564 54.3 74 62.864 117.4 45 82.6
269 204.8 66 50.2129 134.4 57 59.4127 157.7 47 58.4
4,930 111.0 2,415 54.4
236 137.5 118 68.8385 96.8 174 43.7
1,506 107.6 600 42.9763 120.7 478 75.6388 78.7 215 43.6416 123.7 302 89.8
164
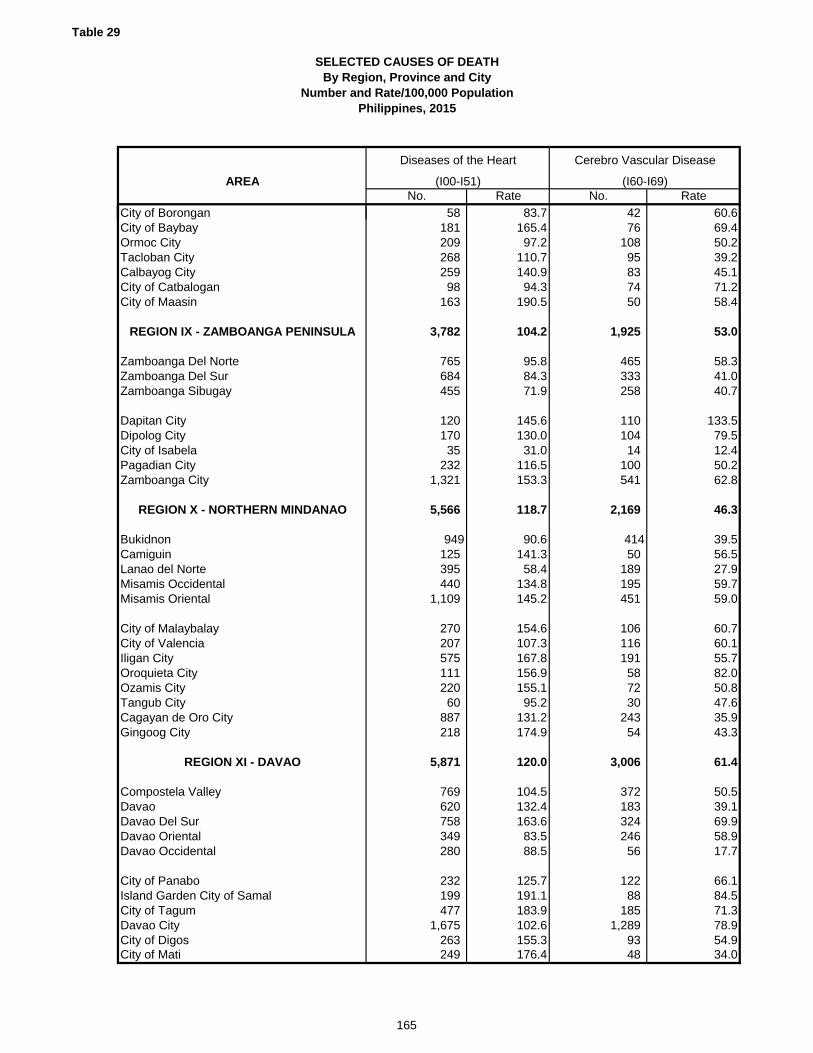
Table 29
SELECTED CAUSES OF DEATHBy Region, Province and City
Number and Rate/100,000 PopulationPhilippines, 2015
AREA
City of BoronganCity of BaybayOrmoc CityTacloban CityCalbayog CityCity of CatbaloganCity of Maasin
REGION IX - ZAMBOANGA PENINSULA
Zamboanga Del NorteZamboanga Del SurZamboanga Sibugay
Dapitan CityDipolog CityCity of IsabelaPagadian CityZamboanga City
REGION X - NORTHERN MINDANAO
BukidnonCamiguinLanao del NorteMisamis OccidentalMisamis Oriental
City of MalaybalayCity of ValenciaIligan CityOroquieta CityOzamis CityTangub CityCagayan de Oro CityGingoog City
REGION XI - DAVAO
Compostela ValleyDavaoDavao Del SurDavao OrientalDavao Occidental
City of PanaboIsland Garden City of SamalCity of TagumDavao CityCity of DigosCity of Mati
No. Rate No. Rate
Diseases of the Heart
(I00-I51)
Cerebro Vascular Disease
(I60-I69)
58 83.7 42 60.6181 165.4 76 69.4209 97.2 108 50.2268 110.7 95 39.2259 140.9 83 45.198 94.3 74 71.2
163 190.5 50 58.4
3,782 104.2 1,925 53.0
765 95.8 465 58.3684 84.3 333 41.0455 71.9 258 40.7
120 145.6 110 133.5170 130.0 104 79.535 31.0 14 12.4
232 116.5 100 50.21,321 153.3 541 62.8
5,566 118.7 2,169 46.3
949 90.6 414 39.5125 141.3 50 56.5395 58.4 189 27.9440 134.8 195 59.7
1,109 145.2 451 59.0
270 154.6 106 60.7207 107.3 116 60.1575 167.8 191 55.7111 156.9 58 82.0220 155.1 72 50.860 95.2 30 47.6
887 131.2 243 35.9218 174.9 54 43.3
5,871 120.0 3,006 61.4
769 104.5 372 50.5620 132.4 183 39.1758 163.6 324 69.9349 83.5 246 58.9280 88.5 56 17.7
232 125.7 122 66.1199 191.1 88 84.5477 183.9 185 71.3
1,675 102.6 1,289 78.9263 155.3 93 54.9249 176.4 48 34.0
165
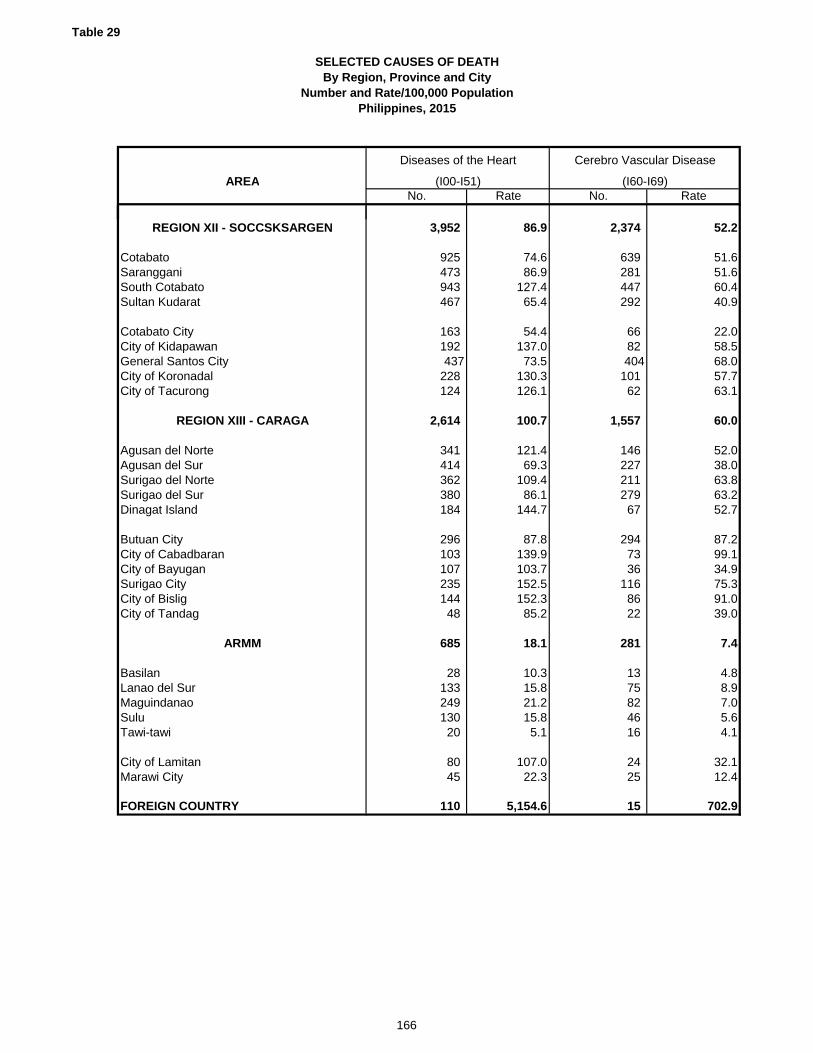
Table 29
SELECTED CAUSES OF DEATHBy Region, Province and City
Number and Rate/100,000 PopulationPhilippines, 2015
AREA
REGION XII - SOCCSKSARGEN
CotabatoSarangganiSouth CotabatoSultan Kudarat
Cotabato CityCity of KidapawanGeneral Santos CityCity of KoronadalCity of Tacurong
REGION XIII - CARAGA
Agusan del NorteAgusan del SurSurigao del NorteSurigao del SurDinagat Island
Butuan CityCity of Cabadbaran City of BayuganSurigao CityCity of BisligCity of Tandag
ARMM
BasilanLanao del SurMaguindanaoSulu Tawi-tawi
City of LamitanMarawi City
FOREIGN COUNTRY
No. Rate No. Rate
Diseases of the Heart
(I00-I51)
Cerebro Vascular Disease
(I60-I69)
3,952 86.9 2,374 52.2
925 74.6 639 51.6473 86.9 281 51.6943 127.4 447 60.4467 65.4 292 40.9
163 54.4 66 22.0192 137.0 82 58.5437 73.5 404 68.0
228 130.3 101 57.7124 126.1 62 63.1
2,614 100.7 1,557 60.0
341 121.4 146 52.0414 69.3 227 38.0362 109.4 211 63.8380 86.1 279 63.2184 144.7 67 52.7
296 87.8 294 87.2103 139.9 73 99.1107 103.7 36 34.9235 152.5 116 75.3144 152.3 86 91.048 85.2 22 39.0
685 18.1 281 7.4
28 10.3 13 4.8133 15.8 75 8.9249 21.2 82 7.0130 15.8 46 5.620 5.1 16 4.1
80 107.0 24 32.145 22.3 25 12.4
110 5,154.6 15 702.9
166
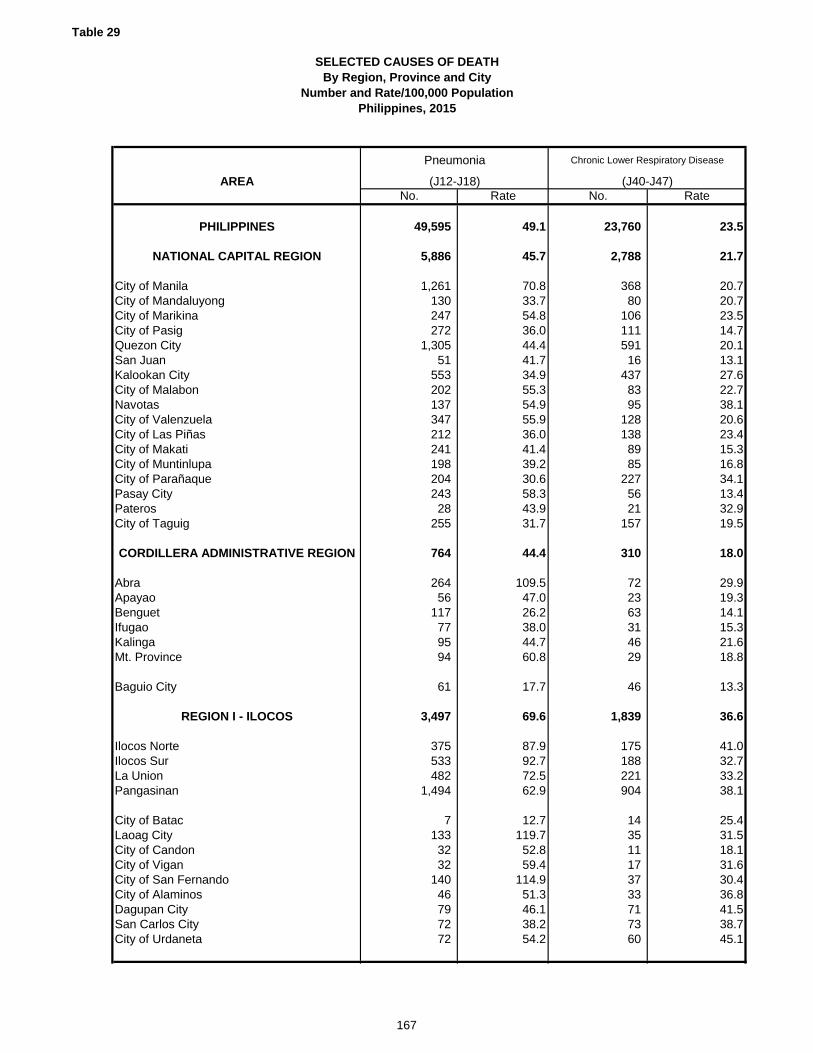
Table 29
SELECTED CAUSES OF DEATHBy Region, Province and City
Number and Rate/100,000 PopulationPhilippines, 2015
AREA
PHILIPPINES
NATIONAL CAPITAL REGION
City of Manila City of MandaluyongCity of MarikinaCity of PasigQuezon CitySan JuanKalookan CityCity of MalabonNavotasCity of ValenzuelaCity of Las PiñasCity of MakatiCity of MuntinlupaCity of ParañaquePasay CityPaterosCity of Taguig
CORDILLERA ADMINISTRATIVE REGION
AbraApayaoBenguetIfugaoKalingaMt. Province
Baguio City
REGION I - ILOCOS
Ilocos NorteIlocos SurLa UnionPangasinan
City of BatacLaoag CityCity of CandonCity of ViganCity of San FernandoCity of AlaminosDagupan CitySan Carlos CityCity of Urdaneta
No. Rate No. Rate
49,595 49.1 23,760 23.5
5,886 45.7 2,788 21.7
1,261 70.8 368 20.7130 33.7 80 20.7247 54.8 106 23.5272 36.0 111 14.7
1,305 44.4 591 20.151 41.7 16 13.1
553 34.9 437 27.6202 55.3 83 22.7137 54.9 95 38.1347 55.9 128 20.6212 36.0 138 23.4241 41.4 89 15.3198 39.2 85 16.8204 30.6 227 34.1243 58.3 56 13.428 43.9 21 32.9
255 31.7 157 19.5
764 44.4 310 18.0
264 109.5 72 29.956 47.0 23 19.3
117 26.2 63 14.177 38.0 31 15.395 44.7 46 21.694 60.8 29 18.8
61 17.7 46 13.3
3,497 69.6 1,839 36.6
375 87.9 175 41.0533 92.7 188 32.7482 72.5 221 33.2
1,494 62.9 904 38.1
7 12.7 14 25.4133 119.7 35 31.532 52.8 11 18.132 59.4 17 31.6
140 114.9 37 30.446 51.3 33 36.879 46.1 71 41.572 38.2 73 38.772 54.2 60 45.1
Pneumonia
(J12-J18)
Chronic Lower Respiratory Disease
(J40-J47)
167

Table 29
SELECTED CAUSES OF DEATHBy Region, Province and City
Number and Rate/100,000 PopulationPhilippines, 2015
AREA
REGION II - CAGAYAN VALLEY
BatanesCagayanIsabelaNueva VizcayaQuirino
Tuguegarao CityCity of CauayanIlagan CityCity of Santiago
REGION III - CENTRAL LUZON
AuroraBataanBulacanNueva EcijaPampangaTarlacZambales
City of BalangaCity of MalolosCity of MeycauayanCity of San Jose Del MonteCabanatuan CityCity of GapanScience City of MuñozPalayan CitySan Jose CityAngeles CityMabalacat CityCity of San FernandoCity of TarlacOlangapo City
REGION IVA - CALABARZON
BatangasCaviteLagunaQuezon Rizal
Batangas CityLipa CityCity of TanauanBacoor CityCavite City
No. Rate No. Rate
Pneumonia
(J12-J18)
Chronic Lower Respiratory Disease
(J40-J47)
2,299 66.6 1,109 32.1
18 104.4 8 46.4835 79.8 348 33.3684 57.8 379 32.0241 53.3 174 38.5132 69.8 60 31.7
72 46.9 36 23.5120 92.6 21 16.298 67.3 42 28.999 73.4 41 30.4
4,090 36.5 3,571 31.8
54 25.2 77 35.9226 34.0 206 31.0773 34.3 602 26.7571 38.7 689 46.7395 24.1 450 27.4417 40.7 374 36.5341 57.7 206 34.9
26 27.1 16 16.797 38.5 51 20.295 45.4 52 24.9
304 53.0 113 19.795 31.4 134 44.344 39.9 51 46.289 109.2 44 54.06 14.6 22 53.6
44 31.5 71 50.8162 39.4 97 23.660 23.9 84 33.576 24.8 60 19.6117 34.2 116 33.998 42.1 56 24.0
5,665 39.3 3,199 22.2
838 45.1 461 24.8600 43.8 348 25.4346 34.8 279 28.1855 48.7 413 23.5782 37.1 403 19.1
93 28.2 60 18.294 28.3 71 21.451 29.4 40 23.1
173 28.8 112 18.660 58.4 30 29.2
168

Table 29
SELECTED CAUSES OF DEATHBy Region, Province and City
Number and Rate/100,000 PopulationPhilippines, 2015
AREA
City of DasmariñasCity of General TriasImus CityTagaytay CityTrece Martires CityCity of BiñanCabuyao CityCity of CalambaSan Pablo CityCity of San PedroCity of Santa RosaLucena City City of TayabasCity of Antipolo
REGION IVB - MIMAROPA
MarinduqueOccidental MindoroOriental MindoroPalawanRomblon
Calapan CityPuerto Princesa City
REGION V - BICOL
AlbayCamarines NorteCamarines SurCatanduanesMasbateSorsogon
Legazpi CityCity of LigaoCity of TabacoIriga CityNaga CityCity of MasbateCity of Sorsogon
REGION VI - WESTERN VISAYAS
AklanAntiqueCapizGuimarasIloiloNegros Occidental
No. Rate No. Rate
Pneumonia
(J12-J18)
Chronic Lower Respiratory Disease
(J40-J47)
305 46.3 147 22.3114 36.3 44 14.0121 30.0 87 21.511 15.5 12 16.949 31.5 23 14.881 24.3 127 38.1
82 26.6 54 17.5111 24.4 54 11.999 37.2 91 34.299 30.4 46 14.1
165 46.6 66 18.7180 67.6 41 15.460 60.1 11 11.0
296 38.1 179 23.1
1,230 41.5 749 25.3
199 84.9 109 46.5137 28.1 126 25.9211 29.7 185 26.1360 42.4 145 17.1195 66.6 92 31.4
26 19.4 43 32.1102 40.0 49 19.2
3,432 59.2 1,610 27.8
694 79.5 263 30.1254 43.5 248 42.5853 51.9 440 26.8246 94.3 55 21.1366 45.9 161 20.2409 65.5 160 25.6
158 80.4 47 23.970 62.8 39 35.097 72.5 29 21.732 28.6 37 33.1
110 56.1 72 36.736 37.7 25 26.2
107 63.6 34 20.2
6,271 83.2 2,136 28.3
583 101.4 177 30.8716 123.0 177 30.4540 90.9 149 25.172 41.2 44 25.2
1,858 100.1 525 28.3748 70.7 300 28.3
169

Table 29
SELECTED CAUSES OF DEATHBy Region, Province and City
Number and Rate/100,000 PopulationPhilippines, 2015
AREA
Roxas CityIloilo CityCity of PassiBacolod CityBago CityCadiz CityCity of EscalanteCity of HimamaylanCity of KabankalanLa Carlota CitySagay CitySan Carlos CitySilay CityCity of SipalayCity of TalisayCity of Victorias
REGION VII - CENTRAL VISAYAS
BoholCebuNegros OrientalSiquijor
Tagbilaran CityCity of BogoCity of CarcarCebu CityDanao CityLapu-Lapu CityMandaue CityCity of NagaCity of TalisayToledo CityBais CityCity of BayawanCanlaon CityDumaguete CityCity of GuihulnganCity of Tanjay
REGION VIII - EASTERN VISAYAS
BiliranEastern SamarLeyteNorthern SamarSamarSouthern Leyte
No. Rate No. Rate
Pneumonia
(J12-J18)
Chronic Lower Respiratory Disease
(J40-J47)
96 57.5 33 19.8278 62.1 137 30.668 84.4 47 58.4
221 39.3 129 23.090 52.6 42 24.670 45.2 39 25.248 51.0 26 27.661 57.1 68 63.6148 81.3 36 19.853 82.2 30 46.5
130 88.9 28 19.1169 127.5 14 10.6102 80.4 57 44.929 41.4 21 30.0
142 138.9 32 31.349 55.7 25 28.4
4,933 66.7 1,511 20.4
1,051 87.0 311 25.71,361 65.1 434 20.8
567 71.0 150 18.858 60.4 23 24.0
35 33.3 18 17.129 37.1 12 15.4
113 94.4 12 10.0747 81.0 164 17.837 27.1 30 22.0
300 73.5 61 14.9133 36.7 62 17.140 34.6 21 18.197 42.6 31 13.6
101 59.3 43 25.228 36.7 18 23.626 22.1 15 12.741 75.2 19 34.955 41.9 29 22.154 56.3 33 34.460 74.5 25 31.0
2,855 64.3 1,119 25.2
118 68.8 65 37.9186 46.7 56 14.1970 69.3 301 21.5291 46.0 175 27.7192 39.0 125 25.4308 91.6 128 38.1
170

Table 29
SELECTED CAUSES OF DEATHBy Region, Province and City
Number and Rate/100,000 PopulationPhilippines, 2015
AREA
City of BoronganCity of BaybayOrmoc CityTacloban CityCalbayog CityCity of CatbaloganCity of Maasin
REGION IX - ZAMBOANGA PENINSULA
Zamboanga Del NorteZamboanga Del SurZamboanga Sibugay
Dapitan CityDipolog CityCity of IsabelaPagadian CityZamboanga City
REGION X - NORTHERN MINDANAO
BukidnonCamiguinLanao del NorteMisamis OccidentalMisamis Oriental
City of MalaybalayCity of ValenciaIligan CityOroquieta CityOzamis CityTangub CityCagayan de Oro CityGingoog City
REGION XI - DAVAO
Compostela ValleyDavaoDavao Del SurDavao OrientalDavao Occidental
City of PanaboIsland Garden City of SamalCity of TagumDavao CityCity of DigosCity of Mati
No. Rate No. Rate
Pneumonia
(J12-J18)
Chronic Lower Respiratory Disease
(J40-J47)
97 140.0 9 13.082 74.9 49 44.8
119 55.3 47 21.9131 54.1 36 14.9156 84.9 68 37.0142 136.7 28 27.063 73.6 32 37.4
1,030 28.4 558 15.4
204 25.6 141 17.7217 26.7 104 12.8225 35.5 88 13.9
47 57.0 21 25.550 38.2 11 8.42 1.8 3 2.7
45 22.6 23 11.6240 27.8 167 19.4
2,062 44.0 896 19.1
442 42.2 152 14.593 105.1 18 20.3
200 29.6 72 10.6193 59.1 110 33.7378 49.5 202 26.4
56 32.1 28 16.0112 58.0 31 16.1179 52.2 61 17.870 98.9 12 17.089 62.8 37 26.124 38.1 16 25.4
170 25.1 120 17.856 44.9 37 29.7
2,428 49.6 845 17.3
281 38.2 86 11.7215 45.9 111 23.7215 46.4 102 22.0343 82.1 80 19.1194 61.3 22 7.0
48 26.0 64 34.747 45.1 18 17.3
110 42.4 55 21.2747 45.7 243 14.9147 86.8 39 23.081 57.4 25 17.7
171
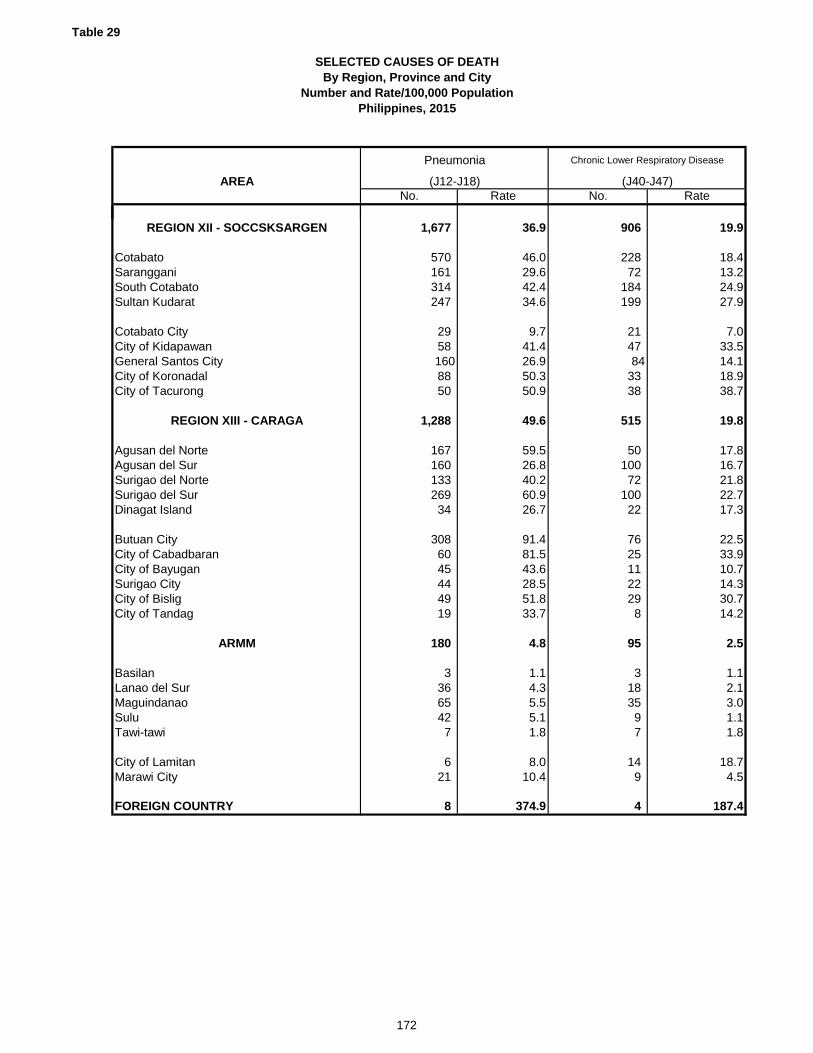
Table 29
SELECTED CAUSES OF DEATHBy Region, Province and City
Number and Rate/100,000 PopulationPhilippines, 2015
AREA
REGION XII - SOCCSKSARGEN
CotabatoSarangganiSouth CotabatoSultan Kudarat
Cotabato CityCity of KidapawanGeneral Santos CityCity of KoronadalCity of Tacurong
REGION XIII - CARAGA
Agusan del NorteAgusan del SurSurigao del NorteSurigao del SurDinagat Island
Butuan CityCity of Cabadbaran City of BayuganSurigao CityCity of BisligCity of Tandag
ARMM
BasilanLanao del SurMaguindanaoSulu Tawi-tawi
City of LamitanMarawi City
FOREIGN COUNTRY
No. Rate No. Rate
Pneumonia
(J12-J18)
Chronic Lower Respiratory Disease
(J40-J47)
1,677 36.9 906 19.9
570 46.0 228 18.4161 29.6 72 13.2314 42.4 184 24.9247 34.6 199 27.9
29 9.7 21 7.058 41.4 47 33.5160 26.9 84 14.188 50.3 33 18.950 50.9 38 38.7
1,288 49.6 515 19.8
167 59.5 50 17.8160 26.8 100 16.7133 40.2 72 21.8269 60.9 100 22.734 26.7 22 17.3
308 91.4 76 22.560 81.5 25 33.945 43.6 11 10.744 28.5 22 14.349 51.8 29 30.719 33.7 8 14.2
180 4.8 95 2.5
3 1.1 3 1.136 4.3 18 2.165 5.5 35 3.042 5.1 9 1.17 1.8 7 1.8
6 8.0 14 18.721 10.4 9 4.5
8 374.9 4 187.4
172
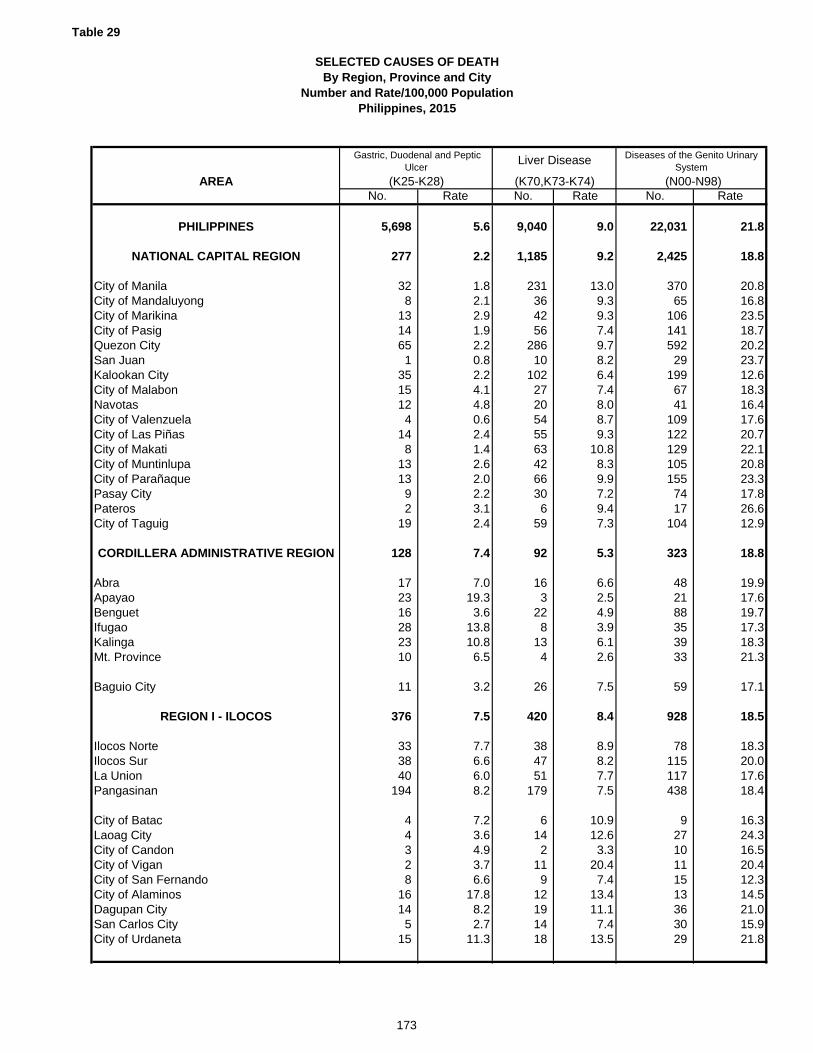
Table 29
SELECTED CAUSES OF DEATHBy Region, Province and City
Number and Rate/100,000 PopulationPhilippines, 2015
AREA
PHILIPPINES
NATIONAL CAPITAL REGION
City of Manila City of MandaluyongCity of MarikinaCity of PasigQuezon CitySan JuanKalookan CityCity of MalabonNavotasCity of ValenzuelaCity of Las PiñasCity of MakatiCity of MuntinlupaCity of ParañaquePasay CityPaterosCity of Taguig
CORDILLERA ADMINISTRATIVE REGION
AbraApayaoBenguetIfugaoKalingaMt. Province
Baguio City
REGION I - ILOCOS
Ilocos NorteIlocos SurLa UnionPangasinan
City of BatacLaoag CityCity of CandonCity of ViganCity of San FernandoCity of AlaminosDagupan CitySan Carlos CityCity of Urdaneta
No. Rate No. Rate No. Rate
5,698 5.6 9,040 9.0 22,031 21.8
277 2.2 1,185 9.2 2,425 18.8
32 1.8 231 13.0 370 20.88 2.1 36 9.3 65 16.8
13 2.9 42 9.3 106 23.514 1.9 56 7.4 141 18.765 2.2 286 9.7 592 20.21 0.8 10 8.2 29 23.7
35 2.2 102 6.4 199 12.615 4.1 27 7.4 67 18.312 4.8 20 8.0 41 16.44 0.6 54 8.7 109 17.6
14 2.4 55 9.3 122 20.78 1.4 63 10.8 129 22.1
13 2.6 42 8.3 105 20.813 2.0 66 9.9 155 23.39 2.2 30 7.2 74 17.82 3.1 6 9.4 17 26.6
19 2.4 59 7.3 104 12.9
128 7.4 92 5.3 323 18.8
17 7.0 16 6.6 48 19.923 19.3 3 2.5 21 17.616 3.6 22 4.9 88 19.728 13.8 8 3.9 35 17.323 10.8 13 6.1 39 18.310 6.5 4 2.6 33 21.3
11 3.2 26 7.5 59 17.1
376 7.5 420 8.4 928 18.5
33 7.7 38 8.9 78 18.338 6.6 47 8.2 115 20.040 6.0 51 7.7 117 17.6
194 8.2 179 7.5 438 18.4
4 7.2 6 10.9 9 16.34 3.6 14 12.6 27 24.33 4.9 2 3.3 10 16.52 3.7 11 20.4 11 20.48 6.6 9 7.4 15 12.3
16 17.8 12 13.4 13 14.514 8.2 19 11.1 36 21.05 2.7 14 7.4 30 15.9
15 11.3 18 13.5 29 21.8
Gastric, Duodenal and Peptic Ulcer
(K25-K28)
Liver Disease
(K70,K73-K74)
Diseases of the Genito Urinary System
(N00-N98)
173
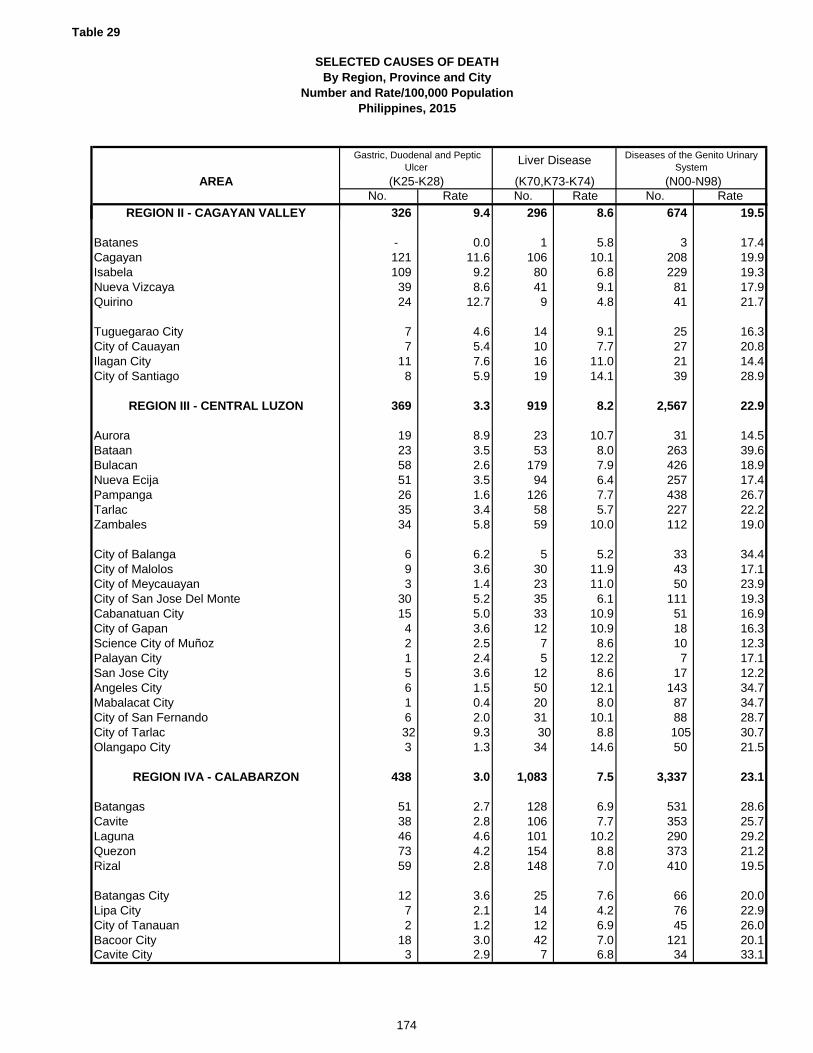
Table 29
SELECTED CAUSES OF DEATHBy Region, Province and City
Number and Rate/100,000 PopulationPhilippines, 2015
AREA
REGION II - CAGAYAN VALLEY
BatanesCagayanIsabelaNueva VizcayaQuirino
Tuguegarao CityCity of CauayanIlagan CityCity of Santiago
REGION III - CENTRAL LUZON
AuroraBataanBulacanNueva EcijaPampangaTarlacZambales
City of BalangaCity of MalolosCity of MeycauayanCity of San Jose Del MonteCabanatuan CityCity of GapanScience City of MuñozPalayan CitySan Jose CityAngeles CityMabalacat CityCity of San FernandoCity of TarlacOlangapo City
REGION IVA - CALABARZON
BatangasCaviteLagunaQuezon Rizal
Batangas CityLipa CityCity of TanauanBacoor CityCavite City
No. Rate No. Rate No. Rate
Gastric, Duodenal and Peptic Ulcer
(K25-K28)
Liver Disease
(K70,K73-K74)
Diseases of the Genito Urinary System
(N00-N98)
326 9.4 296 8.6 674 19.5
- 0.0 1 5.8 3 17.4121 11.6 106 10.1 208 19.9109 9.2 80 6.8 229 19.339 8.6 41 9.1 81 17.924 12.7 9 4.8 41 21.7
7 4.6 14 9.1 25 16.37 5.4 10 7.7 27 20.8
11 7.6 16 11.0 21 14.48 5.9 19 14.1 39 28.9
369 3.3 919 8.2 2,567 22.9
19 8.9 23 10.7 31 14.523 3.5 53 8.0 263 39.658 2.6 179 7.9 426 18.951 3.5 94 6.4 257 17.426 1.6 126 7.7 438 26.735 3.4 58 5.7 227 22.234 5.8 59 10.0 112 19.0
6 6.2 5 5.2 33 34.49 3.6 30 11.9 43 17.13 1.4 23 11.0 50 23.9
30 5.2 35 6.1 111 19.315 5.0 33 10.9 51 16.94 3.6 12 10.9 18 16.32 2.5 7 8.6 10 12.31 2.4 5 12.2 7 17.15 3.6 12 8.6 17 12.26 1.5 50 12.1 143 34.71 0.4 20 8.0 87 34.76 2.0 31 10.1 88 28.732 9.3 30 8.8 105 30.73 1.3 34 14.6 50 21.5
438 3.0 1,083 7.5 3,337 23.1
51 2.7 128 6.9 531 28.638 2.8 106 7.7 353 25.746 4.6 101 10.2 290 29.273 4.2 154 8.8 373 21.259 2.8 148 7.0 410 19.5
12 3.6 25 7.6 66 20.07 2.1 14 4.2 76 22.92 1.2 12 6.9 45 26.0
18 3.0 42 7.0 121 20.13 2.9 7 6.8 34 33.1
174

Table 29
SELECTED CAUSES OF DEATHBy Region, Province and City
Number and Rate/100,000 PopulationPhilippines, 2015
AREA
City of DasmariñasCity of General TriasImus CityTagaytay CityTrece Martires CityCity of BiñanCabuyao CityCity of CalambaSan Pablo CityCity of San PedroCity of Santa RosaLucena City City of TayabasCity of Antipolo
REGION IVB - MIMAROPA
MarinduqueOccidental MindoroOriental MindoroPalawanRomblon
Calapan CityPuerto Princesa City
REGION V - BICOL
AlbayCamarines NorteCamarines SurCatanduanesMasbateSorsogon
Legazpi CityCity of LigaoCity of TabacoIriga CityNaga CityCity of MasbateCity of Sorsogon
REGION VI - WESTERN VISAYAS
AklanAntiqueCapizGuimarasIloiloNegros Occidental
No. Rate No. Rate No. Rate
Gastric, Duodenal and Peptic Ulcer
(K25-K28)
Liver Disease
(K70,K73-K74)
Diseases of the Genito Urinary System
(N00-N98)
29 4.4 48 7.3 162 24.613 4.1 7 2.2 31 9.96 1.5 29 7.2 71 17.62 2.8 6 8.4 21 29.54 2.6 9 5.8 32 20.65 1.5 22 6.6 62 18.6
7 2.3 25 8.1 71 23.011 2.4 35 7.7 108 23.88 3.0 30 11.3 64 24.16 1.8 27 8.3 88 27.05 1.4 23 6.5 60 17.08 3.0 26 9.8 91 34.2
- 0.0 9 9.0 28 28.125 3.2 50 6.4 149 19.2
201 6.8 291 9.8 490 16.5
19 8.1 25 10.7 54 23.016 3.3 45 9.2 43 8.853 7.5 86 12.1 125 17.666 7.8 51 6.0 124 14.628 9.6 55 18.8 61 20.8
6 4.5 13 9.7 27 20.213 5.1 16 6.3 56 22.0
327 5.6 552 9.5 1,356 23.4
34 3.9 68 7.8 165 18.943 7.4 43 7.4 146 25.088 5.4 125 7.6 436 26.519 7.3 42 16.1 58 22.262 7.8 66 8.3 96 12.037 5.9 69 11.0 202 32.3
6 3.1 34 17.3 48 24.42 1.8 15 13.5 15 13.51 0.7 22 16.4 35 26.17 6.3 10 8.9 41 36.7
13 6.6 29 14.8 52 26.510 10.5 12 12.6 18 18.95 3.0 17 10.1 44 26.2
529 7.0 982 13.0 1,989 26.4
48 8.4 58 10.1 118 20.547 8.1 63 10.8 123 21.139 6.6 62 10.4 124 20.97 4.0 13 7.4 34 19.5
113 6.1 240 12.9 418 22.597 9.2 149 14.1 356 33.6
175
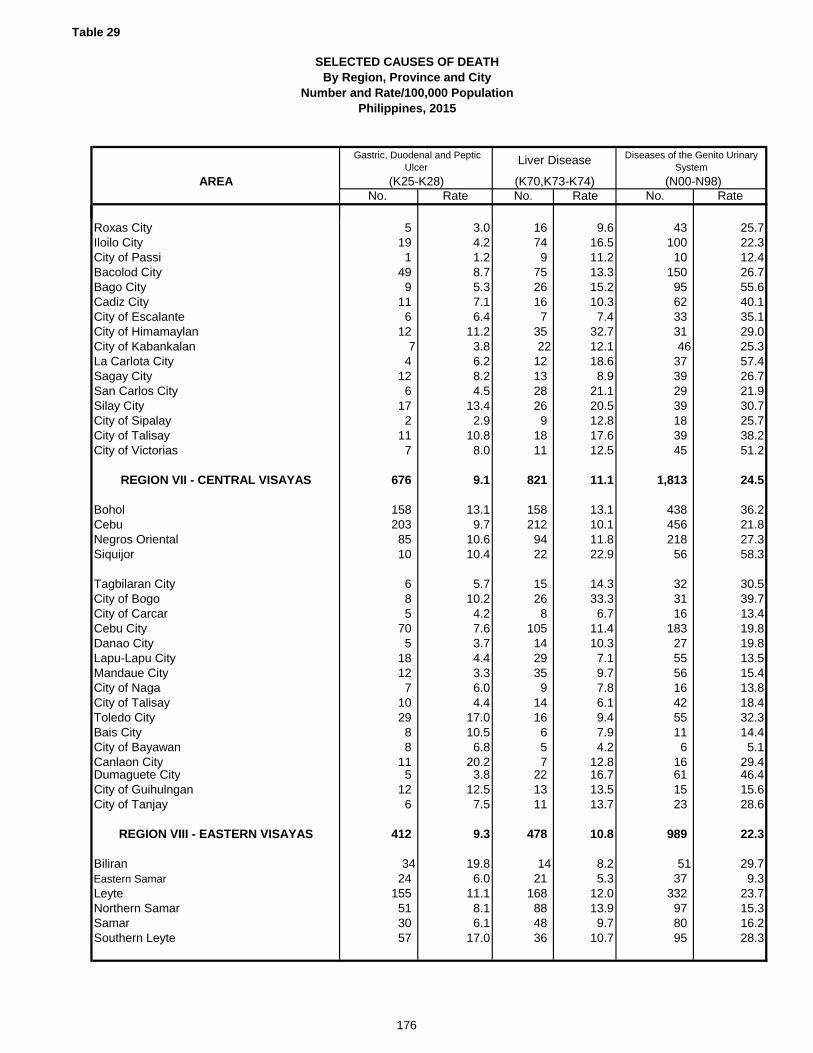
Table 29
SELECTED CAUSES OF DEATHBy Region, Province and City
Number and Rate/100,000 PopulationPhilippines, 2015
AREA
Roxas CityIloilo CityCity of PassiBacolod CityBago CityCadiz CityCity of EscalanteCity of HimamaylanCity of KabankalanLa Carlota CitySagay CitySan Carlos CitySilay CityCity of SipalayCity of TalisayCity of Victorias
REGION VII - CENTRAL VISAYAS
BoholCebuNegros OrientalSiquijor
Tagbilaran CityCity of BogoCity of CarcarCebu CityDanao CityLapu-Lapu CityMandaue CityCity of NagaCity of TalisayToledo CityBais CityCity of BayawanCanlaon CityDumaguete CityCity of GuihulnganCity of Tanjay
REGION VIII - EASTERN VISAYAS
BiliranEastern SamarLeyteNorthern SamarSamarSouthern Leyte
No. Rate No. Rate No. Rate
Gastric, Duodenal and Peptic Ulcer
(K25-K28)
Liver Disease
(K70,K73-K74)
Diseases of the Genito Urinary System
(N00-N98)
5 3.0 16 9.6 43 25.719 4.2 74 16.5 100 22.31 1.2 9 11.2 10 12.4
49 8.7 75 13.3 150 26.79 5.3 26 15.2 95 55.6
11 7.1 16 10.3 62 40.16 6.4 7 7.4 33 35.1
12 11.2 35 32.7 31 29.07 3.8 22 12.1 46 25.3
4 6.2 12 18.6 37 57.412 8.2 13 8.9 39 26.76 4.5 28 21.1 29 21.9
17 13.4 26 20.5 39 30.72 2.9 9 12.8 18 25.7
11 10.8 18 17.6 39 38.27 8.0 11 12.5 45 51.2
676 9.1 821 11.1 1,813 24.5
158 13.1 158 13.1 438 36.2203 9.7 212 10.1 456 21.885 10.6 94 11.8 218 27.310 10.4 22 22.9 56 58.3
6 5.7 15 14.3 32 30.58 10.2 26 33.3 31 39.75 4.2 8 6.7 16 13.4
70 7.6 105 11.4 183 19.85 3.7 14 10.3 27 19.8
18 4.4 29 7.1 55 13.512 3.3 35 9.7 56 15.47 6.0 9 7.8 16 13.8
10 4.4 14 6.1 42 18.429 17.0 16 9.4 55 32.38 10.5 6 7.9 11 14.48 6.8 5 4.2 6 5.1
11 20.2 7 12.8 16 29.45 3.8 22 16.7 61 46.4
12 12.5 13 13.5 15 15.66 7.5 11 13.7 23 28.6
412 9.3 478 10.8 989 22.3
34 19.8 14 8.2 51 29.724 6.0 21 5.3 37 9.3
155 11.1 168 12.0 332 23.751 8.1 88 13.9 97 15.330 6.1 48 9.7 80 16.257 17.0 36 10.7 95 28.3
176
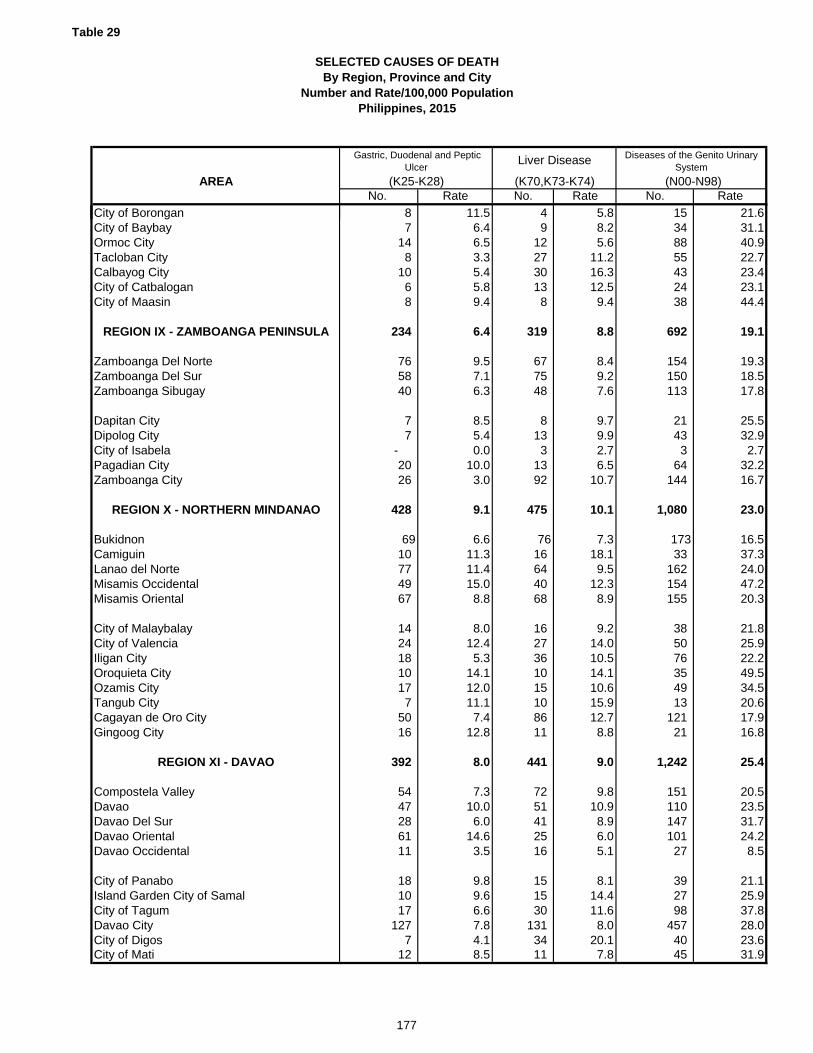
Table 29
SELECTED CAUSES OF DEATHBy Region, Province and City
Number and Rate/100,000 PopulationPhilippines, 2015
AREA
City of BoronganCity of BaybayOrmoc CityTacloban CityCalbayog CityCity of CatbaloganCity of Maasin
REGION IX - ZAMBOANGA PENINSULA
Zamboanga Del NorteZamboanga Del SurZamboanga Sibugay
Dapitan CityDipolog CityCity of IsabelaPagadian CityZamboanga City
REGION X - NORTHERN MINDANAO
BukidnonCamiguinLanao del NorteMisamis OccidentalMisamis Oriental
City of MalaybalayCity of ValenciaIligan CityOroquieta CityOzamis CityTangub CityCagayan de Oro CityGingoog City
REGION XI - DAVAO
Compostela ValleyDavaoDavao Del SurDavao OrientalDavao Occidental
City of PanaboIsland Garden City of SamalCity of TagumDavao CityCity of DigosCity of Mati
No. Rate No. Rate No. Rate
Gastric, Duodenal and Peptic Ulcer
(K25-K28)
Liver Disease
(K70,K73-K74)
Diseases of the Genito Urinary System
(N00-N98)
8 11.5 4 5.8 15 21.67 6.4 9 8.2 34 31.1
14 6.5 12 5.6 88 40.98 3.3 27 11.2 55 22.7
10 5.4 30 16.3 43 23.46 5.8 13 12.5 24 23.18 9.4 8 9.4 38 44.4
234 6.4 319 8.8 692 19.1
76 9.5 67 8.4 154 19.358 7.1 75 9.2 150 18.540 6.3 48 7.6 113 17.8
7 8.5 8 9.7 21 25.57 5.4 13 9.9 43 32.9
- 0.0 3 2.7 3 2.720 10.0 13 6.5 64 32.226 3.0 92 10.7 144 16.7
428 9.1 475 10.1 1,080 23.0
69 6.6 76 7.3 173 16.510 11.3 16 18.1 33 37.377 11.4 64 9.5 162 24.049 15.0 40 12.3 154 47.267 8.8 68 8.9 155 20.3
14 8.0 16 9.2 38 21.824 12.4 27 14.0 50 25.918 5.3 36 10.5 76 22.210 14.1 10 14.1 35 49.517 12.0 15 10.6 49 34.57 11.1 10 15.9 13 20.6
50 7.4 86 12.7 121 17.916 12.8 11 8.8 21 16.8
392 8.0 441 9.0 1,242 25.4
54 7.3 72 9.8 151 20.547 10.0 51 10.9 110 23.528 6.0 41 8.9 147 31.761 14.6 25 6.0 101 24.211 3.5 16 5.1 27 8.5
18 9.8 15 8.1 39 21.110 9.6 15 14.4 27 25.917 6.6 30 11.6 98 37.8
127 7.8 131 8.0 457 28.07 4.1 34 20.1 40 23.6
12 8.5 11 7.8 45 31.9
177
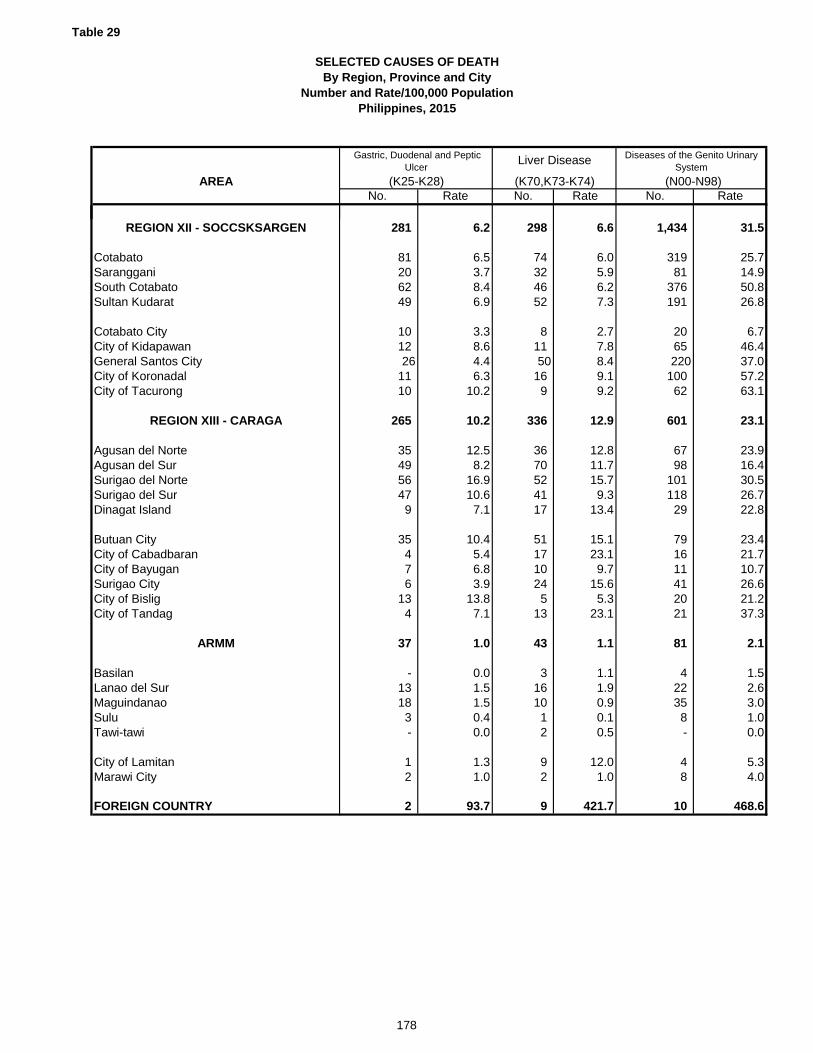
Table 29
SELECTED CAUSES OF DEATHBy Region, Province and City
Number and Rate/100,000 PopulationPhilippines, 2015
AREA
REGION XII - SOCCSKSARGEN
CotabatoSarangganiSouth CotabatoSultan Kudarat
Cotabato CityCity of KidapawanGeneral Santos CityCity of KoronadalCity of Tacurong
REGION XIII - CARAGA
Agusan del NorteAgusan del SurSurigao del NorteSurigao del SurDinagat Island
Butuan CityCity of Cabadbaran City of BayuganSurigao CityCity of BisligCity of Tandag
ARMM
BasilanLanao del SurMaguindanaoSulu Tawi-tawi
City of LamitanMarawi City
FOREIGN COUNTRY
No. Rate No. Rate No. Rate
Gastric, Duodenal and Peptic Ulcer
(K25-K28)
Liver Disease
(K70,K73-K74)
Diseases of the Genito Urinary System
(N00-N98)
281 6.2 298 6.6 1,434 31.5
81 6.5 74 6.0 319 25.720 3.7 32 5.9 81 14.962 8.4 46 6.2 376 50.849 6.9 52 7.3 191 26.8
10 3.3 8 2.7 20 6.712 8.6 11 7.8 65 46.426 4.4 50 8.4 220 37.0
11 6.3 16 9.1 100 57.210 10.2 9 9.2 62 63.1
265 10.2 336 12.9 601 23.1
35 12.5 36 12.8 67 23.949 8.2 70 11.7 98 16.456 16.9 52 15.7 101 30.547 10.6 41 9.3 118 26.79 7.1 17 13.4 29 22.8
35 10.4 51 15.1 79 23.44 5.4 17 23.1 16 21.77 6.8 10 9.7 11 10.76 3.9 24 15.6 41 26.6
13 13.8 5 5.3 20 21.24 7.1 13 23.1 21 37.3
37 1.0 43 1.1 81 2.1
- 0.0 3 1.1 4 1.513 1.5 16 1.9 22 2.618 1.5 10 0.9 35 3.03 0.4 1 0.1 8 1.0- 0.0 2 0.5 - 0.0
1 1.3 9 12.0 4 5.32 1.0 2 1.0 8 4.0
2 93.7 9 421.7 10 468.6
178

Table 29
SELECTED CAUSES OF DEATHBy Region, Province and City
Number and Rate/100,000 PopulationPhilippines, 2015
AREA
PHILIPPINES
NATIONAL CAPITAL REGION
City of Manila City of MandaluyongCity of MarikinaCity of PasigQuezon CitySan JuanKalookan CityCity of MalabonNavotasCity of ValenzuelaCity of Las PiñasCity of MakatiCity of MuntinlupaCity of ParañaquePasay CityPaterosCity of Taguig
CORDILLERA ADMINISTRATIVE REGION
AbraApayaoBenguetIfugaoKalingaMt. Province
Baguio City
REGION I - ILOCOS
Ilocos NorteIlocos SurLa UnionPangasinan
City of BatacLaoag CityCity of CandonCity of ViganCity of San FernandoCity of AlaminosDagupan CitySan Carlos CityCity of Urdaneta
No. Rate No. Rate No. Rate
9,831 9.7 5,138 5.1 10,033 9.9
1,953 15.2 845 6.6 410 3.2
364 20.4 120 6.7 57 3.250 12.9 19 4.9 8 2.176 16.9 34 7.5 15 3.384 11.1 58 7.7 21 2.8
460 15.7 190 6.5 98 3.317 13.9 6 4.9 5 4.1
155 9.8 83 5.2 35 2.266 18.1 28 7.7 14 3.843 17.2 26 10.4 7 2.8
112 18.1 40 6.4 22 3.5103 17.5 37 6.3 27 4.654 9.3 38 6.5 11 1.974 14.7 39 7.7 15 3.0
128 19.2 49 7.4 24 3.660 14.4 28 6.7 14 3.48 12.5 5 7.8 1 1.6
99 12.3 45 5.6 36 4.5
136 7.9 83 4.8 146 8.5
28 11.6 11 4.6 29 12.05 4.2 5 4.2 16 13.4
33 7.4 28 6.3 28 6.37 3.5 6 3.0 21 10.4
14 6.6 5 2.4 27 12.717 11.0 9 5.8 13 8.4
32 9.3 19 5.5 12 3.5
596 11.9 320 6.4 773 15.4
59 13.8 36 8.4 72 16.968 11.8 30 5.2 120 20.9
100 15.0 39 5.9 103 15.5231 9.7 149 6.3 344 14.5
5 9.1 6 10.9 15 27.215 13.5 6 5.4 14 12.610 16.5 3 4.9 8 13.23 5.6 3 5.6 9 16.7
29 23.8 6 4.9 8 6.614 15.6 6 6.7 22 24.512 7.0 15 8.8 22 12.828 14.8 15 8.0 20 10.622 16.5 6 4.5 16 12.0
Cond. Originating in the Perinatal Period
Congenital Anomalies
(Q00-Q99)(P00-P99)
Transport Accidents
(V00-V99)
179
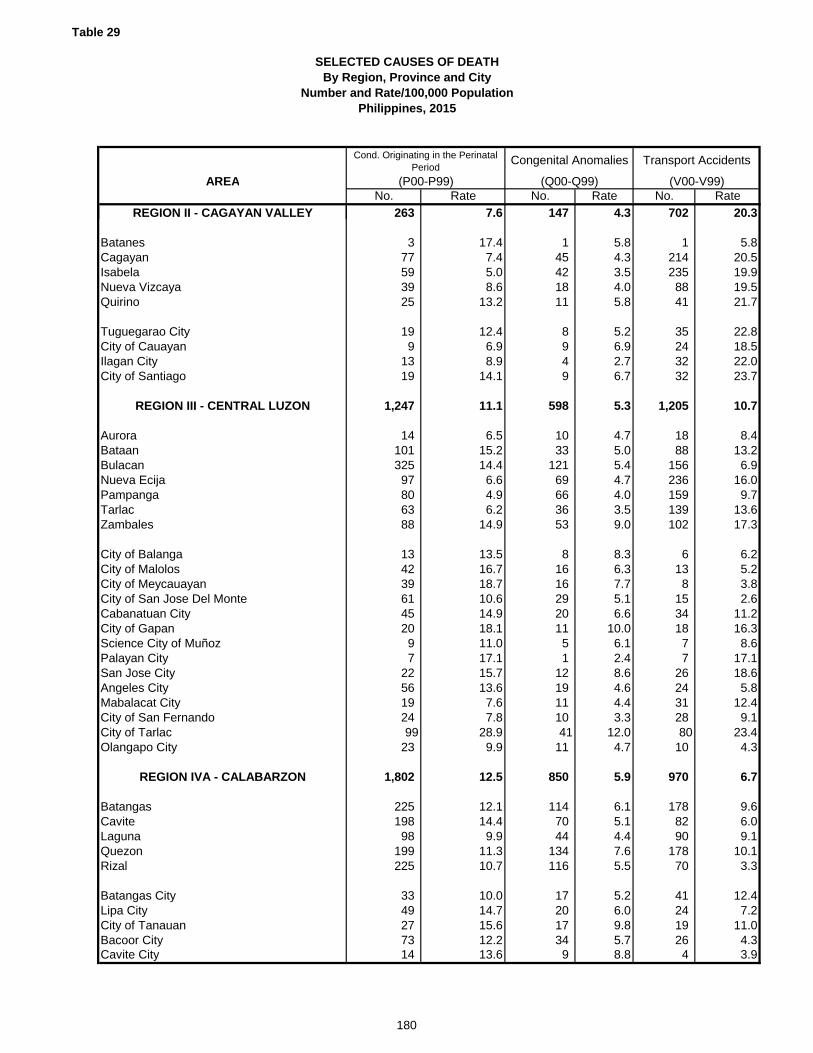
Table 29
SELECTED CAUSES OF DEATHBy Region, Province and City
Number and Rate/100,000 PopulationPhilippines, 2015
AREA
REGION II - CAGAYAN VALLEY
BatanesCagayanIsabelaNueva VizcayaQuirino
Tuguegarao CityCity of CauayanIlagan CityCity of Santiago
REGION III - CENTRAL LUZON
AuroraBataanBulacanNueva EcijaPampangaTarlacZambales
City of BalangaCity of MalolosCity of MeycauayanCity of San Jose Del MonteCabanatuan CityCity of GapanScience City of MuñozPalayan CitySan Jose CityAngeles CityMabalacat CityCity of San FernandoCity of TarlacOlangapo City
REGION IVA - CALABARZON
BatangasCaviteLagunaQuezon Rizal
Batangas CityLipa CityCity of TanauanBacoor CityCavite City
No. Rate No. Rate No. Rate
Cond. Originating in the Perinatal Period
Congenital Anomalies
(Q00-Q99)(P00-P99)
Transport Accidents
(V00-V99)
263 7.6 147 4.3 702 20.3
3 17.4 1 5.8 1 5.877 7.4 45 4.3 214 20.559 5.0 42 3.5 235 19.939 8.6 18 4.0 88 19.525 13.2 11 5.8 41 21.7
19 12.4 8 5.2 35 22.89 6.9 9 6.9 24 18.5
13 8.9 4 2.7 32 22.019 14.1 9 6.7 32 23.7
1,247 11.1 598 5.3 1,205 10.7
14 6.5 10 4.7 18 8.4101 15.2 33 5.0 88 13.2325 14.4 121 5.4 156 6.997 6.6 69 4.7 236 16.080 4.9 66 4.0 159 9.763 6.2 36 3.5 139 13.688 14.9 53 9.0 102 17.3
13 13.5 8 8.3 6 6.242 16.7 16 6.3 13 5.239 18.7 16 7.7 8 3.861 10.6 29 5.1 15 2.645 14.9 20 6.6 34 11.220 18.1 11 10.0 18 16.39 11.0 5 6.1 7 8.67 17.1 1 2.4 7 17.1
22 15.7 12 8.6 26 18.656 13.6 19 4.6 24 5.819 7.6 11 4.4 31 12.424 7.8 10 3.3 28 9.199 28.9 41 12.0 80 23.4
23 9.9 11 4.7 10 4.3
1,802 12.5 850 5.9 970 6.7
225 12.1 114 6.1 178 9.6198 14.4 70 5.1 82 6.098 9.9 44 4.4 90 9.1
199 11.3 134 7.6 178 10.1225 10.7 116 5.5 70 3.3
33 10.0 17 5.2 41 12.449 14.7 20 6.0 24 7.227 15.6 17 9.8 19 11.073 12.2 34 5.7 26 4.314 13.6 9 8.8 4 3.9
180
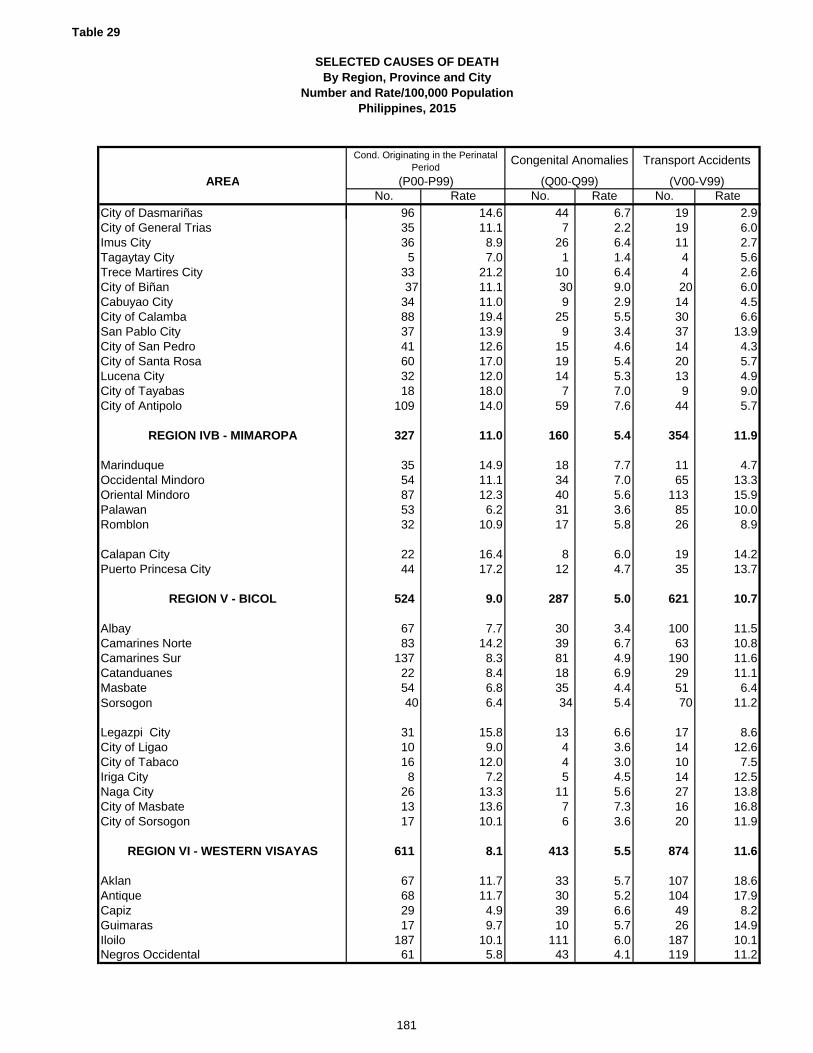
Table 29
SELECTED CAUSES OF DEATHBy Region, Province and City
Number and Rate/100,000 PopulationPhilippines, 2015
AREA
City of DasmariñasCity of General TriasImus CityTagaytay CityTrece Martires CityCity of BiñanCabuyao CityCity of CalambaSan Pablo CityCity of San PedroCity of Santa RosaLucena City City of TayabasCity of Antipolo
REGION IVB - MIMAROPA
MarinduqueOccidental MindoroOriental MindoroPalawanRomblon
Calapan CityPuerto Princesa City
REGION V - BICOL
AlbayCamarines NorteCamarines SurCatanduanesMasbateSorsogon
Legazpi CityCity of LigaoCity of TabacoIriga CityNaga CityCity of MasbateCity of Sorsogon
REGION VI - WESTERN VISAYAS
AklanAntiqueCapizGuimarasIloiloNegros Occidental
No. Rate No. Rate No. Rate
Cond. Originating in the Perinatal Period
Congenital Anomalies
(Q00-Q99)(P00-P99)
Transport Accidents
(V00-V99)
96 14.6 44 6.7 19 2.935 11.1 7 2.2 19 6.036 8.9 26 6.4 11 2.75 7.0 1 1.4 4 5.6
33 21.2 10 6.4 4 2.637 11.1 30 9.0 20 6.0
34 11.0 9 2.9 14 4.588 19.4 25 5.5 30 6.637 13.9 9 3.4 37 13.941 12.6 15 4.6 14 4.360 17.0 19 5.4 20 5.732 12.0 14 5.3 13 4.918 18.0 7 7.0 9 9.0
109 14.0 59 7.6 44 5.7
327 11.0 160 5.4 354 11.9
35 14.9 18 7.7 11 4.754 11.1 34 7.0 65 13.387 12.3 40 5.6 113 15.953 6.2 31 3.6 85 10.032 10.9 17 5.8 26 8.9
22 16.4 8 6.0 19 14.244 17.2 12 4.7 35 13.7
524 9.0 287 5.0 621 10.7
67 7.7 30 3.4 100 11.583 14.2 39 6.7 63 10.8
137 8.3 81 4.9 190 11.622 8.4 18 6.9 29 11.154 6.8 35 4.4 51 6.440 6.4 34 5.4 70 11.2
31 15.8 13 6.6 17 8.610 9.0 4 3.6 14 12.616 12.0 4 3.0 10 7.58 7.2 5 4.5 14 12.5
26 13.3 11 5.6 27 13.813 13.6 7 7.3 16 16.817 10.1 6 3.6 20 11.9
611 8.1 413 5.5 874 11.6
67 11.7 33 5.7 107 18.668 11.7 30 5.2 104 17.929 4.9 39 6.6 49 8.217 9.7 10 5.7 26 14.9
187 10.1 111 6.0 187 10.161 5.8 43 4.1 119 11.2
181
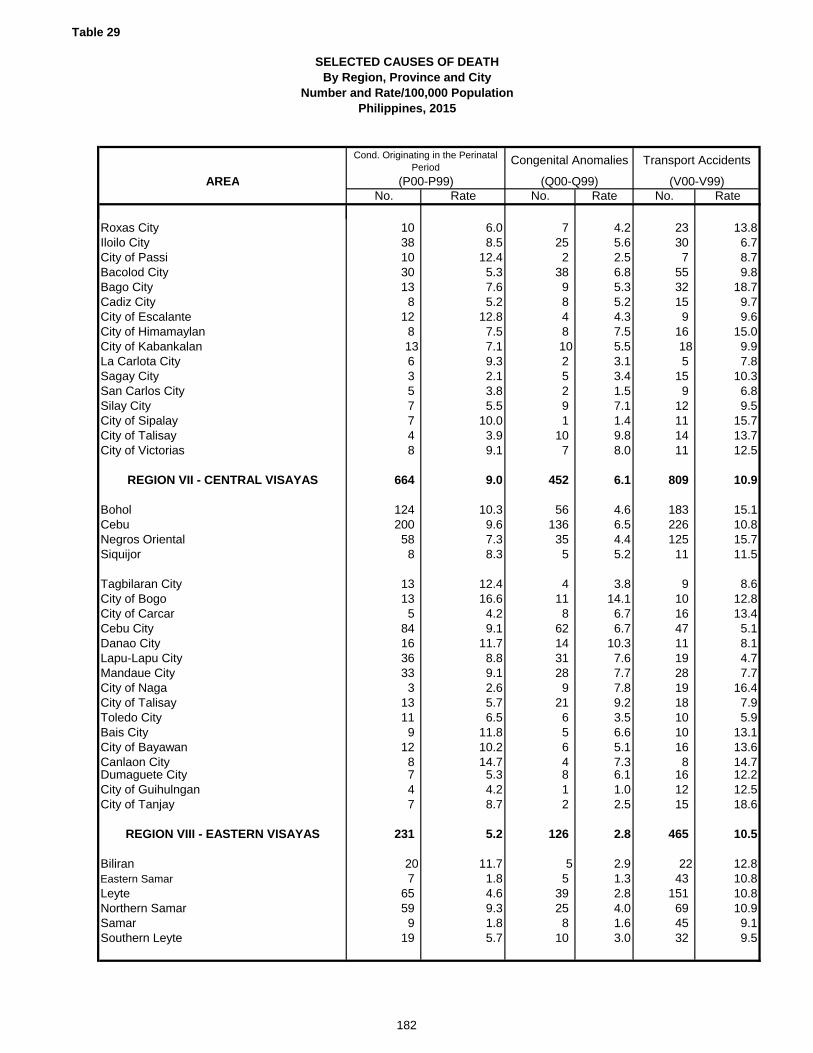
Table 29
SELECTED CAUSES OF DEATHBy Region, Province and City
Number and Rate/100,000 PopulationPhilippines, 2015
AREA
Roxas CityIloilo CityCity of PassiBacolod CityBago CityCadiz CityCity of EscalanteCity of HimamaylanCity of KabankalanLa Carlota CitySagay CitySan Carlos CitySilay CityCity of SipalayCity of TalisayCity of Victorias
REGION VII - CENTRAL VISAYAS
BoholCebuNegros OrientalSiquijor
Tagbilaran CityCity of BogoCity of CarcarCebu CityDanao CityLapu-Lapu CityMandaue CityCity of NagaCity of TalisayToledo CityBais CityCity of BayawanCanlaon CityDumaguete CityCity of GuihulnganCity of Tanjay
REGION VIII - EASTERN VISAYAS
BiliranEastern SamarLeyteNorthern SamarSamarSouthern Leyte
No. Rate No. Rate No. Rate
Cond. Originating in the Perinatal Period
Congenital Anomalies
(Q00-Q99)(P00-P99)
Transport Accidents
(V00-V99)
10 6.0 7 4.2 23 13.838 8.5 25 5.6 30 6.710 12.4 2 2.5 7 8.730 5.3 38 6.8 55 9.813 7.6 9 5.3 32 18.78 5.2 8 5.2 15 9.7
12 12.8 4 4.3 9 9.68 7.5 8 7.5 16 15.013 7.1 10 5.5 18 9.96 9.3 2 3.1 5 7.83 2.1 5 3.4 15 10.35 3.8 2 1.5 9 6.87 5.5 9 7.1 12 9.57 10.0 1 1.4 11 15.74 3.9 10 9.8 14 13.78 9.1 7 8.0 11 12.5
664 9.0 452 6.1 809 10.9
124 10.3 56 4.6 183 15.1200 9.6 136 6.5 226 10.858 7.3 35 4.4 125 15.78 8.3 5 5.2 11 11.5
13 12.4 4 3.8 9 8.613 16.6 11 14.1 10 12.85 4.2 8 6.7 16 13.4
84 9.1 62 6.7 47 5.116 11.7 14 10.3 11 8.136 8.8 31 7.6 19 4.733 9.1 28 7.7 28 7.73 2.6 9 7.8 19 16.4
13 5.7 21 9.2 18 7.911 6.5 6 3.5 10 5.99 11.8 5 6.6 10 13.1
12 10.2 6 5.1 16 13.68 14.7 4 7.3 8 14.77 5.3 8 6.1 16 12.24 4.2 1 1.0 12 12.57 8.7 2 2.5 15 18.6
231 5.2 126 2.8 465 10.5
20 11.7 5 2.9 22 12.87 1.8 5 1.3 43 10.8
65 4.6 39 2.8 151 10.859 9.3 25 4.0 69 10.99 1.8 8 1.6 45 9.1
19 5.7 10 3.0 32 9.5
182

Table 29
SELECTED CAUSES OF DEATHBy Region, Province and City
Number and Rate/100,000 PopulationPhilippines, 2015
AREA
City of BoronganCity of BaybayOrmoc CityTacloban CityCalbayog CityCity of CatbaloganCity of Maasin
REGION IX - ZAMBOANGA PENINSULA
Zamboanga Del NorteZamboanga Del SurZamboanga Sibugay
Dapitan CityDipolog CityCity of IsabelaPagadian CityZamboanga City
REGION X - NORTHERN MINDANAO
BukidnonCamiguinLanao del NorteMisamis OccidentalMisamis Oriental
City of MalaybalayCity of ValenciaIligan CityOroquieta CityOzamis CityTangub CityCagayan de Oro CityGingoog City
REGION XI - DAVAO
Compostela ValleyDavaoDavao Del SurDavao OrientalDavao Occidental
City of PanaboIsland Garden City of SamalCity of TagumDavao CityCity of DigosCity of Mati
No. Rate No. Rate No. Rate
Cond. Originating in the Perinatal Period
Congenital Anomalies
(Q00-Q99)(P00-P99)
Transport Accidents
(V00-V99)
2 2.9 2 2.9 9 13.05 4.6 5 4.6 8 7.3
15 7.0 12 5.6 22 10.210 4.1 8 3.3 23 9.511 6.0 3 1.6 21 11.42 1.9 2 1.9 13 12.57 8.2 2 2.3 7 8.2
216 6.0 119 3.3 357 9.8
34 4.3 32 4.0 65 8.137 4.6 18 2.2 99 12.228 4.4 11 1.7 58 9.2
3 3.6 3 3.6 3 3.67 5.4 5 3.8 14 10.71 0.9 - 0.0 3 2.7
18 9.0 5 2.5 29 14.688 10.2 45 5.2 86 10.0
370 7.9 214 4.6 678 14.5
57 5.4 32 3.1 178 17.06 6.8 5 5.7 10 11.3
37 5.5 12 1.8 51 7.519 5.8 11 3.4 38 11.648 6.3 48 6.3 127 16.6
33 18.9 16 9.2 49 28.121 10.9 13 6.7 58 30.165 19.0 14 4.1 24 7.02 2.8 5 7.1 14 19.88 5.6 7 4.9 12 8.55 7.9 3 4.8 12 19.0
48 7.1 36 5.3 76 11.221 16.8 12 9.6 29 23.3
373 7.6 274 5.6 752 15.4
72 9.8 42 5.7 113 15.440 8.5 21 4.5 95 20.336 7.8 17 3.7 80 17.321 5.0 20 4.8 69 16.58 2.5 5 1.6 30 9.5
14 7.6 14 7.6 38 20.68 7.7 10 9.6 13 12.5
39 15.0 26 10.0 68 26.2115 7.0 100 6.1 180 11.013 7.7 15 8.9 44 26.07 5.0 4 2.8 22 15.6
183
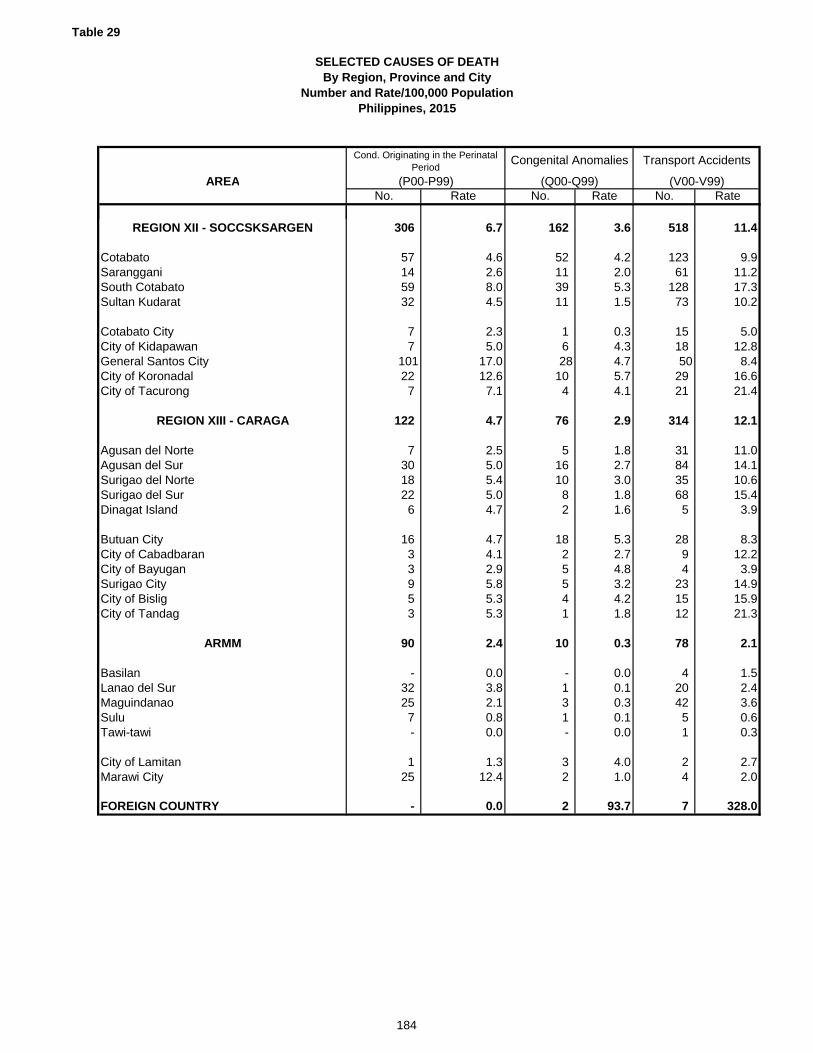
Table 29
SELECTED CAUSES OF DEATHBy Region, Province and City
Number and Rate/100,000 PopulationPhilippines, 2015
AREA
REGION XII - SOCCSKSARGEN
CotabatoSarangganiSouth CotabatoSultan Kudarat
Cotabato CityCity of KidapawanGeneral Santos CityCity of KoronadalCity of Tacurong
REGION XIII - CARAGA
Agusan del NorteAgusan del SurSurigao del NorteSurigao del SurDinagat Island
Butuan CityCity of Cabadbaran City of BayuganSurigao CityCity of BisligCity of Tandag
ARMM
BasilanLanao del SurMaguindanaoSulu Tawi-tawi
City of LamitanMarawi City
FOREIGN COUNTRY
No. Rate No. Rate No. Rate
Cond. Originating in the Perinatal Period
Congenital Anomalies
(Q00-Q99)(P00-P99)
Transport Accidents
(V00-V99)
306 6.7 162 3.6 518 11.4
57 4.6 52 4.2 123 9.914 2.6 11 2.0 61 11.259 8.0 39 5.3 128 17.332 4.5 11 1.5 73 10.2
7 2.3 1 0.3 15 5.07 5.0 6 4.3 18 12.8
101 17.0 28 4.7 50 8.422 12.6 10 5.7 29 16.67 7.1 4 4.1 21 21.4
122 4.7 76 2.9 314 12.1
7 2.5 5 1.8 31 11.030 5.0 16 2.7 84 14.118 5.4 10 3.0 35 10.622 5.0 8 1.8 68 15.46 4.7 2 1.6 5 3.9
16 4.7 18 5.3 28 8.33 4.1 2 2.7 9 12.23 2.9 5 4.8 4 3.99 5.8 5 3.2 23 14.95 5.3 4 4.2 15 15.93 5.3 1 1.8 12 21.3
90 2.4 10 0.3 78 2.1
- 0.0 - 0.0 4 1.532 3.8 1 0.1 20 2.425 2.1 3 0.3 42 3.67 0.8 1 0.1 5 0.6- 0.0 - 0.0 1 0.3
1 1.3 3 4.0 2 2.725 12.4 2 1.0 4 2.0
- 0.0 2 93.7 7 328.0
184

Table 29
SELECTED CAUSES OF DEATHBy Region, Province and City
Number and Rate/100,000 PopulationPhilippines, 2015
AREA
PHILIPPINES
NATIONAL CAPITAL REGION
City of Manila City of MandaluyongCity of MarikinaCity of PasigQuezon CitySan JuanKalookan CityCity of MalabonNavotasCity of ValenzuelaCity of Las PiñasCity of MakatiCity of MuntinlupaCity of ParañaquePasay CityPaterosCity of Taguig
CORDILLERA ADMINISTRATIVE REGION
AbraApayaoBenguetIfugaoKalingaMt. Province
Baguio City
REGION I - ILOCOS
Ilocos NorteIlocos SurLa UnionPangasinan
City of BatacLaoag CityCity of CandonCity of ViganCity of San FernandoCity of AlaminosDagupan CitySan Carlos CityCity of Urdaneta
No. Rate No. Rate No. Rate
2,391 2.4 3,186 3.2 11,096 11.0
185 1.4 151 1.2 1,137 8.8
19 1.1 20 1.1 199 11.27 1.8 3 0.8 26 6.77 1.6 7 1.6 33 7.3
10 1.3 15 2.0 37 4.940 1.4 33 1.1 209 7.12 1.6 4 3.3 5 4.1
21 1.3 18 1.1 154 9.72 0.5 9 2.5 67 18.33 1.2 15 6.0 54 21.65 0.8 8 1.3 29 4.78 1.4 2 0.3 42 7.1
17 2.9 1 0.2 32 5.57 1.4 5 1.0 49 9.7
12 1.8 5 0.8 55 8.37 1.7 1 0.2 35 8.41 1.6 1 1.6 5 7.8
17 2.1 4 0.5 106 13.2
93 5.4 76 4.4 123 7.1
7 2.9 12 5.0 40 16.610 8.4 11 9.2 8 6.721 4.7 16 3.6 18 4.010 4.9 11 5.4 9 4.49 4.2 6 2.8 21 9.9
15 9.7 12 7.8 6 3.9
21 6.1 8 2.3 21 6.1
105 2.1 230 4.6 408 8.1
10 2.3 18 4.2 39 9.116 2.8 24 4.2 68 11.815 2.3 33 5.0 37 5.650 2.1 115 4.8 192 8.1
2 3.6 - 0.0 9 16.32 1.8 2 1.8 10 9.02 3.3 3 4.9 1 1.6
- 0.0 2 3.7 4 7.42 1.6 3 2.5 9 7.42 2.2 9 10.0 8 8.92 1.2 7 4.1 14 8.22 1.1 7 3.7 12 6.4
- 0.0 7 5.3 5 3.8
Falls
(W65-W74)
Assault
(X85-Y09)
Accidental Drowning & Submersion
(W65-W74)
185
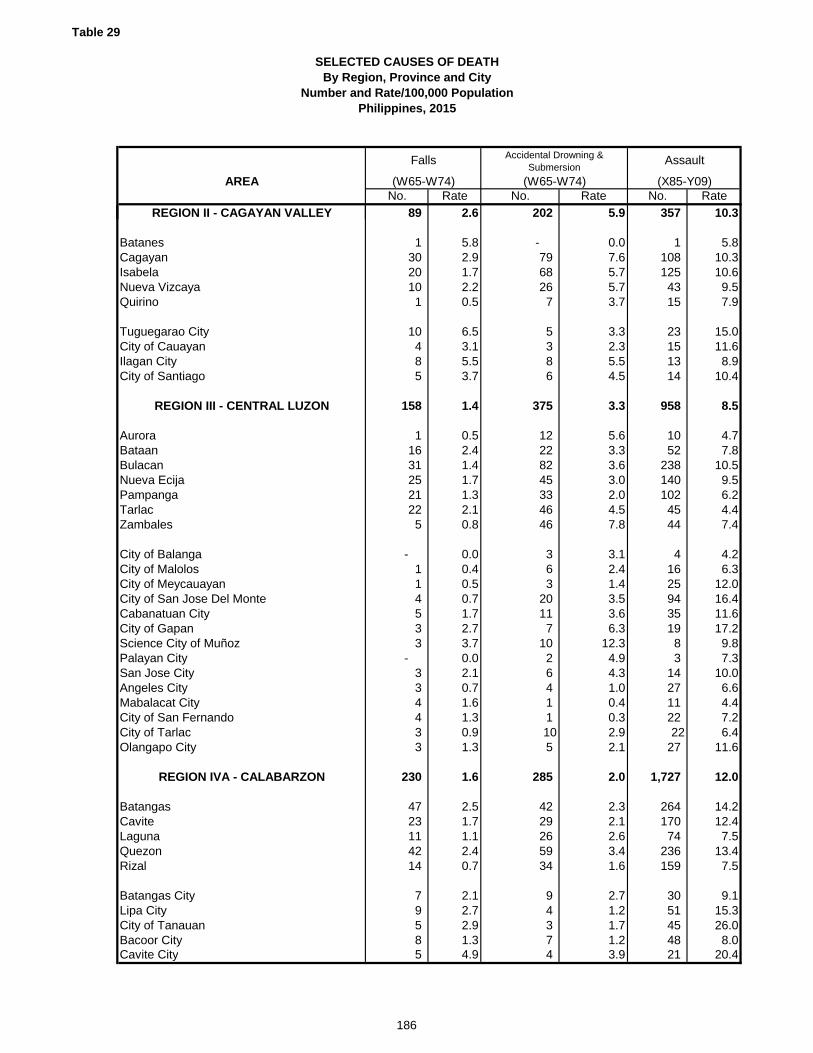
Table 29
SELECTED CAUSES OF DEATHBy Region, Province and City
Number and Rate/100,000 PopulationPhilippines, 2015
AREA
REGION II - CAGAYAN VALLEY
BatanesCagayanIsabelaNueva VizcayaQuirino
Tuguegarao CityCity of CauayanIlagan CityCity of Santiago
REGION III - CENTRAL LUZON
AuroraBataanBulacanNueva EcijaPampangaTarlacZambales
City of BalangaCity of MalolosCity of MeycauayanCity of San Jose Del MonteCabanatuan CityCity of GapanScience City of MuñozPalayan CitySan Jose CityAngeles CityMabalacat CityCity of San FernandoCity of TarlacOlangapo City
REGION IVA - CALABARZON
BatangasCaviteLagunaQuezon Rizal
Batangas CityLipa CityCity of TanauanBacoor CityCavite City
No. Rate No. Rate No. Rate
Falls
(W65-W74)
Assault
(X85-Y09)
Accidental Drowning & Submersion
(W65-W74)
89 2.6 202 5.9 357 10.3
1 5.8 - 0.0 1 5.830 2.9 79 7.6 108 10.320 1.7 68 5.7 125 10.610 2.2 26 5.7 43 9.51 0.5 7 3.7 15 7.9
10 6.5 5 3.3 23 15.04 3.1 3 2.3 15 11.68 5.5 8 5.5 13 8.95 3.7 6 4.5 14 10.4
158 1.4 375 3.3 958 8.5
1 0.5 12 5.6 10 4.716 2.4 22 3.3 52 7.831 1.4 82 3.6 238 10.525 1.7 45 3.0 140 9.521 1.3 33 2.0 102 6.222 2.1 46 4.5 45 4.45 0.8 46 7.8 44 7.4
- 0.0 3 3.1 4 4.21 0.4 6 2.4 16 6.31 0.5 3 1.4 25 12.04 0.7 20 3.5 94 16.45 1.7 11 3.6 35 11.63 2.7 7 6.3 19 17.23 3.7 10 12.3 8 9.8
- 0.0 2 4.9 3 7.33 2.1 6 4.3 14 10.03 0.7 4 1.0 27 6.64 1.6 1 0.4 11 4.44 1.3 1 0.3 22 7.23 0.9 10 2.9 22 6.43 1.3 5 2.1 27 11.6
230 1.6 285 2.0 1,727 12.0
47 2.5 42 2.3 264 14.223 1.7 29 2.1 170 12.411 1.1 26 2.6 74 7.542 2.4 59 3.4 236 13.414 0.7 34 1.6 159 7.5
7 2.1 9 2.7 30 9.19 2.7 4 1.2 51 15.35 2.9 3 1.7 45 26.08 1.3 7 1.2 48 8.05 4.9 4 3.9 21 20.4
186
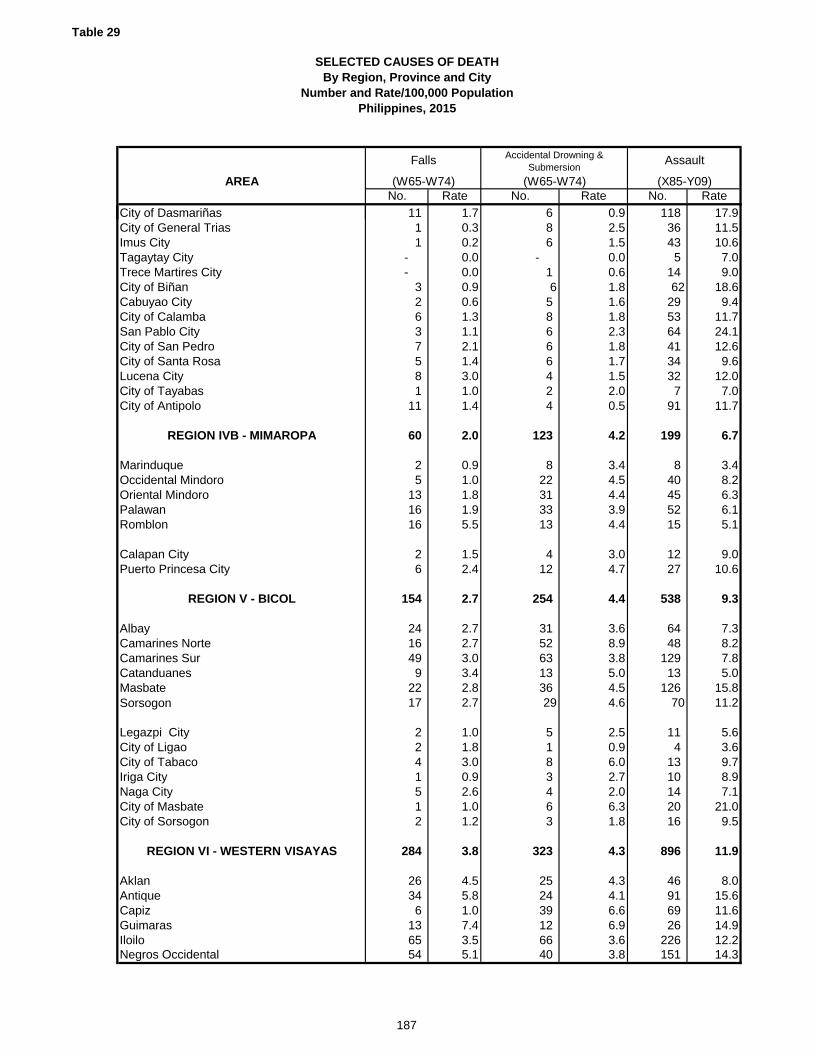
Table 29
SELECTED CAUSES OF DEATHBy Region, Province and City
Number and Rate/100,000 PopulationPhilippines, 2015
AREA
City of DasmariñasCity of General TriasImus CityTagaytay CityTrece Martires CityCity of BiñanCabuyao CityCity of CalambaSan Pablo CityCity of San PedroCity of Santa RosaLucena City City of TayabasCity of Antipolo
REGION IVB - MIMAROPA
MarinduqueOccidental MindoroOriental MindoroPalawanRomblon
Calapan CityPuerto Princesa City
REGION V - BICOL
AlbayCamarines NorteCamarines SurCatanduanesMasbateSorsogon
Legazpi CityCity of LigaoCity of TabacoIriga CityNaga CityCity of MasbateCity of Sorsogon
REGION VI - WESTERN VISAYAS
AklanAntiqueCapizGuimarasIloiloNegros Occidental
No. Rate No. Rate No. Rate
Falls
(W65-W74)
Assault
(X85-Y09)
Accidental Drowning & Submersion
(W65-W74)
11 1.7 6 0.9 118 17.91 0.3 8 2.5 36 11.51 0.2 6 1.5 43 10.6
- 0.0 - 0.0 5 7.0- 0.0 1 0.6 14 9.0
3 0.9 6 1.8 62 18.62 0.6 5 1.6 29 9.46 1.3 8 1.8 53 11.73 1.1 6 2.3 64 24.17 2.1 6 1.8 41 12.65 1.4 6 1.7 34 9.68 3.0 4 1.5 32 12.01 1.0 2 2.0 7 7.0
11 1.4 4 0.5 91 11.7
60 2.0 123 4.2 199 6.7
2 0.9 8 3.4 8 3.45 1.0 22 4.5 40 8.2
13 1.8 31 4.4 45 6.316 1.9 33 3.9 52 6.116 5.5 13 4.4 15 5.1
2 1.5 4 3.0 12 9.06 2.4 12 4.7 27 10.6
154 2.7 254 4.4 538 9.3
24 2.7 31 3.6 64 7.316 2.7 52 8.9 48 8.249 3.0 63 3.8 129 7.89 3.4 13 5.0 13 5.0
22 2.8 36 4.5 126 15.817 2.7 29 4.6 70 11.2
2 1.0 5 2.5 11 5.62 1.8 1 0.9 4 3.64 3.0 8 6.0 13 9.71 0.9 3 2.7 10 8.95 2.6 4 2.0 14 7.11 1.0 6 6.3 20 21.02 1.2 3 1.8 16 9.5
284 3.8 323 4.3 896 11.9
26 4.5 25 4.3 46 8.034 5.8 24 4.1 91 15.66 1.0 39 6.6 69 11.6
13 7.4 12 6.9 26 14.965 3.5 66 3.6 226 12.254 5.1 40 3.8 151 14.3
187
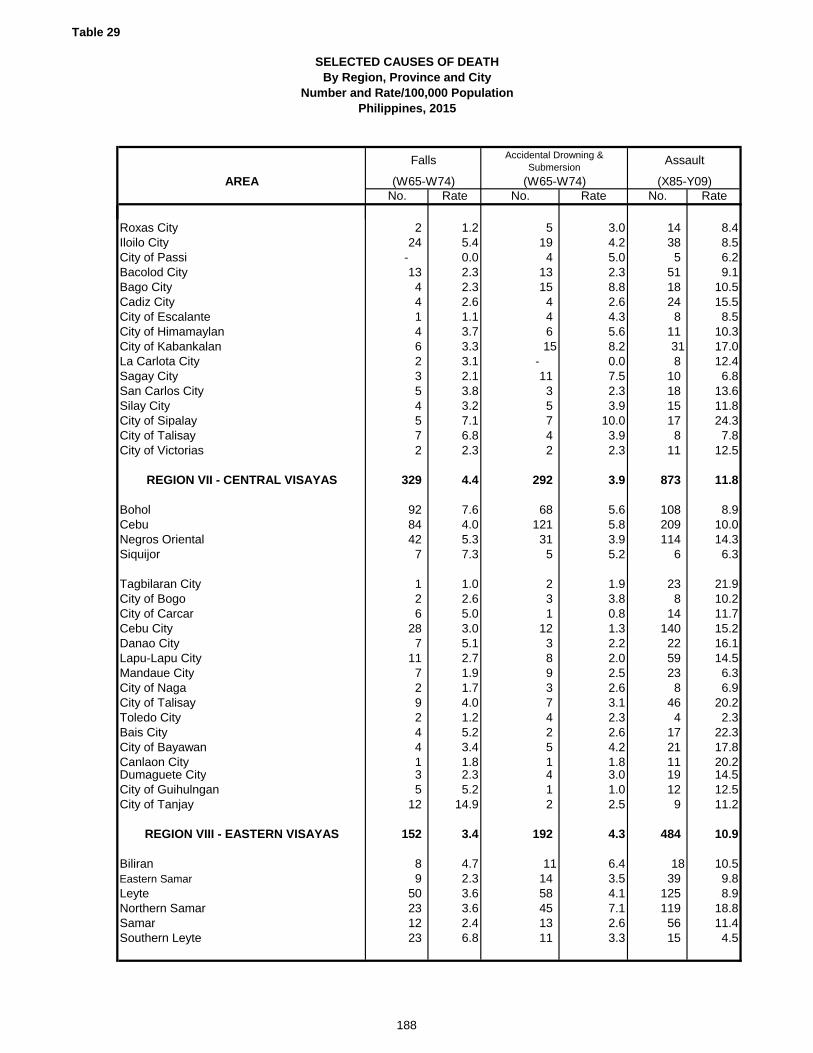
Table 29
SELECTED CAUSES OF DEATHBy Region, Province and City
Number and Rate/100,000 PopulationPhilippines, 2015
AREA
Roxas CityIloilo CityCity of PassiBacolod CityBago CityCadiz CityCity of EscalanteCity of HimamaylanCity of KabankalanLa Carlota CitySagay CitySan Carlos CitySilay CityCity of SipalayCity of TalisayCity of Victorias
REGION VII - CENTRAL VISAYAS
BoholCebuNegros OrientalSiquijor
Tagbilaran CityCity of BogoCity of CarcarCebu CityDanao CityLapu-Lapu CityMandaue CityCity of NagaCity of TalisayToledo CityBais CityCity of BayawanCanlaon CityDumaguete CityCity of GuihulnganCity of Tanjay
REGION VIII - EASTERN VISAYAS
BiliranEastern SamarLeyteNorthern SamarSamarSouthern Leyte
No. Rate No. Rate No. Rate
Falls
(W65-W74)
Assault
(X85-Y09)
Accidental Drowning & Submersion
(W65-W74)
2 1.2 5 3.0 14 8.424 5.4 19 4.2 38 8.5
- 0.0 4 5.0 5 6.213 2.3 13 2.3 51 9.14 2.3 15 8.8 18 10.54 2.6 4 2.6 24 15.51 1.1 4 4.3 8 8.54 3.7 6 5.6 11 10.36 3.3 15 8.2 31 17.02 3.1 - 0.0 8 12.43 2.1 11 7.5 10 6.85 3.8 3 2.3 18 13.64 3.2 5 3.9 15 11.85 7.1 7 10.0 17 24.37 6.8 4 3.9 8 7.82 2.3 2 2.3 11 12.5
329 4.4 292 3.9 873 11.8
92 7.6 68 5.6 108 8.984 4.0 121 5.8 209 10.042 5.3 31 3.9 114 14.37 7.3 5 5.2 6 6.3
1 1.0 2 1.9 23 21.92 2.6 3 3.8 8 10.26 5.0 1 0.8 14 11.7
28 3.0 12 1.3 140 15.27 5.1 3 2.2 22 16.1
11 2.7 8 2.0 59 14.57 1.9 9 2.5 23 6.32 1.7 3 2.6 8 6.99 4.0 7 3.1 46 20.22 1.2 4 2.3 4 2.34 5.2 2 2.6 17 22.34 3.4 5 4.2 21 17.81 1.8 1 1.8 11 20.23 2.3 4 3.0 19 14.55 5.2 1 1.0 12 12.5
12 14.9 2 2.5 9 11.2
152 3.4 192 4.3 484 10.9
8 4.7 11 6.4 18 10.59 2.3 14 3.5 39 9.8
50 3.6 58 4.1 125 8.923 3.6 45 7.1 119 18.812 2.4 13 2.6 56 11.423 6.8 11 3.3 15 4.5
188
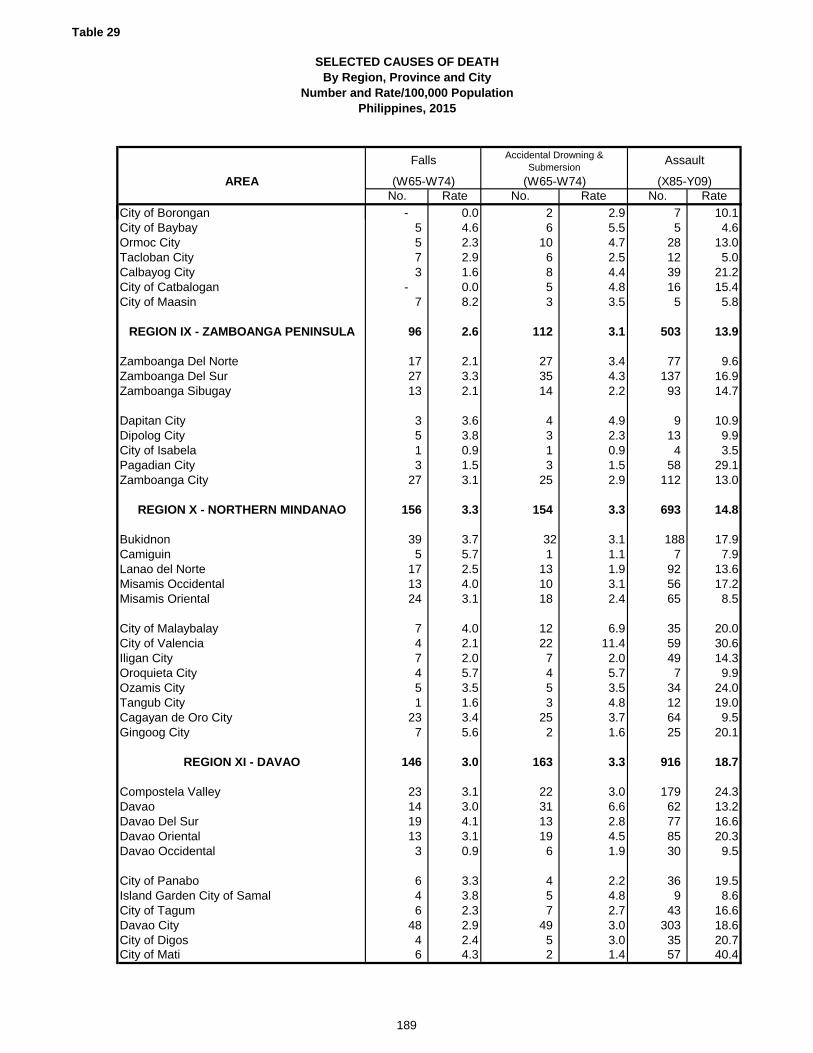
Table 29
SELECTED CAUSES OF DEATHBy Region, Province and City
Number and Rate/100,000 PopulationPhilippines, 2015
AREA
City of BoronganCity of BaybayOrmoc CityTacloban CityCalbayog CityCity of CatbaloganCity of Maasin
REGION IX - ZAMBOANGA PENINSULA
Zamboanga Del NorteZamboanga Del SurZamboanga Sibugay
Dapitan CityDipolog CityCity of IsabelaPagadian CityZamboanga City
REGION X - NORTHERN MINDANAO
BukidnonCamiguinLanao del NorteMisamis OccidentalMisamis Oriental
City of MalaybalayCity of ValenciaIligan CityOroquieta CityOzamis CityTangub CityCagayan de Oro CityGingoog City
REGION XI - DAVAO
Compostela ValleyDavaoDavao Del SurDavao OrientalDavao Occidental
City of PanaboIsland Garden City of SamalCity of TagumDavao CityCity of DigosCity of Mati
No. Rate No. Rate No. Rate
Falls
(W65-W74)
Assault
(X85-Y09)
Accidental Drowning & Submersion
(W65-W74)
- 0.0 2 2.9 7 10.15 4.6 6 5.5 5 4.65 2.3 10 4.7 28 13.07 2.9 6 2.5 12 5.03 1.6 8 4.4 39 21.2
- 0.0 5 4.8 16 15.47 8.2 3 3.5 5 5.8
96 2.6 112 3.1 503 13.9
17 2.1 27 3.4 77 9.627 3.3 35 4.3 137 16.913 2.1 14 2.2 93 14.7
3 3.6 4 4.9 9 10.95 3.8 3 2.3 13 9.91 0.9 1 0.9 4 3.53 1.5 3 1.5 58 29.1
27 3.1 25 2.9 112 13.0
156 3.3 154 3.3 693 14.8
39 3.7 32 3.1 188 17.95 5.7 1 1.1 7 7.9
17 2.5 13 1.9 92 13.613 4.0 10 3.1 56 17.224 3.1 18 2.4 65 8.5
7 4.0 12 6.9 35 20.04 2.1 22 11.4 59 30.67 2.0 7 2.0 49 14.34 5.7 4 5.7 7 9.95 3.5 5 3.5 34 24.01 1.6 3 4.8 12 19.0
23 3.4 25 3.7 64 9.57 5.6 2 1.6 25 20.1
146 3.0 163 3.3 916 18.7
23 3.1 22 3.0 179 24.314 3.0 31 6.6 62 13.219 4.1 13 2.8 77 16.613 3.1 19 4.5 85 20.33 0.9 6 1.9 30 9.5
6 3.3 4 2.2 36 19.54 3.8 5 4.8 9 8.66 2.3 7 2.7 43 16.6
48 2.9 49 3.0 303 18.64 2.4 5 3.0 35 20.76 4.3 2 1.4 57 40.4
189
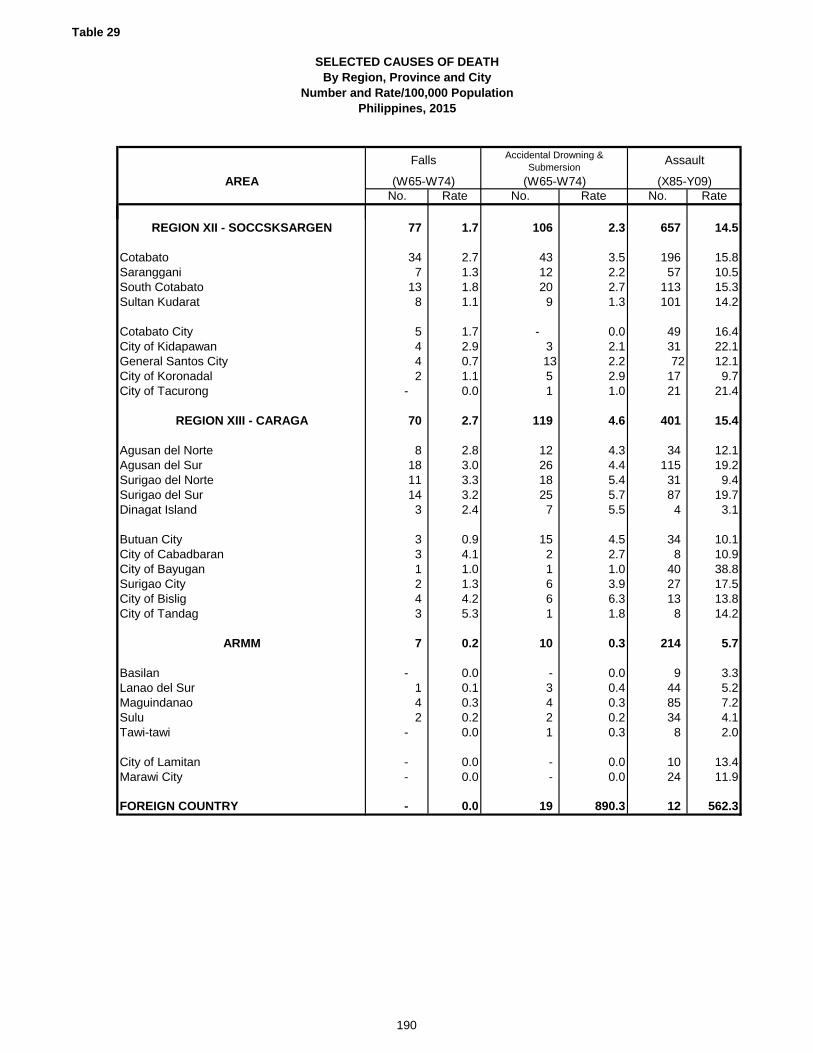
Table 29
SELECTED CAUSES OF DEATHBy Region, Province and City
Number and Rate/100,000 PopulationPhilippines, 2015
AREA
REGION XII - SOCCSKSARGEN
CotabatoSarangganiSouth CotabatoSultan Kudarat
Cotabato CityCity of KidapawanGeneral Santos CityCity of KoronadalCity of Tacurong
REGION XIII - CARAGA
Agusan del NorteAgusan del SurSurigao del NorteSurigao del SurDinagat Island
Butuan CityCity of Cabadbaran City of BayuganSurigao CityCity of BisligCity of Tandag
ARMM
BasilanLanao del SurMaguindanaoSulu Tawi-tawi
City of LamitanMarawi City
FOREIGN COUNTRY
No. Rate No. Rate No. Rate
Falls
(W65-W74)
Assault
(X85-Y09)
Accidental Drowning & Submersion
(W65-W74)
77 1.7 106 2.3 657 14.5
34 2.7 43 3.5 196 15.87 1.3 12 2.2 57 10.5
13 1.8 20 2.7 113 15.38 1.1 9 1.3 101 14.2
5 1.7 - 0.0 49 16.44 2.9 3 2.1 31 22.14 0.7 13 2.2 72 12.12 1.1 5 2.9 17 9.7
- 0.0 1 1.0 21 21.4
70 2.7 119 4.6 401 15.4
8 2.8 12 4.3 34 12.118 3.0 26 4.4 115 19.211 3.3 18 5.4 31 9.414 3.2 25 5.7 87 19.73 2.4 7 5.5 4 3.1
3 0.9 15 4.5 34 10.13 4.1 2 2.7 8 10.91 1.0 1 1.0 40 38.82 1.3 6 3.9 27 17.54 4.2 6 6.3 13 13.83 5.3 1 1.8 8 14.2
7 0.2 10 0.3 214 5.7
- 0.0 - 0.0 9 3.31 0.1 3 0.4 44 5.24 0.3 4 0.3 85 7.22 0.2 2 0.2 34 4.1
- 0.0 1 0.3 8 2.0
- 0.0 - 0.0 10 13.4- 0.0 - 0.0 24 11.9
- 0.0 19 890.3 12 562.3
190

Table 29
SELECTED CAUSES OF DEATHBy Region, Province and City
Number and Rate/100,000 PopulationPhilippines, 2015
AREA
PHILIPPINES
NATIONAL CAPITAL REGION
City of Manila City of MandaluyongCity of MarikinaCity of PasigQuezon CitySan JuanKalookan CityCity of MalabonNavotasCity of ValenzuelaCity of Las PiñasCity of MakatiCity of MuntinlupaCity of ParañaquePasay CityPaterosCity of Taguig
CORDILLERA ADMINISTRATIVE REGION
AbraApayaoBenguetIfugaoKalingaMt. Province
Baguio City
REGION I - ILOCOS
Ilocos NorteIlocos SurLa UnionPangasinan
City of BatacLaoag CityCity of CandonCity of ViganCity of San FernandoCity of AlaminosDagupan CitySan Carlos CityCity of Urdaneta
No. Rate
80,905 80.1
8,891 69.0
1,235 69.4290 75.1442 98.1610 80.8
1,906 64.994 76.9
922 58.2183 50.1187 75.0419 67.5620 105.3343 58.9364 72.1441 66.2286 68.745 70.5
504 62.6
1,209 70.2
196 81.375 62.9
303 67.9118 58.2128 60.2154 99.6
235 68.0
5,263 104.7
516 120.9729 126.7574 86.3
2,241 94.4
30 54.362 55.871 117.1
123 228.389 73.180 89.2
261 152.4243 128.9244 183.5
Other causes of death
(All remaining codes)
191
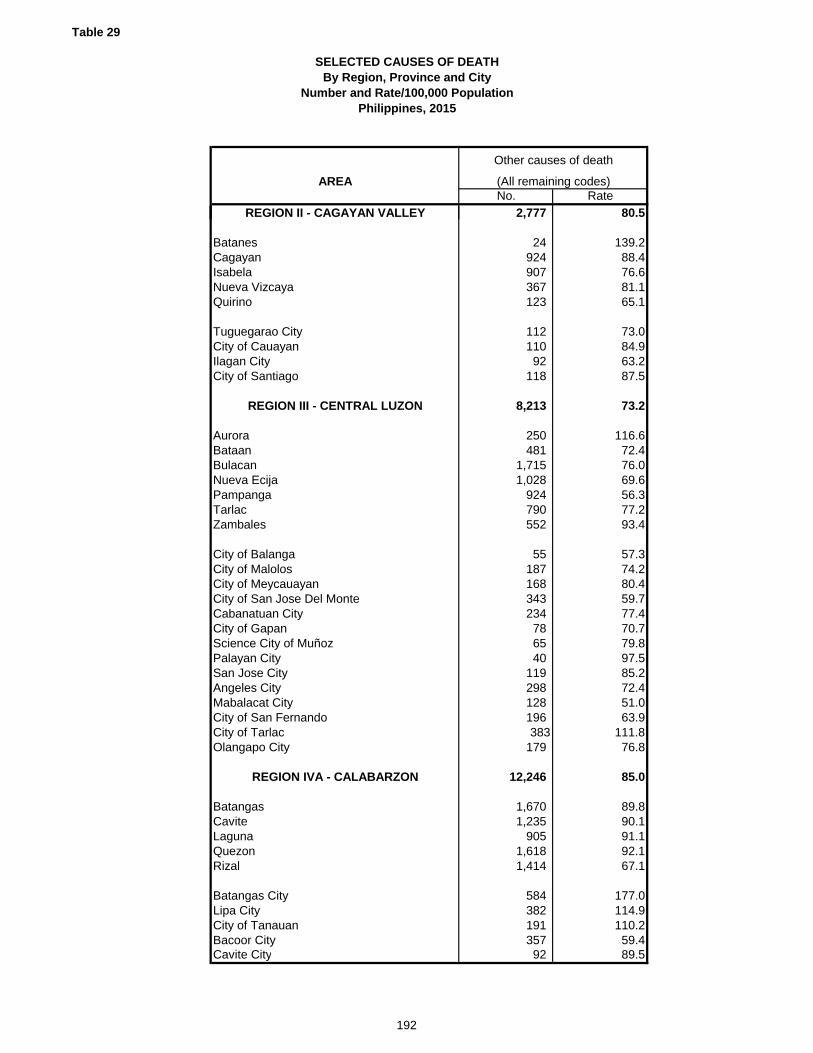
Table 29
SELECTED CAUSES OF DEATHBy Region, Province and City
Number and Rate/100,000 PopulationPhilippines, 2015
AREA
REGION II - CAGAYAN VALLEY
BatanesCagayanIsabelaNueva VizcayaQuirino
Tuguegarao CityCity of CauayanIlagan CityCity of Santiago
REGION III - CENTRAL LUZON
AuroraBataanBulacanNueva EcijaPampangaTarlacZambales
City of BalangaCity of MalolosCity of MeycauayanCity of San Jose Del MonteCabanatuan CityCity of GapanScience City of MuñozPalayan CitySan Jose CityAngeles CityMabalacat CityCity of San FernandoCity of TarlacOlangapo City
REGION IVA - CALABARZON
BatangasCaviteLagunaQuezon Rizal
Batangas CityLipa CityCity of TanauanBacoor CityCavite City
No. Rate
Other causes of death
(All remaining codes)
2,777 80.5
24 139.2924 88.4907 76.6367 81.1123 65.1
112 73.0110 84.992 63.2
118 87.5
8,213 73.2
250 116.6481 72.4
1,715 76.01,028 69.6
924 56.3790 77.2552 93.4
55 57.3187 74.2168 80.4343 59.7234 77.478 70.765 79.840 97.5
119 85.2298 72.4128 51.0196 63.9383 111.8
179 76.8
12,246 85.0
1,670 89.81,235 90.1
905 91.11,618 92.11,414 67.1
584 177.0382 114.9191 110.2357 59.492 89.5
192

Table 29
SELECTED CAUSES OF DEATHBy Region, Province and City
Number and Rate/100,000 PopulationPhilippines, 2015
AREA
City of DasmariñasCity of General TriasImus CityTagaytay CityTrece Martires CityCity of BiñanCabuyao CityCity of CalambaSan Pablo CityCity of San PedroCity of Santa RosaLucena City City of TayabasCity of Antipolo
REGION IVB - MIMAROPA
MarinduqueOccidental MindoroOriental MindoroPalawanRomblon
Calapan CityPuerto Princesa City
REGION V - BICOL
AlbayCamarines NorteCamarines SurCatanduanesMasbateSorsogon
Legazpi CityCity of LigaoCity of TabacoIriga CityNaga CityCity of MasbateCity of Sorsogon
REGION VI - WESTERN VISAYAS
AklanAntiqueCapizGuimarasIloiloNegros Occidental
No. Rate
Other causes of death
(All remaining codes)
501 76.0171 54.4225 55.725 35.1
160 102.8276 82.9
141 45.7639 140.6197 74.0217 66.6220 62.2311 116.853 53.1
662 85.3
2,605 87.9
290 123.7522 107.1698 98.3538 63.3288 98.4
123 91.9146 57.2
5,098 87.9
742 85.0507 86.9
1,436 87.3283 108.4531 66.6605 96.8
218 110.981 72.793 69.5
117 104.7163 83.2113 118.5209 124.3
6,508 86.4
578 100.6491 84.4404 68.0137 78.5
1,490 80.3979 92.5
193

Table 29
SELECTED CAUSES OF DEATHBy Region, Province and City
Number and Rate/100,000 PopulationPhilippines, 2015
AREA
Roxas CityIloilo CityCity of PassiBacolod CityBago CityCadiz CityCity of EscalanteCity of HimamaylanCity of KabankalanLa Carlota CitySagay CitySan Carlos CitySilay CityCity of SipalayCity of TalisayCity of Victorias
REGION VII - CENTRAL VISAYAS
BoholCebuNegros OrientalSiquijor
Tagbilaran CityCity of BogoCity of CarcarCebu CityDanao CityLapu-Lapu CityMandaue CityCity of NagaCity of TalisayToledo CityBais CityCity of BayawanCanlaon CityDumaguete CityCity of GuihulnganCity of Tanjay
REGION VIII - EASTERN VISAYAS
BiliranEastern SamarLeyteNorthern SamarSamarSouthern Leyte
No. Rate
Other causes of death
(All remaining codes)
106 63.5470 104.971 88.2
583 103.8149 87.1138 89.2136 144.672 67.4137 75.358 90.087 59.559 44.5
113 89.063 89.986 84.1
101 114.9
6,621 89.5
1,359 112.51,771 84.7
739 92.6131 136.5
97 92.388 112.662 51.8
856 92.885 62.3
236 57.8223 61.593 80.3
138 60.6127 74.679 103.6
214 181.532 58.7
165 125.650 52.176 94.4
3,807 85.7
159 92.7253 63.6
1,292 92.3712 112.6298 60.5371 110.4
194
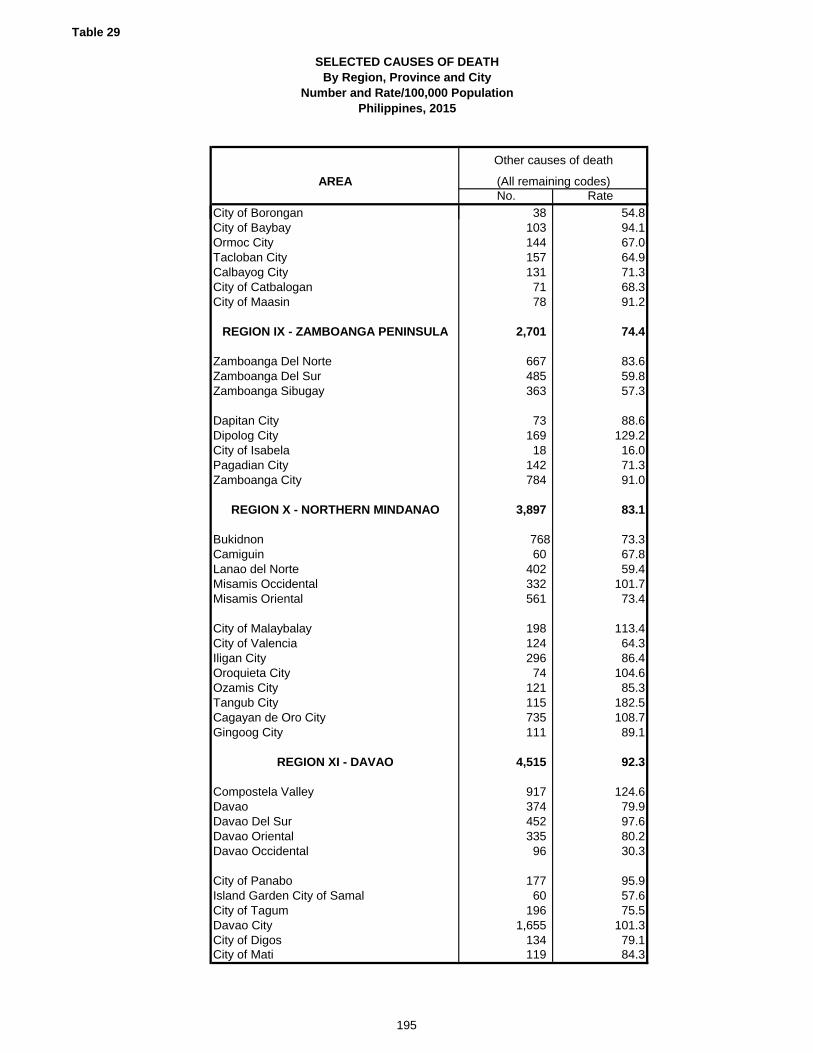
Table 29
SELECTED CAUSES OF DEATHBy Region, Province and City
Number and Rate/100,000 PopulationPhilippines, 2015
AREA
City of BoronganCity of BaybayOrmoc CityTacloban CityCalbayog CityCity of CatbaloganCity of Maasin
REGION IX - ZAMBOANGA PENINSULA
Zamboanga Del NorteZamboanga Del SurZamboanga Sibugay
Dapitan CityDipolog CityCity of IsabelaPagadian CityZamboanga City
REGION X - NORTHERN MINDANAO
BukidnonCamiguinLanao del NorteMisamis OccidentalMisamis Oriental
City of MalaybalayCity of ValenciaIligan CityOroquieta CityOzamis CityTangub CityCagayan de Oro CityGingoog City
REGION XI - DAVAO
Compostela ValleyDavaoDavao Del SurDavao OrientalDavao Occidental
City of PanaboIsland Garden City of SamalCity of TagumDavao CityCity of DigosCity of Mati
No. Rate
Other causes of death
(All remaining codes)
38 54.8103 94.1144 67.0157 64.9131 71.371 68.378 91.2
2,701 74.4
667 83.6485 59.8363 57.3
73 88.6169 129.218 16.0
142 71.3784 91.0
3,897 83.1
768 73.360 67.8
402 59.4332 101.7561 73.4
198 113.4124 64.3296 86.474 104.6
121 85.3115 182.5735 108.7111 89.1
4,515 92.3
917 124.6374 79.9452 97.6335 80.296 30.3
177 95.960 57.6
196 75.51,655 101.3
134 79.1119 84.3
195
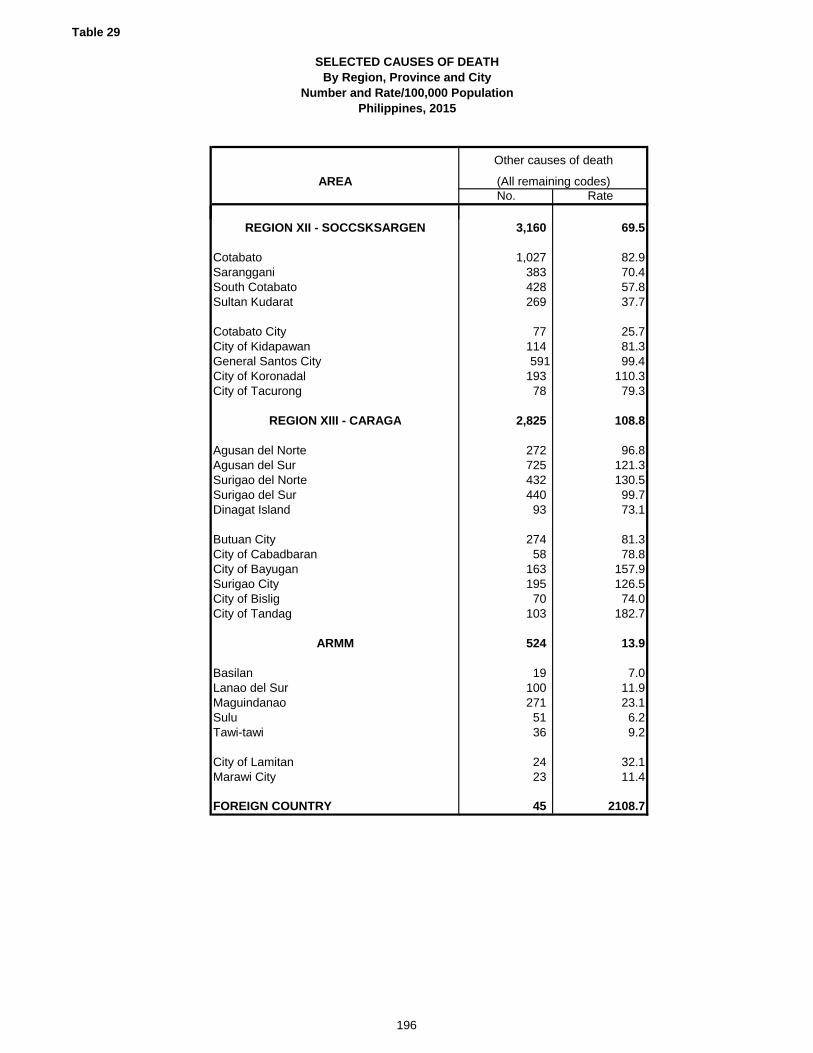
Table 29
SELECTED CAUSES OF DEATHBy Region, Province and City
Number and Rate/100,000 PopulationPhilippines, 2015
AREA
REGION XII - SOCCSKSARGEN
CotabatoSarangganiSouth CotabatoSultan Kudarat
Cotabato CityCity of KidapawanGeneral Santos CityCity of KoronadalCity of Tacurong
REGION XIII - CARAGA
Agusan del NorteAgusan del SurSurigao del NorteSurigao del SurDinagat Island
Butuan CityCity of Cabadbaran City of BayuganSurigao CityCity of BisligCity of Tandag
ARMM
BasilanLanao del SurMaguindanaoSulu Tawi-tawi
City of LamitanMarawi City
FOREIGN COUNTRY
No. Rate
Other causes of death
(All remaining codes)
3,160 69.5
1,027 82.9383 70.4428 57.8269 37.7
77 25.7114 81.3591 99.4
193 110.378 79.3
2,825 108.8
272 96.8725 121.3432 130.5440 99.793 73.1
274 81.358 78.8
163 157.9195 126.570 74.0
103 182.7
524 13.9
19 7.0100 11.9271 23.151 6.236 9.2
24 32.123 11.4
45 2108.7
196

Table 30
Male FemaleNumber Number Number Rate Percent
Total Deaths from All Causes 321,623 238,982 560,605 555.2 100.0
Certain infectious and parasitic diseases (A00-B94, B98-B99) 27,598 14,877 42,475 42.1 7.6 Neoplasms (C00-C97, D00-D48) 31,256 31,747 63,003 62.4 11.2 Disases of Blood and Blood Forming Organs (D50-D89) 1,773 1,936 3,709 3.7 0.7 Endocrine, Nutritional and Metabolic Diseases (E00-E88) 20,519 22,208 42,727 42.3 7.6
Mental & Behavioral Disorder (F00-F99) 342 147 489 0.5 0.1
Diseases of the Nervous System and Sense Organs (G00-G99;H00-H94) 4,288 3,331 7,619 7.5 1.4
Diseases of Circulatory System (I00-I13; I20-I64; I67-I95; I98-I99) 111,403 86,674 198,077 196.2 35.3
Diseases of the Respiratory System (J00-J94; J96-J99) 44,111 34,746 78,857 78.1 14.1 Diseases of Digestive System (K00-K90; K92-K99) 15,524 6,931 22,455 22.2 4.0
Diseases of the skin and subcutaneous tissues (L00-L99) 953 1,374 2,327 2.3 0.4
Diseases of Musculoskeletal System and connective tissue (M00-M95; M97-M99) 883 1,327 2,210 2.2 0.4
Diseases of Genito-Urinary System (N00-N98) 13,155 8,876 22,031 21.8 3.9 Complication of pregnancy and the puerperium (O00-O07; O10-O79; O85-O99) - 1,721 1,721 1.7 0.3
Certain conditions originating in the perinatal period (P00-P96) 5,910 3,921 9,831 9.7 1.8
Congenital Anomalies (Q00-Q99) 2,725 2,413 5,138 5.1 0.9
Ill-defined and unknown causes of mortality (R00-R68; R70-R99) 9,383 9,276 18,659 18.5 3.3
Accidents, violence other external causes of poisoning & injury (V01-Y89) 31,783 7,473 39,256 38.9 7.0
Other diseases not included in the general list of mortality tabulation 17 4 21 0.0 0.0
Cause GroupBoth Sexes
MORTALITY: 17 CAUSE GROUPSNumber, Rate/100,000 Population & Percent Distribution
Philippines, 2015
197

Table 31
Number Rate Number Rate Number Rate2015 93,807 92.9 58,715 58.1 136,879 135.62014 93,502 93.6 54,277 54.3 132,825 133.02013 92,745 94.6 53,601 54.7 118,740 121.12012 94,116 97.8 50,507 52.5 112,581 117.02011 93,228 98.8 50,763 53.8 107,294 113.72010 90,591 96.4 49,817 53.0 102,936 109.52009 89,179 96.7 47,732 51.8 100,908 109.42008 83,313 92.1 46,262 51.1 92,133 101.92007 77,587 87.6 44,399 50.1 88,314 99.72006 78,348 90.1 43,043 49.5 83,081 95.52005 78,677 92.3 41,697 48.9 77,060 90.42004 72,813 87.1 40,524 48.5 70,861 84.82003 75,200 92.7 39,298 48.5 67,696 83.52002 79,998 100.6 38,821 48.8 70,138 88.22001 79,383 101.9 38,245 49.1 62,950 80.82000 78,361 102.6 36,414 47.7 60,417 79.11999 73,791 98.7 34,238 45.8 58,574 78.41998 79,184 108.3 32,090 43.9 55,830 76.31997 73,940 103.3 29,677 41.5 54,787 76.61996 82,902 118.5 30,339 43.4 53,865 77.01995 80,193 116.9 28,487 41.5 50,252 73.21994 74,635 108.8 28,110 41.0 50,307 73.31993 88,920 132.8 25,399 37.9 48,582 72.51992 87,715 134.2 23,946 36.6 49,022 75.01991 80,513 126.6 22,384 35.2 46,381 72.91990 91,349 147.2 25,738 41.5 46,272 74.61989 104,525 173.9 21,933 36.5 44,856 74.61988 98,997 168.6 21,184 36.1 40,566 69.11987 111,383 194.2 20,367 35.5 38,840 67.71986 104,792 187.1 18,395 32.8 39,163 69.91985 112,998 206.7 18,143 33.2 36,242 66.31984 101,119 190.1 17,700 33.3 31,347 58.91983 110,513 215.0 17,997 35.0 32,320 62.91982 103,868 202.2 16,832 32.8 36,819 71.71981 104,740 211.4 16,059 32.4 34,055 68.71980 105,281 217.9 16,019 33.2 29,355 60.81979 127,453 273.6 15,449 33.2 29,473 63.31978 127,413 279.9 14,158 31.1 25,768 56.61977 122,266 271.7 13,977 31.1 28,006 62.21976 119,738 273.7 13,173 30.1 25,988 59.41975 100,299 235.9 12,493 29.4 24,060 56.61974 119,394 288.0 12,469 30.1 23,522 56.71973 119,737 297.7 11,490 28.6 19,474 48.41972 119,268 305.5 10,268 26.3 16,971 43.51971 99,239 261.4 9,480 25.0 15,277 40.21970 109,103 296.1 9,485 25.7 12,531 34.01969 109,649 295.1 9,256 24.9 12,423 33.41968 110,024 306.6 8,712 24.3 12,347 34.41967 104,149 295.9 8,229 23.4 11,739 33.41966 110,046 328.7 7,382 22.1 10,514 31.41965 107,043 330.9 7,186 22.2 10,854 33.6
DiseasesMalignant
Neoplasms
MORTALITY: COMMUNICABLE DISEASES, MALIGNANT NEOPLASM AND DISEASES OF THE HEART
Number & Rate/100,000 PopulationPhilippines, 1965-2015
Diseases of the HeartYEAR
Communicable
198

Table 32
Number Rate1. Diseases of the heart 136,879 135.52. Diseases of the vascular system 61,198 60.63. Malignant neoplasms 58,715 58.14. Pneumonia 49,595 49.15. Accidents 39,256 38.96. Diabetes mellitus 34,050 33.77. Tuberculosis, all forms 26,047 25.88. Chronic lower respiratory diseases 23,760 23.59. Diseases of the digestive system 22,455 22.210. Diseases of the genitourinary system 22,031 21.8
Number Rate1. Diseases of the heart 77,060 90.42. Diseases of the vascular system 54,372 63.83. Malignant neoplasms 41,697 48.94. Pneumonia 35,610 42.85. Accidents 33,327 39.16. Tuberculosis, all forms 26,588 31.27. Chronic lower respiratory diaseases 20,951 24.68. Diabetes mellitus 18,441 21.6
9. Certain conditions originating in the perinatal period 12,368 14.510. Nephritis, nephrotic syndrome and nephrosis 11,056 13
Number Rate1. Diseases of the heart 50,252 73.22. Diseases of the vascular system 38,592 56.23. Pneumonia 33,637 49.04. Malignant neoplasms 28,487 41.55. Tuberculosis, all forms 27,053 39.46. Accidents 15,814 23.07. Chronic obstructive pulmonary disease and allied conditions 11,309 16.58. Other diseases of respiratory conditions 6,747 9.89. Diabetes Mellitus 6,724 9.810. Nephritis, nephrotic syndrome and nephrosis 6,600 9.6
MORTALITY: TEN (10) LEADING CAUSES Number & Rate/100,000 Population
Philippines2015, 2005, 1995
Causes1995
Causes2015
Causes2005
199
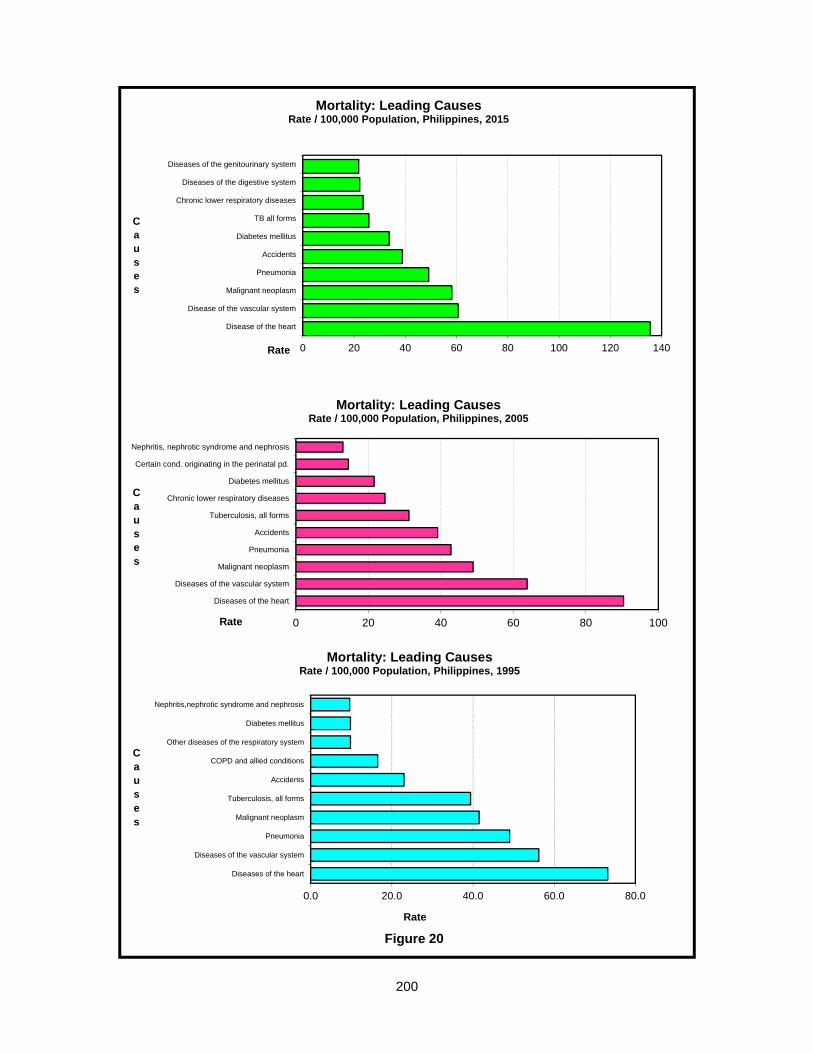
0 20 40 60 80 100 120 140
Disease of the heart
Disease of the vascular system
Malignant neoplasm
Pneumonia
Accidents
Diabetes mellitus
TB all forms
Chronic lower respiratory diseases
Diseases of the digestive system
Diseases of the genitourinary system
Rate
Causes
Mortality: Leading CausesRate / 100,000 Population, Philippines, 2015
0 20 40 60 80 100
Diseases of the heart
Diseases of the vascular system
Malignant neoplasm
Pneumonia
Accidents
Tuberculosis, all forms
Chronic lower respiratory diseases
Diabetes mellitus
Certain cond. originating in the perinatal pd.
Nephritis, nephrotic syndrome and nephrosis
Rate
Causes
Mortality: Leading CausesRate / 100,000 Population, Philippines, 2005
0.0 20.0 40.0 60.0 80.0
Diseases of the heart
Diseases of the vascular system
Pneumonia
Malignant neoplasm
Tuberculosis, all forms
Accidents
COPD and allied conditions
Other diseases of the respiratory system
Diabetes mellitus
Nephritis,nephrotic syndrome and nephrosis
Rate
Causes
Mortality: Leading CausesRate / 100,000 Population, Philippines, 1995
Figure 20
200

Table 33
% of % of % of % ofNumber Rate Neonatal Infant Number Rate Neonatal Infant
Deaths Deaths Deaths Deaths
Under 1 Year 22,023 12.5 100.0 20,750 11.9 100.0
Under 28 Days 12,325 6.9 100.0 55.9 11,802 6.8 100.0 56.9
0 - 7 Days 9,391 5.3 76.2 42.6 9,371 5.4 79.4 45.2
8 - 13 Days 1,507 0.8 12.2 6.8 1,077 0.6 9.1 5.2
14 - 20 Days 787 0.5 6.4 3.6 783 0.4 6.6 3.8
21- 27 Days 639 0.3 5.2 2.9 571 0.3 4.8 2.8
28 Days to Under 1 Year 9,698 5.5 44.1 8,948 5.1 43.1
28 - 59 days 2,236 1.3 10.2 2,190 1.3 10.6
2 Months 1,301 0.8 5.9 1,187 0.7 5.7
3 Months 959 0.5 4.4 887 0.5 4.3
4 Months 868 0.5 3.9 761 0.4 3.7
5 Months 770 0.4 3.5 735 0.4 3.5
6 Months 748 0.4 3.4 681 0.4 3.3
7 Months 701 0.4 3.2 612 0.4 2.9
8 Months 648 0.4 2.9 567 0.3 2.7
9 Months 533 0.3 2.4 505 0.3 2.4
10 Months 462 0.3 2.1 414 0.2 2.0
11 Months 473 0.3 2.2 409 0.2 2.0
2015
Age
INFANT MORTALITY: BY SMALLER AGE GROUPSNumber, Rate/1000 Livebirths & Percent Distribution
Philippines5 - Year Average (2010-2014) & 2015
5-Year Average (2010-2014)
201
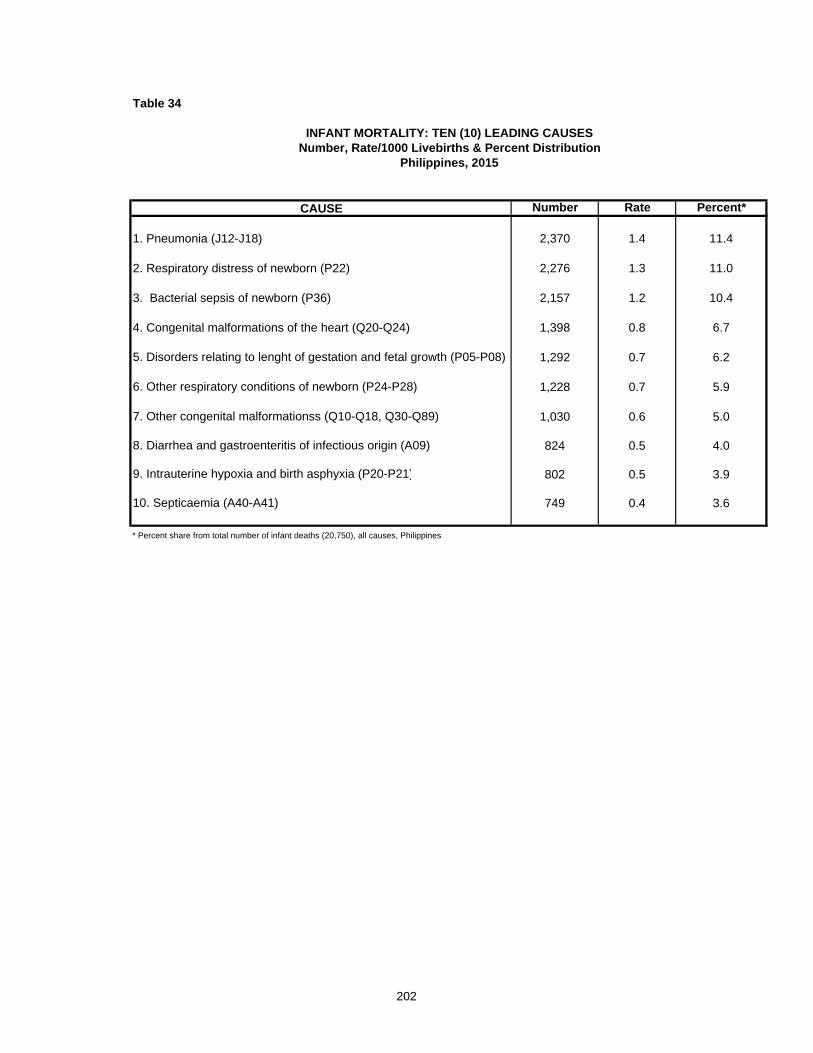
Table 34
CAUSE Number Rate Percent*
1. Pneumonia (J12-J18) 2,370 1.4 11.4
2. Respiratory distress of newborn (P22) 2,276 1.3 11.0
3. Bacterial sepsis of newborn (P36) 2,157 1.2 10.4
4. Congenital malformations of the heart (Q20-Q24) 1,398 0.8 6.7
5. Disorders relating to lenght of gestation and fetal growth (P05-P08) 1,292 0.7 6.2
6. Other respiratory conditions of newborn (P24-P28) 1,228 0.7 5.9
7. Other congenital malformationss (Q10-Q18, Q30-Q89) 1,030 0.6 5.0
8. Diarrhea and gastroenteritis of infectious origin (A09) 824 0.5 4.0
9. Intrauterine hypoxia and birth asphyxia (P20-P21) 802 0.5 3.9
10. Septicaemia (A40-A41) 749 0.4 3.6
INFANT MORTALITY: TEN (10) LEADING CAUSESNumber, Rate/1000 Livebirths & Percent Distribution
Philippines, 2015
* Percent share from total number of infant deaths (20,750), all causes, Philippines
202
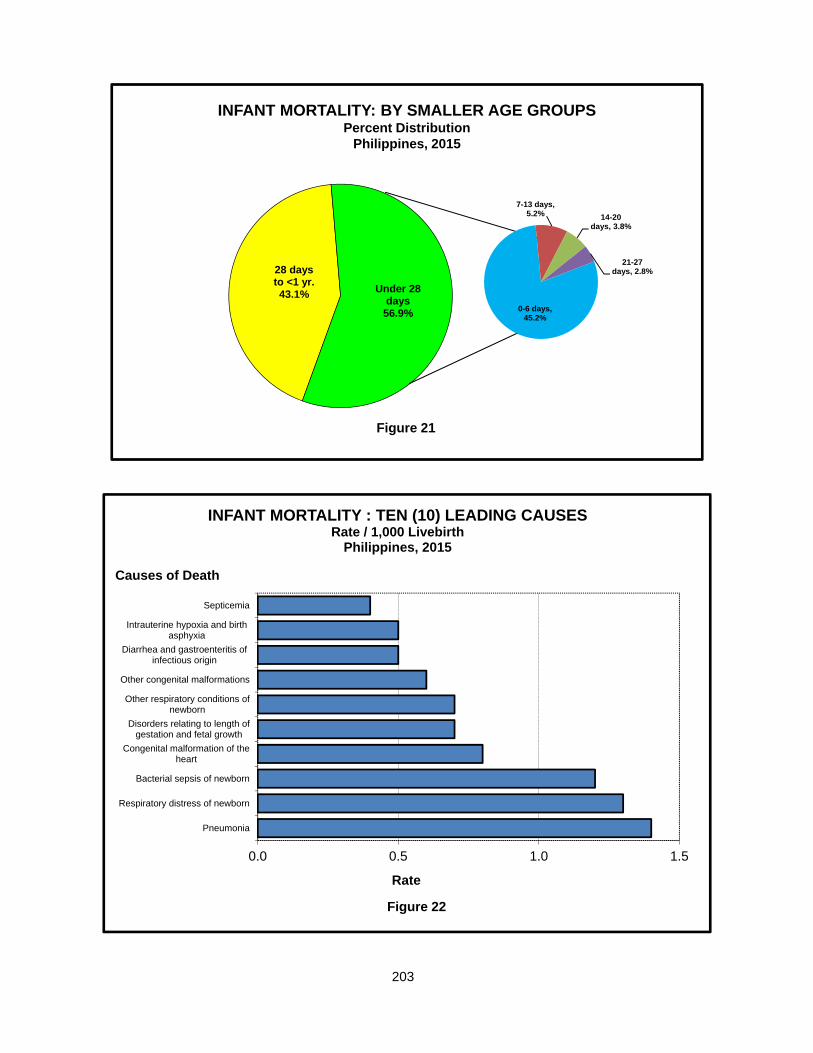
0.0 0.5 1.0 1.5
Pneumonia
Respiratory distress of newborn
Bacterial sepsis of newborn
Congenital malformation of theheart
Disorders relating to length ofgestation and fetal growth
Other respiratory conditions ofnewborn
Other congenital malformations
Diarrhea and gastroenteritis ofinfectious origin
Intrauterine hypoxia and birthasphyxia
Septicemia
Rate
Causes of Death
INFANT MORTALITY : TEN (10) LEADING CAUSESRate / 1,000 Livebirth
Philippines, 2015
Figure 22
INFANT MORTALITY: BY SMALLER AGE GROUPSPercent Distribution
Philippines, 2015
28 days to <1 yr.43.1% Under 28
days56.9%
Figure 21
203
0-6 days, 45.2%
7-13 days, 5.2% 14-20
days, 3.8%
21-27 days, 2.8%
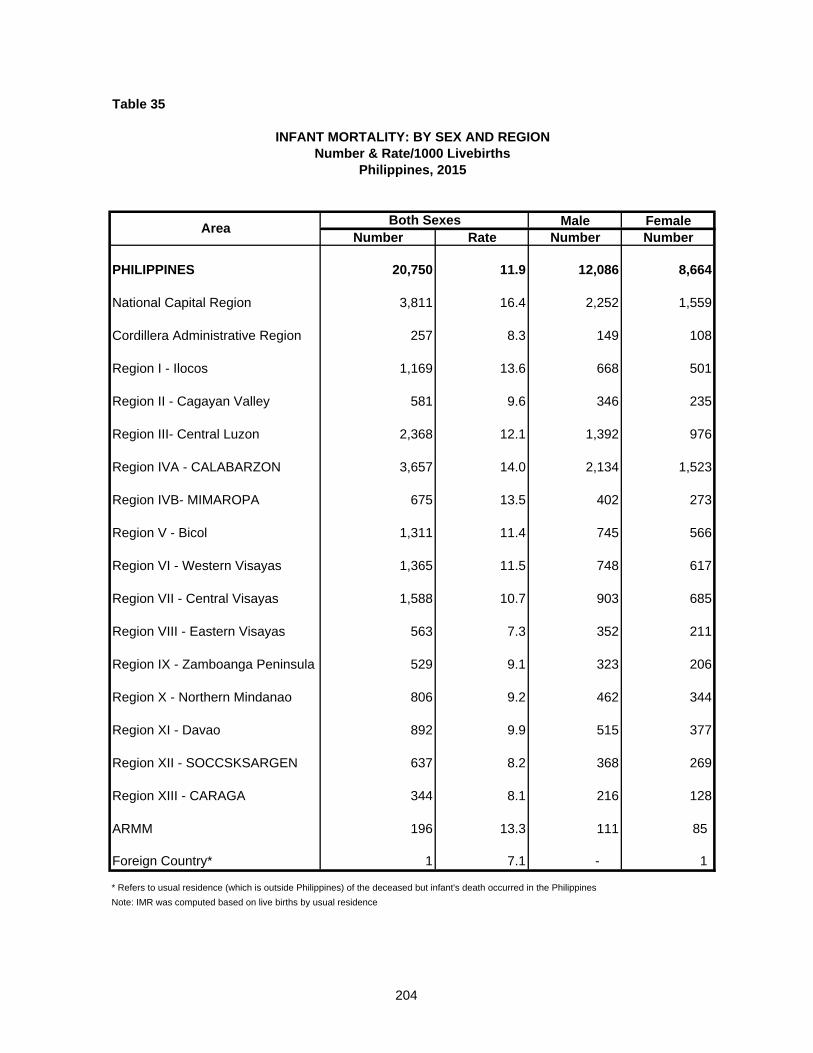
Table 35
Male FemaleNumber Rate Number Number
PHILIPPINES 20,750 11.9 12,086 8,664
National Capital Region 3,811 16.4 2,252 1,559
Cordillera Administrative Region 257 8.3 149 108
Region I - Ilocos 1,169 13.6 668 501
Region II - Cagayan Valley 581 9.6 346 235
Region III- Central Luzon 2,368 12.1 1,392 976
Region IVA - CALABARZON 3,657 14.0 2,134 1,523
Region IVB- MIMAROPA 675 13.5 402 273
Region V - Bicol 1,311 11.4 745 566
Region VI - Western Visayas 1,365 11.5 748 617
Region VII - Central Visayas 1,588 10.7 903 685
Region VIII - Eastern Visayas 563 7.3 352 211
Region IX - Zamboanga Peninsula 529 9.1 323 206
Region X - Northern Mindanao 806 9.2 462 344
Region XI - Davao 892 9.9 515 377
Region XII - SOCCSKSARGEN 637 8.2 368 269
Region XIII - CARAGA 344 8.1 216 128
ARMM 196 13.3 111 85
Foreign Country* 1 7.1 - 1
* Refers to usual residence (which is outside Philippines) of the deceased but infant's death occurred in the Philippines
Note: IMR was computed based on live births by usual residence
AreaBoth Sexes
INFANT MORTALITY: BY SEX AND REGIONNumber & Rate/1000 Livebirths
Philippines, 2015
204

Table 36
Number Rate Percent*
1 Eclampsia (O15) 337 0.2 19.62 Gestational [pregnancy-induced] hypertension with significant
proteinuria (O14) 292 0.2 17.03 Abnormality of forces of labor (O62) 206 0.1 12.04 Postpartum hemorrhage (O72) 198 0.1 11.55 Complications of the puerperium, not elsewhere classified (O90) 108 0.1 6.36 Other maternal diseases classifiable elsewhere but complicating
pregnancy, childbirth, and the puerperium (O99)93 0.1 5.4
7 Ectopic pregnancy (O00) 60 0.0 3.58 Obstetric embolism (O88) 57 0.0 3.39 Hydatidiform mole (O01) 53 0.0 3.1
Premature separation of placenta [abruptio placentae](O45) 40 0.0 2.3Puerperal sepsis (O85) 40 0.0 2.3
* Percent share to total number of maternal deaths (n=1,721)
MATERNAL MORTALITY: BY MAIN CAUSENumber, Rate/1000 Livebirths & Percent Distribution
Philippines, 2015
Cause
10
205
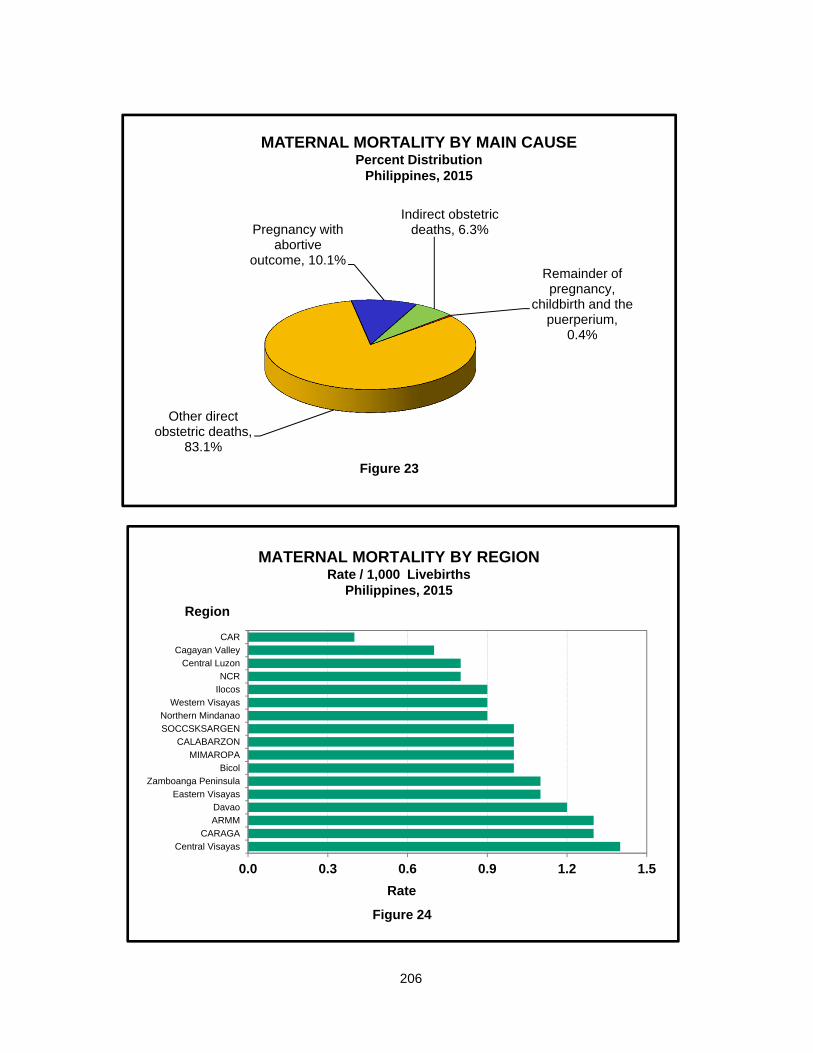
Other direct obstetric deaths,
83.1%
Pregnancy with abortive
outcome, 10.1%
Indirect obstetric deaths, 6.3%
Remainder of pregnancy,
childbirth and the puerperium,
0.4%
Figure 23
MATERNAL MORTALITY BY MAIN CAUSEPercent Distribution
Philippines, 2015
0.0 0.3 0.6 0.9 1.2 1.5
Central Visayas
CARAGA
ARMM
Davao
Eastern Visayas
Zamboanga Peninsula
Bicol
MIMAROPA
CALABARZON
SOCCSKSARGEN
Northern Mindanao
Western Visayas
Ilocos
NCR
Central Luzon
Cagayan Valley
CAR
MATERNAL MORTALITY BY REGIONRate / 1,000 Livebirths
Philippines, 2015
Rate
Region
Figure 24
206
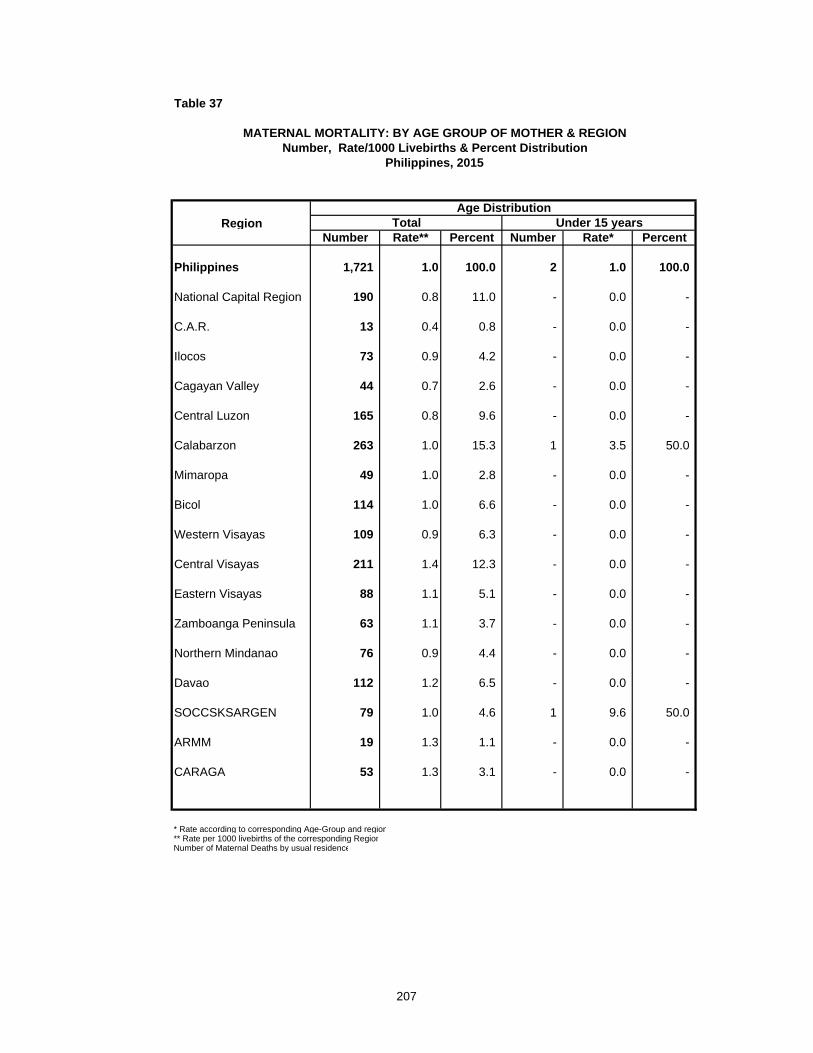
Table 37
RegionNumber Rate** Percent Number Rate* Percent
Philippines 1,721 1.0 100.0 2 1.0 100.0
National Capital Region 190 0.8 11.0 - 0.0 -
C.A.R. 13 0.4 0.8 - 0.0 -
Ilocos 73 0.9 4.2 - 0.0 -
Cagayan Valley 44 0.7 2.6 - 0.0 -
Central Luzon 165 0.8 9.6 - 0.0 -
Calabarzon 263 1.0 15.3 1 3.5 50.0
Mimaropa 49 1.0 2.8 - 0.0 -
Bicol 114 1.0 6.6 - 0.0 -
Western Visayas 109 0.9 6.3 - 0.0 -
Central Visayas 211 1.4 12.3 - 0.0 -
Eastern Visayas 88 1.1 5.1 - 0.0 -
Zamboanga Peninsula 63 1.1 3.7 - 0.0 -
Northern Mindanao 76 0.9 4.4 - 0.0 -
Davao 112 1.2 6.5 - 0.0 -
SOCCSKSARGEN 79 1.0 4.6 1 9.6 50.0
ARMM 19 1.3 1.1 - 0.0 -
CARAGA 53 1.3 3.1 - 0.0 -
* Rate according to corresponding Age-Group and region** Rate per 1000 livebirths of the corresponding RegionNumber of Maternal Deaths by usual residence
MATERNAL MORTALITY: BY AGE GROUP OF MOTHER & REGIONNumber, Rate/1000 Livebirths & Percent Distribution
Philippines, 2015
Age DistributionTotal Under 15 years
207
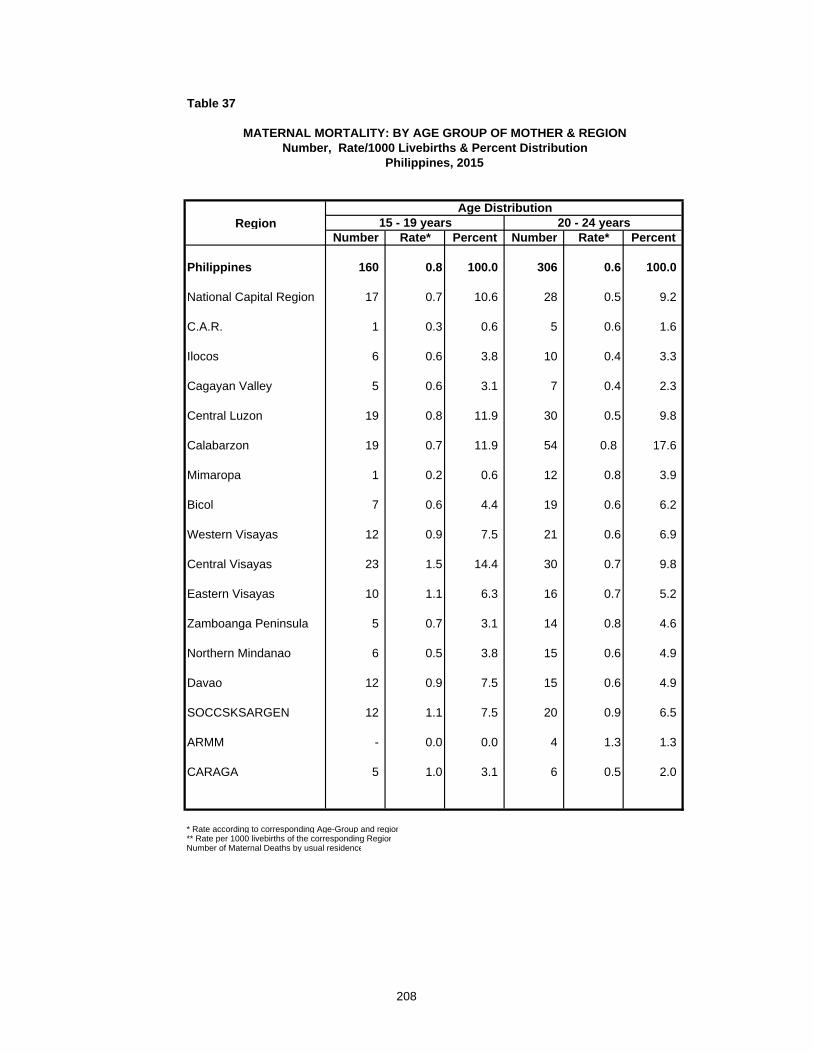
Table 37
RegionNumber Rate* Percent Number Rate* Percent
Philippines 160 0.8 100.0 306 0.6 100.0
National Capital Region 17 0.7 10.6 28 0.5 9.2
C.A.R. 1 0.3 0.6 5 0.6 1.6
Ilocos 6 0.6 3.8 10 0.4 3.3
Cagayan Valley 5 0.6 3.1 7 0.4 2.3
Central Luzon 19 0.8 11.9 30 0.5 9.8
Calabarzon 19 0.7 11.9 54 0.8 17.6
Mimaropa 1 0.2 0.6 12 0.8 3.9
Bicol 7 0.6 4.4 19 0.6 6.2
Western Visayas 12 0.9 7.5 21 0.6 6.9
Central Visayas 23 1.5 14.4 30 0.7 9.8
Eastern Visayas 10 1.1 6.3 16 0.7 5.2
Zamboanga Peninsula 5 0.7 3.1 14 0.8 4.6
Northern Mindanao 6 0.5 3.8 15 0.6 4.9
Davao 12 0.9 7.5 15 0.6 4.9
SOCCSKSARGEN 12 1.1 7.5 20 0.9 6.5
ARMM - 0.0 0.0 4 1.3 1.3
CARAGA 5 1.0 3.1 6 0.5 2.0
* Rate according to corresponding Age-Group and region** Rate per 1000 livebirths of the corresponding RegionNumber of Maternal Deaths by usual residence
MATERNAL MORTALITY: BY AGE GROUP OF MOTHER & REGIONNumber, Rate/1000 Livebirths & Percent Distribution
Philippines, 2015
15 - 19 years 20 - 24 yearsAge Distribution
208

Table 37
RegionNumber Rate* Percent Number Rate* Percent
Philippines 323 0.7 100.0 351 1.1 100.0
National Capital Region 39 0.6 12.1 44 0.9 12.5
C.A.R. 3 0.4 0.9 1 0.2 0.3
Ilocos 15 0.7 4.6 13 0.8 3.7
Cagayan Valley 13 0.9 4.0 6 0.6 1.7
Central Luzon 25 0.5 7.7 38 1.0 10.8
Calabarzon 53 0.8 16.4 45 0.9 12.8
Mimaropa 8 0.7 2.5 8 0.9 2.3
Bicol 28 1.0 8.7 21 1.0 6.0
Western Visayas 15 0.5 4.6 27 1.2 7.7
Central Visayas 47 1.2 14.6 40 1.5 11.4
Eastern Visayas 9 0.5 2.8 15 1.1 4.3
Zamboanga Peninsula 6 0.4 1.9 15 1.5 4.3
Northern Mindanao 13 0.6 4.0 21 1.4 6.0
Davao 18 0.8 5.6 30 2.0 8.5
SOCCSKSARGEN 16 0.8 5.0 12 0.9 3.4
ARMM 5 1.4 1.5 3 1.0 0.9
CARAGA 10 0.9 3.1 12 1.6 3.4
* Rate according to corresponding Age-Group and region** Rate per 1000 livebirths of the corresponding RegionNumber of Maternal Deaths by usual residence
Number, Rate/1000 Livebirths & Percent DistributionPhilippines, 2015
MATERNAL MORTALITY: BY AGE GROUP OF MOTHER & REGION
Age Distribution25 - 29 years 30 -34 years
209
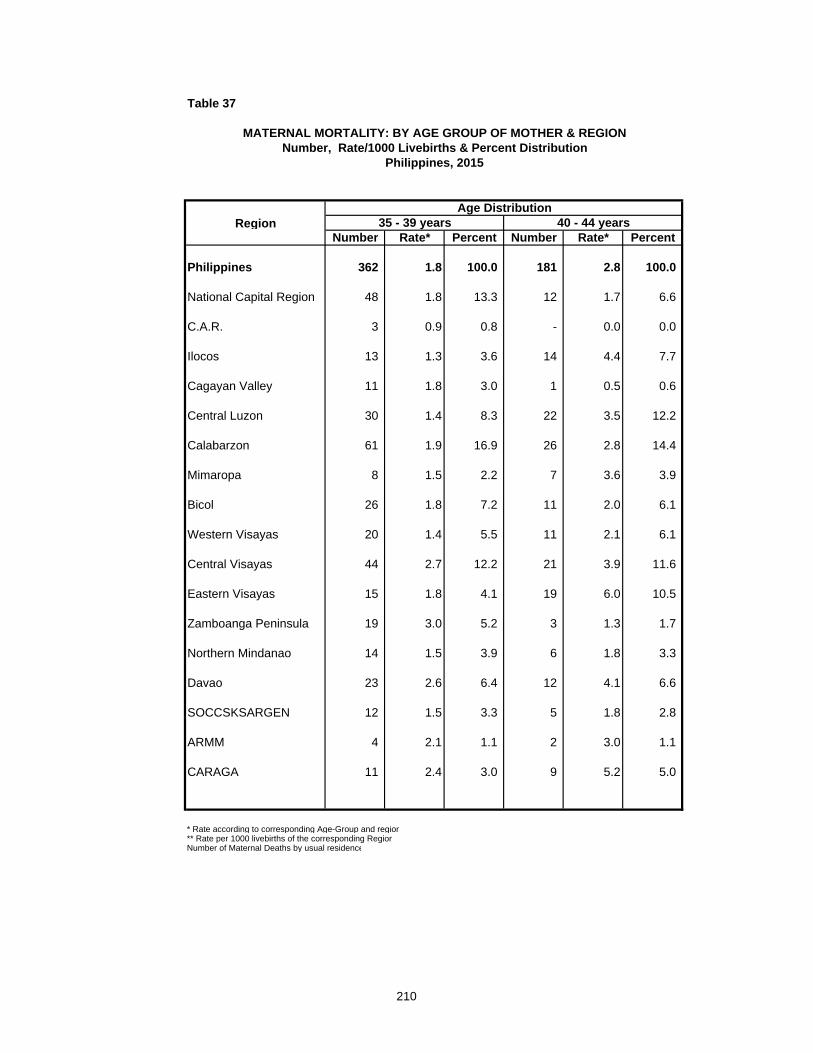
Table 37
RegionNumber Rate* Percent Number Rate* Percent
Philippines 362 1.8 100.0 181 2.8 100.0
National Capital Region 48 1.8 13.3 12 1.7 6.6
C.A.R. 3 0.9 0.8 - 0.0 0.0
Ilocos 13 1.3 3.6 14 4.4 7.7
Cagayan Valley 11 1.8 3.0 1 0.5 0.6
Central Luzon 30 1.4 8.3 22 3.5 12.2
Calabarzon 61 1.9 16.9 26 2.8 14.4
Mimaropa 8 1.5 2.2 7 3.6 3.9
Bicol 26 1.8 7.2 11 2.0 6.1
Western Visayas 20 1.4 5.5 11 2.1 6.1
Central Visayas 44 2.7 12.2 21 3.9 11.6
Eastern Visayas 15 1.8 4.1 19 6.0 10.5
Zamboanga Peninsula 19 3.0 5.2 3 1.3 1.7
Northern Mindanao 14 1.5 3.9 6 1.8 3.3
Davao 23 2.6 6.4 12 4.1 6.6
SOCCSKSARGEN 12 1.5 3.3 5 1.8 2.8
ARMM 4 2.1 1.1 2 3.0 1.1
CARAGA 11 2.4 3.0 9 5.2 5.0
* Rate according to corresponding Age-Group and region** Rate per 1000 livebirths of the corresponding RegionNumber of Maternal Deaths by usual residence
Age Distribution35 - 39 years 40 - 44 years
MATERNAL MORTALITY: BY AGE GROUP OF MOTHER & REGIONNumber, Rate/1000 Livebirths & Percent Distribution
Philippines, 2015
210

Table 37
RegionNumber Rate* Percent Number Rate* Percent
Philippines 34 5.1 100.0 2 5.4 100.0
National Capital Region 2 3.2 5.9 - 0.0 0.0
C.A.R. - 0.0 0.0 - 0.0 0.0
Ilocos 2 6.5 5.9 - 0.0 0.0
Cagayan Valley - 0.0 0.0 1 90.9 50.0
Central Luzon 1 1.4 2.9 - 0.0 0.0
Calabarzon 4 4.5 11.8 - 0.0 0.0
Mimaropa 5 19.8 14.7 - 0.0 0.0
Bicol 2 3.3 5.9 - 0.0 0.0
Western Visayas 3 5.1 8.8 - 0.0 0.0
Central Visayas 6 12.2 17.6 - 0.0 0.0
Eastern Visayas 3 9.8 8.8 1 100.0 50.0
Zamboanga Peninsula 1 4.0 2.9 - 0.0 0.0
Northern Mindanao 1 2.8 2.9 - 0.0 0.0
Davao 2 7.2 5.9 - 0.0 0.0
SOCCSKSARGEN 1 2.9 2.9 - 0.0 0.0
ARMM 1 5.7 2.9 - 0.0 0.0
CARAGA - 0.0 0.0 - 0.0 0.0
* Rate according to corresponding Age-Group and region** Rate per 1000 livebirths of the corresponding RegionNumber of Maternal Deaths by usual residence
MATERNAL MORTALITY: BY AGE GROUP OF MOTHER & REGIONNumber, Rate/1000 Livebirths & Percent Distribution
Philippines, 2015
Age Distribution45 - 49 years 50 years & Over
211
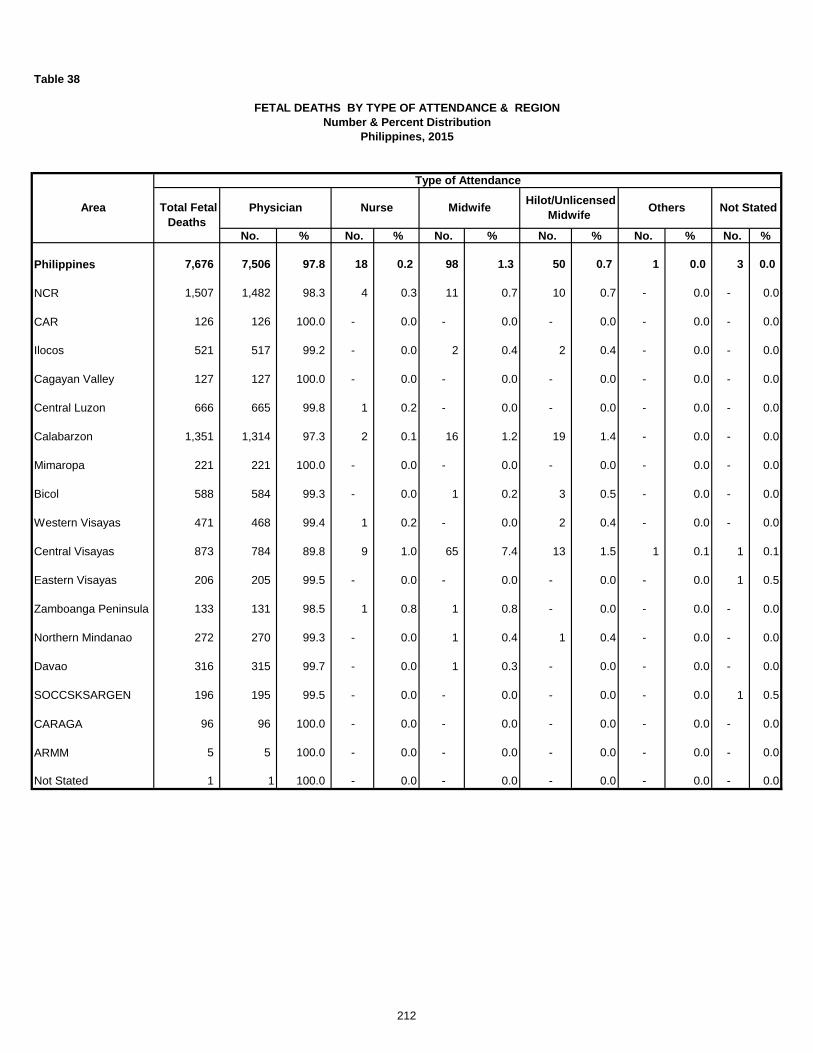
Table 38
No. % No. % No. % No. % No. % No. %
Philippines 7,676 7,506 97.8 18 0.2 98 1.3 50 0.7 1 0.0 3 0.0
NCR 1,507 1,482 98.3 4 0.3 11 0.7 10 0.7 - 0.0 - 0.0
CAR 126 126 100.0 - 0.0 - 0.0 - 0.0 - 0.0 - 0.0
Ilocos 521 517 99.2 - 0.0 2 0.4 2 0.4 - 0.0 - 0.0
Cagayan Valley 127 127 100.0 - 0.0 - 0.0 - 0.0 - 0.0 - 0.0
Central Luzon 666 665 99.8 1 0.2 - 0.0 - 0.0 - 0.0 - 0.0
Calabarzon 1,351 1,314 97.3 2 0.1 16 1.2 19 1.4 - 0.0 - 0.0
Mimaropa 221 221 100.0 - 0.0 - 0.0 - 0.0 - 0.0 - 0.0
Bicol 588 584 99.3 - 0.0 1 0.2 3 0.5 - 0.0 - 0.0
Western Visayas 471 468 99.4 1 0.2 - 0.0 2 0.4 - 0.0 - 0.0
Central Visayas 873 784 89.8 9 1.0 65 7.4 13 1.5 1 0.1 1 0.1
Eastern Visayas 206 205 99.5 - 0.0 - 0.0 - 0.0 - 0.0 1 0.5
Zamboanga Peninsula 133 131 98.5 1 0.8 1 0.8 - 0.0 - 0.0 - 0.0
Northern Mindanao 272 270 99.3 - 0.0 1 0.4 1 0.4 - 0.0 - 0.0
Davao 316 315 99.7 - 0.0 1 0.3 - 0.0 - 0.0 - 0.0
SOCCSKSARGEN 196 195 99.5 - 0.0 - 0.0 - 0.0 - 0.0 1 0.5
CARAGA 96 96 100.0 - 0.0 - 0.0 - 0.0 - 0.0 - 0.0
ARMM 5 5 100.0 - 0.0 - 0.0 - 0.0 - 0.0 - 0.0
Not Stated 1 1 100.0 - 0.0 - 0.0 - 0.0 - 0.0 - 0.0
Area
Type of Attendance
Total Fetal Deaths
FETAL DEATHS BY TYPE OF ATTENDANCE & REGIONNumber & Percent Distribution
Philippines, 2015
Physician Nurse Others MidwifeHilot/Unlicensed
Midwife Not Stated
212
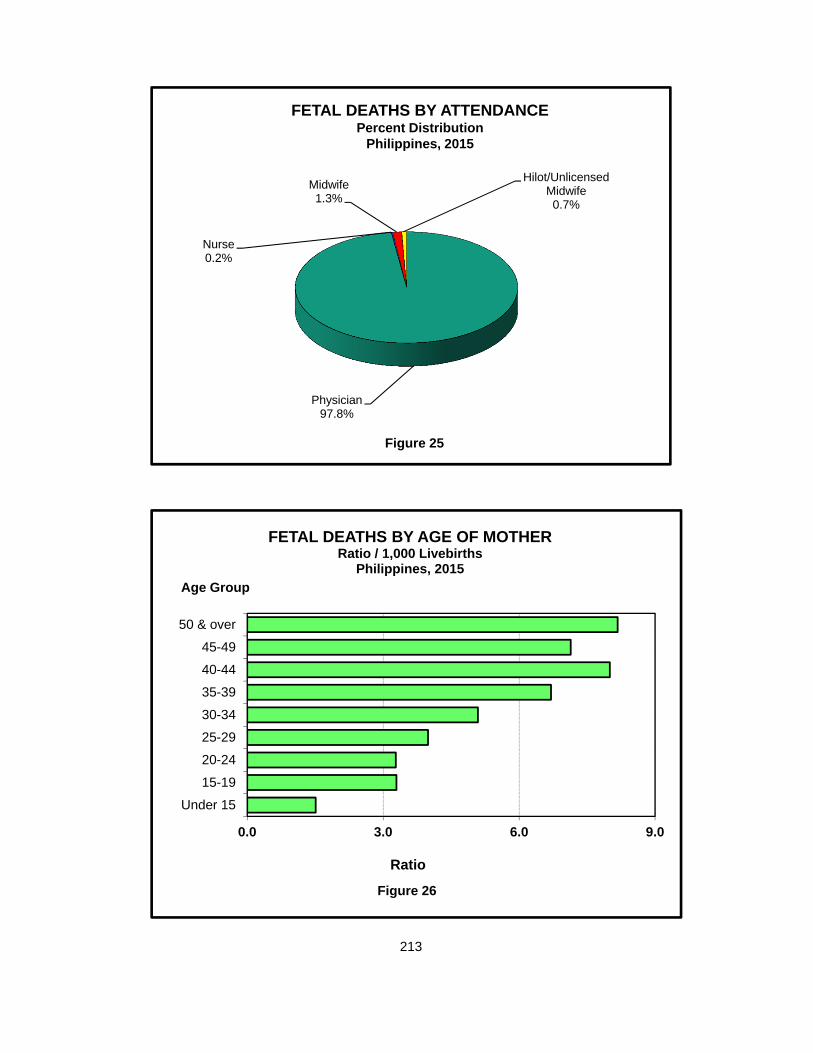
Physician97.8%
Nurse0.2%
Midwife1.3%
Hilot/Unlicensed Midwife0.7%
FETAL DEATHS BY ATTENDANCEPercent Distribution
Philippines, 2015
Figure 25
213
0.0 3.0 6.0 9.0
Under 15
15-19
20-24
25-29
30-34
35-39
40-44
45-49
50 & over
Ratio
FETAL DEATHS BY AGE OF MOTHERRatio / 1,000 Livebirths
Philippines, 2015
Figure 26
Age Group
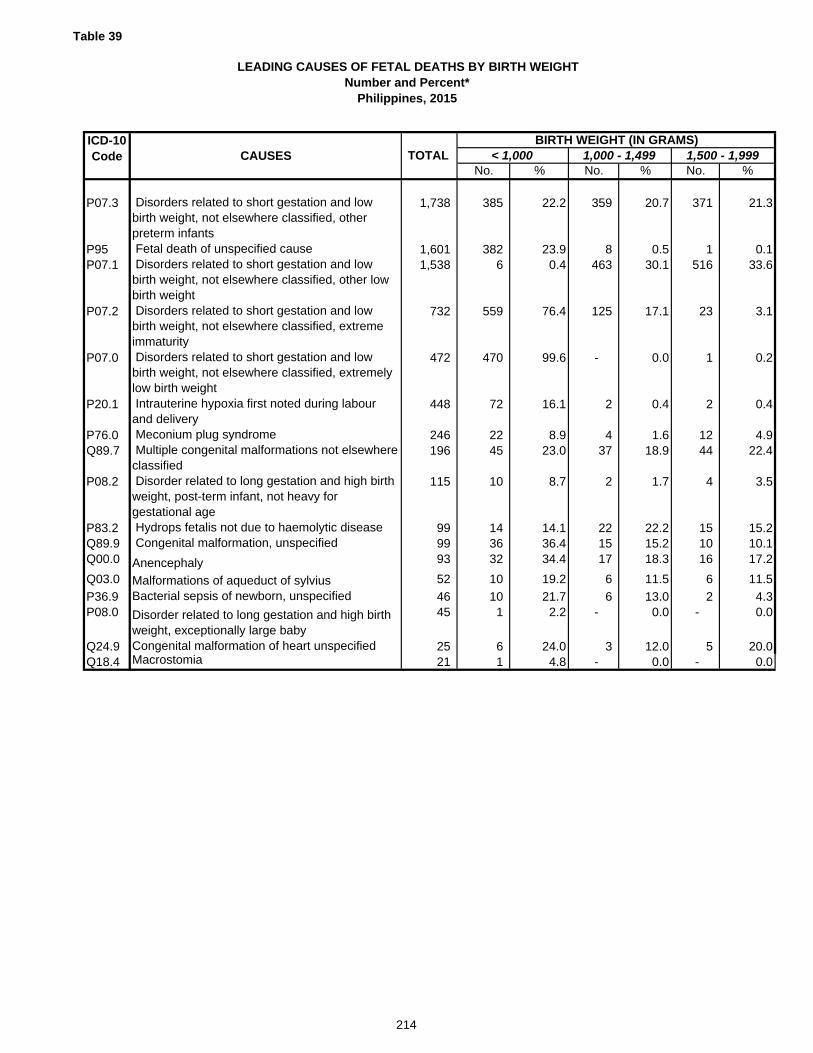
Table 39
LEADING CAUSES OF FETAL DEATHS BY BIRTH WEIGHTNumber and Percent*
Philippines, 2015
CAUSESNo. % No. % No. %
P07.3 Disorders related to short gestation and low birth weight, not elsewhere classified, other preterm infants
1,738 385 22.2 359 20.7 371 21.3
P95 Fetal death of unspecified cause 1,601 382 23.9 8 0.5 1 0.1P07.1 Disorders related to short gestation and low
birth weight, not elsewhere classified, other low birth weight
1,538 6 0.4 463 30.1 516 33.6
P07.2 Disorders related to short gestation and low birth weight, not elsewhere classified, extreme immaturity
732 559 76.4 125 17.1 23 3.1
P07.0 Disorders related to short gestation and low birth weight, not elsewhere classified, extremely low birth weight
472 470 99.6 - 0.0 1 0.2
P20.1 Intrauterine hypoxia first noted during labour and delivery
448 72 16.1 2 0.4 2 0.4
P76.0 Meconium plug syndrome 246 22 8.9 4 1.6 12 4.9Q89.7 Multiple congenital malformations not elsewhere
classified 196 45 23.0 37 18.9 44 22.4
P08.2 Disorder related to long gestation and high birth weight, post-term infant, not heavy for gestational age
115 10 8.7 2 1.7 4 3.5
P83.2 Hydrops fetalis not due to haemolytic disease 99 14 14.1 22 22.2 15 15.2Q89.9 Congenital malformation, unspecified 99 36 36.4 15 15.2 10 10.1Q00.0 Anencephaly 93 32 34.4 17 18.3 16 17.2
Q03.0 Malformations of aqueduct of sylvius 52 10 19.2 6 11.5 6 11.5
P36.9 Bacterial sepsis of newborn, unspecified 46 10 21.7 6 13.0 2 4.3P08.0 Disorder related to long gestation and high birth
weight, exceptionally large baby
45 1 2.2 - 0.0 - 0.0
Q24.9 Congenital malformation of heart unspecified 25 6 24.0 3 12.0 5 20.0Q18.4 Macrostomia 21 1 4.8 - 0.0 - 0.0
1,500 - 1,999TOTAL ICD-10 Code
BIRTH WEIGHT (IN GRAMS)< 1,000 1,000 - 1,499
214

Table 39
LEADING CAUSES OF FETAL DEATHS BY BIRTH WEIGHTNumber and Percent*
Philippines, 2015
CAUSES
Disorders related to short gestation and low birth weight, not elsewhere classified, other preterm infants Fetal death of unspecified cause Disorders related to short gestation and low birth weight, not elsewhere classified, other low birth weight Disorders related to short gestation and low birth weight, not elsewhere classified, extreme immaturity Disorders related to short gestation and low birth weight, not elsewhere classified, extremely low birth weight Intrauterine hypoxia first noted during labour and delivery Meconium plug syndrome Multiple congenital malformations not elsewhere classified Disorder related to long gestation and high birth weight, post-term infant, not heavy for gestational age Hydrops fetalis not due to haemolytic disease Congenital malformation, unspecified
Anencephaly
Malformations of aqueduct of sylviusBacterial sepsis of newborn, unspecified
Disorder related to long gestation and high birth weight, exceptionally large babyCongenital malformation of heart unspecifiedMacrostomia
No. % No. % No. % No. %
296 17.0 237 13.6 61 3.5 16 0.9
9 0.6 594 37.1 409 25.5 155 9.7550 35.8 1 0.1 1 0.1 - 0.0
11 1.5 5 0.7 2 0.3 3 0.4
1 0.2 - 0.0 - 0.0 - 0.0
5 1.1 166 37.1 130 29.0 53 11.8
38 15.4 92 37.4 53 21.5 22 8.933 16.8 19 9.7 9 4.6 4 2.0
13 11.3 32 27.8 30 26.1 18 15.7
18 18.2 15 15.2 7 7.1 3 3.012 12.1 13 13.1 7 7.1 5 5.111 11.8 7 7.5 9 9.7 1 1.1
12 23.1 7 13.5 5 9.6 4 7.7
6 13.0 11 23.9 9 19.6 2 4.3- 0.0 - 0.0 - 0.0 - 0.0
4 16.0 3 12.0 3 12.0 1 4.01 4.8 - 0.0 - 0.0 3 14.3
2,000 -2,499BIRTH WEIGHT (IN GRAMS)
3,500 - 3,9992,500 - 2,999 3,000 -3,499
215
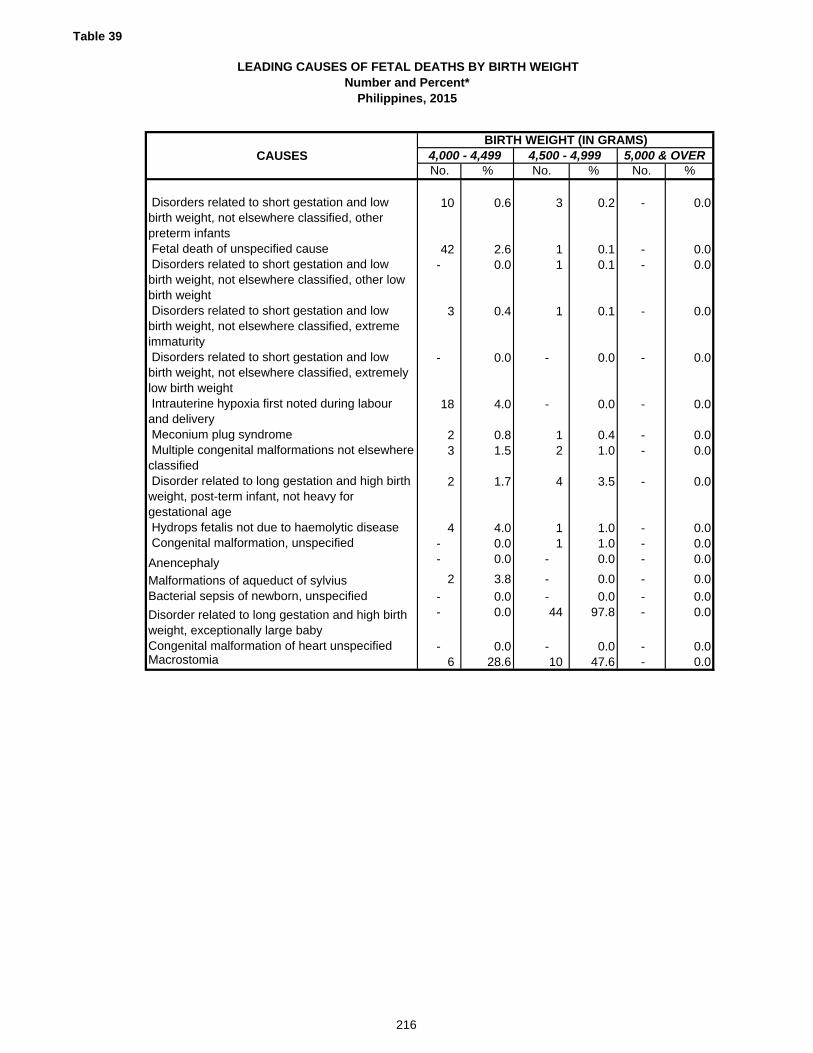
Table 39
LEADING CAUSES OF FETAL DEATHS BY BIRTH WEIGHTNumber and Percent*
Philippines, 2015
CAUSES
Disorders related to short gestation and low birth weight, not elsewhere classified, other preterm infants Fetal death of unspecified cause Disorders related to short gestation and low birth weight, not elsewhere classified, other low birth weight Disorders related to short gestation and low birth weight, not elsewhere classified, extreme immaturity Disorders related to short gestation and low birth weight, not elsewhere classified, extremely low birth weight Intrauterine hypoxia first noted during labour and delivery Meconium plug syndrome Multiple congenital malformations not elsewhere classified Disorder related to long gestation and high birth weight, post-term infant, not heavy for gestational age Hydrops fetalis not due to haemolytic disease Congenital malformation, unspecified
Anencephaly
Malformations of aqueduct of sylviusBacterial sepsis of newborn, unspecified
Disorder related to long gestation and high birth weight, exceptionally large babyCongenital malformation of heart unspecifiedMacrostomia
No. % No. % No. %
10 0.6 3 0.2 - 0.0
42 2.6 1 0.1 - 0.0- 0.0 1 0.1 - 0.0
3 0.4 1 0.1 - 0.0
- 0.0 - 0.0 - 0.0
18 4.0 - 0.0 - 0.0
2 0.8 1 0.4 - 0.03 1.5 2 1.0 - 0.0
2 1.7 4 3.5 - 0.0
4 4.0 1 1.0 - 0.0- 0.0 1 1.0 - 0.0- 0.0 - 0.0 - 0.0
2 3.8 - 0.0 - 0.0
- 0.0 - 0.0 - 0.0- 0.0 44 97.8 - 0.0
- 0.0 - 0.0 - 0.06 28.6 10 47.6 - 0.0
5,000 & OVER4,500 - 4,9994,000 - 4,499BIRTH WEIGHT (IN GRAMS)
216
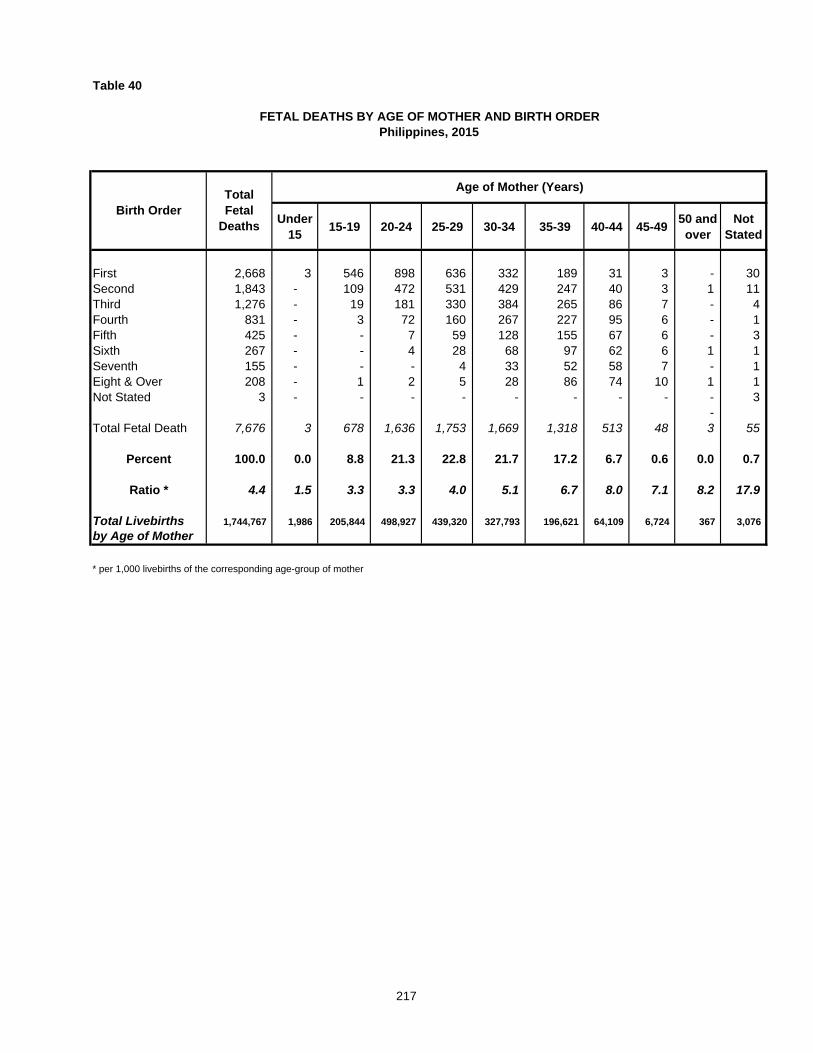
Table 40
Under 15
15-19 20-24 25-29 30-34 35-39 40-44 45-4950 and over
Not Stated
First 2,668 3 546 898 636 332 189 31 3 - 30 Second 1,843 - 109 472 531 429 247 40 3 1 11 Third 1,276 - 19 181 330 384 265 86 7 - 4 Fourth 831 - 3 72 160 267 227 95 6 - 1 Fifth 425 - - 7 59 128 155 67 6 - 3 Sixth 267 - - 4 28 68 97 62 6 1 1 Seventh 155 - - - 4 33 52 58 7 - 1 Eight & Over 208 - 1 2 5 28 86 74 10 1 1 Not Stated 3 - - - - - - - - - 3
- Total Fetal Death 7,676 3 678 1,636 1,753 1,669 1,318 513 48 3 55
Percent 100.0 0.0 8.8 21.3 22.8 21.7 17.2 6.7 0.6 0.0 0.7
Ratio * 4.4 1.5 3.3 3.3 4.0 5.1 6.7 8.0 7.1 8.2 17.9
Total Livebirths 1,744,767 1,986 205,844 498,927 439,320 327,793 196,621 64,109 6,724 367 3,076
by Age of Mother
* per 1,000 livebirths of the corresponding age-group of mother
Birth OrderTotal Fetal
Deaths
FETAL DEATHS BY AGE OF MOTHER AND BIRTH ORDERPhilippines, 2015
Age of Mother (Years)
217
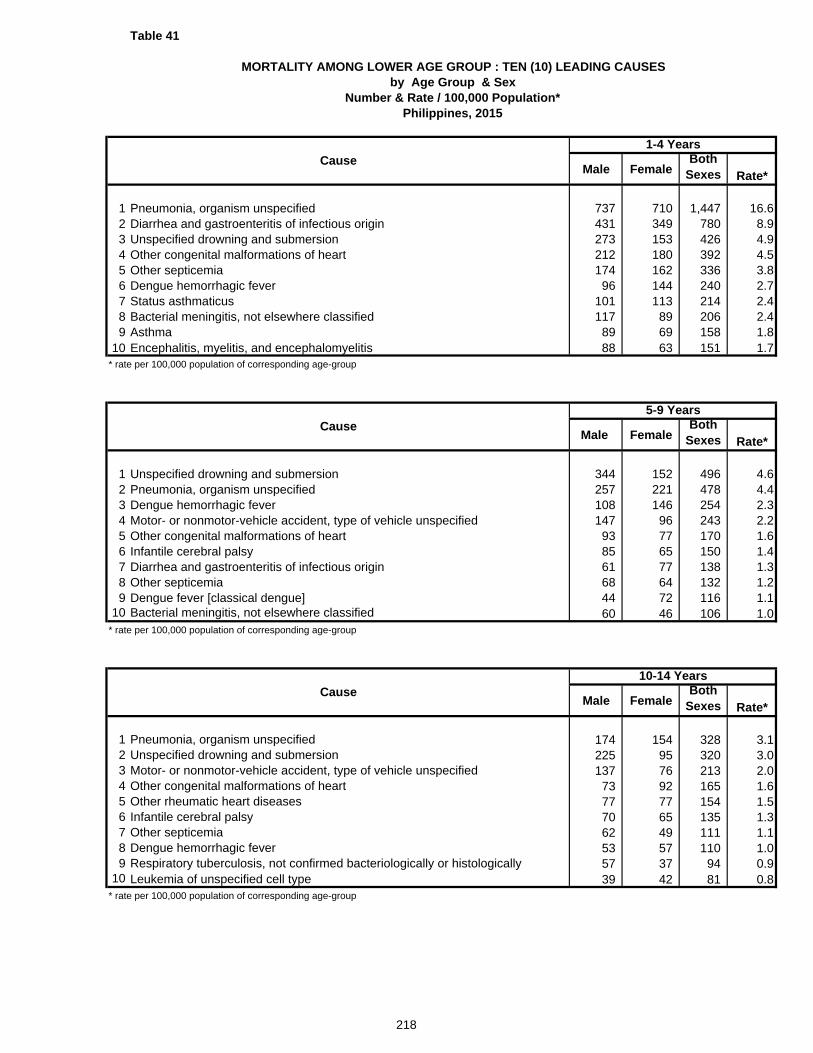
Table 41
Male FemaleBoth
Sexes Rate*
1 Pneumonia, organism unspecified 737 710 1,447 16.62 Diarrhea and gastroenteritis of infectious origin 431 349 780 8.93 Unspecified drowning and submersion 273 153 426 4.94 Other congenital malformations of heart 212 180 392 4.55 Other septicemia 174 162 336 3.86 Dengue hemorrhagic fever 96 144 240 2.77 Status asthmaticus 101 113 214 2.48 Bacterial meningitis, not elsewhere classified 117 89 206 2.49 Asthma 89 69 158 1.8
10 Encephalitis, myelitis, and encephalomyelitis 88 63 151 1.7* rate per 100,000 population of corresponding age-group
Male FemaleBoth
Sexes Rate*
1 Unspecified drowning and submersion 344 152 496 4.62 Pneumonia, organism unspecified 257 221 478 4.43 Dengue hemorrhagic fever 108 146 254 2.34 Motor- or nonmotor-vehicle accident, type of vehicle unspecified 147 96 243 2.25 Other congenital malformations of heart 93 77 170 1.66 Infantile cerebral palsy 85 65 150 1.47 Diarrhea and gastroenteritis of infectious origin 61 77 138 1.38 Other septicemia 68 64 132 1.29 Dengue fever [classical dengue] 44 72 116 1.1
10 Bacterial meningitis, not elsewhere classified 60 46 106 1.0* rate per 100,000 population of corresponding age-group
Male FemaleBoth
Sexes Rate*
1 Pneumonia, organism unspecified 174 154 328 3.12 Unspecified drowning and submersion 225 95 320 3.03 Motor- or nonmotor-vehicle accident, type of vehicle unspecified 137 76 213 2.04 Other congenital malformations of heart 73 92 165 1.65 Other rheumatic heart diseases 77 77 154 1.56 Infantile cerebral palsy 70 65 135 1.37 Other septicemia 62 49 111 1.18 Dengue hemorrhagic fever 53 57 110 1.09 Respiratory tuberculosis, not confirmed bacteriologically or histologically 57 37 94 0.9
10 Leukemia of unspecified cell type 39 42 81 0.8* rate per 100,000 population of corresponding age-group
5-9 Years
Cause
Cause
Cause10-14 Years
MORTALITY AMONG LOWER AGE GROUP : TEN (10) LEADING CAUSESby Age Group & Sex
Number & Rate / 100,000 Population*Philippines, 2015
1-4 Years
218

Table 42
Number Rate Number Rate Number Rate Number Rate Number Rate
1. Measles (B05) 10 0.0 6 0.3 2 0.0 - 0.0 2 0.0
2. Tetanus (A33, A35) 95 0.3 22 1.1 17 0.2 31 0.3 25 0.2
3. Tuberculosis, all forms (A15-A19; B90) 509 1.6 32 1.5 149 1.7 161 1.5 167 1.6
4. Diphtheria (A36) 17 0.1 2 0.1 8 0.1 7 0.1 - 0.0
5. Acute Poliomyelitis, including late effects (A80, B91) 7 0.0 - 0.0 - 0.0 3 0.0 4 0.0
* population of specific age group
MORTALITY AMONG IMMUNIZABLE DISEASES(Under 1; 1 - 4; 5 - 9; 10 - 14 Years)Number & Rate/100,000 Population*
Philippines, 2015
Under 1 1 - 4 Years 5 - 9 Years 10 - 14 YearsTotalCause
219
220
Bibliograhy: Philippine Statistics Authority. (2015). Philippine Statistics Authority. Retrieved November 28,
2018, from Philippine Statistics Authority: https://psa.gov.ph/sites/default/files/2015%20PIF_0.pdf
Philippine Statistics Authority. (2017). Philippine Statistics Authority. Retrieved April 2018, from Population and Housing: https://psa.gov.ph/content/philippine-population-surpassed-100-million-mark-results-2015-census-population
World Health Organization. (2018). Maternal Health. Retrieved November 29, 2018, from World Health Organization: https://www.who.int/maternal-health/en/