PHILIPPINE STATISTICS AUTHORITY Statistics on...PHILIPPINE STATISTICS AUTHORITY ... The Office of...
68
PHILIPPINE STATISTICS AUTHORITY
Transcript of PHILIPPINE STATISTICS AUTHORITY Statistics on...PHILIPPINE STATISTICS AUTHORITY ... The Office of...
PHILIPPINE STATISTICS AUTHORITY

PHILIPPINE STATISTICS AUTHORITY
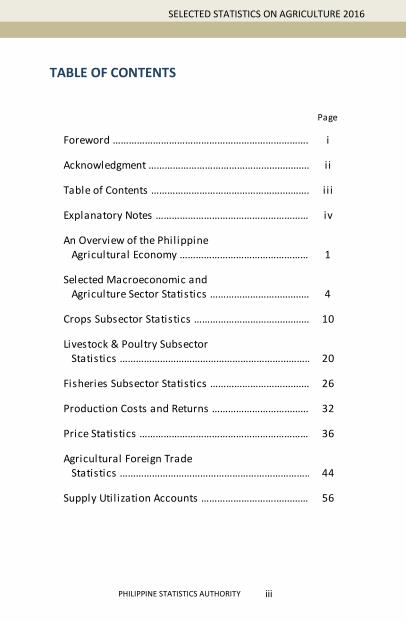
TERMS OF USE Selected Statistics on Agriculture 2016 is a publication of the Philippine Statistics Authority. The PSA reserves exclusive right to reproduce this publication in whatever form. Should any portion of this publication be included in a report/article, the title of the publication and the PSA should be cited as the source of the data. The PSA will not be responsible for any information derived from the processing of data contained in this publication.
ISSN-2012-0362 AUGUST 2016 Please direct technical inquiries to: The Office of the National Statistician PHILIPPINE STATISTICS AUTHORITY East Avenue, Diliman, Quezon City, Philippines 1104
Website : www.psa.gov.ph
60

PHILIPPINE STATISTICS AUTHORITY
FOREWORD
The 2016 Selected Statistics on Agriculture (SSA) is the 27 th issue of the annual statistical report published by the Philippine Statistics Authority (PSA). It provides a five-year data series (2011-2015) for selected macroeconomic indicators and agricultural production by subsector and by commodity, including statistics on production costs and returns, price and trade, and supply utilization accounts. Through this report, the PSA consolidates statistics and indicators that can respond to the needs of our data users. The 27th issue of SSA can be downloaded from www.psa.gov.ph and is available in printed copies. As the PSA strives to improve its statistical products and services, we welcome comments and feedback on the contents and format of this publication.
LISA GRACE S. BERSALES, Ph.D. National Statistician and Civil Registrar General
Quezon City, Philippines August 2016
i
SELECTED STATISTICS ON AGRICULTURE 2016

PHILIPPINE STATISTICS AUTHORITY
ACKNOWLEDGMENT
Our appreciation and gratitude go to the following agencies for their cooperation and support in sharing with us their data: Agricultural Credit Policy Council (ACPC), Asian Development Bank (ADB), National Meat Inspection Services (NMIS), Bangko Sentral ng Pilipinas (BSP), Department of Budget and Management (DBM), Development Bank of the Philippines (DBP), Food and Agriculture Organization (FAO), Fertilizer and Pesticide Authority (FPA), Philippine Fiber Industry Development Authority (PhilFIDA), National Food Authority (NFA), National Irrigation Administration (NIA), Philippine Coconut Authority (PCA), Philippine National Bank (PNB), Sugar Regulatory Administration (SRA) and World Bank (WB).
ii
PHILIPPINE STATISTICS AUTHORITY
TABLE OF CONTENTS
iii
SELECTED STATISTICS ON AGRICULTURE 2016
Page
Foreword ………………………………………………………………….…….i
Acknowledgment …………………………………….................. i i
Table of Contents …………………………………………....………. i i i
Explanatory Notes ………………………………………………… iv
An Overview of the Philippine Agricultural Economy …………………………………………. 1
Selected Macroeconomic and Agriculture Sector Statistics …………………….................…...4
Crops Subsector Statistics ………………………….....................10
Livestock & Poultry Subsector Statistics ……………………………………………………...………. 20
Fisheries Subsector Statistics ………………………..............……..26
Production Costs and Returns ………………………............. 32
Price Statistics ……………………………………………………… 36
Agricultural Foreign Trade Statistics …………………………………………………………….. 44
Supply Util ization Accounts ………………………..........……. 56
PHILIPPINE STATISTICS AUTHORITY
EXPLANATORY NOTES 1. Data sets are sourced from various agricultural surveys
conducted by PSA for crops, livestock and poultry and fisheries. Estimation procedures are based on the established sampling methodology used for each survey as discussed in detail in the Metadata for National Agricultural Statistics in the Philippines.
2. Unless otherwise indicated, year refers to calendar year. 3. Sources of basic data from other agencies are
acknowledged at the bottom of each table. 4. As a rule, figures from source publications were copied to
the extent possible. In some instances, however, figures were rounded-off or combined.
5. Figures may not add up to the totals due to rounding off. 6. Yield per hectare is derived prior to rounding-off the data on
production and hectarage.
7. The following symbols and abbreviations are used in the tables:
- - - Data not yet available - None R Revised P Preliminary mt Metric Ton ha(s) Hectare/s kg Kilogram GNI Gross National Income GVA Gross Value Added GDP Gross Domestic Product PDB Private Development Bank SMB Savings and Mortgage Bank SSLA Stock Savings & Loan Association FOB Freight on Board CIF Cost Insurance Freight NFD Net Food Disposable CPH Census of Population and Housing
iv
PHILIPPINE STATISTICS AUTHORITY
SELECTED STATISTICS ON AGRICULTURE 2016
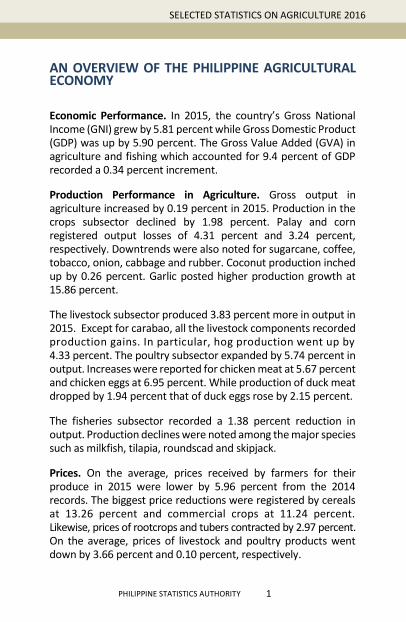
AN OVERVIEW OF THE PHILIPPINE AGRICULTURAL ECONOMY Economic Performance. In 2015, the country’s Gross National Income (GNI) grew by 5.81 percent while Gross Domestic Product (GDP) was up by 5.90 percent. The Gross Value Added (GVA) in agriculture and fishing which accounted for 9.4 percent of GDP recorded a 0.34 percent increment. Production Performance in Agriculture. Gross output in agriculture increased by 0.19 percent in 2015. Production in the crops subsector declined by 1.98 percent. Palay and corn registered output losses of 4.31 percent and 3.24 percent, respectively. Downtrends were also noted for sugarcane, coffee, tobacco, onion, cabbage and rubber. Coconut production inched up by 0.26 percent. Garlic posted higher production growth at 15.86 percent. The livestock subsector produced 3.83 percent more in output in 2015. Except for carabao, all the livestock components recorded production gains. In particular, hog production went up by 4.33 percent. The poultry subsector expanded by 5.74 percent in output. Increases were reported for chicken meat at 5.67 percent and chicken eggs at 6.95 percent. While production of duck meat dropped by 1.94 percent that of duck eggs rose by 2.15 percent. The fisheries subsector recorded a 1.38 percent reduction in output. Production declines were noted among the major species such as milkfish, tilapia, roundscad and skipjack. Prices. On the average, prices received by farmers for their produce in 2015 were lower by 5.96 percent from the 2014 records. The biggest price reductions were registered by cereals at 13.26 percent and commercial crops at 11.24 percent. Likewise, prices of rootcrops and tubers contracted by 2.97 percent. On the average, prices of livestock and poultry products went down by 3.66 percent and 0.10 percent, respectively. A 2.08 percent price cut was recorded for fishery products. On the
1
PHILIPPINE STATISTICS AUTHORITY
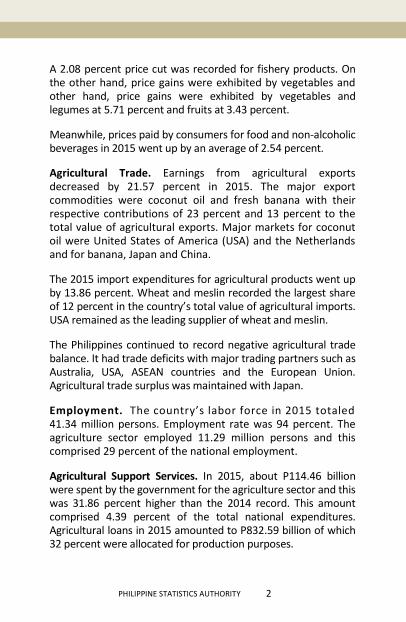
A 2.08 percent price cut was recorded for fishery products. On the other hand, price gains were exhibited by vegetables and other hand, price gains were exhibited by vegetables and legumes at 5.71 percent and fruits at 3.43 percent. Meanwhile, prices paid by consumers for food and non-alcoholic beverages in 2015 went up by an average of 2.54 percent. Agricultural Trade. Earnings from agricultural exports decreased by 21.57 percent in 2015. The major export commodities were coconut oil and fresh banana with their respective contributions of 23 percent and 13 percent to the total value of agricultural exports. Major markets for coconut oil were United States of America (USA) and the Netherlands and for banana, Japan and China. The 2015 import expenditures for agricultural products went up by 13.86 percent. Wheat and meslin recorded the largest share of 12 percent in the country’s total value of agricultural imports. USA remained as the leading supplier of wheat and meslin. The Philippines continued to record negative agricultural trade balance. It had trade deficits with major trading partners such as Australia, USA, ASEAN countries and the European Union. Agricultural trade surplus was maintained with Japan. Employment. The country’s labor force in 2015 totaled 41.34 million persons. Employment rate was 94 percent. The agriculture sector employed 11.29 million persons and this comprised 29 percent of the national employment. Agricultural Support Services. In 2015, about P114.46 billion were spent by the government for the agriculture sector and this was 31.86 percent higher than the 2014 record. This amount comprised 4.39 percent of the total national expenditures. Agricultural loans in 2015 amounted to P832.59 billion of which 32 percent were allocated for production purposes.
2
PHILIPPINE STATISTICS AUTHORITY
60

PHILIPPINE STATISTICS AUTHORITY
4
ITEM 2011 2012 2013 2014 2015
GNI (million pesos) 7,058,037 7,559,511 8,152,210 8,633,162 9,134,679
Growth Rate (%) 3.02 7.11 7.84 5.90 5.81
GDP (million pesos) 5,910,201 6,305,229 6,750,631 7,170,414 7,593,769
Growth Rate (%) 3.66 6.68 7.06 6.22 5.90
GVA IN AGRICULTURE EXCLUDING FORESTRY (million pesos) 676,075 695,130 701,577 713,258 715,703
Growth Rate (%)
Agriculture Sector 2.44 2.82 0.93 1.66 0.34 Crops 4.97 4.27 0.11 2.41 -1.85
Livestock 1.96 1.09 1.76 1.03 3.85 Poultry 4.40 4.60 4.23 0.38 5.66
Fishing -4.32 -0.38 0.75 -0.16 -1.77 Agricultural Activities
and Services 3.02 2.14 0.62 4.46 6.20
Source: PSA
(Value at constant 2000 prices)
PHILIPPINES, 2011-2015Table 1.1 MACROECONOMIC GROWTH INDICATORS,
ITEM 2011 2012 2013 2014 2015
GROSS OUTPUT IN AGRICULTURE(million pesos) 747,353 768,836 777,178 787,995 789,511
Growth Rate (%) 2.17 2.87 1.09 1.39 0.19
Crops (million pesos) 380,906 396,342 396,200 406,061 398,003
Growth Rate (%) 4.73 4.05 -0.04 2.49 -1.98
Livestock (million pesos) 122,679 124,041 126,216 127,495 132,381
Growth Rate (%) 2.01 1.11 1.75 1.01 3.83
Poultry (million pesos) 105,379 110,136 114,833 115,143 121,755
Growth Rate (%) 4.37 4.51 4.26 0.27 5.74
Fisheries (million pesos) 138,389 138,318 139,928 139,296 137,371
Growth Rate (%) -5.56 -0.05 1.16 -0.45 -1.38
Source: PSA
Table 1.1a PERFORMANCE OF AGRICULTURE BY SUBSECTOR,PHILIPPINES, 2011-2015
(Value at constant 2000 prices)
PHILIPPINE STATISTICS AUTHORITY
5
SELECTED STATISTICS ON AGRICULTURE 2016
ITEM 2011 2012 2013 2014 2015
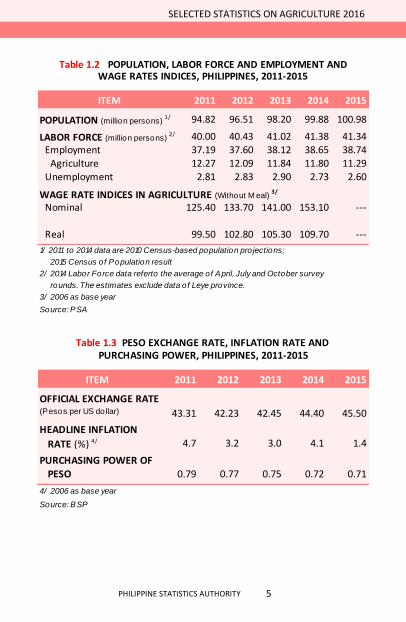
OFFICIAL EXCHANGE RATE (Pesos per US dollar) 43.31 42.23 42.45 44.40 45.50
HEADLINE INFLATION
RATE (%) 4/ 4.7 3.2 3.0 4.1 1.4
PURCHASING POWER OF PESO 0.79 0.77 0.75 0.72 0.71
4/ 2006 as base year
Source: BSP
Table 1.3 PESO EXCHANGE RATE, INFLATION RATE AND PURCHASING POWER, PHILIPPINES, 2011-2015
ITEM 2011 2012 2013 2014 2015
POPULATION (million persons) 1/ 94.82 96.51 98.20 99.88 100.98
LABOR FORCE (million persons) 2/ 40.00 40.43 41.02 41.38 41.34 Employment 37.19 37.60 38.12 38.65 38.74
Agriculture 12.27 12.09 11.84 11.80 11.29 Unemployment 2.81 2.83 2.90 2.73 2.60
WAGE RATE INDICES IN AGRICULTURE (Without M eal) 3/
Nominal 125.40 133.70 141.00 153.10 ---
Real 99.50 102.80 105.30 109.70 ---
1/ 2011 to 2014 data are 2010 Census-based population pro jections;
2015 Census of Population result
2/ 2014 Labor Force data referto the average of April, July and October survey
rounds. The estimates exclude data of Leye province.
3/ 2006 as base year
Source: PSA
Table 1.2 POPULATION, LABOR FORCE AND EMPLOYMENT ANDWAGE RATES INDICES, PHILIPPINES, 2011-2015
PHILIPPINE STATISTICS AUTHORITY
6
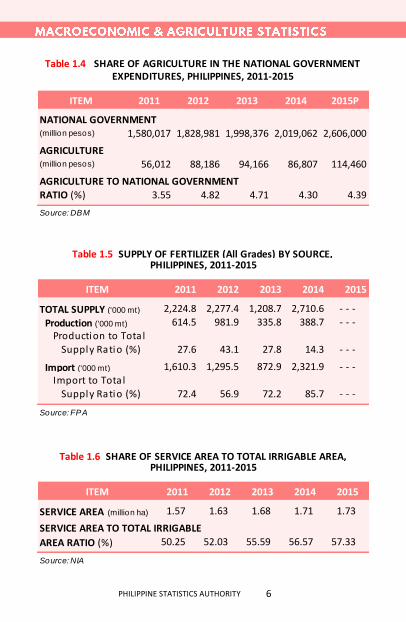
ITEM 2011 2012 2013 2014 2015P
NATIONAL GOVERNMENT (million pesos) 1,580,017 1,828,981 1,998,376 2,019,062 2,606,000
AGRICULTURE (million pesos) 56,012 88,186 94,166 86,807 114,460
AGRICULTURE TO NATIONAL GOVERNMENT RATIO (%) 3.55 4.82 4.71 4.30 4.39
Source: DBM
Table 1.4 SHARE OF AGRICULTURE IN THE NATIONAL GOVERNMENT EXPENDITURES, PHILIPPINES, 2011-2015
ITEM 2011 2012 2013 2014 2015
TOTAL SUPPLY ('000 mt) 2,224.8 2,277.4 1,208.7 2,710.6 - - -
Production ('000 mt) 614.5 981.9 335.8 388.7 - - -
Production to Tota l Supply Ratio (%) 27.6 43.1 27.8 14.3 - - -
Import ('000 mt) 1,610.3 1,295.5 872.9 2,321.9 - - - Import to Tota l Supply Ratio (%) 72.4 56.9 72.2 85.7 - - -
Source: FPA
ITEM 2011 2012 2013 2014 2015
SERVICE AREA (million ha) 1.57 1.63 1.68 1.71 1.73
SERVICE AREA TO TOTAL IRRIGABLE
AREA RATIO (%) 50.25 52.03 55.59 56.57 57.33
Source: NIA
PHILIPPINES, 2011-2015
Table 1.5 SUPPLY OF FERTILIZER (All Grades) BY SOURCE, PHILIPPINES, 2011-2015
Table 1.6 SHARE OF SERVICE AREA TO TOTAL IRRIGABLE AREA,

PHILIPPINE STATISTICS AUTHORITY
7
SELECTED STATISTICS ON AGRICULTURE 2016
ITEM 2011 2012 2013 2014 2015P
LOANS GRANTED BY COMMODITY (million pesos)
FOOD COMMODITIES 87,434.2 92,957.2 101,800.0 110,942.5 122,553.7Cereals 40,885.0 45,711.4 50,864.9 56,229.0 64,447.3 Palay 36,547.5 40,078.7 44,313.5 48,979.0 55,672.3 Corn 4,288.1 5,509.7 6,421.2 7,112.7 8,551.8 Sorghum 39.3 36.1 37.7 39.1 54.9 Soybeans and Feedgrains 10.0 86.8 92.5 98.3 168.3Fruits , Vegetables and Rootcrops 8,743.0 8,780.4 9,673.8 10,610.9 11,778.1Livestock and Poultry 32,590.0 32,677.8 35,139.0 37,598.4 39,644.6Fisheries 5,216.2 5,787.5 6,122.3 6,504.3 6,683.6
EXPORT AND COMMERCIAL COMMODITIES 16,701.8 19,268.4 21,216.2 23,150.5 26,072.1Abaca and Other Fibers 127.4 133.8 143.2 150.2 154.7Coconut 6,391.9 5,619.1 5,984.1 6,134.1 6,427.9
Coffee and Cacao 472.0 323.1 332.4 341.9 353.3Rubber 84.7 85.7 87.9 99.7 118.4Sugarcane 7,983.1 11,342.0 12,749.9 14,338.4 16,699.4Tobacco 1,642.7 1,764.8 1,918.7 2,086.3 2,318.3
FORESTRY 315.5 529.8 551.9 574.8 644.2
OTHERS 43,036.5 43,004.7 45,421.7 47,793.2 51,462.4
SUB-TOTAL 147,488.0 155,760.1 168,989.8 182,460.9 200,732.4
OTHER LOANS SOURCED FROM SSLA 20,024.0 13,866.0 14,534.1 16,375.4 17,161.9 SMB 32,560.0 23,382.0 25,014.0 25,628.9 27,418.9 PDB 15,070.0 18,413.0 19,333.7 22,198.6 22,822.3
GRAND TOTAL 215,142.0 211,421.1 227,871.5 246,663.8 268,135.5
Source: ACPC
Table 1.7 AGRICULTURAL PRODUCTION LOANS BY COMMODITY AND SOURCES, PHILIPPINES, 2011-2015

PHILIPPINE STATISTICS AUTHORITY
8
ITEM 2011 2012 2013 2014 2015P
AGRICULTURAL PRODUCTION LOAN TO OUTPUT (GVA) RATIO (%) 17.4 16.9 17.6 17.2 19.6
AGRICULTURAL LOANS (million pesos, at current
prices) 642,743.3 669,595.7 721,728.4 778,250.0 832,588.0
TOTAL LOANS (million pesos, at current
prices) 33,343,260.3 35,440,936.6 37,804,845.3 40,195,025.9 43,067,679.4
AGRICULTURAL LOANS TO TOTAL LOANS GRANTED RATIO (%) 1.9 1.9 1.9 1.9 1.9
Source: ACPC
Table 1.7a SHARE OF AGRICULTURE IN THE TOTAL LOANSPHILIPPINES, 2011-2015

PHILIPPINE STATISTICS AUTHORITY
60
PHILIPPINE STATISTICS AUTHORITY
10
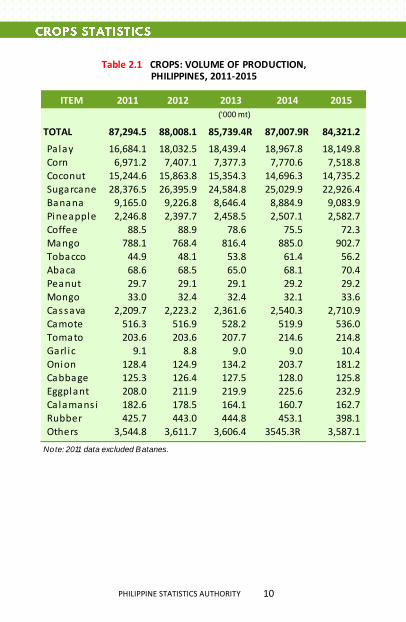
ITEM 2011 2012 2013 2014 2015
TOTAL 87,294.5 88,008.1 85,739.4R 87,007.9R 84,321.2
Palay 16,684.1 18,032.5 18,439.4 18,967.8 18,149.8 Corn 6,971.2 7,407.1 7,377.3 7,770.6 7,518.8 Coconut 15,244.6 15,863.8 15,354.3 14,696.3 14,735.2 Sugarcane 28,376.5 26,395.9 24,584.8 25,029.9 22,926.4 Banana 9,165.0 9,226.8 8,646.4 8,884.9 9,083.9 Pineapple 2,246.8 2,397.7 2,458.5 2,507.1 2,582.7 Coffee 88.5 88.9 78.6 75.5 72.3 Mango 788.1 768.4 816.4 885.0 902.7 Tobacco 44.9 48.1 53.8 61.4 56.2 Abaca 68.6 68.5 65.0 68.1 70.4 Peanut 29.7 29.1 29.1 29.2 29.2 Mongo 33.0 32.4 32.4 32.1 33.6 Cassava 2,209.7 2,223.2 2,361.6 2,540.3 2,710.9 Camote 516.3 516.9 528.2 519.9 536.0 Tomato 203.6 203.6 207.7 214.6 214.8 Garl ic 9.1 8.8 9.0 9.0 10.4 Onion 128.4 124.9 134.2 203.7 181.2 Cabbage 125.3 126.4 127.5 128.0 125.8 Eggplant 208.0 211.9 219.9 225.6 232.9 Ca lamans i 182.6 178.5 164.1 160.7 162.7 Rubber 425.7 443.0 444.8 453.1 398.1 Others 3,544.8 3,611.7 3,606.4 3545.3R 3,587.1
Note: 2011 data excluded Batanes.
Table 2.1 CROPS: VOLUME OF PRODUCTION,PHILIPPINES, 2011-2015
('000 mt)
PHILIPPINE STATISTICS AUTHORITY
.
11
SELECTED STATISTICS ON AGRICULTURE 2016
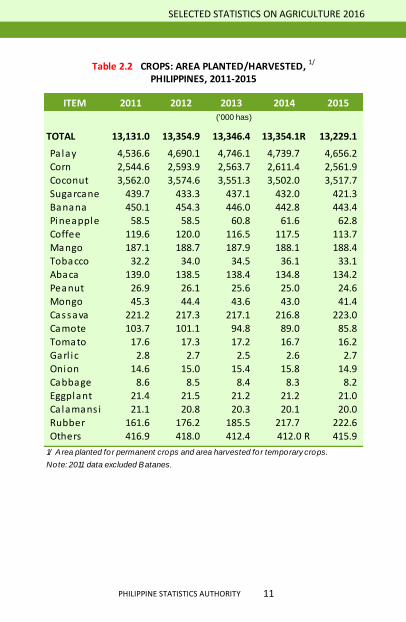
ITEM 2011 2012 2013 2014 2015
TOTAL 13,131.0 13,354.9 13,346.4 13,354.1R 13,229.1
Palay 4,536.6 4,690.1 4,746.1 4,739.7 4,656.2 Corn 2,544.6 2,593.9 2,563.7 2,611.4 2,561.9 Coconut 3,562.0 3,574.6 3,551.3 3,502.0 3,517.7 Sugarcane 439.7 433.3 437.1 432.0 421.3 Banana 450.1 454.3 446.0 442.8 443.4 Pineapple 58.5 58.5 60.8 61.6 62.8 Coffee 119.6 120.0 116.5 117.5 113.7 Mango 187.1 188.7 187.9 188.1 188.4 Tobacco 32.2 34.0 34.5 36.1 33.1 Abaca 139.0 138.5 138.4 134.8 134.2 Peanut 26.9 26.1 25.6 25.0 24.6 Mongo 45.3 44.4 43.6 43.0 41.4 Cassava 221.2 217.3 217.1 216.8 223.0 Camote 103.7 101.1 94.8 89.0 85.8 Tomato 17.6 17.3 17.2 16.7 16.2 Garl ic 2.8 2.7 2.5 2.6 2.7 Onion 14.6 15.0 15.4 15.8 14.9 Cabbage 8.6 8.5 8.4 8.3 8.2 Eggplant 21.4 21.5 21.2 21.2 21.0 Ca lamans i 21.1 20.8 20.3 20.1 20.0 Rubber 161.6 176.2 185.5 217.7 222.6 Others 416.9 418.0 412.4 412.0 R 415.9
1/ Area planted for permanent crops and area harvested for temporary crops.
Note: 2011 data excluded Batanes.
PHILIPPINES, 2011-2015
('000 has)
Table 2.2 CROPS: AREA PLANTED/HARVESTED, 1/

PHILIPPINE STATISTICS AUTHORITY
12
ITEM 2011 2012 2013 2014 2015
TOTAL 802,720.5 797,109.4 814,630.2R 927,308.6R 856,025.1
Palay 254,265.2 292,127.0 314,760.9 378,218.5 311,088.4 Corn 87,698.1 94,143.9 90,150.5 100,629.4 92,480.6 Coconut 120,889.8 88,837.2 82,299.3 104,931.6 95,189.3 Sugarcane 56,185.5 42,497.4 40,073.3 41,299.3 42,413.9 Banana 102,556.9 107,584.1 117,158.9 130,696.3 136,531.5 Pineapple 14,334.6 17,455.6 17,480.1 19,730.8 20,945.8 Coffee 6,190.9 6,156.4 5,596.0 5,785.5 5,686.7 Mango 18,598.7 19,540.7 19,201.3 19,356.0 20,393.1 Tobacco 3,008.1 3,483.4 3,827.5 4,333.8 3,725.4 Abaca 2,706.7 2,710.3 2,445.4 2,947.9 3,315.8 Peanut 929.7 994.6 1,028.1 1,073.1 1,176.6 Mongo 1,766.3 1,478.7 1,476.9 1,619.5 1,827.8 Cassava 14,142.0 15,717.8 18,065.9 16,664.1 14,855.8 Camote 5,886.3 6,140.8 6,455.2 7,158.3 7,750.7 Tomato 2,542.7 2,823.9 2,984.2 2,439.7 2,899.4 Garlic 916.4 801.5 311.6R 935.9R 1,040.1 Onion 4,754.7 3,888.1 3,428.5 4,887.8 3,687.6 Cabbage 2,251.8 1,655.4 1,841.8 1,944.2 2,687.5 Eggplant 4,216.0 3,600.0 3,428.6 4,112.1 3,791.1 Calamansi 4,407.0 2,898.0 2,440.0 2,890.1 2,461.2 Rubber 30,667.4 21,609.1 17,605.6 11,412.6 8,181.8 Others 63,805.9 60,965.5 62,570.7R 64,241.9R 73,894.9
(million pesos, at current prices)
Table 2.3 CROPS: VALUE OF PRODUCTION, PHILIPPINES, 2011-2015

PHILIPPINE STATISTICS AUTHORITY
13
SELECTED STATISTICS ON AGRICULTURE 2016
PHILIPPINES ('000 mt) 18,149.84 7,518.76 14,735.19 22,926.44
LUZON (%) 59.02 43.03 24.35 14.46 CAR 2.21 3.16 0.01 0.23 Ilocos Region 9.79 6.53 0.27 0.09 Cagayan Valley 13.72 23.96 0.52 2.55 Central Luzon 18.21 3.61 1.14 2.96 CALABARZON 2.16 0.86 9.36 7.60 MIMAROPA 5.96 1.67 5.55 0.00 Bicol Region 6.97 3.24 7.50 1.04
VISAYAS (%) 18.45 7.87 13.63 67.80 Western Visayas 11.33 4.66 2.79 58.54 Central Visayas 1.85 2.00 2.93 8.48 Eastern Visayas 5.27 1.21 7.91 0.78
MINDANAO (%) 22.53 49.10 62.01 17.74 Zamboanga Peninsula 3.65 2.93 11.42 a/ Northern Mindanao 4.00 16.18 12.57 13.37 Davao Region 2.43 2.98 15.24 0.91 SOCCSKSARGEN 7.12 16.48 7.87 2.97 Caraga 2.65 1.58 5.46 a/ ARMM 2.69 8.95 9.45 0.49
Table 2.4 MAJOR CROPS: PERCENTAGE DISTRIBUTION OF
REGION
PRODUCTION BY REGION, PHILIPPINES, 2015
SUGAR-
CANEPALAY CORN
COCO-
NUT
PHILIPPINE STATISTICS AUTHORITY
14
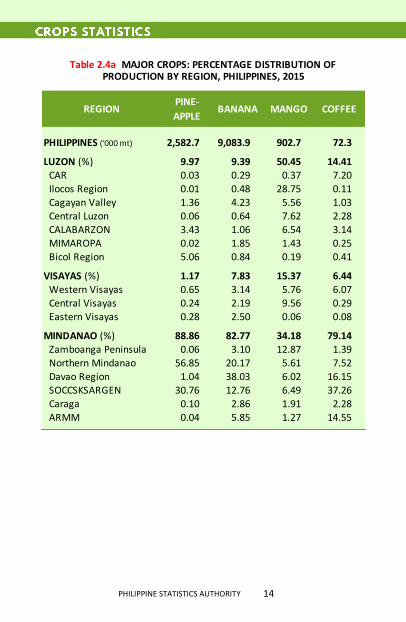
PHILIPPINES ('000 mt) 2,582.7 9,083.9 902.7 72.3
LUZON (%) 9.97 9.39 50.45 14.41 CAR 0.03 0.29 0.37 7.20 Ilocos Region 0.01 0.48 28.75 0.11 Cagayan Valley 1.36 4.23 5.56 1.03 Central Luzon 0.06 0.64 7.62 2.28 CALABARZON 3.43 1.06 6.54 3.14 MIMAROPA 0.02 1.85 1.43 0.25 Bicol Region 5.06 0.84 0.19 0.41
VISAYAS (%) 1.17 7.83 15.37 6.44 Western Visayas 0.65 3.14 5.76 6.07 Central Visayas 0.24 2.19 9.56 0.29 Eastern Visayas 0.28 2.50 0.06 0.08
MINDANAO (%) 88.86 82.77 34.18 79.14 Zamboanga Peninsula 0.06 3.10 12.87 1.39 Northern Mindanao 56.85 20.17 5.61 7.52
Davao Region 1.04 38.03 6.02 16.15 SOCCSKSARGEN 30.76 12.76 6.49 37.26 Caraga 0.10 2.86 1.91 2.28 ARMM 0.04 5.85 1.27 14.55
REGIONPINE-
APPLECOFFEEMANGOBANANA
Table 2.4a MAJOR CROPS: PERCENTAGE DISTRIBUTION OFPRODUCTION BY REGION, PHILIPPINES, 2015

PHILIPPINE STATISTICS AUTHORITY
15
SELECTED STATISTICS ON AGRICULTURE 2016
ITEM 2011 2012 2013 2014 2015
PRODUCTION (million mt)
TOTAL 16.68 18.03 18.44 18.97 18.15Irrigated 12.36 13.40 13.82 14.41 13.94Rainfed 4.33 4.64 4.62 4.56 4.21
JANUARY-JUNE 7.58 7.89 8.00 8.38 8.32Irrigated 6.15 6.37 6.56 6.87 6.92Rainfed 1.43 1.52 1.43 1.51 1.40
JULY-DECEMBER 9.11 10.14 10.44 10.59 9.83Irrigated 6.21 7.02 7.26 7.54 7.02Rainfed 2.90 3.12 3.18 3.05 2.81
AREA HARVESTED (million ha)
TOTAL 4.54 4.69 4.75 4.74 4.66Irrigated 3.07 3.16 3.24 3.25 3.23Rainfed 1.46 1.53 1.51 1.49 1.42
JANUARY-JUNE 1.99 2.04 2.04 2.10 2.06Irrigated 1.48 1.49 1.53 1.54 1.53Rainfed 0.52 0.55 0.52 0.56 0.53
JULY-DECEMBER 2.54 2.65 2.70 2.64 2.59Irrigated 1.60 1.67 1.71 1.72 1.70Rainfed 0.95 0.98 0.99 0.92 0.89
YIELD PER HECTARE (mt)
TOTAL 3.68 3.84 3.89 4.00 3.90Irrigated 4.02 4.24 4.27 4.43 4.31Rainfed 2.95 3.04 3.06 3.07 2.96
JANUARY-JUNE 3.80 3.88 3.91 3.99 4.04Irrigated 4.17 4.28 4.30 4.47 4.51Rainfed 2.76 2.78 2.77 2.69 2.65
JULY-DECEMBER 3.58 3.82 3.86 4.01 3.79Irrigated 3.89 4.20 4.24 4.39 4.13Rainfed 3.06 3.18 3.21 3.30 3.14
Table 2.5 PALAY: PRODUCTION, AREA HARVESTED AND YIELD PERHECTARE, BY ECOSYSTEM, BY SEMESTER, PHILIPPINES, 2011-2015

PHILIPPINE STATISTICS AUTHORITY
Figure 1. Palay: Production and Yield per Hectare, Philippines, 2006-2015
16
PHILIPPINE STATISTICS AUTHORITY
17
SELECTED STATISTICS ON AGRICULTURE 2016
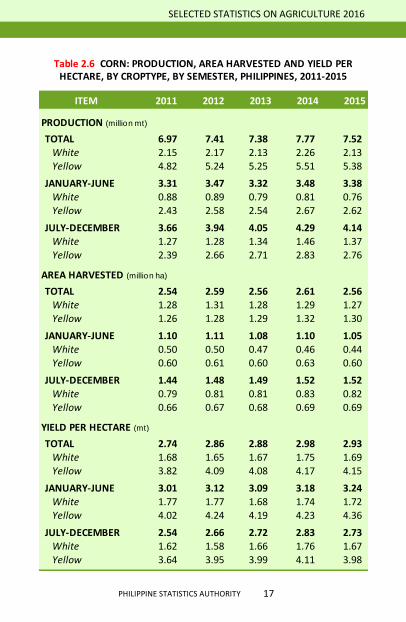
ITEM 2011 2012 2013 2014 2015
PRODUCTION (million mt)
TOTAL 6.97 7.41 7.38 7.77 7.52 White 2.15 2.17 2.13 2.26 2.13 Yellow 4.82 5.24 5.25 5.51 5.38
JANUARY-JUNE 3.31 3.47 3.32 3.48 3.38 White 0.88 0.89 0.79 0.81 0.76 Yellow 2.43 2.58 2.54 2.67 2.62
JULY-DECEMBER 3.66 3.94 4.05 4.29 4.14 White 1.27 1.28 1.34 1.46 1.37 Yellow 2.39 2.66 2.71 2.83 2.76
AREA HARVESTED (million ha)
TOTAL 2.54 2.59 2.56 2.61 2.56 White 1.28 1.31 1.28 1.29 1.27 Yellow 1.26 1.28 1.29 1.32 1.30
JANUARY-JUNE 1.10 1.11 1.08 1.10 1.05 White 0.50 0.50 0.47 0.46 0.44 Yellow 0.60 0.61 0.60 0.63 0.60
JULY-DECEMBER 1.44 1.48 1.49 1.52 1.52 White 0.79 0.81 0.81 0.83 0.82 Yellow 0.66 0.67 0.68 0.69 0.69
YIELD PER HECTARE (mt)
TOTAL 2.74 2.86 2.88 2.98 2.93 White 1.68 1.65 1.67 1.75 1.69 Yellow 3.82 4.09 4.08 4.17 4.15
JANUARY-JUNE 3.01 3.12 3.09 3.18 3.24 White 1.77 1.77 1.68 1.74 1.72 Yellow 4.02 4.24 4.19 4.23 4.36
JULY-DECEMBER 2.54 2.66 2.72 2.83 2.73 White 1.62 1.58 1.66 1.76 1.67 Yellow 3.64 3.95 3.99 4.11 3.98
HECTARE, BY CROPTYPE, BY SEMESTER, PHILIPPINES, 2011-2015Table 2.6 CORN: PRODUCTION, AREA HARVESTED AND YIELD PER
PHILIPPINE STATISTICS AUTHORITY
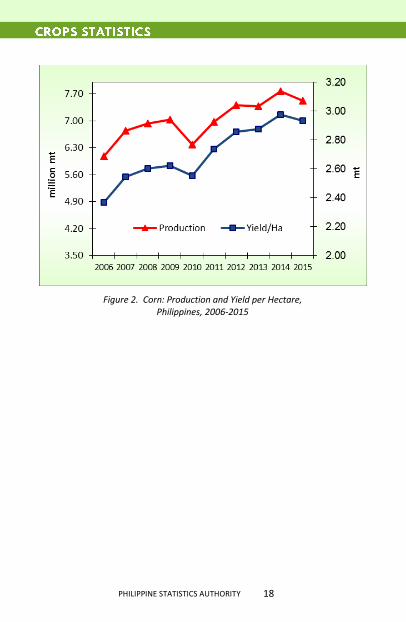
Figure 2. Corn: Production and Yield per Hectare, Philippines, 2006-2015
18

PHILIPPINE STATISTICS AUTHORITY
60

PHILIPPINE STATISTICS AUTHORITY
20
ITEM 2011 2012 2013 2014 2015
LIVESTOCK 212,326.0 214,082.9 233,997.8 247,757.3 251,989.9 (liveweight)
Carabao 10,080.0 9,966.1 10,335.1 10,740.1 11,099.8
Cattle 21,461.8 21,438.5 22,530.0 23,641.6 24,593.9Hog 172,574.7 174,408.8 192,484.2 204,104.9 206,711.0
Goat 7,710.5 7,708.2 8,054.9 8,649.1 8,931.9Dairy 498.9 561.3 593.7 621.5 653.3
POULTRY 158,734.9 168,231.4 177,991.2 R 191,532.5 R 195,246.2 (liveweight)
Chicken 118,320.3 124,878.7 133,177.1 R 144,915.8 R 145,935.4
Duck 2,452.9 2,577.0 2,662.6 2,807.0 2,835.8Chicken
eggs 35,046.8 37,588.9 38,629.0 40,147.6 42,694.6Duck eggs 2,914.9 3,186.8 3,522.6 3,662.0 3,780.4
(million pesos, at current prices)
Table 3.2 LIVESTOCK AND POULTRY: VALUE OF PRODUCTION,BY TYPE, PHILIPPINES, 2011-2015
ITEM 2011 2012 2013 2014 2015
LIVESTOCK (liveweight) 2,438.8 2,464.5 2,507.0 2,532.5 2,627.1
Carabao 147.5 142.7 141.5 143.0 142.0 Cattle 256.3 254.0 258.5 261.3 266.9
Hog 1,940.3 1,973.6 2,012.2 2,032.3 2,120.3 Goat 78.2 75.7 75.4 76.1 77.5
Dairy 16.5 18.5 19.5 19.7 20.4
POULTRY (liveweight) 1,447.4 1,513.3 1,589.5 1,606.4 1,694.8
Chicken 1,414.3 1,479.4 1,555.1 1,571.8 1,660.8 Duck 33.2 33.8 34.5 34.6 33.9
Egg 441.1 460.8 468.8 457.2 487.0
Chicken 403.4 421.1 427.7 415.7 444.6 Duck 37.7 39.7 41.1 41.5 42.4
('000 mt)
BY TYPE, PHILIPPINES, 2011-2015Table 3.1 LIVESTOCK AND POULTRY: VOLUME OF PRODUCTION

PHILIPPINE STATISTICS AUTHORITY
Figure 3a. Livestock: Volume of Production by Type, Philippines, 2006-2015
Figure 3b. Poultry: Volume of Production by Type, Philippines, 2006-2015
21
SELECTED STATISTICS ON AGRICULTURE 2016
PHILIPPINE STATISTICS AUTHORITY
22
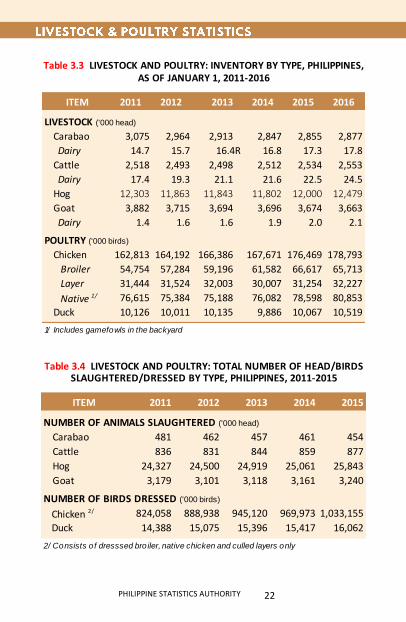
ITEM 2011 2012 2013 2014 2015 2016
LIVESTOCK ('000 head)
Carabao 3,075 2,964 2,913 2,847 2,855 2,877
Dairy 14.7 15.7 16.4R 16.8 17.3 17.8
Cattle 2,518 2,493 2,498 2,512 2,534 2,553
Dairy 17.4 19.3 21.1 21.6 22.5 24.5
Hog 12,303 11,863 11,843 11,802 12,000 12,479
Goat 3,882 3,715 3,694 3,696 3,674 3,663
Dairy 1.4 1.6 1.6 1.9 2.0 2.1
POULTRY ('000 birds)
Chicken 162,813 164,192 166,386 167,671 176,469 178,793
Broiler 54,754 57,284 59,196 61,582 66,617 65,713
Layer 31,444 31,524 32,003 30,007 31,254 32,227
Native 1/ 76,615 75,384 75,188 76,082 78,598 80,853
Duck 10,126 10,011 10,135 9,886 10,067 10,519
1/ Includes gamefowls in the backyard
Table 3.3 LIVESTOCK AND POULTRY: INVENTORY BY TYPE, PHILIPPINES,AS OF JANUARY 1, 2011-2016
ITEM 2011 2012 2013 2014 2015
NUMBER OF ANIMALS SLAUGHTERED ('000 head)
Carabao 481 462 457 461 454
Cattle 836 831 844 859 877
Hog 24,327 24,500 24,919 25,061 25,843
Goat 3,179 3,101 3,118 3,161 3,240
NUMBER OF BIRDS DRESSED ('000 birds)
Chicken 2/ 824,058 888,938 945,120 969,973 1,033,155
Duck 14,388 15,075 15,396 15,417 16,062
2/ Consists o f dresssed bro iler, native chicken and culled layers only
SLAUGHTERED/DRESSED BY TYPE, PHILIPPINES, 2011-2015Table 3.4 LIVESTOCK AND POULTRY: TOTAL NUMBER OF HEAD/BIRDS
PHILIPPINE STATISTICS AUTHORITY
23
SELECTED STATISTICS ON AGRICULTURE 2016
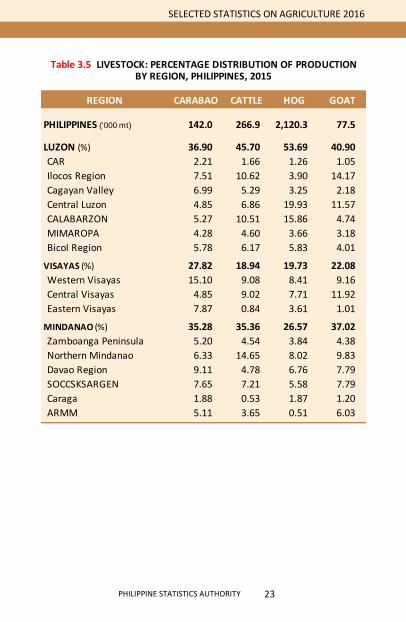
REGION CARABAO CATTLE HOG GOAT
PHILIPPINES ('000 mt) 142.0 266.9 2,120.3 77.5
LUZON (%) 36.90 45.70 53.69 40.90
CAR 2.21 1.66 1.26 1.05
Ilocos Region 7.51 10.62 3.90 14.17
Cagayan Valley 6.99 5.29 3.25 2.18
Central Luzon 4.85 6.86 19.93 11.57
CALABARZON 5.27 10.51 15.86 4.74
MIMAROPA 4.28 4.60 3.66 3.18
Bicol Region 5.78 6.17 5.83 4.01
VISAYAS (%) 27.82 18.94 19.73 22.08
Western Visayas 15.10 9.08 8.41 9.16
Central Visayas 4.85 9.02 7.71 11.92
Eastern Visayas 7.87 0.84 3.61 1.01
MINDANAO (%) 35.28 35.36 26.57 37.02
Zamboanga Peninsula 5.20 4.54 3.84 4.38
Northern Mindanao 6.33 14.65 8.02 9.83
Davao Region 9.11 4.78 6.76 7.79
SOCCSKSARGEN 7.65 7.21 5.58 7.79
Caraga 1.88 0.53 1.87 1.20
ARMM 5.11 3.65 0.51 6.03
BY REGION, PHILIPPINES, 2015Table 3.5 LIVESTOCK: PERCENTAGE DISTRIBUTION OF PRODUCTION
PHILIPPINE STATISTICS AUTHORITY
24
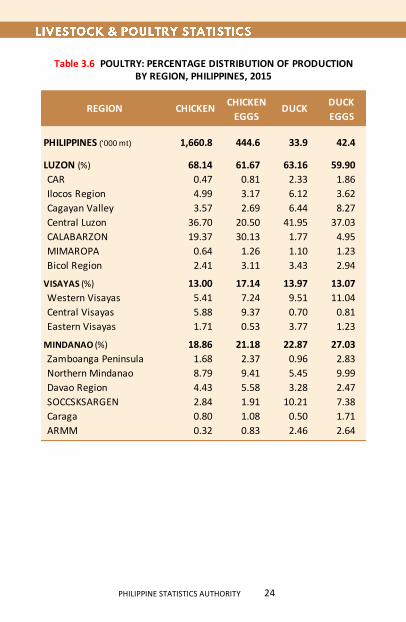
CHICKEN DUCK
EGGS EGGS
PHILIPPINES ('000 mt) 1,660.8 444.6 33.9 42.4
LUZON (%) 68.14 61.67 63.16 59.90
CAR 0.47 0.81 2.33 1.86
Ilocos Region 4.99 3.17 6.12 3.62
Cagayan Valley 3.57 2.69 6.44 8.27
Central Luzon 36.70 20.50 41.95 37.03
CALABARZON 19.37 30.13 1.77 4.95
MIMAROPA 0.64 1.26 1.10 1.23
Bicol Region 2.41 3.11 3.43 2.94
VISAYAS (%) 13.00 17.14 13.97 13.07
Western Visayas 5.41 7.24 9.51 11.04
Central Visayas 5.88 9.37 0.70 0.81
Eastern Visayas 1.71 0.53 3.77 1.23
MINDANAO (%) 18.86 21.18 22.87 27.03
Zamboanga Peninsula 1.68 2.37 0.96 2.83
Northern Mindanao 8.79 9.41 5.45 9.99
Davao Region 4.43 5.58 3.28 2.47
SOCCSKSARGEN 2.84 1.91 10.21 7.38
Caraga 0.80 1.08 0.50 1.71
ARMM 0.32 0.83 2.46 2.64
BY REGION, PHILIPPINES, 2015Table 3.6 POULTRY: PERCENTAGE DISTRIBUTION OF PRODUCTION
CHICKEN DUCKREGION

PHILIPPINE STATISTICS AUTHORITY
60

PHILIPPINE STATISTICS AUTHORITY
26
ITEM 2011 2012 2013 2014 2015
TOTAL 4,973.5 4,865.1 4,705.4 4,689.1 4,649.3
Commercial 1,032.8 1,042.3 1,067.6 1,107.2 1,084.6
Municipal 1,332.6 1,280.8 1,264.4 1,244.3 1,216.5
Marine 1,138.9 1,083.4 1,062.1 1,029.4 1,011.8Inland 193.7 197.4 202.3 214.9 204.7
Aquaculture 2,608.1 2,542.0 2,373.4 2,337.6 2,348.2
Brackishwater Fishpond 1/ 311.1 320.2 327.4 322.7 325.6
Freshwater Fishcage/pen 164.0 165.4 170.5 150.4 155.6
Freshwater Fishpond 2/ 142.9 144.7 148.3 148.9 147.6
Marine Fishcage/pen 105.4 114.3 123.8 125.0 116.8 Others 1,884.7 1,797.4 1,603.4 1,590.6 1,602.6
Oyster 21.5 20.6 22.1 22.3 20.3
Mussel 22.4 25.7 22.9 18.8 15.9 Seaweed 1,840.8 1,751.1 1,558.4 1,549.5 1,566.4
1/ Includes brackishwater pen/cage
2/ Includes small farm reservoir and rice fish
('000 mt)
Table 4.1 FISHERIES: VOLUME OF PRODUCTION, PHILIPPINES, 2011-2015
ITEM 2011 2012 2013 2014 2015
TOTAL 224,695.0 237,711.4 244,551.7 241,943.8 239,702.4
Commercial 58,623.0 65,894.2 69,922.5 66,189.8 64,875.3
Municipal 80,075.6 79,527.3 80,898.0 81,805.0 81,486.2
Marine 72,028.1 70,982.7 71,909.3 71,925.1 71,718.0Inland 8,047.5 8,544.6 8,988.7 9,879.9 9,768.2
Aquaculture 85,996.4 92,289.9 93,731.2 93,949.0 93,340.9
Table 4.2 FISHERIES: VALUE OF PRODUCTION, PHILIPPINES, 2011-2015
(million pesos, at current prices)
PHILIPPINE STATISTICS AUTHORITY
27
SELECTED STATISTICS ON AGRICULTURE 2016
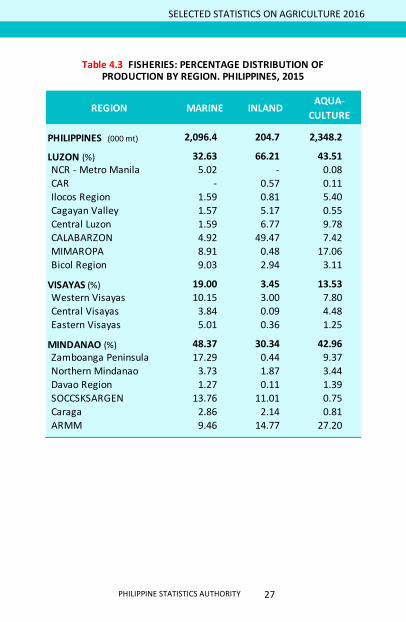
REGION MARINE INLAND AQUA-
CULTURE
PHILIPPINES (000 mt) 2,096.4 204.7 2,348.2
LUZON (%) 32.63 66.21 43.51NCR - Metro Manila 5.02 - 0.08CAR - 0.57 0.11Ilocos Region 1.59 0.81 5.40Cagayan Valley 1.57 5.17 0.55Central Luzon 1.59 6.77 9.78CALABARZON 4.92 49.47 7.42MIMAROPA 8.91 0.48 17.06Bicol Region 9.03 2.94 3.11
VISAYAS (%) 19.00 3.45 13.53Western Visayas 10.15 3.00 7.80Central Visayas 3.84 0.09 4.48Eastern Visayas 5.01 0.36 1.25
MINDANAO (%) 48.37 30.34 42.96Zamboanga Peninsula 17.29 0.44 9.37
Northern Mindanao 3.73 1.87 3.44Davao Region 1.27 0.11 1.39SOCCSKSARGEN 13.76 11.01 0.75Caraga 2.86 2.14 0.81ARMM 9.46 14.77 27.20
Table 4.3 FISHERIES: PERCENTAGE DISTRIBUTION OF PRODUCTION BY REGION. PHILIPPINES, 2015

PHILIPPINE STATISTICS AUTHORITY
28
SECTOR/
MAJOR SPECIES
MARINE SPECIES 2,171.8 2,125.7 2,129.7 2,136.6 2,096.4Indian sardines 232.9 246.0 229.2 256.1 290.7Roundscad 239.6 233.5 270.8 260.6 225.1Skipjack 197.4 206.5 212.2 233.9 233.5Yel lowfin tuna 123.0 125.3 130.1 139.9 143.4Frigate tuna 132.6 131.7 134.2 134.1 137.7Fimbriated sardines 98.8 95.5 89.1 93.3 83.8Big-eyed scad 119.2 114.9 117.1 116.4 116.8Indian mackerel 84.3 78.8 85.2 78.2 74.1Anchovies 75.9 71.2 68.4 71.9 64.0Squid 56.8 54.9 57.2 55.7 53.0Sl ipmouth 61.1 57.0 50.8 50.6 48.1Eastern l i ttle tuna 36.4 35.8 36.1 35.5 34.7Indo-paci fic mackerel 55.3 46.6 43.2 39.6 38.9Threadfin bream 48.1 46.3 42.1 38.8 39.2Creval le 37.9 37.8 37.3 35.8 35.3Blue crab 29.3 26.1 26.2 27.2 25.9Caval la 32.2 31.7 29.8 28.0 28.9Flying fi sh 23.2 21.9 20.5 19.4 18.5Siganid 25.7 26.1 28.2 26.4 25.5Snapper 22.3 20.2 20.4 18.5 17.2Bigeye tuna 9.6 12.5 11.8 11.2 10.9Other species 430.2 405.7 389.6 365.5 351.2
AQUACULTURE SPECIES 2,608.1 2,542.0 2,373.4 2,337.6 2,348.2Seaweed 1,840.8 1,751.1 1,558.4 1,549.6 1,566.4Mi lkfish 372.6 386.7 401.1 390.2 384.4 Ti lapia 257.4 260.5 268.8 259.2 261.2Tiger prawn 47.5 48.2 49.5 47.8 49.5Carp 17.3 17.7 18.3 16.8 16.9Oyster 21.5 20.6 22.1 22.4 20.3Mussel 22.4 25.7 22.9 18.8 16.0
Table 4.4 FISHERIES: VOLUME OF PRODUCTION BY MAJOR SPECIES, PHILIPPINES, 2011-2015
('000 mt)
201520122011 2013 2014

PHILIPPINE STATISTICS AUTHORITY
Figure 4. Fisheries: Volume of Production, Philippines, 2006-2015
29
SELECTED STATISTICS ON AGRICULTURE 2016
SECTOR/
MAJOR SPECIES
Mud crab 15.7 16.4 15.8 16.2 16.2 Catfish 3.1 3.6 3.8 3.6 3.6 Other species 9.8 11.5 12.7 13.1 13.7
INLAND SPECIES 193.8 197.4 202.3 214.9 204.7 Sna i l 54.6 55.2 55.2 51.8 50.8
Ti lapia 45.8 47.4 48.9 54.2 50.5 Carp 13.9 14.7 15.4 15.6 14.4 Mudfish 10.7 10.7 10.9 11.2 11.7
Gourami 7.3 6.6 6.8 6.4 5.7 Freshwater goby 5.6 5.4 5.3 5.7 4.0
Freshwater catfish (Hito) 5.5 5.8 6.2 6.2 6.3 Freshwater shrimp 5.1 5.3 5.4 5.4 5.2
Freshwater catfish (Kanduli) 1.9 1.9 1.9 1.8 2.0
Other fi sh species 29.0 29.7 32.8 43.5 42.0 Other crustaceans 5.8 5.4 5.0 5.4 5.2 Other mol luscs 8.6 9.3 8.5 7.7 6.9
('000 mt)
2011 2012 20152013 2014
Table 4.4 FISHERIES: VOLUME OF PRODUCTION …(Continued)
PHILIPPINE STATISTICS AUTHORITY
30
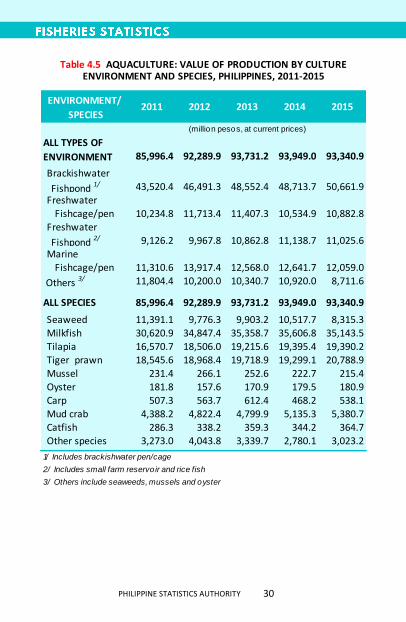
ENVIRONMENT/
SPECIES
ALL TYPES OF
ENVIRONMENT 85,996.4 92,289.9 93,731.2 93,949.0 93,340.9
Brackishwater
Fishpond 1/ 43,520.4 46,491.3 48,552.4 48,713.7 50,661.9Freshwater Fishcage/pen 10,234.8 11,713.4 11,407.3 10,534.9 10,882.8Freshwater
Fishpond 2/ 9,126.2 9,967.8 10,862.8 11,138.7 11,025.6
Marine Fishcage/pen 11,310.6 13,917.4 12,568.0 12,641.7 12,059.0
Others 3/ 11,804.4 10,200.0 10,340.7 10,920.0 8,711.6
ALL SPECIES 85,996.4 92,289.9 93,731.2 93,949.0 93,340.9
Seaweed 11,391.1 9,776.3 9,903.2 10,517.7 8,315.3Milkfish 30,620.9 34,847.4 35,358.7 35,606.8 35,143.5Tilapia 16,570.7 18,506.0 19,215.6 19,395.4 19,390.2Tiger prawn 18,545.6 18,968.4 19,718.9 19,299.1 20,788.9Mussel 231.4 266.1 252.6 222.7 215.4Oyster 181.8 157.6 170.9 179.5 180.9Carp 507.3 563.7 612.4 468.2 538.1Mud crab 4,388.2 4,822.4 4,799.9 5,135.3 5,380.7Catfish 286.3 338.2 359.3 344.2 364.7Other species 3,273.0 4,043.8 3,339.7 2,780.1 3,023.2
1/ Includes brackishwater pen/cage
2/ Includes small farm reservo ir and rice fish
3/ Others include seaweeds, mussels and oyster
Table 4.5 AQUACULTURE: VALUE OF PRODUCTION BY CULTURE ENVIRONMENT AND SPECIES, PHILIPPINES, 2011-2015
(million pesos, at current prices)
201520122011 2013 2014
PHILIPPINE STATISTICS AUTHORITY
60

PHILIPPINE STATISTICS AUTHORITY
32
ITEM DRY WET AVERAGE
Gross Returns 70,307 65,322 67,552Cash Costs 21,172 21,164 21,167Non-Cash Costs 15,065 15,093 15,101Imputed Costs 10,691 11,628 11,202Total Costs 46,928 47,885 47,470Net Returns 23,379 17,437 20,082
Net Profi t-Cost Ratio 0.50 0.36 0.42
Cost Per Ki logram (pesos) 11.63 12.64 12.18
ITEM DRY WET AVERAGE
Gross Returns 78,634 71,167 74,710 Cash Costs 24,057 23,673 23,845 Non-Cash Costs 16,603 16,013 15,968 Imputed Costs 10,829 11,815 11,338 Tota l Costs 51,489 51,501 51,151 Net Returns 27,145 19,666 23,559
Net Profi t-Cost Ratio 0.53 0.38 0.46
Cost Per Ki logram (pesos) 11.41 12.48 11.87
. . . . . . . . . . . . . . . . . . . . . . . . . . . . . . . . . . . . . . . . . . . . . . . . . . . . . . . .
. . . . . . . . . . . . . . . . . . . . . . . . . . . . . . . . . . . . . . . . . . . . . . . . . . . . . . . .
Table 5.1 ALL PALAY: PRODUCTION COSTS AND RETURNS BY SEASON,PHILIPPINES, 2015P
BY SEASON, PHILIPPINES, 2015P
(pesos per hectare)
Table 5.1a IRRIGATED PALAY: PRODUCTION COSTS AND RETURNS
(pesos per hectare)

PHILIPPINE STATISTICS AUTHORITY
33
SELECTED STATISTICS ON AGRICULTURE 2016
ITEM DRY WET AVERAGE
Gross Returns 46,146 54,203 51,297 Cash Costs 14,727 17,051 16,085 Non-Cash Costs 11,026 13,342 12,364 Imputed Costs 10,411 11,318 10,929 Tota l Costs 36,164 41,711 39,378 Net Returns 9,982 12,492 11,919
Net Profi t-Cost Ratio 0.28 0.30 0.30
Cost Per Ki logram (pesos) 13.65 13.27 13.30
ITEM WHITE YELLOW ALL
Gross Returns 22,049 49,794 36,101Cash Costs 6,382 28,182 14,467Non-Cash Costs 1,585 2,735 2,062Imputed Costs 6,537 5,358 5,494Total Costs 14,504 36,275 22,023Net Returns 7,545 13,519 14,078
Net Profi t-Cost Ratio 0.52 0.37 0.64
Cost Per Ki logram (pesos) 8.60 8.73 7.50
RETURNS BY SEASON, PHILIPPINES, 2015P
PHILIPPINES, 2015P
(pesos per hectare)
Table 5.2 CORN: PRODUCTION COSTS AND RETURNS BY TYPE,
(pesos per hectare)
Table 5.1b NON-IRRIGATED PALAY: PRODUCTION COSTS AND
. . . . . . . . . . . . . . . . . . . . . . . . . . . . . . . . . . . . . . . . . . . . . . . . . . . . . . . .
. . . . . . . . . . . . . . . . . . . . . . . . . . . . . . . . . . . . . . . . . . . . . . . . . . . . . . . .
PHILIPPINE STATISTICS AUTHORITY
34
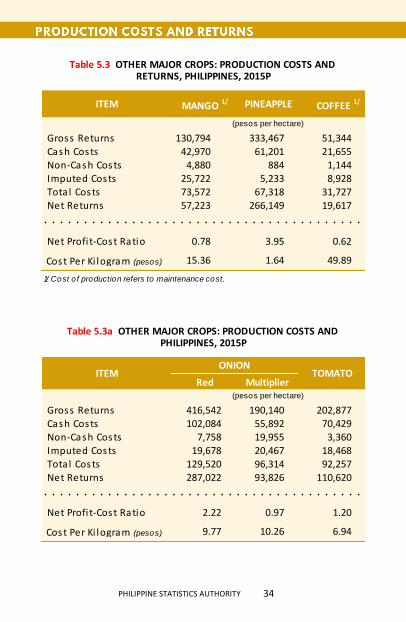
Gross Returns 130,794 333,467 51,344Cash Costs 42,970 61,201 21,655Non-Cash Costs 4,880 884 1,144Imputed Costs 25,722 5,233 8,928Total Costs 73,572 67,318 31,727Net Returns 57,223 266,149 19,617
Net Profi t-Cost Ratio 0.78 3.95 0.62
Cost Per Ki logram (pesos) 15.36 1.64 49.89
1/ Cost o f production refers to maintenance cost.
Red Multiplier
Gross Returns 416,542 190,140 202,877Cash Costs 102,084 55,892 70,429Non-Cash Costs 7,758 19,955 3,360Imputed Costs 19,678 20,467 18,468Total Costs 129,520 96,314 92,257Net Returns 287,022 93,826 110,620
Net Profi t-Cost Ratio 2.22 0.97 1.20
Cost Per Ki logram (pesos) 9.77 10.26 6.94
. . . . . . . . . . . . . . . . . . . . . . . . . . . . . . . . . . . . . . . . . . . . . . . . . . . . . . . .
. . . . . . . . . . . . . . . . . . . . . . . . . . . . . . . . . . . . . . . . . . . . . . . . . . . . . . . .
(pesos per hectare)
PHILIPPINES, 2015P
TOMATO
Table 5.3a OTHER MAJOR CROPS: PRODUCTION COSTS AND
ITEMONION
(pesos per hectare)
PINEAPPLE COFFEE 1/
Table 5.3 OTHER MAJOR CROPS: PRODUCTION COSTS AND RETURNS, PHILIPPINES, 2015P
MANGO 1/ITEM

PHILIPPINE STATISTICS AUTHORITY
60
PHILIPPINE STATISTICS AUTHORITY
36
ITEM 2011 2012 2013 2014 2015P
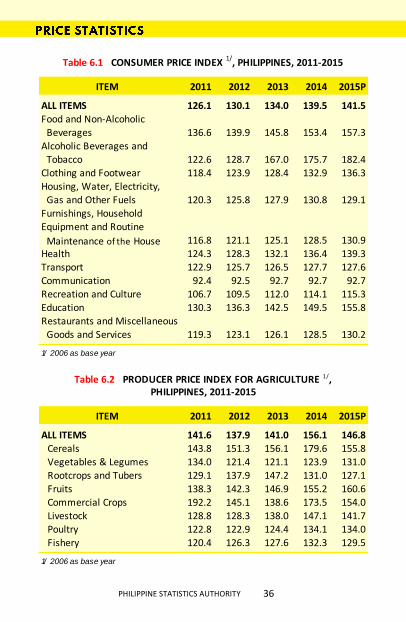
ALL ITEMS 126.1 130.1 134.0 139.5 141.5Food and Non-Alcoholic Beverages 136.6 139.9 145.8 153.4 157.3Alcoholic Beverages and Tobacco 122.6 128.7 167.0 175.7 182.4Clothing and Footwear 118.4 123.9 128.4 132.9 136.3Housing, Water, Electricity, Gas and Other Fuels 120.3 125.8 127.9 130.8 129.1Furnishings, Household Equipment and Routine
Maintenance of the House 116.8 121.1 125.1 128.5 130.9Health 124.3 128.3 132.1 136.4 139.3Transport 122.9 125.7 126.5 127.7 127.6Communication 92.4 92.5 92.7 92.7 92.7Recreation and Culture 106.7 109.5 112.0 114.1 115.3Education 130.3 136.3 142.5 149.5 155.8Restaurants and Miscellaneous Goods and Services 119.3 123.1 126.1 128.5 130.2
1/ 2006 as base year
ITEM 2011 2012 2013 2014 2015P
ALL ITEMS 141.6 137.9 141.0 156.1 146.8 Cereals 143.8 151.3 156.1 179.6 155.8 Vegetables & Legumes 134.0 121.4 121.1 123.9 131.0 Rootcrops and Tubers 129.1 137.9 147.2 131.0 127.1 Fruits 138.3 142.3 146.9 155.2 160.6 Commercial Crops 192.2 145.1 138.6 173.5 154.0 Livestock 128.8 128.3 138.0 147.1 141.7 Poultry 122.8 122.9 124.4 134.1 134.0 Fishery 120.4 126.3 127.6 132.3 129.5
1/ 2006 as base year
Table 6.1 CONSUMER PRICE INDEX 1/
, PHILIPPINES, 2011-2015
Table 6.2 PRODUCER PRICE INDEX FOR AGRICULTURE 1/, PHILIPPINES, 2011-2015

PHILIPPINE STATISTICS AUTHORITY
37
SELECTED STATISTICS ON AGRICULTURE 2016
ITEM 2011 2012 2013 2014 2015P
DOMESTIC PRICE (pesos per kilogram)
PALAY/RICE, Well milled
Farm 15.17 16.22 16.93 20.07 17.33Wholesale 32.06 32.82 34.49 39.51 38.14Retail 34.73 35.30 36.87 42.32 42.04
CORNGRAIN
Corngra in, white
Farm 14.40 13.35 13.81 13.90 13.07Wholesale 16.41 15.53 15.43 14.79 14.08Retail 19.07 19.72 18.97 21.88 23.23
Corngra in, yellow
Farm 11.95 12.42 11.62 12.73 12.01Wholesale 15.13 15.78 15.93 14.31 15.52Retail 19.80 21.51 22.04 20.76 20.70
WORLD PRICE (US dollar per kilogram)
CEREALS Rice
5% brokens 0.54 0.56 0.51 0.42 0.3925% brokens 0.51 0.54 0.47 0.38 0.37
CornYellow 0.29 0.30 0.26 0.19 0.17
Sources: PSA and World Bank
Table 6.3 CEREALS: AVERAGE DOMESTIC AND WORLD PRICES BY TYPE, PHILIPPINES, 2011-2015

PHILIPPINE STATISTICS AUTHORITY
38
ITEM 2011 2012 2013 2014 2015P
COCONUT
Copra (corriente)
Farm 32.53 19.28 15.88 24.67 21.27Wholesale 28.00 16.66 13.16 19.61 17.50
Matured nutsFarm 8.05 5.63 5.30 7.14 6.48Wholesale 18.87 18.44 16.34 17.96 22.59Retail 19.51 18.83 17.62 20.53 20.87
Young nutsFarm 6.71 7.03 6.96 7.93 8.37
COFFEE, dry beans
RobustaFarm 71.71 69.27 67.84 76.10 74.98Wholesale 76.52 - 70.15 - -
ArabicaFarm 69.25 71.14 83.94 82.09 96.21
ExcelsaFarm 56.14 60.68 65.64 68.35 73.99
RUBBER (cup lump)Farm 75.42 50.06 40.35 26.37 20.31
BANANA Bungulan
Farm 7.27 7.80 8.22 9.93 10.22Wholesale 6.72 6.86 7.28 13.28 15.91
LatundanFarm 9.41 9.46 10.12 11.42 11.72Wholesale 16.80 15.80 17.30 22.88 23.02Retail 21.20 21.60 23.50 33.02 33.75
(pesos per kilogram)
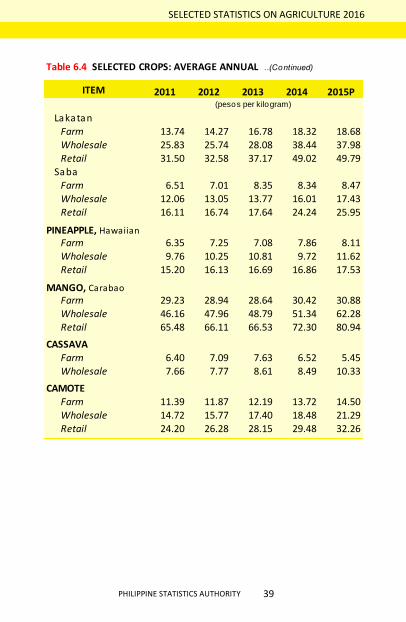
PHILIPPINES, 2011-2015Table 6.4 SELECTED CROPS: AVERAGE ANNUAL PRICES,
PHILIPPINE STATISTICS AUTHORITY
39
SELECTED STATISTICS ON AGRICULTURE 2016
ITEM 2011 2012 2013 2014 2015P
LakatanFarm 13.74 14.27 16.78 18.32 18.68Wholesale 25.83 25.74 28.08 38.44 37.98Retail 31.50 32.58 37.17 49.02 49.79
SabaFarm 6.51 7.01 8.35 8.34 8.47Wholesale 12.06 13.05 13.77 16.01 17.43Retail 16.11 16.74 17.64 24.24 25.95
PINEAPPLE, Hawaiian
Farm 6.35 7.25 7.08 7.86 8.11Wholesale 9.76 10.25 10.81 9.72 11.62Retail 15.20 16.13 16.69 16.86 17.53
MANGO, Carabao
Farm 29.23 28.94 28.64 30.42 30.88Wholesale 46.16 47.96 48.79 51.34 62.28Retail 65.48 66.11 66.53 72.30 80.94
CASSAVAFarm 6.40 7.09 7.63 6.52 5.45Wholesale 7.66 7.77 8.61 8.49 10.33
CAMOTEFarm 11.39 11.87 12.19 13.72 14.50Wholesale 14.72 15.77 17.40 18.48 21.29Retail 24.20 26.28 28.15 29.48 32.26
(pesos per kilogram)
Table 6.4 SELECTED CROPS: AVERAGE ANNUAL …(Continued)
PHILIPPINE STATISTICS AUTHORITY
40
ITEM 2011 2012 2013 2014 2015P
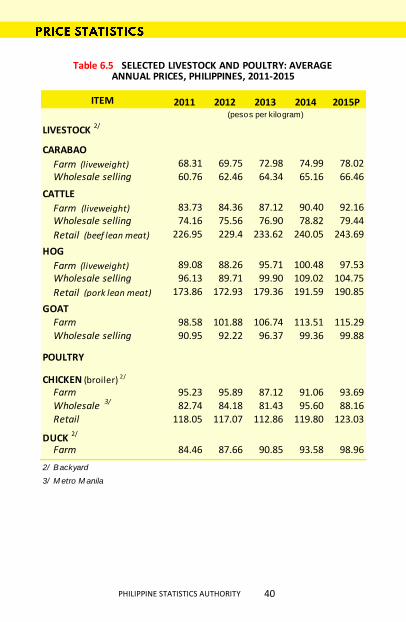
LIVESTOCK 2/
CARABAO
Farm (liveweight) 68.31 69.75 72.98 74.99 78.02Wholesale selling 60.76 62.46 64.34 65.16 66.46
CATTLE
Farm (liveweight) 83.73 84.36 87.12 90.40 92.16Wholesale selling 74.16 75.56 76.90 78.82 79.44
Retail (beef lean meat) 226.95 229.4 233.62 240.05 243.69
HOG
Farm (liveweight) 89.08 88.26 95.71 100.48 97.53Wholesale selling 96.13 89.71 99.90 109.02 104.75
Retail (pork lean meat) 173.86 172.93 179.36 191.59 190.85
GOATFarm 98.58 101.88 106.74 113.51 115.29Wholesale selling 90.95 92.22 96.37 99.36 99.88
POULTRY
CHICKEN (broiler) 2/
Farm 95.23 95.89 87.12 91.06 93.69Wholesale 3/ 82.74 84.18 81.43 95.60 88.16Retail 118.05 117.07 112.86 119.80 123.03
DUCK 2/
Farm 84.46 87.66 90.85 93.58 98.96
2/ Backyard
3/ M etro M anila
(pesos per kilogram)
ANNUAL PRICES, PHILIPPINES, 2011-2015Table 6.5 SELECTED LIVESTOCK AND POULTRY: AVERAGE
PHILIPPINE STATISTICS AUTHORITY
41
SELECTED STATISTICS ON AGRICULTURE 2016
ITEM 2011 2012 2013 2014 2015P
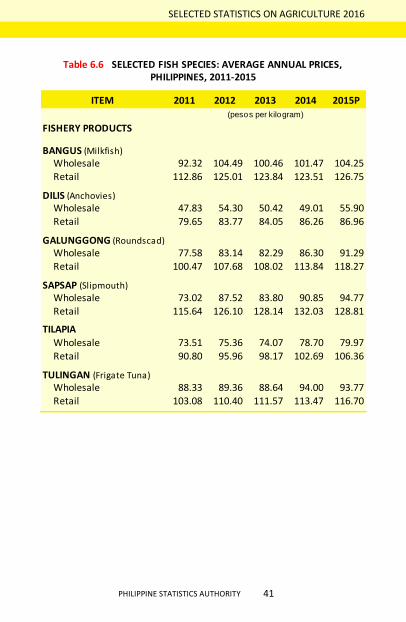
FISHERY PRODUCTS
BANGUS (Milkfish)
Wholesale 92.32 104.49 100.46 101.47 104.25Retail 112.86 125.01 123.84 123.51 126.75
DILIS (Anchovies)
Wholesale 47.83 54.30 50.42 49.01 55.90Retail 79.65 83.77 84.05 86.26 86.96
GALUNGGONG (Roundscad)
Wholesale 77.58 83.14 82.29 86.30 91.29Retail 100.47 107.68 108.02 113.84 118.27
SAPSAP (Slipmouth)
Wholesale 73.02 87.52 83.80 90.85 94.77Retail 115.64 126.10 128.14 132.03 128.81
TILAPIAWholesale 73.51 75.36 74.07 78.70 79.97Retail 90.80 95.96 98.17 102.69 106.36
TULINGAN (Frigate Tuna)
Wholesale 88.33 89.36 88.64 94.00 93.77Retail 103.08 110.40 111.57 113.47 116.70
(pesos per kilogram)
Table 6.6 SELECTED FISH SPECIES: AVERAGE ANNUAL PRICES,PHILIPPINES, 2011-2015
PHILIPPINE STATISTICS AUTHORITY
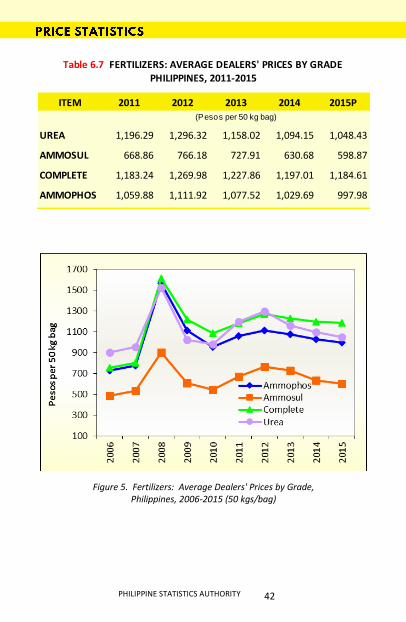
Figure 5. Fertilizers: Average Dealers' Prices by Grade, Philippines, 2006-2015 (50 kgs/bag)
42
ITEM 2011 2012 2013 2014 2015P
UREA 1,196.29 1,296.32 1,158.02 1,094.15 1,048.43
AMMOSUL 668.86 766.18 727.91 630.68 598.87
COMPLETE 1,183.24 1,269.98 1,227.86 1,197.01 1,184.61
AMMOPHOS 1,059.88 1,111.92 1,077.52 1,029.69 997.98
Table 6.7 FERTILIZERS: AVERAGE DEALERS' PRICES BY GRADEPHILIPPINES, 2011-2015
(Pesos per 50 kg bag)
PHILIPPINE STATISTICS AUTHORITY
60

PHILIPPINE STATISTICS AUTHORITY
44
ITEM 2011 2012 2013 2014 2015
VOLUME OF TOP EXPORTS ('000 mt)
Coconut Oil 826.72 884.46 1,080.84 892.30 940.15
Bananas, Fresh 2,055.51 2646.12 3,266.55 3,630.98 1,795.22Pineapple & Products 582.68 742.61 816.64 783.33 713.94Tuna 80.13 61.71 165.76 127.31 104.16Tobacco Manufactured 28.16 15.80 34.96 44.17 28.95Seaweeds & Carageenan 46.13 33.91 55.70 41.58 38.96Desiccated Coconut 108.87 68.58 92.81 84.30 52.02Tobacco Unmanufactured 44.89 15.39 31.60 38.02 32.85Milk & Cream Products 38.19 18.02 11.44 20.68 22.43Copra Oil Cake 314.34 462.07 785.95 515.98 361.26
VALUE OF TOTAL AGRICULTURAL EXPORTS (FOB in M illion US$) 5,431.76 5,037.94 6,400.03 6,542.95 5,131.85
VALUE OF TOP EXPORTS (FOB in million US $)
Coconut Oil 1,425.45 1,041.48 1,005.58 1,220.21 1,168.22
Bananas, Fresh 472.38 646.66 962.58 1,129.89 657.87Pineapple & Products 345.64 414.91 425.38 434.99 574.24Tuna 314.58 455.10 618.62 501.03 350.30Tobacco Manufactured 199.97 157.46 248.02 325.06 207.61Seaweeds & Carageenan 210.78 184.15 218.58 256.65 202.60Desiccated Coconut 286.77 197.00 198.67 254.16 160.05Tobacco Unmanufactured 131.02 76.32 92.34 121.82 101.04Milk & Cream Products 173.52 85.84 41.29 71.10 84.05Copra Oil Cake 58.80 124.61 211.26 112.04 70.42
Table 7.1 TOP AGRICULTURAL EXPORTS: VOLUME AND VALUE, PHILIPPINES, 2011-2015
PHILIPPINE STATISTICS AUTHORITY
45
SELECTED STATISTICS ON AGRICULTURE 2016
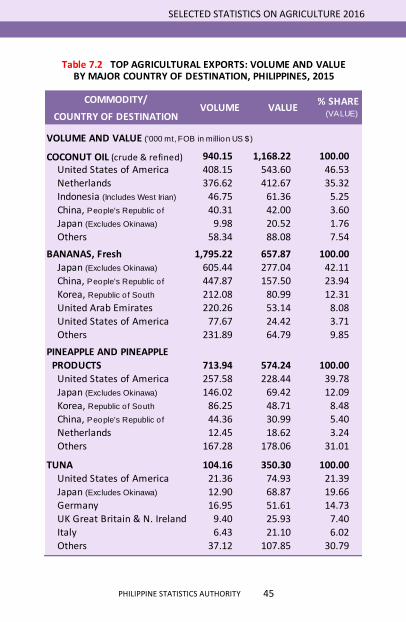
COMMODITY/ % SHARE
COUNTRY OF DESTINATION (VALUE)
VOLUME AND VALUE ('000 mt, FOB in million US $)
COCONUT OIL (crude & refined) 940.15 1,168.22 100.00United States of America 408.15 543.60 46.53Netherlands 376.62 412.67 35.32Indonesia (Includes West Irian) 46.75 61.36 5.25China, People's Republic o f 40.31 42.00 3.60Japan (Excludes Okinawa) 9.98 20.52 1.76Others 58.34 88.08 7.54
BANANAS, Fresh 1,795.22 657.87 100.00Japan (Excludes Okinawa) 605.44 277.04 42.11China, People's Republic o f 447.87 157.50 23.94Korea, Republic o f South 212.08 80.99 12.31United Arab Emirates 220.26 53.14 8.08United States of America 77.67 24.42 3.71Others 231.89 64.79 9.85
PINEAPPLE AND PINEAPPLE PRODUCTS 713.94 574.24 100.00
United States of America 257.58 228.44 39.78Japan (Excludes Okinawa) 146.02 69.42 12.09Korea, Republic o f South 86.25 48.71 8.48China, People's Republic o f 44.36 30.99 5.40Netherlands 12.45 18.62 3.24Others 167.28 178.06 31.01
TUNA 104.16 350.30 100.00United States of America 21.36 74.93 21.39Japan (Excludes Okinawa) 12.90 68.87 19.66Germany 16.95 51.61 14.73UK Great Britain & N. Ireland 9.40 25.93 7.40Italy 6.43 21.10 6.02Others 37.12 107.85 30.79
VALUEVOLUME
Table 7.2 TOP AGRICULTURAL EXPORTS: VOLUME AND VALUEBY MAJOR COUNTRY OF DESTINATION, PHILIPPINES, 2015
PHILIPPINE STATISTICS AUTHORITY
46
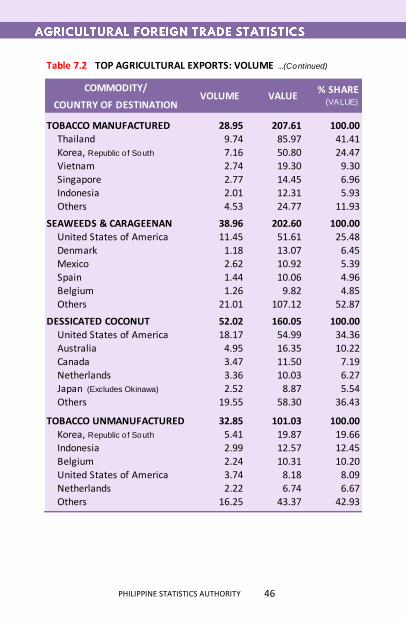
Table 7.2 TOP AGRICULTURAL EXPORTS: VOLUME ...(Continued)
COMMODITY/ % SHARE
COUNTRY OF DESTINATION (VALUE)
TOBACCO MANUFACTURED 28.95 207.61 100.00Thailand 9.74 85.97 41.41Korea, Republic o f South 7.16 50.80 24.47Vietnam 2.74 19.30 9.30Singapore 2.77 14.45 6.96Indonesia 2.01 12.31 5.93Others 4.53 24.77 11.93
SEAWEEDS & CARAGEENAN 38.96 202.60 100.00United States of America 11.45 51.61 25.48Denmark 1.18 13.07 6.45
Mexico 2.62 10.92 5.39Spain 1.44 10.06 4.96Belgium 1.26 9.82 4.85Others 21.01 107.12 52.87
DESSICATED COCONUT 52.02 160.05 100.00United States of America 18.17 54.99 34.36Australia 4.95 16.35 10.22Canada 3.47 11.50 7.19Netherlands 3.36 10.03 6.27Japan (Excludes Okinawa) 2.52 8.87 5.54Others 19.55 58.30 36.43
TOBACCO UNMANUFACTURED 32.85 101.03 100.00Korea, Republic o f South 5.41 19.87 19.66Indonesia 2.99 12.57 12.45Belgium 2.24 10.31 10.20United States of America 3.74 8.18 8.09Netherlands 2.22 6.74 6.67Others 16.25 43.37 42.93
VOLUME VALUE

PHILIPPINE STATISTICS AUTHORITY
47
SELECTED STATISTICS ON AGRICULTURE 2016
Table 7.2 TOP AGRICULTURAL EXPORTS: VOLUME ...(Continued)
COMMODITY/ % SHARE
COUNTRY OF DESTINATION (VALUE)
MILK & CREAM PRODUCTS 22.43 84.05 100.00Malaysia 10.00 36.38 43.29
Thailand 3.91 15.17 18.05South Africa 1.44 6.67 7.94Sri Lanka 0.95 3.69 4.39
Cameroon 0.72 2.95 3.51Others -17.03 -64.86 22.83
COPRA OIL CAKE 361.26 70.42 100.00Korea, Republic o f South 182.91 33.80 47.99
Vietnam 108.03 21.91 31.12India 31.06 6.75 9.58Japan (Excludes Okinawa) 15.51 2.89 4.11
Taiwan 9.47 2.33 3.31Others 14.28 2.74 3.90
VOLUME VALUE
PHILIPPINE STATISTICS AUTHORITY
48
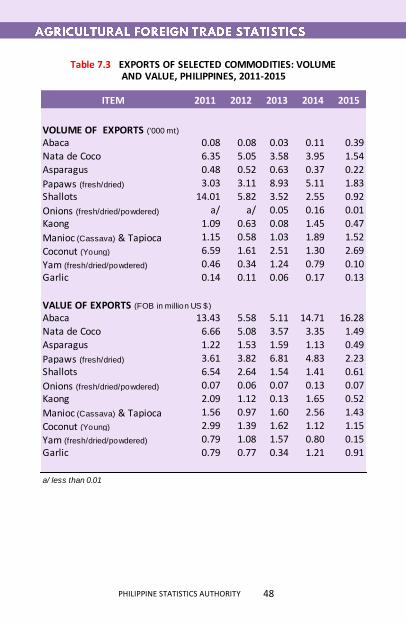
ITEM 2011 2012 2013 2014 2015
VOLUME OF EXPORTS ('000 mt)
Abaca 0.08 0.08 0.03 0.11 0.39Nata de Coco 6.35 5.05 3.58 3.95 1.54Asparagus 0.48 0.52 0.63 0.37 0.22
Papaws (fresh/dried) 3.03 3.11 8.93 5.11 1.83Shallots 14.01 5.82 3.52 2.55 0.92
Onions (fresh/dried/powdered) a/ a/ 0.05 0.16 0.01Kaong 1.09 0.63 0.08 1.45 0.47
Manioc (Cassava) & Tapioca 1.15 0.58 1.03 1.89 1.52
Coconut (Young) 6.59 1.61 2.51 1.30 2.69
Yam (fresh/dried/powdered) 0.46 0.34 1.24 0.79 0.10Garlic 0.14 0.11 0.06 0.17 0.13
VALUE OF EXPORTS (FOB in million US $)
Abaca 13.43 5.58 5.11 14.71 16.28Nata de Coco 6.66 5.08 3.57 3.35 1.49Asparagus 1.22 1.53 1.59 1.13 0.49
Papaws (fresh/dried) 3.61 3.82 6.81 4.83 2.23Shallots 6.54 2.64 1.54 1.41 0.61
Onions (fresh/dried/powdered) 0.07 0.06 0.07 0.13 0.07Kaong 2.09 1.12 0.13 1.65 0.52
Manioc (Cassava) & Tapioca 1.56 0.97 1.60 2.56 1.43
Coconut (Young) 2.99 1.39 1.62 1.12 1.15
Yam (fresh/dried/powdered) 0.79 1.08 1.57 0.80 0.15Garlic 0.79 0.77 0.34 1.21 0.91
a/ less than 0.01
Table 7.3 EXPORTS OF SELECTED COMMODITIES: VOLUME AND VALUE, PHILIPPINES, 2011-2015

PHILIPPINE STATISTICS AUTHORITY
49
SELECTED STATISTICS ON AGRICULTURE 2016
ITEM 2011 2012 2013 2014 2015
VOLUME OF TOP IMPORTS ('000 mt)
Wheat (Including Spelt)
and Meslin 2,787.17 3,000.30 2,472.61 3,095.30 4,770.39Soyabean Oil/Cake Meal 2,068.93 1,455.57 1,513.32 1,991.08 1,954.98Milk & Cream & Products 273.87 282.43 296.00 277.59 350.72Rice 707.67 1,042.14 399.08 1,089.14 1,481.50Meat of Bovine Animals 83.99 82.58 75.44 100.85 103.46Fertilizer Manufactured 889.97 991.04 978.62 1,218.62 1,050.63Coffee 51.61 104.57 90.89 70.68 91.18Urea 577.51 616.03 637.04 773.21 672.08Tobacco Unmanufactured 54.54 52.59 56.32 35.29 50.86Cocoa 31.92 26.06 31.12 37.57 48.48
VALUE OF TOTAL AGRICULTURAL IMPORTS (CIF in million US $) 7,839.93 8,168.33 7,931.14 9,631.24 10,965.76
VALUE OF TOP IMPORTS (CIF in million US $)
Wheat (Including Spelt)
and Meslin 961.62 975.91 868.93 1,030.44 1,319.24Soyabean Oil/Cake Meal 576.62 689.32 758.88 971.14 888.40Milk & Cream & Products 688.79 644.35 751.22 763.34 650.15Rice 393.15 438.08 172.31 453.77 615.70Meat of Bovine Animals 238.87 238.70 235.51 336.34 324.89Fertilizer Manufactured 327.13 385.72 349.64 352.73 319.47Coffee 120.15 251.14 214.62 246.45 298.13Urea 233.92 252.39 221.36 254.28 206.75Tobacco Unmanufactured 154.33 144.59 155.67 134.32 204.27Cocoa 103.37 81.00 83.32 110.78 199.69
Table 7.4 TOP AGRICULTURAL IMPORTS: VOLUME AND VALUE, PHILIPPINES, 2011-2015
PHILIPPINE STATISTICS AUTHORITY
50
ITEM 2011 2012 2013 2014 2015
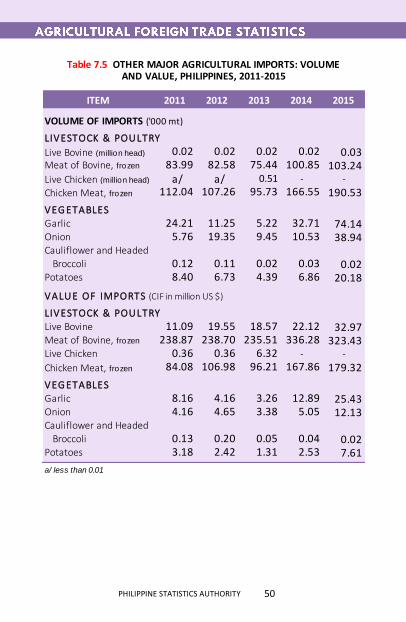
VOLUME OF IMPORTS ('000 mt)
LIV ESTOCK & POU LTRY
Live Bovine (million head) 0.02 0.02 0.02 0.02 0.03Meat of Bovine, frozen 83.99 82.58 75.44 100.85 103.24Live Chicken (million head) a/ a/ 0.51 - -
Chicken Meat, frozen 112.04 107.26 95.73 166.55 190.53
V EG ETABLESGarlic 24.21 11.25 5.22 32.71 74.14Onion 5.76 19.35 9.45 10.53 38.94Cauliflower and Headed Broccoli 0.12 0.11 0.02 0.03 0.02Potatoes 8.40 6.73 4.39 6.86 20.18
V ALU E OF IMPORTS (CIF in million US $)
LIV ESTOCK & POU LTRYLive Bovine 11.09 19.55 18.57 22.12 32.97Meat of Bovine, frozen 238.87 238.70 235.51 336.28 323.43Live Chicken 0.36 0.36 6.32 - -
Chicken Meat, frozen 84.08 106.98 96.21 167.86 179.32
V EG ETABLESGarlic 8.16 4.16 3.26 12.89 25.43Onion 4.16 4.65 3.38 5.05 12.13Cauliflower and Headed Broccoli 0.13 0.20 0.05 0.04 0.02Potatoes 3.18 2.42 1.31 2.53 7.61
a/ less than 0.01
Table 7.5 OTHER MAJOR AGRICULTURAL IMPORTS: VOLUME AND VALUE, PHILIPPINES, 2011-2015
PHILIPPINE STATISTICS AUTHORITY
51
SELECTED STATISTICS ON AGRICULTURE 2016
% SHARE (VALUE)
VOLUME AND VALUE ('000 mt, CIF in million US $)
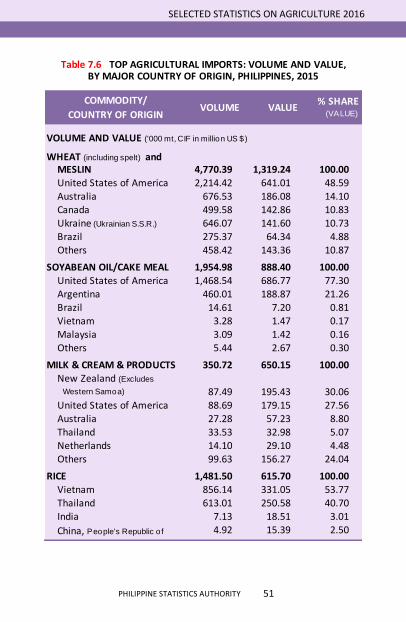
WHEAT (including spelt) andMESLIN 4,770.39 1,319.24 100.00United States of America 2,214.42 641.01 48.59Australia 676.53 186.08 14.10Canada 499.58 142.86 10.83Ukraine (Ukrainian S.S.R.) 646.07 141.60 10.73Brazil 275.37 64.34 4.88Others 458.42 143.36 10.87
SOYABEAN OIL/CAKE MEAL 1,954.98 888.40 100.00United States of America 1,468.54 686.77 77.30Argentina 460.01 188.87 21.26Brazil 14.61 7.20 0.81
Vietnam 3.28 1.47 0.17Malaysia 3.09 1.42 0.16Others 5.44 2.67 0.30
MILK & CREAM & PRODUCTS 350.72 650.15 100.00New Zealand (Excludes
Western Samoa) 87.49 195.43 30.06United States of America 88.69 179.15 27.56Australia 27.28 57.23 8.80Thailand 33.53 32.98 5.07Netherlands 14.10 29.10 4.48Others 99.63 156.27 24.04
RICE 1,481.50 615.70 100.00Vietnam 856.14 331.05 53.77Thailand 613.01 250.58 40.70India 7.13 18.51 3.01
China, People's Republic o f 4.92 15.39 2.50
BY MAJOR COUNTRY OF ORIGIN, PHILIPPINES, 2015
VALUECOMMODITY/
COUNTRY OF ORIGIN
Table 7.6 TOP AGRICULTURAL IMPORTS: VOLUME AND VALUE,
VOLUME

PHILIPPINE STATISTICS AUTHORITY
52
% SHARE (VALUE)
Singapore 0.25 0.10 0.02Others 0.06 0.06 0.01
MEAT OF BOVINE ANIMALS 103.46 324.89 100.00India 42.40 120.58 37.11Australia 24.25 91.76 28.24United States of America 9.54 32.73 10.07Brazil 10.88 30.63 9.43Ireland 8.52 24.39 7.51Others 7.87 24.81 7.64
F ERTILIZ ER MANU F ACTU RED 1,050.63 319.47 100.00
China, People's Republic o f 550.59 159.54 49.94Vietnam 86.75 26.35 8.25Canada 80.52 23.92 7.49Japan (Excludes Okinawa) 130.50 20.18 6.32Korea, Republic o f South 41.40 14.49 4.53Others 160.87 75.00 23.48
COF F EE 91.18 298.13 100.00Indonesia (Includes West Irian) 73.89 224.26 75.22Vietnam 7.68 29.00 9.73
China, People's Republic o f 3.52 19.59 6.57Malaysia (Federation of M alaya) 2.30 15.28 5.13Thailand 2.40 6.71 2.25Others 1.38 3.29 1.10
U REA 672.08 206.75 100.00
China, People's Republic o f 261.53 80.12 38.75Qatar 176.64 54.16 26.20Malaysia (Federation of M alaya) 174.56 53.05 25.66Indonesia (Includes West Irian) 31.92 11.35 5.49Saudi Arabia 27.37 7.99 3.86Others -672.01 -206.66 0.04
Table 7.6 TOP AGRICULTURAL IMPORTS: VOLUME ...(Continued)
COMMODITY/
COUNTRY OF ORIGINVOLUME VALUE
PHILIPPINE STATISTICS AUTHORITY
53
SELECTED STATISTICS ON AGRICULTURE 2016
% SHARE (VALUE)
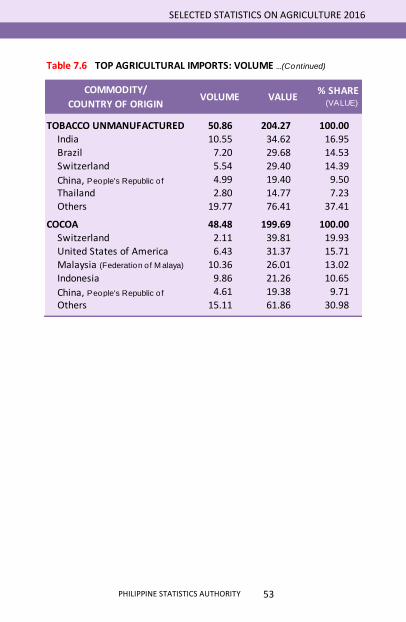
TOBACCO UNMANUFACTURED 50.86 204.27 100.00
India 10.55 34.62 16.95Brazil 7.20 29.68 14.53
Switzerland 5.54 29.40 14.39
China, People's Republic o f 4.99 19.40 9.50
Thailand 2.80 14.77 7.23Others 19.77 76.41 37.41
COCOA 48.48 199.69 100.00Switzerland 2.11 39.81 19.93
United States of America 6.43 31.37 15.71Malaysia (Federation of M alaya) 10.36 26.01 13.02
Indonesia 9.86 21.26 10.65
China, People's Republic o f 4.61 19.38 9.71Others 15.11 61.86 30.98
Table 7.6 TOP AGRICULTURAL IMPORTS: VOLUME ...(Continued)
COMMODITY/
COUNTRY OF ORIGINVOLUME VALUE
PHILIPPINE STATISTICS AUTHORITY
54
ITEM 2011 2012 2013 2014 2015
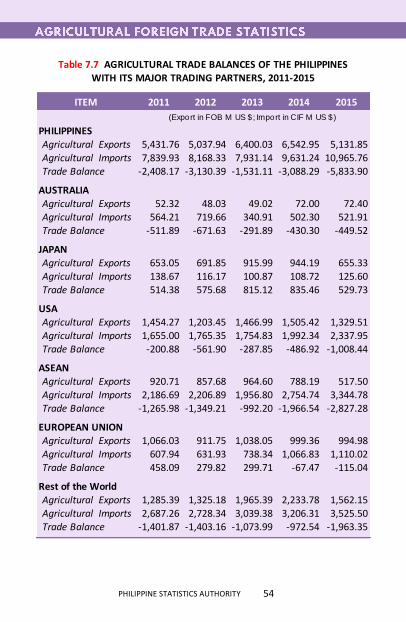
PHILIPPINESAgricultural Exports 5,431.76 5,037.94 6,400.03 6,542.95 5,131.85Agricultural Imports 7,839.93 8,168.33 7,931.14 9,631.24 10,965.76Trade Balance -2,408.17 -3,130.39 -1,531.11 -3,088.29 -5,833.90
AUSTRALIAAgricultural Exports 52.32 48.03 49.02 72.00 72.40Agricultural Imports 564.21 719.66 340.91 502.30 521.91Trade Balance -511.89 -671.63 -291.89 -430.30 -449.52
JAPANAgricultural Exports 653.05 691.85 915.99 944.19 655.33Agricultural Imports 138.67 116.17 100.87 108.72 125.60Trade Balance 514.38 575.68 815.12 835.46 529.73
USAAgricultural Exports 1,454.27 1,203.45 1,466.99 1,505.42 1,329.51Agricultural Imports 1,655.00 1,765.35 1,754.83 1,992.34 2,337.95Trade Balance -200.88 -561.90 -287.85 -486.92 -1,008.44
ASEANAgricultural Exports 920.71 857.68 964.60 788.19 517.50Agricultural Imports 2,186.69 2,206.89 1,956.80 2,754.74 3,344.78Trade Balance -1,265.98 -1,349.21 -992.20 -1,966.54 -2,827.28
EUROPEAN UNIONAgricultural Exports 1,066.03 911.75 1,038.05 999.36 994.98Agricultural Imports 607.94 631.93 738.34 1,066.83 1,110.02Trade Balance 458.09 279.82 299.71 -67.47 -115.04
Rest of the WorldAgricultural Exports 1,285.39 1,325.18 1,965.39 2,233.78 1,562.15Agricultural Imports 2,687.26 2,728.34 3,039.38 3,206.31 3,525.50Trade Balance -1,401.87 -1,403.16 -1,073.99 -972.54 -1,963.35
Table 7.7 AGRICULTURAL TRADE BALANCES OF THE PHILIPPINES
(Export in FOB M US $; Import in CIF M US $)
WITH ITS MAJOR TRADING PARTNERS, 2011-2015
PHILIPPINE STATISTICS AUTHORITY
60

PHILIPPINE STATISTICS AUTHORITY
56
ITEM 2011 2012 2013 2014 2015P
Gross Supply 15,042 15,465 14,981 15,618 16,010Beginning Stock 3,424 2,631 2,524 2,126 2,662Production 10,911 11,793 12,059 12,405 11,870Imports 707 1,041 398 1,087 1,478
Utilization
Exports a/ a/ 2 1 a/Seeds 223 230 233 232 228Feeds & Waste 709 767 784 806 772Processing 436 472 482 496 475Net Food Disposable 11,043 11,472 11,354 11,421 11,336Per Capita NFD
kilograms/year 116.46 118.87 115.63 114.35 112.26grams/day 319.07 325.67 316.79 313.29 307.56
Ending Stock 2,631 2,524 2,126 2,662 3,199
a/ Less than 1 thousand metric ton
ITEM 2011 2012 2013 2014 2015P
Gross Supply 7,190 7,710 7,880 8,515 8,415Beginning Stock 153 166 161 169 184Production 6,971 7,407 7,377 7,771 7,519Imports 66 137 342 575 712
Utilization
Exports a/ a/ a/ 1 a/Seeds 51 52 51 52 51Feeds & Waste 4,531 4,815 4,795 5,051 4,887Processing 930 988 984 1,037 1,003Net Food Disposable 1,512 1,694 1,881 2,190 2,087Per Capita NFD
kilograms/year 15.95 17.55 19.16 21.93 20.67grams/day 43.70 48.08 52.49 60.08 56.63
Ending Stock 166 161 169 184 387
a/ Less than 1 thousand metric ton
('000 mt)
PHILIPPINES, 2011-2015
Table 8.2 CORN: SUPPLY UTILIZATION ACCOUNTS,
Table 8.1 RICE: SUPPLY UTILIZATION ACCOUNTS,
PHILIPPINES, 2011-2015
('000 mt)

PHILIPPINE STATISTICS AUTHORITY
57
SELECTED STATISTICS ON AGRICULTURE 2016
ITEM 2011 2012 2013 2014 2015P
Gross Supply 157,907 164,913 166,336 172,628 172,629Production 157,907 164,913 166,336 172,628 172,629Imports - - - - -
UtilizationExports 2,951 3,065 5,925 5,108 1,834Feeds & Waste 9,297 9,711 9,625 10,051 10,248Net Food Disposable 145,659 152,137 150,786 157,469 160,547Per Capita NFD
kilograms/year 1.54 1.58 1.54 1.58 1.59grams/day 4.22 4.33 4.22 4.33 4.36
ITEM 2011 2012 2013 2014 2015P
Gross Supply 125,309 126,381 127,463 127,986 125,752Production 125,309 126,381 127,463 127,986 125,752Imports - - - - -
UtilizationExports 4 - - - -Seeds 32 32 31 31 30Feeds & Waste 10,024 10,110 10,197 10,239 10,060Net Food Disposable 115,249 116,239 117,235 117,716 115,662Per Capita NFD
kilograms/year 1.22 1.20 1.19 1.18 1.15grams/day 3.34 3.29 3.26 3.23 3.15
Table 8.3 PAPAYA: SUPPLY UTILIZATION ACCOUNTS, PHILIPPINES, 2011-2015
Table 8.4 CABBAGE: SUPPLY UTILIZATION ACCOUNTS,PHILIPPINES, 2011-2015
(mt)
(mt)

PHILIPPINE STATISTICS AUTHORITY
58
ITEM 2011 2012 2013 2014 2015P
Gross Supply 2,215,529 2,223,260 2,377,438 2,550,693 2,710,919
Production 2,209,684 2,223,182 2,361,561 2,540,254 2,710,919
Imports 5,845 78 15,877 10,439 -
Utilization
Exports 1,098 583 1,031 1,744 656
Feeds & Waste 132,581 133,391 141,694 152,415 162,655
Processing 1,860,122 1,867,049 1,996,182 2,141,117 2,276,621
Net Food
Disposable 221,728 222,237 238,531 255,417 270,987
Per Capita NFD
kilograms/year 2.34 2.30 2.43 2.56 2.68
grams/day 6.41 6.30 6.66 7.01 7.34
(mt)
Table 8.5 CASSAVA: SUPPLY UTILIZATION ACCOUNTS, PHILIPPINES, 2011-2015
ITEM 2011 2012 2013 2014 2015P
Gross Supply 57,493 64,543 66,087 60,867 64,371
Production 32,960 32,366 32,422 32,144 33,623
Imports 24,533 32,177 33,665 28,723 30,748
Utilization
Exports 275 77 28 50 b/
Seeds 204 200 196 193 186Feeds & Waste 286 322 330 304 322
Net Food Disposable 56,728 63,944 65,533 60,320 63,863
Per Capita NFDkilograms/year 0.60 0.66 0.67 0.60 0.63
grams/day 1.64 1.81 1.84 1.64 1.73
b/Less than 1 metric ton
PHILIPPINES, 2011-2015Table 8.6 MONGO: SUPPLY UTILIZATION ACCOUNTS,
(mt)
PHILIPPINE STATISTICS AUTHORITY
59
SELECTED STATISTICS ON AGRICULTURE 2016
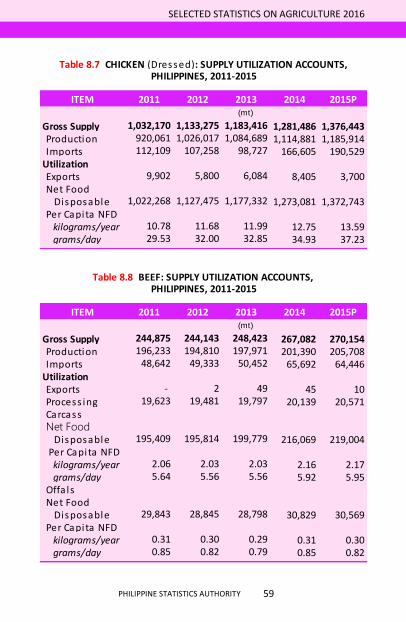
ITEM 2011 2012 2013 2014 2015P
Gross Supply 1,032,170 1,133,275 1,183,416 1,281,486 1,376,443Production 920,061 1,026,017 1,084,689 1,114,881 1,185,914Imports 112,109 107,258 98,727 166,605 190,529
UtilizationExports 9,902 5,800 6,084 8,405 3,700Net Food Disposable 1,022,268 1,127,475 1,177,332 1,273,081 1,372,743Per Capita NFD
kilograms/year 10.78 11.68 11.99 12.75 13.59grams/day 29.53 32.00 32.85 34.93 37.23
ITEM 2011 2012 2013 2014 2015P
Gross Supply 244,875 244,143 248,423 267,082 270,154Production 196,233 194,810 197,971 201,390 205,708Imports 48,642 49,333 50,452 65,692 64,446
UtilizationExports - 2 49 45 10Process ing 19,623 19,481 19,797 20,139 20,571CarcassNet Food Disposable 195,409 195,814 199,779 216,069 219,004 Per Capita NFD
kilograms/year 2.06 2.03 2.03 2.16 2.17grams/day 5.64 5.56 5.56 5.92 5.95
Offa lsNet Food Disposable 29,843 28,845 28,798 30,829 30,569Per Capita NFD
kilograms/year 0.31 0.30 0.29 0.31 0.30grams/day 0.85 0.82 0.79 0.85 0.82
(mt)
(mt)
Table 8.7 CHICKEN (Dressed): SUPPLY UTILIZATION ACCOUNTS, PHILIPPINES, 2011-2015
Table 8.8 BEEF: SUPPLY UTILIZATION ACCOUNTS, PHILIPPINES, 2011-2015

PHILIPPINE STATISTICS AUTHORITY
60
ITEM 2011 2012 2013 2014 2015P
Gross Supply 378,459 392,071 406,241 402,091 392,843Production 378,299 391,330 405,783 401,979 392,738Imports 160 741 458 112 105
UtilizationExports 3,465 2,297 4,121 3,419 3,219Feeds & Waste 11,349 11,740 12,173 12,059 11,782Processing 121,056 125,226 129,851 128,633 125,676Net Food Disposable 242,589 252,808 260,096 257,980 252,166Per Capita NFD kilograms/year 2.56 2.62 2.65 2.58 2.50 grams/day 7.01 7.18 7.26 7.07 6.85
Source: PSA
ITEM 2011 2012 2013 2014 2015P
Gross Supply 303,447 307,975 317,781 313,378 311,727Production 303,170 307,975 317,757 313,378 311,684Imports 277 - 24 - 43
UtilizationExports - 293 5,319 1,957 167Feeds & Waste 9,095 9,239 9,533 9,401 9,351Net Food Disposable 294,352 298,443 302,929 302,020 302,209Per Capita NFD kilograms/year 3.10 3.09 3.08 3.02 2.99 grams/day 8.49 8.47 8.44 8.27 8.19
(mt)
(mt)
Table 8.9 MILKFISH: SUPPLY UTILIZATION ACCOUNTSPHILIPPINES, 2011-2015
Table 8.10 TILAPIA: SUPPLY UTILIZATION ACCOUNTSPHILIPPINES, 2011-2015
PHILIPPINE STATISTICS AUTHORITY
+
SELECTED STATISTICS ON AGRICULTURE 2016 Technical Staff
LISA GRACE S. BERSALES National Statistician and Civil Registrar General
ROMEO S. RECIDE
Deputy National Statistician Sectoral Statistics Office
JOSIE B. PEREZ
Deputy National Statistician Census and Technical Coordination Office
VIVIAN R. ILARINA
Assistant National Statistician Macroeconomic Accounts Service
DULCE A. REGALA
Assistant National Statistician Economic Sector Statistics Service
GENE V. LORICA
Officer-in-Charge, Assistant National Statistician Information Technology and Dissemination Service
Focal Persons Maria Carol G. Duran
Ermina V. Tepora Elizabeth B. Cabrera Reinelda P. Adriano
Elena G. Varona Ma. Julieta P. Soliven
QUIRINO G. SANTOS, JR. Graphic Designer

PHILIPPINE STATISTICS AUTHORITY
PHILIPPINE STATISTICS AUTHORITY PSA-CVEA Building, East Avenue, Diliman,
Quezon City, Philippines 1104 Telefax No.: 462 6600 Local 833
www.psa.gov.ph