The 2013 Annual Homeless Assessment Report (AHAR) to ... · to Congress. PART 2. Estimates of...
109
2013 The U.S. Department of Housing and Urban Development OFFICE OF COMMUNITY PLANNING AND DEVELOPMENT The 2013 Annual Homeless Assessment Report (AHAR) to Congress PART 2 Estimates of Homelessness in the United States October 2014
-
Upload
dinhnguyet -
Category
Documents
-
view
214 -
download
0
Transcript of The 2013 Annual Homeless Assessment Report (AHAR) to ... · to Congress. PART 2. Estimates of...
2013
The U.S. Department of Housing and Urban DevelopmentOFFICE OF COMMUNITY PLANNING AND DEVELOPMENT
The 2013 Annual Homeless Assessment Report (AHAR) to Congress
PART 2
Estimates of Homelessness in the United States
October 2014

Acknowledgements
AUTHORS
Dr. Claudia D. Solari, Dr. Alvaro Cortes, Meghan Henry, Natalie Matthews, and Sean Morris, Abt Associates.
PRINCIPAL INVESTIGATORS
Dr. Jill Khadduri, Abt Associates.Dr. Dennis Culhane, National Center on Homelessness among Veterans, University of Pennsylvania.
DATA MANAGER
Dr. Claudia D. Solari, Abt Associates.
DATA COLLECTORS
Stephanie Althoff, Korrin Bishop, Katherine Buck, David Cooley, Brendan Cox, Karen Cuenca, Tracy DAlanno, RJ delaCruz, Hannah Engle, Zachary Epstein, Nichole Fiore, Theo Gimenez, Jill Hamadyk, Maisha Huq, Andrew Husick, Alex Kats-Rubin, Paul Laskorski, Alyson Lorenz, Natalie Matthews, Annelise Mesler, Sean Morris, Amar Patel, Louise Rothschild, Maureen Sarna, Galen Savidge-Wilkins, Azim Shivji, Theresa Silla, Mark Silverbush, Lisa Tarquinio, Andrew Volkert, Jeff Ward, and Tara Wommack, Abt Associates.Alison Hunt-Johnson, Sophie Wilmot, Meagan Cusack, Tom Byrne, University of Pennsylvania.
PROGRAMMERS
Tom McCall, Will Huguenin, Maisha Huq, and Azim Shivji, Abt Associates.
REVIEWERS
Karen DeBlasio, Marlisa Grogan, Ann Oliva, Michael Roanhouse, and William Snow, The U.S. Department of Housing and Urban Development.Dr. Larry Buron, Abt Associates.Mark Johnston, Consultant.
DESIGN
Cara Capizzi, Abt Associates.
Foreword . . . . . . . . . . . . . . . . . . . . . . . . . . . . . . . . . . . . . . . . . . . . . . . . ii
Key Terms . . . . . . . . . . . . . . . . . . . . . . . . . . . . . . . . . . . . . . . . . . . . . . . . iv
About This ReportTypes of AHAR Estimates and Data Sources: PIT and HMIS . . . . . . . . . . . 3Supplemental Data Sources . . . . . . . . . . . . . . . . . . . . . . . . . . . . . . . . . . . . . . . 5Data Notes . . . . . . . . . . . . . . . . . . . . . . . . . . . . . . . . . . . . . . . . . . . . . . . . . . . . . . 8Putting Data into Perspective . . . . . . . . . . . . . . . . . . . . . . . . . . . . . . . . . . . . . 9How to Use This Report . . . . . . . . . . . . . . . . . . . . . . . . . . . . . . . . . . . . . . . . . . 10
Key Findings . . . . . . . . . . . . . . . . . . . . . . . . . . . . . . . . . . . . . . . . . . . . . 13
Interpretation of the Findings . . . . . . . . . . . . . . . . . . . . . . . . . . . . . . 18
SECTION 1 Homelessness in the United States One-Night Estimates of Homelessness . . . . . . . . . . . . . . . . . . . . . . 1-3
By State . . . . . . . . . . . . . . . . . . . . . . . . . . . . . . . . . . . . . . . . . . . . . . . . . . . . . . . .1-4By State and Sheltered Status . . . . . . . . . . . . . . . . . . . . . . . . . . . . . . . . . . . .1-5
One-Year Estimates of Sheltered Homelessness . . . . . . . . . . . . . . .1-7Characteristics . . . . . . . . . . . . . . . . . . . . . . . . . . . . . . . . . . . . . . . . . . . . . . . . . .1-8Geography . . . . . . . . . . . . . . . . . . . . . . . . . . . . . . . . . . . . . . . . . . . . . . . . . . . . 1-12Patterns of Homeless Service Use . . . . . . . . . . . . . . . . . . . . . . . . . . . . . . . . 1-14Odds of Becoming Part of the Sheltered Homeless Population . . . . . . 1-16
SECTION 2 Homeless Individuals One-Night Estimates of Homeless Individuals . . . . . . . . . . . . . . . . 2-3
By State . . . . . . . . . . . . . . . . . . . . . . . . . . . . . . . . . . . . . . . . . . . . . . . . . . . . . . . .2-4By State and Sheltered Status . . . . . . . . . . . . . . . . . . . . . . . . . . . . . . . . . . . .2-5
One-Year Estimates of Sheltered Homeless Individuals . . . . . . . . .2-7Characteristics . . . . . . . . . . . . . . . . . . . . . . . . . . . . . . . . . . . . . . . . . . . . . . . . . .2-8Geography . . . . . . . . . . . . . . . . . . . . . . . . . . . . . . . . . . . . . . . . . . . . . . . . . . . . 2-12Patterns of Homeless Service Use . . . . . . . . . . . . . . . . . . . . . . . . . . . . . . . . 2-14
SECTION 3 Homeless FamiliesOne-Night Estimates of Homeless Families . . . . . . . . . . . . . . . . . . 3-3
By State . . . . . . . . . . . . . . . . . . . . . . . . . . . . . . . . . . . . . . . . . . . . . . . . . . . . . . . .3-4By State and Sheltered Status . . . . . . . . . . . . . . . . . . . . . . . . . . . . . . . . . . . .3-5
One-Year Estimates of Sheltered Families . . . . . . . . . . . . . . . . . . . 3-7Characteristics . . . . . . . . . . . . . . . . . . . . . . . . . . . . . . . . . . . . . . . . . . . . . . . . . .3-8Geography . . . . . . . . . . . . . . . . . . . . . . . . . . . . . . . . . . . . . . . . . . . . . . . . . . . . 3-12Patterns of Homeless Service Use . . . . . . . . . . . . . . . . . . . . . . . . . . . . . . . . 3-14
SECTION 4 Unaccompanied Homeless Children and YouthOne-Night Estimates of Unaccompanied Homeless Children and Youth . . . . . . . . . . . . . . . . . . . . . . . . . . . . . 4-3
By State and Sheltered Status . . . . . . . . . . . . . . . . . . . . . . . . . . . . . . . . . . . .4-5
SECTION 5 Homeless Veterans One-Night Estimates of Homeless Veterans . . . . . . . . . . . . . . . . . 5-3
By State . . . . . . . . . . . . . . . . . . . . . . . . . . . . . . . . . . . . . . . . . . . . . . . . . . . . . . . .5-4By State and Sheltered Status . . . . . . . . . . . . . . . . . . . . . . . . . . . . . . . . . . . .5-5
One-Year Estimates of Sheltered Veterans . . . . . . . . . . . . . . . . . . . 5-7Characteristics . . . . . . . . . . . . . . . . . . . . . . . . . . . . . . . . . . . . . . . . . . . . . . . . . .5-8Geography . . . . . . . . . . . . . . . . . . . . . . . . . . . . . . . . . . . . . . . . . . . . . . . . . . . . 5-12Patterns of Homeless Service Use . . . . . . . . . . . . . . . . . . . . . . . . . . . . . . . . 5-14
SECTION 6 Chronically Homeless PeopleOne-Night Estimates of Chronic Homelessness . . . . . . . . . . . . . . 6-3
By State . . . . . . . . . . . . . . . . . . . . . . . . . . . . . . . . . . . . . . . . . . . . . . . . . . . . . . . .6-4By State and Sheltered Status . . . . . . . . . . . . . . . . . . . . . . . . . . . . . . . . . . . .6-5
SECTION 7 People Living in Permanent Supportive Housing (PSH)One-Year Estimates of People Living in PSH . . . . . . . . . . . . . . . . . . .7-3
Characteristics . . . . . . . . . . . . . . . . . . . . . . . . . . . . . . . . . . . . . . . . . . . . . . . . .7-4Geography . . . . . . . . . . . . . . . . . . . . . . . . . . . . . . . . . . . . . . . . . . . . . . . . . . . . .7-8Residential Patterns People Living in PSH . . . . . . . . . . . . . . . . . . . . . . . . 7-10Destination at Move-Out for PSH Residents . . . . . . . . . . . . . . . . . . . . . . . 7-12
One-Year Estimates of Veterans Living in PSH . . . . . . . . . . . . . . . . 7-13Characteristics . . . . . . . . . . . . . . . . . . . . . . . . . . . . . . . . . . . . . . . . . . . . . . . . 7-14Residential Patterns Veterans Living in PSH . . . . . . . . . . . . . . . . . . . . . . . 7-16
Summary of Contents

I t is my pleasure to submit to Congress the U.S. Department of Housing and Urban Development’s (HUD) 2013 Annual
Homeless Assessment Report (AHAR) Part 2. The AHAR provides national estimates of homelessness in the United States. Like previous
annual reports, this report is the second part in a two-part series, supplementing the Part 1 report that was published in November 2013. This report augments our understanding of homelessness by providing 1-year, national estimates of people in shelter and in-depth information about their characteristics and service-use patterns.
HUD has released the AHAR each year since 2007, giving policymakers and local service providers the information needed to serve this vulnerable population. At the Federal level, HUD and its partner agencies on the U.S. Interagency Council on Homelessness are using the AHAR to track progress against the goals set forth by Opening Doors: Federal Strategic Plan to Prevent and End Homelessness (2010). At the local level, stakeholders are using the AHAR to inform their policy decisions and benchmark their service systems against the national estimates presented in the report. With the knowledge gained through this report, we are on the path to ending homelessness in the United States.
ii • The 2013 Annual Homeless Assessment Report to Congress
Foreword
The report shows steady reductions in homelessness nationwide. In 2013, the number of people who used shelters during the year declined by 4 percent in the past year and by 11 percent since 2007, when HUD began tracking this information. These reductions are substantial—more than 160,000 fewer people are homeless in shelter than in 2007. The report also shows large declines in the number of unsheltered homeless people on a single night, down by 23 percent since 2007. These reductions are attributable to the hard work of local homeless service providers nationwide. HUD and other Federal agencies have continued to target resources and emphasize evidence-based interventions to support this work. Remarkably, this progress has occurred during challenging economic circumstances in both the labor and housing markets that are now behind us. As the national economy continues to improve, we must remember those Americans with no place to call home and judge our Nation’s prosperity by the number of Americans sleeping in shelters or on the streets.
Ending homelessness as we know it is the ultimate goal. To achieve this goal, we need a continued bipartisan commitment from Congress to break the cycle of homelessness among our most vulnerable citizens and prevent others from falling into homelessness. Congress must maintain its support of practices and program models that are making a measureable difference, moving our citizens out of shelters and off the streets and into stable

housing. We must continue to support experimentation with new program models that create effective and sustainable solutions. Finally, we must continue to press for comprehensive and accurate data that can be harnessed by policymakers and homeless services providers to advance the most effective approaches to ending homelessness.
This report shows significant progress toward ending a social wrong that deprives people of their full potential. Indeed, ending homelessness means more than providing a roof over people’s heads. It is also about restoring people’s dignities, providing families with a place to raise their children, and ensuring that our Nation’s veterans can heal in their own home.
Secretary Julian CastroU.S. Department of Housing and Urban Development
The 2013 Annual Homeless Assessment Report to Congress • iii

Children are people under the age of 18.
Chronically Homeless Individual refers to an individual with a disability who has been continuously homeless for 1 year or more or has experienced at least four episodes of homelessness in the last 3 years.
Chronically Homeless People in Families refers to people in families in which the head of household has a disability, and that has either been continuously homeless for 1 year or more or has experienced at least four episodes of homelessness in the last 3 years.
Continuums of Care (CoC) are local planning bodies responsible for coordinating the full range of homelessness services in a geographic area, which may cover a city, county, metropolitan area, or an entire state.
Emergency Shelter is a facility with the primary purpose of providing temporary shelter for homeless people.
Family refers to a household that has at least one adult and one child. It does not include households composed only of adults or only children.
Homeless Management Information System (HMIS) is a software application designed to record and store client-level information on the characteristics and service needs of homeless people. Each CoC maintains its own HMIS, which can be tailored to meet local needs, but must also conform to HUD’s HMIS Data and Technical Standards.
HMIS Data provide an unduplicated count of people who are homeless in shelter and information about their characteristics and service-use patterns over a one year period of time. These data are entered into each CoC’s HMIS at the client level but are submitted to HUD in aggregate form for the AHAR.
Homeless describes a person who lacks a fixed, regular, and adequate nighttime residence.
Household Type refers to the composition of a household upon entering a shelter program. People enter shelter as either an individual or as part of a family, but can be served as both individuals or family members during the AHAR reporting year. However, the estimates reported in the AHAR adjust for this overlap and thus provide an unduplicated count of homeless people.
Housing Inventory Count (HIC) is produced by each CoC and provides an annual inventory of beds in each CoC.
Individual refers to a person who is not part of a family during their episode of homelessness. They are homeless as single adults, unaccompanied youth, or in multiple-adult or multiple-child households.
Living Arrangement before Entering Shelter refers to the place a person stayed the night before their first homeless episode captured during the AHAR reporting year. For those that were already in shelter at the start of the reporting year, it refers to the place they stayed the night before beginning that current episode of homelessness.
Minority refers to people who self-identify as being a member of any racial or ethnic category other than white and not Hispanic/Latino. This includes African Americans, Asians, Hispanics/Latinos, American Indian, and people of multiple races. This report uses the term “Hispanic” to refer to people who self-identify their ethnicity as Hispanic or Latino.
Multiple Races refers to people who self-identify as more than one race.
One-Year Shelter Count is an unduplicated counts of homeless people who use an emergency shelter or transitional housing program at any time from October through September of the following year. The 1-year count is derived from communities’ administrative databases, or Homeless Management Information Systems, and represent the federal estimates of sheltered homelessness for each year.
Other One Race refers to a person who self-identifies as being one of the following races: Asian, American Indian, Alaska Native, Native Hawaiian, or other Pacific Islander.
Permanent Supportive Housing (PSH) is a program designed to provide housing (project- and tenant-based) and supportive services on a long-term basis to formerly homeless people. McKinney-Vento-funded programs require that the client have a disability for program eligibility, so the majority of people in PSH have disabilities.
People in Families are people who are homeless as part of households that have at least one adult and one child.
iv • The 2013 Annual Homeless Assessment Report to Congress
Key TermsPlease note: Key terms are used for AHAR reporting purposes and accurately reflect the data used in this report. Definitions of these terms may differ in some ways from the definitions found in the McKinney-Vento Homeless Assistance Act and in HUD regulations.

Point-in-Time (PIT) Count is an unduplicated 1-night estimate of both sheltered and unsheltered homeless populations. The 1-night count is conducted according to HUD standards by CoCs nationwide and occur during the last week in January of each year.
Principal City is the largest city in each metropolitan or micropolitan statistical area. Other smaller cities may qualify if specified requirements (population size and employment) are met.
Sheltered Homeless People are people who are staying in emergency shelters or transitional housing programs.
Total U.S. Population refers to people who are housed (including those in group quarters) in the United States, as reported in the American Community Survey (ACS) through the U.S. Census Bureau.
Total U.S. Poverty Population refers to people who are housed in the United States that fall below the national poverty line, as reported by the American Community Survey (ACS) through the U.S. Census Bureau.
Transitional Housing is a type of housing program in which homeless people may stay and receive supportive services for up to 24 months.
Unaccompanied Children are people who are not part of a family or in a multi-child household during their episode of homelessness, and who are under the age of 18.
Unaccompanied Youth are people who are not part of a family during their episode of homelessness and who are between the ages of 18 and 24.
Unduplicated Count of Sheltered Homelessness is an estimate of people in shelter that counts each person only once, even if they enter and exit the shelter system multiple times throughout the year within a CoC.
Unsheltered Homeless People include people whose primary nighttime residence is a public or private place not designated for or ordinarily used as a regular sleeping accommodation for people, such as the streets, vehicles, or parks.
Veteran refers to any person who served on active duty in the armed forces of the United States. This also includes military reserves and National Guard who were called up to active duty.
The 2013 Annual Homeless Assessment Report to Congress • v

Ab
out This R
epo
rt
About This ReportTypes of AHAR Estimates and Data Sources: PIT and HMIS . . . . . . . . . 3
Supplemental Data Sources . . . . . . . . . . . . . . . . . . . . . . . . . . . . . . . . . . . 6
Data Notes . . . . . . . . . . . . . . . . . . . . . . . . . . . . . . . . . . . . . . . . . . . . . . . . 6
Putting Data into Perspective . . . . . . . . . . . . . . . . . . . . . . . . . . . . . . . . . 7
How to Use This Report . . . . . . . . . . . . . . . . . . . . . . . . . . . . . . . . . . . . . . 8
Key Findings . . . . . . . . . . . . . . . . . . . . . . . . . . . . . . . . . . . . . . . . . . . . . . . 9
Interpretation of the Findings . . . . . . . . . . . . . . . . . . . . . . . . . . . . . . . . 13

2 • The 2013 Annual Homeless Assessment Report to Congress
ABOUT THIS REPORT
PIT data estimate the number of people homeless in shelter and on the street on a single night during the year.
HMIS data estimate the number of people homeless in shelter at any time during the year.

The 2013 Annual Homeless Assessment Report to Congress • 3
ABOUT THIS REPORT
Since 2007, the U.S. Department of Housing and Urban Development has released an annual report on the extent of homelessness in the
United States—the Annual Homeless Assessment Report (AHAR). The report documents how many people are using shelter programs for
homeless people, and how many people are in unsheltered locations that are often called “the streets.” The AHAR is submitted each year to
the U.S. Congress, and its contents are used to inform federal, state, and local policies to prevent and end homelessness.
This report is the second part of a two-part series. The first part is
called The 2013 Point-in-Time Estimates of Homelessness: Part 1 of
the 2013 Annual Homeless Assessment Report (AHAR) to Congress
and was published in November 2013. The Part 1 report provides
estimates of homelessness based on the Point-in-Time (PIT) count
data gathered by communities throughout the country on a single
night in January. The estimates are provided at the national-,
state-, and CoC-levels. New to the 2013 AHAR is information on
unaccompanied homeless children and youth and chronically
homeless people in families.
Part 2 of the 2013 AHAR builds on the Part 1 report by adding 1-year
estimates of sheltered homelessness based on data from Homeless
Management Information Systems (HMIS). The HMIS estimates
provide detailed demographic information about people who use the
nation’s shelters during a 12-month period.
Types of AHAR Estimates and Data Sources: PIT Count and HMISThe estimates presented throughout this report are based primarily
on aggregate information submitted by hundreds of communities
nationwide about the homeless people they encounter and serve.
There are two types of estimates: 1-night PIT counts and 1-year
counts based on HMIS data (See Exhibit 1).
PIT CountThe PIT counts offer a snapshot of homelessness—of both sheltered
and unsheltered homeless populations—on a single night. The
1-night counts are conducted CoCs in late January and reported
to HUD as part of their annual applications for McKinney-Vento
funding. In addition to the total counts of homelessness, the PIT
counts provide an estimate of the number of homeless people within
particular subpopulations, such as chronically homeless people and
veterans. Typically, CoCs conduct a PIT count in shelters every year
and a street count every other year (on the odd numbered year). In
2013, all 420 CoCs conducted both sheltered and unsheltered PIT
counts of homeless people.
Communities across the nation typically conduct their PIT counts
during a defined period of time (e.g., dusk to dawn) on a given night
to minimize the risk of counting any person more than once. Many
CoCs also collect identifying information to unduplicate their counts
of unsheltered homeless people.
For the 2013 AHAR Part 1, 420 CoCs in the United States reported
PIT estimates of homeless people in their communities, covering
virtually the entire United States. HUD has standards for conducting
the PIT counts, and CoCs use a variety of approved methods to
produce the counts. Researchers review the data for accuracy and
quality prior to creating the PIT estimates for this report. Pending
HUD approval, the previously reported PIT estimates are subject to
change if communities adjust their counts.

4 • The 2013 Annual Homeless Assessment Report to Congress
ABOUT THIS REPORT
PIT counts are particularly useful because they account for both
sheltered and unsheltered homeless people. However, these counts
enumerate the homeless population on a single night during the year
and thus do not capture changes in homelessness throughout the
year and may over-represent frequent homeless service users, whom
are more likely to be present on the night of the PIT count.
HMISThe 1-year HMIS estimates provide unduplicated counts of homeless
people who use an emergency shelter, transitional housing facility,
or PSH program at any time from October through September of the
following year. These 1-year estimates provide information about
the self-reported demographic characteristics of sheltered homeless
people and their patterns of service use. The 12-month counts
of sheltered homelessness are produced using HMIS data from a
nationally representative sample of communities. Data are collected
separately by shelter type and for individuals, people in families,
and veterans. For the 2013 AHAR, the estimates were derived from
aggregate HMIS data reported by 381 CoCs nationwide, representing
89 percent of all CoCs nationwide. The data are unduplicated,
offering information on 1,167,742 people served by CoCs, and are
weighted to provide a statistically reliable estimate of the total
number of people who access shelter throughout the year (1,422,360
people). Excluded from the HMIS-based estimates are people in
unsheltered locations, in programs targeting victims of domestic
violence, and in Safe Havens.
In combination, the PIT and HMIS estimates provide a
comprehensive picture of homelessness in the United States that
includes counts of people on the street as well as information
on people who use the shelter system. The PIT estimates of
homelessness will be smaller than the annual HMIS estimates
because the PIT count data capture homelessness on a single night,
whereas HMIS estimates capture anyone that enters the shelter
system at any point during the year, including some people that may
have been on the street the night of the PIT count.
Exhibit 2 shows the trends in PIT count and HMIS data since the
first AHAR was released in 2007, and places them in a larger policy
context.
October 1–September 30
OCTOBER
SEPTEMBER
JANUARY HMISPITTYPE OF ESTIMATE
PRIMARY LEVEL OF ANALYSIS
REPORTING PERIOD
POPULATION
1-day count
CoC & state
January
Sheltered &Unsheltered
POPULATION Sheltered
TYPE OF ESTIMATE
PRIMARY LEVEL OF ANALYSIS
REPORTING PERIOD
12-month longitudinal count
Nation
EXHIBIT 1: Comparison of Data SourcesPIT and HMIS

The 2013 Annual Homeless Assessment Report to Congress • 5
ABOUT THIS REPORT
EXHIBIT 2. Policy Context Surrounding Trends in HomelessnessPIT & HMIS 2007-2013
MAY 2008Congress funds and HUD and the VA re-establish the HUD-VA Supportive Housing (HUD-VASH) Program.
2007 20082009
2010
20112012
2013
1,422,360
591,768
1,588,595 1,593,794
643,668
633,616 640,466625,217 622,982
1,558,917
1,593,150
1,502,1961,488,371
One Year Estimateof Sheltered
HomelessnessHMIS Data
One Day Estimateof Total
HomelessnessPIT Data
651,142
AUGUST 2012Release of the Continuum of Care Program Interim Rule.
FEBRUARY 2009President Obama signed the American Recovery and Reinvestment Act of 2009, including $1.5 billion for the Homelessness Prevention and Rapid Re-Housing Program.
MAY 2009President Obama signed the Homeless Emergency Assistance and Rapid Transition to Housing (HEARTH) Act.
SEPTEMBER 2009 Communities begin to use the Homelessness Prevention and Rapid Re-Housing Program funding.
JUNE 2010“Opening Doors: Federal Strategic Plan to Prevent and End Homelessness” is released.
JULY 2011The U.S. Department of Veteran Affairs announces the Supportive Services for Veteran Families program (SSVF).

ABOUT THIS REPORT
6 • The 2013 Annual Homeless Assessment Report to Congress
Supplemental Data SourcesTwo other data sources are used in the 2013 AHAR: Housing
Inventory Count (HIC) data and U.S. Census Bureau’s American
Community Survey (ACS) data. The HIC data provide an inventory
of beds for people who are homeless, and thus describes the nation’s
capacity to house homeless people. Like the PIT count data, the HIC
data are compiled by CoCs and represent the inventory of beds for
people who are homeless on a single night. The HIC data are used in
this report to produce the statistical weights for the national estimates.
ACS data are nationally representative and include people who are
housed, including those housed in group quarters. ACS data are used
to provide a profile of the total U.S. population and U.S. subpopulations,
including households in poverty. The AHAR reports ACS data on
gender, age, ethnicity, race, household size, disability status, and
geographic location to serve as a comparison to the nationally
representative HMIS data. The ACS data come in several forms, and
this report uses the 1-year Public Use Microdata Sample (PUMS) that
correspond most closely to the HMIS data for any given year.
The 2013 AHAR compares the estimate of homelessness with census
data about all people in housing units or group quarters throughout
the U.S. Through this comparison, the report provides a clearer
picture for how homeless people differ from, or are similar to, the
broader population. If one group is more common in the homeless
population than in the general U.S. population, this group is more
vulnerable to fall into homelessness. If a group is less common in the
homeless population than in the general U.S. population, this group is
less vulnerable to fall into homelessness.
This report on homelessness also compares the homeless population
with the U.S. poverty population. People in poverty are the most
vulnerable to become homeless and thus are an interesting
comparison group. Differences between these populations may
highlight subgroups at greatest risk of becoming homeless.
Data NotesData collected as part of CoCs’ PIT counts and HMIS records are
generally self-reported by homeless people. This information may be
collected using a standard survey or intake form. Some information
may require additional supporting documentation if the information
is necessary to establish eligibility for services.
PIT count and HMIS data quality has improved considerably since
HUD began to compile these data. PIT count methodologies have
become more robust, and rates of missing data have declined. HMIS
bed-coverage rates have increased sharply over time, resulting in
more reliable estimates of homelessness.
Throughout this report, information in the narrative may not be
reflected in the corresponding tables. For example, the report uses
the supplemental data sources to inform the narrative. Also, the
tables present the percentage of homeless people within a particular
category, and rather than present the percentage-point change across
the years, the narrative highlights the percentage change.
The supporting 2013 HMIS data used to produce the tabulations in
the report can be downloaded from HUD’s Resource Exchange at
http://www.hudexchange.info/.
Those tables are:
1. 2013 AHAR HMIS Estimates of Homelessness.xlsx
2. 2013 AHAR HMIS Estimates of Homeless Veterans.xlsx
3. 2013 AHAR_HMIS Estimates of People in PSH.xlsx
4. 2013 AHAR_HMIS Estimates of Veterans in PSH.xlsx
The AHAR estimation methodology and underlying assumptions
for the information presented in this report are consistent with
past reports, thus making data comparable over time and across
AHAR reports. For more details, the 2013 AHAR Data Collection
and Analysis Methodology can be downloaded from:
http://www.hudexchange.info/.

ABOUT THIS REPORT
The 2013 Annual Homeless Assessment Report to Congress • 7
Putting Data into PerspectiveFor more than a decade, HUD has supported local efforts to collect
information about people experiencing homelessness. Together,
the PIT count and HMIS data present a detailed picture of who
is experiencing homelessness in emergency shelter, transitional
housing, or in unsheltered locations, what their demographic
characteristics are, and how they utilize residential services available
for homeless people.
HUD and its federal partners use many other data sources to get a
full picture of homelessness and housing instability, including data
collected and reported by other federal agencies as well as national
and local studies and evaluations. Each of these data sources
provides an important perspective on homelessness. For example,
the American Housing Survey (AHS) estimates the number of people
who are living in overcrowded situations or living with other people
temporarily, the Department of Education collects and reports data on
the extent of children experiencing homelessness including doubled-
up situations, and Department of Veterans Affairs data provides
crucial information about veterans experiencing homelessness that is
not captured in the PIT count.
Federal agencies use data to inform a broad set of policy solutions
across many different programs to meet the goals of ending
homelessness set forth in Opening Doors. Ending homelessness
cannot rely solely on programs that are targeted to persons
experiencing homelessness. HUD and its federal partners recognize
that homelessness, housing affordability, health care, service
needs, and employment are closely linked, and the mainstream
programs that address these needs have a substantial role in ending
homelessness.
Targeted Homeless Programs (e.g. Continuum of Care,
Emergency Solutions Grants,Runaway and Homeless Youth,
Department of Ed,HUD-VASH, SSVF)
Mainstream Programs(e.g. Housing Choice Vouchers,
Medicaid, TANF,Workforce Investment Act,
Head Start)
PIT Counts
HMIS Data
American Housing Survey
Program Data (HUD, ED, HHS, VA, etc.)
Local Data
Federal Agencies
Local Stakeholders, including State and Local Agencies, CoCs, Providers, and otherCommunity Stakeholders
Federal agencies and local stakeholders use many data sources to measure homelessness and housing instability to inform policies for targeted and mainstream programs that serve persons experiencing homelessness.

8 • The 2013 Annual Homeless Assessment Report to Congress
ABOUT THIS REPORT
How to Use this ReportThe 2013 AHAR Part 2 is intended to serve as a data reference guide.
It is divided into seven sections, by each subpopulation of interest:
1. All homeless people,
2. Homeless individuals,
3. Homeless people in families,
4. Unaccompanied children and youth,
5. Homeless veterans,
6. Chronically homeless people, and
7. Formerly homeless people in permanent supportive housing
(PSH).
The sections begin with a summary of the PIT count data and a state-
level analysis. The HMIS data follow, with information on the gender,
age, ethnicity, race, household size, disability status, geographic
location, characteristics by geography, living situation before entering
shelter, length of shelter stay, and bed-use patterns for each section.
HMIS data are not available for unaccompanied children and youth or
chronically homeless people. The section on people in PSH is based
only on HMIS data.
This report is intended for several audiences: Members of Congress,
staff at local service providers and CoCs, researchers, policy-makers,
and advocates. These audiences may have various reasons for
reading this report, but all audiences can find answers to questions
that can be useful to them. For example:
At the national level, Congress and policymakers can mark the
progress on the nation’s Opening Doors initiative to prevent and
end homelessness. Key stakeholders can also identify what sub-
populations require more attention in this effort or which groups are
improving at a slower rate than others.
At the state level, policymakers and state-level CoCs can determine
how they compare to the 50 U.S. states and the District of Columbia
on a range of important measures. The report shows which states
experienced substantial changes in their homeless populations
compared to other states, and these comparisons can foster
collaborations and propel efforts towards ending homelessness.
At the local level, community leaders and local service providers
can determine how their community compares to the nation.
This comparison can highlight ways in which the community’s
homeless population is similar or different from the national profile of
homelessness.
This report can address many questions that may be of interest
across all audiences. Some sample questions include:
1. How many people are homeless in the U.S. in any given year?
How has this changed over time?
2. Are women more likely to become homeless than men? How
many people are homeless as individuals, and how many are
homeless in families with children?
3. How many children are homeless in the U.S.?
4. What is the race and ethnicity of people who are homeless in
the U.S.?
5. What is the rate of disability among people who are homeless?
6. Where do homeless people stay before they enter the shelter
system?
7. How long do people stay in shelter?
8. How many U.S. veterans are homeless? How has that number
changed over time?
9. How many people are chronically homeless in the U.S.?
10. How many people are in a permanent supportive housing
program? Where were they living beforehand? Where did they go
once they left?

The 2013 Annual Homeless Assessment Report to Congress • 9
ABOUT THIS REPORT
Homeless Individuals One-Night Estimates • On a single night in January 2013, 369,571 people were homeless
as individuals in the United States. Over the last six years, the
number of homeless individuals dropped by 11.1 percent, or
46,026 people.
• Declines occurred in both sheltered and unsheltered individual
homelessness, but the largest declines were among those staying
in places not suitable for human habitation.
• In January 2013, 55 percent of homeless individuals were
in sheltered locations and the remaining 45 percent were in
unsheltered locations.
• In January, 2013, almost half of all homeless individuals were
in California, Florida, New York or Texas. California and Florida
together had more than half of all unsheltered individuals in
the U.S.
• In four states—Nevada, Arkansas, California, and Georgia—
homeless individuals represented more than three quarters of all
homeless people in January 2013.
One-Year Estimates• An estimated 943,017 individuals used a shelter program in the
United States in 2013 over the course of a year. The number of
homeless individuals in shelter dropped by 2.7 percent between
2012 and 2013 and by 15.4 percent over a six-year period.
• While still a fairly small share of individuals using shelter, both
the number and share of elderly individuals in shelter continued
to increase between 2012 and 2013.
• Although minorities living in poverty as individuals increased
substantially between 2007 and 2013, minorities in shelter
programs as individuals declined by 11.2 percent over the same
period. The share of sheltered individuals identifying as white
Key FindingsHomelessness in the United States One-Night Estimates • On a single night in January 2013, 591,768 people were homeless
in the United States. This is a 9.1 percent decline from January
2007, representing 59,374 fewer people homeless in 2013.
This change is due to a reduction of the number of people in
unsheltered locations. The number of sheltered homeless people
in 2013 was similar to the number in 2007.
• Together, California and New York have one in three of all
homeless people in the United States in 2013.
• In 2013, at least 90 percent of the homeless population was
living in shelter rather than in unsheltered locations in Delaware,
Maine, Iowa, Massachusetts, New York, Nebraska, Wisconsin,
the District of Columbia, Rhode Island, and Pennsylvania.
One-Year Estimates• In 2013, an estimated 1.42 million people used a shelter program
at some point during the reporting year, representing a 10.5
percent decline since 2007. As the number of homeless people
using shelter during a year dropped, those in shelter were using
it more intensively, with somewhat longer average stays. At
the same time, the share of sheltered homeless people using
transitional housing declined.
• Minorities are among the populations most vulnerable to fall into
homelessness. One in 134 people identifying as minorities and
one in 68 African Americans were homeless in shelter in 2013.
• The share of adults in shelter with a disability increased from 37.1
percent in 2007 to 39.6 percent in 2013.
• Between 2007 and 2013, the number of people using shelter
programs increased 8.5 percent in suburban and rural areas and
declined 16.4 percent in cities, tracking a similar geographic
trend in the U.S. poverty population. The number of people using
shelter programs declined in both types of geography between
2012 and 2013.

10 • The 2013 Annual Homeless Assessment Report to Congress
ABOUT THIS REPORT
and not Hispanic increased from 42.6 to 44.7 percent since 2007.
• The share of sheltered individuals with a disability increased
from 40 percent in 2007 to 44 percent in 2013.
• The number of individuals using shelter programs in suburban
and rural areas was almost unchanged between 2007 and 2013,
but 20 percent fewer individuals used shelters in cities.
Homeless People in FamiliesOne-Night Estimates • On a single night in January 2013, 222,197 people in families
were homeless in 70,960 family households in the United States.
About 36 percent of all homeless people on a single night were in
families.
• Between 2012 and 2013, the number of homeless people in
families dropped by 7.2 percent (17,206 fewer people). The
number of homeless family households dropped by 8 percent
(6,197 fewer households).
• In 2013, 86.2 percent of all people who were homeless in families
were found in shelter programs. More than half of all states and
D.C. had at least 90 percent of their family homeless population in
shelter.
• Since 2007, the number of sheltered people in families on a single
night increased by 7.4 percent, while the number of unsheltered
dropped by 46.5 percent.
• New York and Massachusetts had notable increases in sheltered
homelessness, both between 2012 and 2013 and over the six-year
period between 2007 and 2013. Unsheltered family homelessness
increased substantially over the same period in several states—
California, Georgia, Texas, Nevada, and Oregon.
One-Year Estimates• In 2013, 495,714 people in 156,540 family households used shelter
programs at some point during the reporting year, comprising
34.9 percent of the total sheltered homeless population.
• Between 2012 and 2013, the number of people in families using
shelters dropped by 7.4 percent or by 39,706 people.
• Sheltered family homelessness increased by 19.8 percent (97,793
people) between 2007 and 2010, but has declined by 12.6 percent
(71,620 fewer people) since then.
• In 2013, 20 percent of sheltered adults in families had a disability.
Among all adults in U.S. families, only 8.1 percent have a
disability.
• Between 2007 and 2013, the number of people in families using
shelters in suburban and rural areas increased 29.1 percent, while
people in families using shelters in cities dropped 4.3 percent.
However, between 2012 and 2013, the trend reversed, with
31,608 fewer people in families using suburban and rural shelter
programs and only 3,240 fewer people using shelter programs in
cities.
Unaccompanied Homeless Children and Youth One-Night Estimates • 45,616 homeless children and youth were unaccompanied on a
night in January 2013—86.4 percent were youth and 13.6 percent
were children.
• About half of unaccompanied youth were unsheltered in January
2013, nearly the same rate as individual homeless people
25 and older. Unaccompanied children are more likely than
unaccompanied youth to be unsheltered, with nearly 6 in 10
found in places not suitable for human habitation.
The 2013 Annual Homeless Assessment Report to Congress • 11
ABOUT THIS REPORT
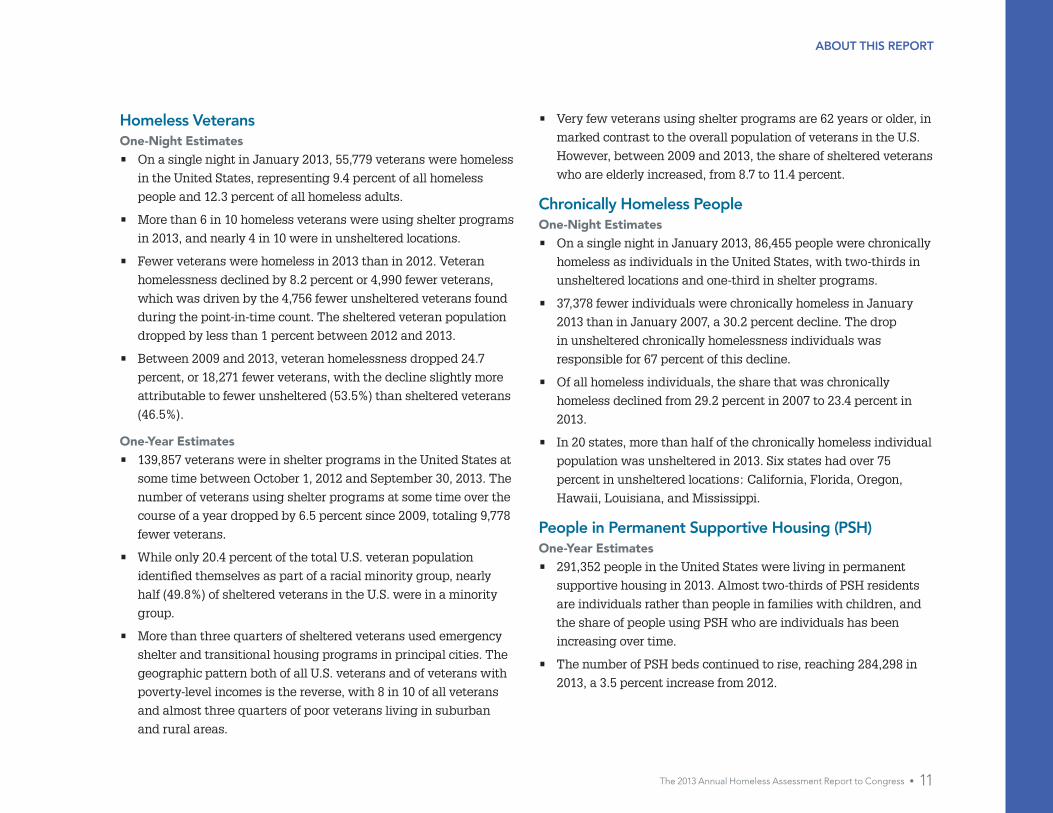
Homeless Veterans One-Night Estimates • On a single night in January 2013, 55,779 veterans were homeless
in the United States, representing 9.4 percent of all homeless
people and 12.3 percent of all homeless adults.
• More than 6 in 10 homeless veterans were using shelter programs
in 2013, and nearly 4 in 10 were in unsheltered locations.
• Fewer veterans were homeless in 2013 than in 2012. Veteran
homelessness declined by 8.2 percent or 4,990 fewer veterans,
which was driven by the 4,756 fewer unsheltered veterans found
during the point-in-time count. The sheltered veteran population
dropped by less than 1 percent between 2012 and 2013.
• Between 2009 and 2013, veteran homelessness dropped 24.7
percent, or 18,271 fewer veterans, with the decline slightly more
attributable to fewer unsheltered (53.5%) than sheltered veterans
(46.5%).
One-Year Estimates• 139,857 veterans were in shelter programs in the United States at
some time between October 1, 2012 and September 30, 2013. The
number of veterans using shelter programs at some time over the
course of a year dropped by 6.5 percent since 2009, totaling 9,778
fewer veterans.
• While only 20.4 percent of the total U.S. veteran population
identified themselves as part of a racial minority group, nearly
half (49.8%) of sheltered veterans in the U.S. were in a minority
group.
• More than three quarters of sheltered veterans used emergency
shelter and transitional housing programs in principal cities. The
geographic pattern both of all U.S. veterans and of veterans with
poverty-level incomes is the reverse, with 8 in 10 of all veterans
and almost three quarters of poor veterans living in suburban
and rural areas.
• Very few veterans using shelter programs are 62 years or older, in
marked contrast to the overall population of veterans in the U.S.
However, between 2009 and 2013, the share of sheltered veterans
who are elderly increased, from 8.7 to 11.4 percent.
Chronically Homeless PeopleOne-Night Estimates • On a single night in January 2013, 86,455 people were chronically
homeless as individuals in the United States, with two-thirds in
unsheltered locations and one-third in shelter programs.
• 37,378 fewer individuals were chronically homeless in January
2013 than in January 2007, a 30.2 percent decline. The drop
in unsheltered chronically homelessness individuals was
responsible for 67 percent of this decline.
• Of all homeless individuals, the share that was chronically
homeless declined from 29.2 percent in 2007 to 23.4 percent in
2013.
• In 20 states, more than half of the chronically homeless individual
population was unsheltered in 2013. Six states had over 75
percent in unsheltered locations: California, Florida, Oregon,
Hawaii, Louisiana, and Mississippi.
People in Permanent Supportive Housing (PSH)One-Year Estimates• 291,352 people in the United States were living in permanent
supportive housing in 2013. Almost two-thirds of PSH residents
are individuals rather than people in families with children, and
the share of people using PSH who are individuals has been
increasing over time.
• The number of PSH beds continued to rise, reaching 284,298 in
2013, a 3.5 percent increase from 2012.
12 • The 2013 Annual Homeless Assessment Report to Congress
ABOUT THIS REPORT
• People are staying longer in PSH over time. The share staying
more than five years rose from 18.3 percent in 2010 to 23.3 percent
in 2013. The share staying a year or less has dropped.
• People in families who moved out of PSH were more likely to
move into another housed situation than were individuals who
exited PSH (79.3% versus 59.3%). A larger share of people in
families who exited PSH to other housing moved into rental
housing than did individuals (65.4% versus 52.6%), while a larger
share of individuals who exited PSH to other housing went to stay
with friends than did people in families (11.7% versus 5.9%).
• The number of veterans using PSH continues to grow, reaching
31,158 in 2013, which does not include many of the veterans
served by the HUD-VASH program.

The 2013 Annual Homeless Assessment Report to Congress • 13
ABOUT THIS REPORT
who would be short-term stayers from entering shelters in the first place. The overall number of emergency shelter and transitional housing beds has stayed the same since 2007; however, there has been a shift in the mix of these beds. During this time, the number of emergency shelter beds increased 18 percent, while, at the same time, the number of transitional housing beds declined by 18 percent as many communities adopt a rapid re-housing approach for helping people leave shelter for permanent housing. The shift to a rapid rehousing approach is further highlighted by the dramatic increase in permanent supportive housing beds, which increased by 51 percent since 2007. Many of these beds have been added to the nation’s inventory in an effort to serve more chronically homeless clients.
People also are staying longer in PSH, which may reflect success in providing residents of PSH with the supportive services they need. A shift in the target population of PSH towards individuals rather than families may also reflect efforts by communities to use this resource for the highest needs people who are most likely to have chronic patterns of homelessness. Communities have just started estimating the numbers of families that have chronic patterns of homelessness, and these estimates confirm that most people with chronic patterns become homeless as individuals.
Demographic patterns among people experiencing homelessness continue to shift moderately. For example, while rates of homelessness remain high among minorities, the overall growth in the U.S. minority populations has far outpaced the number of minorities experiencing homelessness. This trend is likely driven by Hispanics or Latinos in the United States. While the share of Hispanics in the total U.S. population increased from 15 percent in 2007 to 17 percent in 2013, the share of Hispanics in the shelter population dropped from 22 to 16 percent. Also, people homeless as individuals, still predominately men, are both younger and older, with growing portions 25 or younger and 51 or older. The proportion of homeless individuals who are elderly, 62 years or older, continues to increase slightly, both among all individuals and among veterans.
Interpretation of the FindingsThe Annual Homeless Assessment Report (AHAR) is now in its seventh year. With each additional year of data, the report becomes more valuable for understanding patterns of homelessness and for tracking progress in the nation’s efforts to prevent and end homelessness. The 2013 report shows how homelessness in America has changed since the end of the 2008 recession, highlighting patterns that may be reverting back to pre-recession trends or setting new directions in how Americans experience homelessness.
Homelessness is largely an urban phenomenon, particularly among those Americans experiencing homelessness in the nation’s shelter system. Increases in the use of shelters and transitional housing programs in suburban and rural areas between 2007 and 2013 reversed in 2012-2013, with numbers of homeless people at some time during the year declining more in suburban and rural areas than in principal cities. The reversal may suggest that the housing crisis during the recession, especially in suburban and rural areas, has waned and more Americans located in these areas are regaining their housing stability.
Not surprisingly, the most populous states also have the largest numbers of people experiencing homelessness, both sheltered and unsheltered, and some regional patterns have emerged. California, Florida, New York, and Texas continue to account for nearly half of the homeless population in the United States. States with mild climates are less likely to have their homeless populations in shelters when compared to states with colder climates—which may be partly related to weather and partly to hard-to-break forms of encampment homelessness. And some states have large and growing numbers of sheltered homelessness and sizable declines in unsheltered homelessness, probably related to the expansions of their homeless services systems and targeted efforts to reach those staying in unsheltered locations.
The AHAR data show some shifts in the makeup of the homeless services systems in communities across the country. Even after the end of the recession, people are staying longer in shelters, and this may reflect the success of diversion policies in keeping people

14 • The 2013 Annual Homeless Assessment Report to Congress
ABOUT THIS REPORT
While the many American veterans who are elderly are at low risk of becoming homeless overall—since so many are not poor or disadvantaged in other ways—veterans who are at highest risk for homelessness, such as post-Vietnam era veterans, are aging and beginning to enter their sixties.
The 2013 AHAR has a new section that focuses on the nearly 47,000 unaccompanied homeless children and youth. The section shows that unaccompanied children and youth are up to four times more likely to be unsheltered than those in families. Thus, many of the nation’s most vulnerable children and youth experience homelessness in places that are both dangerous and difficult to reach and provide services.
Finally, and most importantly, the 2013 AHAR shows some progress towards ending homelessness, with 12 and 11 percent declines in counts of homeless people on a single night and in people using shelters at some time during the course of a year, respectively. Family homelessness is declining, and very few people who are homeless as members of families are living in unsheltered locations. Chronic homelessness has declined by almost a third since 2007.
Veteran homelessness is declining even as the number of veterans rises overall, with programs for veterans who become homeless showing some success. But much remains to be done—by the federal government, by states, and by the local communities that have the primary responsibility for shaping the nation’s response to homelessness. As shown in the 2013 AHAR, there are 1.4 million people who use shelters throughout the year, and finding a stable and decent home for each person will require a sustained commitment by policymakers at all governmental levels and effective solutions by local practitioners.

1H
om
elessness in the United
States
POINT-IN-TIME (PIT)One-Night Estimates of Homelessness . . . . . . . . . . . . . . . . . . . . . . . . 1-3
By State . . . . . . . . . . . . . . . . . . . . . . . . . . . . . . . . . . . . . . . . . . . . . . . . . . 1-4
By State and Sheltered Status . . . . . . . . . . . . . . . . . . . . . . . . . . . . . . . . 1-5
HOMELESS MANAGEMENT INFORMATION SYSTEM (HMIS)One-Year Estimates of Sheltered Homelessness . . . . . . . . . . . . . . . . . 1-7
Characteristics of Sheltered HomelessnessGender and Age . . . . . . . . . . . . . . . . . . . . . . . . . . . . . . . . . . . . . . . . . . . . . . . . . . . .1-8Ethnicity and Race . . . . . . . . . . . . . . . . . . . . . . . . . . . . . . . . . . . . . . . . . . . . . . . . . . . 1-9Household Size and Disability Status . . . . . . . . . . . . . . . . . . . . . . . . . . . . . . . . . . 1-11
Geography of Sheltered HomelessnessGeographic Location . . . . . . . . . . . . . . . . . . . . . . . . . . . . . . . . . . . . . . . . . . . . . . . 1-12Characteristics by Geography . . . . . . . . . . . . . . . . . . . . . . . . . . . . . . . . . . . . . . . . 1-13
Patterns of Homeless Service Use Among Sheltered HomelessnessLiving Situation Before Entering Shelter . . . . . . . . . . . . . . . . . . . . . . . . . . . . . . . 1-14Length of Stay and Other Bed-Use Patterns . . . . . . . . . . . . . . . . . . . . . . . . . . . 1-15
Odds of Becoming Part of the Sheltered Homeless Population . . . . .1-16
1Homelessness IN THE UNITED STATES

1-2 • The 2013 Annual Homeless Assessment Report to Congress
Homelessness in the United States
TOTAL ESTIMATES HOMELESSNESSPIT
KEY TERM HOMELESS describes a person who lacks a fixed, regular, and adequate nighttime residence.
HOMELESSNESSIN THE UNITED STATES
591,768 people were homeless
1 in 3 are in CA or NY
since 2007. since 2007.
This is a This is a9.1% decline 10.5% decline
1.42 million people used shelter at some point
PIT DATA HMIS DATA
People using shelter programs in
On a single night in January 2013…
Throughout the year in 2013…
From 2012–2013…People in sheltered & unsheltered locations
67%33%
1 in 134 minorities
1 in 68 African Americans
2.3%
9.9%
were homeless and
were homeless
CITIES
SUBURBAN & RURAL AREAS

The 2013 Annual Homeless Assessment Report to Congress • 1-3
The Point-in-Time (PIT) estimates are one-night counts of both sheltered and unsheltered homeless populations. The one-night counts are conducted
by CoCs nationwide and occur during the last ten days in January. CoCs are required to conduct a point in time count in shelters every year and a street count every other year (on the odd numbered year), although many CoCs do the unsheltered count along with the sheltered count each year. In 2013, 420 CoCs nationwide supplied both sheltered and unsheltered counts.
On a single night in January 2013• 591,768 people were homeless in the United States.
• Two-thirds of homeless people (66.7%) were in shelter on the night of the PIT count, and one-third (33.3%) were in unsheltered locations.
Between January 2012 and January 2013• Homelessness on a single night declined by 31,214
people, a 5 percent drop.
• Sheltered homelessness increased by 4,543 people, a 1.2 percent rise.
• Unsheltered homelessness declined by 35,757 people, a 15.4 percent drop.
Between January 2007 and January 2013• The one-night estimate of homelessness declined 9.1
percent, or 59,374 fewer people.
• Sheltered homelessness increased by 3,297 people, a 0.8 percent rise.
• Unsheltered homelessness declined by 24.1 percent, or 62,671 fewer people.
YearsTotal Homeless
PeopleSheltered
PeopleUnsheltered
People
# Change % Change # Change % Change # Change % Change
2012 to 2013 -31,214 -5.0 4,543 1.2 -35,757 -15.4
2011 to 2012 -2,235 -0.4 -2,161 -0.6 -74 0.0
2010 to 2011 -15,249 -2.4 -11,227 -2.8 -4,022 -1.7
2009 to 2010 6,850 1.1 235 0.1 6,615 2.9
2008 to 2009 -30,798 -4.6 16,947 4.4 -47,745 -17.2
2007 to 2008 -7,474 -1.1 -5,040 -1.3 -2,434 -0.9
2007 to 2013 -59,374 -9.1 3,297 0.8 -62,671 -24.1
One-Night EstimatesOF HOMELESSNESS
EXHIBIT 1.2: Change in Homelessness PIT Estimates by Sheltered Status, 2007–2013
EXHIBIT 1.1: One-Night Counts of Homelessness PIT Estimates by Sheltered Status, 2007–2013
PIT
Data Source: PIT 2007–2013Includes Puerto Rico and U.S. territories
651,142
391,401 386,361 403,308 403,543 392,316 390,155 394,698
643,668633,616 640,466 625,217 622,982 591,768
259,741 257,307230,308 236,923 232,901 232,827
197,070
2007 2008 2009 2010 2012 20132011
Total Homeless Population Sheltered Unsheltered
In January 2013, 591,768 people in the United States were homeless.
Note: The PIT estimates from 2007–2013 are slightly lower than those reported in past AHARs. The reduction reflects an adjustment to the estimates of unsheltered homeless people submitted by the Los Angeles City and County Continuum of Care. The adjustment removed: 20,746 from 2007 and 2008; 9,451 people in 2009 and 2010; 10,800 people in 2011 and 2012; and 18,274 people from 2013. This change applies to all PIT estimates in this section. See the supporting PIT data tabulations posted on HUD’s Resource Exchange at www.hudexchange.info.
1-4 • The 2013 Annual Homeless Assessment Report to Congress
Homelessness in the United States
TOTAL ESTIMATES HOMELESSNESSPIT
EXHIBIT 1.4: Total Homelessness by StateLargest Change in PIT Estimates, 2007–2013
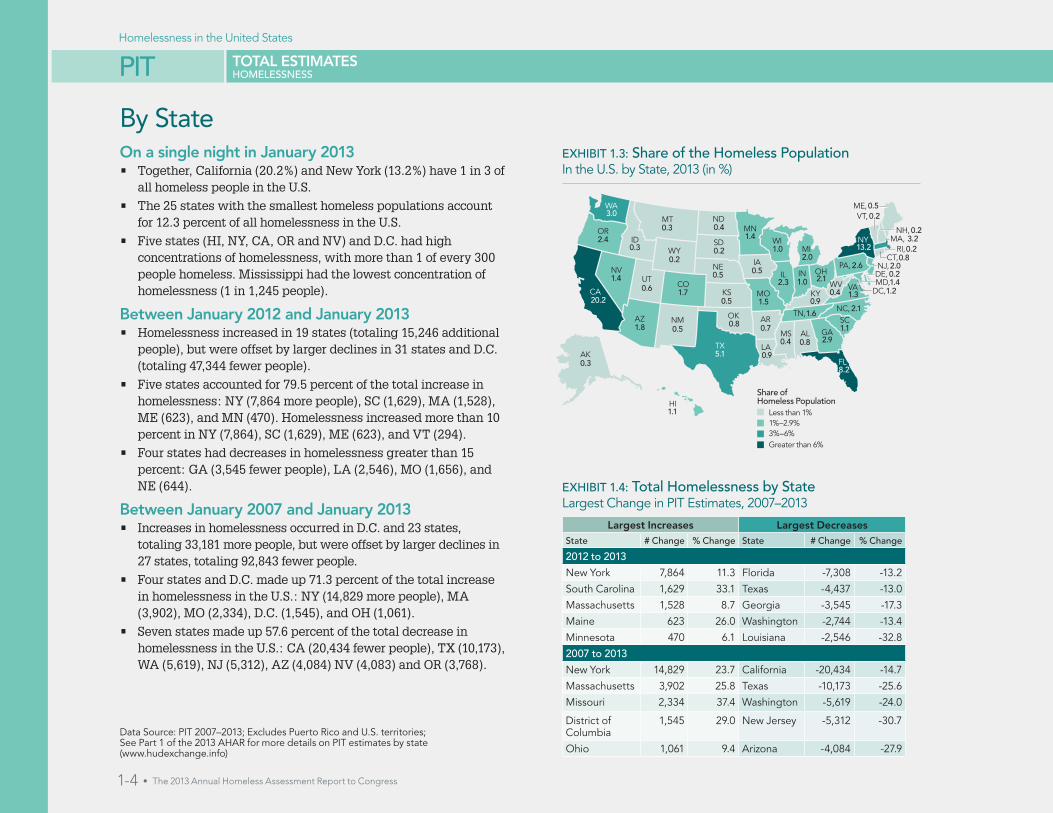
EXHIBIT 1.3: Share of the Homeless Population In the U.S. by State, 2013 (in %)
By StateOn a single night in January 2013• Together, California (20.2%) and New York (13.2%) have 1 in 3 of
all homeless people in the U.S.
• The 25 states with the smallest homeless populations account for 12.3 percent of all homelessness in the U.S.
• Five states (HI, NY, CA, OR and NV) and D.C. had high concentrations of homelessness, with more than 1 of every 300 people homeless. Mississippi had the lowest concentration of homelessness (1 in 1,245 people).
Between January 2012 and January 2013• Homelessness increased in 19 states (totaling 15,246 additional
people), but were offset by larger declines in 31 states and D.C. (totaling 47,344 fewer people).
• Five states accounted for 79.5 percent of the total increase in homelessness: NY (7,864 more people), SC (1,629), MA (1,528), ME (623), and MN (470). Homelessness increased more than 10 percent in NY (7,864), SC (1,629), ME (623), and VT (294).
• Four states had decreases in homelessness greater than 15 percent: GA (3,545 fewer people), LA (2,546), MO (1,656), and NE (644).
Between January 2007 and January 2013• Increases in homelessness occurred in D.C. and 23 states,
totaling 33,181 more people, but were offset by larger declines in 27 states, totaling 92,843 fewer people.
• Four states and D.C. made up 71.3 percent of the total increase in homelessness in the U.S.: NY (14,829 more people), MA (3,902), MO (2,334), D.C. (1,545), and OH (1,061).
• Seven states made up 57.6 percent of the total decrease in homelessness in the U.S.: CA (20,434 fewer people), TX (10,173), WA (5,619), NJ (5,312), AZ (4,084) NV (4,083) and OR (3,768).
Largest Increases Largest DecreasesState # Change % Change State # Change % Change
2012 to 2013
New York 7,864 11.3 Florida -7,308 -13.2
South Carolina 1,629 33.1 Texas -4,437 -13.0
Massachusetts 1,528 8.7 Georgia -3,545 -17.3
Maine 623 26.0 Washington -2,744 -13.4
Minnesota 470 6.1 Louisiana -2,546 -32.8
2007 to 2013
New York 14,829 23.7 California -20,434 -14.7
Massachusetts 3,902 25.8 Texas -10,173 -25.6
Missouri 2,334 37.4 Washington -5,619 -24.0
District of Columbia
1,545 29.0 New Jersey -5,312 -30.7
Ohio 1,061 9.4 Arizona -4,084 -27.9
Data Source: PIT 2007–2013; Excludes Puerto Rico and U.S. territories; See Part 1 of the 2013 AHAR for more details on PIT estimates by state (www.hudexchange.info)
ME,
NH,
VT,
NY MA,RI,
CT,NJ,
DE,
DC,
PA,
VAWV
NC,SC
GA
FL
AL
TN,
KY
OHIL
MIWI
MN
IA
MO
AR
LATX
OK
KS
NE
SD
NDMT
WA
OR
CA
AK
HI
WY
CO
NMAZ
UTNV
ID
IN
MS
MD,
Share of Homeless Population
Less than 1%1%–2.9%
Greater than 6%3%–6%
0.4
0.2
1.21.4
0.2
0.2
0.23.2
0.2
0.3
0.3
0.5
0.4
0.4
0.5
0.5
0.82.0
0.7 1.1
0.9
1.0
1.4
1.3
2.1
2.1
2.6
13.22.4
20.21.7
2.31.4
1.51.6
8.2
1.8
0.9
1.0
2.0
1.1
0.8
0.8
0.5
0.6
0.5
0.3
3.0
2.9
5.1
0.2
The 2013 Annual Homeless Assessment Report to Congress • 1-5
Homelessness in the United States
TOTAL ESTIMATES HOMELESSNESSPIT
EXHIBIT 1.5: Sheltered Homelessness by StateLargest Change in PIT Estimates, 2007–2013
EXHIBIT 1.6: Unsheltered Homelessness by StateLargest Change in PIT Estimates, 2007–2013
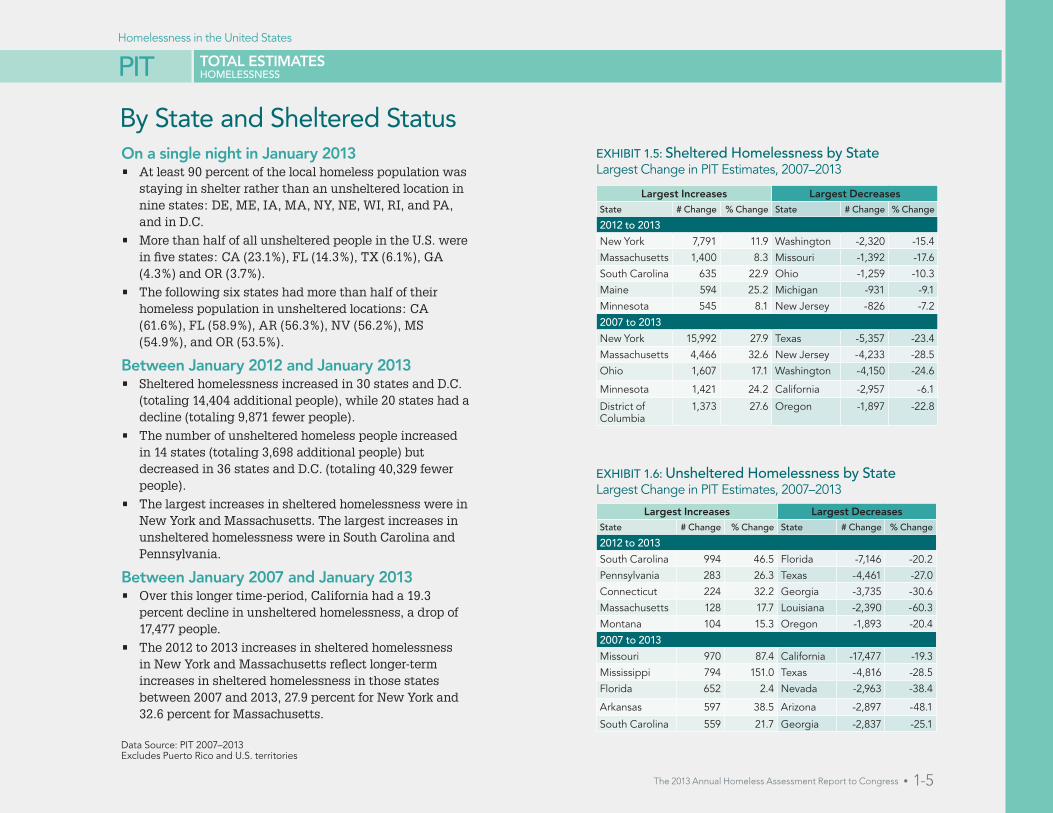
By State and Sheltered StatusOn a single night in January 2013• At least 90 percent of the local homeless population was
staying in shelter rather than an unsheltered location in nine states: DE, ME, IA, MA, NY, NE, WI, RI, and PA, and in D.C.
• More than half of all unsheltered people in the U.S. were in five states: CA (23.1%), FL (14.3%), TX (6.1%), GA (4.3%) and OR (3.7%).
• The following six states had more than half of their homeless population in unsheltered locations: CA (61.6%), FL (58.9%), AR (56.3%), NV (56.2%), MS (54.9%), and OR (53.5%).
Between January 2012 and January 2013• Sheltered homelessness increased in 30 states and D.C.
(totaling 14,404 additional people), while 20 states had a decline (totaling 9,871 fewer people).
• The number of unsheltered homeless people increased in 14 states (totaling 3,698 additional people) but decreased in 36 states and D.C. (totaling 40,329 fewer people).
• The largest increases in sheltered homelessness were in New York and Massachusetts. The largest increases in unsheltered homelessness were in South Carolina and Pennsylvania.
Between January 2007 and January 2013• Over this longer time-period, California had a 19.3
percent decline in unsheltered homelessness, a drop of 17,477 people.
• The 2012 to 2013 increases in sheltered homelessness in New York and Massachusetts reflect longer-term increases in sheltered homelessness in those states between 2007 and 2013, 27.9 percent for New York and 32.6 percent for Massachusetts.
Largest Increases Largest DecreasesState # Change % Change State # Change % Change
2012 to 2013
New York 7,791 11.9 Washington -2,320 -15.4
Massachusetts 1,400 8.3 Missouri -1,392 -17.6
South Carolina 635 22.9 Ohio -1,259 -10.3
Maine 594 25.2 Michigan -931 -9.1
Minnesota 545 8.1 New Jersey -826 -7.2
2007 to 2013
New York 15,992 27.9 Texas -5,357 -23.4
Massachusetts 4,466 32.6 New Jersey -4,233 -28.5
Ohio 1,607 17.1 Washington -4,150 -24.6
Minnesota 1,421 24.2 California -2,957 -6.1
District of Columbia
1,373 27.6 Oregon -1,897 -22.8
Largest Increases Largest DecreasesState # Change % Change State # Change % Change
2012 to 2013
South Carolina 994 46.5 Florida -7,146 -20.2
Pennsylvania 283 26.3 Texas -4,461 -27.0
Connecticut 224 32.2 Georgia -3,735 -30.6
Massachusetts 128 17.7 Louisiana -2,390 -60.3
Montana 104 15.3 Oregon -1,893 -20.4
2007 to 2013
Missouri 970 87.4 California -17,477 -19.3
Mississippi 794 151.0 Texas -4,816 -28.5
Florida 652 2.4 Nevada -2,963 -38.4
Arkansas 597 38.5 Arizona -2,897 -48.1
South Carolina 559 21.7 Georgia -2,837 -25.1
Data Source: PIT 2007–2013Excludes Puerto Rico and U.S. territories

1-6 • The 2013 Annual Homeless Assessment Report to Congress
GEOGRAPHY ALL SHELTERED HOMELESSNESS
PROFILE OF A TYPICAL PERSON WHO WAS HOMELESS IN 2013
34.6% WERE AGE
63.4% MALE / 64.0% 1-PERSON HOUSEHOLD
41.8% WERE
71.9% WERE IN A
60.5% HAD
NIGHTS SPENT IN EMERGENCY SHELTER
PRIOR TO USING A SHELTER IN 2013, 41.8% WERE
A Man in Shelter by Himself
31–50
Already Homeless
African American
City
No Disability
24

The 2013 Annual Homeless Assessment Report to Congress • 1-7
Homelessness in the United States
GEOGRAPHY ALL SHELTERED HOMELESSNESSHMIS
HMIS
One-Year EstimatesOF SHELTERED HOMELESSNESS
The one-year estimates account for all people who used an emergency shelter or transitional housing program at any time from October 1 through September 30 of
the following year. The estimates are based on a nationally representative sample of communities that submit aggregate Homeless Management Information Systems (HMIS) data to HUD. The estimates statistically adjust for homeless people in shelter programs that do not yet participate in their local HMIS—thus providing a complete enumeration of shelter users in each community—and are weighted to represent the entire country. The one-year estimates do not include: (a) shelter users in Puerto Rico and the U.S. territories; (b) people served by victim service providers; and (c) people in unsheltered locations who never accessed a shelter program during the 12-month period.
The 2013 AHAR uses data from 381 CoCs, representing 89 percent of all CoCs nationwide. The 95 percent confidence interval for the total sheltered homeless population in 2013 is ± 145,371 (1,276,989 to 1,567,731).
In 2013, 1,422,360 people in the U.S. were homeless in shelter, the lowest number since 2007.
2013 Estimate of Sheltered Homelessness• The estimated number of people who used an emergency
shelter or transitional housing program at some time from October 1, 2012 through September 30, 2013 was 1,422,360.
• 1 in 181 people in the U.S. was homeless in shelter during that year.
Changes Over Time• Between 2012 and 2013, the number of people using shelter
programs at some point during a year dropped by 66,011 people, or 4.4 percent.
• The number of homeless people in shelter programs has declined every year for the last three years following a small one-year increase from 2009 to 2010. The 2013 estimate of people using shelter programs is the lowest it has been since 2007, when HUD began tracking this information. Sheltered homelessness dropped by 10.5 percent, 166,235 fewer people, between 2007 and 2013.
1,422,360
1,588,595
2007
1,593,794
2008
1,558,917
2009
1,593,150
2010 2011 20132012
2007–2013
-166,235
-10.5%
34,2332.2%
-66,011
-4.4%-90,954
-5.7%
-13,825
-0.9%-34,877
-2.2%5,1990.3%
1,502,196 1,488,371
EXHIBIT 1.7: One-year Estimates of Sheltered Homelessness, 2007–2013
Data Source: HMIS, HIC 2007–2013; ACS 2012

1-8 • The 2013 Annual Homeless Assessment Report to Congress
Homelessness in the United States
HMIS CHARACTERISTICS SHELTERED HOMELESSNESS
EXHIBIT 1.8: GenderSheltered Homeless Adults and Total U.S. Adults, 2007–2013
EXHIBIT 1.9: AgeSheltered Homeless People and Total U.S. Population, 2007–2013
Gender and AgeIn 2013• Almost two-thirds of all homeless adults in shelter
(63.4%) were men, and just over a third (36.6%) were women.
• Men are overrepresented in the adult homeless population in shelter when compared to their share of the adult U.S. population (63.4% versus 48.6%).
• About one-third of homeless people in shelter are ages 31 to 50 (34.6%). Those ages 18 to 30 make up 22.9% of the homeless population in shelter, and 16.8 percent are ages 51 to 61.
• About one-fifth (22.2%) of people homeless in shelter are children.
• Only a small share of sheltered homeless people are 62 or older, 3.5 percent, compared with a much larger share of the U.S. population, 17.1 percent, and the U.S. poverty population, 10.2 percent.
Changes Over Time• The gender profile of sheltered homeless people
remained stable between 2012 and 2013, but the share of adults in shelter who are women increased slightly over the six years since 2007.
• Between 2007 and 2013, the age distribution of sheltered homelessness shifted somewhat, away from the 31 to 50 age group (a 24% decline or 152,776 fewer people). Increasing shares of the sheltered homeless population were younger adults (ages 18 to 30) and people 51 years or older.
Data Source: HMIS 2007–2013; ACS 2006, 2011, 2012
65.2 34.8
0% 100%
36.8
48.6
48.6
48.6
63.2
51.4
51.4
51.4
2012
2007
2013
2012
2007
2013
SHELTEREDADULTS
U.S.ADULTS
Male Female
36.663.4
2012
2007
2012
2007
2013
Under Age 18 18–30 31–50
51–61 62 and Older
SHELTEREDPEOPLE
U.S.POPULATION
24.6 18.1 29.0 13.2 15.1
23.7 18.2 26.9 14.5 16.7
23.5 18.2 26.7 14.6 17.1
0% 100%
21.8 20.5 41.2 13.6 2.9
2013 22.2 22.9 34.6 16.8 3.5
22.6 23.5 35.0 15.6 3.2

The 2013 Annual Homeless Assessment Report to Congress • 1-9
Homelessness in the United States
HMIS CHARACTERISTICS SHELTERED HOMELESSNESS
Ethnicity and RaceIn 2013• People who identify themselves as Hispanic make up a
similar share of the population using shelter programs as in the total U.S. population (16.4% and 16.9%).
• About 62 percent of the sheltered homeless population identified as members of a minority group. African Americans comprised 41.8 percent of the population using shelter programs, representing the largest single racial group in shelter programs. Other minority groups include: White Hispanic (10.1%), multiple races (6.5%), American Indian or Alaska Native (2.4%), Asian (0.8%), and Native Hawaiian or other Pacific Islander (0.9%).
• Minorities, especially African Americans, were overrepresented in the sheltered homeless population when compared to their share of the total U.S. population. People in a shelter were 3 times more likely to be African American than those in the total U.S. population.
Changes Over Time• While the share of Hispanics in the total U.S.
population increased from14.8 percent in 2007 to 16.9 percent in 2013, the share of Hispanics in the shelter population dropped from 21.6 to 16.4 percent.
• While the number of minorities in the total U.S. population increased 15.2 percent between 2007 and 2013, the number of minorities in the sheltered population dropped 3 percent. The share of the sheltered population identifying as white, non-Hispanic increased slightly, from 36.4 to 37.6 percent over the six years, while the share of African Americans increased from 39.6 to 41.8 percent.
EXHIBIT 1.10: EthnicitySheltered Homeless People and Total U.S. Population, 2007–2013
EXHIBIT 1.11: RaceSheltered Homeless People and Total U.S. Population, 2007–2013
0% 100%
2012
2012
2007
2013
SHELTEREDPEOPLE
U.S.POPULATION
Hispanic Non-Hispanic
85.2
83.3
83.1
2013 83.616.4
83.716.3
16.7
16.9
14.8
2007 78.421.6
36.4 12.9 39.6 3.9 7.3
66.2 7.7 12.4 11.7 2.0
62.8 11.1 12.6 10.6 2.9
63.3 10.8 12.6 10.5 2.8
2012
2007
2013
2012
2007
2013
SHELTEREDPEOPLE
U.S.POPULATION
0% 100%
White, Non-Hispanic White, Hispanic
Other One RaceBlack or African American Multiple Races
37.6 41.810.1 4.0 6.5
38.9 39.49.5 5.0 7.2
Data Source: HMIS 2007–2013; ACS 2006, 2011, 2012
Note: Ethnicity is distinguished among the white race group to facilitate an understanding of minorities and non-minorities. Non-minorities are those who identify their ethnicity as not Hispanic and their race as white.

1-10 • The 2013 Annual Homeless Assessment Report to Congress
Homelessness in the United States
GEOGRAPHY ALL SHELTERED HOMELESSNESSHMIS

The 2013 Annual Homeless Assessment Report to Congress • 1-11
Homelessness in the United States
HMIS
Household Size and Disability StatusIn 2013• Almost two-thirds (64%) of people using shelter
programs were there alone. In contrast, a small share of the U.S. population was in one-person households, 12.8 percent.
• People in shelter were 2.6 times more likely to have a disability than were people in the U.S. population overall (39.6% versus 15.3%).
Changes Over Time• Between 2012 and 2013, the number of sheltered
homeless people in large households (5 or more people) decreased 11 percent (14,463 fewer people), but the share dropped only slightly, from 8.9 to 8.3 percent.
• The share of adults with a disability in shelter increased from 37.1 percent in 2007 to 39.6 percent in 2013.
EXHIBIT 1.12: Household SizeSheltered Homeless People and Total U.S. Population, 2007–2013
EXHIBIT 1.13: Disability StatusSheltered Homeless Adults and Total U.S. Adults, 2007–2013
0% 100%
2012
2007
2013
2012
2007
2013
SHELTEREDADULTS
U.S.ADULTS
Not DisabledDisabled
37.1
15.3
15.3
17.9
38.6
39.6 60.5
61.4
62.9
84.7
84.7
82.1
2012
2007
2012
2007
2013
1 Person 2 People 3 People
4 People 5 or More People
SHELTEREDPEOPLE
U.S.POPULATION
64.0
70.3
9.6
25.9 18.8
25.8
8.0
10.2
8.2
7.9
6.5
20.5 21.9
8.3
63.1 9.6 10.5 7.9 8.9
6.9
0% 100%
2013
12.8
25.8 18.8 20.4 22.212.8
12.9 25.5 18.9 21.1 21.7
Data Source: HMIS 2007–2013; ACS 2006, 2011, 2012
CHARACTERISTICS SHELTERED HOMELESSNESS

1-12 • The 2013 Annual Homeless Assessment Report to Congress
Homelessness in the United States
GEOGRAPHY ALL SHELTERED HOMELESSNESSHMIS
Geographic Location In 2013• About 7 in 10 people used shelter programs in
principal cities. A larger portion of the sheltered individual population was in principal cities than of the sheltered family population, 74.7 percent versus 66.8 percent
• In contrast, the majority of the U.S. poverty population and the U.S. population overall live in suburban and rural areas rather than cities.
Changes Over Time• Between 2007 and 2013, sheltered homelessness
increased 8.5 percent in suburban and rural areas and declined 16.4 percent in cities. This trend is similar to the U.S. poverty population, with an increase between 2007 and 2012 that was larger in suburban and rural areas (a 26.6% rise) than in cities (a 15.6% rise). The share of sheltered homeless people in suburban and rural areas increased from 23.1 to 28.1 percent.
• The shift away from cities did not continue between 2012 and 2013. Sheltered homelessness declined in both cities (24,096 fewer people) and in suburban and rural areas (43,731 fewer people).
U.S.POVERTY
POPULATION*
U.S.POPULATION*
34.8 65.2
64.8
63.1
35.2
36.9
75.8
75.8
75.7
24.2
24.2
24.3
2012
2013
2007
2012
2013
2007
SHELTEREDPEOPLE
SUBURBAN AND RURAL AREASPRINCIPAL CITIES 0% 100%
70.2
71.9
29.8
28.1
23.176.9
2012
2013
2007
EXHIBIT 1.14: Geographic Distribution Sheltered Homelessness, U.S. Poverty Population, and Total U.S. Population 2007–2013
EXHIBIT 1.15: Percent Change by Geography Sheltered Homeless People, U.S. Poverty Population, and Total U.S. Population, 2007–2013 (in %)
Data Source: HMIS 2007–2013; ACS 2006,2010, 2011
Population2012–2013 2007–2013
Principal Cities
Suburban & Rural Areas
Principal Cities
Suburban & Rural Areas
Sheltered People -2.3 -9.9 -16.4 8.5
U.S. Poverty Population* 3.1 5.0 15.6 26.6
U.S. Population* 0.7 0.6 2.7 3.4
The share of sheltered homeless people in suburban and rural areas increased since 2007, as has the share of the U.S. poverty population.
* In the 2013 ACS, the geographic indicator used to distinguish principal cities from other areas is not yet available. The data source used to represent 2012 and 2013 are from the most recent two years available.
* In the 2013 ACS, the geographic indicator used to distinguish principal cities from other areas is not yet available. The data source used to represent 2012 and 2013 are from the most recent two years available.

The 2013 Annual Homeless Assessment Report to Congress • 1-13
Homelessness in the United States
GEOGRAPHY ALL SHELTERED HOMELESSNESSHMIS
Characteristics by GeographyIn 2013• People using shelter programs in principal cities
were more likely to be part of a minority group compared to those in suburban and rural areas, 66.7 percent versus 51.2 percent.
• Sheltered homeless people in principal cities were more likely to be African American than those in suburban and rural areas, 44.7 percent versus 34.5 percent.
• Sheltered people in cities were more likely to be homeless alone than they were in suburban and rural areas, 66.5 percent versus 57.5 percent.
• Sheltered people in suburban and rural areas were younger than their urban counterparts. For example, they were more likely to be children than those in cities (26% versus 20.8%), and they were more likely to be women (42.4% versus 34.6%).
Changes Over Time• The share of people identifying as Hispanic
using shelter programs declined within cities, from 18.3 percent in 2012 to 18.1 percent in 2013, and increased in suburban and rural areas, 11.4 percent in 2012 to 11.7 percent in 2013.
• The share of people identifying as white and not Hispanic using shelter programs in cities increased from 33.1 percent in 2012 to 33.3 percent in 2013, and in suburban and rural areas decreased from 52.7 percent in 2012 to 48.8 percent in 2013.
• The share of women in a shelter program located in suburban and rural areas increased from 37.6 percent in 2007 to 42.4 percent in 2013.
CharacteristicPrincipal Cities Suburban &
Rural Areas
2007 2012 2013 2007 2012 2013
# Homeless People
1,221,044 1,044,880 1,020,784 367,551 442,636 398,905
Gender of Adults
Male 66.0 65.3 65.4 62.4 57.8 57.6
Female 34.0 34.7 34.6 37.6 42.2 42.4
Ethnicity
Hispanic 23.9 18.3 18.1 13.9 11.4 11.7
Non-Hispanic 76.1 81.7 81.9 86.1 88.6 88.3
Race
White, Non-Hispanic
33.9 33.1 33.3 44.3 52.7 48.8
White, Hispanic 14.9 10.3 10.9 6.5 7.8 7.7
Black or African American
39.7 43.8 44.7 39.3 29.0 34.5
Other One Race 4.1 5.1 4.2 3.2 4.7 3.7
Multiple Races 7.5 7.8 6.9 6.7 5.8 5.3
Age
Under Age 18 21.1 20.8 20.8 24.0 26.9 26.0
18–30 20.0 23.2 22.5 22.1 24.3 24.0
31–50 41.4 36.0 35.3 40.4 32.7 32.7
51–61 14.2 16.5 17.5 11.5 13.6 14.8
62 and Older 3.2 3.5 4.0 2.0 2.6 2.5
Household Size
1 Person 71.9 66.4 66.5 65.1 55.1 57.5
2 People 8.0 9.1 9.0 8.0 10.7 11.4
3 People 7.7 9.4 9.4 9.9 13.1 12.2
4 People 6.0 7.0 7.3 8.0 10.2 9.7
5 + 6.3 8.0 7.9 9.0 10.9 9.3
Disability Status of Adults
Disabled 31.5 36.9 38.9 52.9 43.0 41.3
Not Disabled 68.5 63.2 61.2 47.1 57.0 58.8
EXHIBIT 1.16: Characteristics by GeographyHomeless People, 2013 (in %)
Data Source: HMIS 2007–2013

1-14 • The 2013 Annual Homeless Assessment Report to Congress
Homelessness in the United States
HMIS
Living Situation Before Entering ShelterInformation on where people lived before entering shelter was asked only of adults.
In 2013• Just prior to their sheltered homeless experience
during 2013, about 4 in 10 adults in shelter were in a housed situation before entering shelter, about 4 in 10 were already homeless, and 2 in 10 were in institutional or other settings.
• Of the 410,433 adults entering shelter from housing, 42.2 percent had been staying with family, 32.5 percent with friends and 22.7 percent in housing they rented. Less than 2 percent were in housing they owned and less than one percent left permanent supportive housing to enter a shelter or transitional housing program.
• Of the 438,243 adults who were already homeless before entering a shelter program during the reporting year, more than half (58.5%) were in emergency shelter or a transitional housing program.
• Of the 117,931 adults who entered shelter from institutional settings, 30.5 percent came from a substance abuse treatment center and 40 percent came from a correctional facility.
• Excluding adults who were already homeless before the reporting year can describe the flow into the shelter system. Of those not already homeless, more than two-thirds were housed, while19.3 percent were in institutions, and 13.5 percent were in other settings.
Changes Over Time• Although homelessness declined overall between
2007 and 2013, the number of people who stayed with friends—sometimes called couch-surfing or doubled-up—and then entered shelter increased by 20.3 percent (24,034 more adults).
EXHIBIT 1.17: Places Adults StayedBefore Entering Shelter and Change Over Time, 2007–2013
Data Source: HMIS 2007–2013
Place Stayed2013 2012–2013 2007–2013
# % # Change
% Change
# Change
% Change
Already Homeless 438,243 41.8 -1,416 -0.3 -45,835 -9.0
Sheltered 256,561 58.5 -662 -0.2 -91,106 -25.1
Unsheltered 181,682 41.5 -754 -0.4 42,264 28.5
Housing 410,433 39.1 -24,619 -5.2 -20,835 -4.5
Staying with family 173,204 42 .2 -6,534 -3 .4 -9,478 -4 .8
Staying with friends 133,359 32 .5 -5,248 -3 .6 24,034 20 .3
Rented housing unit 93,098 22 .7 -9,710 -8 .5 -17,617 -14 .3
Owned housing unit 7,698 1 .9 -3,396 -28 .6 -17,775 -67 .7
Permanent supportive housing (PSH)
3,074 0 .7 269 8 .8 1 0 .0
Institutional Settings 117,931 11.2 -948 -0.8 2,641 2.2
Substance abuse treatment center
36,020 30.5 -2,167 -5.5 -1,170 -3.0
Correctional facility 48,014 40.7 942 1.9 -1,919 -3.6
Hospital 18,100 15.3 2,135 12.6 4,441 30.2
Psychiatric facility 15,797 13.4 -1,858 -10.1 1,289 8.4
Other Settings 82,650 7.9 -18,625 -17.4 -31,712 -26.4
Hotel or motel 35,553 43.0 -28 -0.1 -7,946 -17.6
Foster care home 3,376 4.1 207 6.2 -2,191 -38.1
Other living arrangement 43,721 52.9 -18,804 -28.3 -21,575 -31.1
EXHIBIT 1.18: Places Adults Stayed Who Were Not Already HomelessBefore Entering Shelter, 2007–2013 (in %)
20132012
67.267.066.5
19.317.817.6
13.515.315.9
2007
Note: To produce comparable trend information, statistical imputations were applied to missing values in this table. See the 2013 AHAR methodology document for more details.
PATTERNS OF HOMELESS SERVICE USE SHELTERED HOMELESSNESS

The 2013 Annual Homeless Assessment Report to Congress • 1-15
Homelessness in the United States
HMIS
Length of Stay and Other Bed-Use PatternsEmergency shelter and transitional housing programs are designed differently. Emergency shelters are high-volume, high-turnover programs; transitional housing programs offer homeless people shelter as well as supportive services for up to 24 months.
In 2013• Of the 1,422,360 people in a shelter program, 77.8 percent stayed just
in emergency shelters at some time during the year, 16 percent stayed just in transitional housing programs, and 6.3 percent used both emergency shelter and transitional housing programs.
• During the 12-month reporting period, about one-third of people in emergency shelter stayed one week or less, 58.1 percent stayed one month or less, and few stayed more than six months (5.6%).
• In contrast, nearly half of all people in transitional housing (46.2%) stayed between 1 and 6 months.
• The median length of stay for emergency shelter clients was 24 nights, and the average was 56 nights. On an average night throughout the year, 88.1 percent of emergency shelter beds were occupied.
• In contrast, people in transitional housing typically stayed 124 nights, with an average stay of 155 nights (about 5 months) during the reporting year. On an average night, 81.8 percent of transitional housing beds were occupied.
Changes Over Time• The use of transitional housing declined 3.7 percent (12,052 fewer
people) between 2012 and 2013.
• The number of homeless people using just emergency shelter decreased 4.7 percent (53,960 fewer people), and those using both emergency shelters and transitional housing programs increased 7.2 percent (5,957 more people).
• The smaller number of people using shelter programs at some time during 2013 compared with 2007 are using it more intensively. The average number of nights in emergency shelter rose from 46 in 2007 to 56 in 2013.
EXHIBIT 1.19: Length of StayPeople in Emergency Shelter and Transitional Housing Programs, 2013
EXHIBIT 1.20: Bed-Use PatternsPeople in Emergency Shelter and Transitional Housing Programs, 2007–2013
Data Source: HMIS, HIC 2007–2013
Length of StayEmergency Shelter Transitional Housing
# % # %
7 days or less 371,212 31.1 15,879 5.0
8 to 30 days 322,060 27.0 37,984 12.0
31 to 180 days 402,512 33.8 146,231 46.2
181 to 360 days 66,722 5.6 74,829 23.6
361 to 365 days 29,789 2.5 41,792 13.2
Bed-Use Patterns
Emergency Shelter Transitional Housing
2007 2012 2013 2007 2012 2013
Median # nights
18 22 24 113 124 124
Average # nights
46 53 56 149 155 155
Average occupancy rate
88.5 87.9 88.1 76.9 82.2 81.8
Bed count 211,451 229,206 238,708 211,205 197,192 185,332
Turnover rate
7.3 6.1 5.7 1.8 1.9 1.9
Note: Length of stay accounts for multiple program entries/exits by summing the total number of (cumulative) days in a homeless residential program during the 12-month reporting period. The maximum length of stay is 365 days, corresponding to the total days observed for this reporting period.
Note1: The average daily occupancy rate is calculated by dividing the average daily census during the 12-month reporting period by the total of year-round equivalent beds for that year. Note2: The total bed count is based on the year-round beds determined at one point in time from the HIC.Note3: The turnover rate measures the number of people served per available bed over the 12-month reporting period, and is calculated by dividing the total of year-round equivalent beds for that year.
PATTERNS OF HOMELESS SERVICE USE SHELTERED HOMELESSNESS

1-16 • The 2013 Annual Homeless Assessment Report to Congress
Homelessness in the United States
GEOGRAPHY ALL SHELTERED HOMELESSNESSHMIS
LOWER RISK
HIGHER RISK
All Minorities
Veterans
Men
Adults
All People
Children
Women
African AmericansMinorities were more likely to experience homelessness than to be victims of a violent crime (1 in 153).b
African Americans were more likely to experience homelessness than they were to receive a cancer diagnosis (1 in 189).a
Veterans were 6.2 times more likely to be homeless than to be surviving former prisoners of war (1 in 938).c
It was more common for men to experience homelessness than it was for them to work as a waiter in a restaurant (1 in 186).d
Among all adults, experiencing homelessness was more common than working on the front lines of public safety as a police of�cer or �re �ghter (1 in 240).d
Children were over 15 times more likely to experience homelessness than they were to be diagnosed with whooping cough (1 in 3,865).a
Americans were 35 times more likely to experience homelessness than they were to receive an HIV diagnosis (1 in 6,371).a
Women were more likely to be homeless than they were to be a lawyer (1 in 342).d
68
134
152
167
221
218
234
305
Data Source:a Centers for Disease Control and Prevention Survey (2010, 2011, 2014)b Bureau of Justice Statistics (2013)c Veterans Affairs Benefits Assistance Service (2012)d Bureau of Labor Statistics (2013)
EXHIBIT 1.21: Odds of Becoming Part of the Sheltered Homeless Population, 2013

2H
om
eless Individ
uals2Homeless Individuals IN THE UNITED STATES
POINT-IN-TIME (PIT)One-Night Estimates of Homeless Individuals . . . . . . . . . . . . . . . . . . 2-3
By State . . . . . . . . . . . . . . . . . . . . . . . . . . . . . . . . . . . . . . . . . . . . . . . . . . 2-4
By State and Sheltered Status . . . . . . . . . . . . . . . . . . . . . . . . . . . . . . . . 2-5
HOMELESS MANAGEMENT INFORMATION SYSTEM (HMIS)One-Year Estimates of Homeless Individuals. . . . . . . . . . . . . . . . . . . . 2-7
Characteristics of Sheltered IndividualsGender and Age . . . . . . . . . . . . . . . . . . . . . . . . . . . . . . . . . . . . . . . . . . . . . . . . . . . .2-8Ethnicity and Race . . . . . . . . . . . . . . . . . . . . . . . . . . . . . . . . . . . . . . . . . . . . . . . . . . . 2-9Household Size and Disability Status . . . . . . . . . . . . . . . . . . . . . . . . . . . . . . . . . . 2-11
Geography of Sheltered IndividualsGeographic Location . . . . . . . . . . . . . . . . . . . . . . . . . . . . . . . . . . . . . . . . . . . . . . . 2-12Characteristics by Geography . . . . . . . . . . . . . . . . . . . . . . . . . . . . . . . . . . . . . . . . 2-13
Patterns of Homeless Service Use Among Sheltered IndividualsLiving Situation Before Entering Shelter . . . . . . . . . . . . . . . . . . . . . . . . . . . . . . . 2-14Length of Stay and Other Bed-Use Patterns . . . . . . . . . . . . . . . . . . . . . . . . . . . 2-15

2-2 • The 2013 Annual Homeless Assessment Report to Congress
Homeless Individuals in the United States
TOTAL ESTIMATES HOMELESS INDIVIDUALSPITHOMELESS INDIVIDUALS
IN THE UNITED STATES
369,571 individuals were homeless
since 2007. since 2007.
This is an This is a11.1% decline 15.4% decline
943,017 individuals used shelter at some point
PIT DATA HMIS DATA
Individuals using shelter programs in
On a single night in January 2013…
Throughout the year in 2013…
Individuals in sheltered & unsheltered locations
55%45%
Over half of all unsheltered individuals are in CA or FL
KEY TERM
An INDIVIDUAL refers to a person in a household that does not have both an adult and a child. These households include people who are homeless alone, adult roommates, married or cohabiting couples without children, households comprised of multiple children (e.g., parenting teens), and unaccompanied youth.
2%
5.6%CITIES
SUBURBAN & RURAL AREAS
From 2012–2013…
Individuals in shelter were
2.3 times more likely to be disabled than those in the U.S. population

The 2013 Annual Homeless Assessment Report to Congress • 2-3
One-Night EstimatesOF HOMELESS INDIVIDUALS
PIT
EXHIBIT 2.2: Change in Homeless IndividualsPIT Estimates by Sheltered Status, 2007–2013
EXHIBIT 2.1: One-Night Counts of Homeless Individuals PIT Estimates by Sheltered Status, 2007–2013
664,108 656,634633,616 640,466 625,217 591,768
Total Homeless People
Sheltered Individuals Unsheltered Individuals*
Homeless Individuals
415,597 407,422 395,506 398,515 389,036 369,571
213,073 204,855 215,995 212,218 205,834 203,127
202,524 202,567179,511 186,297 183,202 166,444
622,982
383,579
199,159
184,420
* Counts for unsheltered individuals are labeled below the trend line.
2007 2008 2009 2010 2012 20132011
YearsTotal Homeless
IndividualsSheltered Individuals
Unsheltered Individuals
# Change % Change # Change % Change # Change % Change
2012 to 2013 -14,008 -3.7 3,968 2.0 -17,976 -9.7
2011 to 2012 -5,457 -1.4 -6,675 -3.2 1,218 0.7
2010 to 2011 -9,479 -2.4 -6,384 -3.0 -3,095 -1.7
2009 to 2010 3,009 0.8 -3,777 -1.7 6,786 3.8
2008 to 2009 -19,696 -4.7 11,140 5.4 -30,836 -14.7
2007 to 2008 -8,175 -1.9 -8,218 -3.9 43 0.0
2007 to 2013 -46,026 -11.1 -9,946 -4.7 -36,080 -17.8Data Source: PIT 2007–2013Includes Puerto Rico and U.S. territories
This section presents the Point-in-Time (PIT) estimates of homeless individuals in the U.S. The PIT estimates are one-night counts of both sheltered and unsheltered homeless populations. The
one-night counts are conducted by CoCs nationwide and occur during the last ten days in January. CoCs are required to conduct a PIT count in shelters every year and a street count every other year (on the odd numbered year), although many CoCs conduct an unsheltered count along with the sheltered count each year.
On a single night in January 2013• 369,571 people were homeless as individuals, representing 62.5
percent of the total homeless population in the United States.
• Of the individual homeless population, 55 percent were in shelter programs and 45 percent in unsheltered locations.
• Homeless individuals comprise 84.5 percent of all people found in unsheltered locations and 51.5 percent of those in shelters.
Between January 2012 and January 2013• The total number of people homeless as individuals declined by 3.7
percent (14,008 fewer people).
• The number of homeless individuals staying in shelters increased by 3,968 people or by 2 percent.
• The number of unsheltered homeless individuals decreased by 17,976 people or by 9.7 percent.
Between January 2007 and January 2013• The number of homeless individuals declined 11.1 percent, 46,026
fewer people.
• The number of homeless individuals staying in shelter on a single night dropped by 4.7 percent, 9,946 fewer people.
• The number of homeless individuals staying in unsheltered locations dropped by 17.8 percent, 36,080 fewer people.
The number of homeless individuals declined 11.1% between January 2007 and 2013.
Note: The PIT estimates from 2007–2013 are slightly lower than those reported in past AHARs. The reduction reflects an adjustment to the estimates of unsheltered homeless people submitted by the Los Angeles City and County Continuum of Care. The adjustment removed: 20,746 from 2007 and 2008; 9,451 people in 2009 and 2010; 10,800 people in 2011 and 2012; and 18,274 people from 2013. This change applies to all PIT estimates in this section. See the supporting PIT data tabulations posted on HUD’s Resource Exchange at www.hudexchange.info.

2-4 • The 2013 Annual Homeless Assessment Report to Congress
Homeless Individuals in the United States
TOTAL ESTIMATES HOMELESS INDIVIDUALSPIT
By State
EXHIBIT 2.4: Total Homeless Individuals by StateLargest Change in PIT Estimates, 2007–2013
EXHIBIT 2.3: Share of Homeless Individuals In the U.S. by State, 2013 (in %)
Largest Increases Largest DecreasesState # Change % Change State # Change % Change
2012 to 2013
South Carolina 1,409 42.4 Florida -5,412 -14.7
New York 1,102 3.7 Georgia -2,483 -16.2
Pennsylvania 678 9.3 Louisiana -2,414 -38.2
Indiana 435 13.1 California -1,430 -1.5
Massachusetts 405 6.4 Nevada -1,319 -14.8
2007 to 2013
New York 3,179 11.3 California -17,494 -15.8
Missouri 1,316 39.4 Texas -5,548 -21.1
South Carolina 965 25.6 Arizona -3,510 -35.0
Louisiana 935 31.4 New Jersey -2,879 -32.1
Ohio 741 10.8 Washington -2,672 -20.1
ME,
NH,
VT,
NY MA,RI,
CT,NJ,
DE,
DC,
PA,
VAWV
NC,
SCGA
FL
AL
TN,
KY
OHIL
MIWI
MN
IA
MO
AR
LATX
OK
KS
NE
SD
NDMT
WA
OR
CA
AK
HI
WY
CO
NMAZ
UTNV
ID
IN
MS
MD,
Share of Homeless Individuals
Less than 1%1%–2.9%
Greater than 6%3%–6%
0.30.3
0.2
0.5
0.5
0.4
0.40.4
1.33.5
0.90.9
5.7
0.9
1.0
0.5
0.3 0.2
0.5 0.2
1.01.4
0.9
1.31.2
1.9
2.2
8.5
8.6
2.0
2.12.2
2.1
1.3
2.1
25.6
2.5
2.9
1.8
1.1
0.20.8
1.7
0.8
1.00.2
1.8
0.20.4
0.4
0.9
Data Source: PIT 2007–2013Excludes Puerto Rico and U.S. territoriesSee Part 1 of the 2013 AHAR for more details on PIT estimates by state (www.hudexchange.info)
On a single night in January 2013• Almost half of all homeless individuals, sheltered and
unsheltered, were in four states: California, with 25.6 percent of the national total, Florida (8.6%), New York (8.5%) and Texas (5.7%).
• In four states, homeless individuals represented more than three quarters of all homeless people: NV (90% of all homeless people), AR (83.3%), CA (78.8%), and GA (75.9%).
Between January 2012 and January 2013• The number of homeless individuals dropped in 30 states
and D.C., totaling 21,282 fewer people. Three states represented 48.4 percent of the total decrease: Florida (5,412 fewer people), Georgia (2,483), and Louisiana (2,414).
• In contrast, 20 states had an increase in the number of homeless individuals, totaling 6,251 more people. Two states represented 40.1 percent of the total increase: South Carolina (1,409 more people) and New York (1,102).
• Individual homelessness increased at least ten percent in three states: SC (1,409), IN (435), and ME (276).
Between January 2007 and January 2013• The number of homeless individuals dropped in 26 states
and in D.C., totaling 58,692 fewer people. The five states with the largest decreases were CA (17,494 fewer people), TX (5,548), AZ (3,510), NJ (2,879) and WA (2,672).
• In contrast, 24 states had an increase in the number of homeless individuals, totaling 13,161 more people. The four states with the largest increases in homeless individuals were NY (3,179 more people), MO (1,316), SC (965), and LA (935).

The 2013 Annual Homeless Assessment Report to Congress • 2-5
Homeless Individuals in the United States
TOTAL ESTIMATES HOMELESS INDIVIDUALSPIT
By State and Sheltered StatusEXHIBIT 2.5: Sheltered Homeless Individuals by StateLargest Change in PIT Estimates, 2007–2013
EXHIBIT 2.6: Unsheltered Homeless Individuals by StateLargest Change in PIT Estimates, 2007–2013
Largest Increases Largest DecreasesState # Change % Change State # Change % Change
2012 to 2013
New York 1,117 4.3 New Jersey -471 -8.7
Texas 651 7.2 Florida -471 -3.7
South Carolina 550 30.7 Washington -412 -6.4
Indiana 506 19.0 Alabama -361 -14.0
Tennessee 465 11.2 Virginia -212 -5.6
2007 to 2013
New York 4,307 18.8 California -4,071 -13.3
Ohio 880 15.7 Texas -3,438 -26.2
Minnesota 842 38.6 New Jersey -2,118 -30.1
Missouri 804 31.4 Washington -2,081 -25.7
Wisconsin 632 30.5 Massachusetts -1,296 -18.1
Largest Increases Largest DecreasesState # Change % Change State # Change % Change
2012 to 2013
South Carolina 859 55.9 Florida -4,941 -20.6
Arizona 324 12.8 Georgia -2,917 -27.7
Pennsylvania 227 23.2 Louisiana -2,377 -61.2
Connecticut 172 23.3 California -1,362 -2.0
Hawaii 158 7.7 Nevada -1,219 -20.6
2007 to 2013
Georgia 852 12.6 California -13,423 -16.7
Arkansas 776 63.6 Arizona -2,749 -49.1
Louisiana 689 84.2 Texas -2,110 -16.0
South Carolina 656 37.7 Tennessee -1,462 -39.1
Mississippi 583 111.7 Florida -1,239 -6.1
Data Source: PIT 2007–2013Excludes Puerto Rico and U.S. territories
On a single night in January 2013• In five states (DE, ME, NE, IA, and WI) at least
90 percent of homeless individuals were in a shelter rather than in unsheltered locations. This is not typical, as 45 percent of individuals were unsheltered nationally.
• More than half of all unsheltered individuals in the U.S. were in California (41%) and Florida (11.6%).
• Unsheltered homeless individuals accounted for the majority of homeless individuals in 13 states, including CA (71.7%), HI (66%), MS (63%), AR (62.9%), and NV (61.8%).
Between January 2012 and January 2013• D.C. and 37 states had decreases in unsheltered
individuals (totaling 21,850 fewer people). Three states—FL, GA and LA—accounted for 46.8 percent of the decline.
• Increases in unsheltered individuals occurred in 13 states totaling 2,955 additional people. South Carolina had a notable increase in unsheltered individual homelessness with 859 more people, representing a 55.9 percent increase.
• States with the largest increases in sheltered individuals were New York and Texas.
Between January 2007 and January 2013• The one-year rise in New York’s population of
sheltered homeless individuals sustained a longer-term increase, totaling 4,307 people over 6 years.
• Several states had large, long-term decreases in individual homeless people in shelter: CA, TX, NJ, WA, and MA.

2-6 • The 2013 Annual Homeless Assessment Report to Congress
Homeless Individuals in the United States
CHARACTERISTICS HOMELESS INDIVIDUALSHMIS
PROFILE OF A TYPICAL HOMELESS INDIVIDUAL IN 2013
43.9% WERE AGE
72.3% MALE / 97.8% 1-PERSON HOUSEHOLD
44.7% WERE
74.7% WERE IN A
56.2% HAD
NIGHTS SPENT IN EMERGENCY SHELTER
PRIOR TO USING A SHELTER, 44.1% WERE
A Man in Shelter by Himself
31–50
Already Homeless
White, Non-Hispanic
City
No Disability
20

The 2013 Annual Homeless Assessment Report to Congress • 2-7
Homeless Individuals in the United States
CHARACTERISTICS HOMELESS INDIVIDUALSHMIS
HMIS
One-Year EstimatesOF SHELTERED INDIVIDUALS
943,017 individuals used a shelter program at some time during the 2013 reporting year.
2007–2013
-172,037
-15.4%
1,115,054
2007
1,092,612
2008
1,034,659
2009
1,043,242
2010
984,469
2011 2012
969,659
-14,810
-1.5%
26,642
-2.7%-58,773
-5.6%
8,5830.8%
-57,953
-5.3%-22,442
-2.0%
2013
943,017
EXHIBIT 2.7: One-year Estimates of Sheltered Homeless Individuals, 2007–2013
Data Source: HMIS 2007–2013; ACS 2012
The one-year estimates account for all individuals who used an emergency shelter or transitional housing program at any time from October 1 through
September 30 of the reporting year. The estimates are based on a nationally representative sample of communities that submit aggregate Homeless Management Information Systems (HMIS) data to HUD. The estimates statistically adjust for homeless people in shelter programs that do not yet participate in their local HMIS—thus providing a complete enumeration of sheltered individuals in each community—and are weighted to represent the entire country. The one-year estimates do not include: (a) sheltered individuals in Puerto Rico and the U.S. territories; (b) individuals served by victim service providers; and (c) individuals in unsheltered locations who never accessed a shelter program during the 12-month period. The 95 percent confidence interval for individuals who were homeless in shelter in 2013 is ± 112,971 (830,046 to 1,055,988).
2013 Estimate of Sheltered Individuals• An estimated 943,017 individuals used an emergency
shelter or transitional housing program at some time from October 1, 2012 through September 30, 2013.
Changes Over Time• Between 2012 and 2013, the number of individuals using
shelter programs dropped by 26,642 people, or 2.7 percent.
• Between 2007 and 2013, the number of homeless individuals in shelter dropped by 172,037 people, or by 15.4 percent.
• The number of sheltered homeless individuals declined every year except between 2009 and 2010, which saw a small, 0.8 percent, increase (8,583 more individuals).

2-8 • The 2013 Annual Homeless Assessment Report to Congress
Homeless Individuals in the United States
CHARACTERISTICS HOMELESS INDIVIDUALSHMIS
EXHIBIT 2.8: GenderSheltered Adult Individuals and Total U.S. Adult Individuals, 2007–2013
EXHIBIT 2.9: AgeSheltered Individuals and Total U.S. Individuals, 2007–2013
Gender and AgeIn 2013• Adults in shelter as individuals are 2.6 times more
likely to be men as they are to be women (72.3% versus 27.7%). In contrast, less than half (46.6%) of individuals in poverty are men.
• 43.9 percent of individuals in shelter are between ages 31 and 50.
• Only 5.4 percent of individuals in shelter are elderly (age 62 or older), a far lower share than those individuals living in poverty (24.5%) or nationwide (31.9%).
• While children living without adults represent 0.1 percent of the U.S. poverty population of individuals, they are almost 2 percent of the population in shelter as individuals. These are unaccompanied youth or children living together (e.g. parenting teens).
Changes Over Time• The gender profile among adult individuals in
shelter has remained stable over time, with women making up between 26 to 28 percent of the population in 2007, 2012, and 2013.
• Between 2012 and 2013, the number of children under age 18 in shelter without an adult dropped by 1.4 percent (237 fewer children).
• The number of elderly people (ages 62 and older) in shelter as individuals increased by 3,113 people between 2012 and 2013. The share of individuals in shelter who are elderly increased from 4.1 percent in 2007 to 5.4 percent in 2013. Those between 51 and 61 years of age also increased, from 18.9 percent in 2007 to 25 percent in 2013.
72.3 27.7
72.3
73.2
49.7
49.7
49.8
27.7
26.8
0% 100%
2012
2007
2013
2012
2007
2013
SHELTEREDADULT
INDIVIDUALS
U.S.ADULT
INDIVIDUALS
Male Female
50.3
50.3
50.2
22.0 25.4 22.7 29.7
22.1 22.5 23.7 31.5
22.2
0.2
0.2
0.1 22.0 23.7 31.9
20.3 51.9 18.9 4.1
24.0
4.8
1.8 43.9 25.0 5.4
24.51.8 45.2 23.7 4.92012
2007
2012
2007
2013
Under Age 18 18–30 31–50
51–61 62 and Older
SHELTEREDINDIVIDUALS
U.S.INDIVIDUALS
0% 100%
2013
Data Source: HMIS 2007–2013; ACS 2006, 2011, 2012
Although the share of individuals in shelter who are elderly is low, it has increased since 2007, from 4.1% to 5.4% in 2013.

The 2013 Annual Homeless Assessment Report to Congress • 2-9
Homeless Individuals in the United States
CHARACTERISTICS HOMELESS INDIVIDUALSHMIS
Ethnicity and RaceIn 2013• People in shelter as individuals were more likely
to identify their ethnicity as Hispanic than were individuals in the U.S. population (13.7% versus 10.4%).
• More than half (55.3%) of people in shelter as individuals were in a minority group, comprised mostly of African Americans (38.3%).
• Individuals in shelter were nearly 2 times more likely to belong to a minority group than were individuals in the U.S. (55.3% versus 28.4%), and were more likely than individuals in the poverty population (41%).
• Whites who are not Hispanic were under-represented among sheltered homeless individuals compared to the U.S. population of individuals (44.7% versus 71.6%), while African Americans were over-represented (38.3% versus 11.6%).
Changes Over Time• The number of Hispanics in shelter as individuals
dropped by 2,910 people, or 2.2 percent, between 2012 and 2013, although the share of Hispanic individuals in shelter remained stable. Over a six-year period, the share of individuals in shelter identifying as Hispanic dropped from 21.5 percent in 2007 to 13.7 percent in 2013.
• Despite an 18.2 percent increase in the number of African American individuals in the U.S. between 2007 and 2013, their number increased by only 6.3 percent (20,785 more people) among individuals in shelter.
• Although minorities living in poverty as individuals increased substantially (by 35.2%) between 2007 and 2013, minorities among sheltered individuals dropped by 11.2 percent over the same period.
EXHIBIT 2.10: EthnicitySheltered Individuals and Total U.S. Individuals, 2007–2013
EXHIBIT 2.11: RaceSheltered Individuals and Total U.S. Individuals, 2007–2013
0% 100%
2012
2012
2007
2013
SHELTEREDINDIVIDUALS
U.S.INDIVIDUALS
Hispanic Non-Hispanic
90.9
89.6
2013 86.313.7
86.413.6
10.4
89.810.2
9.1
2007 78.521.5
42.6 14.1 33.2 2.9 7.3
74.4 5.110.8 8.5 1.3
71.6 7.0 11.6 8.0 1.8
72.1 6.8 11.5 7.9 1.8
2012
2007
2013
2012
2007
2013
SHELTEREDINDIVIDUALS
U.S.INDIVIDUALS
0% 100%
White, Non-Hispanic White, Hispanic
Other One RaceBlack or African American Multiple Races
44.7 38.39.1 3.5 4.5
45.2 36.18.6 5.1 5.0
Data Source: HMIS 2007–2013; ACS 2006, 2011, 2012
Note: Ethnicity is distinguished among the white race group to facilitate an understanding of minorities and non-minorities. Non-minorities are those who identify their ethnicity as not Hispanic and their race as white.

2-10 • The 2013 Annual Homeless Assessment Report to Congress
Homeless Individuals in the United States
CHARACTERISTICS HOMELESS INDIVIDUALSHMIS
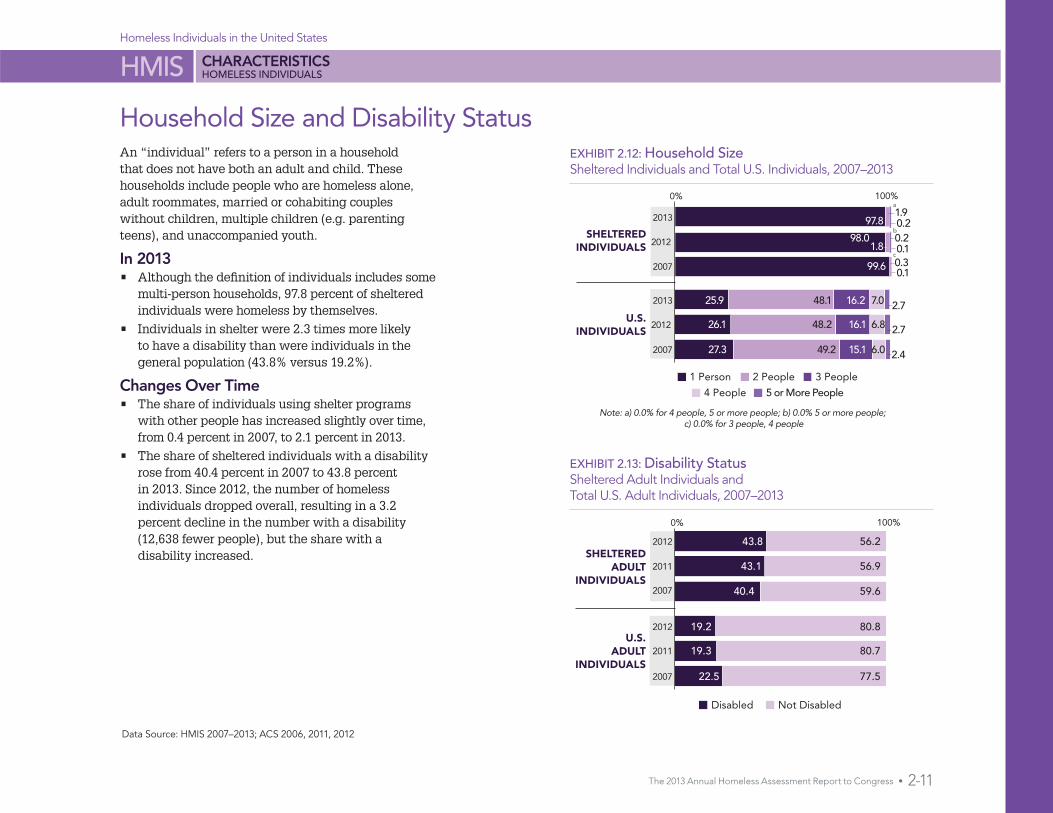
The 2013 Annual Homeless Assessment Report to Congress • 2-11
Homeless Individuals in the United States
CHARACTERISTICS HOMELESS INDIVIDUALSHMIS
Household Size and Disability StatusAn “individual” refers to a person in a household that does not have both an adult and child. These households include people who are homeless alone, adult roommates, married or cohabiting couples without children, multiple children (e.g. parenting teens), and unaccompanied youth.
In 2013• Although the definition of individuals includes some
multi-person households, 97.8 percent of sheltered individuals were homeless by themselves.
• Individuals in shelter were 2.3 times more likely to have a disability than were individuals in the general population (43.8% versus 19.2%).
Changes Over Time• The share of individuals using shelter programs
with other people has increased slightly over time, from 0.4 percent in 2007, to 2.1 percent in 2013.
• The share of sheltered individuals with a disability rose from 40.4 percent in 2007 to 43.8 percent in 2013. Since 2012, the number of homeless individuals dropped overall, resulting in a 3.2 percent decline in the number with a disability (12,638 fewer people), but the share with a disability increased.
EXHIBIT 2.12: Household SizeSheltered Individuals and Total U.S. Individuals, 2007–2013
EXHIBIT 2.13: Disability StatusSheltered Adult Individuals and Total U.S. Adult Individuals, 2007–2013
0% 100%
2011
2007
2012
2011
2007
2012
SHELTEREDADULT
INDIVIDUALS
U.S.ADULT
INDIVIDUALS
Not DisabledDisabled
40.4
19.2
19.3
22.5
43.1
43.8 56.2
56.9
59.6
80.8
80.7
77.5
98.01.8
0.20.1
b
2012
2007
2012
2007
2013
1 Person 2 People 3 People
4 People 5 or More People
SHELTEREDINDIVIDUALS
U.S.INDIVIDUALS
99.6
97.8
48.1 16.2 7.0 2.7
0% 100%
2013
25.9
48.2 16.1 6.8 2.726.1
27.3 49.2 15.1 6.0
1.90.2
2.4
0.10.3
a
c
Note: a) 0.0% for 4 people, 5 or more people; b) 0.0% 5 or more people; c) 0.0% for 3 people, 4 people
Data Source: HMIS 2007–2013; ACS 2006, 2011, 2012

2-12 • The 2013 Annual Homeless Assessment Report to Congress
HMISHomeless Individuals in the United States
Geographic Location In 2013• Three-quarters of people homeless as individuals
were in shelters located in principal cities, with the remaining quarter in suburban and rural areas. This pattern is reversed for all individuals in the U.S. population, with almost three quarters living in suburban and rural areas.
• The geographic distribution of homeless individuals in shelter programs is also markedly different from that of poor individuals. Homeless individuals in shelter are about 2 times more likely to be in cities than poor individuals (74.7% versus 35.4%).
Changes Over Time• Since 2007, the number of individuals using
shelter programs in cities dropped 20 percent (175,314 fewer people), while rising slightly (by 845 people) in suburban and rural areas. As a result, the share of the individual sheltered homeless population in cities dropped from 78.7 percent in 2007 to 74.7 percent in 2013.
• Between 2012 and 2013, the number of individuals using shelter programs dropped both in cities (a 2% drop or 14,249 fewer people) and in suburban and rural areas (a 5.6% drop or 14,126 fewer people). The larger percentage decline in suburban and rural areas created an interruption in the previous year-to-year trend, with the share of individuals who are using shelters in cities increasing very slightly, from 74 percent in 2012 to 74.7 percent in 2013.
SHELTEREDINDIVIDUALS
SUBURBAN AND RURAL AREASPRINCIPAL CITIES 0% 100%
74.7 25.3
26.0
21.3
74.0
78.7
2012
2013
2007
U.S.INDIVIDUALSIN POVERTY*
U.S.INDIVIDUALS*
35.4 64.6
64.5
64.3
35.5
35.7
74.8
74.9
74.9
25.2
25.1
25.1
2012
2013
2007
2012
2013
2007
EXHIBIT 2.14: Geographic Distribution Sheltered Individuals, U.S. Individuals in Poverty, and Total U.S. Individuals, 2007–2013
EXHIBIT 2.15: Percent Change by Geography Sheltered Individuals, U.S. Poverty Population, and Total U.S. Population, 2007–2013 (in %)
Population2012–2013 2007–2013
Principal Cities
Suburban & Rural Areas
Principal Cities
Suburban & Rural Areas
Sheltered Individuals -2.0 -5.6 -20.0 0.4
U.S. Individuals in Poverty* 4.7 5.4 20.1 21.7
U.S. Individuals* 1.9 1.6 7.8 7.3
Data Source: HMIS 2007–2013; ACS 2006, 2010, 2011
* In the 2013 ACS, the geographic indicator used to distinguish principal cities from other areas is not yet available. The data source used to represent 2012 and 2013 are from the most recent two years available.
* In the 2013 ACS, the geographic indicator used to distinguish principal cities from other areas is not yet available. The data source used to represent 2012 and 2013 are from the most recent two years available.
GEOGRAPHY HOMELESS INDIVIDUALS

The 2013 Annual Homeless Assessment Report to Congress • 2-13
Homeless Individuals in the United States
HMIS
In 2013• Sheltered homeless individuals in principal cities
were less likely to be women than those in suburban and rural areas. About 1 out of every 4 individuals using shelter programs in principal cities was a woman, while about 1 in 3 individuals using a shelter program in a suburban or rural area was a woman.
• Individuals using shelter programs in cities were more likely to identify as Hispanic than were those in suburban and rural areas (15.1% versus 8.6%).
• Sheltered individuals in cities were more likely to be in a minority group than those in suburban and rural areas (59.6% versus 42.2%). Of individuals using shelters in cities, 41.2 percent were African American, compared to 29.9 percent in suburban and rural areas.
Changes Over Time• Between 2007 and 2013, the number of women using
shelter as individuals increased by 8,621 (a 13% rise) in suburban and rural areas, while dropping by 36,776 (a 16.9% decline) in cities.
• The share of individuals with a disability using shelter in cities increased from 40.5 percent in 2012 to 42.5 percent in 2013.
Characteristics by Geography
CharacteristicPrincipal Cities Suburban &
Rural Areas
2007 2012 2013 2007 2012 2013
# Sheltered Individuals
877,974 716,909 702,660 236,990 251,961 237,835
Gender of Adults
Male 73.8 73.7 73.8 71.1 68.3 67.9
Female 26.2 26.3 26.2 29.0 31.7 32.1
Ethnicity
Hispanic 23.4 15.3 15.1 14.5 8.9 8.6
Non-Hispanic 76.6 84.8 84.9 85.5 91.2 91.4
Race
White, Non-Hispanic
39.7 40.6 40.4 52.8 58.5 57.8
White, Hispanic 16.0 9.5 10.2 7.5 6.0 5.5
Black or African American
33.6 39.1 41.2 31.6 27.8 29.9
Other One Race 2.8 5.5 3.6 3.0 3.9 3.3
Multiple Races 7.9 5.3 4.7 5.1 3.7 3.5
Age
Under Age 18 5.3 1.8 1.8 3.3 1.6 1.7
18–30 19.4 23.9 23.1 23.8 26.1 26.4
31–50 51.6 45.5 44.0 53.0 44.4 43.5
51–61 19.4 23.8 25.2 17.0 23.4 24.3
62 and Older 4.4 5.0 5.8 3.0 4.5 4.1
Household Size
1 Person 99.8 97.9 97.9 98.9 98.2 97.7
2 People 0.2 1.9 1.9 0.8 1.5 2.0
3 People 0.0 0.2 0.2 0.0 0.1 0.3
4 People 0.0 0.1 0.1 0.0 0.1 0.0
5 or More People 0.0 0.0 0.0 0.3 0.1 0.0
Disability Status of Adults
Disabled 34.1 40.5 42.5 59.3 50.3 47.4
Not Disabled 66.0 59.5 57.5 40.7 49.7 52.6
EXHIBIT 2.16: Characteristics by GeographyHomeless People, 2013 (in %)
Data Source: HMIS 2007–2013; ACS 2006, 2011, 2012
GEOGRAPHY HOMELESS INDIVIDUALS

2-14 • The 2013 Annual Homeless Assessment Report to Congress
Homeless Individuals in the United States
HMIS
Living Situation Before Entering ShelterEXHIBIT 2.17: Places Adult Individuals StayedBefore Entering Shelter and Change Over Time, 2007–2013
Information on where individuals lived before entering shelter was asked only of adults.
In 2013• Just prior to their homeless experience at some time
during 2013, 44.1 percent of adults in shelter as individuals were already homeless and 34.9 percent came from a housing arrangement.
• Of the 307,894 adult individuals in shelter who came from a housed situation, 41.1 percent had been staying with family, 35.2 percent with friends, and 20.7 percent in housing they rented. Only 2 percent had been in housing they owned, and only 0.9 percent entered an emergency shelter or transitional housing program from permanent supportive housing.
• Of the adult individuals in shelter who were not already homeless, almost two-thirds entered from housing, about a quarter from institutional settings, and the rest from other settings, such as motels.
Changes Over Time• In 2013, 1,146 fewer adults in shelter as individuals
came from institutions than had done so in 2012. Fewer adults entered shelter programs from substance abuse treatment centers (2,095 fewer adults) and psychiatric facilities (1,817 fewer adults). However, 608 more adults in shelter as individuals entered from correctional facilities (a 1.2% rise) and 2,158 more entered from hospitals (a 12.9% rise).
• The number of homeless individuals in shelter coming from a friend’s place increased substantially between 2007 and 2013, up by 33 percent or about 29,000 individuals.
EXHIBIT 2.18: Places Adult Individuals Stayed Who Were Not Already HomelessBefore Entering Shelter, 2007–2013 (in %)
20132012
62.561.764.3
23.521.920.4
14.016.415.3
2007
Data Source: HMIS 2007–2013
Place Stayed2013 2012–2013 2007–2013
# % # Change % Change # Change % Change
Already Homeless 389,396 44.1 7,891 1.9 -50,094 -10.8
Sheltered 216,234 55.5 4,721 2.1 -92,242 -28.6
Unsheltered 173,162 45.5 3,170 1.8 39,906 28.2
Housing 307,894 34.9 -15,373 -4.4 -25,593 -7.1
Staying with family 126,513 41 .1 -3,799 -2 .7 -14,294 -9 .5
Staying with friends 108,470 35 .2 -4,680 -3 .9 28,793 33 .0
Rented housing unit 63,729 20 .7 -4,210 -5 .6 -27,601 -27 .9
Owned housing unit 6,285 2 .0 -2,992 -30 .4 -13,101 -65 .7
Permanent supportive housing (PSH)
2,897 0 .9 308 10 .9 610 24 .3
Institutional Settings 115,862 13.1 -1,146 -0.9 3,035 2.6
Substance abuse treatment center
34,443 29.7 -2,095 -5.5 -732 -2.0
Correctional facility 47,612 41.1 608 1.2 -2,153 -4.1
Hospital 17,870 15.4 2,158 12.9 4,618 32.3
Psychiatric facility 15,937 13.8 -1,817 -9.8 1,302 8.5
Other Settings 68,969 7.8 -18,017 -19.5 -17,893 -19.4
Hotel or motel 25,784 37.4 -734 -2.6 3,276 13.6
Foster care home 3,259 4.7 253 7.9 -2,350 -40.6
Other living arrangement 39,926 57.9 -17,536 -28.7 -18,819 -30.2
Note: To produce comparable trend information, statistical imputations were applied to missing values in this table. See the 2013 AHAR methodology document for more details.
PATTERNS OF HOMELESS SERVICE USE HOMELESS INDIVIDUALS
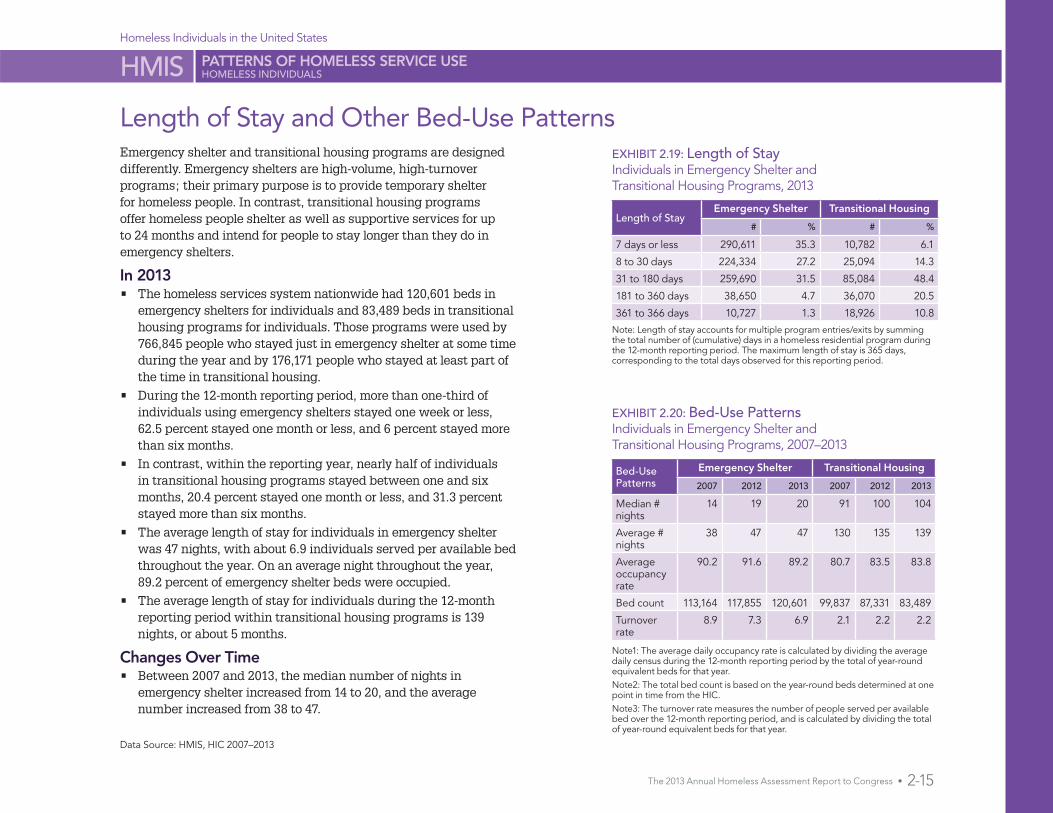
The 2013 Annual Homeless Assessment Report to Congress • 2-15
Homeless Individuals in the United States
HMIS
Length of Stay and Other Bed-Use PatternsEmergency shelter and transitional housing programs are designed differently. Emergency shelters are high-volume, high-turnover programs; their primary purpose is to provide temporary shelter for homeless people. In contrast, transitional housing programs offer homeless people shelter as well as supportive services for up to 24 months and intend for people to stay longer than they do in emergency shelters.
In 2013• The homeless services system nationwide had 120,601 beds in
emergency shelters for individuals and 83,489 beds in transitional housing programs for individuals. Those programs were used by 766,845 people who stayed just in emergency shelter at some time during the year and by 176,171 people who stayed at least part of the time in transitional housing.
• During the 12-month reporting period, more than one-third of individuals using emergency shelters stayed one week or less, 62.5 percent stayed one month or less, and 6 percent stayed more than six months.
• In contrast, within the reporting year, nearly half of individuals in transitional housing programs stayed between one and six months, 20.4 percent stayed one month or less, and 31.3 percent stayed more than six months.
• The average length of stay for individuals in emergency shelter was 47 nights, with about 6.9 individuals served per available bed throughout the year. On an average night throughout the year, 89.2 percent of emergency shelter beds were occupied.
• The average length of stay for individuals during the 12-month reporting period within transitional housing programs is 139 nights, or about 5 months.
Changes Over Time• Between 2007 and 2013, the median number of nights in
emergency shelter increased from 14 to 20, and the average number increased from 38 to 47.
EXHIBIT 2.19: Length of StayIndividuals in Emergency Shelter and Transitional Housing Programs, 2013
EXHIBIT 2.20: Bed-Use PatternsIndividuals in Emergency Shelter and Transitional Housing Programs, 2007–2013
Length of StayEmergency Shelter Transitional Housing
# % # %
7 days or less 290,611 35.3 10,782 6.1
8 to 30 days 224,334 27.2 25,094 14.3
31 to 180 days 259,690 31.5 85,084 48.4
181 to 360 days 38,650 4.7 36,070 20.5
361 to 366 days 10,727 1.3 18,926 10.8
Bed-Use Patterns
Emergency Shelter Transitional Housing
2007 2012 2013 2007 2012 2013
Median # nights
14 19 20 91 100 104
Average # nights
38 47 47 130 135 139
Average occupancy rate
90.2 91.6 89.2 80.7 83.5 83.8
Bed count 113,164 117,855 120,601 99,837 87,331 83,489
Turnover rate
8.9 7.3 6.9 2.1 2.2 2.2
Data Source: HMIS, HIC 2007–2013
Note: Length of stay accounts for multiple program entries/exits by summing the total number of (cumulative) days in a homeless residential program during the 12-month reporting period. The maximum length of stay is 365 days, corresponding to the total days observed for this reporting period.
Note1: The average daily occupancy rate is calculated by dividing the average daily census during the 12-month reporting period by the total of year-round equivalent beds for that year. Note2: The total bed count is based on the year-round beds determined at one point in time from the HIC.Note3: The turnover rate measures the number of people served per available bed over the 12-month reporting period, and is calculated by dividing the total of year-round equivalent beds for that year.
PATTERNS OF HOMELESS SERVICE USE HOMELESS INDIVIDUALS

3H
om
eless Families3Homeless Families
IN THE UNITED STATES
POINT-IN-TIME (PIT)One-Night Estimates of Homeless Families . . . . . . . . . . . . . . . . . . . . 3-3
By State . . . . . . . . . . . . . . . . . . . . . . . . . . . . . . . . . . . . . . . . . . . . . . . . . . 3-4
By State and Sheltered Status . . . . . . . . . . . . . . . . . . . . . . . . . . . . . . . . 3-5
HOMELESS MANAGEMENT INFORMATION SYSTEM (HMIS)One-Year Estimates of Homeless Families . . . . . . . . . . . . . . . . . . . . . . 3-7
Characteristics of Sheltered FamiliesGender and Age . . . . . . . . . . . . . . . . . . . . . . . . . . . . . . . . . . . . . . . . . . . . . . . . . . . .3-8Ethnicity and Race . . . . . . . . . . . . . . . . . . . . . . . . . . . . . . . . . . . . . . . . . . . . . . . . . . .3-9Household Size and Disability Status . . . . . . . . . . . . . . . . . . . . . . . . . . . . . . . . . . 3-11
Geography of Sheltered FamiliesGeographic Location . . . . . . . . . . . . . . . . . . . . . . . . . . . . . . . . . . . . . . . . . . . . . . . 3-12Characteristics by Geography . . . . . . . . . . . . . . . . . . . . . . . . . . . . . . . . . . . . . . . . 3-13
Patterns of Homeless Service Use Among Sheltered FamiliesLiving Situation Before Entering Shelter . . . . . . . . . . . . . . . . . . . . . . . . . . . . . . . 3-14Length of Stay and Other Bed-Use Patterns . . . . . . . . . . . . . . . . . . . . . . . . . . . 3-15
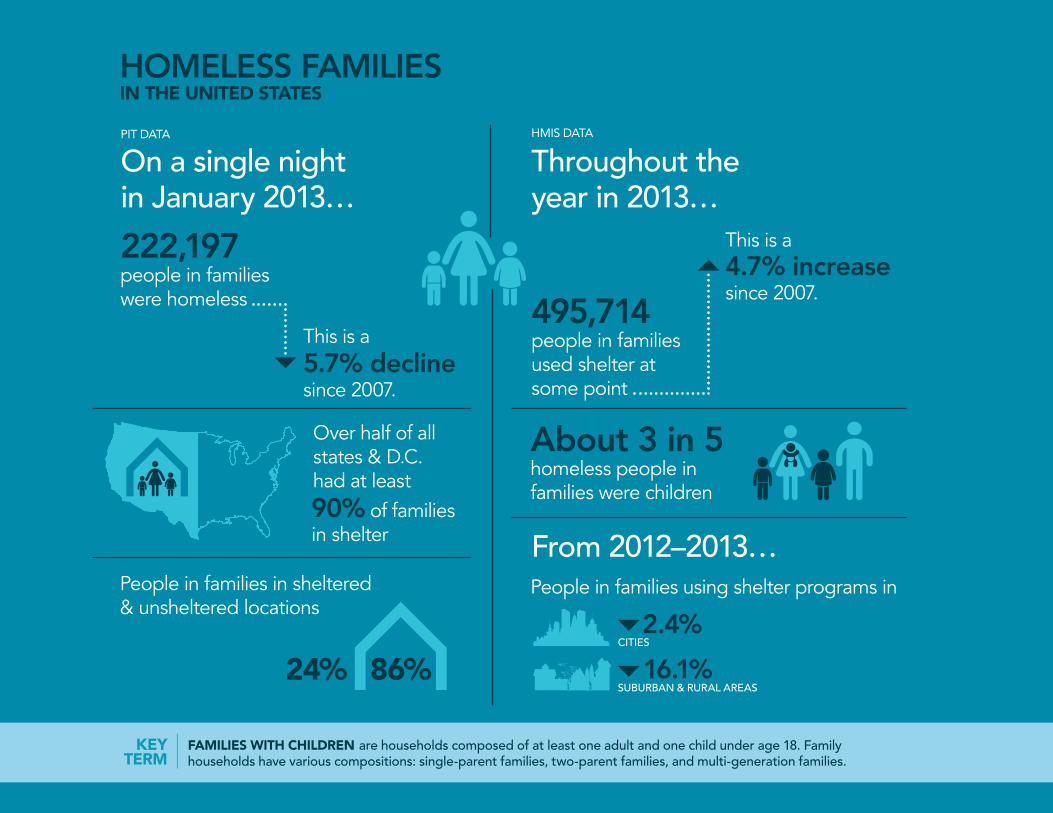
3-2 • The 2013 Annual Homeless Assessment Report to Congress
Homeless Families in the United States
TOTAL ESTIMATES HOMELESS FAMILIESPIT
KEY TERM
FAMILIES WITH CHILDREN are households composed of at least one adult and one child under age 18. Family households have various compositions: single-parent families, two-parent families, and multi-generation families.
HOMELESS FAMILIESIN THE UNITED STATES
222,197 people in families were homeless
since 2007.
since 2007.
This is a
This is a
5.7% decline
4.7% increase
495,714 people in families used shelter at some point
PIT DATA HMIS DATA
People in families using shelter programs in
On a single night in January 2013…
Throughout the year in 2013…
People in families in sheltered & unsheltered locations
86%24% 16.1%
90% of families in shelter
Over half of all states & D.C. had at least
From 2012–2013…
2.4%CITIES
SUBURBAN & RURAL AREAS
About 3 in 5 homeless people in families were children

The 2013 Annual Homeless Assessment Report to Congress • 3-3
One-Night EstimatesOF HOMELESS FAMILIES
PIT
EXHIBIT 3.2: Change in Homeless People in FamiliesPIT Estimates by Sheltered Status, 2007–2013
EXHIBIT 3.1: One-Night Counts of Homeless People in Families PIT Estimates by Sheltered Status, 2007–2013
651,142 643,668633,616 640,466 625,217
591,768622,982
Total Homeless People
Sheltered People in Families Unsheltered People in Families
Homeless People in Families
235,545 236,246 238,110 241,951 236,181 222,197
178,328 181,506 187,313 191,325 186,482 191,571
57,217 54,740 50,797 50,626 49,699 30,626
239,403
190,996
48,407
2007 2008 2009 2010 2012 20132011
YearsTotal Homeless
People in FamiliesSheltered
People in FamiliesUnsheltered
People in Families
# Change % Change # Change % Change # Change % Change
2012 to 2013 -17,206 -7.2 575 0.3 -17,781 -36.7
2011 to 2012 3,222 1.4 4,514 2.4 -1,292 -2.6
2010 to 2011 -5,770 -2.4 -4,843 -2.5 -927 -1.8
2009 to 2010 3,841 1.6 4,012 2.1 -171 -0.3
2008 to 2009 1,864 0.8 5,807 3.2 -16,909 -25.0
2007 to 2008 701 0.3 3,178 1.8 -2,477 -4.3
2007 to 2013 -13,348 -5.7 13,243 7.4 -26,591 -46.5
Data Source: PIT 2007–2013Includes Puerto Rico and U.S. territories
The Point-in-Time (PIT) estimates are one-night counts of both sheltered and unsheltered homeless populations. The one-night counts are conducted by CoCs nationwide and occur
during the last ten days in January. CoCs are required to conduct a point in time count in shelters every year and a street count every other year (on the odd numbered year), although many CoCs do the unsheltered count along with the sheltered count each year.
The PIT count includes estimates of people who are homeless as part of families. “Families with children” are households composed of at least one adult and one child under age 18. Family households have various compositions: single-parent families, two-parent families, and multi-generation families.
On a single night in January 2013• 222,197 people in families were homeless in 70,960 family
households. About 36 percent of all homeless people on a single night were in families.
• Of homeless people in families, 86.2 percent (191,571 people) were in shelters, while only 13.8 percent (30,626 people) were in unsheltered locations.
Chronically homeless people in families• 16.1 percent of chronically homeless people are in families.
Between January 2012 and January 2013• The number of homeless people in families dropped by 7.2 percent
(17,206 fewer people). The number of homeless family households dropped by 8 percent (6,197 fewer households).
• 17,781 fewer people in families were unsheltered (a 36.7% drop).
Between January 2007 and January 2013• The number of homeless people in families on a single night
dropped by 5.7 percent, 13,348 fewer people. The number of homeless family households dropped by 10 percent (7,902 fewer family households).
• The number of sheltered people in families on a single night increased by 7.4 percent (13,243 more people), while the number of unsheltered dropped by 46.5 percent (39,557 fewer people).
Note: The PIT estimates from 2007–2013 are slightly lower than those reported in past AHARs. The reduction reflects an adjustment to the estimates of unsheltered homeless people submitted by the Los Angeles City and County Continuum of Care. The adjustment removed: 20,746 from 2007 and 2008; 9,451 people in 2009 and 2010; 10,800 people in 2011 and 2012; and 18,274 people from 2013. This change applies to all PIT estimates in this section. See the supporting PIT data tabulations posted on HUD’s Resource Exchange at www.hudexchange.info.
Since 2007, the number of homeless people in families on a single night has dropped by 5.7%, or 13,348 fewer people.

3-4 • The 2013 Annual Homeless Assessment Report to Congress
Homeless Families in the United States
TOTAL ESTIMATES HOMELESS FAMILIESPIT
By State
EXHIBIT 3.4: Homeless People in Families by StateLargest Change in PIT Estimates, 2007–2013
EXHIBIT 3.3: Share of Homeless Families In the U.S. by State, 2013 (in %)
Largest Increases Largest DecreasesState # Change % Change State # Change % Change
2012 to 2013
New York 6,762 17.1 Texas -4,452 -33.5
Massachusetts 1,123 10.0 Washington -2,088 -22.6
Maine 347 31.4 Florida -1,896 -10.3
Minnesota 282 6.7 Missouri -1,453 -27.0
Vermont 246 48.5 Ohio -1,408 -23.0
2007 to 2013
New York 11,650 33.7 Texas -4,625 -34.3
Massachusetts 5,500 80.5 Georgia -3,027 -42.5
District of Columbia
1,566 97.7 California -2,940 -10.5
Florida 1,474 9.8 Washington -2,947 -29.2
North Carolina 1,227 36.0 Oregon -2,891 -37.5
ME,
NH,
VT,
NY MA,RI,
CT,NJ,
DE,
DC,
PA,
VAWV
NC,SC
GA
FL
AL
TN,
KY
OHIL
MIWI
MN
IA
MO
AR
LATX
OK
KS
NE
SD
NDMT
WA
OR
CA
AK
HI
WY
CO
NMAZ
UTNV
ID
IN
MS
MD,
Share of Homeless Families
Less than 1%1%–2.9%
Greater than 6%3%–6%
0.4
0.2
1.41.4
0.3
0.2
0.35.6
0.1
0.3
0.3
0.7
0.3
0.3
0.6
0.7
0.62.7
0.3 0.8
0.9
1.4
2.0
1.4
2.1
2.1
3.2
20.92.2
11.42.3
2.50.4
1.81.2
7.5
1.8
0.6
1.1
1.9
1.4
0.6
0.6
0.5
0.6
0.6
0.3
3.2
1.9
4.0
0.2
Data Source: PIT 2007–2013Excludes Puerto Rico and U.S. territories See Part 1 of the 2013 AHAR for more details on PIT estimates by state (www.hudexchange.info)
On a single night in January 2013• Five states accounted for about half of the nation’s
homeless family population: NY (20.9%), CA (11.4%), FL (7.5%), MA (5.6%), and TX (4%).
• In six states, people in families represented more than half of the total homeless population: NY (46,195 people), MA (12,335), MN (4,486), WI (3,099), IA (1,560), and VT (753). In the average state, by comparison, 38 percent of all homeless people were in families.
Between January 2012 and January 2013• The one-night count of family homelessness decreased
or remained constant in 34 states and D.C., totaling 27,345 fewer people. Four states comprised 41.3 percent of the decrease: TX (4,452 fewer people), WA (2,088), FL (1,896), and MO (1,453).
• Family homelessness increased in 16 states, totaling 10,278 more people. More than three-quarters of the increase, 76.7 percent, was in New York (6,762 more people) and Massachusetts (1,123).
Between January 2007 and January 2013• Family homelessness on a single night decreased in
27 states, totaling 40,566 fewer people.
• Family homelessness increased in 23 states and D.C., totaling 26,435 more people, with New York (11,650 more people) and Massachusetts (5,500) comprising nearly 65 percent of the total increase.
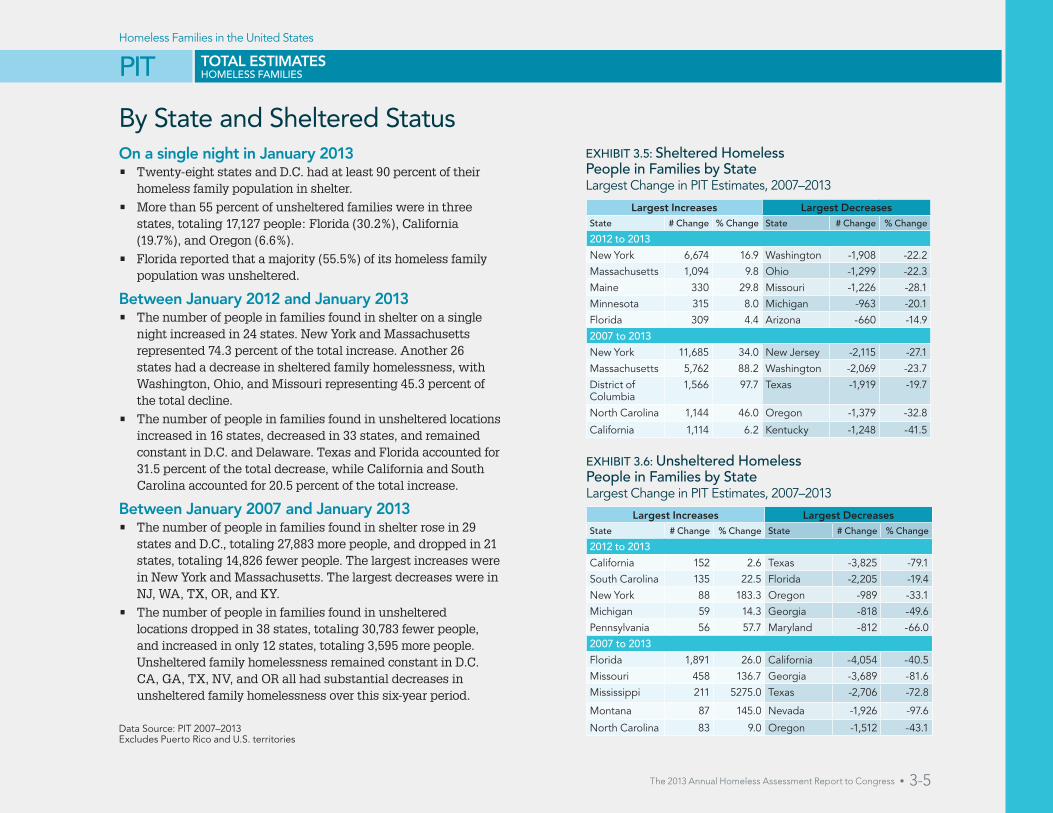
The 2013 Annual Homeless Assessment Report to Congress • 3-5
Homeless Families in the United States
TOTAL ESTIMATES HOMELESS FAMILIESPIT
By State and Sheltered StatusEXHIBIT 3.5: Sheltered Homeless People in Families by StateLargest Change in PIT Estimates, 2007–2013
EXHIBIT 3.6: Unsheltered Homeless People in Families by StateLargest Change in PIT Estimates, 2007–2013
Largest Increases Largest DecreasesState # Change % Change State # Change % Change
2012 to 2013
New York 6,674 16.9 Washington -1,908 -22.2
Massachusetts 1,094 9.8 Ohio -1,299 -22.3
Maine 330 29.8 Missouri -1,226 -28.1
Minnesota 315 8.0 Michigan -963 -20.1
Florida 309 4.4 Arizona -660 -14.9
2007 to 2013
New York 11,685 34.0 New Jersey -2,115 -27.1
Massachusetts 5,762 88.2 Washington -2,069 -23.7
District of Columbia
1,566 97.7 Texas -1,919 -19.7
North Carolina 1,144 46.0 Oregon -1,379 -32.8
California 1,114 6.2 Kentucky -1,248 -41.5
Largest Increases Largest DecreasesState # Change % Change State # Change % Change
2012 to 2013
California 152 2.6 Texas -3,825 -79.1
South Carolina 135 22.5 Florida -2,205 -19.4
New York 88 183.3 Oregon -989 -33.1
Michigan 59 14.3 Georgia -818 -49.6
Pennsylvania 56 57.7 Maryland -812 -66.0
2007 to 2013
Florida 1,891 26.0 California -4,054 -40.5
Missouri 458 136.7 Georgia -3,689 -81.6
Mississippi 211 5275.0 Texas -2,706 -72.8
Montana 87 145.0 Nevada -1,926 -97.6
North Carolina 83 9.0 Oregon -1,512 -43.1Data Source: PIT 2007–2013Excludes Puerto Rico and U.S. territories
On a single night in January 2013• Twenty-eight states and D.C. had at least 90 percent of their
homeless family population in shelter.
• More than 55 percent of unsheltered families were in three states, totaling 17,127 people: Florida (30.2%), California (19.7%), and Oregon (6.6%).
• Florida reported that a majority (55.5%) of its homeless family population was unsheltered.
Between January 2012 and January 2013• The number of people in families found in shelter on a single
night increased in 24 states. New York and Massachusetts represented 74.3 percent of the total increase. Another 26 states had a decrease in sheltered family homelessness, with Washington, Ohio, and Missouri representing 45.3 percent of the total decline.
• The number of people in families found in unsheltered locations increased in 16 states, decreased in 33 states, and remained constant in D.C. and Delaware. Texas and Florida accounted for 31.5 percent of the total decrease, while California and South Carolina accounted for 20.5 percent of the total increase.
Between January 2007 and January 2013• The number of people in families found in shelter rose in 29
states and D.C., totaling 27,883 more people, and dropped in 21 states, totaling 14,826 fewer people. The largest increases were in New York and Massachusetts. The largest decreases were in NJ, WA, TX, OR, and KY.
• The number of people in families found in unsheltered locations dropped in 38 states, totaling 30,783 fewer people, and increased in only 12 states, totaling 3,595 more people. Unsheltered family homelessness remained constant in D.C. CA, GA, TX, NV, and OR all had substantial decreases in unsheltered family homelessness over this six-year period.

3-6 • The 2013 Annual Homeless Assessment Report to Congress
Homeless Families in the United States
CHARACTERISTICS HOMELESS FAMILIESHMIS
PROFILE OF A TYPICAL HOMELESS PERSON IN A FAMILY IN 2013
60.9% WERE
79.3% FEMALE / 53.4% 2- OR 3-PERSON HOUSEHOLD
48.5% WERE 80.1% HAD
66.8% WERE IN A
NIGHTS SPENT IN EMERGENCY SHELTER
PRIOR TO USING A SHELTER IN 2013, 45.4% WERE
A Young Mother in Shelter with a Child
Under Age 18
Staying with Family
African American
No Disability
City
32

The 2013 Annual Homeless Assessment Report to Congress • 3-7
One-Year EstimatesOF SHELTERED FAMILIES
HMIS
2007–2013
43,1839.1%
473,541People inFamilies
516,724 535,447 567,334 537,414 535,420 495,714
130,968 159,142 170,129 156,540167,854
43,183 18,723 31,887 -29,920 -39,7069.1% 3.6% 6.0% -5.3% -7.4%
-1,994
-0.4%
FamilyHouseholds
2007 2008 2009 2010 2011 20132012
168,227 172,767
EXHIBIT 3.7: One-year Estimates of Sheltered Families, 2007–2013
Data Source: HMIS 2007–2013; ACS 2012
The one-year estimates account for all people in families who used an emergency shelter or transitional housing program at any time from October 1 through
September 30 of the reporting year. The estimates are based on a nationally representative sample of communities that submit aggregate Homeless Management Information Systems (HMIS) data to HUD. The estimates statistically adjust for homeless people in shelter programs that do not yet participate in their local HMIS—thus providing a complete enumeration of sheltered people in families in each community—and are weighted to represent the entire country. The one-year estimates do not include: (a) sheltered people in families in Puerto Rico and the U.S. territories; (b) people in families served by victim service providers; and (c) people in families in unsheltered locations who never accessed a shelter program during the 12-month period. The 95 percent confidence interval for sheltered people in families in 2013 is ± 46,639 (449,075 to 542,353).
“Families with children” refers to households composed of at least one adult and one child under age 18. Family households have various compositions: single-parent families, two-parent families, and multi-generation families.
2013 Estimate of Sheltered Families• An estimated 495,714 people in 156,540 families used
an emergency shelter or transitional housing program between October 1, 2012 and September 30, 2013.
• People in families comprised 34.9 percent of the total sheltered homeless population in 2013.
Changes Over Time• Between 2012 and 2013, the number of people in families
using shelter at some time during the year dropped by 7.4 percent or 39,706 people, marking the largest decline in family homelessness since data collection began in 2007. The number of family households dropped by 6.7 percent or more than 11,000 households.
• Sheltered family homelessness increased 19.8 percent (93,793 more people) between 2007 and 2010, but has declined by 12.6 percent (71,620 fewer people) since then.
In 2013, 495,714 people in families were in shelter in the U.S., a drop of 7.4% from 2012 and the largest one-year decline since 2007.

3-8 • The 2013 Annual Homeless Assessment Report to Congress
Homeless Families in the United States
HMIS CHARACTERISTICS HOMELESS FAMILIES
EXHIBIT 3.8: GenderSheltered Adults in Families and Total U.S. Adults in Families, 2007–2013
EXHIBIT 3.9: AgeSheltered People in Families and Total U.S. Population in Families, 2007–2013
Gender and AgeIn 2013• Most sheltered adults in families were women.
Sheltered adults in families were more likely to be women than adults in U.S. families (79.3% versus 54.5%), and also more likely than adults in poor families (79.3% versus 64.2%).
• Of the 301,348 children in families using shelter, most were very young: 40.8 percent were ages 1 to 5, and 10 percent were younger than age one.
• Adults in families were relatively young, with a sizable share (20.9%) between 18 and 30 years old.
Changes Over Time• Between 2012 and 2013, the number of sheltered
women in families declined 7.1 percent (11,709 fewer women).
• While the number of children in poor families increased 23.4 percent and remained stable in U.S. families between 2007 and 2013, the number of sheltered children in families increased 4.7 percent (13,522 more children).
18.0 82.0
0% 100%
77.9
45.5
45.5
46.0
22.1
54.5
54.5
54.0
2012
2007
2013
2012
2007
2013
SHELTEREDADULTS
IN FAMILIES
U.S.ADULTS
IN FAMILIES
Male Female
79.320.7
Sheltered Persons in Families U.S. Persons in Families Age 2007 2012 2013 2007 2012 2013Under Age 18 61.6% 60.3% 60.9% 46.6% 46.4% 46.3%18 - 30 20.9% 21.9% 20.9% 14.5% 14.4% 14.3%31 - 50 16.0% 16.6% 16.9% 32.2% 31.2% 31.2%51 - 61 1.2% 1.0% 1.2% 4.7% 5.6% 5.7%62 and Older 0.3% 0.1% 0.1% 2.0% 2.4% 2.5%
2012
2007
2012
2007
2013
60.3 21.9 16.61.00.1
Under Age 18 18–30 31–50
51–61 62 and Older
SHELTEREDPEOPLE
IN FAMILIES
U.S.PEOPLE
IN FAMILIES46.6 14.5 32.2 4.7 2.0
46.4 14.4 31.2 5.6 2.4
46.3 14.3 31.2 5.7 2.5
0% 100%
61.6 20.9 16.0 1.20.3
2013 60.9 20.9 16.91.20.1
Data Source: HMIS 2007–2013; ACS 2006, 2011, 2012
In 2013, more than half of children in families using shelter programs are under the age of 6.

The 2013 Annual Homeless Assessment Report to Congress • 3-9
Homeless Families in the United States
CHARACTERISTICS HOMELESS FAMILIESHMIS
Ethnicity and RaceIn 2013• The share of people in sheltered homeless families
identifying as Hispanic was similar to that of the U.S. family population, 21.9 percent versus 23.2 percent. However, a larger share of poor people in families was Hispanic, 34.9 percent.
• Sheltered people in families were 3.5 times more likely to be African American than people in U.S. families (48.5% versus 13.7%) and 2.1 times more likely than in the U.S. population of families living in poverty (48.5% versus 23.5%).
• The share of sheltered people in families who identify as white and not Hispanic is lower than that of all people in U.S. families (24% versus 54.3%) or of people in families living in poverty (24% versus 34.2%).
Changes Over Time• Although the number of Hispanics in families using shelter
programs increased 12.2 percent (11,587 more people) since 2007, their share of the sheltered population remained stable between 2007 (21.8%) and 2013 (21.9%).
• The number of people in families who were African American and in shelter programs increased by 9,812, although the overall share declined during this time, from 55.2% (2007) to 48.5% (2013). The proportion of African Americans in U.S. families remained stable and in poor families dropped from 26.2 to 23.5 percent over the six-year period.
• The share of people in families using shelter that was white and not Hispanic rose between 2007 and 2012 and then dropped between 2012 and 2013, resulting in an overall increase between 2007 and 2013. In the U.S. poverty population in families, the share that is white and not Hispanic dropped overall from 36.3 to 34.2 percent over the six-year period.
EXHIBIT 3.10: EthnicitySheltered People in Families and Total U.S. Population in Families, 2007–2013
EXHIBIT 3.11: RaceSheltered People in Families and Total U.S. Population in Families, 2007–2013
0% 100%
2012
2012
2007
2013
SHELTEREDPEOPLE
IN FAMILIES
U.S.PEOPLE
IN FAMILIES
Hispanic Non-Hispanic
80.1
76.8
2013 78.121.9
23.2
77.1
78.821.2
22.9
19.9
2007 78.221.8
21.3 9.8 55.2 6.3 7.3
58.8 10.1 13.8 14.5 2.7
54.3 15.1 13.7 13.0 3.9
54.8 14.7 13.6 13.1 3.8
2012
2007
2013
2012
2007
2013
SHELTEREDPEOPLE
IN FAMILIES
U.S.PEOPLE
IN FAMILIES
0% 100%
White, Non-Hispanic/Non-Latino White, Hispanic/Latino
Other One RaceBlack or African American Multiple Races
23.8 48.712.1 5.0 10.5
27.7 45.011.3 4.8 11.3
Data Source: HMIS 2007–2013; ACS 2006, 2011, 2012
Note: Ethnicity is distinguished among the white race group to facilitate an understanding of minorities and non-minorities. Non-minorities are those who identify their ethnicity as not Hispanic and their race as white.
3-10 • The 2013 Annual Homeless Assessment Report to Congress
Homeless Families in the United States
CHARACTERISTICS HOMELESS FAMILIESHMIS
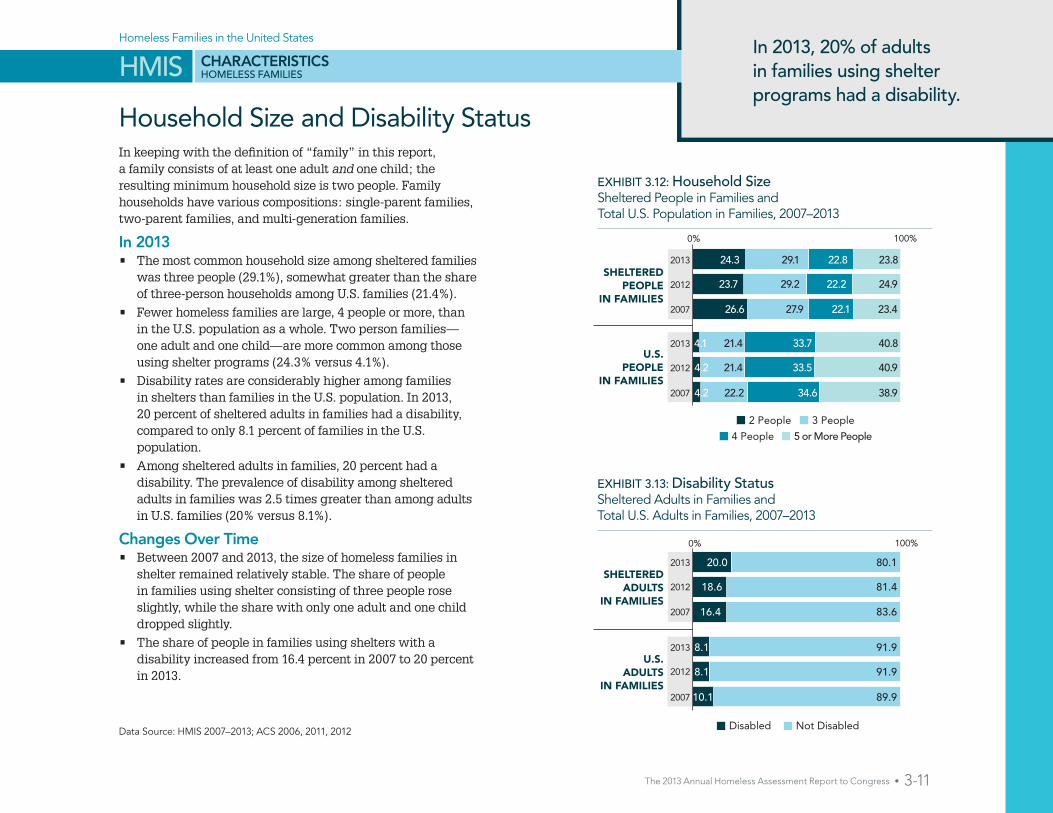
The 2013 Annual Homeless Assessment Report to Congress • 3-11
Homeless Families in the United States
CHARACTERISTICS HOMELESS FAMILIESHMIS
Household Size and Disability StatusIn keeping with the definition of “family” in this report, a family consists of at least one adult and one child; the resulting minimum household size is two people. Family households have various compositions: single-parent families, two-parent families, and multi-generation families.
In 2013• The most common household size among sheltered families
was three people (29.1%), somewhat greater than the share of three-person households among U.S. families (21.4%).
• Fewer homeless families are large, 4 people or more, than in the U.S. population as a whole. Two person families—one adult and one child—are more common among those using shelter programs (24.3% versus 4.1%).
• Disability rates are considerably higher among families in shelters than families in the U.S. population. In 2013, 20 percent of sheltered adults in families had a disability, compared to only 8.1 percent of families in the U.S. population.
• Among sheltered adults in families, 20 percent had a disability. The prevalence of disability among sheltered adults in families was 2.5 times greater than among adults in U.S. families (20% versus 8.1%).
Changes Over Time• Between 2007 and 2013, the size of homeless families in
shelter remained relatively stable. The share of people in families using shelter consisting of three people rose slightly, while the share with only one adult and one child dropped slightly.
• The share of people in families using shelters with a disability increased from 16.4 percent in 2007 to 20 percent in 2013.
EXHIBIT 3.12: Household SizeSheltered People in Families and Total U.S. Population in Families, 2007–2013
EXHIBIT 3.13: Disability StatusSheltered Adults in Families and Total U.S. Adults in Families, 2007–2013
0% 100%
2012
2007
2013
2012
2007
2013
SHELTEREDADULTS
IN FAMILIES
U.S.ADULTS
IN FAMILIES
Not DisabledDisabled
16.4
8.1
10.1
20.0 80.1
83.6
91.9
8.1
18.6 81.4
91.9
89.9
2012
2007
2012
2007
2013
2 People 3 People
4 People 5 or More People
24.3
26.6
29.1
21.4 33.7
27.9
22.8
22.1
23.8
23.7 29.2 22.2 24.9
23.4
40.8
0% 100%
2013
4.1
21.4 33.5 40.94.2
4.2 22.2 34.6 38.9
SHELTEREDPEOPLE
IN FAMILIES
U.S.PEOPLE
IN FAMILIES
Data Source: HMIS 2007–2013; ACS 2006, 2011, 2012
In 2013, 20% of adults in families using shelter programs had a disability.
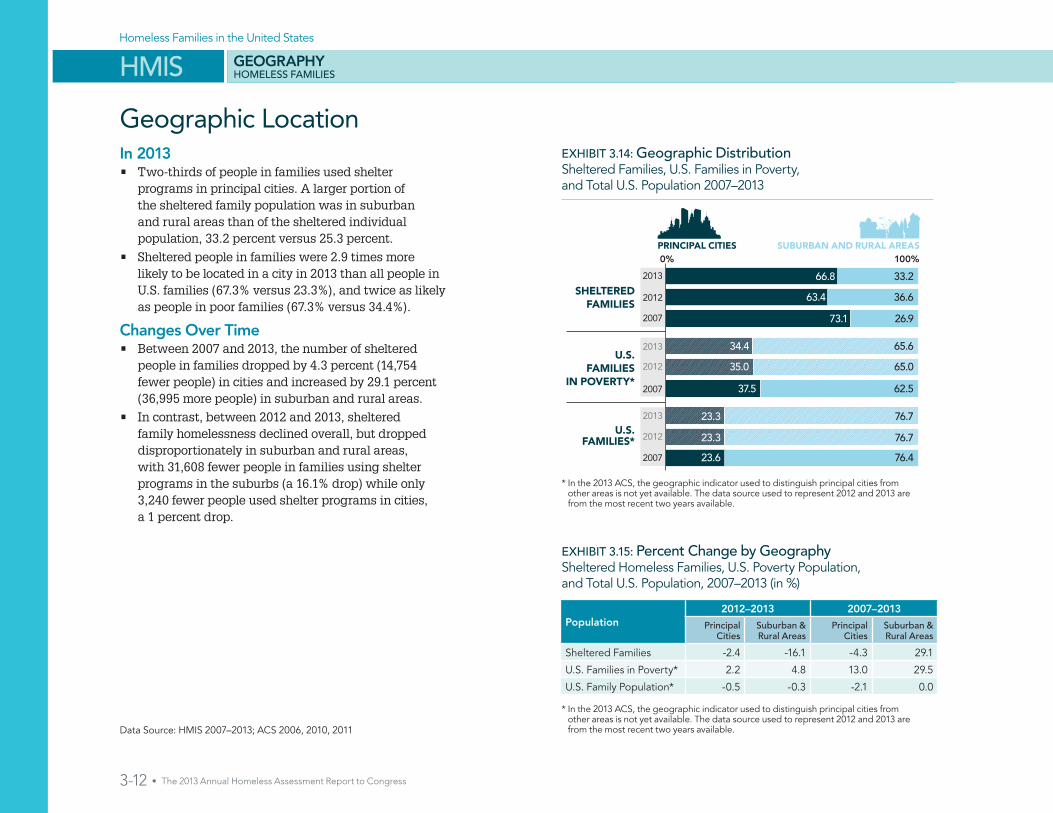
3-12 • The 2013 Annual Homeless Assessment Report to Congress
Homeless Families in the United States
HMIS
Geographic Location
SHELTEREDFAMILIES
SUBURBAN AND RURAL AREASPRINCIPAL CITIES 0% 100%
66.8 33.2
36.6
26.9
63.4
73.1
2012
2013
2007
U.S.FAMILIES
IN POVERTY*
U.S.FAMILIES*
34.4 65.6
65.0
62.5
35.0
37.5
76.7
76.7
76.4
23.3
23.3
23.6
2012
2013
2007
2012
2013
2007
EXHIBIT 3.14: Geographic Distribution Sheltered Families, U.S. Families in Poverty, and Total U.S. Population 2007–2013
EXHIBIT 3.15: Percent Change by Geography Sheltered Homeless Families, U.S. Poverty Population, and Total U.S. Population, 2007–2013 (in %)
Population2012–2013 2007–2013
Principal Cities
Suburban & Rural Areas
Principal Cities
Suburban & Rural Areas
Sheltered Families -2.4 -16.1 -4.3 29.1
U.S. Families in Poverty* 2.2 4.8 13.0 29.5
U.S. Family Population* -0.5 -0.3 -2.1 0.0
Data Source: HMIS 2007–2013; ACS 2006, 2010, 2011
In 2013• Two-thirds of people in families used shelter
programs in principal cities. A larger portion of the sheltered family population was in suburban and rural areas than of the sheltered individual population, 33.2 percent versus 25.3 percent.
• Sheltered people in families were 2.9 times more likely to be located in a city in 2013 than all people in U.S. families (67.3% versus 23.3%), and twice as likely as people in poor families (67.3% versus 34.4%).
Changes Over Time• Between 2007 and 2013, the number of sheltered
people in families dropped by 4.3 percent (14,754 fewer people) in cities and increased by 29.1 percent (36,995 more people) in suburban and rural areas.
• In contrast, between 2012 and 2013, sheltered family homelessness declined overall, but dropped disproportionately in suburban and rural areas, with 31,608 fewer people in families using shelter programs in the suburbs (a 16.1% drop) while only 3,240 fewer people used shelter programs in cities, a 1 percent drop.
* In the 2013 ACS, the geographic indicator used to distinguish principal cities from other areas is not yet available. The data source used to represent 2012 and 2013 are from the most recent two years available.
* In the 2013 ACS, the geographic indicator used to distinguish principal cities from other areas is not yet available. The data source used to represent 2012 and 2013 are from the most recent two years available.
GEOGRAPHY HOMELESS FAMILIES

The 2013 Annual Homeless Assessment Report to Congress • 3-13
Homeless Families in the United States
HMIS
Characteristics by GeographyIn 2013• Homeless people in families using shelter programs
in suburban and rural areas were twice as likely to be white and not Hispanic as those in cities (35.9% versus 18.1%).
• Household sizes and rates of adult disability of sheltered families were similar regardless of the type of geographic location in which families used shelter programs.
Changes Over Time• The share of people in families using shelter
programs in suburban and rural areas who identify as Hispanic increased from 13.4 percent in 2007 to 16.1 percent in 2013.
• Between 2012 and 2013, the number of people in families who are white and not Hispanic using shelter programs in suburban and rural areas declined (29,710 fewer people, or a 34% drop) and increased slightly in cities (1,698 more people, or a 3% rise), while African Americans showed the opposite trend.
• The number of African Americans in families using shelter programs in suburban and rural areas increased 14 percent (8,146 more people), but declined 4.1 percent (7,162 fewer people) in cities between 2012 and 2013.
• The increase in the share of sheltered adults in families with a disability was larger in cities (15.4% in 2007 to 19.8% in 2013) than in suburban and rural areas (18.7% in 2007 to 20.4% in 2013).
CharacteristicPrincipal Cities Suburban &
Rural Areas
2007 2012 2013 2007 2012 2013
# Sheltered Individuals
346,032 339,452 331,278 127,283 195,886 164,278
Gender of Adults
Male 17.8 20.6 20.8 18.3 24.6 20.6
Female 82.2 79.4 79.2 81.7 75.4 79.5
Ethnicity
Hispanic 24.6 25.0 24.8 13.4 14.6 16.1
Non-Hispanic 75.4 75.0 75.2 86.6 85.4 83.9
Race
White, Non-Hispanic 18.6 17.3 18.1 28.1 45.7 35.9
White, Hispanic 11.8 12.0 12.8 5.0 10.0 10.8
Black or African American
56.0 53.5 52.1 53.3 30.3 41.2
Other One Race 7.3 4.3 5.4 3.7 5.6 4.2
Multiple Races 6.4 12.9 11.7 9.8 8.4 7.9
Age
Under Age 18 60.9 60.9 60.9 63.4 59.3 60.9
18–30 21.5 21.9 21.1 19.2 22.0 20.6
31–50 15.9 16.0 16.7 16.3 17.7 17.2
51–61 1.3 1.1 1.2 1.0 1.0 1.2
62 and Older 0.4 0.1 0.2 0.1 0.1 0.1
Household Size
1 Person n/a n/a n/a n/a n/a n/a
2 People 28.3 24.4 24.0 22.0 22.6 24.8
3 People 27.6 29.0 29.0 28.9 29.6 29.3
4 People 21.6 21.6 22.5 23.4 23.1 23.4
5 or More People 22.5 25.0 24.5 25.7 24.7 22.5
Disability Status of Adults
Disabled 15.4 17.6 19.8 18.7 20.3 20.4
Not Disabled 84.7 82.4 80.3 81.3 79.7 79.6
EXHIBIT 3.16: Characteristics by GeographySheltered People in Families, 2013 (in %)
Data Source: HMIS 2007–2013
GEOGRAPHY HOMELESS FAMILIES

3-14 • The 2013 Annual Homeless Assessment Report to Congress
Homeless Families in the United States
HMIS
Living Situation Before Entering ShelterInformation on where people in families lived before entering shelter was asked only of adults.
In 2013• Just prior to their sheltered homeless experience in
2013, 59.9 percent of sheltered adults in families were in a housed situation. Of the 107,838 people who entered shelter from housing during the reporting period, 45.4 percent had been staying with family, 28.5 percent were in housing they rented, and 24.5 percent had been staying with friends.
• Another 30.3 percent of sheltered adults in families were already homeless at the start of their use of shelter during the reporting period. Of these 54,610 adults, 79.6 percent were in shelter programs, and 20.4 percent were in a place not meant for human habitation.
• Of those sheltered adults in families who were not already homeless, 2.6 percent (3,310 adults) entered shelter from an institutional setting, more than half of them (1,893 adults) from substance abuse treatment or detox centers.
Changes Over Time• Between 2012 and 2013, the number of sheltered
adults in families who lived in housing prior to entering shelter declined by 7.2 percent (9,173 people). Nonetheless, the share of families entering shelter from housing was about the same in both years (about 60 percent).
• Since 2007, the number of homeless people in family coming from a housing arrangement has increased dramatically, by 47.8 percent, or about 38.000 people. Many of them are coming from housing they rent or from staying with family.
EXHIBIT 3.17: Places Adults in Families StayedBefore Entering Shelter and Change Over Time, 2007–2013
EXHIBIT 3.18: Places Adults in Families Stayed Who Were Not Already HomelessBefore Entering Shelter, 2007–2013 (in %)
20132012
85.987.178.12.62.33.3
11.510.618.6
2007
Place Stayed2013 2012-2013 2007–2013
# % # Change % Change # Change % Change
Already Homeless 54,610 30.3 -8,641 -13.2 12,717 28.9
Sheltered 43,469 79.6 -4,975 -9.9 5,473 14.0
Unsheltered 11,141 20.4 -3,666 -24.2 6,455 128.7
Housing 107,838 59.9 -9,173 -7.2 38,323 47.8
Staying with family 48,955 45 .4 -2,608 -4 .7 17,172 48 .2
Staying with friends 26,448 24 .5 -687 -2 .4 8,645 44 .1
Rented housing unit 30,719 28 .5 -5,429 -13 .3 17,310 95 .6
Owned housing unit 1,517 1 .4 -409 -18 .9 -4,615 -72 .4
Permanent supportive housing (PSH)
199 0 .2 -40 -15 .7 -189 -46 .8
Institutional Settings 3,310 1.8 73 2.2 307 9.8
Substance abuse treatment center
1,893 57.2 -198 -9.2 46 2.4
Correctional facility 944 28.5 342 52.5 424 74.5
Hospital 402 12.1 -5 -1.2 -144 -25.7
Psychiatric facility 71 2.1 -66 -47.1 -19 -20.4
Other Settings 14,377 8.0 -658 -4.2 -3,980 -20.9
Hotel or motel 10,192 70.9 681 7.0 -2,569 -19.7
Foster care home 168 1.2 -31 -14.7 135 300.0
Other living arrangement
4,017 27.9 -1,308 -22.8 -1,546 -25.9
Data Source: HMIS 2007–2013
Note: To produce comparable trend information, statistical imputations were applied to missing values in this table. See the 2013 AHAR methodology document for more details.
PATTERNS OF HOMELESS SERVICE USE HOMELESS FAMILIES

The 2013 Annual Homeless Assessment Report to Congress • 3-15
Homeless Families in the United States
HMIS
Length of Stay and Other Bed-Use PatternsEmergency shelter and transitional housing programs are designed differently. Emergency shelters are high-volume, high-turnover programs; their primary purpose is to provide temporary shelter for homeless people. In contrast, transitional housing programs offer homeless people shelter as well as supportive services for up to 24 months and intend for people to stay longer than they do in emergency shelters.
In 2013• The homeless services system nationwide had 118,107 beds in
emergency shelters for families, and 101,843 beds in transitional housing programs for families. Those programs were used by 353,506 people who stayed just in emergency shelter at some time during the year and by 142,208 people who stayed at least part of the time in transitional housing.
• During the 12-month reporting period, 21.7 percent of people in families using emergency shelter stayed a week or less, almost half stayed one month or less, 38.2 percent stayed one to six months, and 12.4 percent stayed more than six months.
• A typical stay in transitional housing programs was between one and six months. Only 16.2 percent of people in families were in transitional housing for the entire 12-month reporting period.
• Sheltered people in families stayed in emergency shelter 73 nights on average, or almost two and a half months. Emergency shelters served 4.3 people per available bed throughout the year.
• Sheltered people in families using transitional housing programs stayed an average of 175 nights (nearly 6 months) during the observed year.
Changes Over Time• The number of people in families using just emergency shelter
increased by 8.1 percent.
• The number of people in families using transitional housing at any point during a year declined by 3.1 percent.
• Between 2012 and 2013, bed occupancy rates in emergency shelters increased, from 82.9 to 86.6 percent. The average number of nights people in families stayed in emergency shelter also increased, from 65 to 73 nights.
EXHIBIT 3.19: Length of StayPeople in Families in Emergency Shelter and Transitional Housing Programs, 2013
EXHIBIT 3.20: Bed-Use PatternsPeople in Families in Emergency Shelter and Transitional Housing Programs, 2007–2013
Length of StayEmergency Shelter Transitional Housing
# % # %
7 days or less 85,033 21.7 5,159 3.6
8 to 30 days 108,099 27.6 13,044 9.2
31 to 180 days 149,561 38.2 61,735 43.5
181 to 360 days 28,968 7.4 39,054 27.5
361 to 366 days 19,559 5.0 23,044 16.2
Bed-Use Patterns
Emergency Shelter Transitional Housing
2007 2012 2013 2007 2012 2013
Median # nights 30 28 32 151 157 151
Average # nights
67 65 73 174 178 175
Average occupancy rate
85.9 82.9 86.6 72.9 81.1 80.0
Bed Count 98,287 111,351 118,107 111,368 109,861 101,843
Turnover rate 4.9 4.7 4.3 1.6 1.7 1.7
Note1: The average daily occupancy rate is calculated by dividing the average daily census during the 12-month reporting period by the total of year-round equivalent beds for that year. Note2: The total bed count is based on the year-round beds determined at one point in time from the HIC.Note3: The turnover rate measures the number of people served per available bed over the 12-month reporting period, and is calculated by dividing the total of year-round equivalent beds for that year.
Note: Length of stay accounts for multiple program entries/exits by summing the total number of (cumulative) days in a homeless residential program during the 12-month reporting period. The maximum length of stay is 365 days, corresponding to the total days observed for this reporting period.
Data Source: HMIS, HIC 2007–2013
PATTERNS OF HOMELESS SERVICE USE HOMELESS FAMILIES

4U
naccom
panied
Ho
meless C
hildren and
Youth
4Unaccompanied Homeless Children and Youth IN THE UNITED STATES
POINT-IN-TIME (PIT)One-Night Estimates Estimates of Unaccompanied Homeless Children and Youth . . . . . . . . . . . . . . . . . 4-3
By State and Sheltered Status . . . . . . . . . . . . . . . . . . . . . . . . . . . . . . . . 4-5
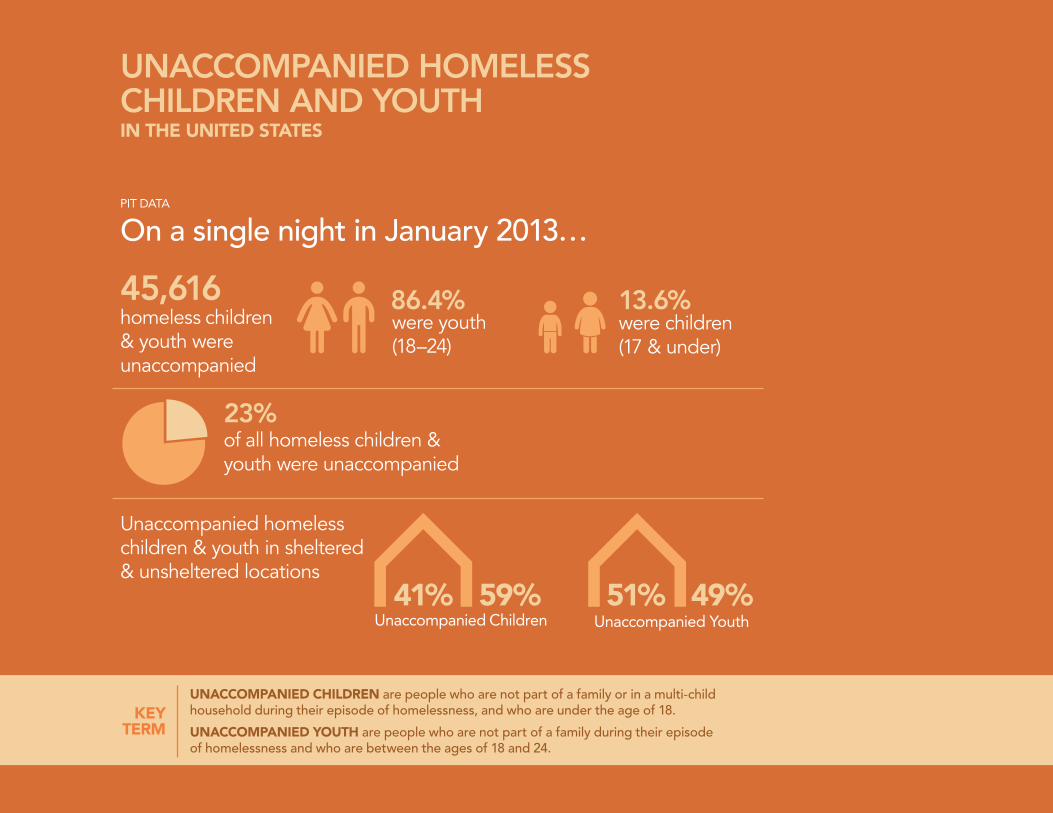
4-2 • The 2013 Annual Homeless Assessment Report to Congress
Unaccompanied Homeless Children and Youth in the United States
TOTAL ESTIMATES UNACCOMPANIED HOMELESS CHILDREN AND YOUTHPIT
UNACCOMPANIED CHILDREN are people who are not part of a family or in a multi-child household during their episode of homelessness, and who are under the age of 18.
UNACCOMPANIED YOUTH are people who are not part of a family during their episode of homelessness and who are between the ages of 18 and 24.
KEY TERM
UNACCOMPANIED HOMELESS CHILDREN AND YOUTHIN THE UNITED STATES
45,616 homeless children & youth were unaccompanied
13.6% 86.4%
PIT DATA
On a single night in January 2013…
Unaccompanied homeless children & youth in sheltered & unsheltered locations
51%59% 49%41%
were children (17 & under)
were youth (18–24)
of all homeless children & youth were unaccompanied
Unaccompanied YouthUnaccompanied Children
23%

The 2013 Annual Homeless Assessment Report to Congress • 4-3
EXHIBIT 4.1: Homeless and Unaccompanied Children and YouthPIT Estimates by Age, 2013
EXHIBIT 4.2: Homeless Unaccompanied Children and Youth, Older Individual Adults, and People in FamiliesBy Sheltered Status, 2013 (in %)
Homeless PopulationAll Homeless
Children & Youth
Unaccompanied Homeless
Children & Youth
# % # %
Total homeless children & youth
198,382 100.0% 45,616 100.0%
Children (17 and under) 138,149 69.6% 6,197 13.6%
Youth (18–24) 60,233 30.4% 39,419 86.4%
UnaccompaniedYouth (18-24)
Individual Adults >24
People in Families
Children in multi-childhouseholds
UnaccompaniedChildren (under 18)
0% 100%
Sheltered Unsheltered
40.7
45.7
51.4
52.7
86.2
47.3
13.8
48.6
59.3
54.3
Data Source: PIT 2013Includes Puerto Rico and U.S. territories
One-Night EstimatesOF UNACCOMPANIED HOMELESS CHILDREN AND YOUTH
PIT
45,616 homeless children and youth were unaccompanied on a night in January 2013—86.4% were youth and 13.6% were children.
Note: The 2013 PIT estimates are slightly lower than estimates reported in the 2013 AHAR Part 1. The reduction reflects an adjustment to the estimates of unsheltered homeless individuals submitted by the Los Angeles City and County Continuum of Care. The adjustment removed 1,308 youth and 16,966 adults age 25 and older from 2013. This change applies to all PIT estimates in this section. See the supporting PIT data tabulations posted on HUD’s Resource Exchange at www.hudexchange.info.
For the first time, communities submitted PIT estimates of homelessness in three age categories: 17 and under, 18 to 24, and 25 and older. This section
describes the extent of homelessness among children (17 and under) and youth (18 to 24), focusing mostly on unaccompanied children and youth. Unaccompanied children are homeless alone, and not in the company of an adult (18 or older). Unaccompanied youth are assumed to be homeless alone and are not in the company of a child.
On a Single Night in January 2013 • 45,616 homeless children and youth were
unaccompanied on a night in January 2013. Among them, 86.4 percent were youth ages 18 to 24 and the remaining 13.6 percent were children age 17 and under.
• Of all the 198,382 children and youth who were homeless, 23 percent were unaccompanied (45,616 people).
• Of all the 60,233 youth homeless on one night, nearly two-thirds (65.4%) were unaccompanied. In contrast, a much smaller share of all homeless children was unaccompanied (4.5%).
• Unaccompanied children and youth, who are homeless as individuals, make up 12.3 percent of all homeless individuals on the one-night count.
• Nearly 6 in 10 unaccompanied children (3,675 children) were counted in places not meant for human habitation.
• Slightly under half of unaccompanied youth were in unsheltered locations, about the same rate as for individual adults 25 years and older.

4-4 • The 2013 Annual Homeless Assessment Report to Congress
Unaccompanied Homeless Children and Youth in the United States
TOTAL ESTIMATES UNACCOMPANIED HOMELESS CHILDREN AND YOUTHPIT

The 2013 Annual Homeless Assessment Report to Congress • 4-5
Unaccompanied Homeless Children and Youth in the United States
TOTAL ESTIMATES UNACCOMPANIED HOMELESS CHILDREN AND YOUTHPIT
ME,
NH,
VT,
NY MA,RI,
CT,NJ,
DE,
DC,
PA,
VAWV
NC,
SCGA
FL
AL
TN,
KY
OHIL
MIWI
MN
IA
MO
AR
LATX
OK
KS
NE
SD
NDMT
WA
OR
CA
AK
HI
WY
CO
NMAZ
UTNV
ID
IN
MS
MD,
Share of Unaccompanied Homeless Children and Youth
Less than 1%1%–2.9%
Greater than 6%3%–6%
0.1
0.40.80.72.3
2.5
2.40.8
1.6
0.8
1.3
0.7
1.1
1.4
1.1
1.1
1.5 0.7
0.9
0.70.6
0.6
0.3
0.21.1
0.51.51.9
1.9
2.0
0.20.7
0.1
0.40.6
0.2
0.9
0.2
0.4
2.5
2.7
4.2
31.2
4.6
7.6
8.1
0.5
0.3
0.3
0.4
0.5
ME,
NH,
VT,
NY MA,RI,
CT,NJ,
DE,
DC,
PA,
VAWV
NC,
SCGA
FL
AL
TN,
KY
OHIL
MIWI
MN
IA
MO
AR
LATX
OK
KS
NE
SD
NDMT
WA
OR
CA
AK
HI
WY
CO
NMAZ
UTNV
ID
IN
MS
MD,
Share of Unsheltered Unaccompanied Homeless Children and Youth
0.0
0.10.70.31.0
2.8
1.30.2
0.8
0.4
0.8
0.8
0.5
0.5
0.5
0.7
1.2 0.7
0.7
0.20.4
0.6
0.1
0.00.4
0.2 0.40.4
1.4
0.7
0.10.0
0.1
0.00.0
0.1
0.4
0.4
0.5
1.6
3.2
7.7
49.7
4.9
9.2
1.1
0.7
0.2
0.1
0.1
0.7
Less than 1%1%–2.9%
Greater than 6%3%–6%
EXHIBIT 4.3: Share of Unaccompanied Homeless Children and Youth PopulationIn the U.S. by State, 2013 (in %)
EXHIBIT 4.4: Share of Unaccompanied Children and Youth Staying in Places not Suitable for Human HabitationIn the U.S. by State, 2013 (in %)
Data Source: PIT 2013Excludes Puerto Rico and U.S. territories
On a Single Night in January 2013• California had the highest number of
unaccompanied homeless children in the U.S., 1,864, followed by Florida (1,117), and Texas (568).
• California (12,297), New York (3,497), and Florida (2,344) had the highest number of unaccompanied homeless youth.
• California (49.7%), Florida (9.2%), Nevada (7.7%), Texas (4.9%), and Oregon (3.2%) represented nearly three quarters of all unaccompanied children and youth in unsheltered locations in the U.S.
By State and Sheltered Status
5H
om
eless Veterans5Homeless Veterans
IN THE UNITED STATES
POINT-IN-TIME (PIT)One-Night Estimates of Homeless Veterans . . . . . . . . . . . . . . . . . . . . 5-3
By State . . . . . . . . . . . . . . . . . . . . . . . . . . . . . . . . . . . . . . . . . . . . . . . . . . 5-4
By State and Sheltered Status . . . . . . . . . . . . . . . . . . . . . . . . . . . . . . . . 5-5
HOMELESS MANAGEMENT INFORMATION SYSTEM (HMIS)One-Year Estimates of Homeless Veterans . . . . . . . . . . . . . . . . . . . . . 5-7
Characteristics of Sheltered VeteransGender and Age . . . . . . . . . . . . . . . . . . . . . . . . . . . . . . . . . . . . . . . . . . . . . . . . . . . .5-8Ethnicity and Race . . . . . . . . . . . . . . . . . . . . . . . . . . . . . . . . . . . . . . . . . . . . . . . . . . .5-9Household Size and Disability Status . . . . . . . . . . . . . . . . . . . . . . . . . . . . . . . . . . 5-11
Geography of Sheltered VeteransGeographic Location . . . . . . . . . . . . . . . . . . . . . . . . . . . . . . . . . . . . . . . . . . . . . . . 5-12Characteristics by Geography . . . . . . . . . . . . . . . . . . . . . . . . . . . . . . . . . . . . . . . . 5-13
Patterns of Homeless Service Use Among Sheltered VeteransLiving Situation Before Entering Shelter . . . . . . . . . . . . . . . . . . . . . . . . . . . . . . . 5-14Length of Stay and Other Bed-Use Patterns . . . . . . . . . . . . . . . . . . . . . . . . . . . 5-15

Homeless Veterans in the United States
TOTAL ESTIMATES HOMELESS VETERANSPIT
5-2 • The 2013 Annual Homeless Assessment Report to Congress
KEY TERM
VETERAN refers to any person who served on active duty in the Armed Forces of the United States. This includes military reserves and National Guard who were called up to active duty.
HOMELESS VETERANSIN THE UNITED STATES
55,779 veterans were homeless
since 2009. since 2009.
This is a This is a24.7% decline 6.5% decline
13% of the adult sheltered population
139,857 Veterans used shelter at some point
PIT DATA HMIS DATA
Veterans using shelter programs in
Veterans make up 9% of the U.S. adult population, but
On a single night in January 2013…
Throughout the year in 2013…
Veterans in sheltered & unsheltered locations
63%37%
8.2%
15.5%
From 2012–2013…
CITIES
SUBURBAN & RURAL AREAS
CA, FL, NY, and TX account for nearly half of homeless Veterans

The 2013 Annual Homeless Assessment Report to Congress • 5-3
EXHIBIT 5.2: Change in Homeless Veterans PIT Estimates by Sheltered Status, 2009–2013
EXHIBIT 5.1: One-Night Counts of Homeless Veterans PIT Estimates by Sheltered Status, 2009–2013
Sheltered Veterans Unsheltered Veterans
Homeless Veterans
2009 2010 201320122011
74,050 74,770
65,645
55,779
43,409 43,43740,033
34,90930,641 31,333
25,621 20,870
60,769
35,143
25,626
YearsTotal Homeless
VeteransSheltered Veterans
Unsheltered Veterans
# Change % Change # Change % Change # Change % Change
2012 to 2013 -4,990 -8.2 -234 -0.7 -4,756 -18.6
2011 to 2012 -4,876 -7.4 -4,890 -12.2 14 0.1
2010 to 2011 -9,125 -12.2 -3,404 -7.8 -5,721 -18.3
2009 to 2010 720 1.0 28 0.1 692 2.3
2009 to 2013 -18,271 -24.7 -8,500 -19.6 -9,771 -31.9
One-Night EstimatesOF HOMELESS VETERANS
PIT
Data Source: PIT 2009–2013Includes Puerto Rico and U.S. territories
Understanding the extent and nature of homelessness among veterans is an important focus for both HUD and the U.S. Department of Veteran Affairs (VA). Estimates of homeless veterans began in 2009.
HUD and the VA have worked collaboratively for many years to produce accurate estimates of homeless veterans and identify effective strategies for preventing and ending homelessness among veterans. The overall framework for addressing veteran homelessness, described in Opening Doors: Federal Strategic Plan to Prevent and End Homelessness, focuses on several key areas: providing affordable housing and permanent supportive housing, increasing meaningful and sustainable employment opportunities, reducing the financial vulnerability of veterans, and transforming the homeless crisis response system with a focus on prevention and rapid re-housing. This chapter provides the most accurate metrics to gauge the nation’s progress towards ending homelessness among veterans.
On a single night in January 2013• 55,779 veterans were homeless in the United States, representing about
9.4 percent of homeless people and 12.3 percent of all homeless adults.
• 62.6 percent of homeless veterans were sheltered (34,909 veterans), and 37.4 percent were in unsheltered locations (20,870 veterans).
Between January 2012 and January 2013• The number of homeless veterans declined by 8.2 percent (4,990 fewer
veterans). The decline was driven by an 18.6 percent decrease in the number of unsheltered homeless veterans, 4,756 fewer veterans, with the number of sheltered homeless veterans decreasing by less than 1 percent.
• The proportion of veterans that were sheltered increased from 57.8 percent in 2012 to 62.6 percent in 2013.
Between January 2009 and January 2013• The total number of homeless veterans dropped by 24.7 percent or 18,271
people. This decline was more attributable to the 31.9 percent decrease in unsheltered veterans than the 19.6 percent decrease in sheltered homeless veterans.
Note: The PIT estimates from 2009-2013 are slightly lower than estimates reported in past AHARs. The reduction reflects an adjustment to the estimates of unsheltered homeless individuals submitted by the Los Angeles City and County Continuum of Care. The adjustment removed the following number of veterans: 1,559 veterans in 2009 and 2010; 1,850 veterans in 2011 and 2012; and 2,284 veterans from 2013. Additionally, the Phoenix/Mesa/Maricopa County Regional CoC updated its 2013 sheltered count of homeless veterans from 174 to 388. These changes apply to all PIT estimates in this section. See the supporting PIT data tabulations posted on HUD’s Resource Exchange at www.hudexchange.info.
55,779 veterans were homeless in the United States in January 2013, an 8.2% decline from 2012.
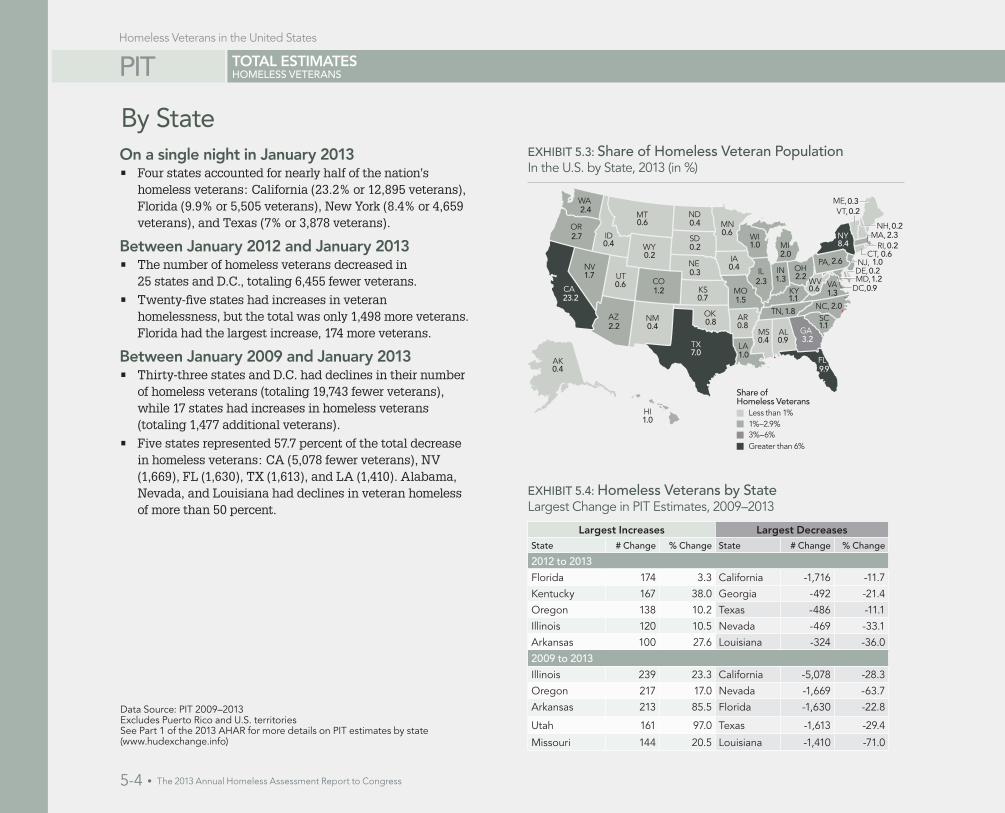
Homeless Veterans in the United States
TOTAL ESTIMATES HOMELESS VETERANSPIT
5-4 • The 2013 Annual Homeless Assessment Report to Congress
By State
EXHIBIT 5.4: Homeless Veterans by StateLargest Change in PIT Estimates, 2009–2013
EXHIBIT 5.3: Share of Homeless Veteran Population In the U.S. by State, 2013 (in %)
Largest Increases Largest DecreasesState # Change % Change State # Change % Change
2012 to 2013
Florida 174 3.3 California -1,716 -11.7
Kentucky 167 38.0 Georgia -492 -21.4
Oregon 138 10.2 Texas -486 -11.1
Illinois 120 10.5 Nevada -469 -33.1
Arkansas 100 27.6 Louisiana -324 -36.0
2009 to 2013
Illinois 239 23.3 California -5,078 -28.3
Oregon 217 17.0 Nevada -1,669 -63.7
Arkansas 213 85.5 Florida -1,630 -22.8
Utah 161 97.0 Texas -1,613 -29.4
Missouri 144 20.5 Louisiana -1,410 -71.0
ME,
NH,
VT,
NY MA,RI,
CT,NJ,
DE,
DC,
PA,
VAWV
NC,SC
GA
FL
AL
TN,
KY
OHIL
MIWI
MN
IA
MO
AR
LATX
OK
KS
NE
SD
NDMT
WA
OR
CA
AK
HI
WY
CO
NMAZ
UTNV
ID
IN
MS
MD,
Less than 1%1%–2.9%
Greater than 6%3%–6%
Share of Homeless Veterans
0.4
0.2
0.3
0.8 1.1
1.1
1.8
1.3
2.0
2.0
1.5
2.3
2.7
2.2
1.0
3.2
1.0
0.9
0.6 2.3
1.2
2.6
8.4
2.4
1.223.2
7.0
9.9
1.3
1.0
0.2
0.7
0.42.2
0.4
1.7
0.8
0.6
0.4 0.9
0.4
0.6
1.0
0.4
0.2
0.20.6
0.2
0.6
0.20.3
Data Source: PIT 2009–2013Excludes Puerto Rico and U.S. territories See Part 1 of the 2013 AHAR for more details on PIT estimates by state (www.hudexchange.info)
On a single night in January 2013• Four states accounted for nearly half of the nation’s
homeless veterans: California (23.2% or 12,895 veterans), Florida (9.9% or 5,505 veterans), New York (8.4% or 4,659 veterans), and Texas (7% or 3,878 veterans).
Between January 2012 and January 2013• The number of homeless veterans decreased in
25 states and D.C., totaling 6,455 fewer veterans.
• Twenty-five states had increases in veteran homelessness, but the total was only 1,498 more veterans. Florida had the largest increase, 174 more veterans.
Between January 2009 and January 2013• Thirty-three states and D.C. had declines in their number
of homeless veterans (totaling 19,743 fewer veterans), while 17 states had increases in homeless veterans (totaling 1,477 additional veterans).
• Five states represented 57.7 percent of the total decrease in homeless veterans: CA (5,078 fewer veterans), NV (1,669), FL (1,630), TX (1,613), and LA (1,410). Alabama, Nevada, and Louisiana had declines in veteran homeless of more than 50 percent.

Homeless Veterans in the United States
TOTAL ESTIMATES HOMELESS VETERANSPIT
The 2013 Annual Homeless Assessment Report to Congress • 5-5
By State and Sheltered StatusEXHIBIT 5.5: Sheltered Homeless Veterans by StateLargest Change in PIT Estimates, 2009–2013
EXHIBIT 5.6: Unsheltered Homeless Veterans by StateLargest Change in PIT Estimates, 2009–2013
Largest Increases Largest DecreasesState # Change % Change State # Change % Change
2012 to 2013
California 374 8.3 Tennessee -245 -25.2
Oregon 151 27.1 Nevada -214 -31.0
Kentucky 141 38.2 Georgia -194 -17.7
Florida 127 5.8 New York -169 -3.9
Texas 123 6.5 North Carolina
-157 -14.40
2009 to 2013
Utah 180 163.6 California -1,913 -28.1
Arkansas 158 94.6 Nevada -852 -64.1
West Virginia 115 65.0 New York -846 -16.8
Missouri 98 17.2 Texas -728 -26.6
Illinois 81 10.1 Florida -579 -19.9
Largest Increases Largest DecreasesState # Change % Change State # Change % Change
2012 to 2013
South Carolina 68 30.5 California -2,090 -20.7
Illinois 51 15.3 Texas -609 -24.6
Florida 47 1.5 Georgia -298 -24.8
Hawaii 47 17.0 Louisiana -257 -57.2
Florida 47 1.50 Nevada -255 -35.0
2009 to 2013
Oregon 180 29.8 California -3,165 -28.3
Illinois 158 69.7 Louisiana -1,352 -87.6
Montana 113 144.9 Florida -1,051 -24.9
South Carolina 101 53.2 Texas -885 -32.1
Hawaii 59 22.40 Nevada -817 -63.3Data Source: PIT 2009–2013Excludes Puerto Rico and U.S. territories
On a single night in January 2013• In eight states, 90 percent or more of the homeless veteran
population was sheltered rather than in unsheltered locations: NY (4,201 veterans), MA (1,204), WI (528), KS (384), IA (220), ME (150), RI (95), and DE (86).
• Almost two-thirds of all unsheltered veterans in the United States were in California (38.6%), Florida (15.3%), and Texas (9%).
• In six states, more than half of the homeless veteran population was unsheltered: CA (8,009 veterans), FL (3,177), GA (905), OR (785), HI (324), and MT (191).
Between January 2012 and January 2013• The number of veterans found in unsheltered locations dropped
in 32 states and D.C., totaling 5,247 fewer veterans, and increased in 18 states, totaling only 532 more unsheltered veterans. California and Texas alone accounted for over half of the overall decrease in unsheltered homelessness.
• The number of sheltered veterans decreased in 26 states and D.C., totaling 2,110 fewer sheltered veterans, and increased in 24 states, totaling 1,868 more sheltered veterans.
Between January 2009 and January 2013• Unsheltered homelessness among veterans decreased in 34
states, totaling 10,828 fewer unsheltered veterans, and increased in 16 states and D.C., totaling 1,079 more unsheltered veterans.
• Sheltered veteran homelessness decreased or remained stable in 37 states and D.C., totaling 9,528 fewer sheltered veterans, while only 13 states had a net increase totaling 1,010 additional sheltered veterans.
• Four states had large decreases in both sheltered and unsheltered veterans over the four-year period: California (1,913 fewer sheltered and 3,165 fewer unsheltered veterans), Texas (728 sheltered and 885 unsheltered), Florida (579 sheltered and 1,051 unsheltered) and Nevada (852 sheltered and 817 unsheltered).

TOTAL ESTIMATES HOMELESS VETERANSPIT
5-6 • The 2013 Annual Homeless Assessment Report to Congress
Homeless Veterans in the United States
CHARACTERISTICS HOMELESS VETERANSHMIS
PROFILE OF A TYPICAL HOMELESS VETERAN IN 2013
42.9% WERE AGE
91.0% MALE / 97.6% 1-PERSON HOUSEHOLD
50.2% WERE
75.7% WERE IN A
53.6% HAD
NIGHTS SPENT IN EMERGENCY SHELTER
PRIOR TO USING A SHELTER IN 2013, 49.8% WERE
A Man in Shelter as an Individual
51–61
Already Homeless
White, Non-Hispanic
City
A Disability
20

The 2013 Annual Homeless Assessment Report to Congress • 5-7
One-Year EstimatesOF SHELTERED VETERANS
HMIS
149,635 144,842 141,449 137,995
2009 2010 2011 2012 2013
2009–2013
-9,778
-6.5%-4,792
-3.2%
-3,454
-2.4%
139,857
1,8611.3%
-3,393
-2.3%
EXHIBIT 5.7: One-year Estimates of Sheltered Veterans, 2009–2013
Data Source: HMIS 2009-2013; ACS 2012
Since 2009, HUD has estimated the annual number of veterans who use shelter programs at some time from October 1 through September 30 of the reporting year. The one-year
estimates account for all veterans who used an emergency shelter or transitional housing program, including programs that specifically target veterans and those that do not. The estimates are based on a nationally representative sample of communities that submit aggregate HMIS data to HUD. The estimates statistically adjust for homeless veterans in shelter programs that do not yet participate in their local HMIS—thus providing a complete enumeration of sheltered veterans in each community—and are weighted to represent the entire country. The one-year estimates do not include: (a) sheltered veterans in Puerto Rico and the U.S. territories; (b) veterans served by victim service providers; and (c) veterans in unsheltered locations who never accessed a shelter program during the 12-month period. The 95 percent confidence interval for the sheltered homeless veteran population in 2013 is ±14,600 (125,527 to 154,457).
Veterans can experience homelessness as individuals or as part of a family. Following the definition used throughout this report, veteran individuals are in households without any children, while homeless veterans in families are in households that have at least one child present.
2013 Estimate of Sheltered Veterans• An estimated 139,857 veterans used an emergency shelter
or transitional housing program at some time between October 1, 2012 and September 30, 2013.
• 1 in 152 veterans in the U.S. was homeless in shelter at some point during 2013. While veterans make up only 9 percent of the U.S. adult population, veterans make up 12.7 percent of the adult homeless population.
Changes Over Time• Between 2012 and 2013, the number of veterans using shelter
programs over the course of a year increased by 1.3 percent (1,861 more veterans), the first annual increase since records began in 2009.
• Between 2009 and 2013, the number of sheltered veterans in the United States has dropped by 6.5 percent or 9,778 fewer veterans.
139,857 veterans were in a shelter program in the United States at some time during 2013, a 6.5% decrease from 2009.

TOTAL ESTIMATES HOMELESS VETERANSPIT
5-8 • The 2013 Annual Homeless Assessment Report to Congress
Homeless Veterans in the United States
CHARACTERISTICS HOMELESS VETERANSHMIS
EXHIBIT 5.8: GenderSheltered Veterans and Total U.S. Veterans, 2009–2013
EXHIBIT 5.9: AgeSheltered Veterans and Total U.S. Veterans, 2009–2013
Gender and AgeIn 2013• More than 9 in 10 (91%) sheltered veterans were men,
slightly lower than the share of men among all U.S. veterans (92.4%), but slightly higher than the share among U.S. veterans in poverty (89.4%).
• Most sheltered veterans were age 51 to 61 (42.9%), with 36.1 percent ages 31 to 50.
• Elderly veterans (age 62 and older) were underrepresented in shelter compared to the total U.S. veteran population. All U.S. veterans were 4.7 times more likely to be age 62 and older than veterans in shelter (54.1% versus 11.4%).
• Fewer than one in 10 (9.6%) sheltered veterans was between the ages of 18 and 30, but this share is higher than that of 18 to 30 year-olds among all U.S. veterans (5.6%).
Changes Over Time• The number of sheltered female veterans rose, both in
absolute numbers (1,891 more women) in 2013 than in 2012 and as a share of sheltered veterans (7.8% to 9%).
• Since 2009, the share of sheltered veterans who are age 62 or older or between 18 and 30 both increased: from 8.7 to 11.4 percent for elderly veterans and from 8.1 to 9.6 percent for young veterans.
7.5
7.6
7.3
6.7
7.8
9.0
0% 100%
2012
2009
2013
2012
2009
2013
SHELTEREDVETERANS
U.S.VETERANS
Male Female
91.0
92.2
92.6
92.4
92.7
93.3
18.7
19.7
24.3
54.1
53.2
47.7
21.6
21.7
23.0
5.6
5.4
5.0
11.4
11.1
8.7
42.9
43.4
38.4
36.19.6
8.5
8.1
37.1
44.7
2012
2009
2012
2009
2013
18–30 31–50 51–61 62 and Older
SHELTEREDVETERANS
U.S.VETERANS
0% 100%
2013
Data Source: HMIS 2009-2013; ACS 2008, 2011, 2012

Homeless Veterans in the United States
The 2013 Annual Homeless Assessment Report to Congress • 5-9
CHARACTERISTICS HOMELESS VETERANSHMIS
Ethnicity and RaceIn 2013• Hispanic veterans were slightly overrepresented in
the sheltered population compared to the broader U.S. veteran population, 7.3 percent versus 5.7 percent.
• Veterans using shelter programs were 3.4 times more likely to be African American than were U.S. veterans overall (38.8% versus 11.3%). Veterans who identified as white and not Hispanic (non-minority) comprise about half of all sheltered veterans, compared to almost 4 out of 5 among all veterans in the U.S.
Changes Over Time• While the number of all U.S. Hispanic veterans
increased by 5.6 percent between 2009 and 2013, the number of sheltered Hispanic veterans dropped by 36.7 percent (5,891 fewer veterans), and the share of sheltered veterans who are Hispanic dropped from 10.9 to 7.3 percent.
• Between 2009 and 2013, the number of sheltered veterans in minority groups declined by 7.6 percent (5,669 fewer veterans), while the number in the total U.S. veteran population increased by 3.7 percent.
• The number of African American veterans in shelter increased 6.7 percent (3,354 more veterans) since 2009, while the number among all U.S. veterans increased by only 2.7 percent, and the share of sheltered veterans who are African American increased from 34.2 to 38.8 percent.
EXHIBIT 5.10: EthnicitySheltered Veterans and Total U.S. Veterans, 2009–2013
EXHIBIT 5.11: RaceSheltered Veterans and Total U.S. Veterans, 2009–2013
89.2
93.0
92.7
7.0
7.3
10.9
94.45.6
94.35.7
94.85.2
0% 100%
2012
2012
2009
2013
SHELTEREDVETERANS
U.S.VETERANS
Hispanic Non-Hispanic
2013
2009
2012
2009
2013
2012
2009
2013
SHELTEREDVETERANS
U.S.VETERANS
0% 100%
1.73.3
11.3
White, Non-Hispanic White, Hispanic
Other One RaceBlack or African American Multiple Races
79.6 4.1
11.080.3 3.91.6
3.2
10.581.4 3.61.4
3.2
3.54.135.552.0 4.9
49.3
50.2 3.22.738.85.1
4.34.234.28.0
Data Source: HMIS 2009-2013; ACS 2008, 2011, 2012
Note: Ethnicity is distinguished among the white race group to facilitate an understanding of minorities and non-minorities. Non-minorities are those who identify their ethnicity as not Hispanic and their race as white.

TOTAL ESTIMATES HOMELESS VETERANSPIT
5-10 • The 2013 Annual Homeless Assessment Report to Congress
Homeless Veterans in the United States
CHARACTERISTICS HOMELESS VETERANSHMIS
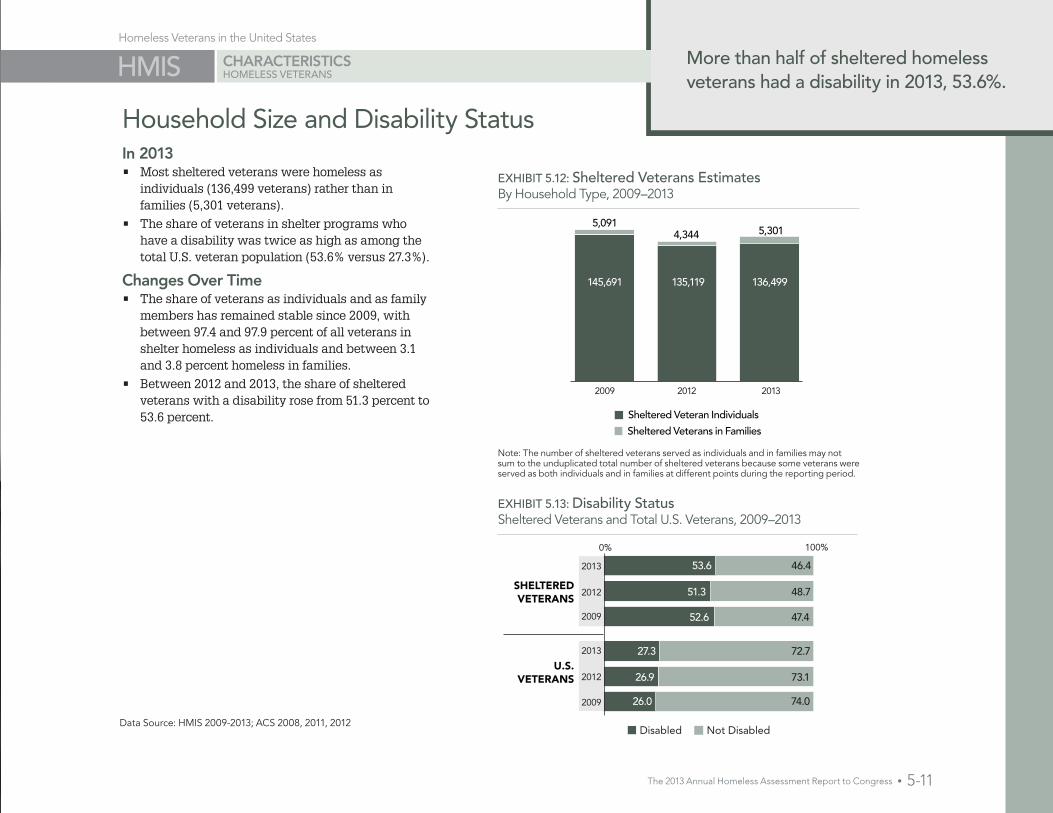
The 2013 Annual Homeless Assessment Report to Congress • 5-11
HMISHomeless Veterans in the United States
CHARACTERISTICS HOMELESS VETERANS
Household Size and Disability StatusIn 2013• Most sheltered veterans were homeless as
individuals (136,499 veterans) rather than in families (5,301 veterans).
• The share of veterans in shelter programs who have a disability was twice as high as among the total U.S. veteran population (53.6% versus 27.3%).
Changes Over Time• The share of veterans as individuals and as family
members has remained stable since 2009, with between 97.4 and 97.9 percent of all veterans in shelter homeless as individuals and between 3.1 and 3.8 percent homeless in families.
• Between 2012 and 2013, the share of sheltered veterans with a disability rose from 51.3 percent to 53.6 percent.
EXHIBIT 5.12: Sheltered Veterans EstimatesBy Household Type, 2009–2013
EXHIBIT 5.13: Disability StatusSheltered Veterans and Total U.S. Veterans, 2009–2013
26.0
26.9
27.3 72.7
73.1
74.0
0% 100%
2012
2009
2013
SHELTEREDVETERANS
U.S.VETERANS
Not DisabledDisabled
53.6
51.3
52.6
46.4
48.7
47.4
2012
2009
2013
20122009 2013
Sheltered Veteran Individuals
Sheltered Veterans in Families
145,691 135,119 136,499
5,3014,3445,091
Data Source: HMIS 2009-2013; ACS 2008, 2011, 2012
Note: The number of sheltered veterans served as individuals and in families may not sum to the unduplicated total number of sheltered veterans because some veterans were served as both individuals and in families at different points during the reporting period.
More than half of sheltered homeless veterans had a disability in 2013, 53.6%.

PIT
5-12 • The 2013 Annual Homeless Assessment Report to Congress
Homeless Veterans in the United States
HMIS
Geographic Location In 2013• More than three-quarters (75.7%) of sheltered veterans
used emergency shelter and transitional housing programs in principal cities, with the remaining 24.3 percent in suburban and rural areas.
• The geographic pattern both of all U.S. veterans and of those in poverty is the reverse of the sheltered veteran population. About 8 in 10 veterans (81.9%) in the U.S. lived in suburban and rural areas in 2012, and almost three-quarters (74.2%) of veterans in poverty lived in suburban and rural areas in 2012.
Changes Over Time• Sheltered veterans have become increasingly
concentrated in cities since 2009, with the share of all sheltered veterans using shelter programs in cities rising from 69.9 percent in 2009 to 75.7 percent in 2013.
• In contrast, veterans in the poverty and in the total U.S. populations have consistently been concentrated in suburban and urban areas.
SHELTEREDVETERANS
SUBURBAN AND RURAL AREASPRINCIPAL CITIES 0% 100%
69.9 30.1
29.2
24.3
70.8
75.7
2012
2013
2009
U.S.VETERANS
IN POVERTY*
U.S.VETERANS*
2012
2013
2009
2012
2013
2009
27.1 72.9
74.8
74.2
25.2
25.8
81.4
81.9
18.6
18.1
81.918.1
EXHIBIT 5.14: Geographic Distribution Sheltered Veterans, U.S. Veterans in Poverty, and Total U.S. Veterans, 2009–2013
EXHIBIT 5.15: Percent Change by Geography Sheltered Homeless Veterans, U.S. Veterans in Poverty Population, and Total U.S. Veterans Population, 2009–2013 (in %)
Population2012–2013 2009–2013
Principal Cities
Suburban & Rural Areas
Principal Cities
Suburban & Rural Areas
Sheltered Veterans 1.1 -24.5 8.2 -15.5
U.S. Veterans in Poverty* 3.9 0.9 3.4 10.4
U.S. Veterans* -1.3 -1.7 -7.0 -4.3
Data Source: HMIS 2009-2013; ACS 2008, 2010, 2011
* In the 2013 ACS, the geographic indicator used to distinguish principal cities from other areas is not yet available. The data source used to represent 2012 and 2013 are from the most recent two years available.
* In the 2013 ACS, the geographic indicator used to distinguish principal cities from other areas is not yet available. The data source used to represent 2012 and 2013 are from the most recent two years available.
GEOGRAPHY HOMELESS VETERANS

Homeless Veterans in the United States
The 2013 Annual Homeless Assessment Report to Congress • 5-13
HMIS
In 2013• A larger share of veterans using shelter programs
located in suburban and rural areas were women than in cities, 10.7 versus 8.5 percent.
• Sheltered veterans in cities were 1.4 times more likely to be in minority groups than those in suburban and rural areas (53.2% versus 39.2%), and they were 1.4 times more likely to be African American (41.6% versus 30.4%).
• Sheltered veterans located in cities were somewhat less likely to have a disability than those located in suburban and rural areas (52.8% and 56.3%).
Changes Over Time• The share of veterans with a disability using shelter
programs in cities increased from 50.5 percent in 2009 to 52.8 percent in 2013.
Characteristics by Geography
CharacteristicPrincipal Cities Suburban &
Rural Areas
2007 2012 2013 2007 2012 2013
# Homeless Veterans 104,596 97,753 105,794 45,037 40,243 33,993
Gender of Adults
Male 92.9 92.5 91.5 91.8 91.5 89.3
Female 7.1 7.5 8.5 8.2 8.5 10.7
Ethnicity
Hispanic 13.8 7.9 8.1 4.0 4.7 4.7
Non-Hispanic 86.2 92.1 91.9 96.0 95.3 95.3
Race
White, Non-Hispanic 43.1 48.1 46.8 63.6 61.6 60.8
White, Hispanic 10.6 5.7 5.7 1.9 2.9 3.2
Black or African American
37.7 38.1 41.6 26.2 29.0 30.4
Other One Race 4.4 4.8 2.7 3.5 2.5 2.6
Multiple Races 4.2 3.3 3.3 4.7 4.0 3.0
Age
18–30 8.0 8.3 9.3 8.6 8.9 10.5
31–50 44.7 38.0 35.9 44.6 34.8 36.9
51–61 37.9 42.6 43.2 39.8 45.2 42.0
62 and Older 9.5 11.0 11.6 7.1 11.1 10.7
Household Size
1 Person 99.7 99.5 99.6 99.8 99.7 99.5
2 People 0.3 0.3 0.4 0.2 0.2 0.4
3 People 0.0 0.1 0.1 0.0 0.0 0.1
4 People 0.0 0.0 0.0 0.0 0.1 0.0
5 or More People 0.0 0.0 0.0 0.0 0.0 0.0
Disability Status of Adults
Disabled 50.5 51.1 52.8 57.7 51.8 56.3
Not Disabled 49.5 48.9 47.2 42.3 48.2 43.7
EXHIBIT 5.16: Characteristics by GeographySheltered Veterans, 2013 (in %)
Data Source: HMIS 2009–2013
GEOGRAPHY HOMELESS VETERANS
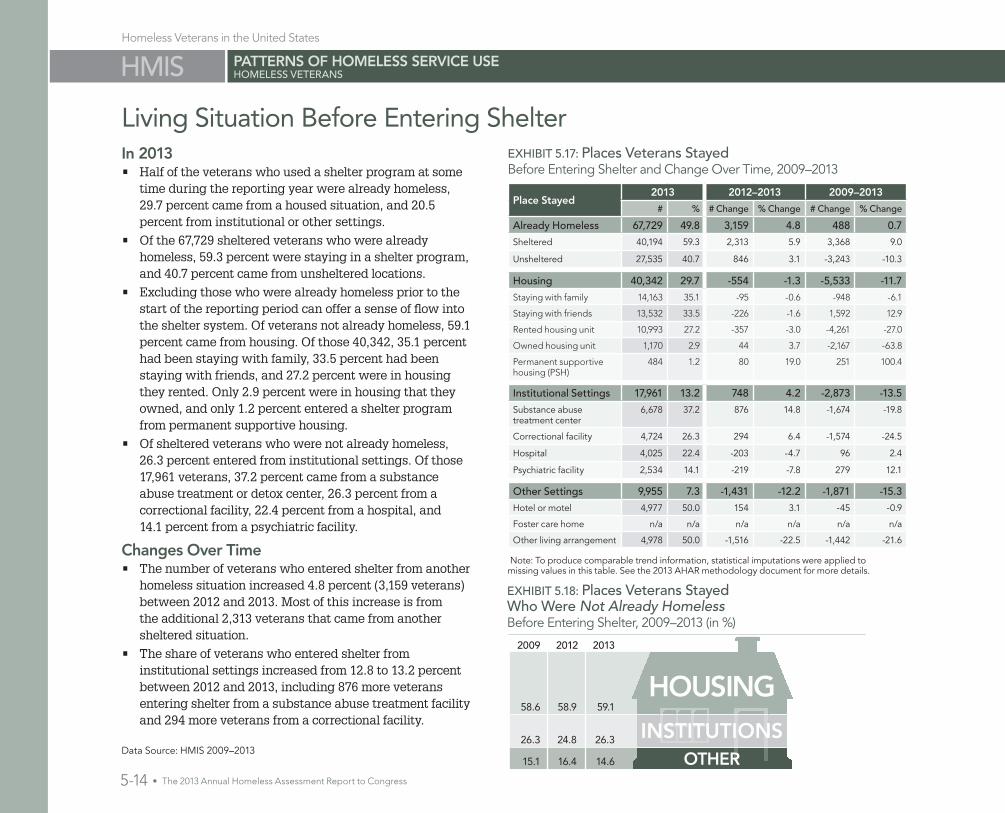
PIT
5-14 • The 2013 Annual Homeless Assessment Report to Congress
Homeless Veterans in the United States
HMIS
Place Stayed2013 2012–2013 2009–2013
# % # Change % Change # Change % Change
Already Homeless 67,729 49.8 3,159 4.8 488 0.7
Sheltered 40,194 59.3 2,313 5.9 3,368 9.0
Unsheltered 27,535 40.7 846 3.1 -3,243 -10.3
Housing 40,342 29.7 -554 -1.3 -5,533 -11.7
Staying with family 14,163 35 .1 -95 -0 .6 -948 -6 .1
Staying with friends 13,532 33 .5 -226 -1 .6 1,592 12 .9
Rented housing unit 10,993 27 .2 -357 -3 .0 -4,261 -27 .0
Owned housing unit 1,170 2 .9 44 3 .7 -2,167 -63 .8
Permanent supportive housing (PSH)
484 1 .2 80 19 .0 251 100 .4
Institutional Settings 17,961 13.2 748 4.2 -2,873 -13.5
Substance abuse treatment center
6,678 37.2 876 14.8 -1,674 -19.8
Correctional facility 4,724 26.3 294 6.4 -1,574 -24.5
Hospital 4,025 22.4 -203 -4.7 96 2.4
Psychiatric facility 2,534 14.1 -219 -7.8 279 12.1
Other Settings 9,955 7.3 -1,431 -12.2 -1,871 -15.3
Hotel or motel 4,977 50.0 154 3.1 -45 -0.9
Foster care home n/a n/a n/a n/a n/a n/a
Other living arrangement 4,978 50.0 -1,516 -22.5 -1,442 -21.6
Living Situation Before Entering ShelterIn 2013• Half of the veterans who used a shelter program at some
time during the reporting year were already homeless, 29.7 percent came from a housed situation, and 20.5 percent from institutional or other settings.
• Of the 67,729 sheltered veterans who were already homeless, 59.3 percent were staying in a shelter program, and 40.7 percent came from unsheltered locations.
• Excluding those who were already homeless prior to the start of the reporting period can offer a sense of flow into the shelter system. Of veterans not already homeless, 59.1 percent came from housing. Of those 40,342, 35.1 percent had been staying with family, 33.5 percent had been staying with friends, and 27.2 percent were in housing they rented. Only 2.9 percent were in housing that they owned, and only 1.2 percent entered a shelter program from permanent supportive housing.
• Of sheltered veterans who were not already homeless, 26.3 percent entered from institutional settings. Of those 17,961 veterans, 37.2 percent came from a substance abuse treatment or detox center, 26.3 percent from a correctional facility, 22.4 percent from a hospital, and 14.1 percent from a psychiatric facility.
Changes Over Time• The number of veterans who entered shelter from another
homeless situation increased 4.8 percent (3,159 veterans) between 2012 and 2013. Most of this increase is from the additional 2,313 veterans that came from another sheltered situation.
• The share of veterans who entered shelter from institutional settings increased from 12.8 to 13.2 percent between 2012 and 2013, including 876 more veterans entering shelter from a substance abuse treatment facility and 294 more veterans from a correctional facility.
EXHIBIT 5.17: Places Veterans StayedBefore Entering Shelter and Change Over Time, 2009–2013
EXHIBIT 5.18: Places Veterans Stayed Who Were Not Already HomelessBefore Entering Shelter, 2009–2013 (in %)
201320122009
58.6 58.9 59.1
26.3
15.1 16.4 14.6
24.8 26.3Data Source: HMIS 2009–2013
Note: To produce comparable trend information, statistical imputations were applied to missing values in this table. See the 2013 AHAR methodology document for more details.
PATTERNS OF HOMELESS SERVICE USE HOMELESS VETERANS

Homeless Veterans in the United States
The 2013 Annual Homeless Assessment Report to Congress • 5-15
HMIS
Length of Stay and Other Bed-Use PatternsEmergency shelter and transitional housing programs are designed differently. Emergency shelters are high-volume, high-turnover programs; their primary purpose is to provide temporary shelter for homeless people. In contrast, transitional housing programs offer homeless people shelter as well as supportive services for up to 24 months and intend for people to stay longer than they do in emergency shelters.
In 2013• During the 12-month reporting year, more than one-third
of veterans using emergency shelters stayed one week or less (35.2%), 62.8 percent stayed one month or less, and 5.3 percent stayed more than six months.
• In contrast, within the reporting year, nearly half of veterans in transitional housing programs stayed between one and six months, 18.5 percent stayed one month or less, and 33.7 percent stayed more than six months.
• Among sheltered veterans, the average length of stay in emergency shelter during the 12-month reporting period was 46 nights, and was 146 nights, or about 5 months, in transitional housing programs.
• Almost two-thirds (65%) of veterans using shelter programs at some point during the reporting year used only emergency shelter. The rest used only transitional housing programs (27.7%) or accessed both types of shelter programs during the year (7.3%).
Changes Over Time• Between 2009 and 2013, the length of stay for veterans in
both emergency shelter and transitional housing programs dropped. For example, the median number of nights in emergency shelter decreased from 21 to 20, and in transitional housing programs from 120 to 113 nights.
EXHIBIT 5.19: Length of StayVeterans in Emergency Shelter and Transitional Housing Programs, 2013
EXHIBIT 5.20: Bed-Use PatternsVeterans in Emergency Shelter and Transitional Housing Programs, 2009–2013
Length of StayEmergency Shelter Transitional Housing
# % # %
7 days or less 35,506 35.2 2,522 5.2
8 to 30 days 27,885 27.6 6,494 13.3
31 to 180 days 32,259 31.9 23,387 47.8
181 to 360 days 4,168 4.1 10,979 22.4
361 to 366 days 1,183 1.2 5,545 11.3
Bed-Use PatternsEmergency Shelter Transitional Housing
2009 2012 2013 2009 2012 2013
Median number of nights 21 19 20 120 105 113
Average number of nights 47 45 46 149 138 146
Note: Length of stay accounts for multiple program entries/exits by summing the total number of (cumulative) days in a homeless residential program during the 12-month reporting period. The maximum length of stay is 365 days, corresponding to the total days observed for this reporting period.
Note: The maximum length of stay is 365 days, corresponding to the total days observed for this reporting period.
Data Source: HMIS, HIC 2009–2013
PATTERNS OF HOMELESS SERVICE USE HOMELESS VETERANS

6C
hronically H
om
eless Peop
le
6Chronically Homeless People IN THE UNITED STATESPOINT-IN-TIME (PIT)One-Night Estimates of Chronically Homeless People. . . . . . . . . . . . 6-3
By State . . . . . . . . . . . . . . . . . . . . . . . . . . . . . . . . . . . . . . . . . . . . . . . . . . 6-4
By State and Sheltered Status . . . . . . . . . . . . . . . . . . . . . . . . . . . . . . . . 6-5
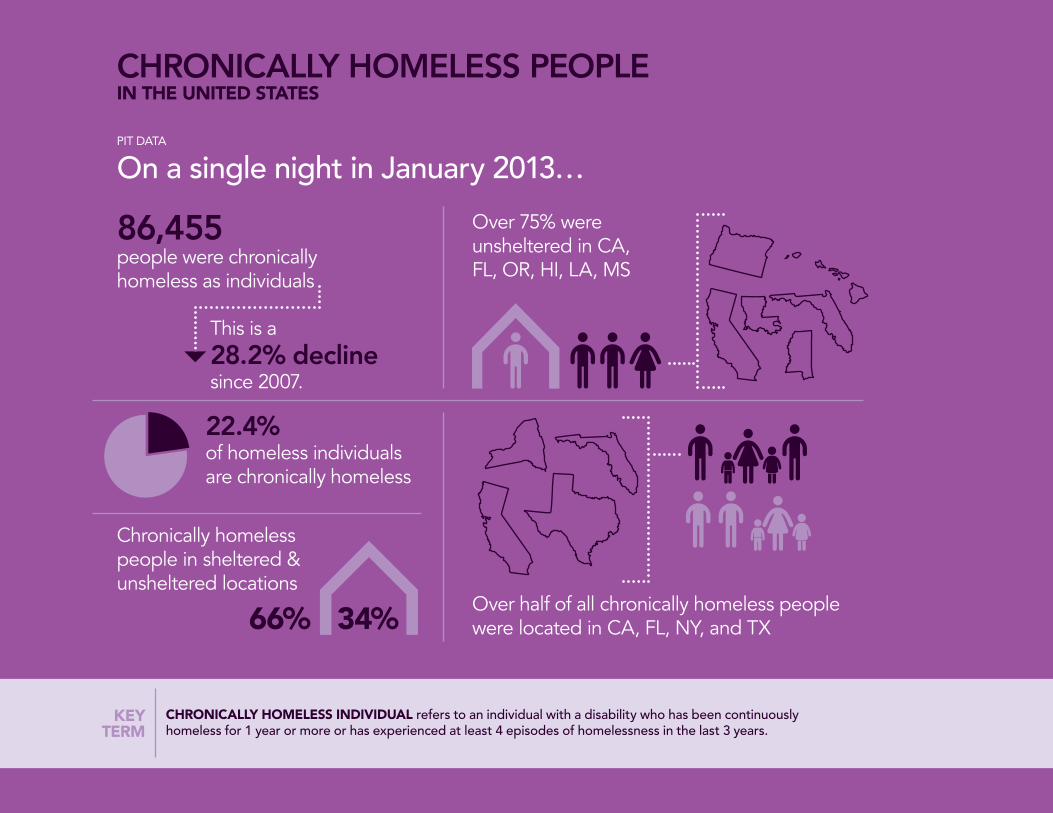
Chronically Homeless People in the United States
TOTAL ESTIMATES CHRONICALLY HOMELESS PEOPLEPIT
6-2 • The 2013 Annual Homeless Assessment Report to Congress
CHRONICALLY HOMELESS INDIVIDUAL refers to an individual with a disability who has been continuously homeless for 1 year or more or has experienced at least 4 episodes of homelessness in the last 3 years.
KEY TERM
CHRONICALLY HOMELESS PEOPLEIN THE UNITED STATES
86,455 people were chronically homeless as individuals
since 2007.
of homeless individuals are chronically homeless
This is a28.2% decline
22.4%
PIT DATA
On a single night in January 2013…
Chronically homeless people in sheltered & unsheltered locations
34%66%Over half of all chronically homeless people were located in CA, FL, NY, and TX
Over 75% were unsheltered in CA, FL, OR, HI, LA, MS

The 2013 Annual Homeless Assessment Report to Congress • 6-3
EXHIBIT 6.2: Change in Chronically Homeless IndividualsPIT Estimates by Sheltered Status, 2007–2013
EXHIBIT 6.1: One-Night Counts of Chronic Homeless Individuals PIT Estimates by Sheltered Status, 2007–2013
Unsheltered Chronic Homeless Sheltered Chronic Homeless
Total Chronic Homeless
120,488 120,790 108,333 107,183 103,915
96,661
41,768 45,418 45,592 43,329 38,97132,647
78,720 75,37262,741 63,854 64,944 64,014
86,455
29,418
57,037
2007 2008 2009 2010 2012 20132011
Years
Total Chronically Homeless
Sheltered Chronically Homeless
Unsheltered Chronically Homeless
# Change % Change # Change % Change # Change % Change
2012 to 2013 -10,206 -10.6 -3,229 -9.9 -6,977 -10.9
2011 to 2012 -7,254 -7.0 -6,324 -16.2 -930 -1.4
2010 to 2011 -3,268 -3.0 -4,358 -10.1 1,090 1.7
2009 to 2010 -1,150 -1.1 -2,263 -5.0 1,113 1.8
2008 to 2009 -12,457 -10.3 174 0.4 -12,631 -16.8
2007 to 2008 302 0.3 3,650 8.7 -3,348 -4.3
2007 to 2013 -34,033 -28.2 -12,350 -29.6 -21,683 -27.5
One-Night EstimatesOF CHRONICALLY HOMELESS PEOPLE
PIT
Data Source: PIT 2007–2013Includes Puerto Rico and U.S territories
Starting in 2007, data were only gathered on adults chronically homeless as individuals. Beginning in 2013, the definition of chronic homelessness was expanded to include people in families where
the head of household met the definition of chronically homeless, and 2013 was the first year of baseline estimates of the number of chronically homeless people in families. However, this section only includes chronically homeless individuals.
On a single night in January 2013• 86,455 adults were chronically homeless, representing 22.4 percent
of all homeless individuals in the U.S.
• About two-thirds (66%) of chronically homeless individuals were in unsheltered locations, and about one-third (34%) were in shelter programs.
Between January 2012 and January 2013• The one-night estimate of chronically homeless individuals dropped by
10.6 percent (10,206 fewer people).
• The number of chronically homeless individuals using shelter programs dropped by 9.9 percent or 3,229 fewer people, and the number in unsheltered locations dropped 10.9 percent or 6,977 fewer people.
Between January 2007 and January 2013• The one-night estimate of chronically homeless individuals dropped
by 28.2 percent or 34,033 fewer people.
• Of all homeless individuals, the share that was chronically homeless declined from 29 percent in 2007 to 23.4 percent in 2013.
• The number of chronically homeless individuals in unsheltered locations dropped by 27.5 percent or 21,683 fewer people, and the number using shelter dropped by 29.6 percent or 12,350 fewer people.
Note: The PIT estimates from 2007-2013 are slightly lower than estimates reported in past AHARs. The reduction reflects an adjustment to the estimates of unsheltered homeless individuals submitted by the Los Angeles City and County Continuum of Care. The adjustment removed the following number of chronically homeless people: 3,345 people in 2007 and 2008; 2,584 people in 2009 and 2010; 3,233 people in 2011 and 2012; and 6,138 people from 2013. This change applies to all PIT estimates in this section. See the supporting PIT data tabulations posted on HUD’s Resource Exchange at www.hudexchange.info.
The one-night estimate of chronically homeless individuals dropped by 10,206, a 10.6% decline, from 2012, and it dropped by 34,033, a 28.2% decline, from 2007.

Chronically Homeless People in the United States
TOTAL ESTIMATES CHRONICALLY HOMELESS PEOPLEPIT
6-4 • The 2013 Annual Homeless Assessment Report to Congress
EXHIBIT 6.4: Chronic Homeless Individuals by StateLargest Change in PIT Estimates, 2007–2013
EXHIBIT 6.3: Share of Chronically Homeless IndividualsIn the U.S. by State, 2013 (in %)
Largest Increases Largest DecreasesState # Change % Change State # Change % Change
2012 to 2013
Arkansas 204 56.5 Louisiana -1,728 -63.0
Oklahoma 136 28.3 Texas -1,345 -22.0
Hawaii 121 13.3 Nevada -1,112 -55.7
New Jersey 121 13.7 California -941 -3.1
Rhode Island 95 64.2 Florida -904 -10.4
2007 to 2013
Louisiana 453 80.6 California -11,093 -27.5
Florida 315 4.2 Texas -3,161 -39.9
Hawaii 253 32.5 New York -2,431 -37.5
Georgia 229 9.2 Arizona -1,740 -62.1
Kansas 145 91.2 New Jersey -1,523 -60.3
ME,
NH,
VT,
NY MA,RI,
CT,NJ,
DE,
DC,
PA,
VAWV
NC,SC
GA
FL
AL
TN,
KY
OHIL
MIWI
MN
IA
MO
AR
LATX
OK
KS
NE
SD
NDMT
WA
OR
CA
AK
HI
WY
CO
NMAZ
UTNV
ID
IN
MS
MD,
Share of Chronically Homeless
Less than 1%1%–2.9%
Greater than 6%3%–6%
0.1
0.1
2.1 1.5
0.2
0.3
0.31.9
0.3
0.2
0.2
0.2
0.5
0.5
0.4
0.3
1.01.2
0.7 0.5
0.5
0.5
1.1
1.5
1.7
2.0
1.8
4.82.9
34.51.6
1.71.0
0.82.3
9.2
1.3
1.2
0.6
1.1
1.2
0.7
0.9
0.5
0.4
0.4
0.2
2.3
3.2
5.6
0.1
On a single night in January 2013• Four states represented more than half of all chronically homeless
individuals: California (34.5%), Florida (9.2%), New York (4.8%), and Texas (5.6%).
Between 2012 and 2013• 36 states and D.C. had declines in the number of chronically
homeless individuals, totaling 11,202 fewer people. Four states represented nearly half of the total decrease: Louisiana (1,728 fewer people), Texas (1,345), Nevada (1,112) and California (941).
• 14 states had increases in the number of chronically homeless individuals, but the total was only 1,041 more people. Two states represented nearly one third of the total increase: Arkansas (204 more people) and Oklahoma (136).
Between 2007 and 2013• The number of chronically homeless individuals dropped in 38
states, totaling 34,430 fewer people. Together, California (11,093 fewer people), Texas (3,161) and New York (2,431) represented 48.5 percent of the total decrease.
• 12 states and D.C. had increases in the number of chronically homeless individuals, but the total was only 2,021 more people. Louisiana (453 more people), Florida (315) and Hawaii (253) represented half of the total increase.
By State
Data Source: PIT 2007–2013Excludes Puerto Rico and U.S. territories See Part 1 of the 2013 AHAR for more details on PIT estimates by state (www.hudexchange.info)
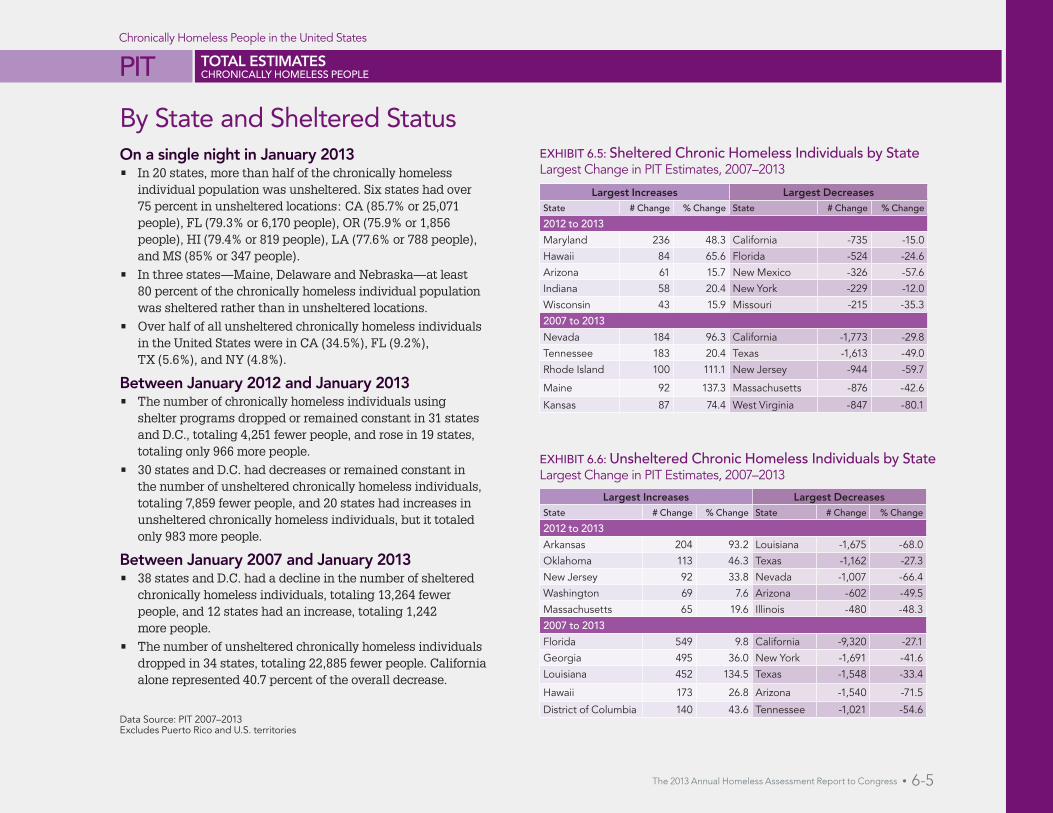
Chronically Homeless People in the United States
TOTAL ESTIMATES CHRONICALLY HOMELESS PEOPLEPIT
The 2013 Annual Homeless Assessment Report to Congress • 6-5
EXHIBIT 6.5: Sheltered Chronic Homeless Individuals by StateLargest Change in PIT Estimates, 2007–2013
EXHIBIT 6.6: Unsheltered Chronic Homeless Individuals by StateLargest Change in PIT Estimates, 2007–2013
Largest Increases Largest DecreasesState # Change % Change State # Change % Change
2012 to 2013
Maryland 236 48.3 California -735 -15.0
Hawaii 84 65.6 Florida -524 -24.6
Arizona 61 15.7 New Mexico -326 -57.6
Indiana 58 20.4 New York -229 -12.0
Wisconsin 43 15.9 Missouri -215 -35.3
2007 to 2013
Nevada 184 96.3 California -1,773 -29.8
Tennessee 183 20.4 Texas -1,613 -49.0
Rhode Island 100 111.1 New Jersey -944 -59.7
Maine 92 137.3 Massachusetts -876 -42.6
Kansas 87 74.4 West Virginia -847 -80.1
Largest Increases Largest DecreasesState # Change % Change State # Change % Change
2012 to 2013
Arkansas 204 93.2 Louisiana -1,675 -68.0
Oklahoma 113 46.3 Texas -1,162 -27.3
New Jersey 92 33.8 Nevada -1,007 -66.4
Washington 69 7.6 Arizona -602 -49.5
Massachusetts 65 19.6 Illinois -480 -48.3
2007 to 2013
Florida 549 9.8 California -9,320 -27.1
Georgia 495 36.0 New York -1,691 -41.6
Louisiana 452 134.5 Texas -1,548 -33.4
Hawaii 173 26.8 Arizona -1,540 -71.5
District of Columbia 140 43.6 Tennessee -1,021 -54.6
On a single night in January 2013• In 20 states, more than half of the chronically homeless
individual population was unsheltered. Six states had over 75 percent in unsheltered locations: CA (85.7% or 25,071 people), FL (79.3% or 6,170 people), OR (75.9% or 1,856 people), HI (79.4% or 819 people), LA (77.6% or 788 people), and MS (85% or 347 people).
• In three states—Maine, Delaware and Nebraska—at least 80 percent of the chronically homeless individual population was sheltered rather than in unsheltered locations.
• Over half of all unsheltered chronically homeless individuals in the United States were in CA (34.5%), FL (9.2%), TX (5.6%), and NY (4.8%).
Between January 2012 and January 2013• The number of chronically homeless individuals using
shelter programs dropped or remained constant in 31 states and D.C., totaling 4,251 fewer people, and rose in 19 states, totaling only 966 more people.
• 30 states and D.C. had decreases or remained constant in the number of unsheltered chronically homeless individuals, totaling 7,859 fewer people, and 20 states had increases in unsheltered chronically homeless individuals, but it totaled only 983 more people.
Between January 2007 and January 2013• 38 states and D.C. had a decline in the number of sheltered
chronically homeless individuals, totaling 13,264 fewer people, and 12 states had an increase, totaling 1,242 more people.
• The number of unsheltered chronically homeless individuals dropped in 34 states, totaling 22,885 fewer people. California alone represented 40.7 percent of the overall decrease.
By State and Sheltered Status
Data Source: PIT 2007–2013Excludes Puerto Rico and U.S. territories

7Peo
ple in Perm
anent Supp
ortive H
ousing
7People Living in Permanent Supportive Housing IN THE UNITED STATES
HOMELESS MANAGEMENT INFORMATION SYSTEM (HMIS)One-Year Estimates of People Living in Permanent Supportive Housing (PSH) . . . . . . . . . . . . . . . . . . . . . . . . . 7-3
Characteristics of People Living in PSHGender and Age . . . . . . . . . . . . . . . . . . . . . . . . . . . . . . . . . . . . . . . . . . . . . . . . . . . . 7-4Ethnicity and Race . . . . . . . . . . . . . . . . . . . . . . . . . . . . . . . . . . . . . . . . . . . . . . . . . . . 7-5Household Size and Disability Status . . . . . . . . . . . . . . . . . . . . . . . . . . . . . . . . . . . 7-7
Geography of People Living in PSHGeographic Location . . . . . . . . . . . . . . . . . . . . . . . . . . . . . . . . . . . . . . . . . . . . . . . . 7-8Characteristics by Geography . . . . . . . . . . . . . . . . . . . . . . . . . . . . . . . . . . . . . . . . . 7-9
Residential Patterns People Living in PSHPlaces Adults Living in PSH Stayed Before Entering PSH . . . . . . . . . . . . . . . . . 7-10Length of Stay and Other Bed-Use Patterns . . . . . . . . . . . . . . . . . . . . . . . . . . . 7-11Destination at Move-Out for PSH Residents . . . . . . . . . . . . . . . . . . . . . . . . . . . . 7-12
One-Year Estimates of Veterans Living in PSH . . . . . . . . . . . . . . . . . .7-13
Characteristics of Veterans Living in PSH . . . . . . . . . . . . . . . . . . . . . . . .7-14
Residential Patterns Veterans Living in PSHPlaces Veterans Stayed Before Moving Into PSH . . . . . . . . . . . . . . . . . . . . . . . . 7-16

People in Permanent Supportive Housing in the United States
VETERANS PEOPLE IN PSHHMIS
7-2 • The 2013 Annual Homeless Assessment Report to Congress
PROFILE OF A TYPICAL PERSON LIVING IN PSH IN 2013
PEOPLE LIVING IN PSH
33.6% WERE AGE
55.2% MALE / 59.2% 1-PERSON HOUSEHOLD
44.2% WERE
64.0% WERE IN A
80.8% HAD
YEARS SPENT LIVING IN PERMANENT SUPPORTIVE HOUSING
PRIOR TO ENTERING PSH, 78.2% WERE
A Man Living Alone
31–50
Already Homeless
African American
City
A Disability
2–5
PERMANENT SUPPORTIVE HOUSING (PSH) is a program designed to provide housing (project- and tenant-based) and supportive services on a long-term basis to formerly homeless people. McKinney-Vento-funded programs require that the client have a disability for program eligibility, so the majority of people in PSH have disabilities.
KEY TERM
IN THE UNITED STATES
291,352 people were living in PSH
HMIS DATA
Throughout the year in 2013…
Only 5% of people who exited PSH became homeless
The number who stayed in PSH for more than 5 years
increased 16%

The 2013 Annual Homeless Assessment Report to Congress • 7-3
One-Year EstimatesOF PEOPLE LIVING IN PERMANENT SUPPORTIVE HOUSING (PSH)
291,352 people lived in Permanent Supportive Housing in 2013.HMIS
Individuals People in FamiliesAll People
188,636 195,724219,381
236,798267,106 274,786
116,155 119,143131,663 141,445
161,125 166,370
72,481 76,581 87,718 95,353 105,981 108,416
284,298
176,233
108,065
2007 2008 2009 2010 2012 20132011
2010 2012 2013
Individuals People in Families
289,467
65.2%
35.0%
291,352
63.2%
36.8%
294,748
57.5%
42.7%
Population2012–2013 2010–2013
# Change % Change # Change % Change
Total People in PSH -3,396 -1.2 1,885 0.7
Individuals in PSH 14,702 8.7 -4,672 -2.5
People in families in PSH -18,379 -14.6 6,168 6.1
EXHIBIT 7.3: Inventory of PSH Beds in the U.S., 2007–2013
EXHIBIT 7.1: One-Year Estimates of People Living in PSH By Household Type, 2010–2013
EXHIBIT 7.2: Change in the One-Year Estimates People Living in PSH by Household Type, 2010–2013
Note: The share of people in PSH as individuals and as family members may not sum to 100% because some people were in PSH as both individuals and in families at different points during the reporting period.
Permanent Supportive Housing (PSH) programs are designed to serve people who were homeless and who have disabilities that interfere with their ability to maintain housing on their own. PSH programs provide permanent
housing combined with intensive supportive services to stabilize formerly homeless people in housing, and has been an important priority for HUD for many years. The number of beds in PSH projects has increased by 50.7 percent since 2007.
In 2010, HUD began collecting aggregate one-year estimates of people in PSH. People in PSH are in housing and not considered homeless, unlike people using emergency shelter and transitional housing programs. Because PSH is meant for a subset of formerly homeless people, their characteristics would not be expected to be the same as those using the shelter system. Nonetheless, comparing people living in PSH with shelter users can shed light on how the PSH system is working. People in PSH are classified by household type, following the definitions used in Sections 2 and 3 of this report: individuals are people in households that do not have at least one adult and one child, while people in families are in households with at least one adult and one child.
The estimates of people in PSH are based on a nationally representative sample of communities that submit aggregate Homeless Management Information Systems (HMIS) data to HUD. Data are statically adjusted for people in PSH that do not yet participate in their local HMIS—thus providing a complete enumeration of people in PSH in each community—and are weighted to represent the entire country. The 95 percent confidence interval for people in PSH in 2013 is ± 18,356 (272,996 to 309,708).
2013 Estimate of People in PSH• An estimated 291,352 people lived in PSH in 2013.
• Almost two-thirds are individuals rather than people in families (63.2%).
Changes Over Time• The number of people living in PSH increased 0.7 percent (1,885 more people)
between 2012 and 2013. Declines among individuals (4,672 fewer people) were more than offset by increases among people in families (6,168 more people).
• In contrast, between 2010 and 2013, there was a 14.6 percent decline (18,379 fewer people) among people in families and an 8.7 percent increase among individuals (14,702 more people).
Data Source: HMIS 2010–2013; HIC 2007–2013

People in Permanent Supportive Housing in the United States
HMIS
7-4 • The 2013 Annual Homeless Assessment Report to Congress
EXHIBIT 7.4: GenderAdults Living in PSH and Adults Using Shelters, 2010–2013
EXHIBIT 7.5: AgePeople Living in PSH and People Using Shelters, 2010–2013
Gender and AgeIn 2013• At 44.8 percent of all adults in PSH, women represented a larger
share of the PSH residents than of people using emergency shelters and transitional housing programs, 36.6 percent.
• About one in five PSH residents was a child under age 18, about the same as for people using shelter programs. People living in PSH are older than people using shelters, with 31.5 percent aged 51 or older compared to 20.3 percent of people using shelters.
Changes Over Time• People living in PSH were older in 2013 than in 2010. The share
of people age 62 and older living in PSH grew from 4 percent in 2010 to 6.4 percent in 2013 (6,918 more people), and the share of PSH residents aged 51 to 61 grew from 19.9 percent to 25.1 percent (14,202 more people).
• The share of PSH residents who are women dropped from 47.3 percent in 2010 to 44.8 percent in 2013. A decline of women in families in PSH (6,985 fewer women) outnumbered an increase of women in PSH as individuals (5,998 more women).
37.7
36.8
36.663.4
63.2
62.3
0% 100%
2012
2010
2013
2012
2010
2013
ADULTSIN PSH
SHELTEREDADULTS
Male Female
44.8
44.7
47.3
55.2
55.3
52.7
22.2
22.6
21.8
22.9
23.5
23.5
34.6
35.0
37.0
16.8
15.6
14.9
3.5
3.2
2.8
21.8
20.7
26.1
13.2
14.1
13.2
33.6
35.5
35.8
25.1
24.9
19.9
6.4
5.7
4.0
0.245.2
2012
2010
2012
2010
2013
Under Age 18 18–30 31–50
51–61 62 and Older
PEOPLEIN PSH
SHELTEREDPEOPLE
0% 100%
2013
Data Source: HMIS 2010–2013
CHARACTERISTICS PEOPLE LIVING IN PSH
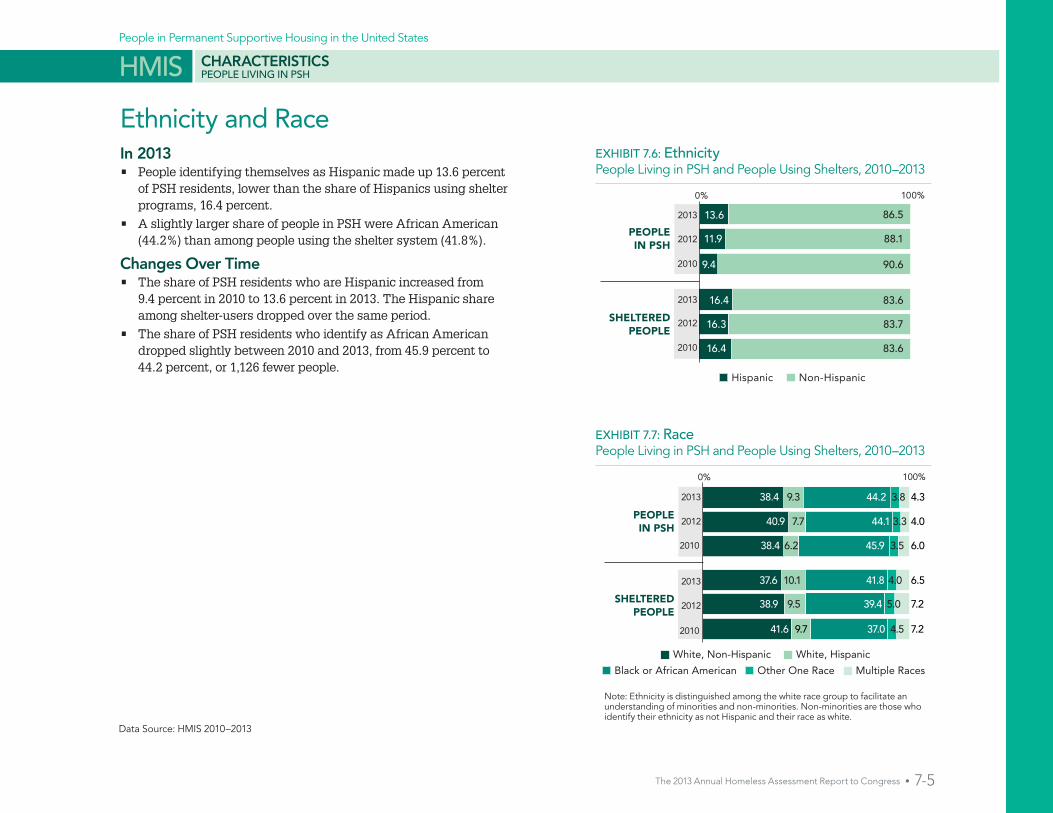
People in Permanent Supportive Housing in the United States
HMIS
The 2013 Annual Homeless Assessment Report to Congress • 7-5
Ethnicity and RaceIn 2013• People identifying themselves as Hispanic made up 13.6 percent
of PSH residents, lower than the share of Hispanics using shelter programs, 16.4 percent.
• A slightly larger share of people in PSH were African American (44.2%) than among people using the shelter system (41.8%).
Changes Over Time• The share of PSH residents who are Hispanic increased from
9.4 percent in 2010 to 13.6 percent in 2013. The Hispanic share among shelter-users dropped over the same period.
• The share of PSH residents who identify as African American dropped slightly between 2010 and 2013, from 45.9 percent to 44.2 percent, or 1,126 fewer people.
EXHIBIT 7.6: EthnicityPeople Living in PSH and People Using Shelters, 2010–2013
EXHIBIT 7.7: RacePeople Living in PSH and People Using Shelters, 2010–2013
0% 100%
2012
2012
2010
2013
PEOPLEIN PSH
SHELTEREDPEOPLE
Hispanic Non-Hispanic
16.3
9.4
11.9
13.62013
16.4
86.5
83.6
83.7
83.6
90.62010
16.4
88.1
37.6 10.1 41.8 4.0 6.5
38.9 9.5 39.4 5.0 7.2
41.6 37.0 4.59.7 7.2
22.6
38.4 9.3 44.2 3.8 4.3
40.9 7.7 44.1 3.3 4.0
38.4 6.2 45.9 3.5 6.0
0.245.2
2012
2010
2012
2010
2013
PEOPLEIN PSH
SHELTEREDPEOPLE
0% 100%
2013
White, Non-Hispanic White, Hispanic
Other One RaceBlack or African American Multiple Races
Data Source: HMIS 2010–2013
Note: Ethnicity is distinguished among the white race group to facilitate an understanding of minorities and non-minorities. Non-minorities are those who identify their ethnicity as not Hispanic and their race as white.
CHARACTERISTICS PEOPLE LIVING IN PSH

People in Permanent Supportive Housing in the United States
VETERANS PEOPLE IN PSHHMIS
7-6 • The 2013 Annual Homeless Assessment Report to Congress

People in Permanent Supportive Housing in the United States
HMIS
The 2013 Annual Homeless Assessment Report to Congress • 7-7
Household Size and Disability StatusAlthough many people in PSH have a disabling condition, some PSH programs are restricted to clients with a disability and some are not. A household member must have a long-term disability in order to be eligible for McKinney-Vento-funded PSH programs, for instance. For this reason, HUD requests that CoCs report more detailed disability information in HMIS on adults in PSH than on adults in shelter. Adults in PSH can have multiple disabilities, and thus disability types do not sum to 100 percent.
In 2013• More than half of people in PSH lived there alone, 59.2 percent. By
comparison, 64 percent of people using shelters were there alone.
• A somewhat larger share of PSH residents were in two-person households than people using shelters, 11.3 versus 9.6 percent. Two-person households in PSH were more often classified as individuals (likely two adults) than those using shelter (4.8% versus 1.9%).
• In many PSH programs, only people with disabilities are eligible. Not surprisingly, 8 of every 10 adults in PSH had a disability (80.8%). Only 39.6 percent of adults using shelter had a disability.
• Mental health issues were the most common disability among residents of PSH. Over half (55.3%) of adults in PSH either had a mental health condition or had dual diagnosis that includes both mental health and substance abuse.
Changes Over Time• The share of people in PSH living alone increased from 55.6 percent
in 2010 to 59.2 percent in 2013.
• Between 2010 and 2013, the share of PSH residents who have a disability increased slightly as well, especially among those who have any mental health issue (39,538 more adults) or a physical disability (19,435 more adults).
• The number of adult residents of PSH with HIV/AIDS increased 29.5 percent (3,795 more adults) since 2010; much of this increase occurred in the last year (2,069 more adults).
EXHIBIT 7.8: Household SizePeople Living in PSH and People Using Shelters, 2010–2013
EXHIBIT 7.9: Disability StatusAdults Living in PSH, 2010–2013 (in %)
64.0 9.6 10.2 7.9 8.3
63.1 9.6 10.5 7.9 8.9
63.0 10.1 10.4 8.1 8.4
59.2 11.3 11.0 9.78.7
61.3 11.5 10.1 8.78.4
55.6 12.6 9.311.8 10.8
22.6
0.245.2
2012
2010
2012
2010
2013
PEOPLEIN PSH
SHELTEREDPEOPLE
0% 100%
2013
1 Person 2 People 3 People
4 People 5 or More People
Disability Type 2010 2012 2013
Any Type of Disability 78.8 81.3 80.8
Dual Diagnosis 17.3 26.3 25.0
Mental Health 24.2 30.3 30.3
Substance Abuse 11.9 9.9 8.9
Physical Disability 13.2 19.4 20.7
HIV/AIDS 6.4 6.6 7.5
Developmental Disability 3.3 4.8 4.5
Data Source: HMIS 2010–2013
Note1: The client self-reports whether or not they have a disability, but McKinney-Vento-funded PSH programs require documentation for disability type. Other programs may or may not rely on self-reported disability type.Note2: Dual diagnosis refers to people that have both a mental health and substance abuse issue. People with dual diagnosis are not included in the mental health or substance abuse categories. Note3: Percent of adults with disabilities will not sum to 100% because people in PSH may have more than one type of disability.
CHARACTERISTICS PEOPLE LIVING IN PSH

People in Permanent Supportive Housing in the United States
HMIS
7-8 • The 2013 Annual Homeless Assessment Report to Congress
Geographic LocationIn 2013• Almost two-thirds of PSH residents were living in cities
(64%) rather than suburban and rural areas (36%). However, PSH residents were more likely to be located in suburban and rural areas than were people using shelter programs, 36 percent versus 28.1 percent.
Changes Over Time• In contrast to a drop in the number of shelter users in
suburban and rural areas between 2012 and 2013, the number of PSH residents in suburban and rural areas continued to increase. Between 2010 and 2013, the number of PSH residents increased 22.6 percent (19,308 more people) in suburban and rural areas.
• The number of PSH residents living in cities decreased 11.1 percent (23,229 fewer people) between 2010 and 2013.
PEOPLEIN PSH
SUBURBAN AND RURAL AREASPRINCIPAL CITIES
SHELTEREDPEOPLE
U.S.POPULATION*
0% 100%
64.0 36.0
28.1
29.8
36.2
35.6
29.0
64.4
71.0
71.9
70.2
63.8
2012
2013
2010
2012
2013
2010
2012
2013
2010
24.2
24.2
24.8
75.8
75.8
75.2
EXHIBIT 7.10: Geographic Distribution People Living in PSH, People Using Shelters, and Total U.S. Population, 2010–2013
EXHIBIT 7.11: Percent Change by Geography Change in the Number of People Living in PSH, People Using Shelters, and the Total U.S. Population, 2010–2013 (in %)
Population2012–2013 2010–2013
Principal Cities
Suburban & Rural Areas
Principal Cities
Suburban & Rural Areas
All Persons in PSH -0.1 1.6 -11.1 22.6
All Sheltered Persons -2.3 -9.9 0.4 -30.8
Data Source: HMIS 2010–2013; ACS 2009, 2010, 2011
* In the 2013 ACS, the geographic indicator used to distinguish principal cities from other areas is not yet available. The data source used to represent 2012 and 2013 are from the most recent two years available
* In the 2013 ACS, the geographic indicator used to distinguish principal cities from other areas is not yet available. The data source used to represent 2012 and 2013 are from the most recent two years available
GEOGRAPHY PEOPLE LIVING IN PSH
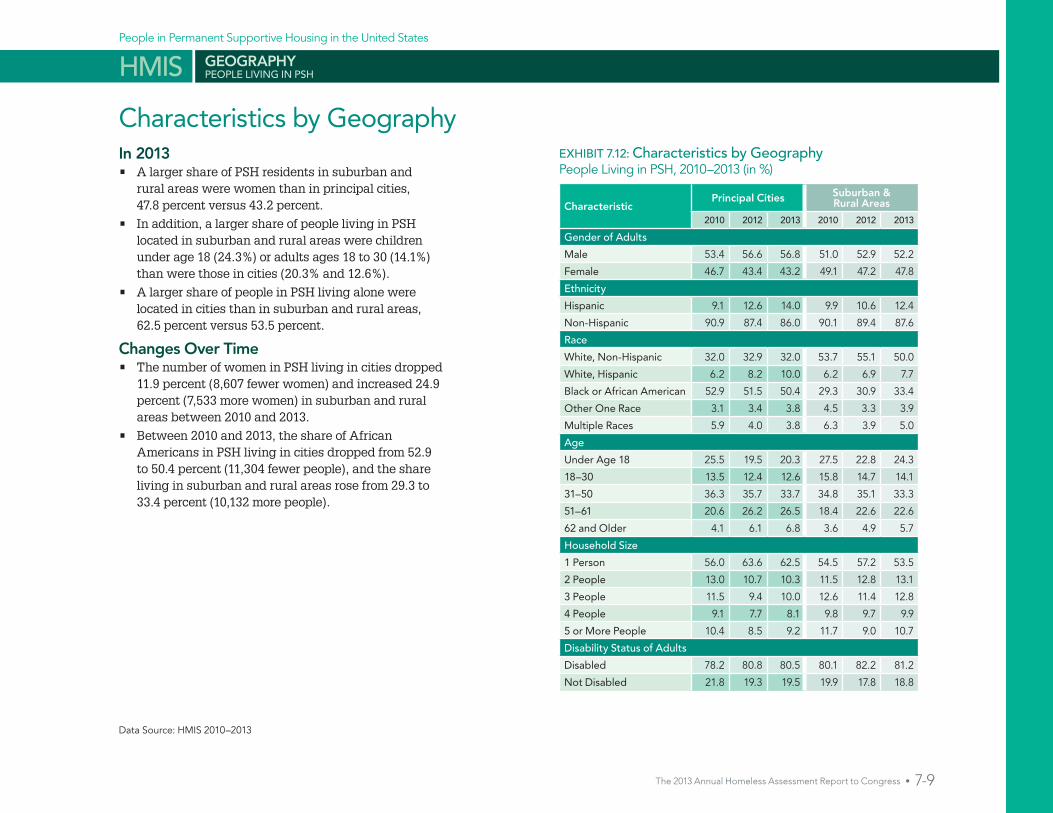
People in Permanent Supportive Housing in the United States
HMIS
The 2013 Annual Homeless Assessment Report to Congress • 7-9
Characteristics by GeographyIn 2013• A larger share of PSH residents in suburban and
rural areas were women than in principal cities, 47.8 percent versus 43.2 percent.
• In addition, a larger share of people living in PSH located in suburban and rural areas were children under age 18 (24.3%) or adults ages 18 to 30 (14.1%) than were those in cities (20.3% and 12.6%).
• A larger share of people in PSH living alone were located in cities than in suburban and rural areas, 62.5 percent versus 53.5 percent.
Changes Over Time• The number of women in PSH living in cities dropped
11.9 percent (8,607 fewer women) and increased 24.9 percent (7,533 more women) in suburban and rural areas between 2010 and 2013.
• Between 2010 and 2013, the share of African Americans in PSH living in cities dropped from 52.9 to 50.4 percent (11,304 fewer people), and the share living in suburban and rural areas rose from 29.3 to 33.4 percent (10,132 more people).
CharacteristicPrincipal Cities Suburban &
Rural Areas
2010 2012 2013 2010 2012 2013
Gender of Adults
Male 53.4 56.6 56.8 51.0 52.9 52.2
Female 46.7 43.4 43.2 49.1 47.2 47.8
Ethnicity
Hispanic 9.1 12.6 14.0 9.9 10.6 12.4
Non-Hispanic 90.9 87.4 86.0 90.1 89.4 87.6
Race
White, Non-Hispanic 32.0 32.9 32.0 53.7 55.1 50.0
White, Hispanic 6.2 8.2 10.0 6.2 6.9 7.7
Black or African American 52.9 51.5 50.4 29.3 30.9 33.4
Other One Race 3.1 3.4 3.8 4.5 3.3 3.9
Multiple Races 5.9 4.0 3.8 6.3 3.9 5.0
Age
Under Age 18 25.5 19.5 20.3 27.5 22.8 24.3
18–30 13.5 12.4 12.6 15.8 14.7 14.1
31–50 36.3 35.7 33.7 34.8 35.1 33.3
51–61 20.6 26.2 26.5 18.4 22.6 22.6
62 and Older 4.1 6.1 6.8 3.6 4.9 5.7
Household Size
1 Person 56.0 63.6 62.5 54.5 57.2 53.5
2 People 13.0 10.7 10.3 11.5 12.8 13.1
3 People 11.5 9.4 10.0 12.6 11.4 12.8
4 People 9.1 7.7 8.1 9.8 9.7 9.9
5 or More People 10.4 8.5 9.2 11.7 9.0 10.7
Disability Status of Adults
Disabled 78.2 80.8 80.5 80.1 82.2 81.2
Not Disabled 21.8 19.3 19.5 19.9 17.8 18.8
EXHIBIT 7.12: Characteristics by GeographyPeople Living in PSH, 2010–2013 (in %)
Data Source: HMIS 2010–2013
GEOGRAPHY PEOPLE LIVING IN PSH

People in Permanent Supportive Housing in the United States
HMIS
7-10 • The 2013 Annual Homeless Assessment Report to Congress
Place Stayed2013 2012–2013 2010–2013
# % # Change % Change # Change % Change
Homeless 168,264 76.2 3,292 2.0 39,952 31.1
Sheltered 128,773 76.5 3,124 2.5 26,065 25.8
Unsheltered 39,491 23.5 168 0.4 12,349 45.5
Housing 34,200 15.5 297 0.9 -2,496 -6.8
Staying with family 11,714 34 .3 -435 -3 .6 -508 -4 .2
Staying with friends 7,044 20 .6 428 6 .5 15 0 .2
Rented housing unit 10,478 30 .6 236 2 .3 -1,417 -11 .9
Owned housing unit 738 2 .2 -36 -4 .7 -863 -53 .9
Other PSH 4,226 12 .4 104 2 .5 277 7 .0
Institutional Settings
10,376 4.7 -416 -3.9 -610 -5.6
Substance abuse treatment center
5,194 50.1 14 0.3 -300 -5.5
Correctional facility 1,479 14.3 168 12.8 256 20.9
Hospital 1,172 11.3 63 5.7 -26 -2.2
Psychiatric facility 2,531 24.4 -661 -20.7 -540 -17.6
Other Settings 7,937 3.6 -1,337 -14.4 -10,109 -56.0
Hotel or motel 2,076 26.2 -185 -8.2 -256 -11.0
Foster care home 834 10.5 179 27.3 226 37.2
Other living arrangement
5,027 63.3 -1,331 -20.9 -10,079 -66.7
Places Adults Living in PSH Stayed before Entering PSHEXHIBIT 7.13: Places Adults Stayed Before Entering PSH and Change over Time, 2010–2013
EXHIBIT 7.14: Places Adults StayedBefore Entering PSH, 2010–2013 (in %)
201320122010
66.1 75.4 76.2
18.95.7 4.9 4.79.3 4.2 3.6
15.5 15.5Data Source: HMIS 2010–2013
Information on where people lived before entering PSH was asked only of adults.
In 2013• Of the adults living in PSH, more than three-quarters had been
homeless before they moved into PSH. Most of these 168,264 adults came from shelter programs, 76.5 percent, rather than a place not meant for human habitation, 23.5 percent).
• Before entering PSH, 15.9 percent of adults had been in a housed situation. Of those 34,200 adults, 34.3 percent were staying with family, 30.6 percent were in housing they rented, and 20.6 percent were staying with friends.
• Of those who came from a housed situation, 12.4 percent (4,226 adults) had been in another PSH program.
• Only 4.8 percent of adults in PSH were located in an institutional setting prior to entering PSH. Half of the 10,376 adults from institutional settings were in a substance abuse treatment center, 24.4 percent were in a psychiatric facility, 14.3 percent were in a correctional facility, and 11.3 percent were in a hospital.
Changes Over Time• Between 2012 and 2013, the number of adults entering PSH from
a homeless situation increased 2 percent (3,292 more people).
• The number of people in PSH that come from a homeless situation increased substantially by 31.1 percent, or almost 40,000 more people, from 2010 to 2013.
• Between 2010 and 2013, 2,496 fewer adults in PSH were in a housed situation before entering PSH.
RESIDENTIAL PATTERNS PEOPLE LIVING IN PSH
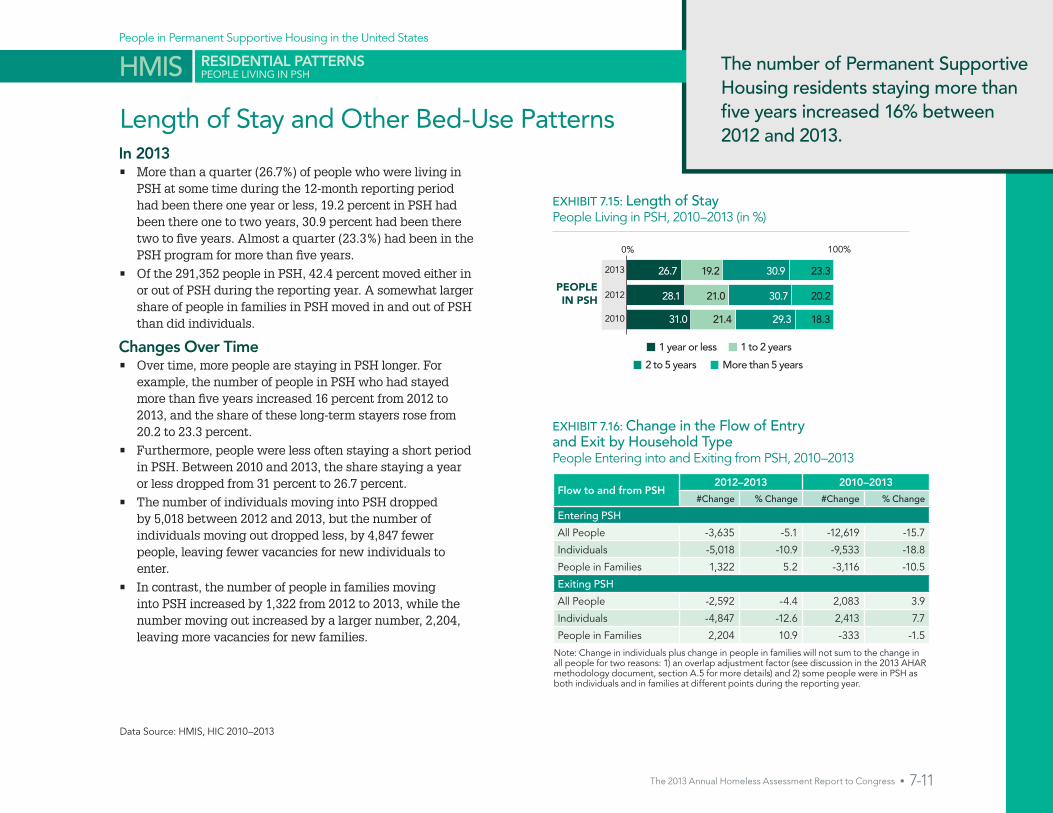
People in Permanent Supportive Housing in the United States
HMIS
The 2013 Annual Homeless Assessment Report to Congress • 7-11
Length of Stay and Other Bed-Use PatternsIn 2013• More than a quarter (26.7%) of people who were living in
PSH at some time during the 12-month reporting period had been there one year or less, 19.2 percent in PSH had been there one to two years, 30.9 percent had been there two to five years. Almost a quarter (23.3%) had been in the PSH program for more than five years.
• Of the 291,352 people in PSH, 42.4 percent moved either in or out of PSH during the reporting year. A somewhat larger share of people in families in PSH moved in and out of PSH than did individuals.
Changes Over Time• Over time, more people are staying in PSH longer. For
example, the number of people in PSH who had stayed more than five years increased 16 percent from 2012 to 2013, and the share of these long-term stayers rose from 20.2 to 23.3 percent.
• Furthermore, people were less often staying a short period in PSH. Between 2010 and 2013, the share staying a year or less dropped from 31 percent to 26.7 percent.
• The number of individuals moving into PSH dropped by 5,018 between 2012 and 2013, but the number of individuals moving out dropped less, by 4,847 fewer people, leaving fewer vacancies for new individuals to enter.
• In contrast, the number of people in families moving into PSH increased by 1,322 from 2012 to 2013, while the number moving out increased by a larger number, 2,204, leaving more vacancies for new families.
EXHIBIT 7.15: Length of StayPeople Living in PSH, 2010–2013 (in %)
EXHIBIT 7.16: Change in the Flow of Entry and Exit by Household TypePeople Entering into and Exiting from PSH, 2010–2013
Flow to and from PSH2012–2013 2010–2013
#Change % Change #Change % Change
Entering PSH
All People -3,635 -5.1 -12,619 -15.7
Individuals -5,018 -10.9 -9,533 -18.8
People in Families 1,322 5.2 -3,116 -10.5
Exiting PSH
All People -2,592 -4.4 2,083 3.9
Individuals -4,847 -12.6 2,413 7.7
People in Families 2,204 10.9 -333 -1.5
26.7
31.0
19.2
21.4
30.9
29.3
23.3
28.1 21.0 30.7 20.2
18.3
2012
2010
PEOPLEIN PSH
0% 100%
2013
1 year or less 1 to 2 years
2 to 5 years More than 5 years
Data Source: HMIS, HIC 2010–2013
Note: Change in individuals plus change in people in families will not sum to the change in all people for two reasons: 1) an overlap adjustment factor (see discussion in the 2013 AHAR methodology document, section A.5 for more details) and 2) some people were in PSH as both individuals and in families at different points during the reporting year.
The number of Permanent Supportive Housing residents staying more than five years increased 16% between 2012 and 2013.
RESIDENTIAL PATTERNS PEOPLE LIVING IN PSH

People in Permanent Supportive Housing in the United States
HMIS
7-12 • The 2013 Annual Homeless Assessment Report to Congress
EXHIBIT 7.17: Destination upon Moving Out People Living in PSH by Household Type, 2013
EXHIBIT 7.18: Percent Change in Destination upon Moving OutPeople Living in PSH by Household Type, 2010–2013 (in %)
DestinationAll People Individuals People in Families
# % # % # %
Homeless 2,785 5.5 2,184 7.3 601 2.9
Sheltered 2,199 79.0 1,628 74.5 572 95.2
Unsheltered 586 21.0 556 25.5 29 4.8
Housing 37,622 74.2 19,930 66.2 17,709 85.9
Staying with family 8,469 22 .5 4,826 24 .2 3,647 20 .6
Staying with friends 3,374 9 .0 2,333 11 .7 1,042 5 .9
Rented housing unit 22,053 58 .6 10,482 52 .6 11,580 65 .4
Owned housing unit 702 1 .9 401 2 .0 302 1 .7
Other PSH 3,024 8 .0 1,888 9 .5 1,138 6 .4
Institutional Settings 3,916 7.7 3,304 11.0 615 3.0
Substance abuse treatment center
845 21.6 621 18.8 224 36.4
Correctional facility 2,115 54.0 1,755 53.1 361 58.7
Hospital 503 12.8 493 14.9 11 1.8
Psychiatric facility 453 11.6 435 13.2 19 3.1
Other Settings 11,599 12.6 8,192 15.6 3,413 8.2
Hotel or motel 218 1.9 121 1.5 97 2.8
Foster care home 382 3.3 200 2.4 183 5.4
Other living arrangement
3,467 29.9 2,217 27.1 1,251 36.7
Missing Destination 5,214 45.0 3,486 42.6 1,731 50.7
Destination2012–2013 2010–2013
All People Individuals
People in Families
All People Individuals
People in Families
Homeless -18.1 -16.3 -24.2 32.3 31.1 36.9
Housing 0.7 -11.8 19.7 38.0 35.0 41.4
Institutional Setting -15.5 -17.9 -0.3 28.7 22.9 72.8
Other Setting -11.7 -11.2 -13.2 -45.9 -32.2 -63.5
Destination at Move-Out for PSH Residents
Data Source: HMIS 2010–2013
In 2013• Of people moving out of PSH, only 5 percent became homeless. Of
those 2,785 people, more than three-quarters entered shelter (79%), while the remainder went to unsheltered locations (21%).
• Most people leaving PSH during the reporting year moved to another housed situation, 67.3 percent. Of those 37,622 people, more than half moved into housing they rented (58.6%), 22.5 percent moved in with family, 9 percent with friends, and 8 percent moved into other permanent supportive housing.
• People in families who moved out of PSH were more likely to move into housing than individuals who exited PSH (79.3% versus 59.3%). A larger share of people in families who exited PSH to housing moved into rental housing than did individuals (65.4% versus 52.6%), while a larger share of individuals who exited PSH to housing went to stay with friends than did people in families (11.7% versus 5.9%).
• Of people moving out of PSH, 7 percent (3,916 people) went to an institutional setting. Of those, over half (54%) entered a correctional facility, 21.6 percent a substance abuse treatment center, 12.8 percent a hospital, and 11.6 percent a psychiatric facility.
• Individuals who moved out of PSH were 3.5 times more likely to go to an institutional setting than people in families, 9.8 versus 2.8 percent. Individuals were more likely to exit to a hospital or a psychiatric facility, while people in families were more likely to go to substance abuse treatment centers.
Changes Over Time• Of those moving out of PSH, 614 fewer people became homeless in
2013 than in 2012. A larger share of this decline was from individuals rather than people in families, 424 versus 192 people. The share of those moving out of PSH that became homeless dropped from 6.6 to 5.5 percent.
RESIDENTIAL PATTERNS PEOPLE LIVING IN PSH

People in Permanent Supportive Housing in the United States
HMIS
The 2013 Annual Homeless Assessment Report to Congress • 7-13
EXHIBIT 7.19: One-Year Estimates of Veterans Living in PSHBy Household Type, 2010–2013
EXHIBIT 7.20: Change in the Number of Veterans Living in PSHBy Household Type, 2010–2013
22,338 31,158
2010 2012 2013
Individual Veterans Veterans in Families
96.5% 92.2%
3.6% 7.9%
25,680
93.2%
7.0%
Year Individual Veterans Veterans in Familes Total Count2010 96.5% 3.6% 22,3382012 93.2% 7.0% 25,6802013 92.2% 7.9% 31,240
Population2012–2013 2010–2013
# Change % Change # Change % Change
Total Veterans in PSH 5,478 21.3 8,820 39.5
Individual Veterans in PSH 4,781 20.0 7,165 33.2
Veterans in Families in PSH 671 37.5 1,655 205.8
One-Year Estimates of Veterans Living in PSH
Data Source: HMIS 2010–2013
The final pages of this section provide information on veterans residing in PSH. The estimates distinguish between veterans served as individuals and veterans who are living with at least one child (the same definition of family as elsewhere in this report), but only the veterans are included in the counts, not other adults or children in the household. The 95 percent confidence interval for veterans in PSH in 2013 is 28,140 to 34,176 (+/- 3,018).
In 2013, 31,158 veterans lived in permanent supportive housing, an increase of 21.3 percent since 2012 and an increase of 39.5 percent since 2010. These one-year estimates of veterans in PSH do not include veterans living in HUD-VA Supportive Housing (HUD-VASH) programs if those programs do not participate in HMIS. The HUD-VASH program combines Housing Choice Voucher rental assistance with case management and clinical services provided by the VA. Administrative data from the HUD-VASH program indicate that 66,315 veterans have been housed through the program between 2008 and 2013.
In 2013• 31,158 veterans lived in PSH in 2013. More than 9 in 10 were in
PSH as individuals (92.2%) rather than as members of a family with at least one child (7.9%).
Changes Over Time• Numbers of veterans living in PSH have increased: 5,478 more in
2013 than in 2012 (a 21.3% rise), and 8,820 more than in 2010 (a 39.5% rise).
• Between 2010 and 2013, the share of veterans living in PSH as a family member rose from 3.6 to 7.9 percent, while the share as an individual dropped from 96.5 to 92.2 percent.
Note: The share of veterans living in PSH as individuals and as family members may not sum to 100% because some veterans were in PSH as both individuals and in families at different points during the reporting period
In 2013, 31,158 veterans lived in Permanent Supportive Housing, an increase of 21.3% since 2012.
ONE-YEAR ESTIMATES VETERANS LIVING IN PSH

People in Permanent Supportive Housing in the United States
HMIS
7-14 • The 2013 Annual Homeless Assessment Report to Congress
Characteristic All Veterans Individual Veterans Veterans in Families
Number of Veterans in PSH 31,158 28,716 2,459
Gender
Male 87.4 89.9 57.7
Female 12.6 10.0 42.3
Ethnicity
Hispanic 8.1 8.1 7.9
Non-Hispanic 91.9 91.9 92.1
Race
White, Non-Hispanic 46.5 46.7 44.4
White, Hispanic 5.2 5.2 5.1
Black or African American 43.1 43.1 42.4
Other One Race 2.5 2.4 3.6
Multiple Races 2.7 2.6 4.6
Age
18–30 4.7 3.2 22.3
31–50 29.6 27.4 55.5
51–61 49.0 51.5 19.1
62 and Older 16.7 17.9 3.1
Disability Status
Disabled 81.2 82.5 65.3
Not Disabled 18.9 17.5 34.7
EXHIBIT 7.21: Characteristics by Household TypeVeterans Living in PSH, 2013 (in %)
In 2013• The typical veteran in PSH was a man (87.4%) who
identified himself as either white and not Hispanic (46.5%) or as African American (43.1%).
• Most veterans living in PSH were alone or with other adults. Only 7.8 percent were in households with at least one child present.
• About half of veterans living in PSH were between 51 and 61 years old (49%), and 8 in 10 had a disability (81.2%). The small number of veterans living in PSH as part of a family were somewhat younger, with 55.5 percent between 31 and 50. They were less likely to have a disability, although almost two-thirds did (65.3%).
• Of the 24,492 veterans with a disability in PSH, 33.7 percent had dual diagnosis—that is, both a mental health and substance abuse issue. Altogether, 60.9 percent had either just a mental health issue or dual diagnosis. More than a third of veterans in PSH had a physical disability, 36 percent.
Characteristics of Veterans Living in PSH
Data Source: HMIS 2010–2013
Note1: Dual diagnosis refers to people that have both a mental health and substance abuse issue. People with dual diagnosis are not included in the mental health or substance abuse categories. Note2: Percent of veterans with disabilities do not sum to 100% because people in PSH may have more than one type of disability.
CHARACTERISTICS VETERANS LIVING IN PSH

People in Permanent Supportive Housing in the United States
HMIS
The 2013 Annual Homeless Assessment Report to Congress • 7-15
EXHIBIT 7.22: Disability TypeVeterans Living in PSH, 2010–2013 (in %)
Disability Type 2010 2012 2013
Any Type of Disability 80.5 85.4 81.2
Dual Diagnosis 23.7 36.8 33.7
Mental Health 23.3 27.2 27.2
Substance Abuse 16.7 14.6 12.3
Physical Disability 22.1 35.7 36.0
HIV/AIDS 5.8 4.8 6.2
Developmental Disability 1.8 3.5 3.5
Data Source: HMIS 2010–2013
Note 1: Dual diagnosis refers to people that have both a mental health and substance abuse issue. People with dual diagnosis are not included in the mental health or substance abuse categories. Note 2: Percent of veterans with disabilities do not sum to 100% because people in PSH may have more than one type of disability.
Changes Over Time• The share of veterans living in PSH with a dual
diagnosis increased from 23.7 percent in 2010 to 33.7 percent in 2013.
• The share of veterans living in PSH with a physical disability increased from 22.1 percent in 2010 to 36 percent in 2013.
CHARACTERISTICS VETERANS LIVING IN PSH

People in Permanent Supportive Housing in the United States
HMIS
7-16 • The 2013 Annual Homeless Assessment Report to Congress
Data Source: HMIS 2010–2013
Places Veterans Stayed Before Moving Into PSHIn 2013• More than three-quarters of veterans living in PSH were
homeless immediately before moving in (77.1%). Of those 23,022 veterans, over three-quarters were in shelter (76%) rather than in an unsheltered location.
• Of the 4,503 veterans in PSH that moved in from another housed situation, 36 percent had been in housing they rented, 24.6 percent had been living with family, and 18.7 percent had been living with friends.
• Of the 1,523 veterans who came to PSH from an institutional setting, over half (56.2%) came from a substance abuse treatment center.
Changes Over Time• Between 2010 and 2013, the number of veterans entering
PSH from another housing situation increased 85.8 percent (2,079 more veterans), with the share increasing from 11.6 to 15.1 percent.
EXHIBIT 7.23: Places Veterans StayedBefore Moving Into PSH, 2010–2013 (in %)
EXHIBIT 7.24: Change in Places Veterans Stayed Before Moving Into PSH, 2010–2013
Place Stayed2012–2013 2010–2013
#Change % Change #Change % Change
Homeless 7,234 45.8 3,594 18.5
Housing 2,079 85.8 1,543 52.1
Institutional Settings 342 29.0 415 37.5
Other Settings -681 -45.0 59 7.6
201320122010
75.5 80.1 77.1
11.65.7 4.6 5.17.2 3.2 2.8
12.2 15.1
RESIDENTIAL PATTERNS VETERANS LIVING IN PSH
The U.S. Department of Housing and Urban DevelopmentOFFICE OF COMMUNITY PLANNING AND DEVELOPMENT