THAI AIRWAYS INTERNATIONAL PLCINTERNATIONAL...
39
THAI AIRWAYS THAI AIRWAYS INTERNATIONAL PLC INTERNATIONAL PLC INTERNATIONAL PLC. INTERNATIONAL PLC. For Boston, New York, London For Boston, New York, London J 25 J 25 30 2009 30 2009 Jun 25 Jun 25-30, 2009 30, 2009
-
Upload
nguyenthuy -
Category
Documents
-
view
225 -
download
2
Transcript of THAI AIRWAYS INTERNATIONAL PLCINTERNATIONAL...

THAI AIRWAYS THAI AIRWAYS INTERNATIONAL PLCINTERNATIONAL PLCINTERNATIONAL PLC.INTERNATIONAL PLC.
For Boston, New York, LondonFor Boston, New York, LondonJ 25J 25 30 200930 2009
0
Jun 25Jun 25--30, 200930, 2009

Table of Contents
1. The Company1. The Company 2
2. Financial Performance2. Financial Performance
3 Current Issues3 Current Issues
11
233. Current Issues3. Current Issues
4. Appendix4. Appendix
23
334. Appendix4. Appendix 33
1

1. The Company
2

The Company
OverviewOthers20.3%
NVDR4.5%
• Thailand’s National Flag Carrier
MOF 51.0%
Vayupak
Vayupak (KTAM)8 6%
• 51% directly 68% indirectly owned by the Royal
Thai Government
• 49 years of operations(MFC)8.6%
8.6%
Ministry of Finance
• 49 years of operations
51.0%• Registered Capital (THB): 17 000 mnVayupak (MFC)
Vayupak (KTAM)
NVDR
Government Saving Bank
M ll B k
8.6%
8.6%
4.5%
2.7%
1 5%
• Registered Capital (THB): 17,000 mn
• Par Value (THB) : 10
• Issued and paid-up (THB): 16,989 mn Mellon Bank
Citibank Nominees
Nortrust Nominees
Social Security Office
Oth
1.5%
1.0%
0.9%
0.9%
20 3%
• Market Capitalization (THB): 24,310 mn
(As of 9 Jun 2009)
3
Others 20.3%
The Company
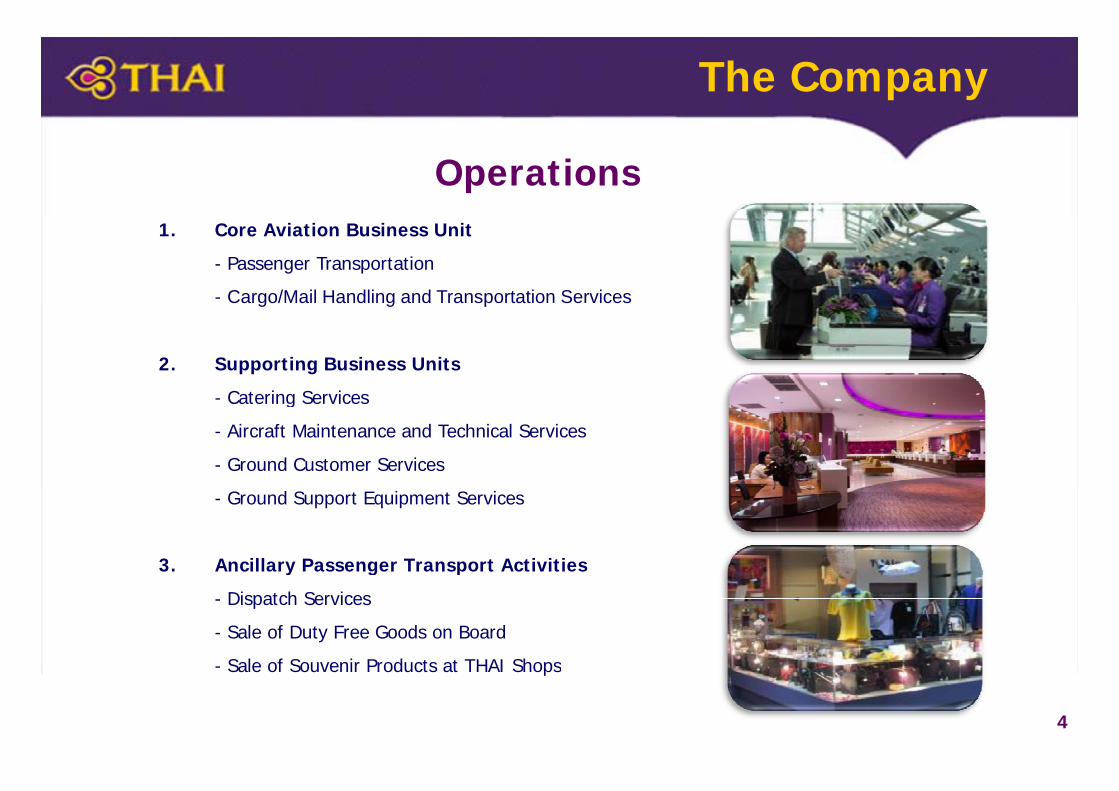
Operations1. Core Aviation Business Unit
- Passenger Transportation
- Cargo/Mail Handling and Transportation Servicesg g p
2. Supporting Business Units
Catering Services- Catering Services
- Aircraft Maintenance and Technical Services
- Ground Customer Services
- Ground Support Equipment Services
3. Ancillary Passenger Transport Activitiesg
- Dispatch Services
- Sale of Duty Free Goods on Board
Sale of Souvenir Products at THAI Shops
4
- Sale of Souvenir Products at THAI Shops
The Company
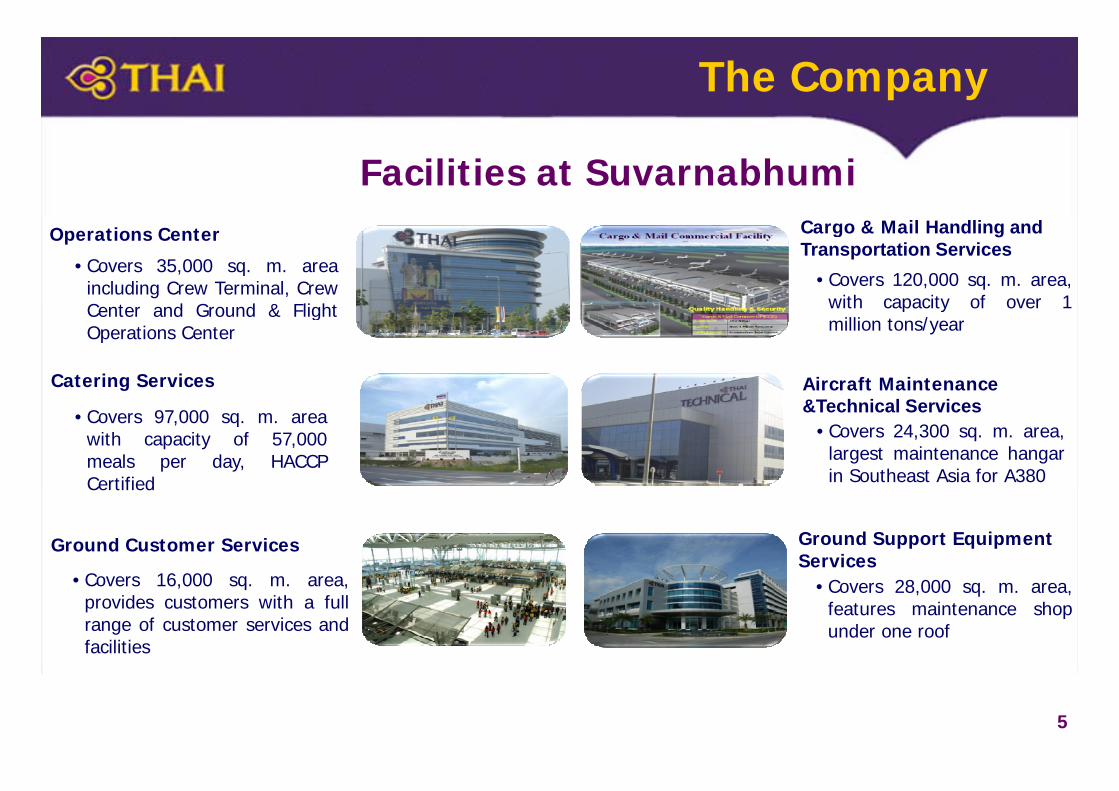
Facilities at SuvarnabhumiCargo & Mail Handling and Transportation Services
• Covers 120,000 sq. m. area, with capacity of over 1
Operations Center
• Covers 35,000 sq. m. area including Crew Terminal, Crew C t d G d & Fli ht
Aircraft Maintenance Catering Services
with capacity of over 1 million tons/year
Center and Ground & Flight Operations Center
&Technical Services• Covers 24,300 sq. m. area,
largest maintenance hangar in Southeast Asia for A380
• Covers 97,000 sq. m. area with capacity of 57,000 meals per day, HACCP Certified
Ground Customer Services
C 16 000
Certified
Ground Support Equipment Services
• Covers 16,000 sq. m. area, provides customers with a full range of customer services and facilities
• Covers 28,000 sq. m. area, features maintenance shop under one roof
5

The Company
Subsidiary & Associated Companies
%
Holding Assets Liab. EquityNet
Profit (Loss)
Business TypeName of Company
2008 Financial Highlights (MB)
(Loss)
55% Reservation Service 706 85 621 145
2. Donmuang International Airport Hotel Co.,Ltd. 40% Hotel 480 16 464 -18
39% Low Cost Flight Service 590 795 204 5023 Nok Air Co Ltd
1. Thai-Amadeus Southeast Asia Co.,Ltd.
39% Low Cost Flight Service 590 795 -204 -502
3. Suvarnabhumi Airport Hotel Co., Ltd. 30% Hotel & Services 2,400 1,757 643 -91
30% Catering Service 293 31 262 89
5 R l O hid H l (Th il d) Pl 24% H l 1 660 162 1 498 214
4. Phuket Air Catering Co.,Ltd.
3. Nok Air Co., Ltd.
5. Royal Orchid Hotel (Thailand) Plc. 24% Hotel 1,660 162 1,498 214
6. Bangkok Aviation Fuel Services Plc. 23% Fuel Service 7,061 4,070 2,991 438
6

The Company
International Destinations
Zurich
OsloCopenhagen
Madrid RomeMilan
Moscow
Paris MunichFrankfurt
London
Stockholm
BeijingMadrid
Athens
Los Angeles
B l
Bombay
Chittagong
VaranasiDhaka
DelhiGaya
Kathmandu
KolkataYangoon
Bangkok
Taipei
PusanSeoul
Manila
Kunming
Hong Kong
GuangzhouFukuoka
NagoyaChengdu
Xiamen
Shanghai
TokyoOsaka
Chennai
Islamabad
KuwaitJeddah
Dubai KarachiVientiane
Siem ReapHanoi
Phnom PenhMiddle East - 7 DestinationsBangalore Sri Lanka
Jakarta
PenangKuala Lumpur
Bali
Singapore
Ho Chi Minh CityNorth America - 1 Destinations
Australia - 5 Destinations
Europe - 13 Destinations
2009 International Destinations • Constitutes 92% of PAX revenue in 2008
Johannesburg*
Perth
AucklandSydney
Brisbane
Melbourne
Africa - 1 Destination*
Northern - 15 Destinations
Southern - 5 Destinations
7
• Serves 63 Destinations - 529 Flights/Week• Intercontinental market, especially in Europe, being major market
of THAI or ~55% of total passenger
Indochina - 5 Destinations
Western - 11 Destinations
Note: Johannesburg and Gaya-Varanasi will resume in winter 09/10

The Company
Domestic Destinations
Domestic® Made by Ake
Chiang Mai
Chiang RaiMae Hong Son
• Constitutes 8% of passenger revenue
• Service spans 12 destinations with 329
® Made by Ake® Made by Ake
PhitsanulokKhon Kaen
Udon Thani
p
flights/Week
• Suvarnabhumi as a single hub
® Made by Ake
® Made by Ake
Ubon Ratchathani
Bangkok
• Possible to have international connection flight at
Phuket & Chiang Mai Airports
• THAI launched double daily flights to Samui in
2008® Made by Ake
Phuket
SamuiSurat Thani
Krabi
8
Hat Yai

The Company
Fleet ProfileNumber of Aircraft
Aircraft Type Number of Aircraft Age (Year)
Number of Aircraft
Owned Financial Lease Operating Lease
Long range
B 747-400 18 11.9 13 5 -
B 777-300 6 8.4 - 6 -
A340-500 4 3.1 1 3 -
A340-600 6 2.8 - 6 -
B 777-200ER 6 1.8 - 6 -
Medium to long range
B 777-200 8 11.8 5 - 2
A330-300 12 12.0 10 - 2
A300-600 17 15.8 17 - -
Short range
B 737-400* 9 14.6 7 - 3
ATR 72 2 18.8 2 - -
T t l 88 11 2 55 26 7
9* NOTE : 3 B737-400 aircraft leased to Nok Air
Total 88 11.2 55 26 7
Aircraft utilization 11.67 hours per aircraftAircraft utilization 11.67 hours per aircraft

The Company
Fleet Information
11.2THAI
Airline’s Fleet Age
Aircraft 2009 2010 2011 TOTAL
THAI’s Tentative Aircraft In/Out Schedule
Phase-in
6.7
8.8
SQ
Airfrance
Aircraft 2009 2010 2011 TOTAL
A330-300 6 2 - 8
A380 - - 6 6
9.7
9.8
10.2
KLM
Southwest
Cathay
TOTAL 6 2 6 14
Phase-out
11.3
11.6
y
Lufthansa
SAS
Aircraft 2009 2010 2011 TOTAL
A300-600 3 1 1 5
TOTAL 3 1 1 511.6
13.1
14.7
British Airways
MAS
American
TOTAL 3 1 1 5
10
American

22. Financial Performance. Financial Performance
11

Financial Performance
Revenue Comparison Q1 ’09 over ’08
Units : THB mn
Revenue Comparison Q1 09 over 08
55,851
41,27045,640
50,000
60,000
•Total revenue decreased yoy by 34,665
30,000
40,000
y y y
26.11% (2009 over 2008)
• Passenger revenue decreased yoy
b ( )
10,000
20,000 by 24.05% (2009 over 2008)
-Q1'08 Q1'09
Total Revenue Passenger Revenue
12

Financial Performance
Revenue Breakdown Q1 ’09 over ’08
(Q1’08) (Q1’09)
Revenue Breakdown Q1 09 over 08
(Q ) (Q )
Interest income0.36% Other
1 44%
Other Activities
4 29% Mail
Interest income0 18% Other
Other Activities
0.40% 1.44%4.29% Mail0.50%
0.18% Ot e1.24%5.15%
cargo11 79%
cargo8.93%
Passenger81.72%
11.79%Passenger
83.99%
13

Financial Performance
Operating Revenue (Q1’08 & Q1’09)Units : THB mn
Change Q1’08-Q1’09
2252,394203
803
50 000
60,000
Passenger -24 05%
3,685
6,586
2072,127
73513
40,000
50,000 Passenger -24.05%
Freight -44.04%
M il 8 03%
45,640
3,685
20,000
30,000Mail -8.03%
Other activities -11.18%
34,665
10,000
20,000Interest income -63.71%
Other income -36.07%
0Q1'08 Q1'09
Total Income -26.10%
14Investor Relations Department
Passenger Freight Mail Other activities Interest income Other income

Financial Performance
Total Expense (Q1 ’09 over ’08)Total Expense (Q1 09 over 08)Units : THB mn
60 000
• Total expense decreased yoy by -37.94%
51,172
40 000
50,000
60,000
• Cost declined more rapidly from fuel cost
and measures implemented as part of the
31,756
20,000
30,000
40,000
turnaround strategy
-
10,000
,
Q1'08 Q1'09
15

Financial Performance
Operating Expense (Q1’08 & ’09)Units : THB mn
50 000
Change Q1’08-Q1’09
Personnel expense decreased -12.74%3,310
4,992
1,172
40,000
50,000
Fuel and oil decreased -44.10%
Flight service expense decreased -18.67%
5,155
2,393
1,320
1,771
1,7465,073
41530,000
g p
Inventories and supplies decreased -14.60%
Crew expense decreased -25 47%
19,563
10,935
4,1922,043
,3 0
10 000
20,000
Crew expense decreased -25.47%
Maintenance/overhual decreased -47.25%
D i ti / ti ti i d 1 63%
7,744 6,7570
10,000
Q1'08 Q1'09 Depreciation/amortisation increased -1.63%
Aircraft lease/spare parts decreased -45.98%
Q1 08 Q1 09
Personnel Fuel and Oil Flight Service ExpenseInventory&Supply Crew Expense Aircraft Maintenance
16Investor Relations Department
Total Expense decreased -37.94%Depreciation Lease of a/c

Financial Performance
EBIT, EBITDA and Net Profit (Q1 ’08 & ’09)
12,000Factors Contributing to Strong Q1 ’09 ResultsUnits : THB mn
9,512 9,334
7,8878,000
10,000• Control personnel expense – outsource
and OT
4,4394,342
2,2404,000
6,000 • Dramatic fuel price drop & low hedging
• Ability to maintain fuel surcharge above actual fuel cost
-
2,000
Q1'08 Q1'09
• Stronger net yield
• Reduction in operating expense
EBIT EBITDA Net Profit • Net FX gain on outstanding loans
17

Financial Performance
Net Debt/Equity Ratio (Q1 ’08 & ’09)
153160 6 0TimesUnits : THB bn •Net debt/equity below 3 times
132
153
120
140
160
4 0
5.0
6.0 / q y
despite additional debt for aircraft
financial lease.
70
542.860
80
100
2.0
3.0
4.0
•Ratio will increase slightly in 2009
financing 4 additional aircraft.
1.9
0
20
40
0.0
1.0
2.0
•Net debt/equity target is around
1:1 but may be in 12-18 months.0
Q1'08 Q1'090.0
Net Debt Equity Net D/E Ratio
18

Financial Performance
i b ’Operating Revenue & Expense by Currency – Q1 ’09
Operating Revenue Operating Expense
THB43.0%
USD25.0%
THB50.0%
USD37.0%
EUR25.0%JPY
7.0%
EUR9.0%JPY
4.0%
19
Financial Performance
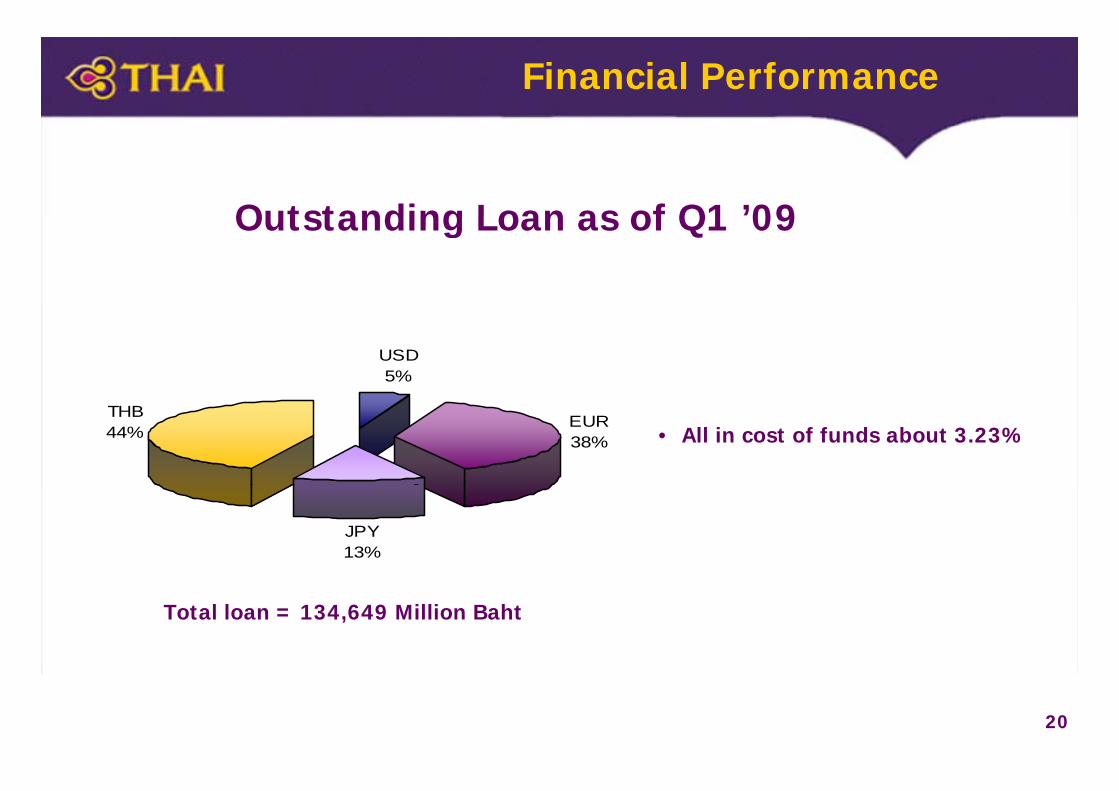
Outstanding Loan as of Q1 ’09Outstanding Loan as of Q1 09
USD5%
EUR38%
THB44% • All in cost of funds about 3.23%
JPY13%
Total loan = 134,649 Million Baht
20

Operating and Financial PerformanceTHAI’s Financial Performance(1999-08)
(99–08)(99–07)
CAGR (%)
MB
MRPK & Cabin Factor(‘000 MRPK) Cabin Factor (%)
125 000
150,000
175,000
200,000 Operating Revenue 7.1Operating Cost 9.7
7.58.6
50,000
75,000
100,000
125,000
EBITDA (average 10yrs.) ~25,000 MB.
Passenger Yield
-25,000
0
25,000
1999 00 01 02 03 04 05 06 07 08
(21,450)
13,397 EBITDA
Net Profit (Loss)
(6.4)
N/A
2.9
2.2
g
EBITDA (MB)
24,375 24,054 21,997 29,067 28,292 32,420 23,979 23,878 30,539 13,397
Net Profit (MB)
21
5,313 4,717 1,929 10,182 12,079 10,077 6,777 8,992 6,342 -21,450
Number of Aircraft
79 79 81 81 81 83 87 87 90 86 Incl. Fuel SurchargeExcl. Fuel Surcharge
Financial Performance
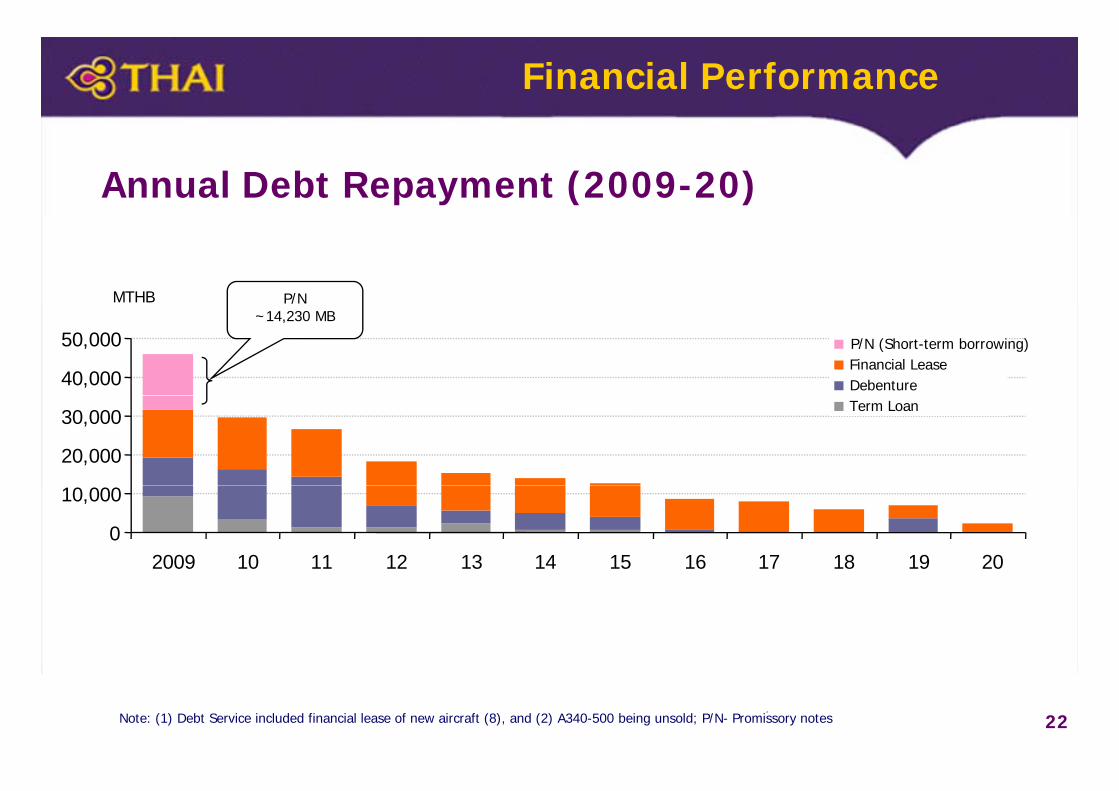
Annual Debt Repayment (2009-20)
MTHB P/N
40,000
50,000 P/N (Short-term borrowing)Financial LeaseDebenture
~14,230 MB
20,000
30,000Term Loan
0
10,000
2009 10 11 12 13 14 15 16 17 18 19 20
2220
Note: (1) Debt Service included financial lease of new aircraft (8), and (2) A340-500 being unsold; P/N- Promissory notes20

33. Current Issues. Current Issues
23

Current Issues
Board of Directors
Steering CommitteeBoard of Directors
Executive CommitteeExecutive Committee
Turnaround Plan Steering Committee
Turnaround Plan Office
g
Turnaround Plan Office
Network & Fleet Team
Revenue Enhancement
Team
Cost Reduction Team
Financial Planning Team
Communications Team
24

Current Issues
Steering Committee
• New Executive Committee Appointed
• Turnaround Plan Steering Committee Re appointed• Turnaround Plan Steering Committee Re-appointed
• Objective is to strengthen strategy department (Apr 2009)
• In time, the function of the Steering Committee will revert to the , g
strategy department
• Executive Management Committee to oversee planning• Executive Management Committee to oversee planning
• Executive Committee to oversee overall operations
25• All key decisions screened by Ex. Comm. for BoD approval

Current Issues
Turnaround PlanShort-term liquidity building plan
1. Strengthen quality of revenue
2 Reduce all unnecessary cost and defer non core investments2. Reduce all unnecessary cost and defer non-core investments
3. Re-build creditor and investor confidence
Revenue Cost Rebuild Confidence
• Strengthen yield • Reduction of non-fuel expense by • Domestic road show with investment• Strengthen yield
• Timely fuel surcharge management
• Distribution channel diversification
• Reduction of non fuel expense by THB 10 bn
• Head count rationalization
• Non-core investment deferment
• Domestic road show with investment community (X 2)
• Domestic road show with financial institutions (X 4)
• Product consistency improvement
• Network & route management
• Ancillary revenue enhancement
• Non core investment deferment
• Effective fuel & FX management
s u o s ( )
• International road show with investment community (X 1)
26

Current Issues
Non- Fuel Cash Cost Reduction Target (2009)
Non- Fuel Cash Cost Reduction Target (2009)
Cost Reduction
Commission 3%Airport Fee 2%
Marketing 2%Maintenance 2%
Materials 5%
Reservation Fee 5%
Personnel 42%Flight Operation
7%~10,000 MB
Navigation 7%
,
Others 12%
27
Ground & Technical Service 13%

Current Issues
Future Structure
Steering Committee
Board of Directors
Future Structure
Executive Committee
President/Executive Management Committee
Turnaround Plan Office/Strategy Department/Respective Functions
k l Revenue d l l
28
Network & Fleet Revenue Enhancement Cost Reduction Financial Planning Communications
Current Issues
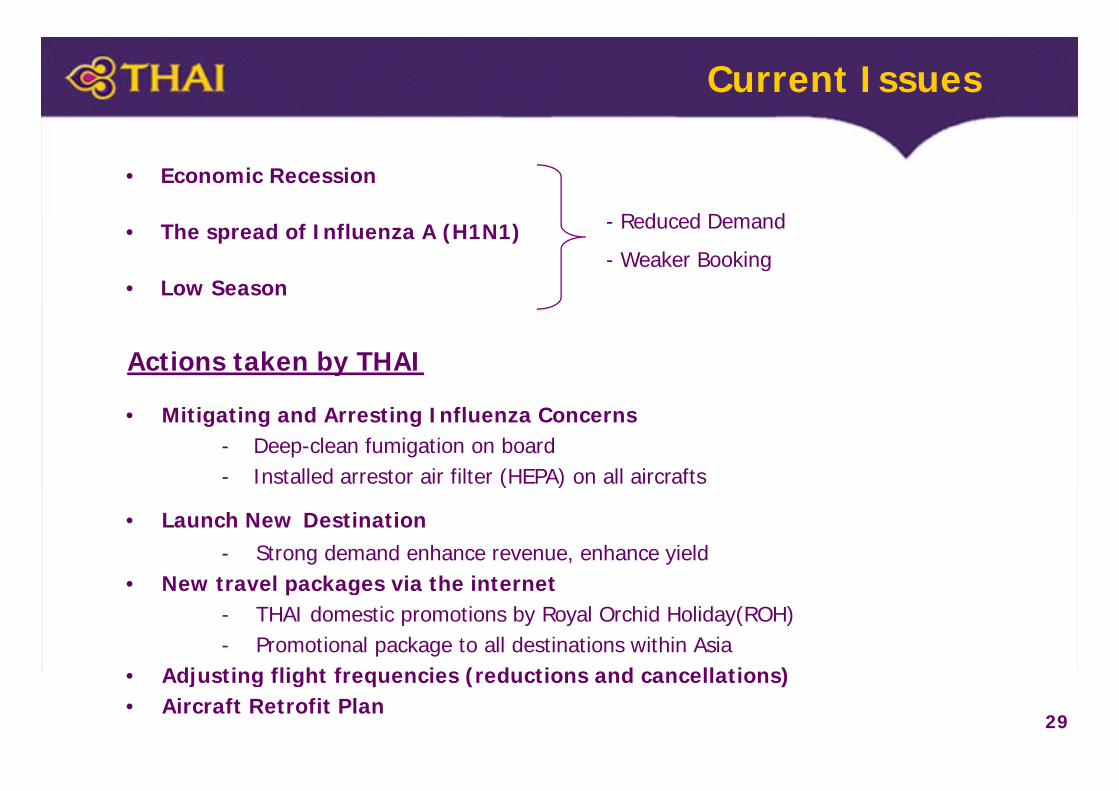
• Economic Recession
R d d D d• The spread of Influenza A (H1N1)
• Low Season
- Reduced Demand
- Weaker Booking
Actions taken by THAI
• Mitigating and Arresting Influenza Concerns- Deep-clean fumigation on board- Installed arrestor air filter (HEPA) on all aircrafts( )
• Launch New Destination- Strong demand enhance revenue, enhance yield
l k i h i• New travel packages via the internet- THAI domestic promotions by Royal Orchid Holiday(ROH)- Promotional package to all destinations within Asia
29
• Adjusting flight frequencies (reductions and cancellations)• Aircraft Retrofit Plan

Current Issues
Rising Fuel Cost
• Pushing fuel cost up and thus higher operating expense.
• Based on expected economic stabilization and hedging against• Based on expected economic stabilization and hedging against
weaker USD.
Actions taken by THAI
• Implementing appropriate ticket price to offset fuel costs.
• Seeking to increase hedging as necessary.g g g y
• Suspend & cancel flights.
30• Tighten cost control measures.
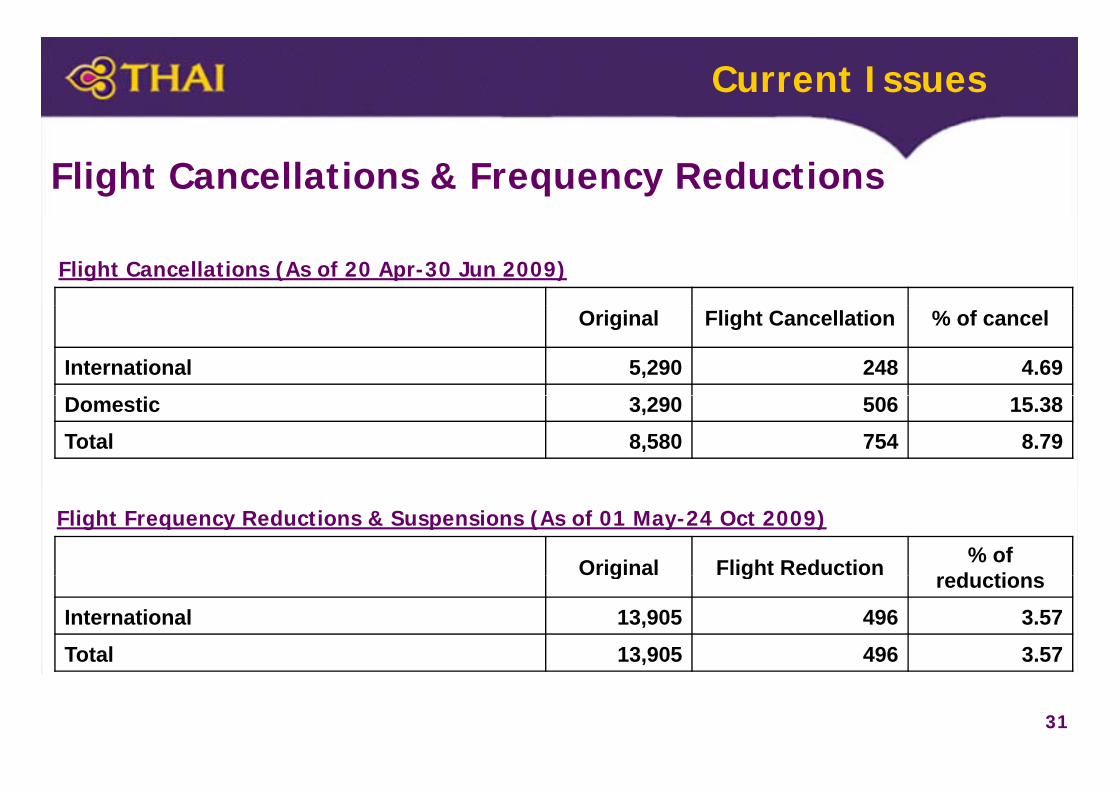
Current Issues
Flight Cancellations & Frequency Reductions
Flight Cancellations (As of 20 Apr-30 Jun 2009)
Original Flight Cancellation % of cancel
International 5,290 248 4.69
Domestic 3,290 506 15.38 Total 8,580 754 8.79
Original Flight Reduction % of d ti
Flight Frequency Reductions & Suspensions (As of 01 May-24 Oct 2009)
O g a g t educt o reductionsInternational 13,905 496 3.57
Total 13,905 496 3.57
31
,

Current Issues
Airbus A380.
• THAI has 6 on order.
• Due to be delivered begining 2011.
• Economic situation requiring review of fleet strategy.
Current Actions
• Appointed Committee to review A380 options.
• Findings to form part of 2nd phase plan in fleet structure• Findings to form part of 2 phase plan in fleet structure.
• If not preferred, Thai Goverment and THAI must negotiate with Airbus.
32

44. Appendix. Appendix
33
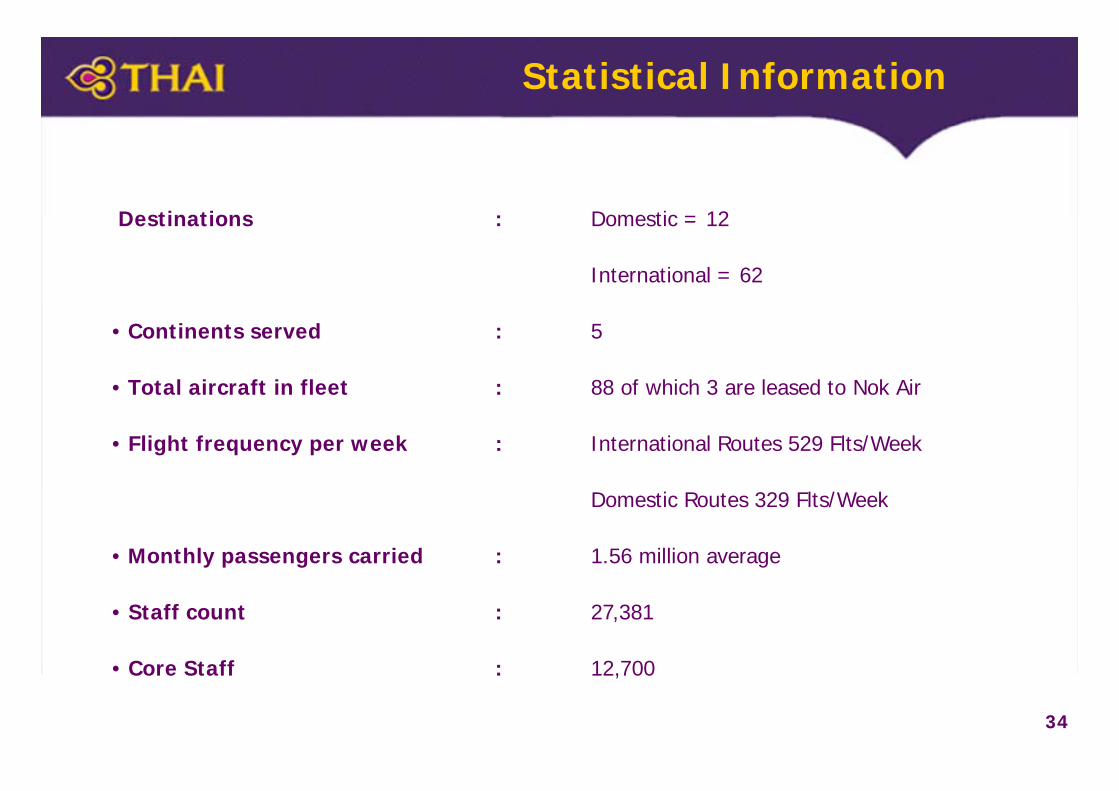
Statistical Information
Destinations : Domestic 12Destinations : Domestic = 12
International = 62
• Continents served : 5
• Total aircraft in fleet : 88 of which 3 are leased to Nok Air
• Flight frequency per week : International Routes 529 Flts/Week
Domestic Routes 329 Flts/Week
• Monthly passengers carried : 1.56 million average
• Staff count : 27,381
Core Staff : 12 700
34
• Core Staff : 12,700

Statistical Information
Q1’08 Q1’09 % Change
Passenger revenue earned (MTHB) : 45,640 34,665 24.0- Million Available Seat Kms. (MASK) : 20,165 17,161 14.9- Million Revenue Passenger Kms. (MRPK) : 16,447 13,107 20.3- Average Cabin factor (%) : 81.6 76.4 6.4- Average Freight load factor (%) : 54.50 44.90 17.6- A L d f t (%) 72 0 65 3 9 3
35
Average Load factor (%) : 72.0 65.3 9.3-

Statistical Information
17,706 19,122 20,16517 16116 44720,000
25,000
(Units : Million)
K , 17,16113,589 15,369 16,447
13,107
10,000
15,000
20,000
• ASK decreased yoy by - 14.9%
• RPK decreased yoy by - 20 3%SK &
RP
K
-
5,000• RPK decreased yoy by - 20.3%
AS
Q1'06 Q1'07 Q1'08 Q1'09
ASK RPK85
(Units : %)
80.481.6
79
81
83
85
acto
r
• Despite travel demand impacted by
global economic & domestic political76.7 76.4
73
75
77
79
Cab
in F
a global economic & domestic political
factors, cabin factor remained strong
compared to normal year
3671
73
Q1'06 Q1'07 Q1'08 Q1'09
C

Statistical Information
944
1,1211,092
93254.4
52.552.6
1,000
1,200
50
60%Million
F/F%
490573 610
423
44.8
200
400
600
800
10
20
30
40
• ADTK decreased yoy by 15.8%
• RFTK decreased yoy by 30 7%RFT
K &
F
0
200
Q1/06 Q1/07 Q1/08 Q1/090
10
MADTK MRFTK Freight factor
• RFTK decreased yoy by 30.7%
• F/F decreased yoy by 17.7%
MA
DTK
,M
MADTK MRFTK Freight factor
3 500 80%Million
M
2,5362,812
2,4882,936
1,7341,977 2,114
1,624
68 70
65
72
2,000
2,500
3,000
3,500
70
80
RTK • ATK decreased yoy by 15.2%
0
500
1,000
1,500
50
60
ATK
&
• RTK decreased yoy by 23.2%
• L/F decreased yoy by 9.4%
37
Q1/06 Q1/07 Q1/08 Q1/09
MATK MRTK Load factor

SAWASDEESAWASDEESAWASDEESAWASDEE3838
SAWASDEE SAWASDEE SAWASDEE SAWASDEE