THAI AIRWAYSTHAI AIRWAYS INTERNATIONAL PlINTERNATIONAL...
28
THAI AIRWAYS THAI AIRWAYS THAI AIRWAYS THAI AIRWAYS INTERNATIONAL Pl INTERNATIONAL Pl INTERNATIONAL Plc. INTERNATIONAL Plc. (Year 2008) (Year 2008) Investor Relations Department 1
-
Upload
truongtram -
Category
Documents
-
view
216 -
download
0
Transcript of THAI AIRWAYSTHAI AIRWAYS INTERNATIONAL PlINTERNATIONAL...

THAI AIRWAYSTHAI AIRWAYSTHAI AIRWAYS THAI AIRWAYS INTERNATIONAL PlINTERNATIONAL PlINTERNATIONAL Plc.INTERNATIONAL Plc.
(Year 2008)(Year 2008)
Investor Relations Department1

Table of ContentsTable of Contents
1. The Companyp y
2. Statistical Information
3. Tentative Aircraft Delivery
4. Financial Performance
5. Going Forward
Investor Relations Department2

1. The Company
Investor Relations Department3

The Companyp y
Shareholders
Ministry of FinanceOther Shareholders
Shareholders
y51.03 %
Chase Nominees
26.90 %
Limited 2.16 %2.16%
• Registered Capital : 17,000 mnVayupak Fund 1 (MFC)8 59 %
Vayupak Fund 1 (Krung Thai)
Government Saving Bank2.73 %
• Par Value (THB) : 10 • Issued and paid-up : 16,989 mn
8.59 %Thai)8.59 %
Investor Relations Department4
• Market Capitalization: 13,175 mn

The Company
THAI’s OperationsTHAI’s Operations
e Co p y
1. Aviation Business
- Passenger Transportation
THAI s OperationsTHAI s Operations
- Passenger Transportation
- Cargo and Mail Transportation
2. Business Units Related to Air Transport2. Business Units Related to Air Transport
- Ground Customer Services
- Ground Support Equipment Servicespp q p
- Cargo and Mail Commercial Services
- Technical Services
3. Transport Support Activities
- Dispatch Service
Investor Relations Department5
- Sale of Duty Free Goods on Board
- Sale of Souvenir Products at THAI Shops

The Company
THAI’s Facilities at SuvarnabhumiTHAI’s Facilities at Suvarnabhumi
p y
Aircraft MaintenanceAircraft Maintenance
THAI s Facilities at SuvarnabhumiTHAI s Facilities at Suvarnabhumi
• Covers 24,300 square meters is the largest maintenance hangar in Southeast Asia for A380
Ground Customer ServiceGround Customer Service• Covering 16,000 square meters provides customers with a full range of customer services and facilities to facilitate customer service.
CateringCatering• Quality and Food Safety Management System• Semi-Automation Equipment• Custom Free Zone• Quality of food and services
Investor Relations Department 6
• Quality of food and services• Hygiene of food & production• Safety of food

The Companyp y
THAI’s Facilities at SuvarnabhumiTHAI’s Facilities at SuvarnabhumiOperations Center
• Crew Terminal• Crew Center
THAI s Facilities at SuvarnabhumiTHAI s Facilities at Suvarnabhumi
Crew Center• Ground & Flight Operations Center• THAI city Headquarter• Landmark
Ground Support Equipment• Environment Revolution• Maintenance Shop Under One Roof• Maintenance Shop Under One Roof• New Modern Maintenance Equipment• Enhancement Superior Quality & safety
C & M ilCargo & Mail• Capacity Over 1 Million Tons/Year• Zoning Operation• Future Expansion
Investor Relations Department7
Future Expansion• Semi-Automation/modern Equipment• Cargo Custom Free Zone

The Company
Subsidiaries and Associated Companies
p y
Subsidiaries and Associated Companies
Shareholding Business TypeName of Company g yp
55.0% Reservation Servicep y
1. Thai-Amadeus Southeast Asia Company Limited2. Royal Orchid Hotel (Thailand) Public Company Limited 24.0% Hotel3. Donmuang International Airport Hotel Company Limited 40.0% Hotel4. Suvarnabhumi Airport Hotel Company Limited 30.0% Hotel & Services5 Bangkok Aviation Fuel Service Public Company Limited 22 6% Fuel Service5. Bangkok Aviation Fuel Service Public Company Limited 22.6% Fuel Service
30.0% Catering Service6. Phuket Air Catering Company Limited
Investor Relations Department8
39.0% Low Cost Flight Service7. Nok Air Company Limited

The Company
DomesticDomestic InternationalInternationalDestinationsDestinations
p y
DomesticDomestic InternationalInternational12 Destinations / 331 Flights / Week
• North (4 Destinations)62 Destinations / 553 Flights / week
Routes Countries Destinations( )
- Chiang Mai * - Phitsanulok
- Chiang Rai * - Mae Hong Son
Routes Countries DestinationsRegional 20 43 Northern 5 15g g
- Khon Kaen - Udon Thani
• Northeast (3 Destinations)
Southern 4 5 Indochina 3 4
W t 5 16- Ubon Ratchathani
• South (5 Destinations)
Western 5 16 Middle East 3 3Intercontinental 14 19
- Hat Yai* - Surat Thani
- Phuket * - Krabi
North Pacific 1 1 Europe 10 12
A t li & N Z l d 2 5
Investor Relations Department9
- Samui * Remark : International Airport
Australia & New Zealand 2 5 South Africa 1 1

The Company
A f DAircraft FleetAircraft FleetType of Aircraft Owned Operating Lease Total B 747 400 18 18
As of Dec. 2008Aircraft FleetAircraft Fleet
B 747-400 18 - 18 B 777-300 6 - 6 B 777-200 5 3 8 B 777-200ER 6 - 6 B 737-400 6 4 10
A 300 600 17 17 A 300-600 17 - 17 A 340-600 6 - 6 A 340-500 4 - 4 A 330-300 10 2 12 ATR72* 2 - 2
Investor Relations Department10
Total 80 9 89* NOTE : 3 B737-400 aircraft lease to Nok Air

The Company
Star Alliance (The Way the Earth Connects)
p y
( y )Founding Members Founding Members Member CarriersMember Carriers Regional CarriersRegional Carriers
- Air Canada - Air China - Air New Zealand - Adria Airways
- Lufthansa
- Scandinavian Airlines
- ANA - Asiana Airlines
- Austrian - Bmi
- Blue 1
- Croatia Airlines- Scandinavian Airlines
- Thai Airways
- Austrian Bmi
- Egypt Air - LOT Polish Airlines
- Croatia Airlines
- United Airlines - Shanghai Airlines - Singapore Airlines
- South African Airways - Spanair
- Swiss - TAP Portugal
- Turkish Airlines
Investor Relations Department11
- US Airways

22. Statistical Information. Statistical Information22. Statistical Information. Statistical Information
Investor Relations Department12

Statistical InformationStatistical InformationStatistical InformationStatistical Information
• Destinations : Domestic = 12
International = 62te at o a 6
• Continents served : 5
• Total aircraft in fleet : 89 of which 3 are leased to Nok Air
• Flight frequency per week : International Routes 553 Flts/Week
Domestic Routes 331 Flts/Week
• Monthly passengers carried : 1.56 million averageMonthly passengers carried : 1.56 million average
• Staff count : 27,193
Investor Relations Department13
• Core Staff : 12,708

Statistical InformationStatistical InformationStatistical InformationStatistical Information
2007 2008 % ChangePassenger revenue earned (MTHB) : 160,558 164,319 2.3 Milli A il bl S t K (MASK) 78 048 75 391 3 4 Million Available Seat Kms. (MASK) : 78,048 75,391 3.4- Million Revenue Passenger Kms. (MRPK) : 61,619 56,377 8.5- o eve ue sse ge s. ( ) : , ,Average Cabin factor (%) : 78.9 74.8 5.2- Average Freight load factor (%) : 54.60 55.20 1.1
Investor Relations Department14
Average Load factor (%) : 70.3 68.2 3.0-

Statistical InformationStatistical Information
70 383 72,22278,048 75,39180,000
ASK,RPK (Million)
Statistical InformationStatistical Information
70,383 ,
50,04055,512
61,620 56,375
40,00050,00060,00070,000
,
ASK d d b 3 40%
Years Years 2005 2005 -- 20082008
-10,00020,00030,000
,• ASK decreased yoy by - 3.40%
• RPK decreased yoy by - 8.51%2005 2006 2007 2008
ASK RPK
85Unit : (%)
71 1
76.86
74.78
78.95
75
80
85
Fact
or • 2008 affected by global economic & d ti liti l f t71.1
65
70
Cab
in F domestic political factors
• Still strong compared to normal year
Investor Relations Department15
602005 2006 2007 2008

33. Tentative Aircraft. Tentative Aircraft33. Tentative Aircraft . Tentative Aircraft DeliveryDeliverye ve ye ve y
Investor Relations Department16

Tentative Aircraft DeliveryTentative Aircraft Deliveryyy
Aircraft Delivery Schedule
2007 2008 2009 2010 2011 TOTAL
ADDITIONAL AIRCRAFT(According to delivery schedule) 2007 2008 2009 2010 2011 TOTAL
A380 - - - - 6 6
A340-600 - 1 - - - 1
A330-300 - - 6 2 - 8
TOTAL - 1 6 2 6 15
Investor Relations Department17
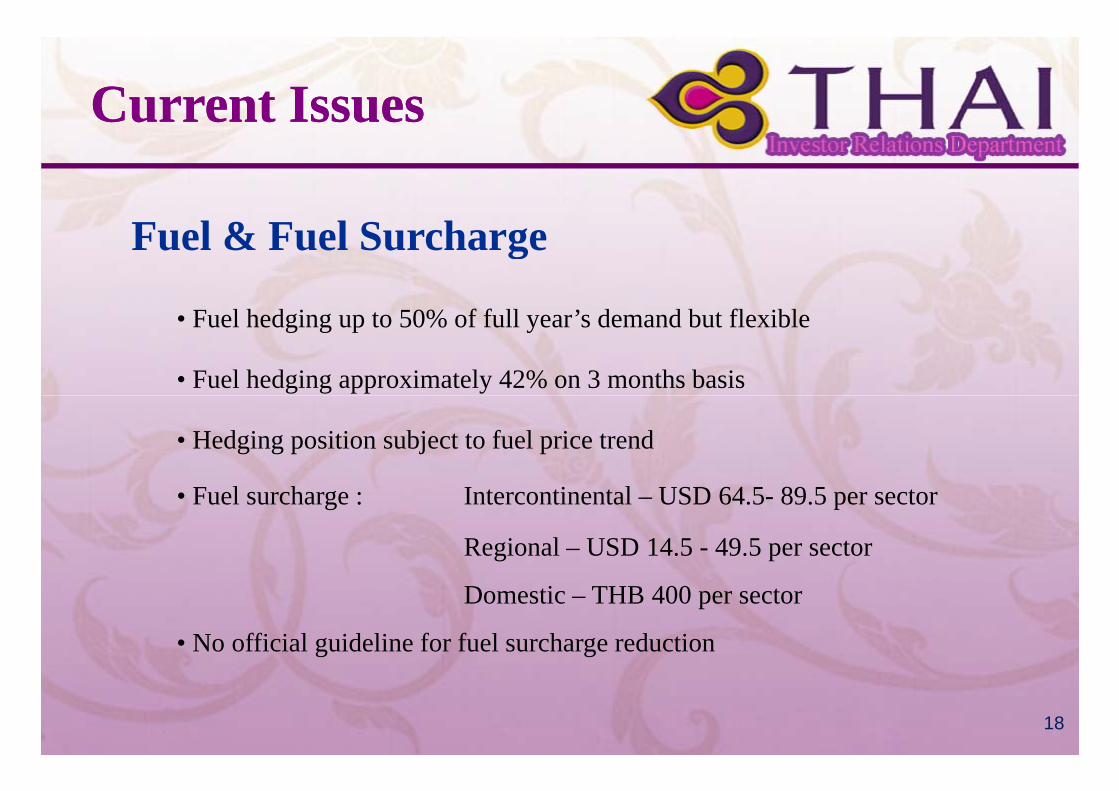
Current IssuesCurrent Issues
Fuel & Fuel Surcharge
• Fuel hedging up to 50% of full year’s demand but flexible
• Fuel hedging approximately 42% on 3 months basis
• Hedging position subject to fuel price trend
• Fuel surcharge : Intercontinental – USD 64.5- 89.5 per sector
Regional – USD 14.5 - 49.5 per sector
Domestic – THB 400 per sector
• No official guideline for fuel surcharge reduction
Investor Relations Department18

44. Financial Performance. Financial Performance44. Financial Performance. Financial Performance
Investor Relations Department19

Financial Performancea c a e o a ce
Revenue Breakdown (Year’07)
Revenue Breakdown (Year’08)
Other Activities
4.66%Other
Interest income0.37%Mail
0 49%
Other Activities4.46%
Other0.98%
Interest income0.24%
1.13%0.49% Mail
0.45%
Passenger80.31%
cargo13.03%
Passenger
cargo12.75%
Passenger81.10%
Investor Relations Department20

Financial Performance
Passenger Revenue (Years 2005 2008)
Financial Performance
Passenger Revenue (Years 2005-2008)Units : THB mn
167,626 186,278199,921
202,606200,000
250,000 • 7.79% CAGR for Total Revenue
• 6.52% CAGR for Passenger 131,203 146,154
160,558 164,319
100 000
150,000
g
Revenue
• Total revenue increased yoy by
50,000
100,0001.34% (2008 over 2007)
• Passenger revenue increased yoy -
2005 2006 2007 2008
Total Revenue Passenger Revenue
by 2.34%(2008 over 2007)
Investor Relations Department21

Financial Performance
Operating Expense (Years 2005 2008)
Financial Performance
Operating Expense (Years 2005-2008)
Units : THB mn
• Total expense increased yoy by 17%
• Personnel expense decreased yoy155,892168 638
188,656220,720
200 000
250,000
Personnel expense decreased yoy
by 7.57%
F l i d b 42 88%
168,638
100 000
150,000
200,000
• Fuel cost increased yoy by 42.88%
• Depreciation increased yoy by 11.77%
f d i i f d i i i d
50,000
100,000
from reducing aircraft depreciation period
to 15 years
-2005 2006 2007 2008
Total Expense
Investor Relations Department22

Financial Performance
EBIT, EBITDA and Net Profit
Financial Performance
40,000
EBIT, EBITDA and Net ProfitUnits : THB mn
22,90524,000
28,477
20 000
30,000
8,860 7,952 10,234 13,619
4,869
9,208 4,36810,000
20,000• Fuel cost the main culprit for disappointing performance
-6,662-10,000
-2005 2006 2007 2008
,
-21,379-30,000
-20,000
Investor Relations Department23
EBIT EBITDA Net Profit
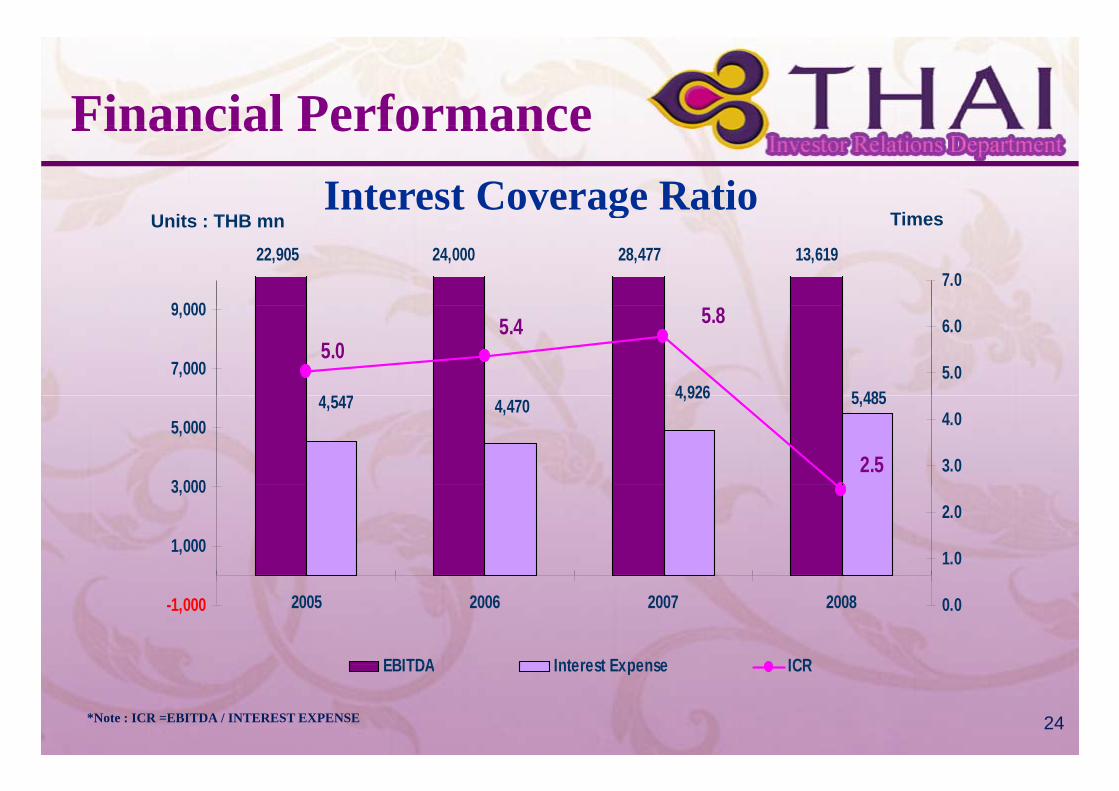
Financial PerformanceInterest Coverage Ratio
U it THB Times
Financial Performance
13,61928,47724,00022,905
9 0007.0
gUnits : THB mn Times
5 4854 9264 547
5.4 5.85.0
7,000
9,000
5.0
6.0
5,4854,9264,4704,547
2.53 000
5,000
3.0
4.0
1,000
3,000
1.0
2.0
-1,000 2005 2006 2007 2008 0.0
EBITDA Interest Expense ICR
Investor Relations Department24
EBITDA Interest Expense ICR
*Note : ICR =EBITDA / INTEREST EXPENSE

Financial Performance
Net Debt/Equity Ratio
a c a e o a ce
139147
6.0
Times
Net Debt/Equity RatioUnits : THB mn
136 136 139
120
140
5.0
6.0
6067 68
462 0
3.280
100
3.0
4.0
462.3 2.0
2.0
20
40
60
1.0
2.0
0
20
2005 2006 2007 20080.0
Investor Relations Department25
Net Debt Equity Net D/E Ratio

55. Going Forward. Going Forward55. Going Forward. Going Forward
Investor Relations Department26

Going Forward
R M i i i O i i i fli h fi bl
Going Forward
• Revenue Maximization - Optimizing flights to profitable routes
- Flexible pricing
- Proactive marketing
- Review less profitable routes
• Network Development - Reduce redundant capacity through synergy
• Ensure Ongoing Operation Excellence - Highest level of safety
- Unsurpassed service quality
- Timely service
Investor Relations Department27
• Enhance Asset Management and Undertake Restructuring
SAWASDEESAWASDEESAWASDEESAWASDEEInvestor Relations Department
28SAWASDEE SAWASDEE SAWASDEE SAWASDEE