TGD Part 4 - Europa
284
on Risk Assessment Part IV Directive 98/8/EC of the European Parliament and of the Council concerning the placing of biocidal products on the market Commission Regulation (EC) No 1488/94 on Risk Assessment for existing substances Commission Directive 93/67/EEC on Risk Assessment for new notified substances in support of TGD Part IV Institute for Health and Consumer Protection European Chemicals Bureau EUR 20418 EN/4 EUROPEAN COMMISSION JOINT RESEARCH CENTRE Technical Guidance Document
Transcript of TGD Part 4 - Europa

on Risk Assessment
Commission Regulation (EC) No 1488/94 on Risk Assessment for existing substances
Commission Directive 93/67/EEC on Risk Assessment for new notified substances
in support of
TGD
Part IV
Institute for Health and Consumer Protection
European Chemicals Bureau
Technical Guidance Document
Directive 98/8/EC of the European Parliament and of the Council concerning the placing of biocidal products on the market
V
Part IEUR 20418 EN/4
EUROPEAN COMMISSION JOINT RESEARCH CENTRE


European Commission
Technical Guidance Document on Risk Assessment
in support of
Commission Directive 93/67/EEC on Risk Assessment
for new notified substances
Commission Regulation (EC) No 1488/94 on Risk Assessment
for existing substances
Directive 98/8/EC of the European Parliament and of the Council
concerning the placing of biocidal products on the market
Part IV

LEGAL NOTICE
Neither the European Commission nor any person acting on behalf of the Commission is responsible for the use which might
be made of the following information
A great deal of additional information on the European Union is available on the Internet.
It can be accessed through the Europa Server (http://europa.eu.int).
© European Communities, 2003 Reproduction is authorised provided the source is acknowledged.
Printed in Italy

FOREWORD
I am pleased to present this Technical Guidance Document which is the result of in-depth co-operative work carried out by experts of the Member States, the Commission Services, Industry and public interest groups. This Technical Guidance Document (TGD) supports legislation on assessment of risks of chemical substances to human health and the environment. It is based on the Technical Guidance Document in support of the Commission Directive 93/67/EEC on risk assessment for new notified substances and the Commission Regulation (EC) No. 1488/94 on risk assessment for existing substances, published in 1996. This guidance was refined taking into account the experience gained when using it for risk assessments of about 100 existing substances and hundreds of new substances. Furthermore, it has been extended to address some of the needs of the Biocidal Products Directive (Directive 98/8/EC of the European Parliament and of the Council).
Concerning Chapter 2 on Risk assessment for human health, the Exposure assessment (Assessment of workplace exposure and Consumer exposure assessment) as well as the Effects assessment were improved and refined. However, for the following sections the revision process is not yet finalised and thus, the current TGD version uses the previous text: section 2.4 on Assessment of indirect exposure via the environment and section 4 on Risk characterisation. These sections are expected to be available by the end of 2003.
With respect to Chapter 3 on Environmental risk assessment, the Environmental exposure assessment and the Effects assessment underwent major improvements. A new chapter on Marine risk assessment was added.
Concerning Chapter 7, five out of eight available Emission scenario documents (ESDs) were revised (IC-3 Chemical industry: Chemicals used in synthesis, IC-7 Leather processing industry; IC-8 Metal extraction industry, refining and processing industry; IC-10 Photographic industry; IC-13 Textiles processing industry). Furthermore, a document on Rubber industry (IC-15) and a number of ESDs for the Biocidal Product Types or parts thereof were added. Some of the Emission scenario documents are still subject to on-going consultation in the OECD and thus, may need to be revised at a later stage. In addition, ESDs to cover all 23 Biocidal Product Types are under development. Consequently, it is anticipated that the set of Emission scenario documents will be continuously expanding in the future.
The White Paper outlining a future chemicals policy was adopted in February 2001 by the Commission. This TGD is therefore to be used in support of the current legislative instruments as described above until they are revoked and replaced by the future legislation implementing the White Paper.
I hope you will agree that this TGD makes a valuable contribution to the development and harmonisation of risk assessment methodologies not only within the Community but also worldwide in the context of the activities of the Organisation of Economic Co-operation and Development and the WHO/ILO International Programme on Chemical Safety.
Ispra, April 2003
Kees van Leeuwen Director Institute for Health and Consumer Protection
III

OVERVIEW
This Technical Guidance Document is presented in four separate, easily manageable parts.
PART I
Chapter 1 General Introduction
Chapter 2 Risk Assessment for Human Health
PART II
Chapter 3 Environmental Risk Assessment
PART III
Chapter 4 Use of (Quantitative) Structure Activity Relationships
((Q)SARs)
Chapter 5 Use Categories
Chapter 6 Risk Assessment Report Format
PART IV
Chapter 7 Emission Scenario Documents
V


Chapter 7
EMISSION SCENARIO DOCUMENTS


CONTENTS
IC-3 CHEMICAL INDUSTRY: CHEMICALS USED IN SYNTHESIS......................................................... 7
IC-5 PERSONAL/DOMESTIC AND IC-6 PUBLIC DOMAIN ....................................................................... 21
IC-7 LEATHER PROCESSING INDUSTRY.................................................................................................... 29 BPT 9 BIOCIDES USED AS PRESERVATIVES ............................................................................................. 29
IC-8 METAL EXTRACTION INDUSTRY, REFINING AND PROCESSING INDUSTRY........................ 57
IC-10 PHOTOGRAPHIC INDUSTRY ............................................................................................................... 83
IC-12 PULP, PAPER AND BOARD INDUSTRY ............................................................................................. 115
IC-13 TEXTILE PROCESSING INDUSTRY.................................................................................................... 131 BPT 9 BIOCIDES USED AS PRESERVATIVES IN THE TEXTILE WET PROCESSING ....................... 131
IC-14 PAINTS, LACQUERS AND VARNISHES INDUSTRY........................................................................ 161
IC-15 OTHERS: RUBBER INDUSTRY............................................................................................................. 177
BPT 6, 7 & 9 BIOCIDES USED AS PRESERVATIVES IN VARIOUS APPLICATIONS .......................... 203
BPT 22 EMBALMING AND TAXIDERMIST FLUIDS .................................................................................. 227
BPT 2 PRIVATE AND PUBLIC HEALTH AREA DISINFECTANTS AND OTHER BIOCIDAL PRODUCTS........................................................................................................................................................... 243
3


Preface
This document is a collection of the Emission Scenario Documents (ESDs) that are currently available for the different industrial categories (IC’s) and Biocidal Product-Types (BPTs). These ESDs have been developed by different Competent Authorities and by Industry. In most cases these documents are based on more in-depth studies of the environmental release of substances used in the different industrial categories and biocidal product-types. Some documents describe environmental releases from specific Use Categories (UCs) under an industrial category. ESDs are not available for all industrial categories and biocidal product-types; some documents are still under preparation. It is anticipated that this set of emission scenario documents will be expanded continuously in the future.
Industrial chemicals
For industrial chemicals nine ESDs have been developed so far:
IC-3 Chemical industry: Chemicals used in synthesis. Assessment of the environmental release of intermediates;
IC-5 Personal/Domestic and IC-6 Public domain: Assessment of the environmental release of soaps, fabric washing, dish cleaning and surface cleaning substances;
IC-7 Leather processing industry: Assessment of the environmental release of chemicals from the leather processing industry;
IC-8 Metal extraction industry, refining and processing industry: Assessment of environmental release of chemicals used in metal cutting and -forming fluids;
IC-10 Photographic industry: Assessment of the environmental release of photochemicals;
IC-12 Pulp, paper and board industry: Assessment of the environmental release of chemicals used in the pulp, paper and board industry;
IC-13 Textile processing industry: Assessment of environmental release of chemicals from the textile finishing industry;
IC- 14 Paints, lacquers and varnished industry: Assessment of environmental release of chemicals from the paints, lacquers and varnished industry;
IC-15 Others: Rubber industry. Assessment of environmental release of chemicals in the rubber industry.
It has been agreed that the OECD Exposure Assessment Task Force reviews the emission scenario documents for industrial chemicals. However, not all of the new or updated ESDs have gone through this process. They are already included in this version of the Technical Guidance Document (TGD) to make the information available for use in the EU risk assessments. If necessary they will be adapted in the future on the basis of the OECD review process. Further information can be found at the OECD's web site on environmental exposure (http://www1.oecd.org/ehs/ESD.htm).
The release information that is given in the ESDs should be used instead of the emission factors that are given in Appendix I of Chapter 3 of the TGD. If for a specific use no release information is given, or if the release is only given for one specific compartment, the complementary release estimates can be obtained from Appendix I of Chapter 3.
5
Biocides
For biocides five EU environmental emission scenarios are available so far:
BPT 2: Assessment of environmental release of private and public health area disinfectants and other biocidal products (sanitary and medical sector);
BPT 6, 7 & 9: Assessment of environmental release of biocides used in paper coating and finishing;
BPT 9: Assessment of environmental release of biocides used as preservatives in the leather industry;
BPT 9 & 18: Assessment of environmental release of biocides used as preservatives in the textile processing industry;
BPT 22: Assessment of environmental release of biocides used in taxidermist and embalming processes.
The environmental emission scenarios for the use of biocides in the leather and textile industry have been integrated with the corresponding scenarios for industrial chemicals.
More environmental emission scenarios are available for biocides. A schematic overview of scenarios for the 23 product types and a report containing existing scenarios and other information relevant for emission estimation (report “Development of emission scenario documents for 23 product groups of the EU biocidal products directive 98/8/EG”, 2000) can be found on the website of the European Chemicals Bureau (biocides section): http://ecb.jrc.it/biocides/ under “documents”.
ESDs for industrial chemicals may contain useful information for biocides and vice versa, but such use needs to be confirmed on a case- by- case basis until further guidance is available.
6
IC- 3 CHEMICAL INDUSTRY: CHEMICALS USED IN SYNTHESIS
ASSESSMENT OF THE ENVIRONMENTAL RELEASE OF INTERMEDIATES
7


IC-3 CHEMICAL INDUSTRY: CHEMICALS USED IN SYNTHESIS
CONTENTS
1 SCOPE ............................................................................................................................................................. 11
2 EMISSION FACTORS ................................................................................................................................... 11
2.1 EMISSION FACTORS FOR WASTEWATER................................................................................... 11
2.2 EMISSION FACTORS FOR AIR ......................................................................................................... 12
3 ELIMINATION............................................................................................................................................... 12
3.1 ELIMINATION THROUGH ON SITE TREATMENT ..................................................................... 12
3.2 ELIMINATION IN BIOLOGICAL WASTEWATER TREATMENT ............................................. 12
4 WASTEWATER TREATMENT PLANT FLOW ....................................................................................... 12
5 EVALUATION OF THE RIVER FLOW RECEIVING WASTEWATER FROM THE CHEMICAL INDUSTRY ...................................................................................................................................................... 12
5.1 FRANCE.................................................................................................................................................. 12 5.1.1 Description of the data................................................................................................................... 12 5.1.2 Use of a correction factor............................................................................................................... 13 5.1.3 Results ........................................................................................................................................... 13
5.1.3.1 Distribution of the river flow's 10th percentile ................................................................ 13 5.1.3.2 Sources of uncertainty ..................................................................................................... 14
5.2 GERMANY ............................................................................................................................................. 14 5.2.1 STP effluent flows ......................................................................................................................... 14 5.2.2 Mean flow of receiving water courses ........................................................................................... 14 5.2.3 Low flow of receiving water courses............................................................................................. 15 5.2.4 Dilution at medium flow ............................................................................................................... 15 5.2.5 Dilution at low flow 2 .................................................................................................................... 15 5.2.6 Dilution at medium flow / dilution at low flow ............................................................................. 15
5.3 CONCLUSION ....................................................................................................................................... 15
6 REFERENCES ................................................................................................................................................ 16
Annex 1 Release of intermediates to water before wastewater treatment .................................................... 17 Annex 2a Calculation of frequency of releases of intermediates during production...................................... 19 Annex 2b Calculation of frequencies of releases of intermediates during use ............................................... 20
9

IC-3 CHEMICAL INDUSTRY: CHEMICALS USED IN SYNTHESIS
1 SCOPE
This emission scenario document was derived from data of High Production Volume (HPV) Intermediates produced and processed in Germany. Up to now this document is limited to release into water and should be used only for HPV intermediates. Relevant factors for the release estimation are:
• the emission factor (release fraction) for processing of the intermediate, • local production volume per time unit, • the emission factor (release fraction) for production of the intermediate, • the elimination in on site treatment facilities, • the elimination in biological wastewater treatment facilities. From these data an emission to the receiving surface water (e.g. g.s-1) is estimated. The local concentration in rivers is calculated from that emission and the river flow (e.g. m3.s-1), taking into account adsorption processes in the surface water (see Chapter 3 of the TGD). This approach is based on a statistically evaluated database. Volumes of wastewater flows from the production or processing facility are not taken into account. Although for the time being the database is restricted to a set of 29 substances and to German conditions it can be regarded as a realistic worst-case situation since it combines two 90th percentiles (discharge.river flow).
2 EMISSION FACTORS
2.1 EMISSION FACTORS FOR WASTEWATER
There are different parameters influencing emissions during production and use of the intermediate. Physico-chemical properties, wet or dry process, type of reaction, batch or continuos production and on or on/off site handling are considered to play a key role. However, experience in plant operation shows that the only discriminating factor of the above-mentioned parameters is the differentiation between wet and dry processes. In this context wet processes are those where water is used either during reaction, work up or vessel cleaning. Dry processes are those where water is used in none of these stages. Generally, the production of very reactive, water sensitive compounds (e.g. acid chlorides, isocyanates, acid anhydrides) is performed without any water. The same holds for intermediates, which are made in gas phase reactions.
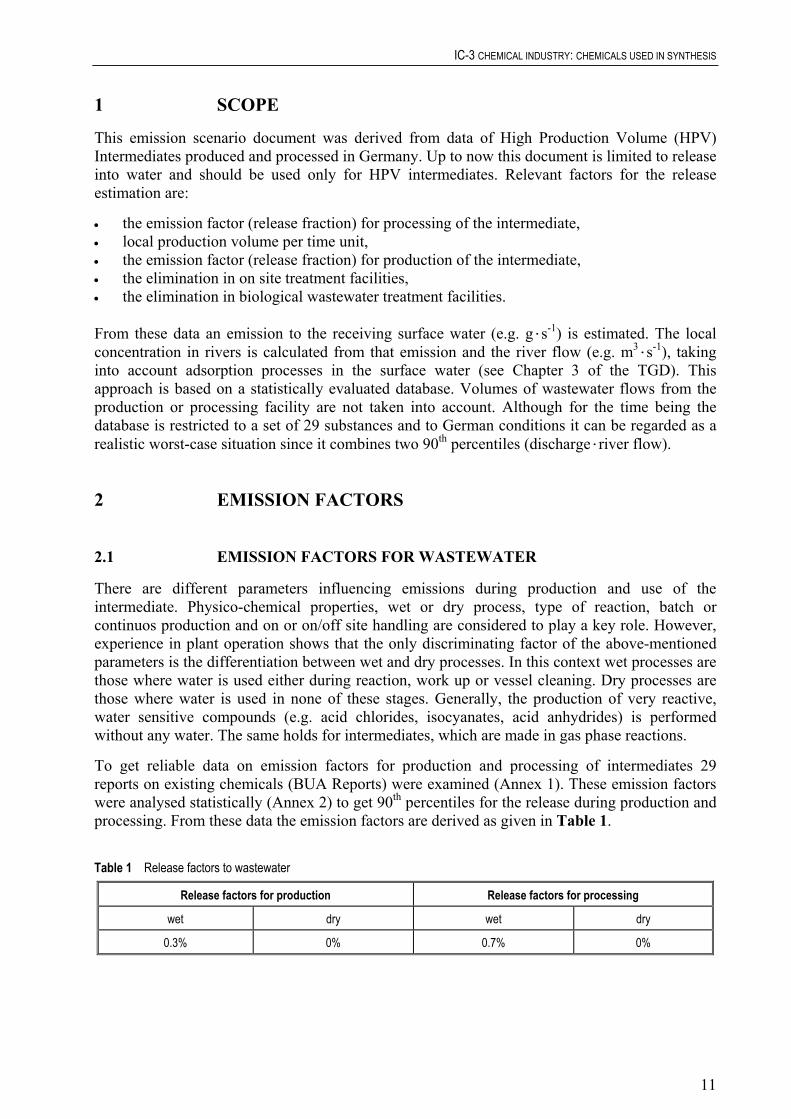
To get reliable data on emission factors for production and processing of intermediates 29 reports on existing chemicals (BUA Reports) were examined (Annex 1). These emission factors were analysed statistically (Annex 2) to get 90th percentiles for the release during production and processing. From these data the emission factors are derived as given in Table 1.
Table 1 Release factors to wastewater
Release factors for production Release factors for processing
wet dry wet dry
0.3% 0% 0.7% 0%
11

IC-3 CHEMICAL INDUSTRY: CHEMICALS USED IN SYNTHESIS
2.2 EMISSION FACTORS FOR AIR
(currently under preparation)
3 ELIMINATION
3.1 ELIMINATION THROUGH ON SITE TREATMENT
Treatment at the plant (e.g. activated carbon, precipitation and so on) is already included in the emission factors.
3.2 ELIMINATION IN BIOLOGICAL WASTEWATER TREATMENT
Estimation procedures are described in Chapter 2 of the TGD.
4 WASTEWATER TREATMENT PLANT FLOW
(currently under preparation)
5 EVALUATION OF THE RIVER FLOW RECEIVING WASTEWATER FROM THE CHEMICAL INDUSTRY
Chemical plants are usually located on large rivers, therefore the default dilution factor of 10 should be increased. For this purpose an evaluation of the river flow receiving wastewater from the chemical industry has been carried out in France (Magaud and Diderich, 2001) as well as in Germany (Umweltbundesamt, 1998).
5.1 FRANCE
5.1.1 Description of the data
690 production sites have been listed in France. All the sites where only formulation of preparations takes place have been removed when the information was available. Companies performing distillation and solvent extraction have been kept in the selection, as many of the operations are similar to those occurring during chemical synthesis. 47 chemical sites discharging their effluents into the sea were removed from the study, therefore 480 production sites were used in this study.
For each production site, an estimation of the flow draining the watershed on which the plant is situated was collected. This flow corresponds to an upper limit of the receiving surface water flow. To estimate this flow, gauging stations of the French river network were used.
12

IC-3 CHEMICAL INDUSTRY: CHEMICALS USED IN SYNTHESIS
5.1.2 Use of a correction factor
As the gauging station is more or less representative of the hydrological zone, a correction factor F, being the ratio of the surface drained by the hydrological zone (hydrological zone’s surface added to the surface of its upstream hydrological zones) the surface drained by the gauging station, is used.
gauging
upstreamhydro
SSSF +
=
Explanation of symbols
Shydro hydrological zone's surface Supstream upstream of the hydrological zone's surface Sgauging drained surface at the gauging station F gives an indication of the representativeness of the gauging station for the hydrological zone: if F is close to 1, the gauging
station might give a good representation of the draining flow of the hydrological zone, if it is far from 1, there is a big difference between the drained surfaces at the gauging station and at the outlet of the hydrological zone. The distribution of F is given in Table 2.
Table 2 Percentiles of the distribution of F
Percentiles 10th 20th 30th 40th 50th 60th 70th 80th 90th
F 0.65 0.97 1.00 1.02 1.06 1.12 1.4 3.1 19.8
For 52% of the stations, the surface drained by the hydrological zone lies within 20% of the surface drained by the associated gauging station.
For a mean flow, it can be assumed that the drained flow is proportional to the drained surface. This assumption is very approximate though as it depends of the spatial distribution of the tributaries. For a low water flow, this relationship is even more hazardous because it depends of the water table. Nevertheless, this linear relationship will be assumed and F will be used as a correction factor.
5.1.3 Results
5.1.3.1 Distribution of the river flow's 10th percentile
The 10th percentile of the river flow (Q10) has been calculated for each gauging station when it was possible (a minimum number of data is required for this evaluation. Table 3 gives the percentiles of the distribution of the data obtained being or not corrected with F.
Table 3 Percentiles of the distribution of the 10th percentile (Q10) of receiving rivers' flow. The “corrected” value is the Q10
multiplied by F
Percentiles 10th 20th 30th 40th 50th 60th 70th 80th 90th
Q10 (m3/s) 0.09 0.26 0.63 1.14 1.48 4.76 27.00 73.4 177.0
“Corrected” Q10 (m3/s) 0.22 0.52 0.91 1.50 4.45 11.76 40.0 96.8 188.2
13

IC-3 CHEMICAL INDUSTRY: CHEMICALS USED IN SYNTHESIS
5.1.3.2 Sources of uncertainty
Although this statistical evaluation is probably the best which can be done with the actual available data, there are three major sources of uncertainty in the result, which could not be quantified:
The river flow of the main river of the hydrological zone is taken instead of the receiving river flow. This will overestimate the dilution factor (and therefore underestimate the risk).
The association of a gauging station to a hydrological zone is also a source of uncertainty. F can give an idea of the magnitude of this uncertainty.
For each gauging station, the number of data available, and therefore the validity of the calculation of a mean or a 10th low percentile, is very variable.
This study should be exhaustive, that is it should have taken into account nearly all the chemical production sites in France, independently of their size.
5.2 GERMANY
By means of a questionnaire the German Chemical industry (VCI) compiled data both on WWTP effluent flows from sites which produce and/or process intermediates and on the flow rates of the corresponding water courses receiving these loads.
Out of around 700 sites those were selected for further consideration which directly discharge their wastewater to an industrial sewage treatment plant (STP). The resulting total number of 101 (West)1 German production/processing sites were corrected by those introducing their effluents either to the sea/estuaries or using jointly one common treatment plant. Sites discharging exclusively cooling water as well as “special cases” (e.g. Emscher-Flußkläranlage) were also excluded. 74 sites fulfilling the criteria were left in the end for further statistical evaluation.
5.2.1 STP effluent flows
• 90% of the STPs (by number) revealed an effluent flow rate of ≥ 570 m³/d (median: 4.663 m³/d);
• 90% of the wastewater volume is released to STPs of a capacity of ≥ 10,000 m³/d (≥ than 85% the organic load).
5.2.2 Mean flow of receiving water courses
• 90% of the STPs outlets (by number) go to water courses of a mean flow rate of ≥ 2,02 m³/s (median: 740 m³/s);
• 90% of the wastewater volume is discharged to water courses of a mean flow rate of ≥ 80 m³/s.
1 Around 95% of German Chemical Industry is located in the former Western Germany (based on turnover and
workforce). Hence the selected sites are regarded as representative for the whole of Germany.
14

IC-3 CHEMICAL INDUSTRY: CHEMICALS USED IN SYNTHESIS
5.2.3 Low flow of receiving water courses
• 90% of the STP (by number) outlets go to water courses of a low flow rate of ≥ 0,67 m³/s (median: 296 m³/s);
• 90% of the wastewater volume is discharged to water courses of a low flow rate of ≥ 47 m³/s, whilst 88% of the wastewater volume being discharged at a low flow rate of ≥ 70 m³/s.
5.2.4 Dilution at medium flow 2
• 90% of all STP outlets (by number) are diluted by a factor of >45 (median: 2,924); • 90% of the wastewater volume is diluted by a factor of >111, whilst 95% are diluted by a
factor of >40.
5.2.5 Dilution at low flow 2
• 90% of all STP outlets (by number) are diluted by a factor of >15 (median: 1,148); • 90% of the wastewater volume is diluted by a factor of > 40.
5.2.6 Dilution at medium flow / dilution at low flow
For 90% of the receiving water courses the ratio between medium flow and low flow situations is < 3.13 (median: 2.10). This result confirms the present practice (TGD) of using a factor of 3 for deriving a low flow from a median flow rate.
5.3 CONCLUSION
Based on the river flow data from France, a representative value can be chosen. The use of the 10th percentile of a river flow gives a realistic worst-case estimation of the dilution of an effluent. Therefore a default dilution parameter for chemical production sites could be the median of the 10th percentile of the river flows receiving chemical effluents, that is 4.45 m3/s. A rounded up value of 4.5 m3/s (388,800 m3/d) can be used. It must be noted that taking into account the correction factor F increases the dilution rate by a factor of nearly 3. The results obtained when the 163 “formulation” sites are taken into account do not modify the result of the study.
The evaluation from Germany regarding STP effluents can be used to complete the scenario. Based on the 90 percentiles of the STP effluents it is proposed to introduce a default value of 10,000 m³/d for this parameter along with a default dilution factor of 40 for the receiving water course.
Using the representative dilution factor of 40 based on the German data, a river flow of 400,000 m3/d is estimated, which is coherent with the results from the French study.
2 Instantaneous dilution assumed.
15

IC-3 CHEMICAL INDUSTRY: CHEMICALS USED IN SYNTHESIS
Finally, it can therefore be proposed that for substances being used in chemical industry, IC2 and IC3, the parameters of the default local aquatic exposure scenario can be altered as follows:
• Effluent discharge rate of STP EFFLUENTSTP = 10,000 m3/d. • Dilution at the point of complete mixing DILUTION = 40.
6 REFERENCES BUA Reports, Beratergremium Umweltrelevante Altstoffe, Verlag VCH and Verlag Hirzel.
Chem-facts (1992). Chem-facts Germany 1992 Edition, Chemical Intelligence Services, Reed Telepublishing Ltd., Dunstable, Beds., UK.
Daten zur Umwelt (1990/91). Umweltbundesamt (UBA), Erich Schmidt Verlag.
Magaud H and Diderich R (2001). Evaluation of the river flow receiving wastewater from the chemical industry. INERIS, Report n° INERIS-DRC-00-25417-ECOT-HMa-0290, Paris.
Umweltbundesamt (1998). Forschungsvorhaben Statistik wichtiger industrieller Branchen; Abwassereinleiterstatistik zur Bewertung der Umweltgefährlichkeit von Stoffen. Teilvorhaben 3: Chemische Zwischenprodukte, Umweltbundesamt (UBA), Berlin.
16

IC-3 CHEMICAL INDUSTRY: CHEMICALS USED IN SYNTHESIS
Annex 1 Release of intermediates to water before wastewater treatment To
tal r
eleas
e [%
]
0.002
8
-3
0.006
5
0.006
4
<0.01
2
<0.01
25
? 1.46
0.002
0.022
<0.03
1.4
1.4
0.051
0.037
0.013
1.0
0.032
Proc
ess
Type
wet
-3
wet
wet
wet
wet ? wet
wet
wet
wet
wet
wet
wet
wet
wet
no re
lease
wet
Relea
se vi
a use
[%
] 2
0.002
1
-3
0.002
5
0.000
4
<0.01
0.005
? 1.4
<0.00
1
0.02
<0.01
0.7
1.1
0.05
0.017
0.003
<0.00
1
0.02
Proc
ess t
ype
wet
dry
wet
wet
wet
wet
wet
wet
wet
wet
wet
wet
wet
wet
wet
wet
wet
wet
Relea
se vi
a syn
thes
is [%
] 2
0.000
7
0.0
0.004
0.006
0.002
0.007
5
0.3
0.06
0.002
0.002
<0.02
0.7
0.3
0.001
0.02
0.01
1.0
0.012
Prod
uctio
n ye
ar1
1979
1990
1985
? 1989
1988
1987
1987
/88
1989
1989
1988
/89
1989
1987
1988
1990
1990
1987
1987
Prod
uctio
n vo
lum
e [t·y
-1]
1500
,000
52,70
0
20,00
0
5,000
500
1,500
6,000
1,200
4,500
200
1,000
1,800
5,000
45,00
0
2,400
1,500
4,000
2,500
Subs
tanc
e
Ethe
ne, c
hloro
-
Carb
on di
sulfid
e
Ethe
n, 1,1
-dich
loro-
1,3-C
yclop
entad
iene,
1,2,3,
4,5,5-
he
xach
loro-
Benz
enea
mine
, 3-ch
loro-
2-me
thyl-
Benz
enea
mine
, 2-ch
loro-
4-nit
ro-
Benz
enea
mine
, 2-n
itro-
Benz
enea
mine
, N,N
-diet
hyl-
Benz
enea
mine
, 3-ch
loro-
4-me
thyl
Benz
enea
mine
, 5-ch
loro-
2-me
thyl
Benz
enea
mine
, 3-tr
ifluor
ometh
yl-
Benz
enea
mine
, N-e
thyl-
Benz
enea
mine
, 3-ch
loro-
2-ch
loro-
Benz
ene,
1-me
thyl-2
-nitro
-
Benz
ene,
1,4-d
ichlor
o-2n
itro-
Benz
ene,
1,3-d
ichlor
o-4-
nitro
Benz
ene,
1-me
thoxy
-2-n
itro-
Benz
idine
, 3,3‘
-dich
loro-
17

C-3 CHEMICAL INDUSTRY: CHEMICALS USED IN SYNTHESIS
Tota
l rele
ase
[% ]
0.3
0.34
0.043
0.11
0.11
0.05
0.021
0.12
---
0.0
<0.11
<0.21
0.009
Proc
ess
Type
wet
wet
wet
wet
wet
wet
wet
wet ? dr
y
wet
wet
polym
eris.
Relea
se vi
a use
[%
] 2
0.3
0.04
0.042
0.11
0.1
<0.00
5
0.003
0.1
? 0.0
<0.1 0.2
0.0
Proc
ess t
ype
wet
wet
wet
wet
wet
wet
wet
wet
wet
dry
wet
wet
wet
Relea
se vi
a syn
thes
is [%
] 2
0.002
0.3
0.001
0.001
0.005
0.048
0.018
0.024
<0.02
4
0.0
<0.01
<0.00
1
0.009
Prod
uctio
n ye
ar1
1989
1988
/89
1989
1988
1988
1988
/89
1988
/89
1988
/89
1987
1990
1986
1987
1991
Prod
uctio
n vo
lum
e [t·y
-1]
12,00
0
4,500
200,0
00
2,500
25,00
0
14,00
0
2,000
500
600
170,0
00
500
500
230,0
00
Subs
tanc
e
Benz
ene,
1,2-d
ichlor
o-
Benz
ene,
1-ch
loro-
2,4-d
initro
(and
othe
r iso
mers)
Benz
ene,
nitro
-
Benz
ene,
1-me
thyl-3
-nitro
-
Benz
ene,
1-me
thyl-4
-nitro
Benz
ene,
1-2-
dichlo
ro-4
-nitro
-
Phen
ol, 4-
nitro
-
Phen
ol, 2-
nitro
-
1-Bu
tanam
ine, N
,N-d
ibutyl
Aceti
c anh
ydrite
1,1-B
iphen
yl-4,4
‘-diam
ine-3
,3‘- d
imeth
oxy-
1,1-B
iphen
yl-4,4
‘-diam
ine-3
,3‘- d
imeth
yl-
Adipi
c acid
1 in
Germ
any
2 as
% of
prod
uctio
n volu
me
3 sp
ecial
use i
n visc
ose p
rodu
ction
18

IC-3 CHEMICAL INDUSTRY: CHEMICALS USED IN SYNTHESIS
Annex 2a Calculation of frequency of releases of intermediates during production
Data from all 29 intermediates listed in Annex 1 which are produced in a wet process are used in the calculation. The 90 percentile is <0.3%.
Count Cumulative count % Cumulative % relsyn
1 1 3.4 3.4 0.0007
3 4 10.3 13.8 0.001
4 8 13.8 27.6 0.002
1 9 3.4 31.0 0.004
1 10 3.4 34.5 0.005
1 11 3.4 37.9 0.006
1 12 3.4 41.4 0.008
1 13 3.4 44.8 0.009
3 16 10.3 55.2 0.010
1 17 3.4 58.6 0.012
1 18 3.4 62.1 0.018
2 20 6.9 69.0 0.020
2 22 6.9 75.9 0.024
1 23 3.4 79.3 0.048
1 24 3.4 82.8 0.060
3 27 10.3 93.1 0.300
1 28 3.4 96.6 0.700
1 29 3.4 100.0 1.000
19

C-3 CHEMICAL INDUSTRY: CHEMICALS USED IN SYNTHESIS
Annex 2b Calculation of frequencies of releases of intermediates during use
Data from 27 intermediates listed in Annex 1 which are used in a wet process and where data for use were available are used in the calculation. The 90 percentile is <0.7%.
Count Cumulative count % Cumulative % Reluse
1 1 3.7 3.4 0.0000
1 2 3.7 7.4 0.0004
2 4 7.4 14.8 0.001
1 5 3.7 18.5 0.002
1 6 3.7 22.2 0.003
2 8 7.4 29.6 0.003
2 10 7.4 37.0 0.005
2 12 7.4 44.4 0.010
1 13 3.7 48.1 0.017
2 15 7.4 55.6 0.020
1 16 3.7 59.3 0.040
1 17 3.7 63.0 0.042
1 18 3.7 66.7 0.050
3 21 11.1 77.8 0.100
1 22 3.7 81.5 0.110
1 23 3.7 85.2 0.200
1 24 3.7 88.9 0.300
1 25 3.7 92.6 0.700
1 26 3.7 96.3 1.100
1 27 3.7 100.0 1.400
20
IC-5 PERSONAL/DOMESTIC AND IC-6 PUBLIC DOMAIN
ASSESSMENT OF THE ENVIRONMENTAL RELEASE OF SOAPS, FABRIC WASHING, DISH CLEANING AND
SURFACE CLEANING SUBSTANCES
21


IC-5 PERSONAL/DOMESTIC AND IC-6 PUBLIC DOMAIN
CONTENTS
1 INTRODUCTION ........................................................................................................................................... 25
2 EXPOSURE SCENARIO ............................................................................................................................... 25
2.1 RELEASE DURING PRODUCTION AND FORMULATION ......................................................... 25
2.2 POST-CONSUMER RELEASE ............................................................................................................ 26
3 EXAMPLE ....................................................................................................................................................... 26
4 REFERENCES ................................................................................................................................................ 28
23

IC-5 PERSONAL/DOMESTIC AND IC-6 PUBLIC DOMAIN
1 INTRODUCTION
The Industrial Category is developed in the Context of Directive 79/831/EEC. Soaps, fabric washing, dish cleaning and surface cleaning products are classified according, to Chapter 5 of the TGD as:
Industrial Category
• Annex I, Category 5 (personal/domestic) and/or • Annex I, Category 6 (public domain).
Use Category
• Annex II, Category 9 (cleaning/washing agents) and/or • Annex II, Category 15 (cosmetics). The emission factors given in the Tables 1 and 2 of this document have been generated for high production volume chemicals (>1,000 t.y-1) and should be applied as default values.
2 EXPOSURE SCENARIO
2.1 RELEASE DURING PRODUCTION AND FORMULATION
The release estimation of chemicals is based on the EEC/OECD classification:
• Main category (EEC/OECD) = Wide Dispersive Use • Fraction of detergent ingredient released to environment = 1.0 The emission algorithm assumes therefore that in comparison to the losses at production, compounding and processing, the majority (>98%) of the release occurs at the use phase. However, for major production volumes, the losses at production and formulation may need to be quantified for risk assessment purposes (Table 1 and Table 2).
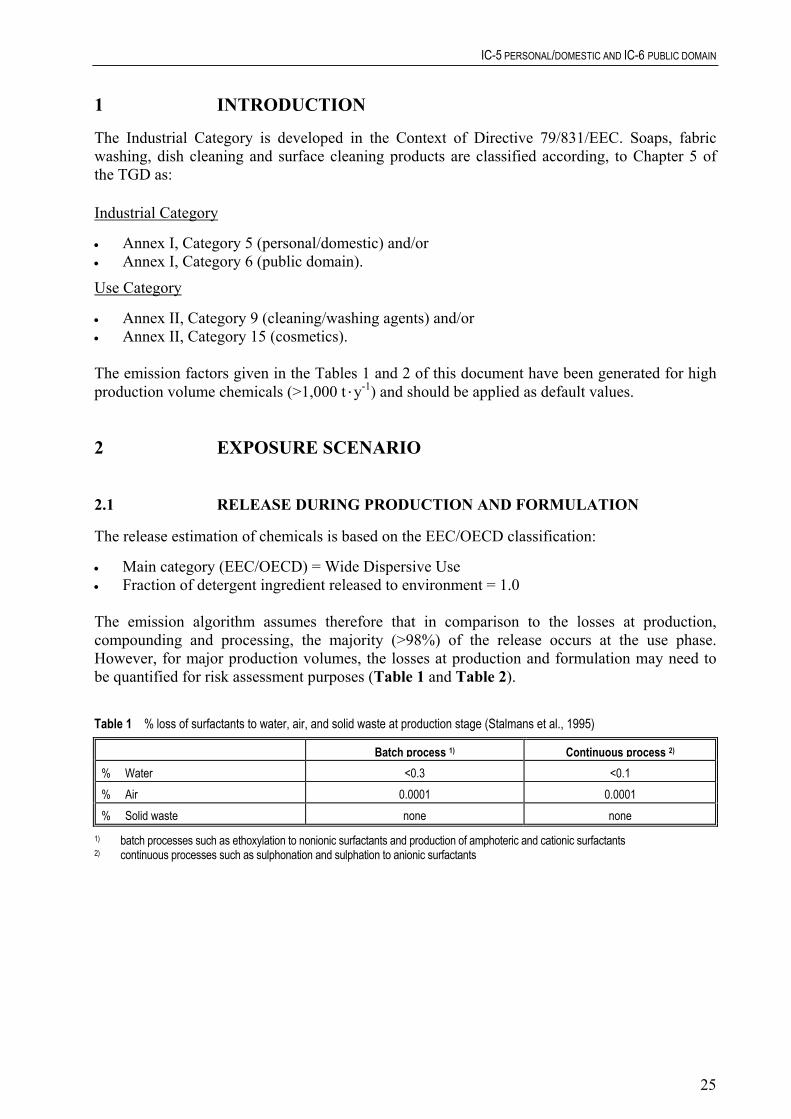
Table 1 % loss of surfactants to water, air, and solid waste at production stage (Stalmans et al., 1995)
Batch process 1) Continuous process 2) % Water <0.3 <0.1 % Air 0.0001 0.0001 % Solid waste none none
1) batch processes such as ethoxylation to nonionic surfactants and production of amphoteric and cationic surfactants 2) continuous processes such as sulphonation and sulphation to anionic surfactants
25

IC-5 PERSONAL/DOMESTIC AND IC-6 PUBLIC DOMAIN
Table 2 % loss to water, air, and solid waste at the formulation stage for regular and compact washing powders and washing liquids (Franke et al., 1995)*
Regular powder Compact powder Liquid
% Water 0.01 0.01 0.09
% Air 0.02 0.02 0.002
% Solid waste 0.73 0.81 0.32
* Based on Oko-Institute, Freiburg in cooperation with Umweltbundesamt
Tables 1 and 2 illustrate that indeed the losses at formulation are minimal, and mainly in the form of solid chemical waste. However, it should be noted that these figures have been generated on current production and formulation of high production volume chemicals (HPVC) and that the default values of Tables 1 and 2 may not necessarily apply for new chemicals.
2.2 POST-CONSUMER RELEASE
Most of the losses occur at the use phase, and a simple algorithm can be used to predict the emission to the sewer by assuming 100% emission to water (Table 3).
Table 3 % loss to water, air, and solid waste at the post-consumer stage for use of soaps, fabric washing, dish cleaning and
surface cleaning
Soaps, fabric washing, dish cleaning and surface cleaning
% Water 100
% Air 0
% Solid waste 0
A simple algorithm can be used to predict the mass flow to raw sewage. This prediction is based respectively on specific consumption data of product (Table 4) or specific consumption data of chemical for a known market or population area.
3 EXAMPLE
The emission to raw sewage can be calculated starting from actual tonnage figures, and related population served:
26
IC-5 PERSONAL/DOMESTIC AND IC-6 PUBLIC DOMAIN
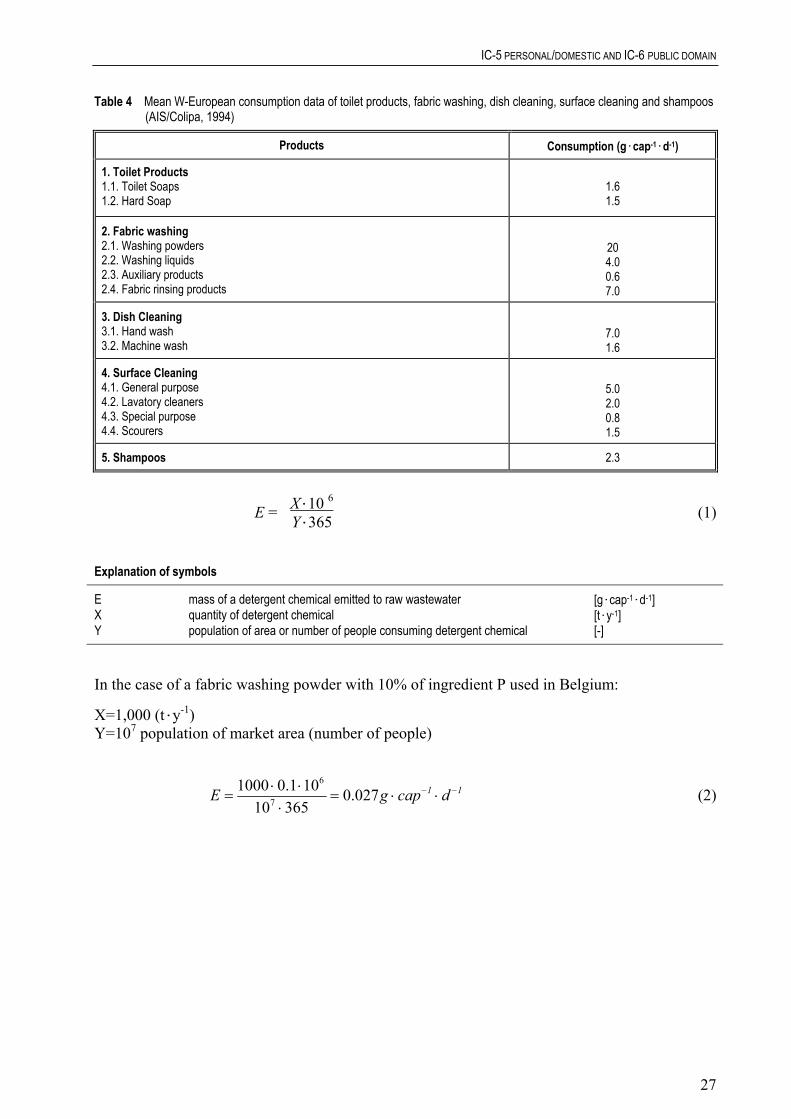
Table 4 Mean W-European consumption data of toilet products, fabric washing, dish cleaning, surface cleaning and shampoos (AIS/Colipa, 1994)
Products Consumption (g.cap-1.d-1)
1. Toilet Products 1.1. Toilet Soaps 1.2. Hard Soap
1.6 1.5
2. Fabric washing 2.1. Washing powders 2.2. Washing liquids 2.3. Auxiliary products 2.4. Fabric rinsing products
20 4.0 0.6 7.0
3. Dish Cleaning 3.1. Hand wash 3.2. Machine wash
7.0 1.6
4. Surface Cleaning 4.1. General purpose 4.2. Lavatory cleaners 4.3. Special purpose 4.4. Scourers
5.0 2.0 0.8 1.5
5. Shampoos 2.3
E = (1) X.10 6 Y.365
Explanation of symbols
E mass of a detergent chemical emitted to raw wastewater [g.cap-1.d-1] X quantity of detergent chemical [t.y-1] Y population of area or number of people consuming detergent chemical [-]
In the case of a fabric washing powder with 10% of ingredient P used in Belgium:
X=1,000 (t.y-1) Y=107 population of market area (number of people)
11 dcapgE −− ⋅⋅=⋅
⋅⋅= 027.0
36510101.01000
7
6
(2)
27
IC-5 PERSONAL/DOMESTIC AND IC-6 PUBLIC DOMAIN
4 REFERENCES AIS (1994). Unpublished data. Association Internationale de la Savonnerie et de la Détergence, Brussels, in combination with unpublished data of COLIPA, Brussels.
Franke M, Kluppel H, Kirchert K and Olschewki J (1995). Sachbilanz fur die Washmittel-Konfektionierung. Tenside Surf. Det. (December issue - in press).
Stalmans M, Berenbold H, Berna JL, Cavalli L, Dillarstone A, Franke M, Hirsinger F, Janzen D, Kosswig K, Postlewaite D, Rappert T, Renta C, Sharer D, Schick KP, Schul W, Thomas H and van Sloten R (1995). European life-cycle inventory for detergent surfactant production. Tenside Surf. Det. 32, 84-109.
28

IC-7 LEATHER PROCESSING INDUSTRY
BPT 9 BIOCIDES USED AS PRESERVATIVES
ASSESSMENT OF THE ENVIRONMENTAL RELEASE OF CHEMICALS FROM THE LEATHER PROCESSING INDUSTRY
29

IC-7 LEATHER PROCESSING INDUSTRY
CONTENTS
1 INTRODUCTION ........................................................................................................................................... 33
2 MAIN PROCESSES........................................................................................................................................ 36
2.1 CURING .................................................................................................................................................. 38
2.2 BEAMHOUSE......................................................................................................................................... 39
2.3 TANYARD OPERATIONS ................................................................................................................... 39
2.4 POST-TANNING OR FINISHING OPERATIONS............................................................................ 40
3 CHEMICALS .................................................................................................................................................. 41
4 BIOCIDES ....................................................................................................................................................... 42
5 RELEASE ESTIMATION ............................................................................................................................. 44
5.1 RELEASES DURING CURING ........................................................................................................... 44
5.2 RELEASES DURING FINISHING ...................................................................................................... 44
5.3 RELEASES DURING OTHER TANNING STEPS ............................................................................ 44
5.4 RELEASES DURING OTHER LIFE CYCLE STAGES ................................................................... 45
5.5 WATER CONSUMPTION .................................................................................................................... 45
5.6 WASTEWATER TREATMENT .......................................................................................................... 46
5.7 SOLID WASTE FROM LEATHER PROCESSING .......................................................................... 47
5.8 SOLID WASTE FROM USED LEATHER PRODUCTS................................................................... 49
6 BRANCH SPECIFIC PARAMETERS ......................................................................................................... 49
6.1 DEFINITION OF A GENERIC POINT SOURCE ............................................................................. 49
6.2 NUMBER OF WORKING DAYS ......................................................................................................... 50
6.3 LEATHER DYEING .............................................................................................................................. 50
7 EMISSION CALCULATION: INDUSTRIAL CHEMICALS ................................................................... 51
7.1 LEATHER PROCESSING: DYES ....................................................................................................... 51
7.2 LEATHER PROCESSING: CHEMICALS OTHER THAN DYES .................................................. 52
7.3 SERVICE LIFE OF LEATHER PRODUCTS..................................................................................... 52
7.4 DISPOSAL OF LEATHER PRODUCTS............................................................................................. 52
7.5 EXAMPLE OF CALCULATION: WASTEWATER PATHWAY.................................................... 53
31

IC-7 LEATHER PROCESSING INDUSTRY
8 EMISSION CALCULATION: BIOCIDES .................................................................................................. 53
8.1 LEATHER PROCESSING .................................................................................................................... 53
8.2 EXAMPLE OF CALCULATION ......................................................................................................... 53
9 REFERENCES ................................................................................................................................................ 54
10 GLOSSARY ..................................................................................................................................................... 55
32

IC-7 LEATHER PROCESSING INDUSTRY
1 INTRODUCTION
This document provides realistic worst-case release scenarios for industrial chemicals and biocides used in the production and finishing of leather (IC-07; UC-10, 51, and Biocide Product Type 9). These guidelines enable estimates of concentrations of substances in wastewater emitted from sites where these activities are carried out. Biocidal products used for the preservation of leather fall within Product Type 9 “Fibre, leather, rubber and polymerised materials preservatives”, according to Annex V of directive 98/8/EC. The current document only covers leather preservatives though. For biocidal products designed to preserved other types of material described in Product Type 9, other emission scenarios apply.
Leather is produced from skins of four different types of wild and domestic animals: cattle, sheep and lamb, goat and “reptiles & others”. “Leather tanning” is a general term for the numerous processing steps involved in converting animal hides or skins into finished leather. The structure of the skin is based on interlaced bundles of micelles and fibrils, the collagen. Respectively three peptides chains form a triple alpha-helix structure. Five of them form microfibrils units which in turn form higher fibriform structures. These structures are stabilised internally and laterally (cross linked) by hydrogen bonds between the peptide groups of amino acids (EC, 1996).
Tanning is the process by which animal hides (skin of large animals such as cattle) and skins (small animals such as sheep, goat, etc.) are converted into leather. In this process, the hydrogen bonds are replaced by substances like chromium sulphate, alum or vegetable tanning agents to stabilize the material against microbial proteolytic enzymes in wet environment, prevention of fracturing in dry environment and of gluing in hot surrounding.
Biocides are applied to prevent hides and skins from deterioration during transport, storage and treatment processes. As preservatives, they prevent microbial destruction of raw hides and skins, intermediate and finished products. As disinfectants, they reduce germs in the processing plant. As pesticides, they prevent animal pests, fly infection, moth larvae damage, and beetle attack prior to slaughtering and on long transports of hides and skins.
Leather production belongs to the natural product industry. It comprises:
• tanning of the skin to stabilise the material against microbial attack, • giving properties and fashion effects to the leather which are requested by the market. Production of leather goods is characterised by intermittent mechanical and chemical (batch) treatments, often high in number. Depending on the desired type of the final product the hides undergo a wide variety of processing steps. The wastewaters arising from the individual steps are sometimes pre-treated, but in most cases are mixed before discharge in order to make use both of dilution and neutralisation effects.
The European leather processing industry is presented on the INTERNET with the following statistical data (Table 1).
33

IC-7 LEATHER PROCESSING INDUSTRY
Table 1 European leather processing industry in 1997 (Cotance, 2000; IPPC, 2000)
Country Employment Companies Turnover 1,000 Euro
Export % Production 1,000 m2
Disposal route for solid waste 1)
Austria 1,000 7 135,000 100 5,000
Belgium 237 5 56,128 57 1,235 66% L 2) 17% I 17% A
Denmark 200 2 25,000 90 1,300
Finland 400 11 35,000 60 1,841
France 2,636 105 335,000 39 11,400 95% I 5% A
Germany 3,097 34 446,000 37 15,500 100% L
Greece 1,000 120 85,000 20 38,000
Ireland 400 3 34,000 100 4,280 60% L 40% A
Italy 25,000 2400 5,507,692 50 187,700 100% L
Netherlands 543 14 94,000 n.a. 3,617 100% L
Portugal 3,570 110 230,000 11 10,680
Spain 8,000 255 1,250,000 39 48,650 90% L 10% A
Sweden 400 4 68,000 65 2,600 100% L
United Kingdom
3,500 50 480,000 65 13,000 90% L 10% A
EU-15 49,983 3,120 8,780,820 56.4 319,986
Norway 220 3 31,000 85 1,192 100% L
Switzerland 130 4 n.a. n.a. 5,528
TOTAL 50,333 3,125 8,811,820 58.3 313,706
n.a. not available 1) quoted from IPPC 2) L = landfill, I = incineration, A = agriculture There are about 3,200 tanneries in Europe (Reymondon and Aloy, 1999). The most important producer and transformer in Europe is Italy (77% of all companies), followed by Spain. Size distribution of tanneries in Europe, France and Germany is shown below (Table 2).
34

IC-7 LEATHER PROCESSING INDUSTRY
Table 2 Size of Tanneries in Europe, France and Germany based on the number of employees. (Cotance, 1999; Syndicat de la Tannerie Française, personal communication, 1999)
Size of tanneries (% ) States Number of tanneries
Small (<50) 1) Medium (50-250) 1) Large (>250) 1)
Europe 3,132 59 35.5 5.5
France 96 87.5 12.5 2) 0
Germany 30 3)
1) Number of employees 2) Only one company with more than 200 employees 3) Of these 30 companies 43% are full tanneries, 37% wet-blue processing, 20% wet-white or “mixing” processing companies
(Böhm et al., 1997). The scenarios in this report are presented in the following way:
Input
[Variable/parameter (unit)] [Symbol] [Unit] S/D/O/P These parameters are the input to the scenario. The S, D, O or P classification of a parameter indicates the status: S Parameter must be present in the input data set for the calculation to be executed (there has been no method
implemented in the system to estimate this parameter; no default value is set). D Parameter has a standard value (most defaults can be changed by the user) O Parameter is the output from another calculation (most output parameters can be overwritten by the user with
alternative data). P Parameter value can be chosen from a “pick-list” of values. c Default or output parameter is closed and cannot be changed by the user. Output
[Symbol] [Description] Intermediate calculations
Parameter description (Unit) [Parameter = equation] (Equation no.)
End calculations [Parameter = equation] (Equation no.)
35

IC-7 LEATHER PROCESSING INDUSTRY
2 MAIN PROCESSES
The four steps of processing hides and skins are (Figure 1):
• curing; • beamhouse operations which wash and soak the hides or skins and (at most tanneries)
remove the attached hair; • tanyard processes in which the tanning agent (primarily chromium) reacts with and
stabilizes the proteinaceous matter in the hides or skins; • finishing or post-tanning processes.
36

IC-7 LEATHER PROCESSING INDUSTRY
37

IC-7 LEATHER PROCESSING INDUSTRY
Not all process steps are performed in each tannery and their sequence may change depending on the hides, as shown in Table 3.
Table 3 Sequence of processes according to different hides (EC, 1992)
HIDES Cowhides Sheepskin Pigskin
soaking soaking soaking PROCESS
unhairing fleshing unhairing
liming dewooling * liming
deliming deliming
bating bating
pickling pickling pickling
washing
degreasing * degreasing *
tanning tanning tanning
splitting splitting
shaving shaving
retanning retanning retanning
dyeing dyeing dyeing
fatliquoring fatliquoring fatliquoring
drying drying drying
buffing buffing
finishing finishing finishing
plating ironing plating
* specific to the skin process.
2.1 CURING
Curing prevents deterioration of the fresh skin or hide during storage and transport. It can be performed according to three methods:
• drying: which is used mainly in warm countries where salt is not available. Dry skins can be kept indefinitely;
• salting: the addition of salts helps the skin to dry more quickly and wet back more easily. Salting can be wet salting (less practical), brining (USA) or dry salting;
• chilling: it represents only 2% of the treated hides and consists of applying cool air or ice [2 - 6°C ] for a maximum storage of 3 weeks;
Usually, the skin is preserved by salting. Although salt is an excellent preservative, halophilic or halotolerant bacteria may grow on the cured hides causing “red or purple heat” (chromogenic pink, red or violet coloured bacteria). Chemicals are added to the salt to prevent red heat, such as sodium metabisulfite, boric acid and naphthalene (at 1-2% of the salt weight). Furthermore biocides are tested as an alternative for salt. The skin can be immersed in a biocide, or the biocide can be sprayed on the flesh surface of the hide (Bioexpo, 1998).
38
IC-7 LEATHER PROCESSING INDUSTRY
The salted hides and skins are stored on pallets in ambient and fresh conditions. Curing often incorporates treatment with insecticides (e.g. pyrethrum, permethrin, p-dichlorobenzene, etc.) to discourage attacks of beetles or other insects during storage and transport.
2.2 BEAMHOUSE
The hide is prepared for tanning through several steps of cleaning (removing the grease and hairs) and by ensuring the correct moisture content.
Typical steps are:
Wetting and soaking
The initial water content of the untanned leather is adjusted, mainly by two-stage cleaning of the skin, preliminary and main soaking. This may be carried out in pits, paddles or drums (or a combination of these). Paddle vats are semi-open systems used for small skins or dried hides, whereas drums (apparently the most common technique) are closed systems used for bovine hides. Drums can contain up to 10 tonnes of hides.
Liming and unhairing
Removal of the upper epidermis layers, including hairs etc. in a bath of lime (calcium hydroxide) and sodium sulphide. The duration of this step may vary from 18 hours (drums) to 7 days (vats). Limed hides are fleshed to remove the excess tissue, to impart uniform thickness, and to remove muscles or fat adhering to the hide. In some cases, fleshing is carried out just after soaking (green fleshing) (UNEP/IEO, 1994).
2.3 TANYARD OPERATIONS
Deliming
The hides are washed and undergo a neutralising treatment to remove the lime. This removal is necessary to make the skins receptive to the subsequent tanning.
Bating
It is an enzymatic process performed to impart softness, stretch, and flexibility to the leather. This step can take between 30 minutes and 12 hours. Bating and deliming are usually performed together by placing the hides in an aqueous solution of ammonium salt and proteolytic enzymes at 27° to 32°C.
Pickling
A solution containing acids (HCl, H2SO4, organic acids, NaCl) and salts is incorporated to adjust the pH according to the tanning requirement (stabilise the skins, end the bating action and improve the penetration of the subsequent tanning step). This step is done in drums. Fungicides such as thiobenzothiazol may be added during pickling.
39
IC-7 LEATHER PROCESSING INDUSTRY
Degreasing
This step, always after pickling, is required for sheep and pigskins where wool or hair may be recovered. For pigskins, degreasing can be initiated before liming. Solvents or surfactants can be used (surfactants especially if there is no recovery).
Tanning
It is the stabilisation of the collagen structure of the hide, using natural or synthetic chemicals. There are different techniques of tanning: chrome tanning, vegetable tanning, syntans and alternative tanning materials (e.g. oil tanning, limited to “chamois”).
In most cases, chromium (III) salts, and sometimes additionally aluminium and zirconium salts, are used as tanning agents. Leather for clothing, shoes and industrial purposes, is chrome tanned in drums for 4 to 24 hours.
Vegetable tanning is the oldest process in use in the leather tanning industry. It is still employed for sole, saddlery and some speciality leathers (heavy leathers). It takes one day (in drum) to 6 weeks (in pits) for the tanning material (bark or wood) to penetrate the hide (US EPA, 1997; UNEP/IEO, 1994).
Syntans are synthetic tanning agents (e.g. sulfonated products of phenol, cresol and naphthalene, or resins derived from polyurethanes or polyacrylic acids) used alone, for certain speciality leathers, or in association with other tanning agents.
Of the aldehydes, glutaraldehyde is by far the most efficient crosslinking agent. Trials carried out with glutaraldehyde have shown that it can be used as a tanning material in itself to give a washable leather which is very resistant to perspiration and when used in conjunction with chromium salts greatly improves the stability of the resulting leather (Bowes and Cater, 1965).
After the tanning process, the leather is called “wet blue” (for chrome tanning) or “wet white” (if other tanning agents are used). It can be stored and/or transported in these conditions. Some fungicides may, then, be added for preservation (UNEP/IEO, 1994).
2.4 POST-TANNING OR FINISHING OPERATIONS
After sammying the hides to remove excess moisture, splitting or shaving (to adjust the leather thickness to the required characteristics) and trimming, post-tanning operations such as dyeing, fatliquoring or finishing can proceed.
Dyeing and fatliquoring
Fatliquoring is the process of introducing oil (in an emulsion form) into the skin before the leather is dried to replace oils lost in beamhouse and tanyard processes. Fatliquoring is usually performed in a drum using an oil emulsion at temperatures of about 60° to 66°C for 30 to 40 minutes.
Finishing
The finishing process refers to all the steps that are carried out after drying. Leather may be finished in a variety of ways: buffed with fine abrasives to produce a suede finish; waxed, shellacked, or treated with pigments, dyes, and resins to achieve a smooth, polished surface and the desired colour; or lacquered with urethane for a glossy patent leather. Having been tanned,
40

IC-7 LEATHER PROCESSING INDUSTRY
the finished leather is relatively safe from destruction by microorganisms. However, as it contains oils and greases added to the leather in the finishing steps, it is susceptible to moulds. Mildew is undesired from an aesthetic point of view, and can cause stiffness and cracking of the leather due to removal of oils and greases used in the finishing operations (Bioexpo, 1998). Biocides can be applied by padding, spraying or rolling (UNEP/IEO, 1994).
Remark
Leather that has been processed through soaking, liming, deliming, pickling and tanning; and that is stored for some time or sold to another tannery, is designated as “wet-blue leather”.
“Crust leather” is the leather before the finishing step.
3 CHEMICALS
The quantities of chemicals used at each stage, per ton of salted wet hide, may be grouped together as indicated in Table 4.
Table 4 Quantities of the main chemicals (CTC, France, 1997)
Process Chemical Maximum quantity per ton of salted wet hide
[%] [kg/t]
Curing Sodium chloride Antiseptics
30.0 0.3
300 3
Beamhouse Wetting agents Antiseptics
Sodium sulphide Sodium hydrosulfide
Slaked lime Caustic soda
Sodium carbonate Enzymes
Mercaptans Ammonium chloride Ammonium sulfate
Organic acids
0.3 0.2 4.0 2.0 5.0 2.0 3.0 1.5 4.0 2.0 2.0 2.0
3 2 40 20 50 20 30 15 40 20 20 20
Tanning Sodium chloride Sulfuric acid Formic acid
Organic solvents Wetting agents
Sodium carbonate Chromium salts
Sodium bicarbonate Vegetable tans Glutaraldehyde
10.0 3.0 2.0 16.0 4.0 2.0 10.0 1.0 30.0 2.0
100 30 20 160 40 20 100 10 300 20
Dressing Dying and faltiquoring
Neutralising agents Retanning agents
Dyes Fat-liquoring oils
2.0 4.0 4.0 12.0
20 40 40 120
Finishing Finishing agents 4.0 40
41
IC-7 LEATHER PROCESSING INDUSTRY
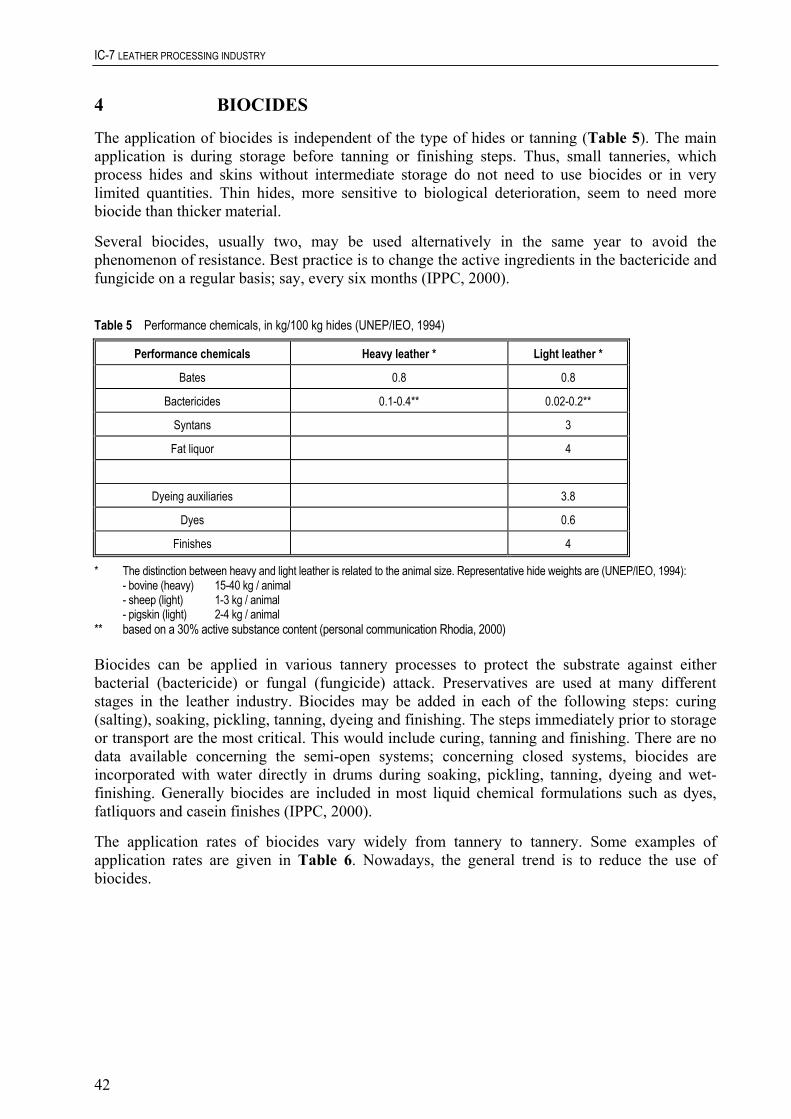
4 BIOCIDES
The application of biocides is independent of the type of hides or tanning (Table 5). The main application is during storage before tanning or finishing steps. Thus, small tanneries, which process hides and skins without intermediate storage do not need to use biocides or in very limited quantities. Thin hides, more sensitive to biological deterioration, seem to need more biocide than thicker material.
Several biocides, usually two, may be used alternatively in the same year to avoid the phenomenon of resistance. Best practice is to change the active ingredients in the bactericide and fungicide on a regular basis; say, every six months (IPPC, 2000).
Table 5 Performance chemicals, in kg/100 kg hides (UNEP/IEO, 1994)
Performance chemicals Heavy leather * Light leather *
Bates 0.8 0.8
Bactericides 0.1-0.4** 0.02-0.2**
Syntans 3
Fat liquor 4
Dyeing auxiliaries 3.8
Dyes 0.6
Finishes 4
* The distinction between heavy and light leather is related to the animal size. Representative hide weights are (UNEP/IEO, 1994): - bovine (heavy) 15-40 kg / animal - sheep (light) 1-3 kg / animal - pigskin (light) 2-4 kg / animal ** based on a 30% active substance content (personal communication Rhodia, 2000) Biocides can be applied in various tannery processes to protect the substrate against either bacterial (bactericide) or fungal (fungicide) attack. Preservatives are used at many different stages in the leather industry. Biocides may be added in each of the following steps: curing (salting), soaking, pickling, tanning, dyeing and finishing. The steps immediately prior to storage or transport are the most critical. This would include curing, tanning and finishing. There are no data available concerning the semi-open systems; concerning closed systems, biocides are incorporated with water directly in drums during soaking, pickling, tanning, dyeing and wet-finishing. Generally biocides are included in most liquid chemical formulations such as dyes, fatliquors and casein finishes (IPPC, 2000).
The application rates of biocides vary widely from tannery to tannery. Some examples of application rates are given in Table 6. Nowadays, the general trend is to reduce the use of biocides.
42

IC-7 LEATHER PROCESSING INDUSTRY
Table 6 Quantities of common biocides (Centre Technique du Cuir (CTC), France, personal communication to INERIS, 1999)
Step Amount of biocide applied per mass of raw hides (%)
Curing (salting) 0.01 – 0.5
Soaking 0.01 – 0.5
Pickling 0.01 – 0.5
Tanning 0.01 – 0.3 and 0.3 – 0.5 (small hides)
Finishing 0.3
Biocides can be applied prior or during the different stages of the tanning process as preservatives, disinfectants, or pesticides. Biocides may also be incorporated in proprietary products, such as dyes and casein finishes. Furthermore, raw hides and skins may contain biocides, which have been applied to the animal to protect it from diseases during its life.
For the wet-blue-conservation the following substances can be used (Baumann et al., 2000; IPPC, 2000):
• Phenols - para-Chlorometacresol (CMK) - Trichlorophenol - ortho-Phenylphenol (oPP)
• Heterocyclic substances - 2-Tricyanatomethylthiobenzothiazol (TCMTB) - 2-n-Octylisothiazolin-3-on (OITZ) - 2-Benzimidazolylmethylcarbamat (BCM)
• Diiodomethyltolylsulfon (DIMTS) • Bronopol (2-Bromo-2-nitro-propane-1,3-diaol) In many countries the use of halogenated phenols is not allowed. When non-halogenated phenols are used, care must be taken that no sodium chloride is used immediately prior to the tannery since this may cause the production of chlorinated phenols during the process. Chlorinated phenols can be discovered by monitoring the AOX value in the wastewater.
After tanning biocides are used in finishing operations to prevent the growth of microorganisms. In this stage the following chemicals can be used:
• p-Nitrophenol, • 2-Chloro-4-nitrophenol, • Tetrachlorohydrochinon, • bis(4-Nitrophenyl)carbonate, • bis(2-Chloro-4-nitrophenyl)carbonate, • 5,6-Dichloro-2-benzoxazolinone.
43

IC-7 LEATHER PROCESSING INDUSTRY
5 RELEASE ESTIMATION
Emissions of the tanning industry may be in gaseous, liquid and solid form. Yet, the two main sources of releases of processing chemicals are wastewater from washing of shipping containers, machinery, etc., and the disposal of unused active substances in spent baths (EC, 1996). Main releases occur during curing and finishing.
Note: Partial degradation of an active substance can occur within the process. This is not considered in this document. If data on degradation within the process are available, they can be taken into account in the release estimation.
5.1 RELEASES DURING CURING
Wastewater emissions
The stage of curing prevents hides from deterioration during storage and/or transportation. Usually, the technique employed is salting. Yet, biocides are tested as alternatives and are often incorporate in the treatment. They can be applied by spraying or, in most cases, in an immersion bath. Some of these biocides can be released in wastewater during the washout. The degree of fixation of biocide has been estimated to amount 95%.
Air emissions
Air emissions may occur during spraying of the biocide on the hides or skins. However, no further data are available, maybe due to the low utilisation of this technique.
5.2 RELEASES DURING FINISHING
Wastewater emissions
The finished leather is susceptible to moulds. The main system of application of biocides is drums (closed systems). The non-fixed biocides are then directly released to wastewater (degree of fixation of 95%).
Air emissions
There are several potential sources of air emissions in the finishing of tanned leather if organic solvent are used. Yet, non-solvent finishing technologies are now developing very quickly and associated releases are much lower. Spray application of biocide is common nowadays, however a release of more than 30% of the applied material may occur. Gas captures and cleaning procedures are then indispensable to limit air emissions (UNEP/IEO, 1994). Unfortunately, no data are available on those emissions.
5.3 RELEASES DURING OTHER TANNING STEPS
Biocides may be applied during others steps of the leather tanning such as soaking, pickling, tanning and dyeing. If drums are the recommended method (because of the closed system), paddles and pits are essential for certain processes such as the first soaking of dried hides and processing of long-wooled skins. Yet, in each case the main release occurs to wastewater.
44

IC-7 LEATHER PROCESSING INDUSTRY
5.4 RELEASES DURING OTHER LIFE CYCLE STAGES
Releases may occur during other life-cycle stages, e.g. the final use of leather articles and the elimination of leather articles.
A large part of the biocides remaining in the finished articles can be released to the environment during the service life of the leather articles. For volatile substances, a total release to the atmosphere can be assumed. Furthermore for articles subject to cleaning, substantial releases to wastewater can be assumed. All of these releases will be diffuse and relevant only for a regional exposure assessment. No precise quantitative release estimations can be proposed for the time being.
Regarding waste elimination, a generic model for releases from landfills is under development and might be used once the model is available.
5.5 WATER CONSUMPTION
A distinction has to be made between the rates of water consumption of integrated plants (processing of raw skins to final leather) and plants specialised in processing wet-blue. In the first case, water consumption rates are commonly in the range of 25-80 m3 per tonne of raw hide (UNEP/IEO, 1994) with a median value of 35 m3/t (EC, 1996) or in Germany of 21 m3/t of finished leather (Böhm et al., 1997; Hillenbrand et al., 1999). For the plants specialised on “wet-blue”, water consumption rates are between 18 m3/t (EC, 1996) and in Germany 25 m3/t (Böhm et al., 1997; Hillenbrand et al., 1999).
The individual stages of soaking, liming, deliming, pickling and tanning may be summarised as “beamhouse tanning”. The outcome of wet processes is “wet blue” material. Detailed figures about averaged water consumption are provided by Table 7.
Local water authorities are responsible for stipulating and monitoring limits of pH, maximum content of organic material and standards for content of specific metals (e.g. Cr3+) in wastewater effluents. Cr3+ is mainly coming from the tanning process. For these reason pre-treatment of wastewater is common practice. This leads also to a partial removal of substances (e.g. dyes) from the aqueous phase by precipitation.
There are two main sources of release of colorants or processing chemicals from leather tanneries:
• washings from cleaning or disposing of shipping containers, machinery, etc. • unused active substances in spent baths.
45

IC-7 LEATHER PROCESSING INDUSTRY
Table 7 Averaged water consumption and characteristics of wastewater from leather production and finishing
Stage Process Water Consumption [m³/t rawhide]
Hellinger, 1993 Warner, 1992
Beamhouse soaking 6 6
liming 9 9
deliming and bating 5 5
Subtotal 20 20
Tanning pickling and chrome tannery 2.5 4
washing after chrome tannery
Subtotal 2.5 4
Squeezing water out 0.5
Wet finishing (grain leather) washing, neutralisation, 6.3 7.5
washing after neutralisation
retanning, dying, fatliquoring 2.5 5.5
washing dressing, cleaning 0.2 27
Subtotal 9 40
Spray finishing
Total amount of wastewater 32 64
5.6 WASTEWATER TREATMENT
The composition of wastewater depends on the types of processes and on the level of water consumption. The sewage treatment plant (STP) is based on a classical scheme. There are usually several options for each processing unit. The final choice depends on the tannery and on local discharge standards.
The classical scheme is:
• pre-treatment: mechanical screening to remove coarse material, • primary treatment: sulfide removal from beam house effluents; chrome removal from
tanning effluents; flow equalisation; physical-chemical treatment for BOD removal and neutralisation,
• secondary treatment, usually biological, • tertiary treatment, including nitrification and denitrification, • sedimentation and sludge handling (UNEP/IEO, 1994). Biocides are treated in the biological step. STP can be private for a single tannery or be a common structure for several small tanneries as shown in Table 8 (EC, 1992).
46

IC-7 LEATHER PROCESSING INDUSTRY
Table 8 European sewage treatment plants of tanneries (EC, 1992)
Countries Collective STPs On-site STPs Urban STPs
Italy X (about 85%)
X (about 10%)
X (about 5%)
Germany 17% 1) 83% 1)
Netherlands X
France X (large tanneries)
X (small tanneries)
Spain X X
1) Böhm et al., 1997; Hillenbrand et al., 1999
A recent German study revealed the following data. Out of a total of 30 German leather processing 5 (17%) plants discharge their wastewater directly into surface waters and 25 plants into municipal sewage treatment plants (Böhm et al, 1997; Hillenbrand, 1999). More details on the wastewater treatment are presented in Table 9.
Table 9 Wastewater Treatment in the Leather Processing Industry in Germany (Böhm et al., 1997; Hillenbrand et al., 1999)
Wastewater Treatment Direct discharge Indirect discharge
Yes No number Yes No Number
Mechanical treatment 4 1 5 22 3 25
Chemical-physical treatment 2 3 5 21 4 25
Biological treatment 5 0 5 2 23 25
Recycling of wastewater into production 5 0 5 1 24 25
Other treatment 1 5
Companies that initiated measures Of which: treatment measures
2 12 9
Companies that plan measures Of which: treatment measures Of which: wastewater recycling
3 8 3 4
5.7 SOLID WASTE FROM LEATHER PROCESSING
Solid waste comes mainly from leather production process. It is assumed, that 600 – 1,000 kg of solid waste results per ton of processed raw hide or skin. Applying this relationship the total amount of waste per country can be calculated from Table 1. The majority of this waste is land filled, minor amounts are spread on agricultural soil or incinerated.
47

IC-7 LEATHER PROCESSING INDUSTRY
Raw hides
Green-fleshing ⇒ Green fleshing
Unhairing, liming ⇒ Hair, lime, organic matter
Lime fleshing ⇒ Lime fleshing
Lime splitting ⇒ Lime split and trimmings Deliming, bating
Degreasing
Pickling
Tanning
Chrome-splitting, shaving ⇒ Chrome split
Retanning, dying, fat-liquoring
Drying
Staking
Buffing ⇒ Buffing dust
Trimming ⇒ Trimmings
Finishing ⇒ Residues of finishing solutions
Finished Leather
Figure 2 General outline of leather production - Solid waste (CTC, France, 1997)
48
IC-7 LEATHER PROCESSING INDUSTRY
5.8 SOLID WASTE FROM USED LEATHER PRODUCTS
Solid waste arises also from used leather products. The major part of this material (shoes, clothes) ends up in the domestic waste streams and is disposed of in landfills or is incinerated. In general, environmental concentrations from products of the leather industry do not have a high number of diffusive sources.
6 BRANCH SPECIFIC PARAMETERS
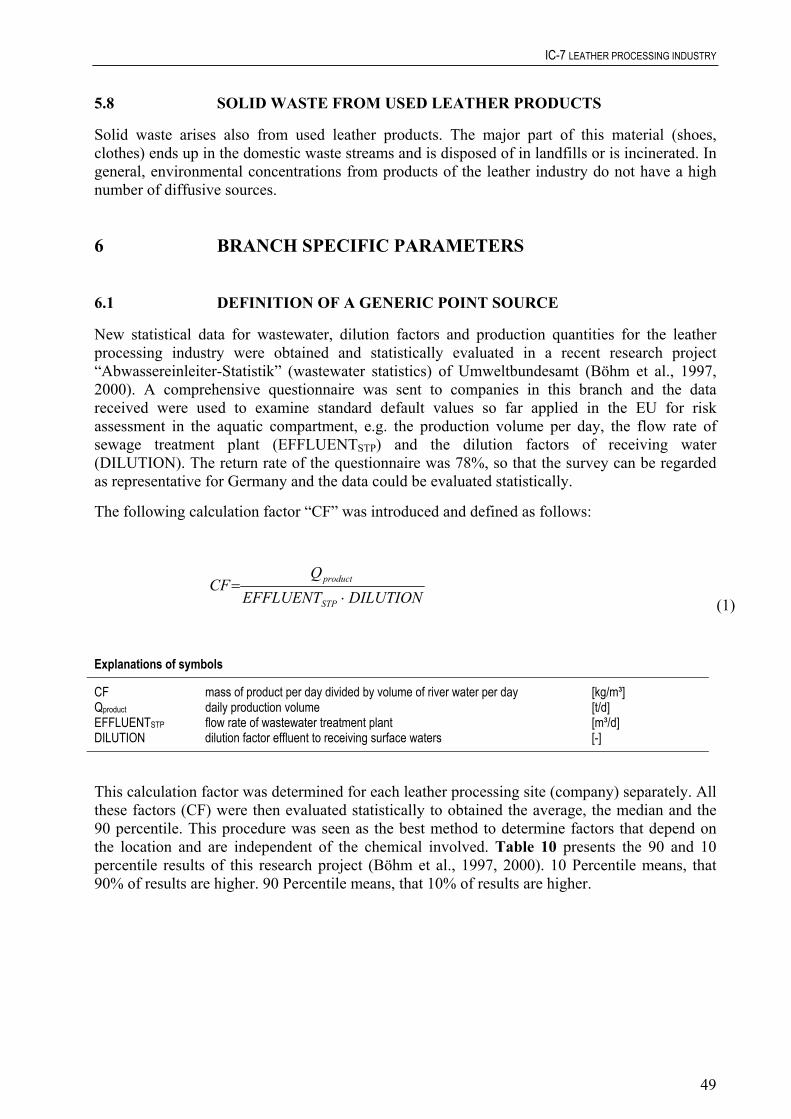
6.1 DEFINITION OF A GENERIC POINT SOURCE
New statistical data for wastewater, dilution factors and production quantities for the leather processing industry were obtained and statistically evaluated in a recent research project “Abwassereinleiter-Statistik” (wastewater statistics) of Umweltbundesamt (Böhm et al., 1997, 2000). A comprehensive questionnaire was sent to companies in this branch and the data received were used to examine standard default values so far applied in the EU for risk assessment in the aquatic compartment, e.g. the production volume per day, the flow rate of sewage treatment plant (EFFLUENTSTP) and the dilution factors of receiving water (DILUTION). The return rate of the questionnaire was 78%, so that the survey can be regarded as representative for Germany and the data could be evaluated statistically.
The following calculation factor “CF” was introduced and defined as follows:
DILUTIONEFFLUENTQ
CFSTP
product
⋅=
(1)
Explanations of symbols
CF mass of product per day divided by volume of river water per day [kg/m³] Qproduct daily production volume [t/d] EFFLUENTSTP flow rate of wastewater treatment plant [m³/d] DILUTION dilution factor effluent to receiving surface waters [-]
This calculation factor was determined for each leather processing site (company) separately. All these factors (CF) were then evaluated statistically to obtained the average, the median and the 90 percentile. This procedure was seen as the best method to determine factors that depend on the location and are independent of the chemical involved. Table 10 presents the 90 and 10 percentile results of this research project (Böhm et al., 1997, 2000). 10 Percentile means, that 90% of results are higher. 90 Percentile means, that 10% of results are higher.
49
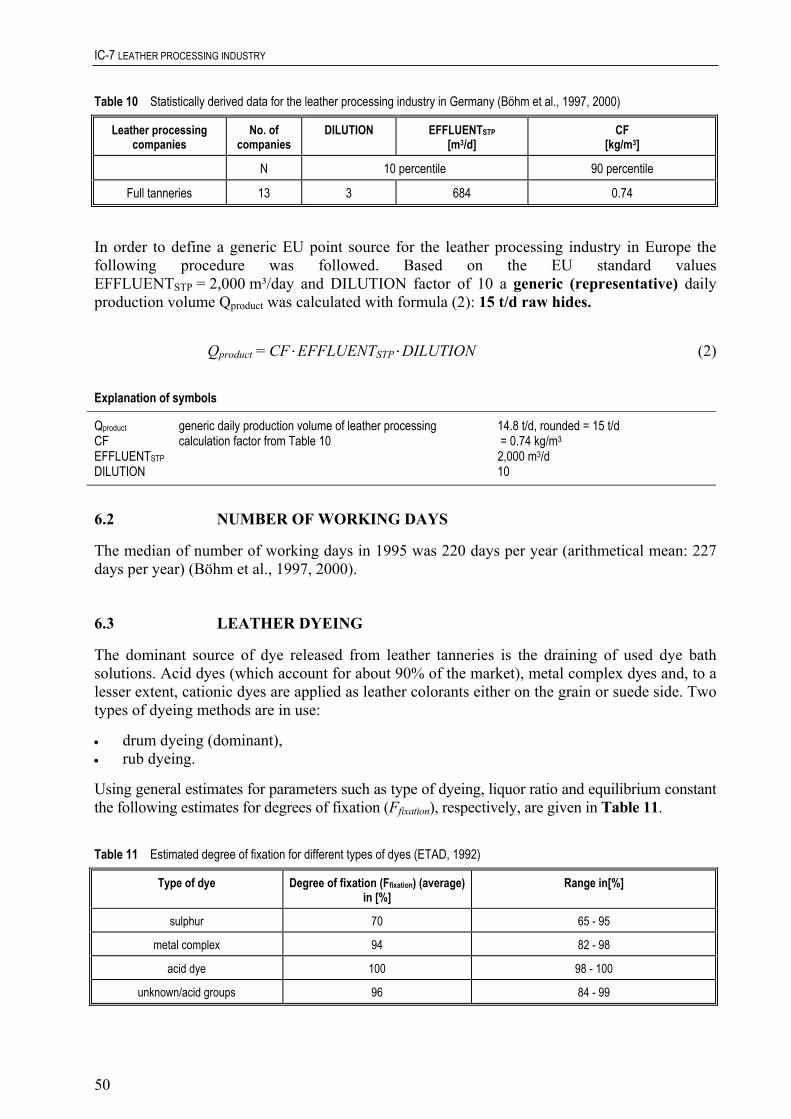
IC-7 LEATHER PROCESSING INDUSTRY
Table 10 Statistically derived data for the leather processing industry in Germany (Böhm et al., 1997, 2000)
Leather processing companies
No. of companies
DILUTION EFFLUENTSTP [m3/d]
CF [kg/m3]
N 10 percentile 90 percentile
Full tanneries 13 3 684 0.74
In order to define a generic EU point source for the leather processing industry in Europe the following procedure was followed. Based on the EU standard values EFFLUENTSTP = 2,000 m³/day and DILUTION factor of 10 a generic (representative) daily production volume Qproduct was calculated with formula (2): 15 t/d raw hides.
Qproduct = CF.EFFLUENTSTP.DILUTION (2)
Explanation of symbols
Qproduct generic daily production volume of leather processing 14.8 t/d, rounded = 15 t/d CF calculation factor from Table 10 = 0.74 kg/m3 EFFLUENTSTP 2,000 m3/d DILUTION 10
6.2 NUMBER OF WORKING DAYS
The median of number of working days in 1995 was 220 days per year (arithmetical mean: 227 days per year) (Böhm et al., 1997, 2000).
6.3 LEATHER DYEING
The dominant source of dye released from leather tanneries is the draining of used dye bath solutions. Acid dyes (which account for about 90% of the market), metal complex dyes and, to a lesser extent, cationic dyes are applied as leather colorants either on the grain or suede side. Two types of dyeing methods are in use:
• drum dyeing (dominant), • rub dyeing.
Using general estimates for parameters such as type of dyeing, liquor ratio and equilibrium constant the following estimates for degrees of fixation (Ffixation), respectively, are given in Table 11.
Table 11 Estimated degree of fixation for different types of dyes (ETAD, 1992)
Type of dye Degree of fixation (Ffixation) (average) in [%]
Range in[%]
sulphur 70 65 - 95
metal complex 94 82 - 98
acid dye 100 98 - 100
unknown/acid groups 96 84 - 99
50
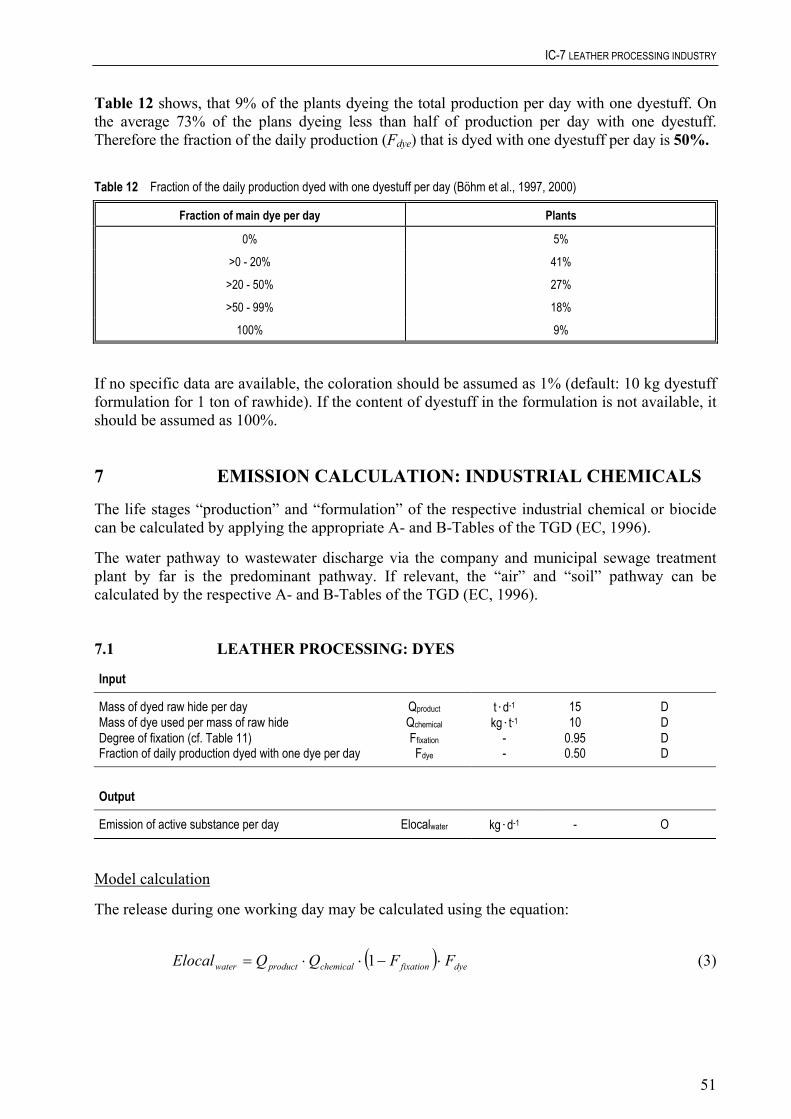
IC-7 LEATHER PROCESSING INDUSTRY
Table 12 shows, that 9% of the plants dyeing the total production per day with one dyestuff. On the average 73% of the plans dyeing less than half of production per day with one dyestuff. Therefore the fraction of the daily production (Fdye) that is dyed with one dyestuff per day is 50%.
Table 12 Fraction of the daily production dyed with one dyestuff per day (Böhm et al., 1997, 2000)
Fraction of main dye per day Plants
0% 5%
>0 - 20% 41%
>20 - 50% 27%
>50 - 99% 18%
100% 9%
If no specific data are available, the coloration should be assumed as 1% (default: 10 kg dyestuff formulation for 1 ton of rawhide). If the content of dyestuff in the formulation is not available, it should be assumed as 100%.
7 EMISSION CALCULATION: INDUSTRIAL CHEMICALS
The life stages “production” and “formulation” of the respective industrial chemical or biocide can be calculated by applying the appropriate A- and B-Tables of the TGD (EC, 1996).
The water pathway to wastewater discharge via the company and municipal sewage treatment plant by far is the predominant pathway. If relevant, the “air” and “soil” pathway can be calculated by the respective A- and B-Tables of the TGD (EC, 1996).
7.1 LEATHER PROCESSING: DYES
Input
Mass of dyed raw hide per day Qproduct t.d-1 15 D Mass of dye used per mass of raw hide Qchemical kg.t-1 10 D Degree of fixation (cf. Table 11) Ffixation - 0.95 D Fraction of daily production dyed with one dye per day Fdye - 0.50 D Output
Emission of active substance per day Elocalwater kg.d-1 - O
Model calculation
The release during one working day may be calculated using the equation:
( ) dyefixationchemicalproductwater FFQQElocal ⋅−⋅⋅= 1 (3)
51

IC-7 LEATHER PROCESSING INDUSTRY
7.2 LEATHER PROCESSING: CHEMICALS OTHER THAN DYES
Input
Mass of processed raw hide per day Qproduct t.d-1 15 D Mass of substance used per mass of raw hide Qchemical kg.t-1 S Proportion of the substance chemically concerted or fixed to the raw hide during processing
Ffixation - S
Output
Emission of active substance per day Elocalwater kg.d-1 - O
Model calculation
The release of tanning, pickling, etc. chemicals during one working day may be calculated using the equation:
( )fixationchemicalproductwater FQQElocal −⋅⋅= 1 (4)
7.3 SERVICE LIFE OF LEATHER PRODUCTS
No major environmental releases are expected.
7.4 DISPOSAL OF LEATHER PRODUCTS
Not quantified yet.
52
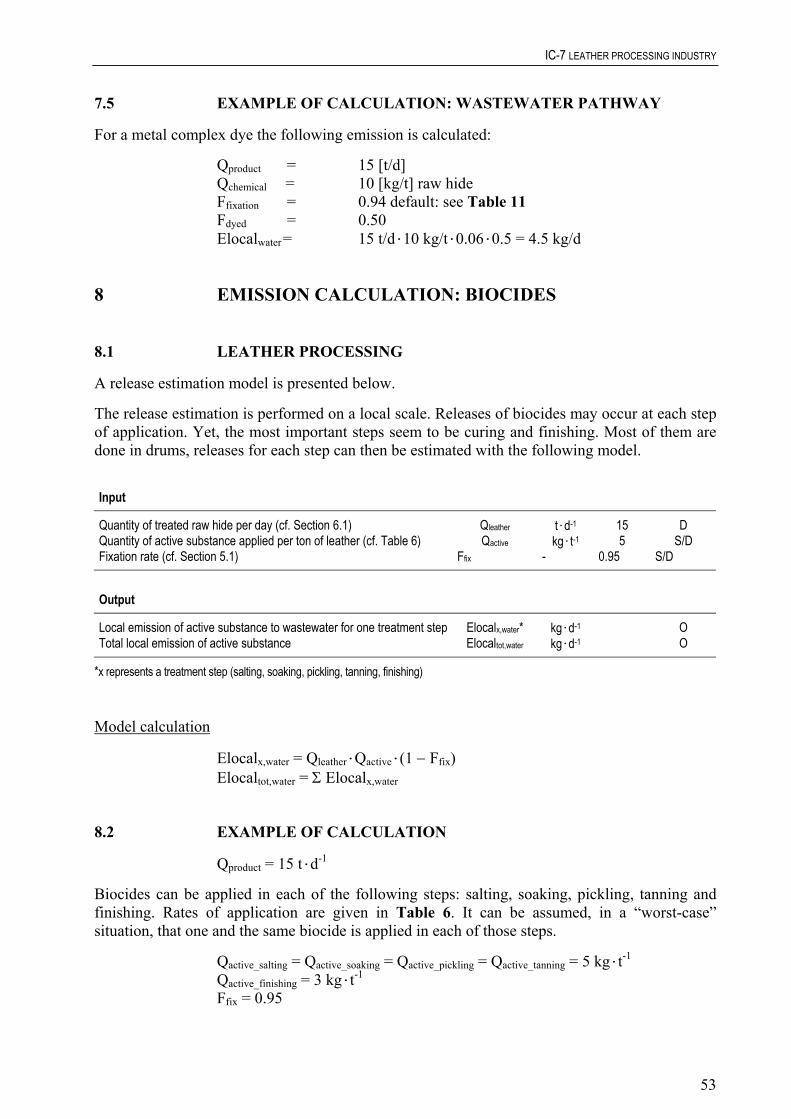
IC-7 LEATHER PROCESSING INDUSTRY
7.5 EXAMPLE OF CALCULATION: WASTEWATER PATHWAY
For a metal complex dye the following emission is calculated:
Qproduct = 15 [t/d] Qchemical = 10 [kg/t] raw hide Ffixation = 0.94 default: see Table 11 Fdyed = 0.50 Elocalwater = 15 t/d.10 kg/t.0.06.0.5 = 4.5 kg/d
8 EMISSION CALCULATION: BIOCIDES
8.1 LEATHER PROCESSING
A release estimation model is presented below.
The release estimation is performed on a local scale. Releases of biocides may occur at each step of application. Yet, the most important steps seem to be curing and finishing. Most of them are done in drums, releases for each step can then be estimated with the following model.
Input
Quantity of treated raw hide per day (cf. Section 6.1) Qleather t.d-1 15 D Quantity of active substance applied per ton of leather (cf. Table 6) Qactive kg.t-1 5 S/D Fixation rate (cf. Section 5.1) Ffix - 0.95 S/D Output
Local emission of active substance to wastewater for one treatment step Elocalx,water* kg.d-1 O Total local emission of active substance Elocaltot,water kg.d-1 O
*x represents a treatment step (salting, soaking, pickling, tanning, finishing)
Model calculation
Elocalx,water = Qleather.Qactive.(1 − Ffix) Elocaltot,water = Σ Elocalx,water
8.2 EXAMPLE OF CALCULATION
Qproduct = 15 t.d-1
Biocides can be applied in each of the following steps: salting, soaking, pickling, tanning and finishing. Rates of application are given in Table 6. It can be assumed, in a “worst-case” situation, that one and the same biocide is applied in each of those steps.
Qactive_salting = Qactive_soaking = Qactive_pickling = Qactive_tanning = 5 kg.t-1 Qactive_finishing = 3 kg.t-1 Ffix = 0.95
53
IC-7 LEATHER PROCESSING INDUSTRY
Elocal = Elocal = Elocal = Elocal = 15.5.(1 – 0.95) = 3.75 kg.d .
soaking_water pickling_water-1
salting_water tanning_water
Elocalfinishing_water = 15.3.(1 – 0.95) = 2.25 kg.d-1.
The release is: Elocaltot_water = 4.3.75 + 2.25 = 17.25 kg.d . -1
9 REFERENCES Baumann W, Hesse K, Pollkläsner D, Kümmerer K, Kümpel T (2000). Gathering and Review of Environmental Emission Scenarios for Biocides. Umweltbundesamt (UBA), Research Project number 360 04 007, Berlin. http://www.oekopro.de
Bioexpo (1998). Development of a Concept for the Environmental Risk Assessment of Biocidal Products for Authorization Purposes (Bioexpo). Fibre, Leather, Rubber and Polymerised Materials Preservatives (Product Type 9). TNO Institute for Environmental Sciences, Energy Research and Process Innovation. Research Project No. FKZ 106 01 065 of Umweltbundesamt, Berlin.
Böhm E, Hillenbrand T, Landwehr M, Marscheider-Weidemann F, Corley MS (1997). Statistik wichtiger industrieller und gewerblicher Branchen zur Bewertung der Umweltgefährlichkeit von Stoffen (Investigation on wastewater: Statistical Evaluation of Industrial Effluents for Risk Assessment of Substances). Fraunhofer Institut für Systemtechnik und Innovationsforschung, Karlsruhe Untersuchungen zur Abwassereinleitung, Umweltbundesamt, Research Report, Projekt number: 206 04 144/01.
Böhm E, Hillenbrand T, Marscheider-Weidemann F, Schubert D (2000). Bewertung der Umweltgefährlichkeit von Stoffen. Erhebung und statistische Auswertung von Produktions- und Abwasserkennwerten für die Branchen Papiererzeugung, Textilveredlung, Ledererzeugung (Risk assessment for substances (Statistical evaluation on production and effluents in three industrial branches: paper and pulp, textile finishing and leather industries). UWSF-Z. Umweltchem. Ökotox. 12(1), 21-26.
Bowes JH and Cater GW (1965). Crosslinking of collagen. J. Appl. Chem. 15, July 1965.
Cotance (2000). http://www.cotance.com.
CTC (1997). Centre Technique Cuir Chaussure Maroquinerie (CTC), Lyon, France.
EC (1992). Technical and Economic Study on the Reduction (based on the Best Technology Available) of Industrial Emissions (Water, Air and Solid Wastes) from Tanneries. Commission of European Communities DGXI/A/3. Final Report.
ETAD (1992). Guidelines for the Assessment of Environmental Exposure to Dyestuffs. Ecological and Toxicological Association of the Dyes and Organic Pigments Manufacturers (ETAD), Basel, Switzerland.
EC (1996). Technical Guidance Document on Risk Assessment in support of Commission Directive 93/67/EEC on Risk Assessment for New Notified Substances and Commission Regulation (EC) 1488/94 on Risk Assessment for Existing Substances. Part IV. Office for Official Publications of the EC, Luxembourg.
IPPC (2000). Best Available Techniques Reference Document on the Tanning of Hides and Skins. Integrated Pollution Prevention and Control (IPPC). European IPPC Bureau, Sevilla, Draft June 2000.
Helliger K (1993). Abfallvermeidung und Verwertung in der Lederindustrie. TV 3: Ökologische Gesamtbilanz der lederherstellenden Industrie. BMFT Studie, Reseach Project Number 523-4014-1480841, Forschungsinstitut für Ledertechnologie GmbH, TU Bergakademie, Freiberg.
Hillenbrand T, Böhm E, Landwehr M, Marscheider-Weidemann (1999). Die Abwassersituation in der deutschen Papier-, Textil- und Lederindustrie – Repräsentative Bestandsaufnahme für die Bewertung chemischer Stoffe, gwf Wasser Abwasser, 140(4) 267-273.
Reymondon R et Aloy M (1999). Geometrisation of hides at early stages. IDC, 46-48.
UNEP/IEO (1994). Tanneries and the Environment: A Technical Guide to Reducing the Environmental Impact of Tannery Operations. Technical Report n° 4. 120p.
54
IC-7 LEATHER PROCESSING INDUSTRY
US EPA (1997). Leather Tanning. In Food And Agricultural Industry. Section 9.15: 1-5. US Environmental Protection Agency (US EPA), Washington, DC.
Warner E (1992). Abwässer aus Lederfabriken in der ehemaligen DDR, Industrieabwasser.
10 GLOSSARY Bating: is the manufacturing step which follows liming and precedes pickling. The purpose of bating is to delime the hides, reduce swelling, peptise fibres, and remove protein degradation products.
Beam house: is that portion of the tannery where the hides are washed, limed, fleshed and unhaired, when necessary, prior to the tanning process.
Crust leather: is leather before the finishing step.
Deliming: is the process which removes the lime from hides coming from the beam house.
Fleshing: to remove the excess tissue, to impart uniform thickness and to remove muscles or fat adhering to the hide.
Finishing: is the final set of processing steps performed on a tanned hide. These operations follow the retan-colour-fatliquor processes, and include the many dry processes involved in converting the hide into the final tannery product.
Leather: is the general term for hide or skin which still retains its original fibrous structure more or less intact, and which has been treated so as to be non-putrescible even after treatment with water.
Pickling: it is the process to preserve hides from deterioration and to further reduce the pH prior to tanning by using salt and acid. Synthetic fat liquors are added to improve softness.
Retanning: is the process of subjecting a skin, which has been first more or less completely tanned by one process or one kind or blend of tanning materials, to a second tanning process involving similar or, more usually, different tanning materials.
Sammying: is the process to remove salt and other solids and to remove excess moisture lost during curing.
Wet blue: is a term for a hide or skin which has been subject to the usual beam house processes, has been chrome-tanned and left wet, and may now be stored or exported in this state. The outcome of 1 t raw hide is approximately 200 kg to 600 kg wet-blue.
55


IC-8 METAL EXTRACTION INDUSTRY, REFINING AND PROCESSING INDUSTRY
ASSESSMENT OF ENVIRONMENTAL RELEASE OF CHEMICALS USED IN METAL CUTTING AND FORMING FLUIDS
57


IC-8 METAL EXTRACTION INDUSTRY, REFINING AND PROCESSING INDUSTRY
CONTENTS
1 INTRODUCTION ........................................................................................................................................... 61
2 LIFE CYCLE OF CHEMICALS IN COOLING LUBRICANTS .............................................................. 62
3 MAIN PROCESSES IN THE METAL PROCESSING INDUSTRY......................................................... 62
3.1 CHEMICALS AND ADDITIVES ......................................................................................................... 66
4 EMISSION SCENARIOS............................................................................................................................... 68
4.1 DEFINITION OF THE POINT SOURCE ........................................................................................... 70 4.1.1 Point source for industrial use ....................................................................................................... 70 4.1.2 Point source for the life cycle step of waste/recovery.................................................................... 70
4.2 EMISSION BY WATER-BASED COOLING LUBRICANTS .......................................................... 71 4.2.1 Emission of cooling lubricant emulsions....................................................................................... 71
4.2.1.1 Emission during industrial use......................................................................................... 72 4.2.1.2 Emission during waste/recovery treatment...................................................................... 72
4.2.2 Aqueous cooling lubricant solutions.............................................................................................. 75 4.2.2.1 Emission during industrial use......................................................................................... 75 4.2.2.2 Emission during waste/recovery treatment...................................................................... 75
4.3 EMISSION BY PURE OILS COOLING LUBRICANTS .................................................................. 76 4.3.1 Emission during industrial use....................................................................................................... 76 4.3.2 Emission during waste/recovery treatment .................................................................................... 77
4.4 RELEASE DETERMINATION PARAMETER ................................................................................. 78
5 EXAMPLES..................................................................................................................................................... 80
6 REFERENCES ................................................................................................................................................ 81
7 ABBREVIATIONS ......................................................................................................................................... 82
59


IC-8 METAL EXTRACTION INDUSTRY, REFINING AND PROCESSING INDUSTRY
1 INTRODUCTION
This document estimates the release of chemicals which can be found in cooling lubricants used in the metal working industry (IC-8 “Metal extraction industry, refining and processing industry”, UC-29 “Heat transferring agents (cooling agents, heating agents)”, UC-35 “Lubricants and additives”). The assessment of the environmental risk is made step by step and is given under realistic worst-case conditions. With the aid of the determined emission Elocalwater (carriage in kg.d-1) it is possible to estimate the PEClocalwater.
Cooling lubricants are used during manufacture in the metal processing industry. Water-based and pure oils cooling lubricants are used in metal processing to reduce the friction, to remove arising heat and to sweep away metal chips from the cutting place. For water-based cooling lubricants a distinction can be made between emulsified and water-soluble cooling lubricants. A cooling lubricant consists of many different substances, which influence, among other things the workmanship, the surface finish, the corrosive behaviour, the productivity and the tool wear.
The environmental release during the production of the metalworking fluids and possible discharges other than those from their intended use and disposal are not considered in this document. Subject of this release estimation are pure oils cooling lubricants and water-based cooling lubricants. To determine the release a representative emission source is considered.
Cinfl: influent concentration
Ceffl: effluent concentration EFFLUENTstp: volume flow of STP P: elimination in STP D: dilution factor
Figure 1 Determination of the PEClocalwater
61
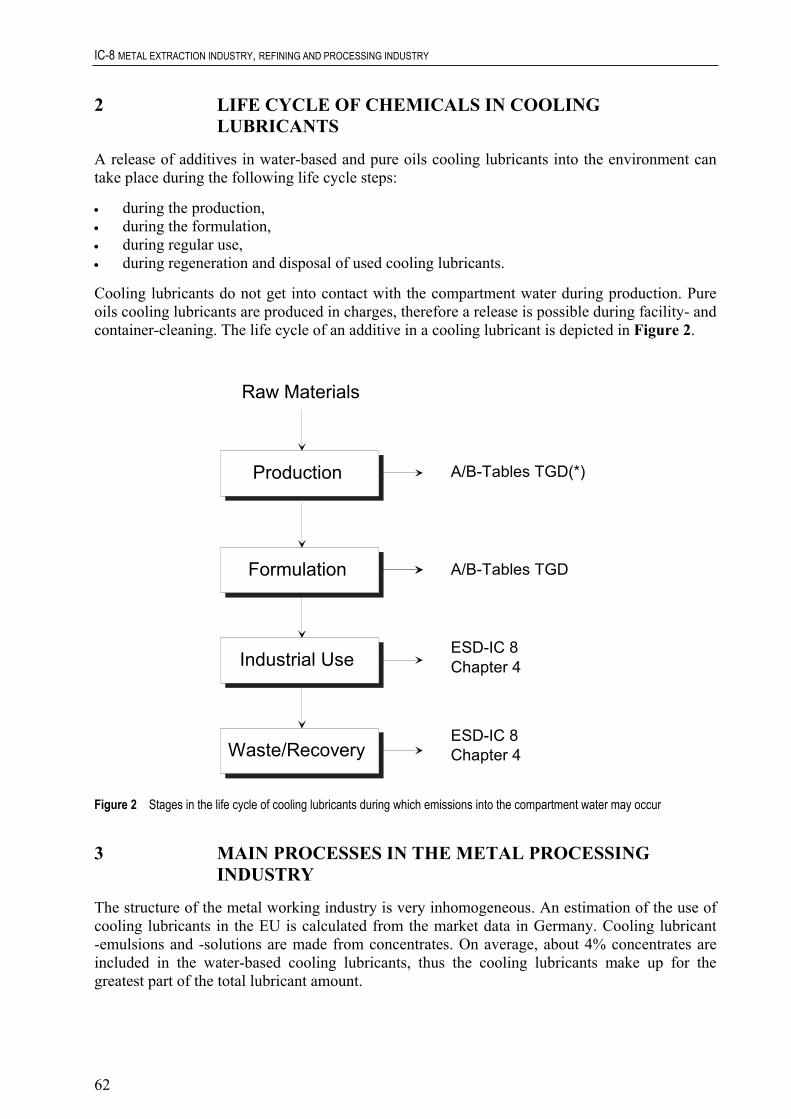
IC-8 METAL EXTRACTION INDUSTRY, REFINING AND PROCESSING INDUSTRY
2 LIFE CYCLE OF CHEMICALS IN COOLING LUBRICANTS
A release of additives in water-based and pure oils cooling lubricants into the environment can take place during the following life cycle steps:
• during the production, • during the formulation, • during regular use, • during regeneration and disposal of used cooling lubricants.
Cooling lubricants do not get into contact with the compartment water during production. Pure oils cooling lubricants are produced in charges, therefore a release is possible during facility- and container-cleaning. The life cycle of an additive in a cooling lubricant is depicted in Figure 2.
Raw Materials
Production
Formulation
Industrial Use
Waste/Recovery
A/B-Tables TGD
ESD-IC 8Chapter 4
ESD-IC 8Chapter 4
A/B-Tables TGD(*)
Figure 2 Stages in the life cycle of cooling lubricants during which emissions into the compartment water may occur
3 MAIN PROCESSES IN THE METAL PROCESSING INDUSTRY
The structure of the metal working industry is very inhomogeneous. An estimation of the use of cooling lubricants in the EU is calculated from the market data in Germany. Cooling lubricant -emulsions and -solutions are made from concentrates. On average, about 4% concentrates are included in the water-based cooling lubricants, thus the cooling lubricants make up for the greatest part of the total lubricant amount.
62
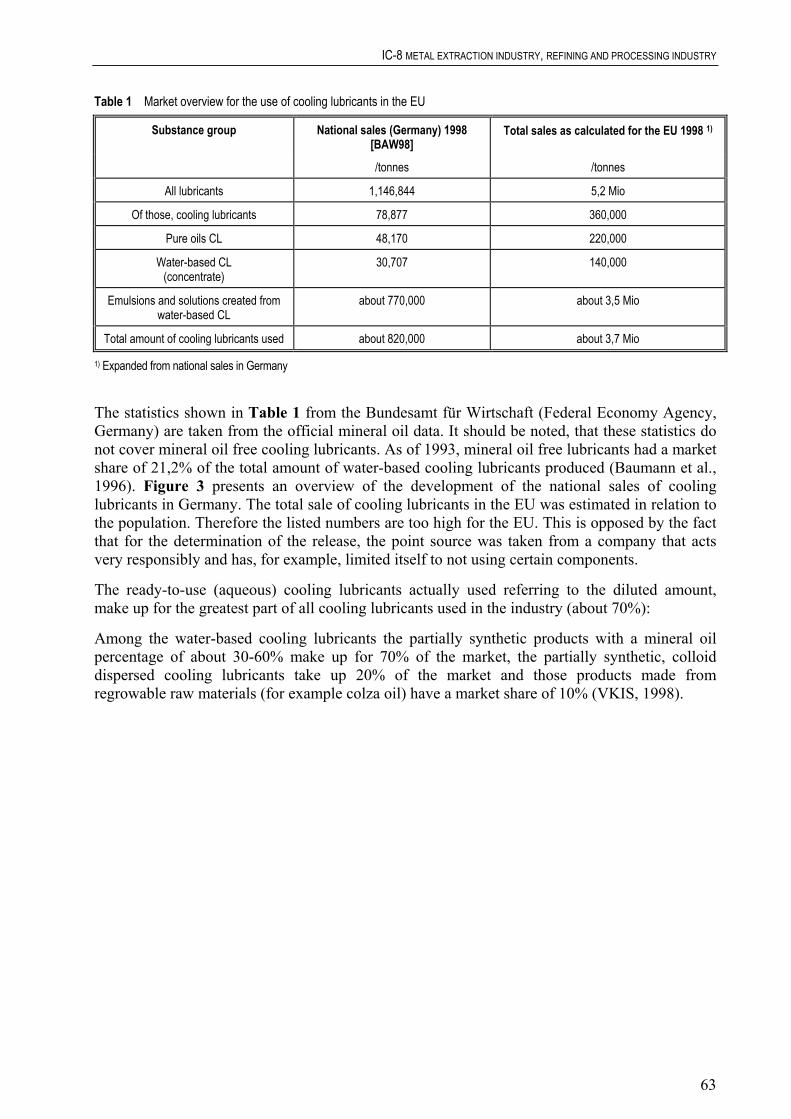
IC-8 METAL EXTRACTION INDUSTRY, REFINING AND PROCESSING INDUSTRY
Table 1 Market overview for the use of cooling lubricants in the EU
Substance group National sales (Germany) 1998 [BAW98]
Total sales as calculated for the EU 1998 1)
/tonnes /tonnes
All lubricants 1,146,844 5,2 Mio
Of those, cooling lubricants 78,877 360,000
Pure oils CL 48,170 220,000
Water-based CL (concentrate)
30,707 140,000
Emulsions and solutions created from water-based CL
about 770,000 about 3,5 Mio
Total amount of cooling lubricants used about 820,000 about 3,7 Mio
1) Expanded from national sales in Germany
The statistics shown in Table 1 from the Bundesamt für Wirtschaft (Federal Economy Agency, Germany) are taken from the official mineral oil data. It should be noted, that these statistics do not cover mineral oil free cooling lubricants. As of 1993, mineral oil free lubricants had a market share of 21,2% of the total amount of water-based cooling lubricants produced (Baumann et al., 1996). Figure 3 presents an overview of the development of the national sales of cooling lubricants in Germany. The total sale of cooling lubricants in the EU was estimated in relation to the population. Therefore the listed numbers are too high for the EU. This is opposed by the fact that for the determination of the release, the point source was taken from a company that acts very responsibly and has, for example, limited itself to not using certain components.
The ready-to-use (aqueous) cooling lubricants actually used referring to the diluted amount, make up for the greatest part of all cooling lubricants used in the industry (about 70%):
Among the water-based cooling lubricants the partially synthetic products with a mineral oil percentage of about 30-60% make up for 70% of the market, the partially synthetic, colloid dispersed cooling lubricants take up 20% of the market and those products made from regrowable raw materials (for example colza oil) have a market share of 10% (VKIS, 1998).
63
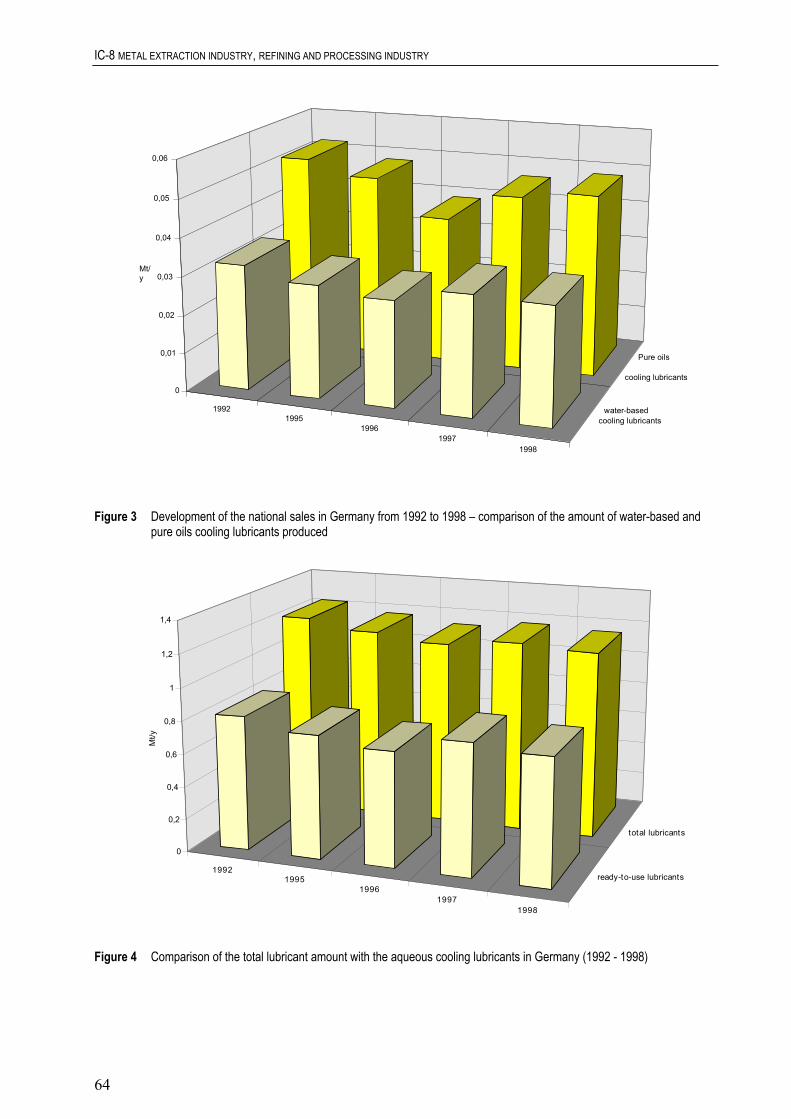
IC-8 METAL EXTRACTION INDUSTRY, REFINING AND PROCESSING INDUSTRY
1992 1995
19961997
1998
Pure oils
cooling lubricants
water-based cooling lubricants
0
0,01
0,02
0,03
0,04
0,05
0,06
Mt/y
Figure 3 Development of the national sales in Germany from 1992 to 1998 – comparison of the amount of water-based and
pure oils cooling lubricants produced
19921995
19961997
1998
ready-to-use lubricants
total lubricants
0
0,2
0,4
0,6
0,8
1
1,2
1,4
Mt/y
Figure 4 Comparison of the total lubricant amount with the aqueous cooling lubricants in Germany (1992 - 1998)
64

IC-8 METAL EXTRACTION INDUSTRY, REFINING AND PROCESSING INDUSTRY
In metal working processes the geometry of the object to be treated is changed by cutting and non-cutting forming. Metal cutting processes are for example turning, drilling, milling, cutting, abrasive blasting, planing and lapping (see Table 2). When using non-cutting forming the work piece is formed through pressure (e.g. rolling), compression-tension (e.g. deep drawing), pulling, bending or pushing.
As shown in Figure 5, cooling lubricants for cutting processes in the metal processing industry are divided according to their makeup into
• pure oils cooling lubricants, • water-based cooling lubricants.
Cooling Lubricants
Water-basedCooling Lubricants
Pure oils Cooling Lubricants
Aqueous Cooling Lubricant Solutions
Cooling LubricantsEmulsions
Figure 5 Division of cooling lubricants Table 2 Cutting processes
Cutting processes with geometrically defined tool edges turning drilling, recessing, grinding milling planing, slotting broaching sawing filing, rasping brush cutting shaving, chiselling
Cutting processes with geometrically undefined tool edges grinding belt grinding stroke grinding honing lapping abrasive blasting/blasting slide cutting
Unlike their water-based counterparts, pure oils cooling lubricants are sold and used as ready-to-use products. The water-based cooling lubricants are sold as concentrates. Before use, they are mixed with water to create a usable product and are known as aqueous cooling lubricants (mixture ratio of 1:5 to 1:100). A definition of terms for cooling lubricants can be found in Table 3.
65

IC-8 METAL EXTRACTION INDUSTRY, REFINING AND PROCESSING INDUSTRY
Table 3 Division of cooling lubricants according to DIN 51385 (German Institute for Standardization)
Name Abbreviation Definition
Cooling lubricant S substance used for cooling and lubrication during cutting and sometimes non-cutting forming of materials.
Pure oils cooling lubricant SN cooling lubricant which is not mixed with water for use.
Water-based cooling lubricant SE cooling lubricant which is mixed with water before use.
Emulsifiable cooling lubricant SEM water-based cooling lubricant which can form the discontinuous phase in an oil-in-water emulsion.
Water soluble cooling lubricant SES cooling lubricant which, if mixed in water produces a solution. In addition to true solutions, this includes solutions of association colloids, for example solutions of soaps.
Aqueous cooling lubricant SEW cooling lubricant mixed with water (water miscible cooling lubricant in usable form).
Cooling lubricant (oil in water) SEMW emulsifiable cooling lubricant mixed with water (usable form).
Cooling lubricant solution SESW water soluble cooling lubricant mixed with water (usable form).
3.1 CHEMICALS AND ADDITIVES
A cooling lubricant has to fill certain demands concerning material compatibility, foaming behaviour, bacteria resistance or corrosion inhibition. By using a cooling lubricant, tool wear should be reduced and the surface finish and dimensional stability of the work piece improved. Additives are used to improve among other things:
• lubricity, • wear resistance, • corrosion inhibition, • insusceptibility to aging, • foaming behaviour.
Cooling lubricants with specially defined attributes are used for the various cutting processes. Usually for cutting processes with high cutting load and low cutting speed which require a high lubricity, non-water miscible cooling lubricants are used. Since they have better cooling properties, water miscible cooling lubricants are used for those processes with a high cutting speed. A cooling lubricant can be made up of up to 25 separate components. A cooling lubricant may be considered to consist of primary and secondary substances (see Figure 6). Primary substances are components that are used deliberately while secondary are not.
66
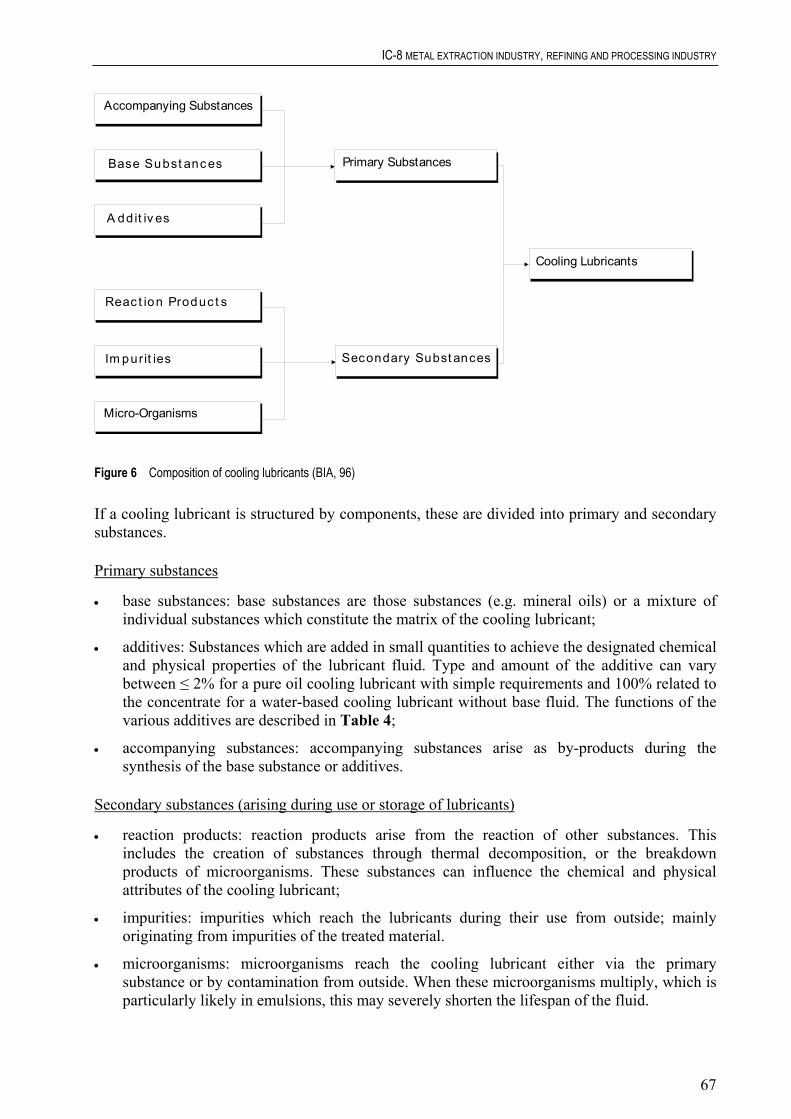
IC-8 METAL EXTRACTION INDUSTRY, REFINING AND PROCESSING INDUSTRY
Cooling Lubricants
Base Subst anc es
A ddit iv es
Reac t ion Produc t s
Im purit ies
Micro-Organisms
Secondary Subst ances
Primary Substances
Accompanying Substances
Figure 6 Composition of cooling lubricants (BIA, 96)
If a cooling lubricant is structured by components, these are divided into primary and secondary substances.
Primary substances
• base substances: base substances are those substances (e.g. mineral oils) or a mixture of individual substances which constitute the matrix of the cooling lubricant;
• additives: Substances which are added in small quantities to achieve the designated chemical and physical properties of the lubricant fluid. Type and amount of the additive can vary between ≤ 2% for a pure oil cooling lubricant with simple requirements and 100% related to the concentrate for a water-based cooling lubricant without base fluid. The functions of the various additives are described in Table 4;
• accompanying substances: accompanying substances arise as by-products during the synthesis of the base substance or additives.
Secondary substances (arising during use or storage of lubricants)
• reaction products: reaction products arise from the reaction of other substances. This includes the creation of substances through thermal decomposition, or the breakdown products of microorganisms. These substances can influence the chemical and physical attributes of the cooling lubricant;
• impurities: impurities which reach the lubricants during their use from outside; mainly originating from impurities of the treated material.
• microorganisms: microorganisms reach the cooling lubricant either via the primary substance or by contamination from outside. When these microorganisms multiply, which is particularly likely in emulsions, this may severely shorten the lifespan of the fluid.
67

IC-8 METAL EXTRACTION INDUSTRY, REFINING AND PROCESSING INDUSTRY
Impurities can enter the cooling lubricant in various ways. Impurities carried in on the work piece can be drawing oil, cooling lubricants used in previous operations and abraded particles from previous work processes, corrosion inhibitors, cleaning substances, form sand, cinder and rust sticking to the work piece or salt- and acid remains from mordant baths. The abraded metal particles created during the work, graphite (from grey iron casting) or abraded particles from grinding tools can be found as well as foreign oils, for example bed carriage oils from the central greasing unit, leakage oils from the machine hydraulic, corrosion inhibition oils and cutting oils. Further impurities are created through the chemical reactions between cooling lubricants and work piece or through microorganisms in aqueous cooling lubricants.
4 EMISSION SCENARIOS
During mechanical working procedures the cooling lubricant, which absorbs abrasion, chips and remains of oil from the surface of the work piece, is used in closed circuits. The central supplying system includes separators to remove bore chips, splints, shavings etc. and a unit for fine purification (band filter).
The circulation period of emulsions is not unlimited. The content of foreign matter gradually increases and microbial decomposition processes may occur, causing disagreeable smells or sedimentation of sludge in pipes etc. Single machines and small central suppliers contain up to 5 m³ of cooling lubricants while large central systems may have up to 100 m³ and more. Common time intervals between replacements range from 4 weeks (solitary supplied machines) to 2 years (central supply station).
Metal working operations may result in emissions to wastewater of:
• metals, • cooling lubricants, • washing and cleaning agents for machines, tools and work pieces.
Used cooling lubricants often contain metals as a result of their field of use. Rinsing processes and pre-purifying steps create larger amounts of wastewater. Tendencies to reduce these amounts can be observed in the metal processing industry as a result of the desire to reduce costs. Water saving rinsing systems (closed circuit systems) and regenerating systems (care of cooling lubricants) to increase the lifetime are used and solutions which were carried off are collected and reintroduced.
With regard to the release of lubricants cooling lubricant producers are as a majority non-discharger (about 80%). The wastewater from direct or indirect-dischargers is mainly a result of rinsing and cleaning processes during the production of water-based cooling lubricants (Schöneich et al., 1997). The wastewater produced here is disposed of as waste though.
68

IC-8 METAL EXTRACTION INDUSTRY, REFINING AND PROCESSING INDUSTRY
Table 4 Additives in cooling lubricants
Type of additive Purpose Function of additive Anti-wear agents lowering of excessive wear between
metal surfaces reaction with the metal surfaces produces layers which improve the bearing behaviour
Bactericides, biocides, fungicides increasing the emulsion lifetime, suppression of unwanted odours
prevention or deceleration of the growth of microorganisms (bacteria, fungi)
Corrosion inhibitors protection of surfaces containing iron against rust
polar molecules are adsorbed easily on metal surfaces and provide a protective barrier against water; neutralization of acids
Detergent reduction or prevention of sedimentation at high process temperatures
control of the creation of varnish and sludge through reaction with the oxidation products, which creates products either soluble or suspended in oil
Dispersant reduction or deceleration of the creation and sedimentation of sludge at low process temperatures
prevents the agglomeration and sedimentation of sludge by encasing the impurities in oil soluble molecules
Emulsifier creation of a stable emulsion of oil and water Extreme pressure additive prevention of micro welding between
metal surfaces at high pressures and temperatures acids, aminophosphates
reaction with the metal surface produces new compounds with a lower shear strength than the basic metal
Foam inhibitors prevention of the creation of stable foam lowers the interfacial surface tension by attacking the oil film on each bubble, this results in the creation of bigger bubbles which will then rise to the surface
Friction modifiers decreasing the friction between metal surfaces
high polar molecules are adsorbed by the metal surfaces and separate the surfaces; hard lubricants produce a friction decreasing surface film
Metal deactivators prevention of the catalytically influence on oxidation and corrosion
the metal surface adsorbs a protective film which prevents contact between the basic metal and the corrosive substances
Mist inhibitors prevents the tearing of the oil drops, less oil mist is created
Oxidation inhibitors, antiaging agents minimization of the creation of resin-, varnish-, sludge-, acid- and polymer like compounds
ends the oxidation chain reaction by reducing the amount of organic peroxides; prevents catalytically reactions; lowers the acid production by decreasing the oxygen absorption by the oil
Pour point depressor reduction of the pour point of the oil prevents agglomeration of the paraffin crystals Solubilizer emulsifying of oil in water lowers the interfacial surface tension by
adsorbing the emulsifier in the oil-water surface, this disperses the fluids into each other
Tackifier improvement of adhesion at the surface of the working piece
Viscosity index improvers decreasing the dependency of the viscosity on the temperature
polymer molecules are strongly twisted in cold oil (bad solvent) and take up a greater volume in warm oil (good solvent), resulting in a thickening of the oil
This emission scenario will treat the discharge of water-based and pure oils cooling lubricants into the environmental compartment water separately. The release into the aqueous environment of water-based (solutions, emulsions) and pure oils cooling lubricants during the processing stage and during waste disposal by special disposal treatment plants is regarded.
69

IC-8 METAL EXTRACTION INDUSTRY, REFINING AND PROCESSING INDUSTRY
This assessment of the environmental contamination from additives in cooling lubricants assumes that it takes place only during the life cycle step of waste/recovery.
4.1 DEFINITION OF THE POINT SOURCE
The inhomogeneous structure of this branch causes problems for the selection of a representative point source. There are both very large and very small companies that belong to different industrial areas.
Apart from uses in the metal processing industry, cooling lubricants are used in other industrial branches, e.g. electrical industry.
4.1.1 Point source for industrial use
During one analysis, the Umex (Schöneich et al., 1997) questioned 122 users of cooling lubricants. With regard to the release of used lubricants the majority of these companies are non-dischargers. 83% of the amount covered by the Umex is used by direct dischargers. The direct dischargers are usually large companies with their own private wastewater treatment plant. The majority of users uses 100 kg to 1 t CL/year. This amount is multiplied for water miscible cooling lubricants.
As an example for a point source, two companies are presented here:
• there are 25 cutting installations with a capacity of 100-200 m³. The throughput in a central supply unit is about 1 month. This means that within one month, the complete content has been exchanged once, this is also called diffuse overflow or spooning share. The spooning share results from the cleaning of the machines and the loss from adhesion to the shavings (70% of the spooned amount remains on the shavings). The cleaning water, the used cooling lubricants and also the dried, partially cleaned, contaminated shavings are transferred to the waste disposal (INFU, 1999);
• this company has cooling lubricant central supply units for drilling emulsions and for the grinding facility. The following processes are used: 35% gear tooth forming, 20% turning, drilling, milling, 20% grinding, 10% broaching, 10% shaving, 5% honing, lapping. The central supply unit for the drilling emulsions has a total capacity of 40 m³ with an emulsion lifetime of 2 years. The spooned amount is balanced. The central supply unit in the grinding facility has a capacity of 27 m³. In addition to this, 280 separate units are active, the lifetime in these solitary supplied machines is 4 weeks. The shavings with their coating of CL-emulsions are disposed directly without any special treatment. There are four washing facilities (Dopatka et al., 1992).
In both cases these are large companies and indirect dischargers which will be treated as possible emission sources in this ESD.
4.1.2 Point source for the life cycle step of waste/recovery
Due to the high number of industrial users of cooling lubricants, and since most of these are medium sized companies, it is assumed that the used cooling lubricants are disposed of as waste. The disposal is done by an external treatment plant. This will be used as the point source for the life cycle step waste/recovery because the typical cutting forming companies are non-
70

IC-8 METAL EXTRACTION INDUSTRY, REFINING AND PROCESSING INDUSTRY
dischargers. They do not have an inner company water treatment plant and mobile treatment installations are rare at best.
This life cycle step assumes a waste treatment plant with a capacity of 45,000 t treated waste per year. Exception: The waste is made up of 50% separate able emulsions and 50% other waste. The substances used for the separation of the emulsions are used alkaline solutions and acids (for example iron mordant). This process is currently widely used in the waste treatment of cooling lubricants, especially for larger amounts. The resulting oil sludge contains hydroxide though and cannot be stored in regular dumps.
The drawn off oil has a remaining water content of 40% and is then decomposed by thermal degradation or disposed of in special refuse incinerators. This company is an indirect discharger with a processing capacity of 200 m³/d for the cooling lubricants. This discharge is comparable to about 20% of the specific related wastewater treatment plant capacity (10% of a standard EU wastewater treatment plant).
The treated volume of aqueous cooling lubricants is assumed by the market share and the capacities of the point sources of cooling lubricant emulsions. So the resulting capacity for the release estimation amounts to 40 m³/d, representing a typical site.
4.2 EMISSION BY WATER-BASED COOLING LUBRICANTS
4.2.1 Emission of cooling lubricant emulsions
Water-based cooling lubricants are concentrates, regardless of whether they are cooling lubricant emulsions or -solutions. Before use they are mixed with water. During the dilution of the usable cooling lubricant, a contamination of the compartment water can take place during the cleaning of the mixing containers.
Discharges into the water compartment can occur during:
• the cleaning of mixing containers used for diluting the cooling lubricant emulsion or –solution to the working concentration;
• the cleaning of the worked part (the washing water may also contain cleaning agents and surfactants which are used to improve the cleaning effect. Larger companies usually use cleaning water in a circulating system, disposing it as waste, once it has reached a certain saturation);
• the cleaning of the facility (usually the company has at least an oil separator with coalescence step).
71

IC-8 METAL EXTRACTION INDUSTRY, REFINING AND PROCESSING INDUSTRY
Cooling Lubricant
Emulsion
Metal Working Washing Product
Centrifugal Chip Seperator
Lubricant Emulsion Work up
Clean Lubricant Emulsion
Washing-Emulsion Work up
SeperatedWashing-Emulsion
Washing-Emulsion
Draining
Chip-Waste
WA S TE
Water Water
Work Piece Emulsified Cooling LubricantWashing Emulsion Used Cooling Lubricant/ Washing Emulsion Waste
Corrosion Protection
Cleaner
Figure 7 Substance flows during cutting processes with water-based cooling lubricants
4.2.1.1 Emission during industrial use
A cooling lubricant emulsion contains about 95% water. Spillage and carry off loss can amount to 100% of the bath volume in one month. This is called process losses. The process losses for water-based cooling lubricants is not as high as for their pure oils counterparts. Large wastewater amounts are a result of rinsing and pre-cleaning steps.
The internal disposal of used emulsions via the wastewater is not allowed, therefore all used cooling lubricants as well as the rinsing water are disposed of as waste. For this ESD that means that the discharge into the compartment water takes place during the life cycle step waste/recovery.
4.2.1.2 Emission during waste/recovery treatment
A CL emulsion which is to be disposed contains about 90% water, in addition to the CL concentrate, impurities and system cleaning agents will be found. Sample values for used cooling lubricants as relevant to wastewater are shown in Table 5 (Baumann et al., 1996). Spent emulsions are complex mixtures due to the formula of the concentrate and the various impurities introduced during the processes.
72

IC-8 METAL EXTRACTION INDUSTRY, REFINING AND PROCESSING INDUSTRY
Table 5 Composition of spent emulsions
Parameter Average value of the emulsion
pH value 7-10
Oil content 2-20%
Solid material content 20-100 mg/l
Metals up to 100 mg/l
Nitrite up to 150 mg/l
COD 5,000-20,000 mg/l
When processing the old emulsions, the water and oil phase are to be completely separated.
The emulsion breaking process consists of the following steps (Dopatka et al., 1992):
• separation of the unemulsifiered foreign oils through skimming, possibly with support (for example flotation),
• separation of the solid materials through filtration and/or settling in a settling tank, • emulsion breaking, • treatment of the separated water, removal of dissolved metals and organic substances
(COD), neutralization, • possibly further treatment of the separated oil phase to reduce the water content.
Processes used in the treatment of used emulsions are, among others, chemical separation processes (organic, inorganic), membrane processes, ultra filtration, reverse osmosis, evaporation processes, electrochemical processes, flotation, coagulation and adsorption. The washing emulsions are disposed of with the water miscible cooling lubricants. The old oils produced in the circulating system are disposed of directly.
Water-based cooling lubricants are often treated with ultra filtration or emulsion splitting. The remaining CL content is then below 10 mg/l. The remaining water content in the oil phase is about 40%.
Only large companies have disposal and recycling systems for used cooling lubricants. The companies dispose off the wastewater as waste, therefore the greatest part of substances from cooling lubricants reaches the wastewater during reprocessing and disposal in the treatment plants.
73

IC-8 METAL EXTRACTION INDUSTRY, REFINING AND PROCESSING INDUSTRY
Water-based Cooling Lubricants
Ultra-Filtration
Other Seperation Process
Disposal
Reprocessing
Incineration
Sewage Water
Waste
Retentate
p e r m e a t e
Oily Phase
Water Phase
Figure 8 Disposal paths of water-based cooling lubricants
Figure 8 shows the disposal paths of water-based cooling lubricants. The resulting permeate or the separated watery phase are to be disposed of according to the wastewater disposal regulations (76/464/EWG, 91/271/EWG).
The discharge into the environmental compartment water takes place after emulsion breaking. The oil phase is turned over to the thermal or substance exploitation (75/439/EEC).
During incineration in special waste disposal incinerators, no release into the compartment water takes place. The reprocessing of the used cooling lubricants of high quality, like the production, also causes no contamination of the compartment water (Baumann et al., 1996).
The estimation of the release of a cooling lubricant additive in the watery phase is done with the aid of the Nernst distribution law. Therefore to determine the release of a substance or the appropriate cooling lubricant additive, specific substance data have to be available. In addition to this, the capacity of the point source is required.
If only a fraction of whole amount to be disposed of containing the substance, the default value f=1 can be lowered if appropriate information is provided by the notifier or the industry about the relevance of the substance.
If a chemical or physical treatment takes place the fraction of elimination can be considered with the concentration of the chemical in the untreated sewage water phase:
1
Vwater+
=mVprod and ( )
( ) ( )elimOW
emul FKm
mfCchem −⋅+⋅
+⋅⋅= 1
11
waterC
the release is calculated as follows:
( ) ( elimOW
prodemul FKm
fVCchem −⋅+⋅
⋅⋅= 11
Elocalwater ) (1)
74

IC-8 METAL EXTRACTION INDUSTRY, REFINING AND PROCESSING INDUSTRY
Explanations of symbols
Input
Explanation Symbol Value Units 1) Origin
Concentration of the chemical in the untreated sewage water phase of the lubricant
Cwater [mg.l-1]
Concentration of the chemical in the cooling lubricant Cchememul [kg.m-3] A, D from notifier or industry see Section 4.4
Treated volume of cooling lubricant per day (average) Vprod 200 [m³.d-1] D see Section 4.1.2 Volume of the treated water phase Vwater [m³.d-1] Volume ratio concentrate / water phase m 1:20 - A from notifier or industry
see Table 8 Partition coefficient between n-octanol and water (KOW=10log KOW)
KOW - A from notifier or industry
Fraction of elimination of the chemical during physical or chemical treatment
Felim 0 - A from notifier or industry
Factor of relevance f 1 - A from notifier or industry Output
Emission per day Elocalwater [kg.d-1] O
1) A = based on information from notifier or industry D = default O = Output
4.2.2 Aqueous cooling lubricant solutions
4.2.2.1 Emission during industrial use
Cooling lubricant solutions are used mainly for grinding processes. The oil content is about 2 to 3%. Some materials can be removed with filters, oil skimmers or decanters (Dopatka et al., 1992). During the processing stage, no discharge into the compartment water takes place. The used solutions are disposed of as waste.
4.2.2.2 Emission during waste/recovery treatment
For water-soluble cooling lubricants the concentration of the chemical in the untreated water phase of the lubricant is calculated from the lubricant to water mixture ratio. Once the contamination resulting from the specific process has been removed from the synthetic cooling lubricant solution, the cooling lubricant solutions are treated with reverse osmosis or evaporation. A mixing with cooling lubricant emulsions results in an inseparability of the dissolved oils. During the separation process, the oil part remains in the watery phase, leading to a high percentage of leftover oil in the water phase. Due to the high COD content, a discharge into the compartment water is therefore impossible.
75

IC-8 METAL EXTRACTION INDUSTRY, REFINING AND PROCESSING INDUSTRY
The release is calculated as follows:
( ) fFmVCchemElocal elimwateraqwater ⋅−⋅⋅⋅= 1 (2)
Parameters
Input
Explanation Symbol Value Units 1) Origin
Concentration of the chemical in the aqueous cooling lubricant
Cchemaq [kg.m-3] A, D from notifier or industry see Section 4.4
Treated volume Vwater 40 [m³.d-1] D see Section 4.1.2 Volume ratio oil phase/ water phase m 1:20 [-] A from notifier or industry Fraction of elimination of the chemical during physical or chemical treatment
Felim 0.8 [-] A from notifier or industry
Factor of relevance f 1 [-] A from notifier or industry Output
Emission per day Elocalwater [kg.d-1] O
1) A = based on information from notifier or industry D = default O = Output
4.3 EMISSION BY PURE OILS COOLING LUBRICANTS
4.3.1 Emission during industrial use
A discharge into the environmental compartment water is possible over the cleaning processes or carry-over effects. Losses due to misting and spilling with subsequent cleaning and discharge to the sewer are not considered.
Here too cooling lubricants enter the wastewater during cleaning of the worked pieces.
The point source used in this ESD is a large company though, in which the circulating flow for washing water systems is standard technology. The washing water is processed, the unusable part disposed of as waste.
The used cooling lubricants are disposed of. The high carry off loss over the work piece or the chips is a result of the high viscosity of the CL oils. By dripping off, centrifuging and blowing off the chips with a subsequent reintroduction of the excess oil, this spooning loss is decreased.
76

IC-8 METAL EXTRACTION INDUSTRY, REFINING AND PROCESSING INDUSTRY
Cooling Lubricant
Cooling Lubricant
Metal Working Clearance, Conservation
Product
Centrifugal Chip Seperator
Lubricant Work up
Clean Lubricant
Chip-Waste
WA S TE
Work Piece
Cooling Lubricant
Used Cooling Lubricant
Waste
Drain
Figure 9 Substance flows for cutting processes with pure oils cooling lubricants
4.3.2 Emission during waste/recovery treatment
Due to the stability of the CL oils, the lifetimes or in large facilities the turnover are significantly longer. The decision about reuse or disposal depends on the degree of contamination of the oil. High quality cooling lubricants without water content can be reprocessed, oils with a high heating value and limited pollutant content are turned over to the thermal exploitation. Low quality, highly polluted oil mixtures are disposed of in special refuse incinerators. None of these options results in a discharge into the compartment water.
Pure oils Cooling Lubricants
Disposal
Reprocessing
IncinerationWaste
Figure 10 Disposal paths of pure oils cooling lubricants
77

IC-8 METAL EXTRACTION INDUSTRY, REFINING AND PROCESSING INDUSTRY
4.4 RELEASE DETERMINATION PARAMETER
To calculate the emission, the concentration of the substance assessed in the cooling lubricant is required in equation 1 and 2. If the concentration has not been provided by the notifier or industry, it can be taken from Tables 6 and 7. Table 8 is for the determination of m. By assuming a density RHOform=1 kg.l-1 of the ready to use water-based cooling lubricant and by assuming that 1 kg of lubricant contains 0.01.Qsub [kg] of additive and (1-0.01.Qsub)/RHOform [l] of lubricant base, CCLE or CACL can be calculated as follows:
( )sub
formsubaqemul Q
RHOQCchemCchem
⋅−
⋅⋅=
01,0101,0
or
or in recommended units:
( )sub
formsubaqemul Q
RHOQCchemCchem
⋅−
⋅⋅=
01,0110
or [kg.m-3] (3)
Table 6 Composition of selected cooling lubricants (substance groups) (Baumann et al., 1996)
Traditional emulsifiable cooling lubricant (SEM) Semi synthetic emulsifiable cooling lubricant (SEM) Qsub
wt-% Qsub
wt-% Base oil about 60 base oil about 30 Emulsifier (anionic) 15-20 emulsifier (not ionic) 10-15 Solubilizer about 5 solubilizer about 5 Friction modifier 0-5 friction modifier 5-10 Aliphatic acids about 5 corrosion inhibitor, bacteriostatic agent 20-25 Corrosion protection agent about 5 boric acid (biocide/emulsifier) 0-3 Neutralization agent 0-3 carbon acid (emulsifier, corrosion
protection, cutting faciliation substance) 5-15
bactericide about 4 corrosion protection 0-10 fungicide 0-1 bactericide 0-5 fungicide 0-1
water 0-10 Aqueous cooling lubricant (mineral oil free) (SES) copper corrosive pure oils cooling lubricant (SN) Qsub
wt-% Qsub
wt-% Corrosion protection 20-40 base oil 87-95 Neutralization agent (soaping) 15-25 sulphur about 0,5 Solubilizer 10-20 sulphurized ester or sulphurized olefin 3-6 Friction modifier 5-10 organic phosphor compounds and calcium
sulfonate 0-3
Water 5-30 carbon acid ester (anion active surfactant) 0-3 Biocide 3-4 mist inhibiting agent 0,5-1 Fungicide 0-1 antioxidant about 0,2
78

IC-8 METAL EXTRACTION INDUSTRY, REFINING AND PROCESSING INDUSTRY
Table 7 Concentration percentages by additive class
Class Qsub wt-%
Water miscible CL Non-water miscible CL
Anionic surfactants 1-25 x x
Anti-wear agents up to 5 x x
Biocides 2-5 x
Complex builders 5 x
Corrosion inhibitors 1-20 x x
Detergents up to 3 x
Dispersants up to 3 x
Emulsifier up to 20 x
Extreme pressure additive up to 50 x x
Foam inhibitors 0,1-0,3 x x
Friction modifiers 10-100 x x
Fungicides 0,5 x
Lubricant base 0-100 x x
Metal deactivators up to 1 x x
Mist inhibitors up to 0,5 x
Neutralization agent 5-25 x
Non-ionic surfactants 10 x
Oxidation inhibitors up to 0,3
Pour point depressor up to 5 x
Solubilizer 5-10 (up to 50) x
tackifier 5 x
Viscosity index improvers up to 5 x
Table 8 Mixture elations of cooling lubricant emulsions for different processes
Cutting process Concentration [%] Water: concentrate Broaching 10 - 20 1:10 - 1:5
Thread cutting 5 - 10 1:20 - 1:10
Deep hole drilling 10 - 20 1:10 - 1:5
Parting-off 5 - 10 1:20 - 1:10
Milling, cylindrical milling 5 - 10 1:20 - 1:10
Turning, drilling, automation work 3 - 10 1:33 - 1:10
Sawing 5 - 20 1:20 - 1:5
Tool grinding 3 - 6 1:33 - 1:17
Cylindrical grinding 2 - 5 1:50 - 1:20
Centre less grinding 3 - 6 1:33 - 1:17
Surface grinding 2 - 5 1:50 - 1:20
79
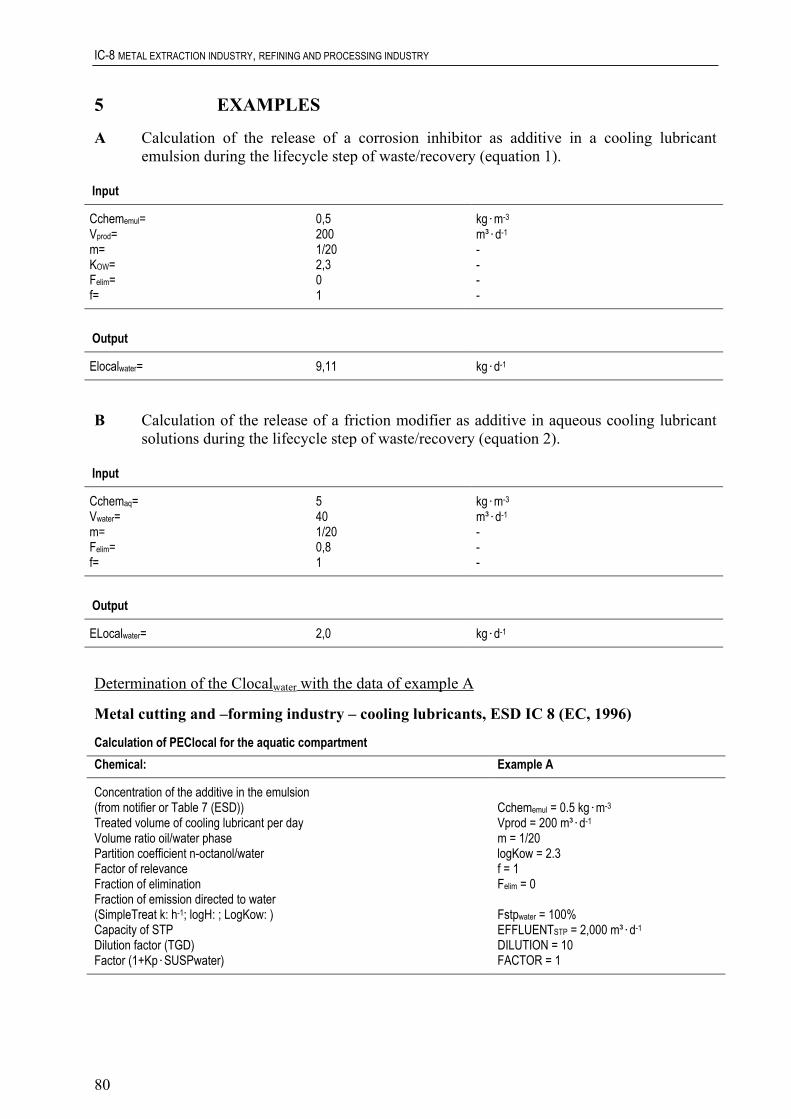
IC-8 METAL EXTRACTION INDUSTRY, REFINING AND PROCESSING INDUSTRY
5 EXAMPLES
A Calculation of the release of a corrosion inhibitor as additive in a cooling lubricant emulsion during the lifecycle step of waste/recovery (equation 1).
Input
Cchememul= 0,5 kg.m-3 Vprod= 200 m³.d-1 m= 1/20 - KOW= 2,3 - Felim= 0 - f= 1 - Output
Elocalwater= 9,11 kg.d-1
B Calculation of the release of a friction modifier as additive in aqueous cooling lubricant solutions during the lifecycle step of waste/recovery (equation 2).
Input
Cchemaq= 5 kg.m-3 Vwater= 40 m³.d-1 m= 1/20 - Felim= 0,8 - f= 1 - Output
ELocalwater= 2,0 kg.d-1
Determination of the Clocalwater with the data of example A
Metal cutting and –forming industry – cooling lubricants, ESD IC 8 (EC, 1996)
Calculation of PEClocal for the aquatic compartment Chemical: Example A
Concentration of the additive in the emulsion (from notifier or Table 7 (ESD)) Cchememul = 0.5 kg.m-3 Treated volume of cooling lubricant per day Vprod = 200 m³.d-1 Volume ratio oil/water phase m = 1/20 Partition coefficient n-octanol/water logKow = 2.3 Factor of relevance f = 1 Fraction of elimination Felim = 0
Fraction of emission directed to water (SimpleTreat k: h-1; logH: ; LogKow: ) Fstpwater = 100% Capacity of STP EFFLUENTSTP = 2,000 m³.d-1 Dilution factor (TGD) DILUTION = 10 Factor (1+Kp.SUSPwater) FACTOR = 1
80

IC-8 METAL EXTRACTION INDUSTRY, REFINING AND PROCESSING INDUSTRY
Concentration in water phase after emulsion breaking:
mFmf
CchemC Kowe
emulwater •+−•+•
•= loglim
101)1()1(
Cwater = 47.8 mg.l-1
Emission per day:
mFfV
CchemElocal Koweprod
emulwater •+
−•••= log
lim
101)1(
Elocalwater = 9.11 kg.d-1
Influent concentration:
STP
water
EFFLUENTElocal
Clocal =inf
Clocalinf = 4.56 mg.l-1
Effluent concentration:
watereff FstpClocalClocal •= inf Clocaleff = 4.56 mg.l-1
Concentration in surface water:
DILUTIONFACTORClocal
Clocal effwater •
= Clocalwater = 455.5 µg.l-1
PEClocalwater=Clocalwater if PECregionalwater=0
6 REFERENCES Baumann W, Herberg-Liedtke B (1996). Chemikalien in der Metallbearbeitung - Daten und Fakten zum Umweltschutz. Springer Verlag.
BIA (1996). BIA-Report Kühlschmierstoffe; Hauptverband der gewerblichen Berufsgenossenschaften (HVBG).
EC (1996). Technical Guidance Document on Risk Assessment in support of Commission Directive 93/67/EEC on Risk assessment for new notified substances and Commission Regulation (EC) 1488/94 on Risk assessment for existing substances. Parts 1-4. European Commission (EC), Office for Official Publications of the EC, Luxembourg.
Schöneich E, Noack J, Steffen J (1997). Examination of Wastewater Discharges: Statistics of Important Industrial and Commercial Categories for Assesment of Environmental Release of Chemicals; Part 2: Laquers and Varnishes, Cooling Lubricants. Umweltbundesamt (UBA), Report No. UBA-FB 106 04 144/02.
Dopatka J, Obst M, Siegfried F (1992). Vermeidung von Abfällen durch abfallarme Produktionsverfahren - Kühlschmierstoffe in Großbetrieben. ABAG Baden-Württemberg, Germany.
VKIS (1998). Verbraucherkreis Industrieschmierstoffe (VKIS) information.
INFU (1999). University of Dortmund, Information of Institute of Environmental Research (INFU), Dortmund, Germany.
81

IC-8 METAL EXTRACTION INDUSTRY, REFINING AND PROCESSING INDUSTRY
7 ABBREVIATIONS CL Cooling Lubricant
COD Chemical Oxygen Demand
ESD Emission Scenario Document
EU European Union
IC Industrial Category
PEClocal Predicted Environmental Concentration (at the local stage)
S Cooling Lubricant
SE Water miscible cooling lubricant
SEM Emulsifiable cooling lubricant
SEMW Cooling lubricant (oil in water)
SES Water soluble cooling lubricant
SESW Cooling lubricant solution
SEW Aqueous cooling lubricant
SN Non-water miscible cooling lubricant
STP Sewage Treatment Plant
TGD Technical Guidance Document
UBA Umweltbundesamt
UC Use Category
82

IC-10 PHOTOGRAPHIC INDUSTRY
ASSESSMENT OF THE ENVIRONMENTAL RELEASE OF PHOTOCHEMICALS
83

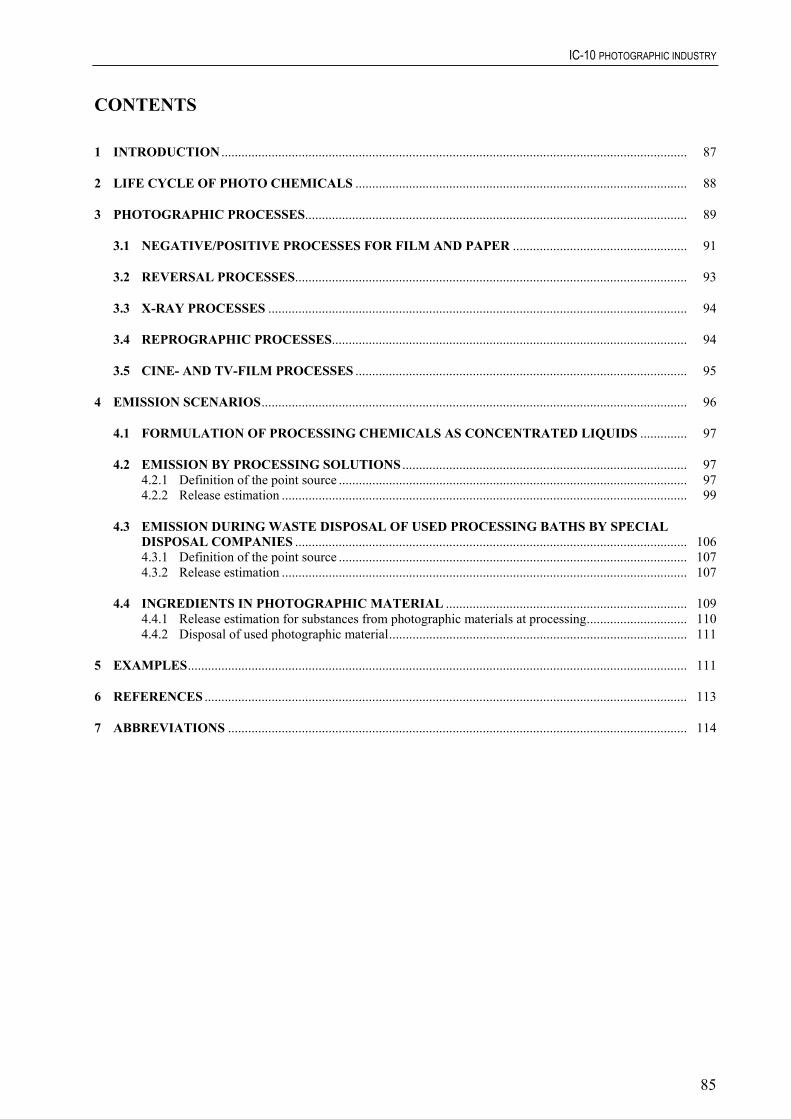
IC-10 PHOTOGRAPHIC INDUSTRY
CONTENTS
1 INTRODUCTION ........................................................................................................................................... 87
2 LIFE CYCLE OF PHOTO CHEMICALS ................................................................................................... 88
3 PHOTOGRAPHIC PROCESSES.................................................................................................................. 89
3.1 NEGATIVE/POSITIVE PROCESSES FOR FILM AND PAPER .................................................... 91
3.2 REVERSAL PROCESSES..................................................................................................................... 93
3.3 X-RAY PROCESSES ............................................................................................................................. 94
3.4 REPROGRAPHIC PROCESSES.......................................................................................................... 94
3.5 CINE- AND TV-FILM PROCESSES ................................................................................................... 95
4 EMISSION SCENARIOS............................................................................................................................... 96
4.1 FORMULATION OF PROCESSING CHEMICALS AS CONCENTRATED LIQUIDS .............. 97
4.2 EMISSION BY PROCESSING SOLUTIONS ..................................................................................... 97 4.2.1 Definition of the point source ........................................................................................................ 97 4.2.2 Release estimation ......................................................................................................................... 99
4.3 EMISSION DURING WASTE DISPOSAL OF USED PROCESSING BATHS BY SPECIAL DISPOSAL COMPANIES ..................................................................................................................... 106 4.3.1 Definition of the point source ........................................................................................................ 107 4.3.2 Release estimation ......................................................................................................................... 107
4.4 INGREDIENTS IN PHOTOGRAPHIC MATERIAL ........................................................................ 109 4.4.1 Release estimation for substances from photographic materials at processing.............................. 110 4.4.2 Disposal of used photographic material......................................................................................... 111
5 EXAMPLES..................................................................................................................................................... 111
6 REFERENCES ................................................................................................................................................ 113
7 ABBREVIATIONS ......................................................................................................................................... 114
85


IC-10 PHOTOGRAPHIC INDUSTRY
1 INTRODUCTION
This document is an attempt to estimate the exposure concentration (release) of photo chemicals (IC-10; UC-42) in the compartment water. This is required for a step-by-step assessment of the environmental risk. A prediction of the environmental release in the aqueous phase is given under realistic worst-case conditions. With the aid of the determined release Elocalwater (carriage in kg.d-1) it is possible to estimate the PEClocalwater (Figure 1).
There are two main applications for photo chemicals:
• ingredient in a processing solution (developer, fixer, bleach, bleach-fixer), • ingredient in photographic material (film, paper).
The relevant photographic processes, the X-ray-process and the reprographic process are part of this emission scenario document.
The chemicals used in the photographic processes may enter the environment via the product, unused material or wastes. In the case of photographic processing solutions, emission occurs from waste disposal of the products because most substances except for silver are discharged into the compartment water. To determine the PEClocalwater the process corresponding representative emission source is considered.
Production
Formulat ion Processing
Waste Recovery
ElocalWater [kg d-1] .
.
Cinfl [kg m-3]
Ceff l [kg m-3]
localw ater
Q = 2000 m3 d-1
STPP
Drain
AquaticCompartmentD = 10
PEC
Cinfl: influent concentration Ceffl: effluent concentration EFFLUENTstp: volume flow of STP P: elimination in STP D: dilution factor
Figure 1 Scenario for the determination of the PEClocalwater
87

IC-10 PHOTOGRAPHIC INDUSTRY
2 LIFE CYCLE OF PHOTO CHEMICALS
Emissions into the compartment water may occur at any phase of the life cycle of a photochemical. This life cycle starts with the production and the formulation. The next step is the processing stage. The life cycle of a chemical substance ends with the recovery and eventually in the wastewater or waste.
The release of chemicals into the environment from private sources is not relevant, therefore the ESD will discuss only the industrial use stage (processing).
The use of the chemical within the relevant process is observed, as well as the consumption and the resulting emissions into the compartment water. The compartment water is also contaminated by waste, waste disposal procedures and the recovery. These emissions are also taken into account.
For releases during syntheses of chemicals used in photographic industry, see specific scenario for production. For releases during their formulation, see IC-10 in the A- and B-tables, Appendix I, Chapter 3 TGD. Also for the environmental targets “air” and “soil” at all stages of the life cycle the reader is referred to IC-10 in the A- and B-tables, Appendix I, Chapter 3 TGD.
Raw Material
Production A/B-Tables TGD
Formulat ion
Processing
Waste/Recovery
ESD-IC 10sect ion 4.2sect ion 4.4
ESD-IC 10sect ion 4.1
ESD-IC 10sect ion 4.3
Figure 2 Stages in the life cycle of photo chemicals in which emissions to the compartment water may occur
88

IC-10 PHOTOGRAPHIC INDUSTRY
3 PHOTOGRAPHIC PROCESSES
Generally exposed film material contains image information transmitted through the light effect to the silver halide crystals finely dispersed in the emulsion layer. There are two basic types of photo processing’s by which the by far greatest part of photographic material is being developed:
• negative/positive processes, • reversal processes.
These processes are used in black-and-white (monochrome) and in colour (polychrome) photography. The processes are categorized by a classification code system according to Kodak abbreviations or, in the case of monochrome photography, to the author.
colour reversal paper2 Mio m²/y
colour negative film34 Mio m²/y
b/w negative film1,5 Mio m²/y
b/w reprographic115 Mio m²/y
cine- and television film
12,7 Mio m²/y
b/w X-ray78 Mio m²/y
b/w positive paper10 Mio m²/y
colour reversal film2 Mio m²/y
colour positive paper383 Mio m²/y
Figure 3 Market shares of the standard processes in the EU
89

IC-10 PHOTOGRAPHIC INDUSTRY
Belgium
10
Denmark
Finland
10
Austria16
Sweden18
10
Greece
Germany
163
25
Netherlands
130,5
Luxembourg
France125
78Italy
PortugalSpain
3610
UK7 118
Ireland
EU15100
Mio sqm/y
Figure 4 Quantity of processed photographic material in European countries
90
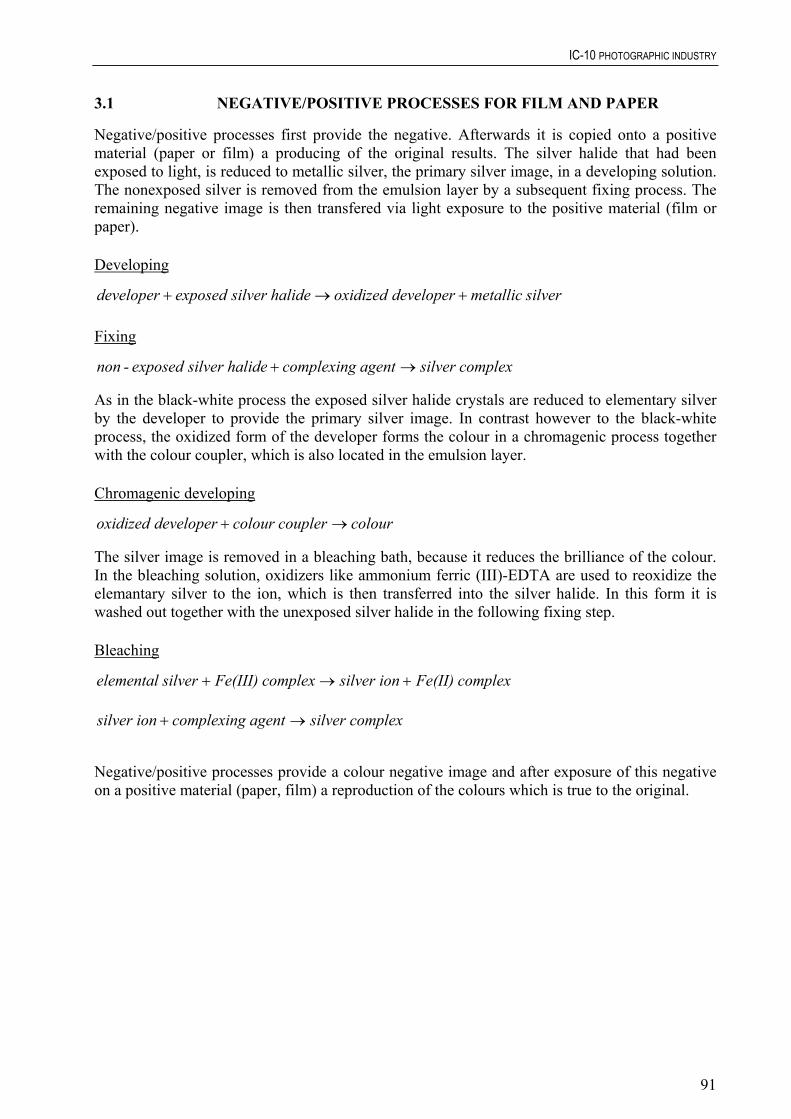
IC-10 PHOTOGRAPHIC INDUSTRY
3.1 NEGATIVE/POSITIVE PROCESSES FOR FILM AND PAPER
Negative/positive processes first provide the negative. Afterwards it is copied onto a positive material (paper or film) a producing of the original results. The silver halide that had been exposed to light, is reduced to metallic silver, the primary silver image, in a developing solution. The nonexposed silver is removed from the emulsion layer by a subsequent fixing process. The remaining negative image is then transfered via light exposure to the positive material (film or paper).
Developing
silvermetallicdeveloper oxidizedhalide silverexposeddeveloper +→+
Fixing
complex silveragent complexinghalide silverexposed-non →+
As in the black-white process the exposed silver halide crystals are reduced to elementary silver by the developer to provide the primary silver image. In contrast however to the black-white process, the oxidized form of the developer forms the colour in a chromagenic process together with the colour coupler, which is also located in the emulsion layer.
Chromagenic developing
colourcoupler colourdeveloper oxidized →+
The silver image is removed in a bleaching bath, because it reduces the brilliance of the colour. In the bleaching solution, oxidizers like ammonium ferric (III)-EDTA are used to reoxidize the elemantary silver to the ion, which is then transferred into the silver halide. In this form it is washed out together with the unexposed silver halide in the following fixing step.
Bleaching
elemental silver Fe(III) complex silver ion Fe(II) complex+ → + silver ion complexing agent silver complex+ →
Negative/positive processes provide a colour negative image and after exposure of this negative on a positive material (paper, film) a reproduction of the colours which is true to the original.
91
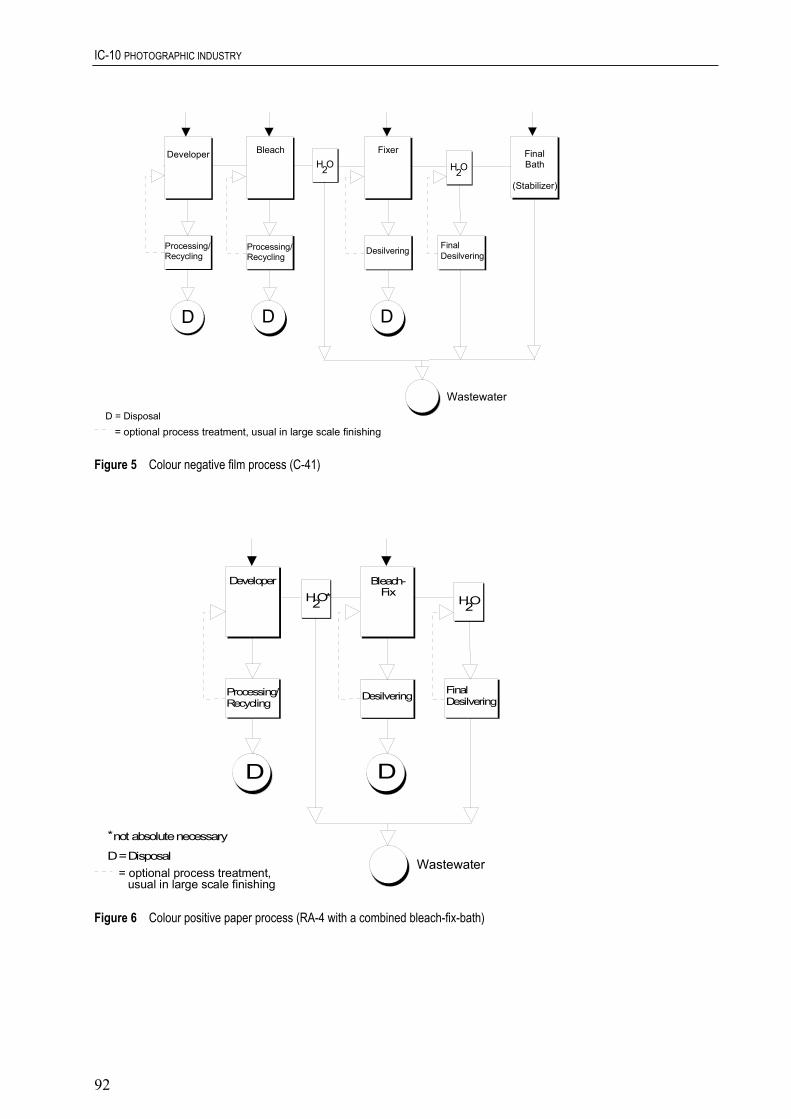
IC-10 PHOTOGRAPHIC INDUSTRY
Developer
R H O2
Bleach Fixer
D D
H O2
D = Disposal
Wastewater
Processing/Recycling
Processing/Recycling
FinalDesilvering
D
Desilvering
FinalBath
(Stabilizer)
= optional process treatment, usual in large scale finishing Figure 5 Colour negative film process (C-41)
D
Desilvering
R H O2
Bleach-Fix
D
H O*2
Wastewater
Processing/Recycling
FinalDesilvering
Developer
not absolute necessary*
D = Disposal = optional process treatment,
usual in large scale finishing Figure 6 Colour positive paper process (RA-4 with a combined bleach-fix-bath)
92

IC-10 PHOTOGRAPHIC INDUSTRY
Developer
D
Desilvering
R H O2
Stop-Bath*
Bleach Fixer
D D
H O2 H O2
not absolute necessary*
D = Disposal Wastewater
Processing/Recycling
Processing/Recycling
FinalDesilvering
= optional process treatment, usual in large scale finishing
Figure 7 Colour positive paper process (RA-4 with bleach- and fixer-bath)
3.2 REVERSAL PROCESSES
The reversal processes provide the positive image in a direct manner. In the case of the colour reverse process a conventional black-white development is performed first, resulting in a silver negative image. The silver halide which is unexposed during first exposure is then either subjected to a reversal second exposure or a chemical treatment in a reversal bath. Thus, in the same material a next following colour developing process provides a colour-positive. Finally the silver is removed in the bleaching and fixing solutions.
FirstDeveloper
H O2
D
R H O2
ReversalBath
ColorDeveloper
Condi-tioner(Pre-
Bleach)
Bleach Fixer FinalBath
D
D = DisposalWastewater
D Recycling/Processing
D
Desilvering
D
Recycling/Processing
FinalDesilvering
= optional process treatment, usual in large scale finishing Figure 8 Colour reversal film process (E-6 )
93

IC-10 PHOTOGRAPHIC INDUSTRY
FirstDeveloper
H O2
D D
Desilvering
R H O2
Color-Developer
Bleach Fixer*
D D
H O2 H O2
Partly bleach-fix bath*
D = Disposal
Wastewater
Processing/Recycling
Processing/Recycling
FinalDesilvering
= optional process treatment, usual in large scale finishing Figure 9 Colour reversal paper process (R-3)
3.3 X-RAY PROCESSES
The X-ray processes provide the negative image. Basically the process is a conventional black/white negative process. Since X-ray images require a strong contrast and quick availability of the pictures, the chemicals used in the processing solutions are present a higher concentration.
The basic reasons for this high consumption of chemicals are the double-sided film emulsion layer, high blackening and necessity for a fast availability of the pictures. The digital technology which is expected to see increased use in the X-ray field in the next years will decrease these emissions. This is a distinct advantage of the new process. Nevertheless, the classical X-ray technology will never be completely replaced, since the quality of the images in the new process is not as good as with the classical method, and the high cost of the conversion to the new technology also poses an obstacle.
3.4 REPROGRAPHIC PROCESSES
The classic layout and reproduction techniques use photographic methods. In photo setting, black/white films are created which are used to produce copies for the printing process. In reproduction techniques, black/white copies are used as well as colour copies. Depending on the printing process used later, line-, screen- or half-tone reproductions can be created here. When working with couloured pictures, colour filters are used to create a colour separation for each of the basic colours. During this process, the coloured original is photographed onto a black/white film through this filter. The resulting colour separations yellow, cyan and magenta as well as black are then developed into separate printing copies. With the development of modern computer technology, it is now possible, to process text and image information digitally, and print it directly onto photosensitive material using laser technology.
94

IC-10 PHOTOGRAPHIC INDUSTRY
Deve-loper
FixerH O2
D
Desilvering
D
H O*
D = Disposal
Wastewater
FinalDesilvering
*unusual in reprographic- and X-ray processes
= optional process treatment, usual in large scale finishing Figure 10 X-ray-, black and white-, reprographic film and paper processes
3.5 CINE- AND TV-FILM PROCESSES
H O2H O2
Desilvering
H O2H O2 H O2H O2
PrimaryBath
Color-Developer
Stabilizer Bleach Fixer Stabilizer
Wastewater
D D D
D
DProcessing/Recycling
D
D = Disposal
= optional process treatment, usual in large scale finishing Figure 11 Cine and TV-film negative process (ECN-2)
95

IC-10 PHOTOGRAPHIC INDUSTRY
H O2H O2 H O2H O2 H O2H O2
De-silvering
PrimaryBath
Colour-Developer
StopBath
Fixer I BleachH O2H O2 H O2H O2
StabilizerFixer II
De-silvering
Wastewater
Processing/RecyclingD D D
D D D
D
D = Disposal
= optional process treatment, usual in large scale finishing Figure 12 Cine and TV-film positive process (ECP-2)
H O2H O2 H O2H O2 H O2H O2
PrimaryBath
Developer BleachBath
Fixer
De-silvering
Color-Developer
Wastewater
D D
D
Recycling/Processing
D
Recycling/Processing
D
D = Disposal = optional process treatment,
usual in large scale finishing Figure 13 Cine and TV-film reversal process (VNF-1)
4 EMISSION SCENARIOS
The various emission sources of the photographic industry and the generic scenarios are described below. The following emissions have been taken into account in this ESD for the compartment water:
• emissions during formulation of processing chemicals as concentrated liquids (formulation stage of the lifecycle);
• emissions from the processes used in the photographic industry (processing stage of the lifecycle);
• emissions during waste disposal of used processing baths by specialized waste processing companies (waste stage of the lifecycle).
96
IC-10 PHOTOGRAPHIC INDUSTRY
4.1 FORMULATION OF PROCESSING CHEMICALS AS CONCENTRATED LIQUIDS
Concentrated solutions of photo chemicals are made by dissolving and mixing the individual substance with other ingredients in water or in a highly water soluble solvent. Emissions may occur:
• to the drain: a small amount of the substance enters the drain when the mixing equipment is cleaned with water;
• as liquid waste: defective batches or batches out of specification .
The emissions of the formulation stage cannot be estimated, since industrial data is not available. This is due to the fact that the different processing chemicals are used in vastly different amounts. For example the E-6 processing chemical is used in much greater amounts than a VNF-1 processing chemical.
4.2 EMISSION BY PROCESSING SOLUTIONS
As main components or small dosage additives, photo chemicals fulfill definite functions in the various photographic processes.
Table 2 describes the most important baths and the substance classes (functions) included in them.
4.2.1 Definition of the point source
To determine the emission during the life cycle step processing, it is necessary to define the point source for the various processes.
a) A typical point source for the photographic processes E-6, R-3, C-41, RA-4, BW-P and BW-N would be a wholesale finisher with a paper throughput of 2,000,000 m2.y-1 and continuous processing machines This particular company processes films on paper and slides exclusively but on a large scale. The film and paper throughput in this company is made up of 2% E-6, 5% R-3, 11% C-41, 77% RA-4, 4% BW-P and 1% BW-N. Assuming 6 working days in 52 weeks per year, 6,410 m2 film/paper are developed per day. The film and paper amount produced is estimated over the market share and size of the C-41/RA-4 finishers.
b) A large x-ray division in a hospital typically has a developed area of 40,000 m2 film per year. Assuming 365 working days, the area developed per day is 110 m2.d-1.
c) For reprography a large printing office is used as a point source. This company develops about 80 m2 film/d (25,000 m2/year).
d) A copying facility as the point source for the processes ECN-2, ECP-2 and VNF-1 develops about 420 m2 film per day. Of these 35 m2.d-1 are developed with ECN-2, 350 m2.d-1 with ECP-2 and 35 m2.d-1 with VNF-1. In the following table these data are summarised.
97

IC-10 PHOTOGRAPHIC INDUSTRY
Table 1 Processing steps dependent on the material to be processed
Processing bath Description Function groups of ingredients Developing In order to obtain a visible image from the exposed emulsion, all
silver ions of those crystals which constitute the latent image must be reduced to metallic silver. To do this, the exposed silver halide is reduced by means of a developer solution, giving a primary silver image and the oxidized developer. In colour photography dyestuffs are formed in a subsequent step by reaction of the oxidized form of the developer and colour couplers in the emulsion layer.
developer antioxidant
pH-regulating agent antifogging agent auxiliary solvent
other
Bleaching In the bleaching solution the precipitated metallic silver is removed from the emulsion layer. Oxidizing agents are employed for converting the metallic silver into a silver salt which can easily be removed by the following fixing step.
bleaching agent bleach accelerator
rehalogenizing agent antifogging agent
other Fixing Unexposed silver halide as well as silver salt formed in the
bleaching baths of colour photographic material are removed from the emulsion layer leaving only the silver or colour image. The fixing agent forms water soluble silver complexes with silver salts.
fixing agent pH-regulating agent
hardening agent antioxidant
other Bleach-fixing Bleaching and fixing baths are combined in one bath (processing
photographic paper). fixing agent
bleaching agent hardening agent
antioxidant other
Reversing The formation of silver latent image specks in unexposed areas of the film is caused by chemical substances of the reversal bath (Only for reversing photographic film).
reversing agent pH-regulating agent
other Stopping To stop development at a specific time, the photographic material is
transfered from the developer bath to an acidic solution, the pH of which is usually between 3 and 5. Alternatively cold water is used by modern finishers.
hardening agent pH-regulating agent
other
Conditioning Conditioning baths are used to accelerate the subsequent bleaching process. Only for reversal photographic material.
antioxidant antifogging agent bleach accelerator
other Clearing In order to remove traces of the bleaching substances from the
emulsion layer, a clearing bath containing mainly sulphites can be applied as an addition in the reversal process.
clarifying agent pH-regulating agent
other Stabilizing Binding of unused colour coupling agents. stabilizer
interlacing agent other
Washing In the final washing step traces of bath components are removed from the emulsion layer as far as possible. Intermediate rinsing water is necessary to minimize carry-over effects from one bath to another.
lime resisting agent other
Primary Primary baths are used to accelerate the photographic developing. Only for tele- and cine-film developing.
accelerator
98

IC-10 PHOTOGRAPHIC INDUSTRY
Table 2 Defined point source for the life cycle step of processing
Point source Photographic processes Produced film and paper [m².d-1]
Wholesale finisher total 100% 6410 C-41 11% 680 RA-4 77% 4950 E-6 2% 120 R-3 5% 350 BW-N 1% 40 BW-P 4% 270
X-ray division total 100% 110 BW-X
Printing office total 100% 80 Reprographic BW-R
Copying facility total 100% 420 ECN-2 8% 35 ECP-2 84% 350 VNF-1 8% 35
4.2.2 Release estimation
Usually the photographic industry employs continuing processes. Different technologies, like continuous processing machines, leader belt processors and in professional labs dipping machines are available. The photochemical process bath is constantly regenerated by adding regenerating solutions. The consumption of photo chemicals is made up of the desired photochemical transformation, the undesired chemical reaction and the transport of the substance into later baths with the film material.
This part of the emission scenario deals with the entry of photochemical substances into the compartment water as a result from the different processes. The emission is created solely by the intermediate and final rinsing. An estimation of the release is therefore made through the carry-over rate CO. The overflow of a photochemical process is collected in special tanks and turned over as waste to a waste disposal specialist.
The amount of rinsing water used is not relevant since this is an input/output-analysis referring to the photo chemicals used. The photographic film and paper surface area processed per day W represents the defined point sources a), b), c), d).
To calculate the emission, the concentration of the substance in the fresh working solution C is required. This value should be provided by the notifier or industry, if it is not known, process- and bath-relevant formulas can be found in Table 4 and Table 5.
If information regarding the process and bath are not given, the highest concentration is chosen as a default value. This principle is applied to all other release estimation parameters as well.
99

IC-10 PHOTOGRAPHIC INDUSTRY
The release is estimated as:
( )RCOWCElocalwater −⋅⋅⋅= 1 (1)
Explanation of symbols
Symbol Explanation Unit 1) Default Remarks
Elocalwater emission per day [kg.d-1] C content of the substance in fresh
working strength solution or content of the substance after establishment of balance
[kg.m-3] from notifier or industry see Tables 4 and 5
W surface processed per day [m2.d-1] see Table 3 RR replenishment rate [l.m-2] see Table 3: parameter depends on process
and bath CO carry-over rate [l.m-2] see Table 3: parameter depends on process R fraction removed or converted during
processing [-] 0 from notifier or industry
(0%-at content of the substance after establishment of balance)
1) Recommended; a factor 10-3 has to be considered
Comment: Reverse baths in the R-3 and conditioning baths in the R-3 and E-6 process are sometimes introduced directly into the wastewater. This also applies to rinsing- and stop- baths (these contain small amounts of surfactant and strongly diluted acetic acid). In these cases the release is calculated in the following manner:
)1( RRRWCElocalwater −⋅⋅⋅= (2)
In the case of the minilab, a washing step does not take place, therefore no introduction into the compartment water has been considered. In this case the release takes place in the waste stage of the life cycle.
In some cases the notifier may announce a substance which is exclusively used in a bath which is followed by a second bath, which is no washing step. In those cases C (the concentration of substance 1 (used in bath 1) and carried off in bath 2) should be modified to:
( )21/12/1 / RRCOCOCC +⋅=
In those cases:
)1(2/1 RCOWCElocalwater −⋅⋅⋅= (3)
100

IC-10 PHOTOGRAPHIC INDUSTRY
Explanation of symbols
Symbol Explanation Unit 1) Default Remarks
Elocalwater emission per day [kg.d-1] C1/2 content of the substance from bath 1 in
bath 2 establishment of balance [kg.m-3]
C1/1 content of the substance in fresh working strength solution or content of the substance after establishment of balance in bath 1
[kg.m-3] from notifier or industry see Tables 4 and 5
W surface processed per day [m².d-1] see Table 3 RR2 replenishment rate bath 2 [l.m-2] see Table 3: parameter depends on process
and bath CO carry-over rate [l.m-2] see Table 3: parameter depends on process R fraction removed or converted during
processing [-] 0 from notifier or industry
(0%-at content of the substance after establishment of balance)
1) Recommended; a factor 10-3 has to be considered Table 3 Release estimation parameter 1): RR: Replenishment Rate by the listed process and process stage, CO: Carry Over
Rate by the listed process, W: Surface processed per day for the listed process, (Agfa, 1998), (Fuji, 2001), (Kodak, 1998), (Tetenal, 2001), (INFU, 2001), (EPCI, 2001)
Process 2) Bath RR 3) [l.m-²] CO [l.m-²] W [m².d-1]
C-41 developing 0.30–0.60 0.080 680 Colour bleaching 0.10–0.90 Negative fixing 0.40–0.90 stabilizing 0.90
RA-4 developing 0.06–0.12 0.040 4950 Colour paper bleach fixing 0.07–0.14
RA-4 developing 0.06–0.12 0.050 Devided stopping 0.15–0.20 Bleaching bleaching 0.05–0.10 and fixing 0.055–0.100 Fixing stabilizing
E-6 primary developing 0.9–1.8 0.080 120 Colour reversing 1.0–1.1 Reversal colour developing 1.0–2.0 Film conditioning 0.9–1.1 bleaching 0.2 fixing 0.4–1.0 stabilizing 1.0
R-3 primary developing 0.17–0.33 0.050 350 Colour colour developing 0.05–0.50 Reversal bleach fixing 0.07–0.20 Paper stabilizing
Table 3 continued overleaf
101

IC-10 PHOTOGRAPHIC INDUSTRY
Table 3 continued Release estimation parameter
Process 2) Bath RR 3) [l.m-²] CO [l.m-²] W [m².d-1]
R-3 primary developing 0.17–0.33 Devided colour developing 0.05-0.50 bleaching bleaching 0.07–0.14 and fixing 0.055-0.100 Fixing stabilizing
BW-N developing 0.5-0.6 0.180 40 fixing 0.4-0.9
BW-P developing 0.2-0.3 0.070 270 fixing 0.055-0.30
BW-X developing 0.35-0.40 0.040 110 Med. fixing 0.4-0.6
BW-X developing 0.5-0.6 0.040 Tech. fixing 0.8-1.2
BW-R developing 0.2-0.3 0.040 80 Film fixing 0.15-0.30
ECN-2 primary bath 0.375 0.180 35 Cine- and colour developing 0.845 Television- stopping 0.560 Film bleach accelerating 0.180 Negative bleaching 0.180 fixing 0.560 stabilizing 0.375
ECP-2 primary bath 0.374 0.180 350 Cine- and colour developing 0.646 Television stopping 0.721 Positive primary fixing 0.187 bleach accelerating 0.187 bleaching 0.187 secondary fixing 0.187 stabilizing 0.374
VNF-1 primary developing 0.348 0.180 35 Cine- and primary stopping 2.254 Television- colour developing 1.639 Film secondary stopping 1.332 Reversal bleach accelerating 0.410 bleaching 0.410 fixing 1.281 stabilizing 0.615
1) fraction removed or converted during processing R = 0 (default) fraction of waste-reduction WR = 0 (default) 2) values of C-41, RA-4, E6, R-3, BW-P and BW-N are related to point source (a) -wholesale finisher values of BW-X are related to point source (b) -hospital values of BW-R are related to point source (c) -printing office values of ECN-2, ECP-2 and VNF-1 are related to point source (d) –copying facility 3) recycling processes of bath-solutions for point source (a) –wholesale finisher- are considered
102
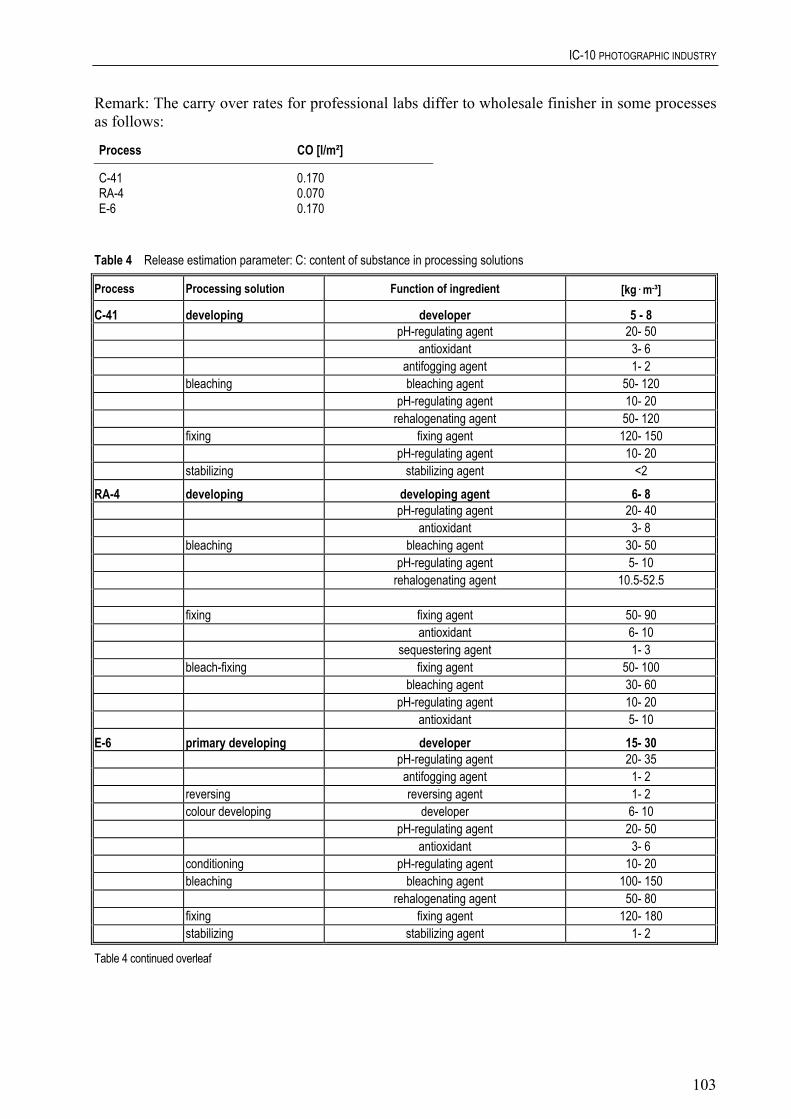
IC-10 PHOTOGRAPHIC INDUSTRY
Remark: The carry over rates for professional labs differ to wholesale finisher in some processes as follows:
Process CO [l/m²]
C-41 0.170 RA-4 0.070 E-6 0.170
Table 4 Release estimation parameter: C: content of substance in processing solutions
Process Processing solution Function of ingredient [kg.m-³]
C-41 developing developer 5 - 8 pH-regulating agent 20- 50 antioxidant 3- 6 antifogging agent 1- 2 bleaching bleaching agent 50- 120 pH-regulating agent 10- 20 rehalogenating agent 50- 120 fixing fixing agent 120- 150 pH-regulating agent 10- 20 stabilizing stabilizing agent <2
RA-4 developing developing agent 6- 8 pH-regulating agent 20- 40 antioxidant 3- 8 bleaching bleaching agent 30- 50 pH-regulating agent 5- 10 rehalogenating agent 10.5-52.5 fixing fixing agent 50- 90 antioxidant 6- 10 sequestering agent 1- 3 bleach-fixing fixing agent 50- 100 bleaching agent 30- 60 pH-regulating agent 10- 20 antioxidant 5- 10
E-6 primary developing developer 15- 30 pH-regulating agent 20- 35 antifogging agent 1- 2 reversing reversing agent 1- 2 colour developing developer 6- 10 pH-regulating agent 20- 50 antioxidant 3- 6 conditioning pH-regulating agent 10- 20 bleaching bleaching agent 100- 150 rehalogenating agent 50- 80 fixing fixing agent 120- 180 stabilizing stabilizing agent 1- 2
Table 4 continued overleaf
103

IC-10 PHOTOGRAPHIC INDUSTRY
Table 4 continued Release estimation parameter: C: content of substance in processing solutions
R-3 developer 15- 20 pH-regulating agent 15- 30
antifogging agent 1- 2 colour developing 5- 7 bleach-fixing fixing agent 50- 100
bleaching agent 30- 60 PH-regulating agent
antioxidant 5- 10
BW developer 5- 15 pH-regulating agent 20- 70 antifogging agent 0- 10
fixing 50- 150 pH-regulating agent 5- 20
primary developing
developing agent
10- 20
developing
fixing agent
antioxidant 5- 20
BW-X developing 10- 20 pH-regulating agent
hardening agent 1- 5 fixing
developer (med.) 20- 60
fixing agent 100- 150
pH-regulating agent 5- 20 antioxidant 5- 20
BW-X developing developer 10- 25 (tech.) pH-regulating agent 40- 80 hardening agent 1- 5 fixing fixing agent 100- 200 antioxidant 8- 20 pH-regulating agent 5- 15
BW-R developing developer 2- 20
antioxidant 2- 8 fixing fixing agent 70- 120 pH-regulating agent
5- 15
ECN-2 antioxidant 55.6
10- 25 pH-regulating agent 5- 15
antioxidant
primary bath pH-regulating agent 0.8 colour developing antioxidant 1.4 antifogging agent 0.43 pH-regulating agent 13.5 developer 3 stopping antifogging agent 26.3 bleach accelerating 6.3
ECN-2 pH-regulating agent 15.8 bleaching bleaching agent antifogging agent 30.4 pH-regulating agent 8.5 fixing fixing agent 68.2 antioxidant 12.9 stabilizing stabilizer 0.5-8
antioxidant
Table 4 continued overleaf
104

IC-10 PHOTOGRAPHIC INDUSTRY
Table 4 continued Release estimation parameter: C: content of substance in processing solutions
ECP-2 primary bath hardening agent 55.6 pH-regulating agent 0.8 colour developing antioxidant 2.4 pH-regulating agent 9.5 antifogging agent 0.8 stopping antifogging agent 26.3 primary fixing fixing agent 54.8 antioxidant 8.9 antifogging agent 0.4 bleach accelerating antioxidant 2.9 pH-regulating agent 3.7 bleaching bleaching agent 13.7
ECP-2 secondary fixing fixing agent 54.8 antioxidant 8.9 antifogging agent 0.4 stabilizing hardening agent 1.95 developing developer 33.3 antioxidant 33.3 pH-regulating agent 44.4
VNF-1 first developing developer 0.2 antioxidant 1.6 pH-regulating agent 16.1 fixing agent 0.8 stabilizer 0.1 antifogging agent 0.004 primary stopping pH-regulating agent 16.7 colour developing developer 6.7 stabilizer 0.06 antifogging agent 0.02 pH-regulating agent 2.6 antioxidant 4.3 secondary stopping pH-regulating agent 16.7 bleach accelerating antioxidant 5.6 pH-regulating agent 4.4 bleaching bleaching agent 47.2 fixing fixing agent 93.9 antioxidant 5.2 stabilizing stabilizing agent 1.9
The following additional table provides an overview of the amounts of photo chemicals used in certain process baths. No division is made according to processes, but other ingredients of photographic baths are listed as well.
105

IC-10 PHOTOGRAPHIC INDUSTRY
Table 5 Release estimation parameter: C: content of substance in processing solutions - overview
Processing solution Function of ingredient C Contents in colour processing baths
[g.l-1]
C Contents in black/white processing
baths [g.l-1]
Developer developing agent antioxidant
alkali buffering agent complexing agent antifogging agent auxiliary solvent
4.0-11.5 0.5-6.5 11-30 0.1-4.0 0.4-1.6 12-19
11-15 5-20 5-20
2-5 1-10 17
Bleach bleaching agent bleach accelerator
rehalogenizing agent
50-80 0.2-0.4 65-120
- -
Fix fixing agent acid buffering agent
hardening agent antioxidant
70-120 - -
5-8
110-140 5-9
ca. 5 2-11
fixing agent bleaching agent hardening agent
antioxidant
40-90 30-70
- 5-10
Reverse reverse agent pH-regulating agent
Stabilizer stabilizing agent 0.5-2 Conditioner antioxidant
antifogging agent bleach accelerator
7-12
Stop hardening agent pH-regulating agent
Water pH-regulating agent lime resisting agent
Bleach fix
4.3 EMISSION DURING WASTE DISPOSAL OF USED PROCESSING BATHS BY SPECIAL DISPOSAL COMPANIES
In some EU-countries e.g. the Netherlands, the return rate of used photo baths is high with a volume of ca. 90%. In other EU countries these rates are extremely low, what indicates that sometimes more than 80% of the used baths will be emitted directly or indirectly to the environment. Such diffuse sources are not considered in this ESD.
In this ESD the release of the main emission sources is used to determine the Elocalwater. In some areas (for example the X-ray film development) a more economical use of chemicals will probably come about due to lack of funds in most of Europe. But there will always be companies that work significantly better (with smaller amounts of waste) as well as those that work much worse. Therefore for the calculation of the release the realistic worst-case is assumed.
Only silver is removed from the waste in greater amounts. About 95% of the collected silver-containing baths are desilvered. In some countries desilvering and the injection in flue gas cleaning is used. in others the desilvered baths will be incinerated or evaporated. There are some more recycling or disposal technologies available at the market, but there significance is not very high at the moment.
106

IC-10 PHOTOGRAPHIC INDUSTRY
A detailed differentiation between the development processes is not possible and makes no sense in the context of the disposal practice.
4.3.1 Definition of the point source
A disposal company treats 600 – 14,000 m3 photochemical baths per year. A typical company treats a volume of about 2,000 m3 per year. Assuming 250 working days, 8 m3.d-1 are treated per day. This volume is divided according to the shares of the used process bathes (see Figure 14).
Specific information of disposal volume of used photochemical baths in the EU is not clearly indicated. It could be estimated a disposal volume of used photochemical baths of 1 litre per 1 inhabitant and year for Germany.
BW-film0,7%
R-30,3%E-6
0,3%
RA-4 B - F13,0%
RA-4 BF19,5%
C-412,9%
Cine1,2%
BW-R22,2%
BW-paper2,2%
BW-X37,7%
C-41RA-4 BFRA-4 B - FE-6R-3BW-filmBW-XBW-paperBW-RCine
Figure 14 Photographic processes by the size of their used baths shares (INFU, 1998, 2001)
4.3.2 Release estimation
The calculation of the release is made over the volume at the disposal company as appropriate for the process:
( ) )1(1 WRRVTCElocalwater −⋅−⋅⋅= (4) Since it is not possible to determine the disposal structure of a substance when it is first introduced, the default value assumes that 100% of the substance used will enter the environment. A reduction of the waste can only be assumed, if the supplicant can already guarantee for the disposal of the substance. Therefore to calculate the release, the waste reduction WR is included here. A possible scenario example would be that a new chemical substance for a minilab is introduced, and acquiring the substance includes a service contract with the producer.
107

IC-10 PHOTOGRAPHIC INDUSTRY
Explanation of symbols
Symbol Explanation Unit1) Default Remarks
Elocalwater emission per day [kg.d-1] C content of the substance in fresh working
strength solution or content of the substance after establishment of balance
[kg.m-3] from notifier or industry see Tables 4 and 5
VT treated volume per day [m³.d-1] see Table 6: parameter depend on process and bath
R fraction removed or converted during processing
[-] 0 from notifier or industry (0%-at content of the substance after establishment of balance)
WR fraction of waste reduction [-] 0 From notifier or industry
1) a factor of 10-3 has to be considered Table 6 shows the values VT -treated volume per day- for the defined point source. In the first part no differentiation is made according to specific photographic processes.
Table 6 Release estimation parameter: VT: treated volume (INFU, 2001; EPCI, 2001)
Point source Photographic processes VT [m³.d-1]
Disposal company total 100 [%] 8
Used for calculation, if specific process is unknown colour process 37.0 3.0 developing 32 1.0 bleaching 11 0.3 fixing 18 0.5 bleachfixing 39 1.2 black/white process 63.0 5.0 developing 46 2.3 fixing 54 2.7 Used for calculation, if specific process is known C-41 colour negative film 2.9 0.2 developing 40 0.08 bleaching 40 0.08 fixing 20 0.04 RA-4 colour positive paper 32.5 2.6 developing 30 0.78 bleaching 8 0.21 fixing 18 0.47 bleach fixing 44 1.14 E-6 colour reversal film 0.3 0.03 primary developing 44 0.013 colour developing 44 0.013 bleaching 10 0.003 fixing 2 0.001 R-3 colour reversal paper 0.3 0.03 primary developing 62 0.019 colour developing 25 0.007 bleach fixing 5 0.002 bleaching 5 0.002 fixing 3 0.001
Table 6 continued overleaf
108

IC-10 PHOTOGRAPHIC INDUSTRY
Table 6 continued Release estimation parameter: VT: treated volume
Point source Photographic processes VT [m³.d-1] BW-N black/white negative film 0.7 0.06 developing 85 0.05 fixing 15 0.01 BW-P black/white positive paper 2.2 0.18 developing 90 0.16 fixing 10 0.02 BW-X black/white X-ray 37.7 3 developing 40 1.2 fixing 60 1.8 BW-R black/white reprographic 22.2 1.8 developing 52 0.9 fixing 47 0.9 activator 1 Cine cine- and television film 1.2 0.1 developing bleaching fixing
4.4 INGREDIENTS IN PHOTOGRAPHIC MATERIAL
Emissions from photographic materials can take place during the life cycle steps:
• production of the photographic material (coating of the basic plastic layer with emulsions, production of the bath concentrates),
• processing of the photographic material in the developing processes (see Section 4.2), • disposal of the used photographic material (baths, film, photographic paper (see Section 4.3)).
No data is available for possible emissions during the production process of photographic material.
The positive silver halide crystals, colour couplers and numerous adjuvants are incorporated in gelatine based emulsion layers. Emissions occur when:
• small amounts go to the drain when the coating equipment is cleaned with water, • waste or defective batches or coating solutions are removed for destruction or collected for
silver recovery
The emulsion layers contain different functional groups of ingredients [Bau94]. These are listed in Table 7.
Table 7 Function of substances in the emulsion layer
Functional groups Description Light sensitive agents silver halide crystals of different grain size Colour couplers form image dyes together with oxidized developer Sensitizers increase the sensitiveness Correction dyes protect light-sensitive films from undesired spectral regions Spectral sensitizers give particular sensitivity to a spectral region Antifogging agents prevent the production of non-image silver
109
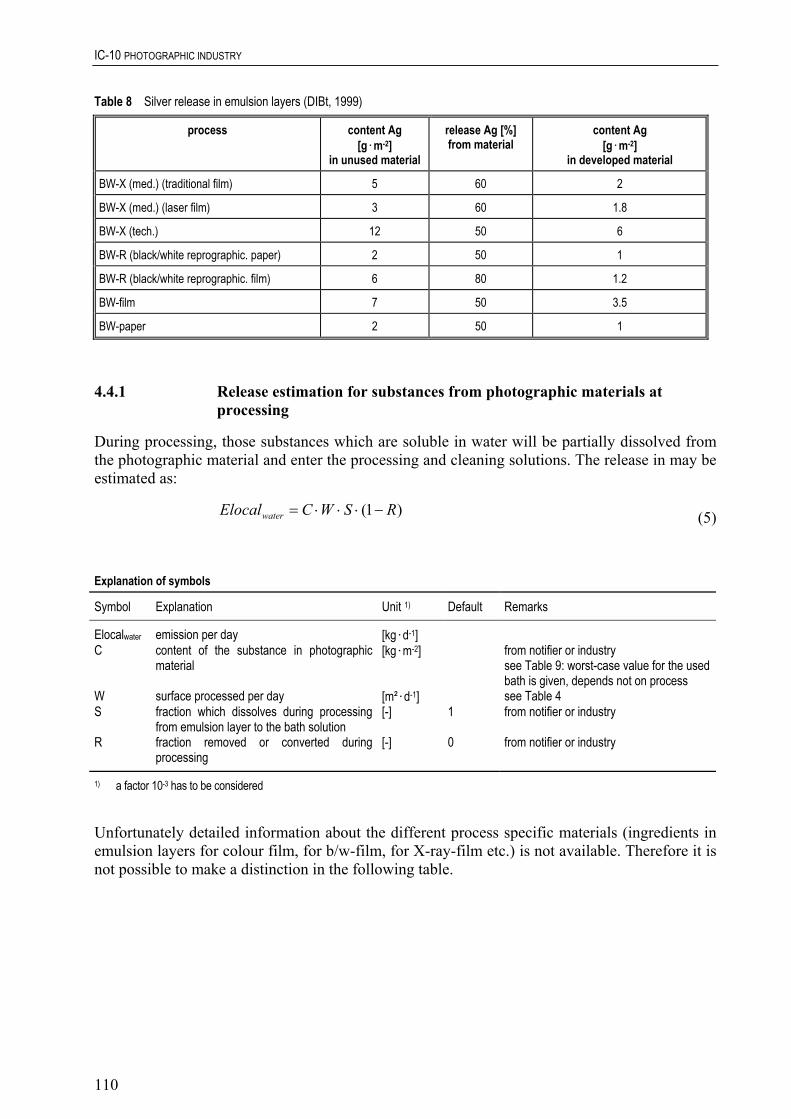
IC-10 PHOTOGRAPHIC INDUSTRY
Table 8 Silver release in emulsion layers (DIBt, 1999)
process content Ag [g.m-2]
in unused material
release Ag [%] from material
content Ag [g.m-2]
in developed material
BW-X (med.) (traditional film) 5 60 2
BW-X (med.) (laser film) 3 60 1.8
BW-X (tech.) 12 50 6
BW-R (black/white reprographic. paper) 2 50 1
80 1.2
BW-film 7 50 3.5
BW-paper 2 50 1
BW-R (black/white reprographic. film) 6
4.4.1 Release estimation for substances from photographic materials at processing
During processing, those substances which are soluble in water will be partially dissolved from the photographic material and enter the processing and cleaning solutions. The release in may be estimated as:
)1( RSWCElocalwater −⋅⋅⋅= (5)
Explanation of symbols
Symbol Explanation Unit 1) Default Remarks
Elocalwater emission per day [kg.d-1] C content of the substance in photographic
material [kg.m-2] from notifier or industry
see Table 9: worst-case value for the used bath is given, depends not on process
W surface processed per day [m².d-1] see Table 4 S fraction which dissolves during processing
from emulsion layer to the bath solution fraction removed or converted during processing
[-] 1 from notifier or industry
R [-] 0 from notifier or industry
1) a factor 10-3 has to be considered
Unfortunately detailed information about the different process specific materials (ingredients in emulsion layers for colour film, for b/w-film, for X-ray-film etc.) is not available. Therefore it is not possible to make a distinction in the following table.
110

IC-10 PHOTOGRAPHIC INDUSTRY
Table 9 Release parameter: C: Content of substance in photographic material
Ingredient content C [mg.m-2] paper content C [mg.m-2] film
Sensitizers 1 25
Photographic stabilizers 5 100
Fungicide 30 150
Silver as Ag 500 12,000
Halides (Cl-. Br-. J-) 300 7,000
Split of products - masking compounds in colour negative films - remaining groups of colour couplers - stabilizers
40 80 0
80 800 80
Wetting agents 10 300
Filter dyestuffs 50 250
4.4.2 Disposal of used photographic material
Although they may be changed during processing, most emulsion constituents stay on the film and paper which are returned to the customer after processing. Waste prints and negatives are disposed of to municipal waste streams, ending up in landfills or incinerators.
The major concern of both light-sensitive material manufacturers and the companies who deal with waste of photographic film and paper is to extract silver efficiently. Silver recovery treatment for solid waste material (incineration. wet oxidizing) can be assumed as well as for silver containing wastewater.
5 EXAMPLES
A Calculation of the release of a complexing agent of the RA-4 processing bath (processing stage) (equation 1).
Input
C= 3 kg.m-3 W= 4,950 m2.d-1 CO= 0.04 l.m-2 R= 0 - Output
Elocalwater= 0.60 kg.d-1
111

IC-10 PHOTOGRAPHIC INDUSTRY
B Calculation of the release of the complexing agent of the RA-4 developing bath during waste disposal (equation 3).
Input
C= 3 kg.m-3 VT= 0.78 m3.d-1 WR= 0 - R= 0 - Output
Elocalwater= 2.34 kg.d-1
C Calculation of the release of a substance for an X-ray developer during waste disposal (equation 3).
Input
C= 20 kg.m-3 VT= 1.2 m3.d-1 WR= 0 - R= 0 - Output
Elocalwater= 24.00 kg.d-1
D Calculation of the release of a pH-regulating agent for developing bath during a reprographic process (BW-R) (equation 1)
Input
C= 2.5 kg.m-3 W= 80 m2.d-1 CO= 0.04 l.m-2 R= 0 - Output
Elocalwater= 0.01 kg.d-1
112

IC-10 PHOTOGRAPHIC INDUSTRY
E Calculation of the release of a sensitizer in the emulsion layer of a photographic material (RA-4) (equation 4).
Input
C= 1.10-6 kg.m-2 W= 4,950 m2.d-1 S= 1 - R= 0 - Output
Elocalwater= 0.005 kg.d-1
6 REFERENCES Agfa (1998). Agfa company information.
Baumann W (1994). Fotochemikalien - Daten und Fakten zum Umweltschutz. 2. Auflage. Springer Verlag.
Baumann W, Muth A, Schmidt M (1997). Vermeiden von Abfällen durch abfallarme Produktionsverfahren. ABAG-Baden-Württemberg, Germany.
Baumann W, Sittel H (1998). Sonderabfälle aus fotografischen Prozessen – Möglichkeitender Vermeidung. Verminderung und Verwertung. Projektstudie 3. SAM. Mainz, Germany.
DIBt (1999). Grundlagen zur Zulassung von Geräten zur Minderung der Silberfracht in Spülwässern der Fotobranche. Deutsches Institut für Bautechnik (DIBt), Berlin.
EPCI (2001). EPCI information.
Fuji (2001). Fuji company information.
INFU (2001). INFU information.
Kodak (1998). Kodak company information.
Tetenal (2001). Tetenal company information.
113

IC-10 PHOTOGRAPHIC INDUSTRY
7 ABBREVIATIONS BW-N black/white negative film process
BW-P black/white positive film process
BW-R
colour negative film process
Predicted Environmental Concentration (at the local stage)
cine- and televisionfilm reversal process
black/white reprographic process
BW-X black/white X-ray process (medical and technical)
C-41 colour negative film process
E-6 colour reversal film process
ECN-2 cine- and televisionfilm negative process
ECP-2 cine- and televisionfilm positive process
EP-2
EU European Union
IC industrial category
P3-X-N colour negative film process
P3-X-P colour negative film process
PEClocalwater
R-3 colour reversal paper process
RA-4 colour positive paper process
STP Sewage Treatment Plant
TGD Technical Guidance Document
VNF-1
114

IC-12 PULP, PAPER AND BOARD INDUSTRY
ASSESSMENT OF THE ENVIRONMENTAL RELEASE OF CHEMICALS USED IN THE
PULP, PAPER AND BOARD INDUSTRY
115


IC-12 PULP, PAPER AND BOARD INDUSTRY
CONTENTS
119
119
119
120
120
120
120 120 121 121 121
121
122
123 123 123 124 125 125
126 126 127 128 128
1 INTRODUCTION ...........................................................................................................................................
1.1 DESCRIPTION OF THE INDUSTRY .................................................................................................
1.2 RECYCLING WASTEPAPER .............................................................................................................
1.3 WASTE TREATMENT ON SITE ........................................................................................................
2 APPLICATION TYPES .................................................................................................................................
2.1 SUBSTANCES APPLIED DURING PAPER PRODUCTION ..........................................................
2.2 SUBSTANCES APPLIED TO PAPER AFTER PRODUCTION ...................................................... 2.2.1 Inks ................................................................................................................................................ 2.2.2 Temperature-sensitive coatings ..................................................................................................... 2.2.3 Carbonless copy paper ................................................................................................................... 2.2.4 Quantities used ..............................................................................................................................
2.3 NON-IMPACT PRINTING MATERIALS .......................................................................................... 1212.3.1 Xerocraphic or electrostatic printing .............................................................................................
3 CALCULATION OF EMISSION RATES TO WATER............................................................................. 122
3.1 GENERAL COMMENTS ......................................................................................................................
3.2 RELEASES FROM PAPER MAKING ................................................................................................ 3.2.1 Use and release rates for dyes and optical brighteners .................................................................. 3.2.2 Other chemicals in paper production ............................................................................................. 3.2.3 Water consumption........................................................................................................................ 3.2.4 Scale of operations......................................................................................................................... 3.2.5 Emission scenarios.........................................................................................................................
3.3 RELEASE DURING PAPER RECYCLING ....................................................................................... 3.3.1 Release to waste during de-inking process .................................................................................... 3.3.2 Removal......................................................................................................................................... 3.3.3 Water consumption........................................................................................................................ 3.3.4 Scale of operations......................................................................................................................... 3.3.5 Emission scenario .......................................................................................................................... 128
4 EXAMPLE CALCULATIONS ...................................................................................................................... 129
4.1 PAPER MAKING ................................................................................................................................... 129
4.2 PAPER RECYCLING............................................................................................................................ 129
5 REFERENCES ................................................................................................................................................ 130
117


IC-12 PULP, PAPER AND BOARD INDUSTRY
1 INTRODUCTION
The purpose of these guidelines is to provide realistic release scenarios for chemicals used in the production and use of paper. These scenarios deal only with releases to water. Consideration must be given to the use and release from each of three stages:
• the manufacture of paper (biocides, dyes papermaking additives); • the application to paper (coatings, inks and toners applied to the finished paper in further
processes); • the recycling of paper (during pulping, washing, de-inking).
For a given substance release may occur at more than one stage; for example, a dye will be released during the manufacture of paper and from recycled wastepaper used in paper production.
These guidelines provide scenarios for:
• the release of substances used in the paper making process; • the release of substances during the pulping, washing and de-inking of wastepaper in the
preparation of pulp for paper production.
Scenarios for the release of printing inks at the application stage will be included in future guidance on the printing/graphical industry. The environmental impact of the application stage of coatings and the production of carbonless copy paper is considered low in comparison with the impact of the release during paper recycling, and so the application stage is not considered here. Some information on the processes used is however included.
1.1 DESCRIPTION OF THE INDUSTRY
The paper industry produces a wide variety of products suitable for different purposes. There are various classifications of paper products; the one used here is very simple but it distinguishes between the different uses of paper and, in particular, the fates of the wastepaper from each class which also vary. The four categories of paper used here are:
• printing and writing paper; • tissue paper; • paper for newspaper printing (newsprint); • board, cartons and packaging and wrapping paper (packaging).
The main component of paper and board is cellulose fibre. For commercial production of paper products, the fibre, or pulp, is derived from wood, wastepaper or other non-wood materials. The fillers used are typically kaolin, calcium sulphate, talc, chalk and titanium dioxide.
1.2 RECYCLING WASTEPAPER
A raw material in papermaking is wastepaper. Depending on the type of wastepaper and the intended type of paper to be produced the proportion may vary from 0 to 100%. The first stages in using wastepaper are always the same - pulping, centrifugal cleaning and screening. In the production of good quality papers this is followed by a de-inking process, involving the addition of chemicals which release various additives from the fibre. Increasing the pH (to about 9), saponification of the binder and the addition of surfactants results in dispersion of the ink
119

IC-12 PULP, PAPER AND BOARD INDUSTRY
particles. Hydrogen peroxide is occasionally used as a bleach for further colour reduction. Separation of the ink is achieved by flotation or washing, or a combination of both.
1.3 WASTE TREATMENT ON SITE
Papermills reuse water to different degrees depending on water availability, effluent discharge levels and the chemistry and economics of backwater recirculation. The traditional so-called open system corresponds to a wastewater production of 50-100 [m3.t-1] of paper. Partially closed systems exist where one part of the process water is reused but in completely closed systems, no wastewater is discharged (Kirk-Othmer).
There are three possible stages for the treatment of liquid waste on site:
• primary sedimentation of solid material which produces sludge. This may be promoted by the addition of electrolytes. It is also known as “clarification”;
• aerobic biological treatment, most usually by activated sludge systems; • anaerobic treatment.
Sludge, produced by the clarification process and by flotation in full de-inking processes is disposed of, sometimes to land.
Most papermills carry out at least primary sedimentation on the wastewater before it is discharged to local sewage treatment works. Some may also have their own biological treatment plants.
2 APPLICATION TYPES
2.1 SUBSTANCES APPLIED DURING PAPER PRODUCTION
A number of substances are added to paper during its production. Some, like anti-foaming agents and biocides, affect the process itself while others, like dyes, resins, glues and adhesives (to five the paper wet strength) and surface coatings, determine the properties of the paper and ensure it meets its specification. All these additives have the potential for release to wastewater and possibly to solid waste.
2.2 SUBSTANCES APPLIED TO PAPER AFTER PRODUCTION
2.2.1 Inks
Printing ink is a mixture of coloured toners, dyes and pigments or combinations of these materials which are dissolved or dispersed in a vehicle or carrier, forming a fluid or paste which can be printed on a substrate and dried. In most cases the vehicle also binds the colorant to the substrate. The composition of a printing ink depends on the printing method and drying procedure for which it is formulated.
120

IC-12 PULP, PAPER AND BOARD INDUSTRY
2.2.2 Temperature-sensitive coatings
Thermal paper, used for receiving Facsimile transmissions, derives its printing properties from a temperature-sensitive coating made up of a colour former and a co-reactant, in addition to a pigment and binder. A wax is added to facilitate the reaction between the co-reactant and the colour former.
2.2.3 Carbonless copy paper
Carbonless copy paper is produced in systems containing at least 2 sheets of paper, though 3 and 4 sheet systems are common. The principle of carbonless copying is based on the reaction of a dye with a reactive montmorillonite clay. In a 2-sheet system, the top sheet is coated on its back with gelatine capsules containing the colour former which make up 10% (w/w) of the coating. The remainder of the coating is starch granules of uniform size which are larger than the capsules and so keep the 2 sheets apart preventing inadvertent marking of the sheets in use. The coating on the upper surface of the lower sheet is 80% reactive montmorillonite clay. Writing pressure results in breakage of the capsules, releasing colour former which reacts with the clay and produces a blue/black colour on the surface of the lower sheet. In systems with more than 2 sheets, the middle sheets are coated with clay on their upper surfaces and with colour former capsules and starch on their lower surfaces.
Both thermal paper and carbonless copy paper are perceived to cause problems for mills using wastepaper because it is difficult to remove the constituents of these coatings in the de-inking process.
2.2.4 Quantities used
Table 1 gives information about the quantities of inks and coatings applied to paper.
2.3 NON-IMPACT PRINTING MATERIALS
2.3.1 Xerocraphic or electrostatic printing
Table 1 Quantity of inks and coatings applied to paper (BRE, 1993)
Quantity applied to paper, as % (w/w)
Inks applied to: newspapers magazines books computer paper continuous stationery
0.5 - 5 1 - 7
0.5 - 1 0.3 - 0.8
1 - 3
Coatings: temperature sensitive colour former - upper surface Montmorillonite clay - upper surface non-impact printed toner
7 - 10
15 21
0.5 - 2
121

IC-12 PULP, PAPER AND BOARD INDUSTRY
In xerography, a sheet of plain paper is electrically sensitised in those areas corresponding to the original. Coloured resin particles carrying an opposite charge are attracted and are retained only on the sensitised areas, thus producing a visible image corresponding to the original.
Most high volume machines rely on dry, two-component toning systems. These consist of black pigmented toner particles that form the copy images and reusable carrier particles that provide their transport Chemicals are added to the toner and carrier particles to control the size and polarity of the electrical charging action. In low volume copiers, mono-component systems are used in which very small magnetic particles are incorporated into the toner particles themselves. These also include agents such as carbon to increase the electrical conductivity of the system. Similar electrostatic systems are used in laser printers for computer printout.
Most of the charge control agent is bound into a polymeric matrix; up to 5% remains unbound and can be released to wastewater during the washing of preparation vessels and during the de-inking of laser and xerographic printed paper.
Table 1 indicates the quantity of toner on paper after the printing process.
3 CALCULATION OF EMISSION RATES TO WATER
3.1 GENERAL COMMENTS
This section provides information to allow the estimation of the release of a chemical from a paper production site. Information on the rates of addition to paper and the corresponding losses to water is given, related to the function of the substance. Data on water consumption and the size of production plants are presented, and general scenarios given to allow a release from paper production to be calculated.
The section also deals with the release of chemicals from paper in the recycling process. Here the estimates are based on the total annual consumption of a substances. The areas in which various types of substance are used are given in Table 2.
Table 2 Areas of use of substances in the paper making industry
Type of substance Papermaking machine Application to paper Release during
pulping
Section 3.2 Not covered in these guidelines Section 3.3
Printing inks + +
Thermal coatings + +
Non-impact printing toners +
Coatings on carbonless copy paper + +
Dyes + +
Biocides + +
Paper additives + +
Coatings applied during paper production + +
122

IC-12 PULP, PAPER AND BOARD INDUSTRY
3.2 RELEASES FROM PAPER MAKING
3.2.1 Use and release rates for dyes and optical brighteners
Dyes and optical brighteners are added to the papermaking process during the preparation of printing and writing grades and of tissue. Dye concentrations applied to paper range from 0.005% (w/w) for very pale shades up to 10% for very dark shades and blacks (Ros and Berns, 1988); however concentrations in a range of 0.01 to 1.0 are the normal case (Baumann and Herberg-Liedtke, 1993). Optical brighteners are typically used at rates of 0.02 - 0.3% (Baumann and Herberg-Liedtke, 1993), although a maximum value of 1.2% is reported (Ros and Berns, 1988). The dyeing process is affected by the sizing system (pH), fibre structure, filler materials, additives (fixing agents), temperature, water hardness etc. Dyes for papers should have both high substantivity (degree of adsorption) and affinity (decree of fixation) to limit the addition of fixing agents and additives. Information on the degree of fixation for dyes is given in Table 3.
Table 3 Estimated values for fixation of paper dyes (ETAD, 1992)
Type of dye Substantivity Substrate Fixation
Anionic direct (and stilbene type FWAS)
high bleached and unbleached 80% (79-90); with fixing agents or alum up to 98%
Cationic direct very high all types 95% (90-99)
Basic low - medium bleached pulp mechanical pulp
60% (50-70) 70% (60-80); with anionic fixation
up to 95%
Acid low sized packaging paper 50% (40-60); with cationic fixation 80-90%
Typical values of paper dyeing capacities in paper mills are summarised in Table 4.
Amount of paper dyed in [t·d
Table 4 Estimated values of paper dyeing capacities and corresponding dye consumption in [t.d-1] (ETAD, 1992)
Paper type -1]
Pale shade 0.01-0.1%
Medium shade 0.1-1.0%
Deep shade 1-4%
Tissue 40-200 4-2,000 40-2,000 400-8,000
Writing and printing paper
100-1,000 10-1,000 100-10,000
3.2.2 Other chemicals in paper production
For other chemicals rates of addition to paper and corresponding losses to wastewater are given in Table 5. It should be noted that this table gives percentages released to water whereas the degree of fixation gives the percentage bound to the paper. The percentage released corresponds to (100-F) in the equations in Section 3.2.5.
123
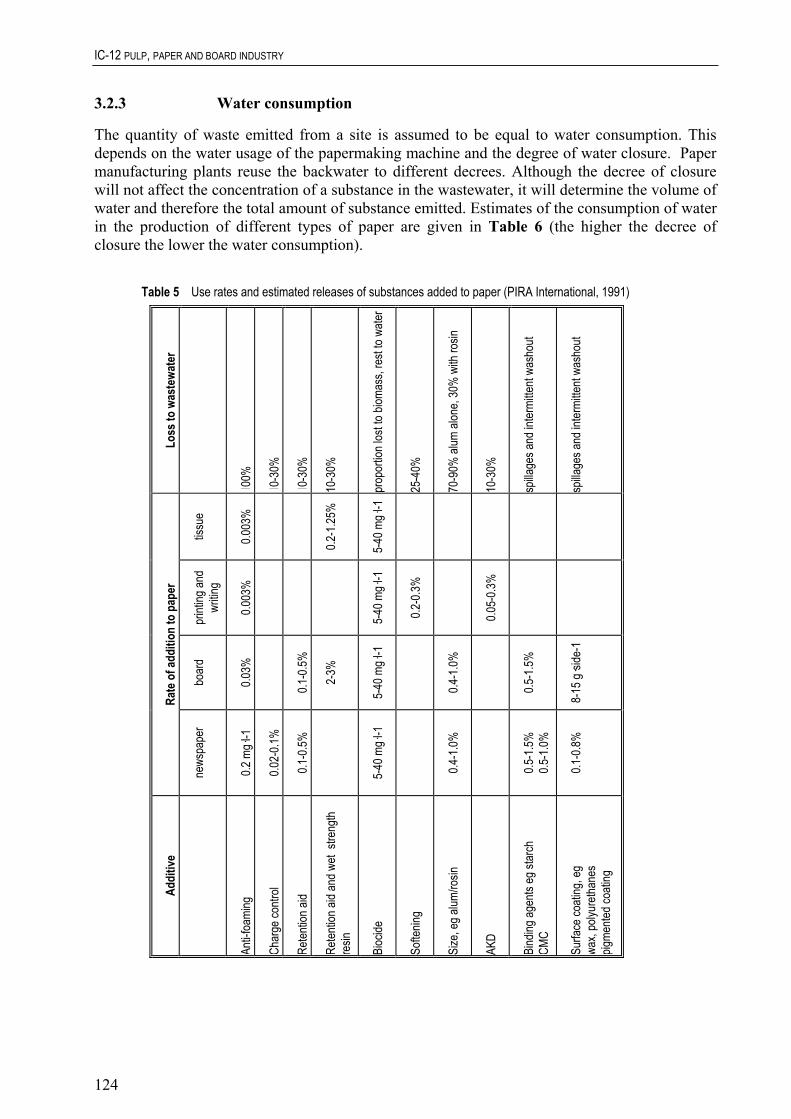
IC-12 PULP, PAPER AND BOARD INDUSTRY
3.2.3 Water consumption
The quantity of waste emitted from a site is assumed to be equal to water consumption. This depends on the water usage of the papermaking machine and the degree of water closure. Paper manufacturing plants reuse the backwater to different decrees. Although the decree of closure will not affect the concentration of a substance in the wastewater, it will determine the volume of water and therefore the total amount of substance emitted. Estimates of the consumption of water in the production of different types of paper are given in Table 6 (the higher the decree of closure the lower the water consumption).
Table 5 Use rates and estimated releases of substances added to paper (PIRA International, 1991)
Loss
to w
aste
wate
r
100%
10-3
0%
10-3
0%
10-3
0%
prop
ortio
n los
t to bi
omas
s, re
st to
water
25-4
0%
70-9
0% al
um al
one,
30%
with
rosin
10-3
0%
spilla
ges a
nd in
termi
ttent
wash
out
spilla
ges a
nd in
termi
ttent
wash
out
0.2-1
.25%
5-40
mg·
l-1
ing an
d wr
iting
0.003
%
5-40
mg·
l-1
0.2-0
.3%
0.05-
0.3%
boar
d
0.03%
0.1-0
.5%
2-3%
5-40
mg·
l-1
0.4-1
.0%
0.5-1
.5%
8-15
g·sid
e-1
Rate
of a
dditi
on to
pap
er
news
pape
r
0.2 m
g·l-1
0.02-
0.1%
0.5-1
.5%
0.5-1
.0%
0.1-0
.5%
5-40
mg·
l-1
0.4-1
.0%
0.1-0
.8%
Addi
tive
Anti-f
oami
ng
Char
ge co
ntrol
Reten
tion a
id
Reten
tion a
id an
d wet
stre
ngth
resin
Bioc
ide
Softe
ning
Size
, eg a
lum/ro
sin
AKD
Surfa
ce co
ating
, eg
wax,
polyu
retha
nes
pigme
nted c
oatin
g
tissu
e
0.003
%
Bind
ing ag
ents
eg st
arch
CM
C
124

IC-12 PULP, PAPER AND BOARD INDUSTRY
Table 6 Estimates of water consumption in the paper industry (ETAD, 1992; BRE, 1993).
Type of paper Water consumption [m3.t-1] Degree of closure [%]
Printing and writing 40 - 75 40 - 70
Tissue 57 40 - 70
Newsprint 24 - 35 65 - 85
Packaging and board 2 - 20 >95
3.2.4
Scale of operations
In Section 3.2.1 representative figures for the amount of paper dyed per day at a site were given for tissue paper and for writing and printing paper. It is suggested that if no more specific information is available for a particular substance then these figures also be used for the quantity of paper produced. In the same way it is suggested that the rate for writing and printing paper, 100-1,000 t.d-1, be used as the default for newsprint and packaging and board if no other information is available (the largest size is similar to the largest plants found in two studies (Ros and Berns, 1988; PIRA International, 1991).
3.2.5 Emission scenarios
The two equations below use the data described in the preceding sections to calculate a daily release of substance. If the usage rate of the substance is given as a mass per ton of paper produced then the equation is:
E = Ws · Q · (100-F) · (100-C) (1) 100 100 Explanation of symbols
E emission per day [kg.d-1] Ws specific consumption of substance [kg.t-1.paper] data from notifier or Tables 4 and 5 Q quantity of paper produced at 1 site per day [t.d-1] (Section 3.2.4) F degree of fixation of substance [%] specific information on substance or Tables 3 and 5 C degree of closure of water system [%] (Section 3.2.3)
If the usage rate of the chemical is given as a concentration in water (e.g. biocide in Table 5) then the equation is:
E = C A · Q · s · s (100-F) (2) 100
125
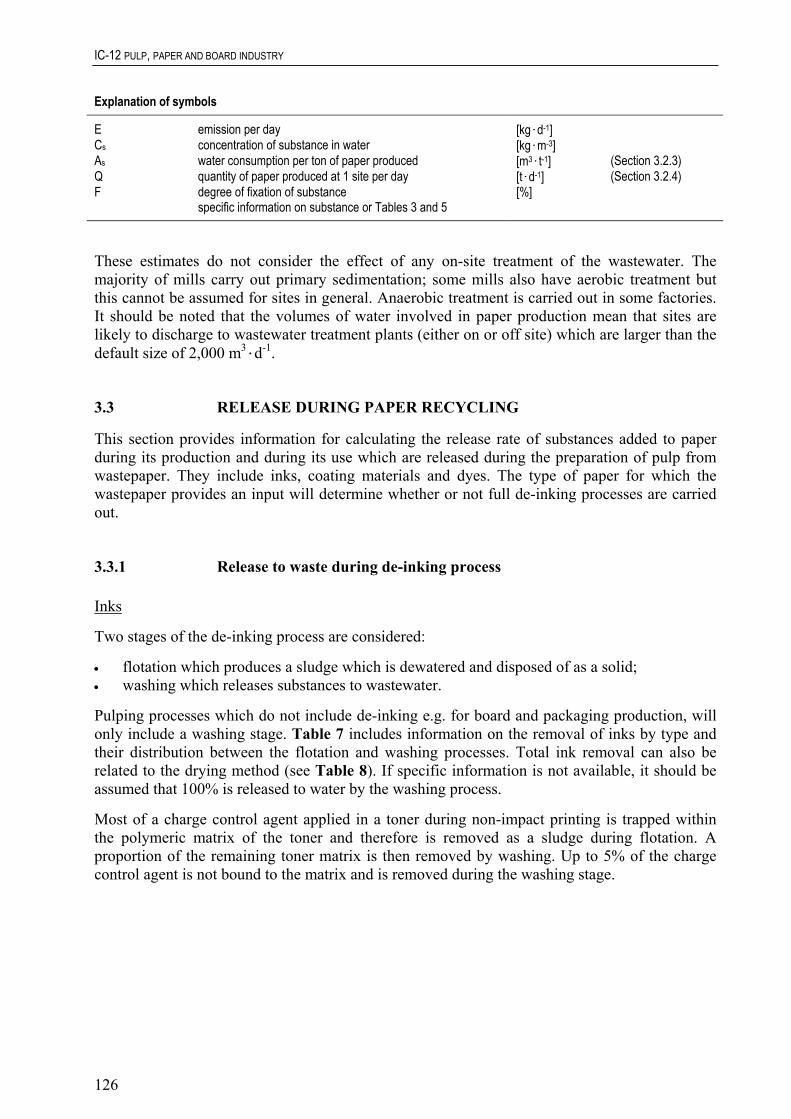
IC-12 PULP, PAPER AND BOARD INDUSTRY
Explanation of symbols
E emission per day [kg.d-1] Cs concentration of substance in water [kg.m-3] As water consumption per ton of paper produced [m3.t-1] (Section 3.2.3) Q quantity of paper produced at 1 site per day F
[t.d-1] (Section 3.2.4) degree of fixation of substance [%] specific information on substance or Tables 3 and 5
3.3 RELEASE DURING PAPER RECYCLING
This section provides information for calculating the release rate of substances added to paper during its production and during its use which are released during the preparation of pulp from wastepaper. They include inks, coating materials and dyes. The type of paper for which the wastepaper provides an input will determine whether or not full de-inking processes are carried out.
3.3.1
These estimates do not consider the effect of any on-site treatment of the wastewater. The majority of mills carry out primary sedimentation; some mills also have aerobic treatment but this cannot be assumed for sites in general. Anaerobic treatment is carried out in some factories. It should be noted that the volumes of water involved in paper production mean that sites are likely to discharge to wastewater treatment plants (either on or off site) which are larger than the default size of 2,000 m3.d-1.
Release to waste during de-inking process
Inks
Two stages of the de-inking process are considered:
• flotation which produces a sludge which is dewatered and disposed of as a solid; • washing which releases substances to wastewater.
Pulping processes which do not include de-inking e.g. for board and packaging production, will only include a washing stage. Table 7 includes information on the removal of inks by type and their distribution between the flotation and washing processes. Total ink removal can also be related to the drying method (see Table 8). If specific information is not available, it should be assumed that 100% is released to water by the washing process.
Most of a charge control agent applied in a toner during non-impact printing is trapped within the polymeric matrix of the toner and therefore is removed as a sludge during flotation. A proportion of the remaining toner matrix is then removed by washing. Up to 5% of the charge control agent is not bound to the matrix and is removed during the washing stage.
126

IC-12 PULP, PAPER AND BOARD INDUSTRY
Table 7 Release of types of inks (PIRA, 1991)
Ink type % removal to sludge by flotation % removal to water by washing
Mineral oil-based ink 60 – 80 14 – 28 (ie 70% of ink remaining after flotation)
Flexographic ink very little 30 - 90
Non-impact toners 60 – 80 (as high as 90 - 95% for some, 30 - 50% for others)
6 – 28 (ie 30 - 70% of toner remaining after flotation)
Table 8 Removal rates of ink particles during de-inking (Ros and Berns, 1988)
method of drying ink % ink removal
Absorption, penetration or evaporation 80 - 100
Oxidation or IR radiation 60 - 95
Hot polymerisation or UV fixation 40 - 90
30 - 60 Ink-jet, laser or xerographic copying
Dyes
It is assumed that the same portion of substance which is retained on the fibre in the papermaking machine is retained on the sludge when the waste paper gets repulped. E.g. a dyestuff which is retained to 70 - 90% on the paper will also be adsorbed to an extent of 70 - 90% to the sludge while 10 - 30% are released to the wastewater. In the absence of specific data on the removal rates of dyes from paper, a removal rate of 50% should be assumed, which can be looked upon as a realistic worst case.
Temperature-sensitive coating
The colour former and co-reactant in waste thermal paper remain unreacted except where printing has occurred; this is assumed to represent a very small proportion of the waste and is ignored. On alkaline pulping, the colour former hydrolyses and this and the co-reactant are 100% released to water (PIRA, 1991).
Carbonless copy paper
Most of the colour former is hydrolysed during alkaline pulping and is released to water in which it has a low solubility. However, the shear forces employed in the pulping machine cause some colour former to react with the montmorillonite clay. It is assumed that 10% of the colour former is bound to the clay in this way and that 50 - 70% of this dye-clay complex is released to water (PIRA, 1991).
3.3.2 Removal
Recycling is carried out in papermills where it is assumed that at least primary sedimentation is carried out at all sites. It can be assumed that nearly 100% of easily soluble substances are released to wastewater after primary treatment while 50% of poorly soluble substances are removed (Ros and Berns, 1988). Other authors assume a primary sedimentation removal of 20%
127

IC-12 PULP, PAPER AND BOARD INDUSTRY
for dissolved substances, leaving 80% in solution. 90% of insoluble substances, like inks and toner constituents, are removed by primary sedimentation or clarification, leaving 10% in the wastewater (PIRA, 1991).
Sludges produced by flotation and clarification are dewatered and generally disposed to landfill.
3.3.3 Water consumption
In the absence of more specific information it should be assumed that the water consumption rates are similar to those at production sites. In the flotation process, because of the high concentrations of de-inking substances in the aqueous phase water is re-circulated. The wastewater production from this process is roughly in a range of 5 - 15 [m3.t-1] recycled paper material, whilst that from washing can range from 5 - 100 [m3.t-1] (Baumann and Herber-Liedtke, 1993).
3.3.4 Scale of operations
There are papermills producing each type of paper - newsprint, printing and writing, tissue and packaging - where the pulp input is 100% from waste. Therefore one assumption could be that the quantity of paper recycled will be similar to the quantity of paper produced, as discussed in Section 3.2.4. The worst case would be 100% recycled pulp used; this proportion could be reduced if more specific information was available. An alternative approach is to assume a number of sites where recycling takes places and to spread the total annual use of the substance evenly between them. The suggested number of sites to use is 10, i.e. each site processes 10% of the annual tonnage. This is the approach used in the emission scenario below.
3.3.5 Emission scenario
For a calculation based on the total usage of a chemical, the equation is:
Wr · RR · DR · (100 - P) (3) Nd · Ns 100 100 100
Unit
Explanation of symbols
Symbol Explanation Default
E emission per day [kg.d-1] Wr total annual consumption of substance on paper
[kg.y-1] data from notifier or calculated from paper making section
RR rate of paper recycling [%] default mean value for EU (Baumann and Herberg-Liedtke, 1993) 50 DR de-inking rate [%] specific information or Tables 7 and 8 Pa removal rate in on-site primary treatment (i.e. by adsorption) [%] specific information or see section 3.3.2 Nd number of working days [d] 250 Ns number of recycling sites [-] 10
E =
128

IC-12 PULP, PAPER AND BOARD INDUSTRY
These calculations take account of primary on-site treatment but not of any possible aerobic treatment on site. As with the production sites the volumes of water used are large and so these sites are likely to discharge to wastewater treatment plants which are larger than the default size of 2,000 m3.d-1.
4 EXAMPLE CALCULATIONS
4.1 PAPER MAKING
a. Cationic dye used at 1% of paper weight in tissue paper
Ws = 10 kg.t-1 (notifier) Q = 200 t.d-1 (Table 4) F = 95% (information from notifier or default) C = 40% (Table 6)
( ) ( )100
40100100
9510020010 −⋅
−⋅⋅=E (4)
= 60 kg.d-1
b. Anti-foaming agent used at 0.2 mg.l-1 in newsprint production
Cs = 2.10-4 kg.m-3 (notifier or Table 5) As = 30 m3.t-1 (Table 6) Q = 1,000 t.d-1 (Section 3.2.4) F = 0 (Table 5)
( )100
0100100030102E 4 −⋅⋅⋅⋅= (5)
= 6 kg.d
4.2
-1
PAPER RECYCLING
a. Mineral oil-based ink, 10 t.y-1 used
Ws =
Nd =
10,000 kg.y-1 RR = 50% (default) DR = 28% (Table 7) Pa = 50% (assumed poorly soluble, Section 3.3.2)
250 (default) Ns = 10 (default)
( )100
5010010028
10050
1025010000ER −
⋅⋅⋅⋅
= (6)
= 0.28 kg.d-1
129

IC-12 PULP, PAPER AND BOARD INDUSTRY
5 REFERENCES Baumann W and Herberg-Liedtke B (1993). Papierchemikalien - Daten und Fakte zum Umweltschutz, Springer Verlag.
BRE (1993). Guidelines for the Assessment of Environmental Exposure to Chemicals used in the Production and Use of Paper. Building Research Establishment (BRE), Garston, Watford, UK.
ETAD (1992). Guidelines for the Assessment of Environmental Exposure to Dyestuffs. Ecological and Toxicological Association of the Dyes and Organic Pigments Manufacturers (ETAD), Basel, Switzerland.
Kirk-Othmer, Encyclopedia of Chemical Technology, Wiley and Sons.
PIRA International. (1991). Paper Recycling Industry: Review of Processes and Effluent Composition. Prepared for the UK Department of the Environment.
Ros JPM and Berns JAS (1988). System for the Assessment of New Substances; Expected Emissions of Chemicals from the Paper Industry. National Institute of Public Health and Environmental Protection (RIVM), Bilthoven, the Netherlands.
130

IC-13 TEXTILE PROCESSING INDUSTRY
BPT 9 BIOCIDES USED AS PRESERVATIVES IN THE TEXTILE WET PROCESSING
ASSESSMENT OF ENVIRONMENTAL RELEASE OF CHEMICALS FROM THE
TEXTILE FINISHING INDUSTRY
131


IC-13 TEXTILE PROCESSING INDUSTRY
CONTENTS
1 INTRODUCTION ........................................................................................................................................... 135
138
138
139 140
142 142 143
143
144
145
146
146
146
147 147 147 149
150
150
153
153
154
154
155
155
156
156
156
157
158
2 MAIN PROCESSES........................................................................................................................................
2.1 YARN AND FABRIC FORMATION ...................................................................................................
2.2 WET PROCESSING .............................................................................................................................. 2.2.1 Fabric pretreatment........................................................................................................................ 2.2.2 Dyeing ........................................................................................................................................... 1412.2.3 Printing .......................................................................................................................................... 2.2.4 Whitening (optical brighteners) ..................................................................................................... 2.2.5 Finishing ........................................................................................................................................
2.3 WATER CONSUMPTION ....................................................................................................................
2.4 WASTEWATER TREATMENT ..........................................................................................................
3 CHEMICALS ..................................................................................................................................................
4 BIOCIDES .......................................................................................................................................................
5 RELEASE ESTIMATION .............................................................................................................................
5.1 DISTRIBUTION OF RELEASES.........................................................................................................
5.2 RELEASES DURING WET PROCESSING ....................................................................................... 5.2.1 Desizing and scouring.................................................................................................................... 5.2.2 Dyeing and finishing...................................................................................................................... 5.2.3 Releases during other life-cycle stages ..........................................................................................
6 BRANCH SPECIFIC PARAMETERS .........................................................................................................
6.1 DEFINITION OF A GENERIC POINT SOURCE .............................................................................
6.2 NUMBER OF WORKING DAYS .........................................................................................................
6.3 DEGREE OF FIXATION ......................................................................................................................
7 EMISSION CALCULATION: INDUSTRIAL CHEMICALS ...................................................................
7.1 DYES........................................................................................................................................................
7.2 FUNCTIONAL FINISHING CHEMICALS ........................................................................................
7.3 EXAMPLE OF CALCULATION .........................................................................................................
8 EMISSION CALCULATION: BIOCIDES ..................................................................................................
8.1 BIOCIDES FROM THE IMPORTED FIBRES/FABRICS................................................................
8.2 RELEASES FROM THE DIFFERENT STEPS OF INTRODUCTION BIOCIDE.........................
8.3 RELEASES FROM ARTICLES DURING THEIR SERVICE LIFE ...............................................
8.4 EXAMPLE OF CALCULATION .........................................................................................................
133

9 REFERENCES ................................................................................................................................................ 158
10 GLOSSARY ..................................................................................................................................................... 159
134

IC-13 TEXTILE PROCESSING INDUSTRY
1 INTRODUCTION
The purpose of this document is to provide a realistic worst-case emission scenario for the releases into the environment of I dustrial chemicals and dyes for the textile finishing industry and biocides used in the textile industry.
Biocidal products used for the preservation of textiles fall within Product Type 9 “ Fibre, leather, rubber and polymerised materials preservatives”, according to annex V of directive 98/8/EC. The current document only covers textile preservatives though. For biocidal products designed to preserved other types of material described in Product Type 9, other emission scenarios apply.
Synthetic fabrics are made of polymers and have a specific preparation. Thus, for biocides added during the formulation (compounding or preparation of master batches) of these polymers, the releases are treated in the scenario for plastic additives (BRE, 1998).
Textiles are manufactured mainly from the raw materials given in Table 1.
Table 1 Raw materials for textiles
Natural Man-made
Natural Synthetics
Cotton
Wool acetate polyamide
polyester
Jute
Linen
Silk rayon
polyacrylonitrile
polyvinyl
Animal fibres (keratin: wool, silk) are susceptible to attack by both microorganisms and insects. Cellulose fibres (cotton, linen…) are susceptible to attack by microorganisms, but not by insects (van der Poel, 1999). Yet, cellulose fibres are more sensitive to rot and mildew than animal fibres.
Blends of different types of fibres (e.g. cotton-polyester) are frequently used.
Textile finishing is a very diversified sector due to the processed raw materials, manufacturing techniques and finalised products. Trends in fashions cause a continuous change in colouring and functional finishing.
Biocides in textile industry are used to prevent deterioration by insects, fungi, algae and microorganisms and to impart hygienic finishes for specific applications. Sensitivity of the fibres differs on a case-by-case basis, but textiles made from natural fibres are generally more susceptible to biodeterioration than synthetic man-made fibres (Hamlyn, 1990).
Synthetic fibres are hardly ever subject to deterioration by microorganisms or insects, nevertheless two polymers are more sensitive than others: Polyvinyl chloride (PVC) and Polyurethanes (PUR) for which both biocides are added. Natural man-made fibres, such as rayon, are readily degraded by mildew and bacteria whereas acetate is more resistant.
The treatment with biocides can take place before textile processing (e.g. during storage and transport of the raw fibres) and at various stages of textile processing. Yarns may be treated or
135

IC-13 TEXTILE PROCESSING INDUSTRY
the fabrics as such. Different techniques can be applied according to the fibre used, the end product, etc. Especially, fabrics exposed to outdoor conditions and carpets are treated with biocides.
The textile finishing industry in Germany is characterised through a large number of small and middle class companies (Table 2). The product range, the treatment processes, the specific wastewater yield and also the use of chemicals vary widely among the individual companies. The processed goods for 1995 in Germany are approximately 529,900 t/a calculated by the German Association of the Textile Finishing Industry (Böhm et al., 1997).
Table 2 Number of companies and employees in Germany above 20 employees (Böhm et al. 1997)
Year Companies in Germany
Number Employees 1993 187 24,087 1994 23,017 1995 185 21,015
188
The main processed raw materials in Germany are cotton, polyester, viscose, mixture of cotton with synthetics and polyamide. Table 3 presents the part of finished raw material of most sites relating to the total production. Multiple nominations were possible.
Table 3 Finished raw material for textile finishing industry in Germany (Böhm et al., 1997)
Raw material Percentage of sites [%] Percentage of total production [%]
Cotton 73 33
17
Viscose 57 15
Mixture of cotton 55 10
Polyamide 39 10
Other natural fibres 30 2
Polyacrylonitrile 28 4
Mixture of wool 21 4
Wool 19 2
Other synthetic fibres 17 3
Sum 100
Polyester 62
136
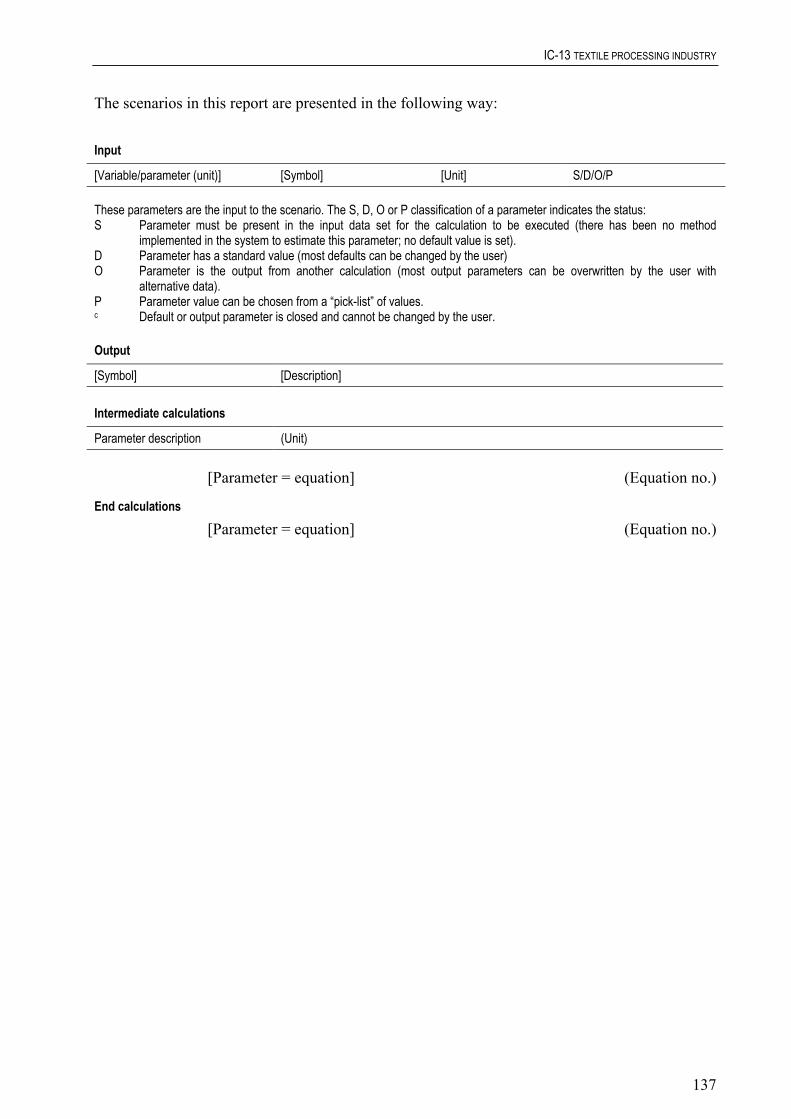
IC-13 TEXTILE PROCESSING INDUSTRY
The scenarios in this report are presented in the following way:
Input
[Variable/parameter (unit)] [Symbol] [Unit] S/D/O/P These parameters are the input to the scenario. The S, D, O or P classification of a parameter indicates the status: S Parameter must be present in the input data set for the calculation to be executed (there has been no method
implemented in the system to estimate this parameter; no default value is set). D Parameter has a standard value (most defaults can be changed by the user) O Parameter is the output from another calculation (most output parameters can be overwritten by the user with
alternative data). P Parameter value can be chosen from a “pick-list” of values.
c Default or output parameter is closed and cannot be changed by the user.
Output
[Symbol] [Description] Intermediate calculations
Parameter description (Unit)
End calculations
[Parameter = equation] (Equation no.)
[Parameter = equation] (Equation no.)
137

IC-13 TEXTILE PROCESSING INDUSTRY
2 MAIN PROCESSES
In the general way, the main textile process includes four steps as shown in Figure 1. Wet processing is the most environmentally relevant step.
2.1 YARN AND FABRIC FORMATION
Figure 1 Typical Textile Processing Flow Chart (US EPA, 1997)
Raw wool must be cleaned by wet processes before the fibre can be dry processed to produce fibre, yarn or fabric. Neither cotton, nor synthetic fibres requires this initial wet cleaning, named scouring or wool scouring, before processing (e.g. since raw sheep wool contains from 25 to
138

IC-13 TEXTILE PROCESSING INDUSTRY
75% suint, the production of one kilo of scoured wool fibres produces one and one half kilos of waste impurities) (UNEP/IEO, 1994).
Yarn formation: textile fibres are converted into yarn by grouping and twisting operations used to bind them together. Filament yarn can be used directly (knitting) or be further worked. Natural fibres need to go through different preparation steps before being spun into yarn. These steps are: opening/blending, carding, combing, drawing and drafting. Biocides against moths can be added during these steps.
For manmade fibres, just one step of texturising is needed before spinning (the process used resembles the manufacture of silk). Methods for making spun yarns from manmade fibres are similar to those used for natural fibres.
Fabric formation: the two major methods used are weaving and knitting. Weaving is the most common process and consists of interlacing yarns. Knitting is also frequently used. The main difference between knitting (dry process) and weaving is the sizing / desizing and mercerising operations (wet processes). So, there are no wastewater emissions at knitting except for cotton for which there is always wet processing, independent of the method of fabric formation.
• fabric pre-treatment (e.g. desizing, scouring, bleaching,... );
• functional finishing.
Tufting is a process used to make most carpets. One of the fundamental differences between tufting and weaving is that the pile and the carpet back are not formed at the same time. Tufting technique presumes an already constructed grounding layer or ground fabric also known as “primary backing”(US EPA, 1997; VITO, 1999).
2.2 WET PROCESSING
Wet processing enhances the appearance, durability and serviceability of fabrics by converting undyed and unfinished goods (“greige” goods) into finished goods. The fabric is definitely stabilised (strength, structure, yarn manufacture, preservatives,...).
For simplification, this stage can be divided in three main steps:
• dyeing and/or printing; whitening;
The use of chemicals occurs essentially in the dying and finishing processes; the use of biocides occurs essentially during the fabric preparation and the finishing processes as shown in Figure 2.
139

IC-13 TEXTILE PROCESSING INDUSTRY
Figure 2 Typical wet Processing Steps for Fabrics (US EPA, 1997)
2.2.1 Fabric pretreatment
Most fabric needs to be prepared before dyeing, printing or finishing. Preparation consists of a series of various treatments and rinsing steps. Depending on the fabric and the fibre type, one or more of the steps described below are not applicable.
The term “pre-treatment” summarises all types of wet finishing processes like scouring, desizing, mercerising, bleaching etc. of the fibres, fabric or yarn. The employed techniques depend upon factors such as type of process, type and quality of materials and desired effects of the final product.
140
IC-13 TEXTILE PROCESSING INDUSTRY
Desizing and scouring: These two operations are often combined. The first is a process for removing sizing compounds (e.g. starch, Polyvinyl Alcohol (PVA), Carboxymethyl Cellulose (CMC)) applied to yarns prior to weaving.
Scouring is a cleaning process for removing natural and acquired impurities (including biocides possibly added with size components) from fibres and fabric.
2.2.2 Dyeing
• hydrogen bindings vat and metal complexes.
• batch (discontinuous) dyeing,
• continuous dyeing.
Singeing: Dry process used on woven goods that must have a smooth finish. It removes fibres protruding from yarns or fabrics.
Bleaching: Process to whiten cotton, wool and some synthetic fibres by treatment in solutions containing hydrogen peroxide, chlorine dioxide, hypochloride, sodium perborate etc.
Mercerising: Process for increasing the tensile strength, lustre, sheen, dye affinity and abrasion resistance of cotton goods by impregnating the fabric with sodium hydroxide solution. Mercerising follows singeing and may either precede or follow bleaching (US EPA, 1997; EC, 1996).
Crabbing: Tensions are removed at wool fibres through hot water (analogical to thermofixing for synthetics).
Process of colouring cloth as a whole (dyeing) or specific areas (printing). Any process of coloration is characterised by the sequential operations of pre-treatment, dyeing and post dyeing. The process of fixing a dye on the fabric may be realised by various principles of binding, namely:
• covalent reactive dyes, • Electrostatic acid and cationic dyes, • adsorption disperse dyes,
Two methods of dying:
• exhaustion mode: dyestuff preparation is solved in water and fixed on textile fibre; • foulard technique: dyestuff preparation is put on rolls, press on textile and fixed by means of
steam, heat or chemicals.
Three types of dyeing processes, affecting the wastewater volume can be evaluated:
• semi-continuous dyeing,
Biocides may be added to the dyeing baths.
Discontinuous dyeing (also called batch dyeing) involves applying a dyestuff in solution or suspension at a specific liquor ratio which determines the depth of the colour obtained (generally from 0.1 to 1.0 [g/L]. At the end of the dyeing operation the spent dye-bath liquor is drained off. The post-dyeing stage consists of washing with water to remove unfixed amounts of dyestuff from the textile substrate. Common methods of batch or exhaust dying include beam, beck, jet and jig processes (US EPA, 1997).
Moth repellent treatment (permethrin in most cases) can be applied during dying by an exhaust process.
141

IC-13 TEXTILE PROCESSING INDUSTRY
Continuous dyeing is operated at constant composition, i.e. a long length of textile fabric is pulled through each stage of the dyeing process. In general these techniques are operating at high dyestuff concentrations of 10 to 100 [g/L] but do hardly generate wastewater beside equipment clean-up discharges. Biocides against rot and mildew are applied in an continuous process (immersion followed by squeezing the solution from the fabric). It is estimated that 70-80% of the biocide is adsorbed by the fabric (van der Poel, 1999).
Semi-continuous dyeing is characterised by performing dyeing in a continuous mode but fixation and washing steps are run discontinuously. Operation concentrations are in a range of 1 to 10 [g/L].
Recommended process
One potential improved process for dyeing is pad-batch dyeing. This method is one of the most reliable and controllable available today and has been used quite successfully in a wide variety of applications. Benefits include the limitation of the need for salt or chemical specialities from the dye bath, with associated cost savings and waste reduction.
In the pad-batch dyeing, prepared fabric is impregnated with liquor (water and process chemicals) containing premixed fibre reactive dyestuff and alkali. Excess liquid is squeezed out on a device known as a mangle. The fabric is then batched onto rolls or into boxes and covered with plastic film to prevent absorption of CO2 from air or evaporation of water. The fabric is then stored for two to twelve hours. The goods can be washed with becks, beams, or other available machines. Pad batch dyeing is more flexible than continuous dyeing methods. The flexibility of pad batch equipment and the use of water soluble dyes minimises cleaning operations.
Use of pad batch (cold) dyeing for cotton, rayon, and blends conserves energy, water, dyes and chemicals, labour, and floor space. While pad batch dyeing is a cost effective way for facilities to apply reactive dyes to cotton and rayon, this method may not achieve the desired final fabric properties for all cottons. Pad batch dyeing is also not appropriate for dyeing synthetic fabrics (US EPA, 1997; UNEP/IEO, 1994).
Pad dyeing can be continuous or discontinuous (batch).
2.2.3 Printing
Instead of colouring the whole cloth as in dyeing, print colour is applied only to specific areas by screen printing systems to achieve the planned design. Printing differs from dyeing by the pigments which do not require washing steps and generate little waste. Dye fixation is carried out by steaming or baking followed by washing to remove surplus dye and thickness. In principle three methods are available:
• printing with diffusing dyestuffs (printing - drying - fixation - washing), • printing with pigment (printing - drying - fixation ), • transfer printing (transfer paper - print on textile – paperwaste disposal).
2.2.4 Whitening (optical brighteners)
Fibres contain normally yellow colouring matters. In order to get a bright white or reddish or bluish shades optical brightness, e.g. fluorescent whitening agents (FWAs) are applied. Fluorescent whitening agents are mainly used in exhaustion or padding (never-dried technique),
142

IC-13 TEXTILE PROCESSING INDUSTRY
the later being the most important one due to economic advantages. FWAs used in textile can be roughly classified in 3 categories:
• anionic compounds which contain sulfuric acid groups, similar to acid dyes, effective on cotton, wool and polyamide yarns,
• cationic and amphoteric compounds and amphoteric with a similar behaviour as basic dyes, effective mainly on polyacrylonitrile, cellulose and polyamides,
• compound without solubilising groups, similar to disperse dyes, effective on polyesters, polyamides and cellulose acetate.
2.2.5 Finishing
To meet requests for special “effects” the bleached and/or dyed textile material (fibre, yarn or fabric) is submitted to one or more functional finishes. These processes may be chemical (e.g. stiffening, softening, water and soil repellent, mildew-, rot-, mothproofing, antistatic finishing, fire retardant finishing) or mechanical treatment (smoothness, roughness, shining). The finishing substances are used in aqueous solutions and fixed to the material. Chemical finishes are usually followed by drying, curing and cooling steps (US EPA, 1997; EC, 1996).
Foulard machines with several dipping baths, spraying or printing techniques as well as exhaustion processes or lick roll processes are commonly used. The main process is immersion dipping and usually the application of chemical additives takes place by continuous “padding” (impregnating and pressing out again) (EC, 1996; VITO, 1999).
For rugs and carpets, biocides are added with foam or sprays after the application of the backing layer (Bioexpo, 1998)
The ideal antimicrobial finish requires no additional process steps. It can be introduced from the same medium as softening agents or crease resisters.
2.3 WATER CONSUMPTION
The branch of textile finishing is characterised by many small and medium-sized enterprises (SMSE) which discharge predominantly (in Germany approximately 90%) to municipal sewage treatment plants. Only a few companies treat their wastewater more extensively.
Wastewaters are generated from bath dumps, washing and rinsing waters from removing the caustic and clean up waters both from the fibres and applicator equipment. Due to differences in processing equipment and requirements of the handled orders, type of dye, washing and rinsing procedures, etc. the wastewater volumes per processed unit vary considerably. Although the various processes are described separately it is not uncommon for two or more operations to occur in sequence in one single bath unit or on a continuous range.
Water consumption in France is 100 up to 150 m3 per tonne of fabric as shown in Table 4 (Personal communication, Institut Textile de France (ITF), 1999). This figure is in agreement with German data. Water consumption in Germany during wet processing of different fields is between 20 to 350 m3 per tonne of fabric (average: 120 m3/t) (Böhm et al., 1997, 2000; Hillenbrand et al., 1999). This is less than previous data on water use and confirms the decrease of water consumption in the textile industry (EC, 1996; UNEP/IEO, 1994). Natural fibres (e.g. cotton or wool) and their blends need more water than pure synthetic fibres (polyamides (PA), polyethylene sulfate (PES), polyamides carbonate (PAC). The amount of water depends also of the ennobled product (spun yarns, fabrics or finished goods) and of the process as shown in Table 5.
143

IC-13 TEXTILE PROCESSING INDUSTRY
Table 4 Water Consumption during wet Processing (ITF, 1999)
Substrate Water consumption [m3 / t]
Average 1) Maximum
Cotton 100 – 150 (250 – 350) 200
50 – 100 (200 – 300)
Polyamide (piece) 50 – 100 (125 – 150) 150
Polyester (piece) 50 – 100 (100 – 200) 150
Acrylic (piece) 50 – 100 (100 – 220) 150
Wool (piece) 150
1) Figures in italic are reported from the TGD (EC, 1996) for water consumption during wet processing.
Table 5 Water Use in wet Processing (UNEP/IEO, 1994)
Sub-category Amounts of water typically used in L/kg of fabric treated
Minimum Median Maximum
Wool finishing 110.9 283.6 657.2
Dry processing 0.8 9.2 140.1
Woven fabric finishing
simple processing 12.5 78.4 275.2
complex processing 10.8 86.7 276.9
c. p. plus desizing 5 113.4 507.9
Knit fabric finishing
simple processing 8.3 135.9 392.8
complex processing 20 83.4 377.8
hosiery products 5.8 69.2 289.4
carpet finishing 8.3 46.7 162.6
stock and yarn finishing 3.3 100.1 557.1
2.4 WASTEWATER TREATMENT
A recent study in Germany revealed the following data. Out of a total of 127 textile finishing companies discharge 14 (11%) plants their wastewater directly into surface waters and 113 plants into municipal sewage treatment plants (Böhm et al., 1997; Hillenbrand, 1999). More details on the wastewater treatment are presented in Table 6.
144

IC-13 TEXTILE PROCESSING INDUSTRY
Table 6 Wastewater treatment in the textile finishing iIndustry in Germany (Böhm et al. 1997; Hillenbrand et al. 1999)
Wastewater Treatment Direct discharge Indirect discharge Yes No number Yes No Number Settling tanks 12 2 14 55 58 113 Sieves 6 8 14 29 84 113 Neutralisation 5 9 14 51 62
12 101 113 Recycling of wastewater into production 3 11 14 10 103 113 Other treatment Of which: biological treatment
6 2
10 5
Companies that initiated measures Of which: treatment measures Of which: Wastewater recycling
8 2 2
36 18 12
Companies that plan measures Of which: treatment measures Of which: wastewater recycling
12 9 1
38 19 10
113 Precipitation 2 14 12
3 CHEMICALS
The following groups of chemicals are especially important as process materials for textile finishing: sizes, bleaches, dyes, dye solvents, carriers, optical whiteners, waterproofing agents, surfactants and others.
Table 7 Survey about Process Materials (Böhm et al., 1997)
Class of chemical Example
Auxiliary-finishing products for fibres and yarn spin bath additive, spool oil
Preparative chemicals bleaching assistant
Auxiliary products for dyeing and printing dyestuff solvent, dyeing activator
Finishing products optical brighteners, water repellent agent
Universal auxiliary products surfactant, defoaming agent
Dyestuff may be categorised in:
• acid dyes: anionic dyes with affinity to protein, polyamide and acrylic-functional groups of substrates. Exhaustion of the dye bath is normally enhanced as pH is lowered;
• cationic dyes: cationic salt of a dye base with affinity to protein fibres and synthetic acrylates;
• direct dyes: anionic or cationic dyes which are substantive to cellulose fibres; • disperse dyes: neutral dyes, which are sparingly soluble in water and which are applied to
polyester, cellulose ester and polyamide fibres; • reactive dyes: dyes that have the property of forming covalent bonds with the fibres; • sulphur dyes, vat dyes: water insoluble dyes which are normally applied in the reduced
water soluble (leuco) form and subsequently de-oxidised into the insoluble form on the textile substrate.
145

IC-13 TEXTILE PROCESSING INDUSTRY
4 BIOCIDES
Biocides such as pentachlorophenol (PCP) or organo-mercury are not allowed anymore in Europe because of their persistent and cumulative toxic effects. The alternatives compounds are pyrethroids and mixture of pyrethroids, pyrimidine derivates (e.g. chlorophenylid, permethrin and ammoniumfluorsilicates), thiazol derivatives and chlorinated hydroxydiphenylethers (Bioexpo, 1998; Debon, 1999; Ciba Spécialités Chimiques, personal communicaion, 2001).
Fungicides (e.g. organo copper compounds like copper naphtenate and copper 8 hydroxyquinolinate) are also frequently used. These biocides are extremely versatile and very effective against fungi, bacteria and algae.
Preservatives are mainly applied in cellulose to prevent rot and mildew. They are often applied in the finishing process, where biocides are added together with antistatics, water repellents, dyes, etc. They are applied in aqueous solutions of 0.25 – 1% in baths through which the fabric is transported (Bioexpo, 1998). 70-80% of the biocides are adsorbed by the fabric (Institut Textile de France (ITF), personal communication, 1999). The fixation rate is very high (up to 100%), if the agents are applied in a bath process where the liquor ratio influences the degree of fixation.
Typical biocides used in the textile industry are (Rossmoore, 1995):
• 2,2’-Dihydroxy-5,5’-dichlorodiphenylmethane, • 2-Phenylphenol, • Sodium-2-phenyl-phenolate, • Quaternary ammonium salts,
• Dichlorophen,
The wastewater is by far the largest waste stream. It is generated by:
• Copper-8-quinolinolate,
• Zinc naphthenate, • Thiobendazone, • Organotin compounds, • 2,4-Dichlorobenzyl alchohol, • 2-Bromo-2-nitropropane-1,3-diol.
5 RELEASE ESTIMATION
5.1 DISTRIBUTION OF RELEASES
In the textile industry, air emissions are a minor source of pollution compared with many other industries. Emissions to the air are considered to be a negligible pathway, due to the high attachment characteristics of the biocidal compounds (Luttik and al, 1993). Operations that represent the greatest concern are coating, finishing and dyeing (US EPA, 1997).
• washing and rinsing cycles (major sources); • bath dumps; • equipment clean-up (EC, 1996).
146

IC-13 TEXTILE PROCESSING INDUSTRY
5.2 RELEASES DURING WET PROCESSING
The wet processing (preparation, dyeing and finishing) accounts for the majority of the wastewater.
5.2.1 Desizing and scouring
The first release occurs during the desizing/scouring step. It is one of the industry’s largest sources of wastewater pollutants. Biocides applied during sizing (e.g. moth repellents) can be removed in wastewater during the desizing step.
In addition, imported fabrics (such as raw wool or cotton) already contains some biocides or pesticides applied for preservation during storage and transport. These biocides are removed by rinsing and released with wastewater almost completely. Yet, it is very difficult to know which and how many of these biocides or pesticides have been applied and so will not be included in the scenario. Examples are shown in Table 8.
Table 8 Preservative chemicals on imported clothes (CEC, 1993)
Material Biocides Concentration range (µg/kg cloth)
Wool p, p’ – DDE 0.07 to 0.38
Heptachlor 0.03 to 0.12
Default 0.38
Cotton p, p’ – DDE 0.85 to 4.5
p, p’ – DDD 0.09 to 12.8
p, p’ – DDT n.d. (not detected) to 12.4
Heptachlor 0.13 to 0.45
default 12.4
PCB – 28/31 0.15 to 0.34
5.2.2 Dyeing and finishing
Dyeing operations generate a large portion of the industry’s total wastewater. Releases can take place at two stages of the impregnation process, namely at the discharge of the spent bath liquid and at the discharge of the water used for the wash-out (Luttik and al, 1993).
Finishing processes generate wastewater containing natural and synthetic polymers and a range of potentially toxic substances (US EPA, 1997; UNEP/IEO, 1994). Biocides are often incorporated with finishing products such as water repellents, fire retardants, etc. in proportions of 0.5 to 2% (data on moth repellents treatment are presented in Table 8). The degree of fixation of biocides has been estimated to amount 70 – 80% (Institut Textile de France (ITF), personal communication, 1999).
Moth-repellents are usually applied to wool by exhaust techniques and the degree of fixation can be up to 98% and more (Ciba Spécialités Chimiques, personal communication, 2001).
Wastewater
147

IC-13 TEXTILE PROCESSING INDUSTRY
Air emissions
Toxic chemicals used in dyeing and finishing operations are emitted from dyeing machines and/or dryers. After dyeing or finishing, products are dried on continuous machines in closed or semi-open conditions.
Other sources of air emissions are from organic solvent vapour releases during and after drying, finishing and solvent processing operations. Yet, the application of finishing products and biocides in an aqueous solution is more and more preferred to a solvent solution. Some biocides (e.g. moth repellents) are applied by spraying with foulard machines. Spraying is a dry technique in which the moth resistant substance is applied on the pile of the carpet.
Remark
Biocidal treatment can take place by foam application during dyeing or finishing, notably on carpets. Zero wastewater emissions can be obtained, yet, some products are not suitable for making into foams and the removal of the foams can be very difficult. The use of “mini-bowls” is developing in the UK, for the wash-out steps, to reduce water consumption and limit the risks of releases in the environment.
Table 9 presents the moth repellents applied at the moment (Debon, 1999). Concerning the concentration in the wastewater and mass discharge according to the process and the substances concerned, CEC (1993) provides some examples which are reported in Table 10.
Table 9 Constitution and rates of application of currently applied moth repellents for wool (Debon, 1999)
Active content of formulation Active component [% w/v] [% w/w]
Amount of agent applied [%w/w]
Amount of agent applied [kg/t]
Permethrin 9.00 10.00 0.35 – 1.81
10.00 12.05 0.029 - 0.150 0.29 – 1.51
8.30 10.00 0.035 - 0.181 0.35 – 1.81
Sulcofuron 46.40 40.00 0.800 8
37.95 33.00 0.970 9.7
Permethrin/HHP * 10.00 10.00 0.055 – 0.0825 0.55 – 0.825
0.035 - 0.181
* HHP: Hexahydropyrimidine
As a worst case, a default value of 1% w/w (i.e. 10 kg/t) can be proposed if no further data is available.
Note: Partial degradation of an active substance can occur within the process. This is not considered in this document. If data on degradation within the process is available, they can be taken into account in the release estimation.
148

IC-13 TEXTILE PROCESSING INDUSTRY
Table 10 Emission concentration and mass discharge according to the process and the biocide (EC, 1993)
Process Biocide Emission concentration Mass discharge Remarks Desizing preservatives not available 0.1 to 0.5 g/t estimated Finishing Dieldrin 0.4 mg/L Not available analysed
Permethrin 0.16 to 34 mg/L 1.7 to 8 g/t wool estimated
Dieldrin seems not to be used any more in Europe.
5.2.3 Releases during other life-cycle stages
Releases may occur during other life-cycle stages, e.g. the final use of textile articles and the elimination of textile articles.
The main application of preservatives for textiles is for preservation of textiles for outdoor applications. Preserved textiles are used for tents, tarpaulins, awnings, sunblinds, parasols, sails, waterproof clothing. Virtually all textiles used for outdoor applications except clothing seem to be preserved with biocides. For indoor applications mainly woollen articles are concerned as well as shower curtains and in some instances mattress ticking.
It is actually only for cotton textiles that the primary function of the preservatives is to preserve the fibres itself. Today cotton seems mostly (apart form clothing) to be used for garden furniture fabric whereas it has been replaced by synthetic fibres for other applications. According to the producers of tents, awnings, one of the reasons for this substitution is that the biocides on the market today do not provide the necessary protection of the cotton fabric. Cotton fabric was formerly preserved with pentachlorophenol (PCP), which is now prohibited in most EU countries.
Textiles and clothing imported from sub-tropical and tropical areas, especially from Eastern Asia, may contain small amounts of biocides applied for preservation of the textiles during transport and storage in the humid and warm climate. The biocides are applied by spraying the biocides into the containers and can be found in trace amount in textiles. Among the biocides, PCP seems to some extent still to be used in Asia for this purpose.
Based on the present information it is estimated that approximately 600 − 1,400 tonnes preserved textile with tents, awnings, sails, etc, is annually used in Denmark. No data are available for other EU countries. The most common biocides in textiles used for production of tents and awnings in Denmark are applied at about 1.5 g.kg-1. Based on this it is estimated that the preserved textiles contain between 0.1 and 0.2% active agents. (Danish Environmental Protection Agency, 2001).
To assess emission, service life of treated articles need to be known. Some preliminary values are presented in Table 11.
149

IC-13 TEXTILE PROCESSING INDUSTRY
Table 11 Service life of few articles (Ciba Spécialités Chimiques, personal communication, Serrurerie Luçonnaise, Décorum, Mondial Moquette, St Maclou, Eurotapis, Ecodécoration, Val d'Oise Vacances, Air E Soleil, 2001).
Articles Service life (years)
Clothes on contact with skin 1
Others clothes and bed linen 2 - 5
Household linen 5 - 10
Bedding (mattress) 10
Carpets 8 - 20
Wall-to-wall carpet 5 -30
Sunblind 8 - 15
Tents 5 - 20
Awning 2
6.1
A large part of the biocides remaining in the finished articles can be released to the environment during the service life of the textile articles. For volatile substances, a total release to the atmosphere can be assumed (Fatm = 1). Furthermore for indoor articles subject to cleaning, a total release to wastewater can be assumed (Fwat = 1). And finally, for outdoor articles, a total release to wastewater and soil can be assumed (Fwat = 0.5 and Fsoil = 0.5). All of these releases will be diffuse and relevant only for a regional exposure assessment. A considerable amount of textiles, mainly clothes, will be exported after use by charity organisations. This is not yet taken into account by the present model.
Regarding waste elimination, a generic model for releases from landfills is under development and might be used once the model is available.
6 BRANCH SPECIFIC PARAMETERS
DEFINITION OF A GENERIC POINT SOURCE
New statistical data for wastewater, dilution factors and production quantities for the textile finishing industry were obtained and statistically evaluated in a recent research project “Abwassereinleiter-Statistik” (wastewater statistics) of Umweltbundesamt (Böhm et al., 1997, 2000). A comprehensive questionnaire was sent to companies in this branch and the data received were used to examine standard default values so far applied in the EU for risk assessment in the aquatic compartment, e.g. the production volume per day, the flow rate of sewage treatment plant (EFFLUENTstp) and the dilution factors of receiving water (DILUTION). The return rate of the questionnaire was about 60%, so that the survey can be regarded as representative for Germany and the data could be evaluated statistically.
The following calculation factor “CF” was introduced and defined as follows:
DILUTIONEFFLUENTQ
CFSTP
product
⋅=
(1)
150

IC-13 TEXTILE PROCESSING INDUSTRY
Explanation of symbols
CF mass of product per day divided by volume of river water per day [kg/m³] Qproduct daily production volume [t/d] EFFLUENTSTP flow rate of wastewater treatment plant [m³/d] DILUTION dilution factor effluent to receiving surface waters [-].
This calculation factor was determined for each textile processing site (company) separately. All these factors (CF) were then evaluated statistically to obtain the average, the median and the 90 percentile. This procedure was seen as the best method to determine factors that depend on the location and are independent of the chemical involved. The smaller the calculation factors are, the lower is the concentration of a substance in the surface waters. Table 12 presents a summary of 90 and 10 percentile results of this research project (Böhm et al., 1997, 2000). 10 Percentile means, that 90% of results are higher. 90 Percentile means, that 10% of results are higher.
Table 12 Statistically derived data for the textile finishing industry in Germany (Böhm et al., 1997, 2000)
Textile finishing companies
No. of companies
Production volume [t/d]
DILUTION EFFLUENTstp [m3/d]
CF [kg/m3]
n 10 percentile 10 percentile 90 percentile
Branch, total 127 14.4 2 1,236 0.64
Dyeing companies, total 107 16.4 2 1,112 0.71
Companies using >90% cotton
15 9.9 3 1,420 1.16
Companies using >90% natural fibres
31 11.7 3 1,130 0.94
Companies using >90% synthetics
26 13.7 3 2,251 0.29
Companies using >90% polyester
7 6.5 3 1,586 0.04
Companies using optical whiteners
86 14.2 2 1,215 0.61
- 3 10 2,000 0.15 EU standard values
In order to define a generic EU point source for the textile finishing industry in Europe the following procedure was followed. Based on the EU standard values EFFLUENTSTP = 2,000 m³/day and DILUTION factor of 10, a generic (representative) daily production volume Qproduct was calculated with formula (2). The statistical results of site specific CF-values and the related values for the production volume per day (Qproduct) are listed in Table 13. These production volumes for different fabrics were calculated with the following formula:
Qproduct = CF.EFFLUENTSTP.DILUTION (2)
Where: Qproduct = generic daily production volume of the fabric [t/d] CF = calculation factor from Table 13 [kg/m3] EFFLUENTSTP = 2,000 m3/d DILUTION = 10
151
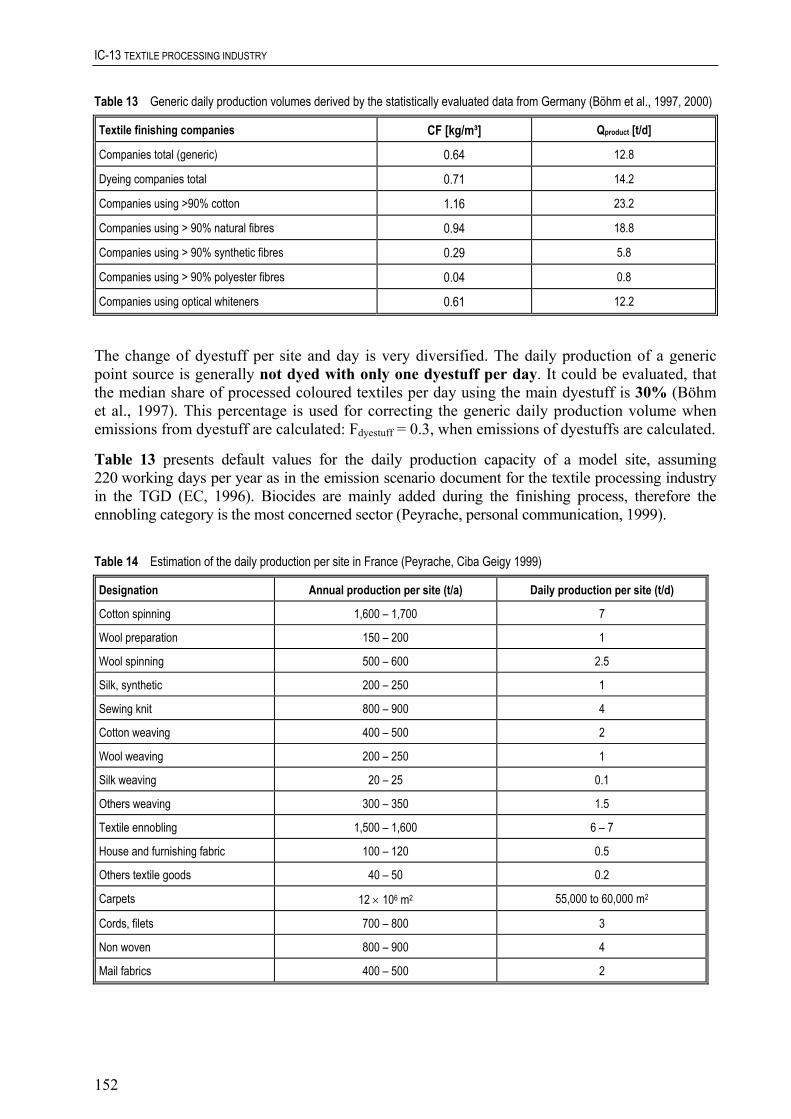
IC-13 TEXTILE PROCESSING INDUSTRY
Table 13 Generic daily production volumes derived by the statistically evaluated data from Germany (Böhm et al., 1997, 2000)
Textile finishing companies CF [kg/m³] Qproduct [t/d]
Companies total (generic) 0.64 12.8
Dyeing companies total 0.71 14.2
Companies using >90% cotton 1.16 23.2
Companies using > 90% natural fibres 0.94 18.8
Companies using > 90% synthetic fibres 0.29 5.8
0.04 0.8
Companies using optical whiteners 0.61 12.2
Companies using > 90% polyester fibres
The change of dyestuff per site and day is very diversified. The daily production of a generic point source is generally not dyed with only one dyestuff per day. It could be evaluated, that the median share of processed coloured textiles per day using the main dyestuff is 30% (Böhm et al., 1997). This percentage is used for correcting the generic daily production volume when emissions from dyestuff are calculated: Fdyestuff = 0.3, when emissions of dyestuffs are calculated.
Table 13 presents default values for the daily production capacity of a model site, assuming 220 working days per year as in the emission scenario document for the textile processing industry in the TGD (EC, 1996). Biocides are mainly added during the finishing process, therefore the ennobling category is the most concerned sector (Peyrache, personal communication, 1999).
Table 14 Estimation of the daily production per site in France (Peyrache, Ciba Geigy 1999)
Designation Annual production per site (t/a) Daily production per site (t/d)
Cotton spinning 1,600 – 1,700 7
Wool preparation 150 – 200 1
Wool spinning 500 – 600 2.5
Silk, synthetic 200 – 250 1
Sewing knit 800 – 900 4
Cotton weaving 400 – 500 2
Wool weaving 200 – 250 1
Silk weaving 20 – 25 0.1
Others weaving 300 – 350 1.5
Textile ennobling 1,500 – 1,600 6 – 7
House and furnishing fabric 100 – 120 0.5
Others textile goods 40 – 50 0.2
Carpets 12 × 106 m2 55,000 to 60,000 m2
Cords, filets 700 – 800 3
Non woven 800 – 900 4
Mail fabrics 400 – 500 2
152

IC-13 TEXTILE PROCESSING INDUSTRY
According to Ciba Spécialités Chimiques (personal communication, 2001), the values for France in Table 14 might be lower than for other European countries.
For a first approach, the values in Table 13 are used for the default release estimation.
If further information regarding the application at different process steps is available, the values from Table 14 can also be used.
6.2 NUMBER OF WORKING DAYS
The median of number of working days in 1995 was 225 days per year (arithmetical mean: 228 days per year) (Böhm et al., 1997, 2000).
6.3 DEGREE OF FIXATION
Two key parameters determine the emissions via the water path:
• the mass of dyestuff used per mass of good (fabric) and the • degree of fixation.
The degree of fixation depends on affinity of the chemical to the fibre, liquor ratio, temperature, time, pH and chemical additions. Therefore thorough knowledge about optimum conditions is necessary to minimise losses to the wastewater. Normally, the degree of fixation is taken from the chemical dossier.
Estimates for parameters for type of dye and the degrees of fixation in dyeing and printing operations are given in Table 15. Washing processes are included in the degrees of fixation.
Table 15 Estimated degree of fixation for different types of dyes, processes and fibres (EC, 1992)
Type of Dye Process 1) Type of fibre 2) Average degree of fixation [%]
Range [%]
Disperse c CE, PES 95 88 - 99
Disperse p 97 91 - 99
Direct b C 88 64 - 96
Reactive b W 95 90 - 97
Reactive b C 70 55 - 80
Reactive b general 85 55 - 95
Vat c C, 80 70 - 95
Vat p 75 70 - 80
Sulfur c C 70 60 - 90
Sulfur p 70 65 - 95
Acid, 1 SO3-group b PAM, PAC 90 85 - 93
Acid, >1 SO3-group b 95% 85 – 98
Table 15 continued overleaf
153

IC-13 TEXTILE PROCESSING INDUSTRY
Table 15 continued Estimated degree of fixation for different types of dyes, processes and fibres
Type of Dye Process 1) Type of fibre 2) Average degree of fixation [%]
Range [%]
Basic b PAC, PES, PAM, C 99 96 - 100
Azoic (naphtol) c 84 76 - 89
Azoic (naphtol) p 87 80 - 91
Metal complex b 94 82 - 98
Pigment c 100
Pigment p 100 98 - 100
Unknown/hardly soluble c 97 85 - 99.5
Unknown/acid groups p 96 84 - 99
1) Processes: c = continuous dying; p = printing; b = batch dyeing 2) Fibres: P = protein; C = cotton; W = wool; CE = cellulose; PES = polyester; PAM = polyamide, PAC = polyacryle
7 EMISSION CALCULATION: INDUSTRIAL CHEMICALS
The life stages “production” and “formulation” of the respective industrial chemical or biocide can be calculated by applying the appropriate A- and B-Tables Chapter 3, Appendix I.
The water pathway to wastewater discharge via the company and municipal sewage treatment plant by far is the predominant pathway. If relevant, the “air” and “soil” pathway can be calculated by the respective A- and B-Tables Chapter 3, Appendix I.
7.1 DYES
The water pathway is the predominant pathway for chemicals used in the textile industry. The local emission of a chemical to surface water during a working day is calculated as follows:
Input
Mass of fabric processed per day Qproduct t.d-1 Table 13 D Fraction of fabric dyed with one dyestuff per day Fdyef - 0.3 D Mass of dyestuff-preparation per mass of fabric Qdye kg.t-1 10 D/S 1) Content of dyestuff chemical in preparation Cdye - 1 D/S 2) Degree of fixation Ffixation - Table 15 D/S Output Local emission of dyestuff per day to wastewater Elocalwater kg.d-1 O
1) If no specific data are available, it should be assumed that the average mass of dyestuff preparation (Qdye) is 10 kg dyestuff preparation per tonne of fabric or 1%.
2) If the content of dyestuff in the preparation is not available, it should be assumed as 100%.
154

IC-13 TEXTILE PROCESSING INDUSTRY
Model calculation
Elocalwater = Qproduct.Fdye.Qdye .Cdye.(1-Ffixation) (3)
7.2 FUNCTIONAL FINISHING CHEMICALS
To meet requests for special effects the bleached and/or dyed textile material is submitted to one or more functional finishes. These processes may be mechanical procedures (smoothness, roughness, shining) or chemical treatment (e.g. stiffening, softening, water and soil repellent, mildew-, rot-, mothproofing, antistatic finishing, fire retardant finishing). The finishing substances are used in aqueous solutions and fixed to the material. Foulard machines with several dipping baths, spraying or painting techniques as well as exhaustion processes or lick-roll processes are commonly used.
The local emission of chemical to water during a working day is calculated as:
Input
Mass of fabric processed per day Qproduct t.d-1 Table 13 D Mass of chemical preparation per mass of fabric Qchemical kg.t-1 S Content of chemical in preparation Cchemical - 1 D/S 1) Fraction of chemical removed, fixed or converted during processing
Ffixation - 0 D/S
Degree of fixation Ffixation - Table 15 D/S Output Local emission of chemical per day to wastewater Elocalwater kg.d-1 O
1) If the content of chemical in the formulation is not available, it should be assumed as 100%
Model calculation
Elocalwater = Qproduct.Qchemical.Cchemical.(1-Ffixation) (4)
7.3 EXAMPLE OF CALCULATION
The daily emissions of a reactive dyestuff for cotton are calculated as follows:
Qproduct = 23.2 [t/d] generic daily production for cotton: Table 13 Fdye = 0.3 Qdye = 10 [kg/t] Cdye = 0.5 Ffixation = 0.85 default: Table 15
Elocalwater = Qproduct.Fdye.Qdye.Cdye.(1-Ffixation)
Elocalwater = 23.2 t/d.0.3.10 kg/t.0.5.0.15 = 5.2 kg/d.
155

IC-13 TEXTILE PROCESSING INDUSTRY
8 EMISSION CALCULATION: BIOCIDES
The release estimation is performed on a local scale except for releases from articles during service life. Only releases to wastewater during wet processing are taken into account in the calculation according to the lack of data regarding emissions to air.
8.1 BIOCIDES FROM THE IMPORTED FIBRES/FABRICS
Imported fabrics may release some biocides during the desizing / scouring step. These biocides are almost completely removed in wastewater. Releases can then be estimated with the following model.
Variable/parameter (unit) Symbol Unit Default S/D/O/P
Input
Quantity of fibres / fabrics treated per day (cf. Table 14) Qfibres t.d-1 D/P Estimated content of active substance present on imported material (cf. Section 5.2.1)
Cactive mg.kg-1 0.01 S/D
Output
Local emission of active substance to wastewater from imported fibres
Elocali,water kg.d-1 O
Model calculation
Elocali,water = Qfibres.Cactive / 1,000 (5)
Remark
The values of concentration of biocides on imported fabrics are often very low and may be considered as negligible, compared to the releases due to application steps (cf. below).
8.2 RELEASES FROM THE DIFFERENT STEPS OF INTRODUCTION BIOCIDE
At each step of application of a biocide, releases may occur. Those steps are: desizing / scouring, dyeing and finishing. In most cases, for these three steps the process used implies essentially releases to wastewater. Thus, only the degree of fixation of the substance is considered in the calculation, and for each step the release can be estimated using the model below. Emissions for the whole textile process can then be estimated, in case that the same substance is concerned in each step (which is difficult to know for releases from imported fabrics).
156

IC-13 TEXTILE PROCESSING INDUSTRY
Variable/parameter (unit) Symbol Unit Default S/D/O/P
Input
Quantity of fibres / fabrics treated per day (cf. Table 14) Qfibres t.d-1 D/P Quantity of active substance applied per ton of fibres / fabrics for one treatment step (cf. Section 5.2.2)
Qx_active* kg.t-1 S/D
Fixation rate (cf. Section 5.2.2) Ffix 0.7 S/D Output
Local emission of active substance to wastewater for one treatment step
Elocalx,water * kg.d-1 O
Total local emission of active substance Elocaltot,water kg.d-1 0
* x represents a treatment step (desizing / scouring, dyeing, finishing).
Model calculation
Elocalx,water = Qfibres.Qx_active.(1 − Ffix) (6)
Elocaltot,water = Elocali,water + Σ Elocalx,water (7)
8.3 RELEASES FROM ARTICLES DURING THEIR SERVICE LIFE
Articles may have a service life longer than one year. Biocides in such articles may accumulate in society. Thus the release estimation is treated in this scenario.
Input
Annual input of the substance in article k Qtotk t.y-1 S Fraction of the continent Fcont - 0.9 D Fraction of the region Freg - 0.1 D Service life of article k (cf. Table 11) Tservicek y P Fraction of tonnage released over one year during service life to compartment j (cf. Section 5.2.3)
Fj - D
Emission duration per year Nd d.y-1 365 D Output
Total release to compartment j RELEASEtotk,j t.d-1 O Continental release to compartment j RELEASEcontk,j O Regional release to compartment j RELEASEregk,j
Model calculation
( ) 365/F1QtotFRELEASEtot1yTservice
1yjkjj,k
k
−⋅⋅=
−
=∑
RELEASEcont Fk,j = RELEASEtotk,j. cont
RELEASEregk,j = RELEASEtotk,j.Freg
157

IC-13 TEXTILE PROCESSING INDUSTRY
8.4 EXAMPLE OF CALCULATION
Cotton is treated in the three steps (desizing/scouring, dyeing and finishing) with permethrin:
Qproduct = 23,200 kg/d default of Table 13 Qbiocide(x) = 1,810 mg/kg Permethrin, Table 9 x = 3 for steps: desizing / scouring, dyeing and finishing
Ffixation = 0.7
Bioexpo (1998). Development of a Concept for the Environmental Risk Assessment of Biocidal Products for Authorization Purposes (Bioexpo). Fibre, Leather, Rubber and Polymerised Materials Preservatives (Product Type 9). TNO Institute for Environmental Sciences, Energy Research and Process Innovation. Research Project No. FKZ 106 01 065 of Umweltbundesamt, Berlin.
Hillenbrand T, Böhm E, Landwehr M, Marscheider-Weidemann (1999). Die Abwassersituation in der deutschen Papier-, Textil- und Lederindustrie – Repräsentative Bestandsaufnahme für die Bewertung chemischer Stoffe, gwf Wasser Abwasser, 140(4) 267-273.
default
Elocalwater = 3 {23,200 kg/d.1,810 mg/kg.0.3} = 37.8 g/d
9 REFERENCES
Böhm E, Hillenbrand T, Landwehr M, Marscheider-Weidemann F, Corley MS (1997). Statistik wichtiger industrieller und gewerblicher Branchen zur Bewertung der Umweltgefährlichkeit von Stoffen (Investigation on wastewater: Statistical Evaluation of Industrial Effluents for Risk Assessment of Substances). Fraunhofer Institut für Systemtechnik und Innovationsforschung, Karlsruhe Untersuchungen zur Abwassereinleitung, Umweltbundesamt, Research Report, Projekt number: 206 04 144/01.
Böhm E, Hillenbrand T, Marscheider-Weidemann F, Schubert D (2000). Bewertung der Umweltgefährlichkeit von Stoffen. Erhebung und statistische Auswertung von Produktions- und Abwasserkennwerten für die Branchen Papiererzeugung, Textilveredlung, Ledererzeugung (Risk assessment for substances (Statistical evaluation on production and effluents in three industrial branches: paper and pulp, textile finishing and leather industries). UWSF-Z. Umweltchem. Ökotox. 12(1), 21-26.
BRE (1998). Use Category Document. Plastic additives. Building Research Establishment (BRE).
Danish Environmental Protection Agency (2001). Inventory of Biocides used in Denmark. Environmental Project N° 585.
Debon A (1999). Les traitements chimiques de la laine. Bulletin du Comité pour les applications des insecticides dans les locaux et la protection des denrées alimentaires (C.I.L.D.A.), n°30, 47-76.
EC (1992). Technical and Economic Aspects of Measures to Reduce Water Pollution from the Textile Finishing Industry. Commission of the European Communities DG XI/A/3, ECT/330795.01.
EC (1993). Guidelines for Selection of Best Available Technology (BAT) for Integrated Pollution Prevention & Control in the Textile Dyeing and Carpet Mothproofing Sectors. L212-14-1004. Final draft. 51 p.
EC (1996). Technical Guidance Document on Risk Assessment in support of Commission Directive 93/67/EEC on Risk assessment for new notified substances and Commission Regulation (EC) 1488/94 on Risk assessment for existing substances. Parts 1-4. European Commission (EC), Office for Official Publications of the EC, Luxembourg.
Hamlyn PF (1990). Talking rot…and mildew. Textiles 19(2), 46-50.
Luttik R, Emans HJB, van der Poel P and Linders JBHJ (1993). Evaluation System for Pesticides (ESPE), 2. Non-Agricultural Pesticides, to be incorporated into the Uniform System for the Evaluation of Substances (USES). National Institute of Public Health and Environmental Protection (RIVM), RIVM Report 679102021, Bilthoven, The Netherlands.
158
IC-13 TEXTILE PROCESSING INDUSTRY
Rossmoore HW (1995). Handbook of Biocide and Preservative Use, Blackie Academic & Professional, London, Glasgow, Weinheim.
UNEP/IEO (1994). The Textile Industry and the Environment. Technical report n° 16. 120 p.
US EPA (1997). Profile of the Textile Industry. US Environmental Protection Agency (US EPA), Office of Compliance Sector Notebook Project: EPA/310-R-97-009, Washington, DC, 133 p.
van der Poel P (1999). Supplement to the Uniform System for the Evaluation of Substances (USES). Emission Scenarios for Waste Treatment (elaborated for biocides). RIVM report no. 601450003, Bilthoven, The Netherlands.
VITO (1999). Best Available Technique in Textile Wet Processing (BATEM), http://www.atc.gr/batem.
Singeing: Cloth is passed across an open gas flame at a high speed to burn off the loose surface fibres.
10 GLOSSARY Beam: Any of a series of machines for dyeing which use a perforated beam through which the dye bath is circulated.
Beck: Any of a series of machines for scouring (cleaning), dyeing, etc., goods while in the form of rope or continuous belt. A roller gradually moves the cloth through the bath in a slack condition.
Carding: Fibres are separated and aligned in a thin web, then condensed into a continuous, untwisted strand called a ‘sliver’.
Combing: Processing cotton or wool stock through a series of needles (or combs) to remove short fibres and foreign matter.
Desizing: Removal of size material from greige (gray) goods to prepare for bleaching, dyeing, etc.
Drafting: A process that uses a frame to stretch the yarn. This process imparts a slight twist as it removes the yarn and winds it onto a rotating spindle.
Drawing: Straightening and paralleling the fibres after combing or carding.
Greige: Fabrics in unbleached, undyed state prior to finishing. Also referred to as “gray” or “grey” goods.
Jet dyeing: A tubular machine utilising water jets to circulate fabric in a dye bath.
Jig: An open vat which passes full width cloth from a roller through a dye liquor and then on to another roller.
Knitting: Process for making a fabric by interlocking in series the loops of one or more yarns. Types include: jersey (circular knits), tricots (warp knits), double knits.
Mercerising: A process given to cotton yarns and fabric to increase lustre, improve strength and dye ability. Treatment consists of impregnating fabrics with cold concentrated caustic soda solution.
Scouring: removal of natural and acquired impurities from fibres, yarns, or cloth through washing.
Sizing: Applying starch, PVA or CMC to warp yarns to minimise aberration during weaving.
Spinning: A process by which a large strand of fibres is drawn out to a small strand and converted into a yarn. After drawing out (or drafting), twist is inserted, and the resulting yarn is wound into a bobbin.
Texturising: it is often used to curl or crimp straight rod-like filament fibres to simulate the appearance, structure, and feel of natural fibres.
Tufting: A process used to create carpets, blankets, and upholstery.
Warping: A warp is a set of length-wise yarns in a loom through which the crosswise filling yarns (weft) are interlaced.
159


IC-14 PAINTS, LACQUERS AND VARNISHES INDUSTRY
ASSESSMENT OF ENVIRONMENTAL RELEASE OF CHEMICALS FROM THE
PAINTS, LACQUERS AND VARNISHES INDUSTRY
161


IC-14 PAINTS, LACQUERS AND VARNISHED INDUSTRY
CONTENTS
1 INTRODUCTION ........................................................................................................................................... 165
165
166
166
168
176
176
176
176
176
2 COMPONENTS IN PAINTS AND VARNISHES........................................................................................
3 RELEASES TO THE ENVIRONMENT ......................................................................................................
3.1 GENERAL INFORMATION ................................................................................................................
3.2 RELEASE ESTIMATES OF COMPONENTS USED IN PAINTS AND VARNISHES .................
4 CALCULATION OF PREDICTED ENVIRONMENTAL CONCENTRATIONS ..................................
4.1 LOCAL EXPOSURE..............................................................................................................................
4.2 TAKING ACCOUNT OF SPECIAL ON-SITE TREATMENT TECHNIQUES .............................
4.3 REGIONAL EXPOSURE ......................................................................................................................
5 REFERENCES ................................................................................................................................................
163


IC-14 PAINTS, LACQUERS AND VARNISHED INDUSTRY
1 INTRODUCTION
The following document provides release estimations for chemicals from the paints, lacquers and varnishes industry (industrial category 14). The data in this document are mainly based on two reports:
• “Study of the identification and quantification of the principal discharges of paint and varnish additives in the environment”. The study was carried out in a contract research project between the French Ministry of Environment and the Institut National de 1'Environnement Industrial et des Risques (INERIS) in 1992. Although the data in this study refer to French conditions they are considered to describe similar situations in most countries of the EU;
• Exposure Scenarios of Raw Materials used in Paint and Printing Inks. This paper, issued by the Confédération Européenne des Associations de Fabricants de Peinture, d'Encres d'Imprimerie et de Couleurs d'Art (CEPE) in 1993, compiles several scenarios derived from information given by several European companies.
In 1993 the German Umweltbundesamt launched a research project on the same use category. The results of this study are to be expected in 1996 and may serve together with further information from industry, literature etc. for a broader basis and an updating of the standard exposure scenario of paints and varnishes.
Paints and varnishes are applied for their decorative and/or protective function. They may be used as pastes or powders. After physical or chemical processes they form a thin adherent film on the surface of the substrate. The treated substrates are mainly of following type:
• metal surfaces (automobiles, trucks, metal frames, bridges, furniture); • wooden surfaces (wooden construction elements, toys, furniture, frames); miscellaneous
(concrete surfaces, road marking paints, anti foulings).
The fields of use of paints and varnishes may be broken down into two categories:
• paints for buildings and decoration (both professional and general public); • industrial use.
2 COMPONENTS IN PAINTS AND VARNISHES
Ingredients of paints and varnishes can be roughly classified into 5 main categories:
• binder: different types of resins which constitutes the main element in the formulation, assuring the adherence and cohesion of the film to the surface;
• solvent: one or a mixture of several liquid constituents which volatilise during drying phase after application; water-based paints as well as paints based on organic solvents and blends are commonly used;
• pigment: very fine particles of organic, inorganic or metallic nature and of very low water solubility which are suspended in the paints. These components are responsible for specific optical properties (in particular opacification);
• colorants: in contrast to pigments colorants are solubilized in the solvents and have no or very low opacifying power;
• fillers: mainly inorganic products which impart mechanical and Theological properties or modify the gloss of paints and varnishes;
165

IC-14 PAINTS, LACQUERS AND VARNISHED INDUSTRY
• additives: constituents of generally less than 3% in the formulation but often several different agents in one preparation. These components affect certain qualities of manufacturing, storage or application properties of the paint or varnish.
Note: Antifouling agents will have to be assessed under the nascent biocides directive.
Additives are used for different purposes and in different concentrations (see Table 1).
Table 1 Concentrations of different types of additives in paints and varnishes (Pratts, 1992)
Type of additive Minimum value in % Maximum value in %
anti skin agents * 0.2 0.3
spreading agents 0 0.1
dispersant agents 0.5 2.0
thickening agents 2.0 3.0
coalescence agents ** 2.0 5.0
preservatives in cans ** 0.1 0.3
drying catalyst agents 0.01 0.1
UV protective agents 0.05 0.1
film preservation agents 0.5 1.0
antifoam/antibubble agents ** 0.2 0.3
Antiblocking agents 0.5 1.0
sanding agents 0.2 1.0
* only for or essentially in organic solvent phase products ** only for or essentially in aqueous phase products
3 RELEASES TO THE ENVIRONMENT
3.1 GENERAL INFORMATION
Contamination of the environment may result from discharge of components in paints and varnishes during:
• synthesis of the components; • formulation of paints and varnishes; • application of paints and varnishes; • waste objects treated with paints or varnishes.
3.1.1 Synthesis of the components
No specific data are available on the release of the different components in paints and varnishes during their synthesis in chemical industry. Generic release factors as described in Appendix I of Chapter 3 of the TGD can be used for the manufacturing step if no specific data is available.
166
IC-14 PAINTS, LACQUERS AND VARNISHED INDUSTRY
3.1.2 Formulation of paints and varnishes
In industrial practice, on average, the percentage of lost material (raw material, additives, paint) is roughly 3%. This lost quantity arises from the washing of manufacturing equipment, of pipes used for transfer, and conditioning machines. These 3% are lost to air (evaporation), water (rinsing) and soil (solid wastes, sludges, filter cartridges).
3.1.3 Application step
The amount of used paint which goes into the environment at that stage varies according to the application technique: larger for spraying, lower for roller application for instance, as well as the domain of use i.e. industry or general public.
In the case of decorative paints, all volatile compounds are evaporated. For non-volatile substances drips, discarding of application instruments and residues in the bottoms of cans are responsible for up to 12% releases to the soil. This high value corresponds to general public paint use; the figure is somewhat lower for the use of paint by professional painters (4-6%). It is estimated that <1-4% enters the aquatic environment from washing of application instruments such as brushes and rollers. Additionally, 3% of non volatile additives are estimated to enter the soil environment from leaching processes during the life of the exterior applied paints.
In the case of industrial paints, depending on the sectors, either all volatile compounds are emitted to the atmosphere or part of them are incinerated or more seldomly recycled (see Table 7 for coil coating, and Section 4.2 for “on-site treatment techniques”). For non-volatile substances, generally recuperated as overspray, paint sludges are treated as wastes and, depending on local regulations, are disposed of either by landfilling or incineration.
The amount entering the aquatic environment is normally reduced to the disposal of water contained in spray booths and in water used for equipment cleaning. The amount of water soluble, non-volatile compounds leached from painted surfaces is minimal in this type of paint use.
3.1.4 Disposal of painted goods
No volatile compounds remain. 100% of the remaining solids will eventually reach the soil, either directly (landfill, natural decay) or through incineration.
167

IC-14 PAINTS, LACQUERS AND VARNISHED INDUSTRY
3.2 RELEASE ESTIMATES OF COMPONENTS USED IN PAINTS AND VARNISHES
A rough estimation of exposure routes for raw materials in paints is given in Table 2.
Table 2 Generalities on the routes into the environment of paint raw materials (CEPE, 1993)
Formulation Localised
global losses air water soil
around 3% all volatile compounds go into the atmosphere low: retention and systematic water treatment nearly 100% treatment
Application localised or diffuse
global losses air water soil
between 3% and 50% depending on the field of application generally the largest part of volatile compounds go into the atmosphere. On large localised application sites air treatment is possible low for localised application ratio of landfilling to incineration depends on countries and varies from 100/0 to 20/80
Elimination generally diffuse
global losses air water soil
remaining solid content: between 45 and 95%, based on the original formulation, depending on the field of application negligible: only cured or dried coatings are disposed of at this stage negligible: solid products with practically non water solubility ratio of landfilling to incineration depends on countries and varies from 100/0 to 20/80
If no further information is given in notification dossier or the HEDSET (or after discussion with the producer/importer) the default values for release scenarios in the Tables 3 - 22 shall be used for assessing environmental exposure.
The release fractions come from indications given by industrial experts from several companies in various European countries (CEPE, 1993). They apply to all raw materials i.e. solvents, binders, pigments. If the application field of the paint is not known, the default emission tables in Appendix I of Chapter 3 of the TGD can be used.
Please note that:
• each table is specific for a given field of application; • for each life stage (formulation, application, elimination), the percentage of the total paint
volume released to the different environmental compartments are indicated according to their physical chemical properties;
• at each life stage it is indicated whether the release is localised i.e. from few industrial sites or diffuse i.e. from wide-spread consumer use;
• the “range present” corresponds to the global composition of the paint and not to the different components of the formulation. It only characterises the type of paint and is not used further in the assessment;
• the figures related to “Elimination” are maximum values as they do not take into account photochemical degradation during the lifetime of the painted goods or possible treatment by incineration. Possible recycling of the painted goods like steel or aluminium is also not taken into account; the amounts released to soil at “Elimination” are not taken into account in the assessment. The amounts released to soil during “Formulation” and “Application” are used as input to “industrial soil” for the estimation of the regional concentrations.
•
168

IC-14 PAINTS, LACQUERS AND VARNISHED INDUSTRY
Definitions
volatile substances are defined as having a vapour pressure of > 10 Pa at 23°C (personal communication, 1995). This is a default definition as the interaction of the substance with other components in the paint layer will also influence its volatility;
•
• a substance is considered to be “water soluble” if its water solubility is > 1 g.l-1 (personal communication, 1995).
Table 3 Furniture (general)
Volatile Non-volatile water soluble
Non-volatile non water soluble
% range present 55% 2% 43% Formulation localised
air water soil
1% 1% --
-- 1% 1%
-- 1% 1%
Application diffuse
air water soil
97% 1% --
-- 3% 3%
-- 3% 3%
Elimination diffuse
air water soil
-- -- --
-- --
92%
-- --
92%
Table 4 UV Curable wood lacquer
Volatile Non-volatile water soluble
Non-volatile non water soluble
% range present 1 - 5% -- 95 - 100% Formulation localised
air water soil
2% -- --
-- -- --
-- --
2%
Application diffuse
air water soil
98% -- --
-- -- --
-- --
5%
Elimination diffuse
air water soil
-- -- --
-- -- --
-- --
93%
169

IC-14 PAINTS, LACQUERS AND VARNISHED INDUSTRY
Table 5 Water-borne wood lacquer
Volatile Non-volatile water soluble
Non-volatile non water soluble
% range present 55% 1 - 2% 30 - 35% Formulation localised
air water soil
1% 2% --
-- 2% 1%
-- 2% 1%
Application diffuse
air water soil
92% 5% --
-- 5% 30%
-- 5% 30%
Elimination diffuse
air water soil
-- -- --
-- --
62%
-- --
62%
Table 6 Nitrocellulose wood lacquer (sprayed finish)
Volatile Non-volatile water soluble
Non-volatile non water soluble
% range present 70 - 80% -- 20 - 30% air water soil
2% -- --
-- -- --
-- --
1%
Application diffuse
air water soil
98% -- --
-- -- --
-- --
3%
Elimination diffuse
air water soil
-- -- --
Formulation localised
-- -- --
-- --
96%
Table 7 Coil coating
Volatile Non-volatile water soluble
Non-volatile non water soluble
% range present 40% 1% 59% Formulation localised
air water soil
1% -- --
-- 1% 1%
-- 1% 1%
Application localised
air water soil
1% * 1% --
-- 1% 1%
-- 1% 1%
Elimination diffuse
air water soil
-- -- --
-- --
96%
-- --
96%
* assuming treatment of flue gases (98% if no treatment)
170

IC-14 PAINTS, LACQUERS AND VARNISHED INDUSTRY
Table 8 Can coatings (general)
Volatile Non-volatile water soluble
Non-volatile non water soluble
% range present 50% -- 50% Formulation localised
air water soil
3% -- --
-- -- --
-- --
3%
Application localised
air water soil
94% --
3%
-- -- --
-- --
5%
Elimination diffuse
air water soil
-- -- --
-- -- --
-- --
92%
Table 9 Solvent-based 2 piece can external white enamel
Volatile Non-volatile water soluble
Von-volatile non water soluble
% range present 45% -- 55% Formulation localised
air water soil
1.8% --
0.2%
-- -- --
-- --
0.2%
Application localised
air water soil
96% --
2%
-- -- --
-- --
2.5%
Elimination diffuse
air water soil
-- -- --
-- -- --
-- --
97.3%
Table 10 Water-based 2 piece can external white enamel
Volatile Non-volatile water soluble
Non-volatile non water soluble
% range present 25% 20% (water) 55% Formulation localised
air water soil
1.5% --
0.5%
-- -- --
-- --
0.2%
Application localised
air water soil
96.5% --
1.5%
-- -- --
-- --
1.5%
Elimination diffuse
air water soil
-- -- --
-- -- --
-- --
98.3%
171

IC-14 PAINTS, LACQUERS AND VARNISHED INDUSTRY
Table 11 Internal solvent-borne epoxy-phenolic food-can lacquer
Volatile Non-volatile water soluble
Non-volatile non water soluble
% range present 65% -- 35% air water soil
1.5% --
0.5%
-- -- --
-- --
0.6%
Application localised
air water soil
93% --
5%
-- -- --
-- --
5%
Elimination diffuse
air water soil
-- -- --
-- -- --
-- --
94.4%
Formulation localised
Table 12 Solvent-based general line varnish for metal cans
Volatile Non-volatile water soluble
Non-volatile non water soluble
% range present 55% -- 45% Formulation localised
air water soil
1.5% --
0.1%
-- -- --
-- --
0.2%
93.4% --
5%
-- -- --
-- --
5%
air water soil
-- -- --
-- -- --
Application localised
air water soil
Elimination diffuse
-- --
94.8%
Table 13 Solvent-based general line white coating for metal cans
Volatile Non-volatile water soluble
Non-volatile non water soluble
% range present 40% -- 60% Formulation localised
air water soil
2% --
0.3%
-- -- --
-- --
0.7%
Application localised
air water soil
92.7% --
5%
-- -- --
-- --
5%
Elimination diffuse
air water soil
-- -- --
-- -- --
-- --
94.3%
172

IC-14 PAINTS, LACQUERS AND VARNISHED INDUSTRY
Table 14 Solvent-based general purpose size (metal cans)
Volatile Non-volatile water soluble
Non-volatile non water soluble
% range present 80% 20% Formulation localised
air water soil
1% --
0.1%
-- -- --
-- --
1%
Application localised
air water soil
93.9% --
5%
-- -- --
-- --
5%
Elimination diffuse
air water soil
-- -- --
-- -- --
-- --
94%
Table 15 Marine coatings
Volatile Non-volatile water soluble
Non-volatile non water soluble
% range present 45% 10 - 15% 40 - 45% Formulation localised
air water soil
3% -- --
-- -- --
-- --
1%
Application diffuse
air water soil
97% -- --
-- --
10%
-- 5% 30%
air water soil
-- -- --
-- 90% *
--
-- 2% 62%
Elimination diffuse
* release during the use of the vessel
Table 16 Container coatings
Volatile Non-volatile water soluble
Non-volatile non water soluble
% range present 40% -- 60% Formulation localised
air water soil
4% -- --
-- -- --
-- --
1%
Application diffuse
air water soil
96% -- --
-- -- --
-- --
1%
Elimination diffuse
air water soil
-- -- --
-- -- --
-- --
98%
173
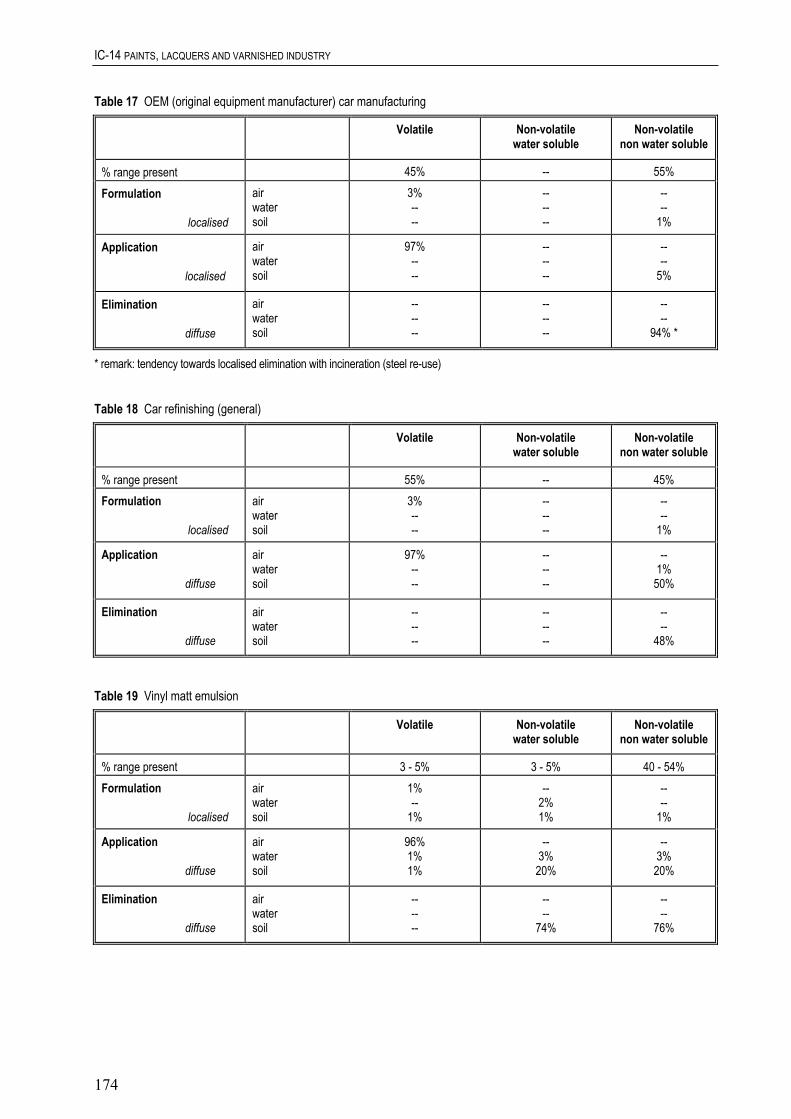
IC-14 PAINTS, LACQUERS AND VARNISHED INDUSTRY
Table 17 OEM (original equipment manufacturer) car manufacturing
Volatile Non-volatile water soluble
Non-volatile non water soluble
% range present 45% -- 55% Formulation localised
air water soil
3% -- --
-- -- --
-- --
1%
Application localised
air water soil
97% -- --
-- -- --
-- --
5%
Elimination diffuse
air water soil
-- -- --
-- -- --
-- --
94% *
* remark: tendency towards localised elimination with incineration (steel re-use)
Table 18 Car refinishing (general)
Volatile Non-volatile water soluble
Non-volatile non water soluble
% range present 55% -- 45% Formulation localised
air water soil
3% -- --
-- -- --
-- --
1%
Application diffuse
air water soil
97% -- --
-- -- --
-- 1% 50%
Elimination diffuse
air water soil
-- -- --
-- -- --
-- --
48%
Table 19 Vinyl matt emulsion
Volatile Non-volatile water soluble
Non-volatile non water soluble
% range present 3 - 5% 3 - 5% 40 - 54% air water soil
1% --
1%
-- 2% 1%
-- --
1%
-- 3% 20%
-- 3% 20%
air water soil
-- -- --
-- --
74%
-- --
76%
Formulation localised
Application diffuse
air water soil
96% 1% 1%
Elimination diffuse
174

IC-14 PAINTS, LACQUERS AND VARNISHED INDUSTRY
Table 20 Standard alkyd gloss finish
Volatile Non-volatile water soluble
Non-volatile non water soluble
% range present 40 - 60% -- 40 - 60% Formulation localised
air water soil
2% --
< 1%
-- 2% 1%
-- 1% 2%
Application diffuse
air water soil
96% 1% --
-- 3% 20%
-- 3% 20%
Elimination diffuse
air water soil
-- -- --
-- --
74%
-- --
74%
Table 21 Water-borne exterior woodstain
Volatile Non-volatile water soluble
Non-volatile non water soluble
% range present 5 - 10% 5 - 10% 25 - 50% Formulation localised
air water soil
2% 1% --
-- 1% 1%
-- 1% 1%
Application diffuse
air water soil
96% 1% --
-- 2% 20%
-- 2% 20%
Elimination diffuse
air water soil
-- -- --
-- --
76%
-- --
76%
Table 22 Solvent-borne interior/exterior woodstain
Volatile Non-volatile water soluble
Non-volatile non water soluble
% range present 50 - 55% -- 40 - 45% Formulation localised
air water soil
1% -- --
-- -- --
-- 1% 1%
Application diffuse
air water soil
98% 1% --
-- -- --
-- 3% 20%
Elimination diffuse
air water soil
-- -- --
-- -- --
-- --
75%
175

IC-14 PAINTS, LACQUERS AND VARNISHED INDUSTRY
4 CALCULATION OF PREDICTED ENVIRONMENTAL CONCENTRATIONS
4.1 LOCAL EXPOSURE
Local exposure occurs mainly at manufacture/formulation and for some industrial uses at application. Tables 3-22 indicate for each life stage whether the release is localised or diffuse. If no specific data are available on the number of days of release or a realistic worst-case fraction of the total release volume from a single industrial site, the default values in the B-tables described in Appendix I of Chapter 3 of the TGD can be used.
4.2 TAKING ACCOUNT OF SPECIAL ON-SITE TREATMENT TECHNIQUES
The release amounts of additives during industrial application depend mainly on the lacquer coating technique (spray guns, immersion, electrostatic spraying) and purification facilities. Exhaust air treatment systems are generally employed to reduce the concentration of volatile components via scrubbers, absorbers etc. The trapped additives are either recycled, dumped or incinerated in special plants. Alternative treatment processes aiming at possibilities of reutilization are under development (Demmich and Blümel, 1992).
If the air is scrubbed in a water-curtain spray-booth, the aqueous phase is decanted from the lacquer coagulate sludge and recirculated. At certain time intervals however, fresh water becomes necessary and the wastewater is released to the sewer. The predicted concentration in the wastewater is therefore mainly determined by the water solubility of the additive. Therefore, it can be assumed that the wastewater concentration is equal to the water solubility. This scenario is supposed to give the highest and therefore worst-case concentration in an environmental compartment.
4.3 REGIONAL EXPOSURE
All the releases, whether local or diffuse, are used for the estimation of the regional exposure. The amounts released to soil at “Elimination” are not taken into account in the assessment. The amounts released to soil during “Formulation” and “Application” are used as input to “industrial soil”.
5 REFERENCES Prats A (1992). Etude sur l'identification et la quantification des principeaux rejets dans 1'environnement des additifs pour peintures et vernis. Contrat INERIS-Ministère Environnement DPPR/MCP/CR/VH lettre de commande 6 n° 122/92.
Demmich J and Blümel W (1992). Lackschlämme aufbereiten und verwerten. Umwelt 22(7/8), 431-432.
CEPE (1993). Scenarios for Environmental Risk Assessment of Paints and Printing Inks Raw Material. Confédération Européenne des Associations de Fabricants de Peinture, d'Encres d'Imprimerie et de Couleurs d'Art.
Fédération des Industries des Peintures, Encres, Couleurs, Colles et Adhésifs (1995). Personal communication from 24/7/1995.
176

IC-15 OTHERS: RUBBER INDUSTRY
ASSESSMENT OF THE ENVIRONMENTAL RELEASES OF ADDITIVES IN THE RUBBER INDUSTRY
177

IC-15 OTHERS:RUBBER INDUSTRY
CONTENTS
1 INTRODUCTION ........................................................................................................................................... 181
2
183
188 189 189
190
190
3.4 CHEMICALS AND ADDITIVES ......................................................................................................... 191
193
194
195
199
201
202
LIFE CYCLE................................................................................................................................................... 182
3 MAIN PROCESSES........................................................................................................................................
3.1 WORKING OF NATURAL- AND SYNTHETIC RUBBER .............................................................. 1883.1.1 Mastication and creation of mixtures............................................................................................. 3.1.2 Shaping .......................................................................................................................................... 3.1.3 Vulcanization/curing......................................................................................................................
3.2 WORKING OF LATEX.........................................................................................................................
3.3 RUBBER-METAL-WORKING ............................................................................................................
4 EMISSION SCENARIOS...............................................................................................................................
4.1 DEFINITION OF THE POINT SOURCE ...........................................................................................
4.2 RELEASE ESTIMATION .....................................................................................................................
5 EXAMPLES.....................................................................................................................................................
6 REFERENCES ................................................................................................................................................
7 ABBREVIATIONS .........................................................................................................................................
179


IC-15 OTHERS:RUBBER INDUSTRY
1 INTRODUCTION
This document estimates the exposure concentration (release) of additives in the rubber industry (IC-15 “Others”), among other additives UC-53 vulcanizing agents, UC-20 fillers, UC-49 stabilizer, UC-22 flame retardants, in the compartment water. The assessment of the environmental risk is made step by step and is given under realistic worst-case conditions. With the aid of the determined Elocalwater (carriage in kg.d-1) it is possible to estimate the PEClocalwater (Figure 1).
The chemicals used in the rubber industry may enter the environment via the product, unused material or wastes.
Chemicals used in the rubber industry are only relevant for the compartment water if they come into direct contact with that element. This does happen in those processes, where water is used as cooling or heating medium or for the vulcanization and therefore has direct contact with the rubber mixture. Also the contamination through water used in cleaning steps throughout these processes has to be considered.
To determine the release, a representative emission source is identified.
Ceffl: effluent co
D: dilution factor
Figure 1 Scenario for the determination of the PEClocal
ncentration
Cinfl: influent concentration
EFFLUENTstp: volume flow of STP P: elimination in STP
water
181

IC-15 OTHERS:RUBBER INDUSTRY
2 LIFE CYCLE
A substance used for rubber production passes a number of life cycle steps. Each step has to be characterized in terms of the emission taking place during it. The production of synthetic “raw rubber” is counted in the industrial category IC 11 (polymers industry), the raw material is provided by the chemical industry. The raw material for the production of natural rubber products is provided by countries outside of the EU.
Raw Material
Production
Formulation
Processing
Waste/Recovery
Private use Industrial Use
This ESDsection 4
A/B-TablesTGD
Figure 2 Stages in the life cycle of rubber additives in which emissions into the compartment water may occur
Formulation takes place at the site of the basic chemical industry for use in the manufacturing of the rubber product and also at the site of the rubber industry where the formulation of the rubber mixture is performed.
The emission during the production depends on the type and make-up of the chemical and the process being used. In this ESD the emission of the substance in question will be determined for the formulation and the processing. These two life cycle steps can often not be viewed separately in the rubber industry. Depending on the process used they are often combined. The process steps to be taken into account here are:
• the creation of the rubber mixture, • the mastication, • the shaping, • the vulcanization, • the finishing.
The life cycle step “industrial and private use” will not be covered within the ESD, even though a contamination of the environmental compartment water takes place through wear and the subsequent leaching through rain water. In the life cycle step “waste/recovery” the possible leaching is a potential danger for the compartment water while the compartment air is contaminated mainly by volatile monomers and plasticizers.
182
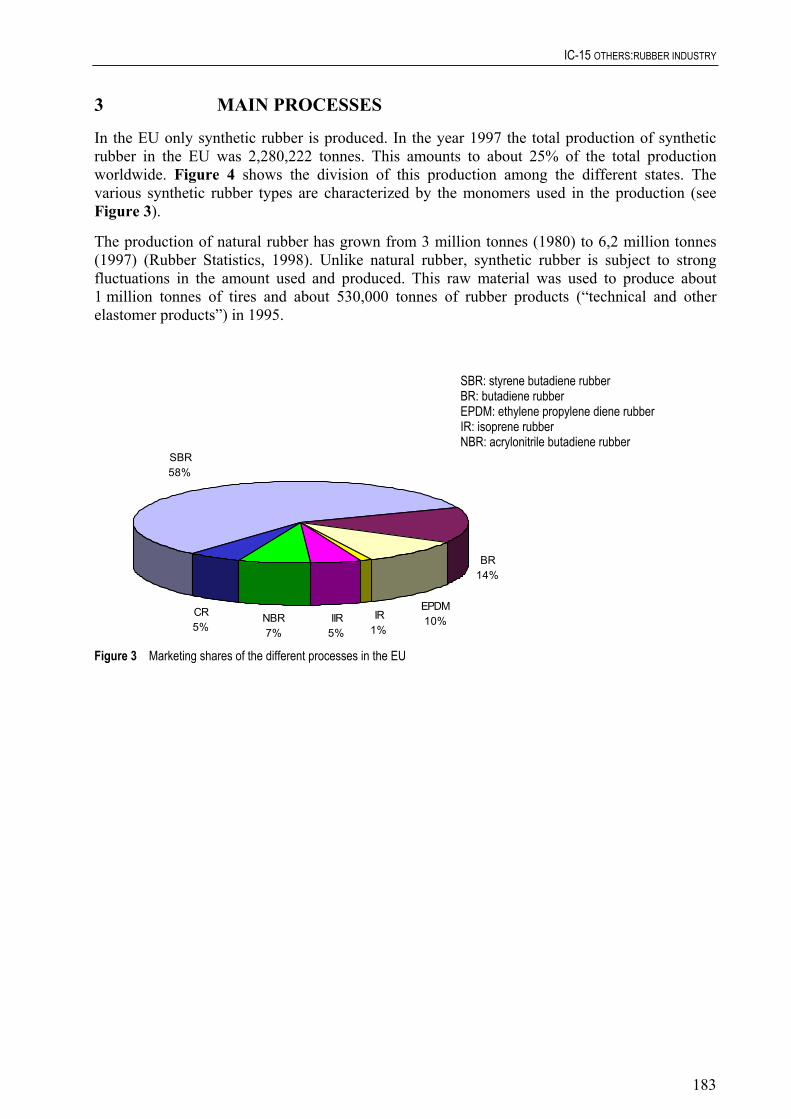
IC-15 OTHERS:RUBBER INDUSTRY
3 MAIN PROCESSES
In the EU only synthetic rubber is produced. In the year 1997 the total production of synthetic rubber in the EU was 2,280,222 tonnes. This amounts to about 25% of the total production worldwide. Figure 4 shows the division of this production among the different states. The various synthetic rubber types are characterized by the monomers used in the production (see Figure 3).
The production of natural rubber has grown from 3 million tonnes (1980) to 6,2 million tonnes (1997) (Rubber Statistics, 1998). Unlike natural rubber, synthetic rubber is subject to strong fluctuations in the amount used and produced. This raw material was used to produce about 1 million tonnes of tires and about 530,000 tonnes of rubber products (“technical and other elastomer products”) in 1995.
BR14%
EPDM10%IR
1%IIR
5%NBR7%
CR5%
SBR58%
SBR: styrene butadiene rubber BR: butadiene rubber EPDM: ethylene propylene diene rubber IR: isoprene rubber NBR: acrylonitrile butadiene rubber
Figure 3 Marketing shares of the different processes in the EU
183
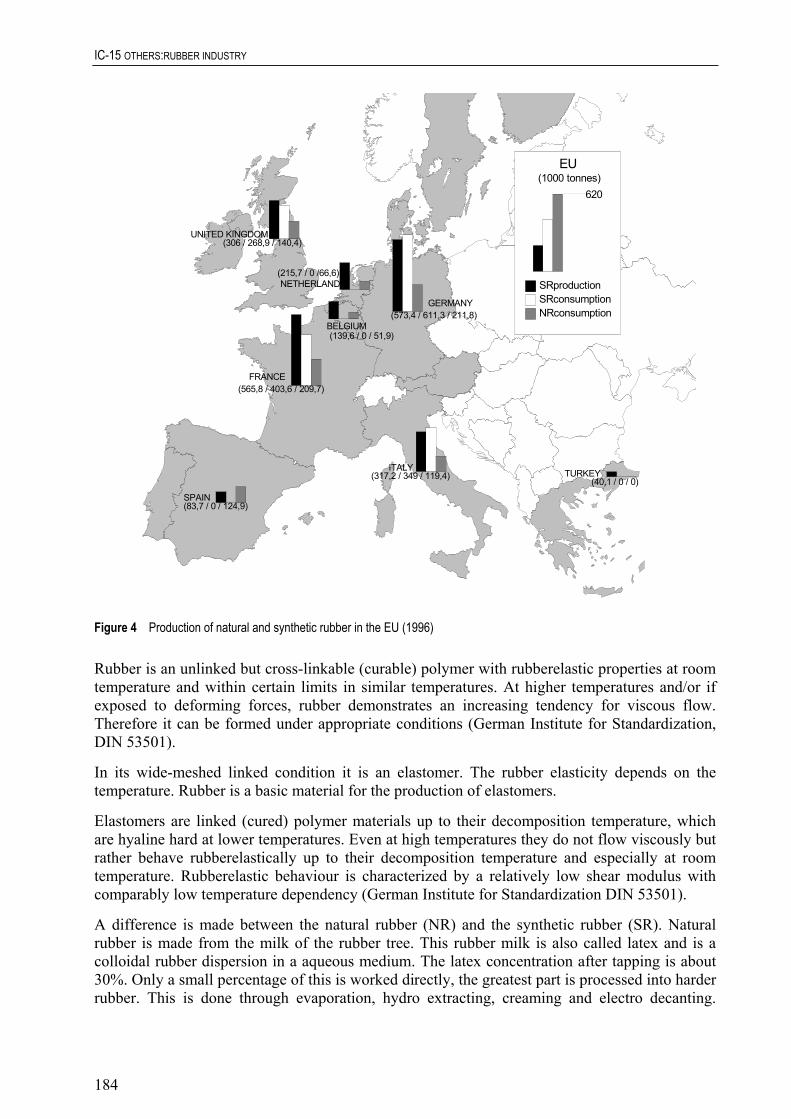
IC-15 OTHERS:RUBBER INDUSTRY
BELGIUM
SPAIN
ITALY
UNITED KINGDOM
GERMANY
FRANCE
(573,4 / 611,3 / 211,8)
(565,8 / 403,6 / 209,7)
(317,2 / 349 / 119,4)
(83,7 / 0 / 124,9)
(139,6 / 0 / 51,9)
(306 / 268,9 / 140,4)
(40,1 / 0 / 0)
(215,7 / 0 /66,6)NETHERLAND
TURKEY
EU(1000 tonnes)
620
SRproductionSRconsumptionNRconsumption
Figure 4 Production of natural and synthetic rubber in the EU (1996)
Rubber is an unlinked but cross-linkable (curable) polymer with rubberelastic properties at room temperature and within certain limits in similar temperatures. At higher temperatures and/or if exposed to deforming forces, rubber demonstrates an increasing tendency for viscous flow. Therefore it can be formed under appropriate conditions (German Institute for Standardization, DIN 53501).
In its wide-meshed linked condition it is an elastomer. The rubber elasticity depends on the temperature. Rubber is a basic material for the production of elastomers.
Elastomers are linked (cured) polymer materials up to their decomposition temperature, which are hyaline hard at lower temperatures. Even at high temperatures they do not flow viscously but rather behave rubberelastically up to their decomposition temperature and especially at room temperature. Rubberelastic behaviour is characterized by a relatively low shear modulus with comparably low temperature dependency (German Institute for Standardization DIN 53501).
A difference is made between the natural rubber (NR) and the synthetic rubber (SR). Natural rubber is made from the milk of the rubber tree. This rubber milk is also called latex and is a colloidal rubber dispersion in a aqueous medium. The latex concentration after tapping is about 30%. Only a small percentage of this is worked directly, the greatest part is processed into harder rubber. This is done through evaporation, hydro extracting, creaming and electro decanting.
184

IC-15 OTHERS:RUBBER INDUSTRY
Thailand is the most important producer of natural rubber (1996). The raw rubber material is exported into the processing countries in solid form.
Natural rubber demonstrates a balanced combination of physical attributes resulting in a broad range of possible uses (UIImanns, 1993). Every single attribute of a NR is surpassed by a certain SR though. If these attributes are specifically required, the appropriate SR will be used instead of NR.
The most important types of synthetic rubber are shown in Figure 3 in relation to their market percentage.
Almost 2/3 of the total rubbers currently used in the industry is taken up by synthetic rubbers. These are created from monomeres like butadiene, styrene, acrylonitrile and isobutene (see Table 1). They characterize the attributes of the rubber. There are of course many more SR (see (Baumann et al., 1998; Ullmanns, 1993).
Depending on the production procedure, a difference is made between polymerisates, polycondensates and polyadditionproducts. According to DIN ISO 1629 rubbers in the form of hard rubbers and latex are divided into groups depending on the chemical makeup of the polymer chains. The rubber types are divided by their attributes (see Lüpfert, 1990) and their function (see Rentel et al., 1991).
A rubber is made up mainly of (Lüpfert, 1991):
• polymers (elastomers),
The chemicals and raw rubbers used in rubber production pass through all the steps listed in Chapter 2, additives may also be added at a later time.
• fillers, • plasticizers, • antiaging agents, • linking systems.
After the initial composition the mixture is created with the aid of an internal mixer, a rolling mill, a batch-off-facility and an extruder. The shaping and semi-finished product creation is done with an extruder, a plunger type injection moulder, through calendering, the spreading machine and assembly.
For the vulcanization (curing) in presses, the compression process, the transfer moulding, and injection moulding are used. A continuous vulcanization is done with the rotational vulcanization, the steam pipe vulcanization, the hot-air vulcanization with microwave preheating, the boiling bed vulcanization and the salt-bath vulcanization. In addition to these, vulcanization can also be accomplished in an autoclave.
185

IC-15 OTHERS:RUBBER INDUSTRY
Table 1 Rubbertype and additives
Abbreviation Rubber type Mixture
Natural Rubber proteins (ca. 2%) (cis-1,4-polyisoprene) aliphatic acids (ca 0,5%) vulcanization agents (sulphur) resins (ca. 1,5%) vulcanization accelerators ash (ca. 0,5%) antiaging agents sugar (1,5%) fillers water (ca. 60%) plasticizers processing aids SR Synthetic Rubber SBR styrene butadiene rubber monomeres(1,3-butadiene, styrene) vulcanization agents (sulphur) vulcanization accelerators antiaging agents
fillers plasticizers factices resins processing aids BR butadiene rubber monomeres(1,3-butadiene)
vulkanization agents (sulphur) vulcanization accelerators antiaging agents
fillers plasticizers
processing aids
vulcanization accelerators antiaging agents
fillers plasticizers factices processing aids CR poly-2-chlorobutadiene monomeres (chloroprene)
(polychloroprene) vulcanization agents (sulphur) vulcanization accelerators antiaging agents fillers plasticizers factices
processing aids EPDM ethylene propylene diene rubber monomers (ethylene, propylene) vulcanization agents vulcanization accelerators antiaging agents
plasticizers processing aids
NR
NBR acrylonitrile butadiene rubber monomeres(1,3-butadiene, acrylonitrile)
vulcanization agents (Sulphur)
fillers
Table 1 continued overleaf
186

IC-15 OTHERS:RUBBER INDUSTRY
Table 1 continued Rubbertype and additives
Abbreviation Rubber type Mixture
SR Synthetic Rubber IR isoprene rubber monomers (isoprene) vulcanization agents vulcanization accelerators antiaging agents fillers plasticizers
processing aids IIR isoprene isobutylene rubber monomers (isoprene, isobutylene) vulcanization agents vulcanization accelerators
vulcanization activators antiaging agents fillers plasticizers processing aids OTHER special monomers vulcanization agents vulcanization accelerators antiaging agents fillers plasticizers processing aids
sole material3%
form products, rubber-metal-compounds
24%
other technical products5%
technical tubes and prof iles23%
sheet material, punching products
2%
other rubber products11%
conveyor belts, f lat- and vee-belts
9%
foam-, microcellular- and cellular rubber products
10%
glues, mixtures, repair material
13%
Figure 5 Distribution of rubber products by amount (WDK, 1990)
187

IC-15 OTHERS:RUBBER INDUSTRY
old rubber and groundmaterial
0,3%
other soft rubber products24,1%
technical andelectrotechnical hard
rubber products0,1%hobby-, sport- and
camping equipment0,5%
other hard rubberproducts
5,0%
spongecellular-,microcellular and foam-
rubber products4,8%
rubberized fabrics2,4%
technical soft rubberproducts59,2%
sole material3,5%
Figure 6 An alternative division of rubber products (Rentel et al., 1991)
This distributions does not fluctuate over the years, it is assumed to be valid now and for all EU member states.
3.1 WORKING OF NATURAL- AND SYNTHETIC RUBBER
3.1.1 Mastication and creation of mixtures
The mastication is a process in which the size of the rubber molecules is decreased to lower the viscosity. This is necessary to get a better workability of the rubber (extrusion, calander and others) and to spread the rubber chemicals throughout the matrix. Rubber chemicals like antiaging agents, fillers, plasticizers are discussed in Subsection 3.4 and their functions are shown in Table 2.
An optimized viscosity is especially important for the production of rubber blends since a homogenous distribution of the constituents is only possible within an equal viscosity. Unlike synthetic rubber, which can often be processed without a previous mastication, natural rubber is usually offered as a relatively hard substance with little plasticity, making mastication a requirement.
The mastication can be achieved in a purely mechanical process, in a mechanic-thermal process, physically by adding plasticizers and/or processing agents as well as chemically.
Machines like rolling mills, the internal mixer or the gordon-plasticator not only masticate the rubber substance but also serve as mixers, for cooling, to finish the mixing of half ready rubber mixtures and to preheat finished rubber mixtures. A possible contamination of the compartment water during the mixing process can happen through the cooling process if water is used as a
188

IC-15 OTHERS:RUBBER INDUSTRY
direct cooling agent. Finally sulphur is added to the mixture. The finished mixture is taken off as a rough sheet. This rough sheet is cooled by immersion in water to which adherent has been added (rolling mill). Especially for larger companies, the internal mixer has replaced the rolling mill. An internal mixer can hold 15 to 650 liters. For the homogenization, cooling and working into sheets rolling mills are still used. In modern installations, a batch off machine is responsible for taking off the sheets and immersing them in a bath of water or adherent.
3.1.2 Shaping
Rubber mixtures are usually not immediately reprocessed after the mixture has been created but are stored in a cool and dry environment. For the shaping, processes like extrusion, calandering, form moulding and transfer moulding are used.
Injection machines (extrusion plants) form rubber mixtures into bars, tubes, profiles, treads of tires or sheets or encase cables and wires. In a continuous process, the rubber mixture is cured immediately after the extrusion. If a reprocessing as semi finished product is planned, the mixture is dusted and drawn through an abherent bath. Calandering is used to create sheets for the rubberization of technical weaves (frictioning) and to coat weaves with a thin rubber sheet (skimming).
Form articles are mass articles like stoppers, bottle caps, soles, packing rings, collars, membranes, valve balls, buffers and tires. Processes like pressing, transfer-moulding, flashless-processes and the injection-moulding process are characterized by the fact that shaping and vulcanization are done in one step. Assembly takes an important role in this context.
After the forms in a transfer moulding process have been used for a certain time, organic elements from the rubber mixture or form adherents settle on the form as incrustation or carbonization. To clean the forms, a chromesulphurbath (60°C) is used. The actual cleaning then takes place in a lapping machine with a suspension of quartz flour. Water is used for rinsing.
3.1.3 Vulcanization/curing
The vulcanization is a chemical process to link the polymer structure. The name vulcanization is used for a linking procedure, during which the macro molecules of the rubber are linked to each other over linking bridges. This linking can take place with the help of vulcanization agents, usually sulphur, sulphurproducers or peroxides as well as energy rich radiation.
If uncured, rubber is a thermoplastic. The molecules are not connected to each other. During the vulcanization the substance changes from the thermoplastic to the elastic condition. The number of links depends on the amount of linking substances, their activity and reaction time. The following procedures are used for vulcanization:
• liquid curing method (LCM-Vulcanization), • boiling bed vulcanization, • hot air vulcanization after UHF-preheating, • vulcanization in hot steam under high voltage (under lead).
The LCM-vulcanization is commonly used for extruded profiles, tubes and similar processes. It is continuous and takes place in a liquid bath. The length of the bath depends on the vulcanization speed, the injection performance of the extrusion plant, the temperature of the heating bath and other factors. Eutectic salt mixtures (as well as glycerine, silicon oils,
189

IC-15 OTHERS:RUBBER INDUSTRY
polyalkylenglycole, metal mixtures) are used as a heating medium. For the boiling bed vulcanization, small glass beads are used through which gas flows to lift them.
The HF vulcanization uses a pressureless, continuous process. The vulcanization in steam pipes is used almost exclusively in the cable industry. Immediately after coating, the cable is guided into a pipe in which the steam pressure is usually between 5 and 12 bar (max. 20 bar). To reduce deformations, the vulcanization is sometimes performed under a lead coating, this coating protects from the hydrolytical effect of the steam. After cooling with water, the lead coat is removed.
The vulcanization of calandered products can be achieved with the rotational vulcanization or in vulcanization presses. A high frequency preheating is possible here. Assembled rubber products are vulcanized free (not in a mould) in an open heater (hot air vulcanization).
To decrease the vulcanization time, a steam heater is used. When using saturated vapour, in which water and steam are in balance, the temperature transference is more regular. To avoid condensation spots, spreading agents are used. When vulcanizing in water, the temperature transfer is extremely good compared to a medium of air or steam. This process will be used for big parts. It is used rarely though (for example for the vulcanization of large rolls) due to the complexity of the process. The vulcanization can also be achieved through cold vulcanization or energy rich radiation.
3.2 WORKING OF LATEX
Natural latexes and synthetic latexes (as are created during the emulsion polymerization) are worked, among other things into thin-walled products. The mixture is prepared by kneading the required chemicals into the latex solution. The coagulation process is used to create thick-walled products. The form is submerged in an alcoholic solution of a coagulation substance. This results in a thicker coagulum on the form as in other submerging processes. The vulcanized products must then be thoroughly rinsed with water to remove the coagulation substance.
For foam rubber, steam or hot water is used as a medium for the vulcanization. The spinning process for the creation of latex strings also requires water to rinse out the coagulator.
Products made from unweaved textiles are made from bonded fabrics impregnated with a latex mixture. The unused adhesive is pressed out and the damp fabric dried and vulcanized. Leftover chemicals (emulsifying agents, stabilizers) are removed by washing.
3.3 RUBBER-METAL-WORKING
Metal working takes place in the rubber industry wherever composite parts made of rubber and metal are needed. One example is the tire which, in addition to a multitude of rubber mixtures, includes stabilizing materials like steel, textiles or plastic. Other rubber-metal parts for the automobile industry are shockabsorbers. elastomere springs, coupling parts, hangers and others. Rubberized parts, like rolls are used in other areas as well. For the preparation of composite parts, spray- and degreasing plants are used.
190
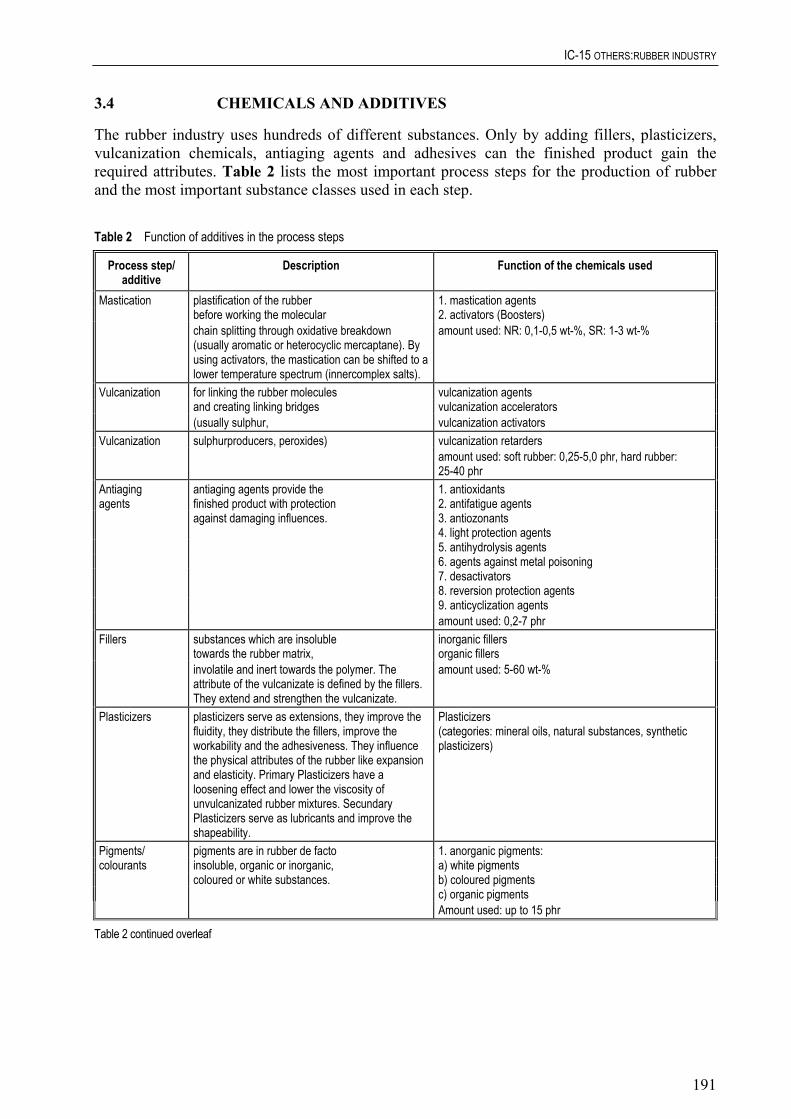
IC-15 OTHERS:RUBBER INDUSTRY
3.4 CHEMICALS AND ADDITIVES
The rubber industry uses hundreds of different substances. Only by adding fillers, plasticizers, vulcanization chemicals, antiaging agents and adhesives can the finished product gain the required attributes. Table 2 lists the most important process steps for the production of rubber and the most important substance classes used in each step.
Table 2 Function of additives in the process steps
Process step/ additive
Description Function of the chemicals used
Mastication plastification of the rubber 1. mastication agents before working the molecular 2. activators (Boosters) chain splitting through oxidative breakdown
(usually aromatic or heterocyclic mercaptane). By using activators, the mastication can be shifted to a lower temperature spectrum (innercomplex salts).
amount used: NR: 0,1-0,5 wt-%, SR: 1-3 wt-%
Vulcanization for linking the rubber molecules vulcanization agents and creating linking bridges vulcanization accelerators (usually sulphur, vulcanization activators Vulcanization sulphurproducers, peroxides) vulcanization retarders amount used: soft rubber: 0,25-5,0 phr, hard rubber:
25-40 phr Antiaging antiaging agents provide the 1. antioxidants agents finished product with protection 2. antifatigue agents against damaging influences. 3. antiozonants 4. light protection agents
5. antihydrolysis agents 6. agents against metal poisoning
8. reversion protection agents 9. anticyclization agents amount used: 0,2-7 phr Fillers substances which are insoluble inorganic fillers towards the rubber matrix, organic fillers involatile and inert towards the polymer. The
attribute of the vulcanizate is defined by the fillers. They extend and strengthen the vulcanizate.
amount used: 5-60 wt-%
Plasticizers plasticizers serve as extensions, they improve the fluidity, they distribute the fillers, improve the workability and the adhesiveness. They influence the physical attributes of the rubber like expansion and elasticity. Primary Plasticizers have a loosening effect and lower the viscosity of unvulcanizated rubber mixtures. Secundary Plasticizers serve as lubricants and improve the shapeability.
Plasticizers (categories: mineral oils, natural substances, synthetic plasticizers)
Pigments/ pigments are in rubber de facto 1. anorganic pigments: colourants insoluble, organic or inorganic, a) white pigments coloured or white substances. b) coloured pigments c) organic pigments Amount used: up to 15 phr
7. desactivators
Table 2 continued overleaf
191

IC-15 OTHERS:RUBBER INDUSTRY
Table 2 continued Function of additives in the process steps
Process step/ additive
Description Function of the chemicals used
Processing aids processing aids ease the working of the material: 1. lubricants are used mainly in the extrusion and
the injection moulding processes 1. lubricants 1-5 wt-% - Metal soaps (like zinc-,calcium-soaps) - Aliphatic acids, Aliphatic acidester
2. tackifiers serve to increase the assembly adhesion
2. tackifier
3. among others to improve the stability, the injectability and calendrability
3. faktice
4. by using fillers activators, the activity of the fillers can be improved
4. fillers activators, adhesion agents
5. blowing agents are used to produce porous rubber articles (decompose under gas splitting)
6. bonding agents increase the adhesion of rubber on strengthening material (weaves, metal)
6. bonding agents
amount used: up to 15 phr Other agents 1. anticyclization agents serve to prevent unwanted
cyclization during mastication 1. anticyclization agents
2. with the aid of replastication agents slightly vulcanized mixtures can be returned to a workable condition (desulphuring of the rubber mixture)
2. replastication agents
3. emulsifier disperse systems 3. emulsifier 4.flame retardant lower the flammability of the
rubber 4. flame retardant
5. in solvent adhesives, in solvent dipping processes, for cleaning
5. solvents
6. for refining the surface 6. surface treatment agents 7. to increase the hardness of the vulcanizate 7. hardeners 8. to nuance, neutralize and cover the rubber smell 8. odorants 9. to increase the electronic conductibility 9. antistatic agents 10. to kill microorganisms 10. microbiocides 11. to prevent the spreading of germs 11. antitermite agents amount used: up to 2 wt-%
to add pulverized additives into 1. dispersion agents chemicals the aqueous colloidal latex 2. emulsifier solution 3. stabilizer 4. wetting and foaming agents 5. foam stabilizers 6. thickeners 7. coagulating agents 8. preservatives 9. vulcanization chemicals 10. antiaging agents 11. fillers 12. plasticizers amount used: up to 5 phr Release agents 1. prevent unvulcanized rubber mixtures from
adhering during storage 1. release agents for unvulcanized rubber mixtures
2. prevent rubber from sticking to the forming tools 2. mould release agents 3. release agents are added to the rubber mixture,
migrate to the surface and impove the removability of the vulcanizate from the form
3. mandrel release agentsamount used: up to 30 phr
5. blowing agents 5-10 wt-% - anorganic - organic
Latex-
192

IC-15 OTHERS:RUBBER INDUSTRY
4 EMISSION SCENARIOS
The contamination of water in the rubber industry takes place in several areas of the rubber production. Usually whenever water comes into direct contact with the unvulcanized rubber product. This happens during cooling-, heating-, vulcanization- and cleaning operations. Examples are the direct cooling during the extrusion, or the direct contact of the material vulcanized with the steam in vulcanization processes.
The sources and contaminations of wastewater are presented in Table 3. The water can contain zinc, compounds of zinc are often used in adherents, cadmium, copper and lead from the vulcanization. Storing, weighing, mixing are other possible sources for an exposition.
By using wastewater free procedures (indirect cooling, circulation systems, dry cleaning) a releases into the compartment water can be avoided. A cascading arrangement of the rinsing baths and an optimized water flow can also decrease the volume of wastewater. The remaining volume will be treated, if the pollutant concentration makes it necessary. Degreasing is accomplished with the aid of chlorinated hydrocarbons and complex builders like EDTA. The reduction or prevention of dangerous substances from the cleaning operations can be accomplished by degreasing on a aqueous basis.
Table 3 Water contamination of different sources in the rubber industry (in mg.l-1) (WDK, 1999) 1)
Source COD 2) C 3) SLS 4) AOX 5) BTX 6) NO2 Ptotal Pb Cu Zn Cd Direct cooling water and adherent contact after mixing
3000 (RP) 1,5 (RP)
0,54 (TI) 1,0
(RP)
<0,005 (TI)
Direct cooling water after extrusion
5 (RP)
<0,05 (RP)
0,06 0,12 0,052 0,084 (TI) <0,1 (RP)
<0,001 (TI) <0,005 (TI) <0,02 (RP)
Wastewater from the waste air treatment during the production and processing of solutions after pretreatment (stripping)
ca. 6,000 35,000 I 1,000 (RP)
0,1 O (RP)
0,03-0,2 (RP)
0,1 I 8,1 O
Wastewater from vulcanization in forms as well as subsequent washing and cleaning processes
282 (TI)
0,065 (TI)
0,14 (TI)
6,8 (TI)
Wastewater from vulcanization in autoclaves as well as subsequent washing and cleaning processes
65 (RP)
1100 (RP)
301 (RP)
233 (RP)
0,23 (RP)
0,05 (RP) 3,3 (TI) 0,2
(RP)
<0,03 (TI) 0,16 (RP)
0,02 (RP) 0,05 (RP)
0,22 (RP) 0,87 (RP)
<0,002
(RP) ca.
0,05 (RP)
Table 3 continued overleaf
193

IC-15 OTHERS:RUBBER INDUSTRY
Table 3 continued Water contamination of different sources in the rubber industry
Source COD 2) C 3) SLS 4) AOX 5) BTX 6) NO2 Ptotal Pb Cu Zn Cd Wastewater from vulcanization in a salt bath as well as subsequent washing and cleaning processes
1500 (RP)
Wastewater from general cleaning of production tools
540 (TI) 2000 I 1200 O
(RP)
87 (TI) 0,05
O (RP)
28 O (RP)
80 (TI) >3,0 I <1,0 O (RP)
<1 (TI) 41 I
6,6 O
5,8 I 0,01
O (RP)
2,2 I 0,02
O (RP)
38,5 I 0,2 O (RP)
I: inflow; O: outflow; TI: tire; RP: rubber products 1) This table gives an overview about individual situations of special rubber manufacturers. It is not a generalization of the emission
situation 2) Chemical oxygen demand 3) Hydrocarbons 4) Semivolatile lipophile substance 5) Adsorbable organic halogen compounds 6) Benzene, Toluene, Xylene
4.1 DEFINITION OF THE POINT SOURCE
The wastewater from the rubber industry can be divided into the areas sanitary, precipitation, metal working, rubber working and others. The total discharged quantity each day is shown in Figure 7. The discharged amount below is given for the Association of the German Rubber Industry (WDK). Hitherto the point source is related to the Federal Republic of Germany. But the size for a typical manufacturer is applicable for the other member states of the EU because the general structure is similar.
sanitaryrainwater
metalworking rubber
processing other
indirect discharge
direct discharge
0
1
2
3
4
5
6
7
8
9
1000
m³/d
Figure 7 Amount of wastewater for direct and indirect discharge for members of the association of the German Rubber
Industry (WDK, 1999)
194

IC-15 OTHERS:RUBBER INDUSTRY
The wastewater data was recorded for 18 direct discharger (plant specific STP) and 70 indirect discharger (municipal STP) by the WDK. It should be noted, that 3 companies discharge 75% of the total amount directly and 1 indirect discharger made up for 30% of the corresponding discharge.
This wastewater amount not only covers the rubber working but also sanitary, metal working and other areas.
Table 4 Statistical data for the determination of a reasonable worst-case point source 1)
Samples [n] 84
Qwwat (arithmetic average of the wastewater amount) 184 m³.d-1
Qwwat (minimum) 10 m³.d-1
Qwwat (maximum) 1154 m³.d-1
Qwwat (90 percentile) 438 m³.d-1
1) These data are determined by using sources below the EU-STP-value of 2000 m³.d-1. The values for the determination of the relevant point sources are listed in Table 4. Direct discharge and indirect discharge are combined. The ESD uses an EU standard sewage treatment plant with a volume stream of 2,000 m³.d-1. In addition the tonnage is shown in relation to the wastewater amount.
To determine a representative point source, the 90 Percentile of these samples was calculated. Only those sources which are below the threshold value of 2,000 m³.d-1 were taken into account. The problem here is that those 84 companies who are below the threshold value discharge about 15,000 m³.d-1 (sum of wastewater amount of 84 companies), while the 4 very large companies who are above the threshold also discharge about 15,000 m³.d-1 (sum of wastewater amount of 4 companies).
To produce 1 tonne of goods a water consumption of about 3 m³ is assumed for rubber processing. This water consumption counts only for the area of rubber production. With the assumption that the water consumption of the rubber production makes up 37% of the total wastewater and a production ratio of 60:40 for tire: rubber products, a production of about 55 tonnes per day can be used for the defined point source.
4.2 RELEASE ESTIMATION
To estimate the release of a substance, the life cycle steps formulation and processing are summarized. The decision about the fate of the substance in the wastewater treatment is made by the function of the substance during the production process. In addition to this, the product type is included in the calculation over the amount produced. This can only happen though, if this is explicitly stated by the notifier or industry. If this is not the case, it is assumed, that the substance will be used for the production of tires as well as for rubber products.
A system is created in which a release can be calculated regardless of the depth of information. If no detailed information about the use of a substance is provided, default values will be assumed. The more detailed the information provided by the user, the more realistic is the generic scenario.
195
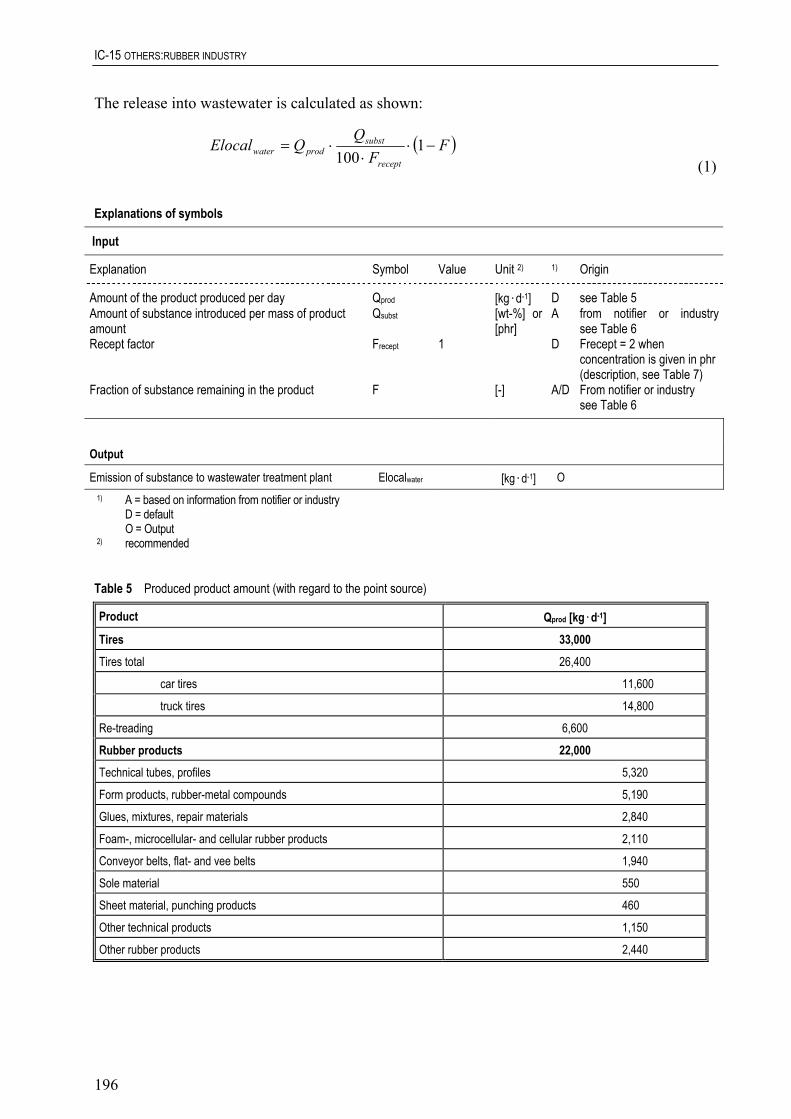
IC-15 OTHERS:RUBBER INDUSTRY
The release into wastewater is calculated as shown:
( )F
FQ
QElocalrecept
substprodwater −⋅
⋅⋅= 1100 (1)
Explanations of symbols
Input
Explanation Symbol Value Unit 2) 1) Origin
Amount of the product produced per day Qprod [kg.d-1] D see Table 5 Amount of substance introduced per mass of product amount
Qsubst [wt-%] or [phr]
A from notifier or industry see Table 6
Recept factor Frecept 1 D Frecept = 2 when concentration is given in phr (description, see Table 7)
Fraction of substance remaining in the product F [-] A/D From notifier or industry see Table 6
Output
Emission of substance to wastewater treatment plant Elocalwater [kg.d-1] O 1) A = based on information from notifier or industry D = default O = Output 2) recommended
Table 5 Produced product amount (with regard to the point source)
Product Qprod [kg.d-1] Tires 33,000 Tires total 26,400
car tires 11,600
truck tires 14,800
Re-treading 6,600
Rubber products 22,000 Technical tubes, profiles 5,320
Form products, rubber-metal compounds 5,190
Glues, mixtures, repair materials 2,840
Foam-, microcellular- and cellular rubber products 2,110
Conveyor belts, flat- and vee belts 1,940
Sole material 550
Sheet material, punching products 460
Other technical products 1,150
Other rubber products 2,440
196
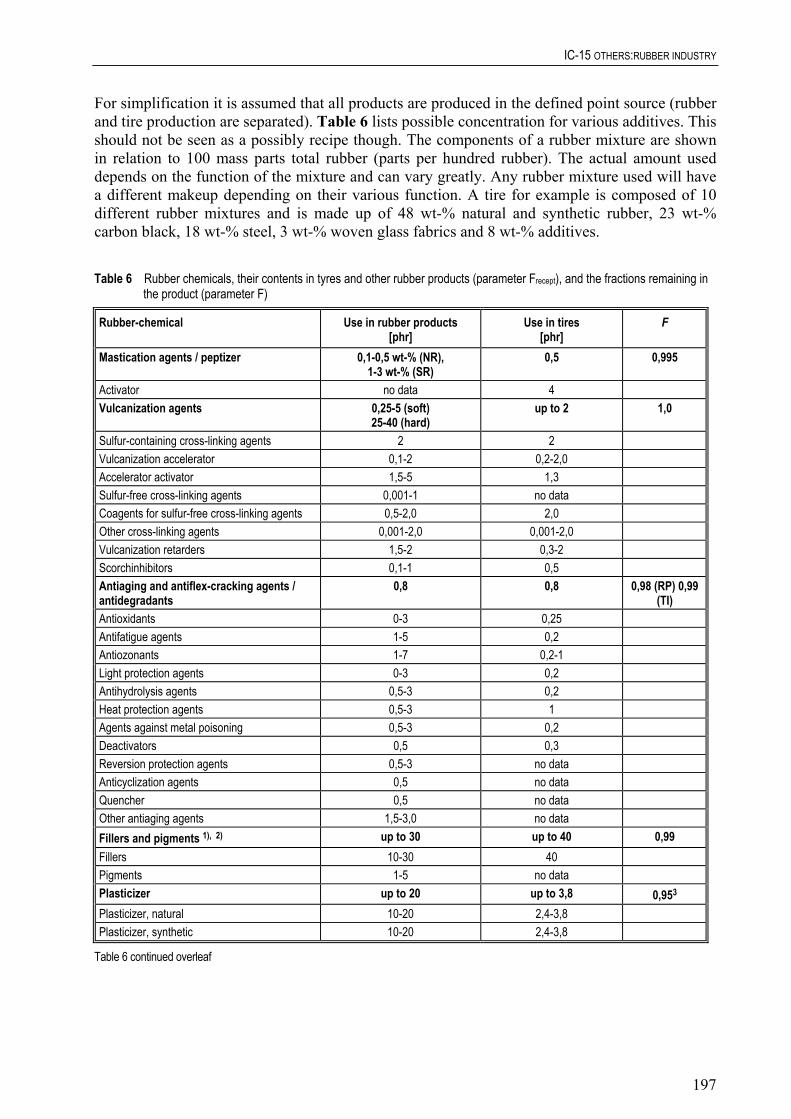
IC-15 OTHERS:RUBBER INDUSTRY
For simplification it is assumed that all products are produced in the defined point source (rubber and tire production are separated). Table 6 lists possible concentration for various additives. This should not be seen as a possibly recipe though. The components of a rubber mixture are shown in relation to 100 mass parts total rubber (parts per hundred rubber). The actual amount used depends on the function of the mixture and can vary greatly. Any rubber mixture used will have a different makeup depending on their various function. A tire for example is composed of 10 different rubber mixtures and is made up of 48 wt-% natural and synthetic rubber, 23 wt-% carbon black, 18 wt-% steel, 3 wt-% woven glass fabrics and 8 wt-% additives.
Table 6 Rubber chemicals, their contents in tyres and other rubber products (parameter Frecept), and the fractions remaining in
the product (parameter F)
Rubber-chemical Use in rubber products [phr]
Use in tires [phr]
F
Mastication agents / peptizer 0,1-0,5 wt-% (NR), 1-3 wt-% (SR)
0,5 0,995
Activator no data 4 Vulcanization agents 0,25-5 (soft)
25-40 (hard) up to 2 1,0
Sulfur-containing cross-linking agents 2 2 Vulcanization accelerator 0,1-2 0,2-2,0 Accelerator activator 1,5-5 1,3 Sulfur-free cross-linking agents 0,001-1 no data Coagents for sulfur-free cross-linking agents 0,5-2,0 2,0 Other cross-linking agents 0,001-2,0 0,001-2,0 Vulcanization retarders 1,5-2 0,3-2 Scorchinhibitors 0,1-1 0,5 Antiaging and antiflex-cracking agents / antidegradants
0,8 0,8 0,98 (RP) 0,99 (TI)
Antioxidants 0-3 0,25 Antifatigue agents 1-5 0,2 Antiozonants 1-7 0,2-1 Light protection agents 0-3 0,2 Antihydrolysis agents 0,5-3 0,2 Heat protection agents 0,5-3 1 Agents against metal poisoning 0,5-3 0,2 Deactivators 0,5 0,3 Reversion protection agents 0,5-3 no data Anticyclization agents 0,5 no data Quencher 0,5 no data Other antiaging agents 1,5-3,0 no data Fillers and pigments 1), 2) up to 30 up to 40 0,99 Fillers 10-30 40 Pigments 1-5 no data Plasticizer up to 20 up to 3,8 0,953 Plasticizer, natural 10-20 2,4-3,8 Plasticizer, synthetic 10-20 2,4-3,8
Table 6 continued overleaf
197

IC-15 OTHERS:RUBBER INDUSTRY
Table 6 continued Rubber chemicals, their contents in tyres and other rubber products (parameter Frecept), and the fractions remaining in the product (parameter F)
Rubber-chemical Use in rubber products [phr]
Use in tires [phr]
F
Processing aids up to 15 1-5 0,995 Lubricants and flow improvers 5-15 no data Tackifier 5-15 no data Factices 5-15 no data Filler activator 5-15 no data Blowing agents 5-10 3 1,0(t) Bonding agents 1-4 3-4 1,0(t) Stabilizer 1,5-3 1,5-3 Other agents 0,1-3 0,1-3 0,95 Anticyclization agents no data no data Replastication agents no data no data Emulsifier 0,1-0,5 no data Flame retardant 2-3 no data Solvents no data no data Surface treatment agent 2-43 2 Hardeners no data no data Odour agents 0,25-0,1 no data Antistatic agents 0,1-0,6 5 Microbiocides no data no data Antitermite agents no data no data
no data no data Homogenizer no data no data Latex-chemicals up to 5 0,95(RP) Dispersion agents 1-2 Emulsifier 1-5 Stabilizer 1-2
1-2 Foam stabilizers 1-5 Thickeners no data Coagulationg agents no data Preservatives no data Vulcanization chemicals 0,5-2 Antiaging chemicals no data Fillers no data Plasticizers no data Release agents up to 30 4) up to 30 0,95 For unvulcanized rubber 0,5-5 0,5-5 Mould release agents 5-30 5-30 Mandrel release agents 5-30 5-30
up to 5 up to 5 0,95 Cleaning agents no data no data Other rubber chemicals no data no data
Reinforcing agent
Wetting and foaming agents
Others
This substances are not a part of the rubber mixture, but will be treated so
1) after formulation, fillers are not removed from the rubber matrix 2) some fillers act as pigments and vice versa 3) plasticizer do not enter a chemical bond with the rubber, migration to the surface is possible 4)
198

IC-15 OTHERS:RUBBER INDUSTRY
A global “loss fraction” for the various additive types is assumed because detailed information is not available. If the amount of the additive class in the mixture is not specified, an estimation is made in the grey field.
To demonstrate the introduction of the t-factor for information about the composition in phr an example for a recipe is given in Table 7.
Table 7 Example for a recipe (Sablowski Datacomm, 1996)
Compound constituent Receipt phr
Receipt wt-%
SBR 80,28 43,63
BR 19,72 10,72
Fatty acid 1,97 1,07
Plasticizer 11,97 6,50
Waxes 1,69 0,92
Zinc oxide 3,10 1,68
Carbon black 60,56 32,91
Antiaging agent 1,69 0,92
Accelerator 1,20 0,65
Sulphur 1,83 0,99
Sum 184,01 99,99
5 EXAMPLES
A Calculation of the release of a plasticiser as additive in the manufacturing of a tire; emission occurs during cooling after extrusion (equation 1).
Input
Qprod= 33,000 kg.d-1 Qsubst= 3,8 phr Frecept= 2 - F = 0.95 - Output
Elocalwater= 31,35 kg.d-1
199

IC-15 OTHERS:RUBBER INDUSTRY
B Calculation of the release of an antioxidant as additive in the manufacturing of a rubber product (equation 1).
Input
Qprod= 22,000 kg.d-1 Qsubst= 0.4 phr Frecept= 2 - F = 0.99 - Output
Elocalwater= 0.4 kg.d-1
C Calculation of the release of an antiaging agent as additive in the manufacturing of a truck tire (equation 1).
Input
Qprod= 14,800 kg.d-1 Qsubst= 0.5 wt-% Frecept= 1 - F = 0.99 -
Elocalwater= 0.7 kg.d-1
Output
Example for the determination of the Clocalwater with the data of example B
Additives in the rubber industry
Calculation of PEClocal for the aquatic compartment Chemical: Example
Amount of the product produced per day (from Table 5 (ESD)) Qprod = 22,000.kg.d-1 Amount of substance introduced per mass of product amount Qsubst = 0.4 phr Recept factor Frecept = 2 Fraction of substance remaining in the product F = 0.99 Fraction of emission directed to water (Simple Treat k: h-1, log H:, log POW:)
Fstpwater = 100%
Capacity of STP EFFLUENTSTP = 2,000 m³.d-1 Dilution factor (TGD) DILUTION = 10 Factor (1+Kp.SUSPwater) FACTOR = 1
Emission per day:
recept
substprodwater F
FQQElocal
⋅−⋅
⋅=100
)1( Elocalwater = 0.44 kg.d-1
200

IC-15 OTHERS:RUBBER INDUSTRY
Influent concentration:
Clocalinf = STP
water
EFFLUENTElocal
Clocalinf = 0.22 mg.l-1
Effluent concentration:
Clocaleff = Clocalinf .Fstpwater Clocaleff = 220 µg.l-1
Concentration in surface water:
Clocalwater = FACTORDILUTION
Clocal eff
⋅ Clocal .l-1
WDK (1999). WDK (Association of the German Rubber Industry) Information.
water = 22 µg
PEClocalwater = Clocalwater if PECregionalwater = 0
6 REFERENCES Baumann W, Ismeier M (1998). Kautschuk und Gummi - Daten und Fakten zum Umweltschutz. Springer Verlag.
Baumann W, Ismeier M (1998). Emissions from tires in dedicated use. Kautschuk, Gummi, Kunststoffe (KGK) 3.
Der Weltkautschukmarkt an der Jahreswende (1996). KGK 4(49), 37.
DIK (1997). Umweltexposition durch Reifeninhaltsstoffe; Workshop Gefahrstoffe und umweltrelevante Aspekte in der Gummiindustrie. Deutsches Institut für Kautschuktechnologie (DIK), Hannover, Germany.
Lüpfert S (1990). Raw Materials in the Rubber Industry in the Light of German and European Legislation. KGK 43(9), 780.
Lüpfert S (1991). Environmental Protection versus Compounding. KGK 44(8), 771.
Sablowski Datacom GmbH (1996). Rubber Doc. Karlsruhe, Germany.
Rentel KH, Gmehling J, Lehmann E (1991). Stoffbelastung in der Gummiindustrie. Wirtschaftsverlag NW, Bremerhaven, Germany.
Rubber Statistics (1998). Rubber Statistical Bulletin, 51(10), (http//:www.rubberstudy.com/STATS.htm).
Ullmanns (1993). Rubber - Ullmanns Encyclopedia of Industrial Chemistry, 5th completely rev. ed., Volume A 23, VCH, Weinheim, 221-472.
WDK (1990). Leaflet of the WDK (Association of the German Rubber Industry).
201

IC-15 OTHERS:RUBBER INDUSTRY
7 ABBREVIATIONS BR butadiene rubber
CR
isoprene isobutylene rubber
poly-2-chlorobutadiene
DIN German Institute for Standardization
EDTA ethylene diamine tetraacetate
EPDM ethylene propylene diene rubber
ESD Emission Scenario Document
EU European Union
F high frequency
IC industrial category
IIR
IR isoprene rubber
LCM liquid curing method
max maximum
NBR acrylonitrile butadiene rubber
NR natural rubber
PEClocal Predicted Environmental Concentration (at the local stage)
phr parts per hundred rubber
SBR synthetic butadiene rubber
SR synthetic rubber
STP sewage treatment plant
TGD Technical Guidance Document
UC use category
UHF ultra high frequency
WDK Association of the German Rubber Industry
202

BPT 6, 7 & 9 BIOCIDES USED AS PRESERVATIVES IN VARIOUS APPLICATIONS
EMISSION SCENARIO DOCUMENT FOR BIOCIDES USED IN PAPER COATING AND FINISHING
203


BPT-6, 7& 9 BIOCIDES USED AS PRESERVATIVES IN VARIOUS APPLICATIONS
CONTENTS
1 INTRODUCTION ........................................................................................................................................... 207
208
208
208
209
211
211
212
212
212
212
214
215 215 216 216
219
219
219 219 221 221
222 222 222 223
223
224
2 MAIN PROCESSES........................................................................................................................................
2.1 PULP STOCK PREPARATION ...........................................................................................................
2.2 WET-END OPERATIONS ....................................................................................................................
2.3 DRY-END OPERATIONS.....................................................................................................................
2.4 COATING ...............................................................................................................................................
2.5 CALENDERING.....................................................................................................................................
2.6 FINISHING (WINDING).......................................................................................................................
3 BIOCIDES .......................................................................................................................................................
4 RELEASE ESTIMATION .............................................................................................................................
4.1 PRODUCTION ESTIMATION ............................................................................................................
4.2 WATER CONSUMPTION ....................................................................................................................
4.3 RELEASES.............................................................................................................................................. 4.3.1 Release distribution ....................................................................................................................... 4.3.2 Release from on-line (size-pressing) and off-line coating. ............................................................ 4.3.3 Release from “broke” .................................................................................................................... 4.3.4 Release from paper recycling ........................................................................................................ 217 4.3.5 Release due to other life-cycle stages ............................................................................................
4.4 WASTEWATER TREATMENT ..........................................................................................................
4.5 EMISSION SCENARIOS ...................................................................................................................... 4.5.1 Release from drying sections after size-pressing and coating........................................................ 4.5.2 Release from “broke” .................................................................................................................... 4.5.3 Release from paper recycling ........................................................................................................
4.6 EXAMPLE CALCULATION................................................................................................................ 4.6.1 Release from drying sections......................................................................................................... 4.6.2 Release from "broke"..................................................................................................................... 4.6.3 Release from recycling paper ........................................................................................................
5 REFERENCES ................................................................................................................................................
6 GLOSSARY .....................................................................................................................................................
205

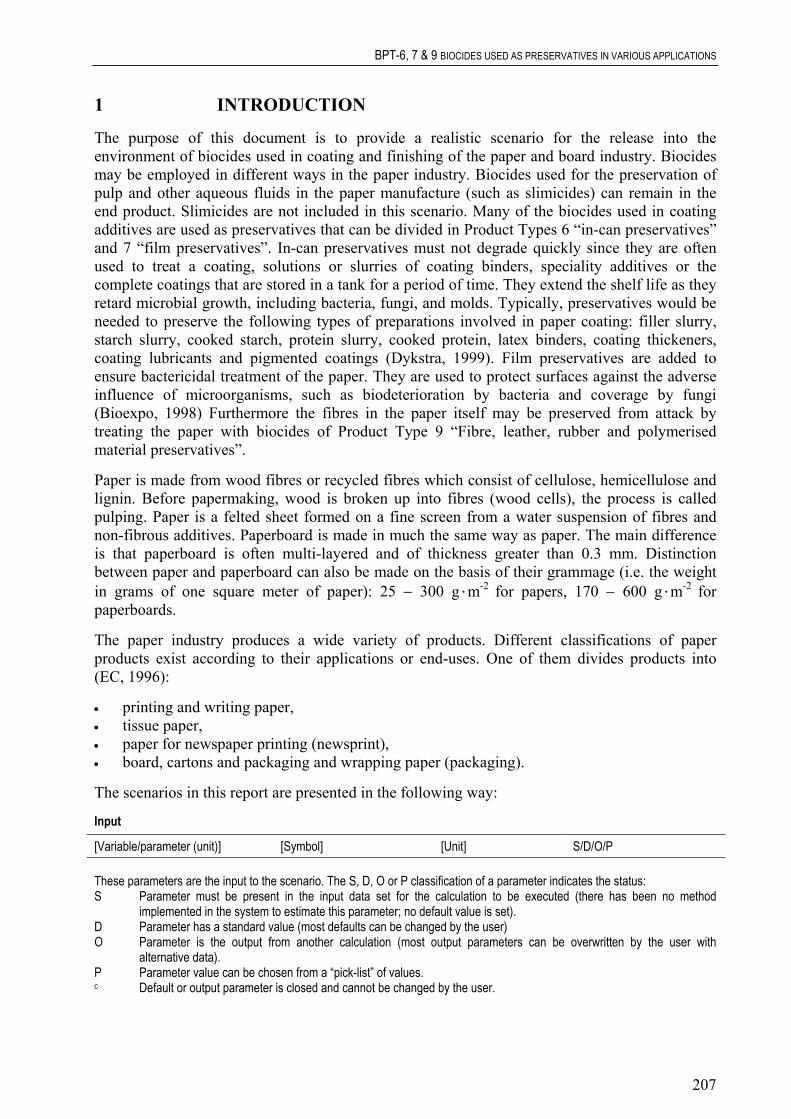
BPT-6, 7 & 9 BIOCIDES USED AS PRESERVATIVES IN VARIOUS APPLICATIONS
1 INTRODUCTION
The purpose of this document is to provide a realistic scenario for the release into the environment of biocides used in coating and finishing of the paper and board industry. Biocides may be employed in different ways in the paper industry. Biocides used for the preservation of pulp and other aqueous fluids in the paper manufacture (such as slimicides) can remain in the end product. Slimicides are not included in this scenario. Many of the biocides used in coating additives are used as preservatives that can be divided in Product Types 6 “in-can preservatives” and 7 “film preservatives”. In-can preservatives must not degrade quickly since they are often used to treat a coating, solutions or slurries of coating binders, speciality additives or the complete coatings that are stored in a tank for a period of time. They extend the shelf life as they retard microbial growth, including bacteria, fungi, and molds. Typically, preservatives would be needed to preserve the following types of preparations involved in paper coating: filler slurry, starch slurry, cooked starch, protein slurry, cooked protein, latex binders, coating thickeners, coating lubricants and pigmented coatings (Dykstra, 1999). Film preservatives are added to ensure bactericidal treatment of the paper. They are used to protect surfaces against the adverse influence of microorganisms, such as biodeterioration by bacteria and coverage by fungi (Bioexpo, 1998) Furthermore the fibres in the paper itself may be preserved from attack by treating the paper with biocides of Product Type 9 “Fibre, leather, rubber and polymerised material preservatives”.
Paper is made from wood fibres or recycled fibres which consist of cellulose, hemicellulose and lignin. Before papermaking, wood is broken up into fibres (wood cells), the process is called pulping. Paper is a felted sheet formed on a fine screen from a water suspension of fibres and non-fibrous additives. Paperboard is made in much the same way as paper. The main difference is that paperboard is often multi-layered and of thickness greater than 0.3 mm. Distinction between paper and paperboard can also be made on the basis of their grammage (i.e. the weight in grams of one square meter of paper): 25 − 300 g.m-2 for papers, 170 − 600 g.m-2 for paperboards.
The paper industry produces a wide variety of products. Different classifications of paper products exist according to their applications or end-uses. One of them divides products into (EC, 1996):
• printing and writing paper, • tissue paper, • paper for newspaper printing (newsprint), • board, cartons and packaging and wrapping paper (packaging).
The scenarios in this report are presented in the following way:
Input
[Variable/parameter (unit)] [Symbol] [Unit] S/D/O/P These parameters are the input to the scenario. The S, D, O or P classification of a parameter indicates the status: S Parameter must be present in the input data set for the calculation to be executed (there has been no method
implemented in the system to estimate this parameter; no default value is set). D Parameter has a standard value (most defaults can be changed by the user) O Parameter is the output from another calculation (most output parameters can be overwritten by the user with
alternative data). P Parameter value can be chosen from a “pick-list” of values. c Default or output parameter is closed and cannot be changed by the user.
207
BPT-6, 7 & 9 BIOCIDES USED AS PRESERVATIVES IN VARIOUS APPLICATIONS
Output
[Symbol] [Description]
Intermediate calculations
Parameter description (Unit) [Parameter = equation] (Equation no.)
End calculations [Parameter = equation] (Equation no.)
2 MAIN PROCESSES
Manufacture of paper and paperboard can be divided into two steps: pulp making and paper / paperboard production which is the step of interest in this scenario.
Papermaking operations generally consist of the following processes (Figure 1):
• pulp stock preparation, • wet-end operations: formation of paper sheet from wet pulp, • dry-end operations: drying of paper products, application of surface sizing, • coating (optional), • calendering, • finishing (winding for storage).
2.1 PULP STOCK PREPARATION
Pulp stock is processed to obtain desired qualities, such as surface, opacity, strength, and feel, in the finished paper and paperboard products. Stock preparation processes include pulp mixing and dispersion, beating and refining, and the addition of wet-end additives (resins, waxes, clays, silicas, talc, inorganic/organic dyes and certain inorganic chemicals) used to create paper products with special properties or to facilitate the papermaking process. Softwood and hardwood pulp are frequently combined to produce paper or paperboard of desired finished properties. Beating and refining make the finished product stronger, more uniform, more dense, more opaque, and less porous (US EPA, 1995, 1999).
2.2 WET-END OPERATIONS
The processed pulp is converted into a paper product via a paper production machine, the most common of which is the Fourdrinier paper machine. The first two operations performed by this machine, sheet formation and pressing, are referred to as “wet-end” operations. Fibres in the form of a fibre slurry are distributed evenly onto a thin moving wire mesh (“the wire”) through which excess water drains. Suction from a series of hydrofoils, vacuum boxes, and vacuum rolls extracts water from the formed sheet. This water, containing entrained fibres is captured and recycled after a series of thickening and cleaning steps. The continuous sheet is then pressed between a series of rollers to remove more water and compress the fibres (US EPA, 1995, 1999).
208

BPT-6, 7 & 9 BIOCIDES USED AS PRESERVATIVES IN VARIOUS APPLICATIONS
2.3 DRY-END OPERATIONS
•
The remaining operations – drying, application of surface sizing, reeling, winding and application of surface treatments – are referred to as “dry-end” operations. They are commonly divided in four steps:
• pre-drying, • sizing, • post-drying,
reeling.
Pre-drying
After pressing, the sheet still contains 50% of water. It enters a closed (which is the most common) or open drying section, where the paper fibres begin to bond together as steam heated rollers compress the sheets. The sheet is maintained against rollers by a heavy cotton felt or a drying fabric of cotton and synthetic fibres. The hot condensed water present in the drier cylinders is collected in order to send it back in form of steam in the process.
These rollers dry the paper from 40 - 50% to 5 - 10% wetness. The temperature during the process ranges from < 100°C up to 130 -140°C at a maximum (Bayer, personal communication, 2001).
Sizing and post-drying (optional)
This is the section of the machine where starches and other chemicals are applied to the surface of the paper by spraying, by dipping in the "size-press" or by transfer from a roll in the “metering size-press”: a controlled amount of water based size mixture is added evenly to the paper sheet by first creating a uniform film thickness on the roll and then transferring the film onto the paper sheet in the nip of the “metering size-press”. Surface sizing is mainly used for printing and writing papers and packaging grades made from recycled fibres.
Although surface sizing treatment is a form of paper coating to improve its surface properties, the term “coating” is usually reserved for the application of a pigmented slurry to the surface of the paper in order to improve its printability or for other specialist applications (IPPC, 2000).
209

BPT-6, 7 & 9 BIOCIDES USED AS PRESERVATIVES IN VARIOUS APPLICATIONS
210

BPT-6, 7 & 9 BIOCIDES USED AS PRESERVATIVES IN VARIOUS APPLICATIONS
2.4 COATING
For further finishing, surface treatments may be applied, to improve printing properties, gloss, colour, and opacity. Coating consists of applying a “sauce” made up of water, pigments (calcium carbonate, clay, talc…), binders and co-binders, and additives (insolubilizers, lubricants, foam control agents, colorants, optical brightners, preservatives) on the surface of the sheet with roller, air knife, blade or bar. Biocides may be part of the “sauce” (Valette and de Choudens, 1992). The application of coatings may be achieved on-line (lighter coatings) or off-line (heavy coatings) machine. The high-quality printing papers are coated several times. In such a case, there is a precoating performed on machine (sizing) and one coating, or more, performed off-line (after the paper machine). For boards, usually just one side is coated (COPACEL, 2000; Valette and de Choudens, 1992). Off-line coating machines consist of an unwinder, one or more coating stations (coating application units), a drying section and a reel. The coated sheet is dried by a short steam-heated cylinder section, by infrared radiation, by hot air or combination of those. Dryers may be topped by a hood blowing hot air (IPPC, 2000; Valette and de Choudens, 1992). The coating slurry is generally re-circulated through the system with constant filtering to remove fibres and other contamination in order to maintain the slurry quality. Added chemicals may be applied to the surface by spraying or dipping (i.e. directly in the “sauce”). This is more controlled and involves only water for washing and cleaning, yet, this is possible only for a few applications. Liquid residues from coating can be treated separately in a precipitation step or by use of ultra-filtration (IPPC, 2000).
Most of the writing and printing papers are coated nowadays. Depending on grades of coated paper and boards, different amounts of coatings are applied, as shown in Table 1. Biocides represent usually less than 1% of the sizing solution.
Table 1 Amount of coatings applied according to the different types of paper (IPPC, 2000)
Types of paper Amount of coatings applied (g.m-2 per side)
Remarks
Art paper > 20 3 or more coats per side
Machine-coated papers 18 Often double coat
Lightweight Coated (LWC) papers 5-12
Folding boxboard and chromoboard 12-33 Precoat + topcoat
2.5 CALENDERING
After drying, the paper sheet is passed through a series of polished, close-stacked metal rollers known as a “calender”. The sheet is then pressed between heavy rolls in the calender that reduce the thickness of the paper and create a smooth surface. This is often the last operation carried out on a machine. Papers, to improve glossiness and smoothness, can pass through supercalenders which have traditionally been off-line equipment but are now being installed also into the drying section of the paper machine itself, to save production costs.
211
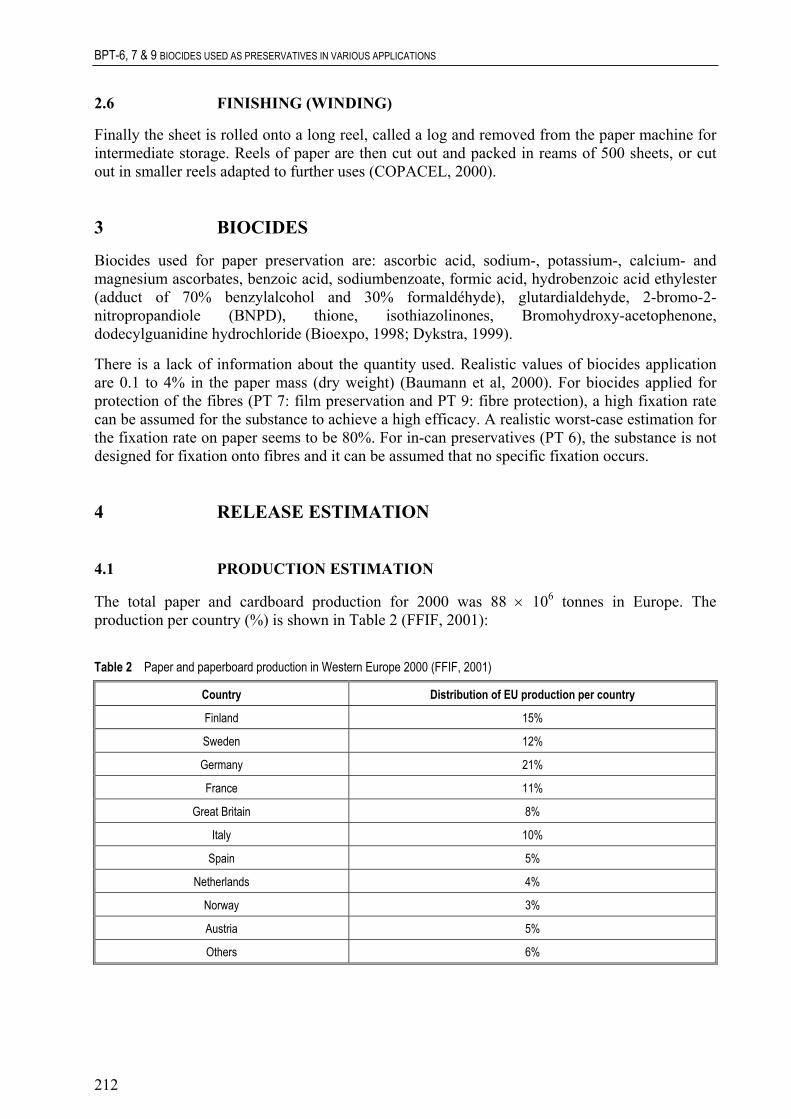
BPT-6, 7 & 9 BIOCIDES USED AS PRESERVATIVES IN VARIOUS APPLICATIONS
2.6 FINISHING (WINDING)
Finally the sheet is rolled onto a long reel, called a log and removed from the paper machine for intermediate storage. Reels of paper are then cut out and packed in reams of 500 sheets, or cut out in smaller reels adapted to further uses (COPACEL, 2000).
3 BIOCIDES
Biocides used for paper preservation are: ascorbic acid, sodium-, potassium-, calcium- and magnesium ascorbates, benzoic acid, sodiumbenzoate, formic acid, hydrobenzoic acid ethylester (adduct of 70% benzylalcohol and 30% formaldéhyde), glutardialdehyde, 2-bromo-2-nitropropandiole (BNPD), thione, isothiazolinones, Bromohydroxy-acetophenone, dodecylguanidine hydrochloride (Bioexpo, 1998; Dykstra, 1999).
There is a lack of information about the quantity used. Realistic values of biocides application are 0.1 to 4% in the paper mass (dry weight) (Baumann et al, 2000). For biocides applied for protection of the fibres (PT 7: film preservation and PT 9: fibre protection), a high fixation rate can be assumed for the substance to achieve a high efficacy. A realistic worst-case estimation for the fixation rate on paper seems to be 80%. For in-can preservatives (PT 6), the substance is not designed for fixation onto fibres and it can be assumed that no specific fixation occurs.
4 RELEASE ESTIMATION
4.1 PRODUCTION ESTIMATION
The total paper and cardboard production for 2000 was 88 × 106 tonnes in Europe. The production per country (%) is shown in Table 2 (FFIF, 2001):
Table 2 Paper and paperboard production in Western Europe 2000 (FFIF, 2001)
Country Distribution of EU production per country
Finland 15%
Sweden 12%
Germany 21%
France 11%
Great Britain 8%
Italy 10%
Spain 5%
Netherlands 4%
Norway 3%
Austria 5%
Others 6%
212

BPT-6, 7 & 9 BIOCIDES USED AS PRESERVATIVES IN VARIOUS APPLICATIONS
Size and number of paper mills in the EU are shown in Table 3. The production volumes per site, as determined in a survey in Germany (Böhm et al., 1997) is shown in Table 4. Table 5 shows the annual production for each category of papers and boards Europe.
The TGD suggests a default value between 40 and 200 t.d-1 for the production of tissue and between 100 and 1,000 t.d-1 for newsprint, packaging and board and writing and printing paper if no other information is available (EC, 1996). The industrial activity can be up to 350 days per year, 24 hours per day (COPACEL, 2000). Much higher production rates are reported from Finland. The average paper and cardboard production per paper mill is 1,144 t.d-1 (55-3,300 t.d-1) (Sirkka, 2001). Based on the figures in Table 4 as well as the figures from Finland, tentatively, a default value of 1,000 t.d-1 per site is recommended for a default scenario. It seems that half of the writing and printing production was coated (12.8.106 t/year for Europe) and half of the board production (COPACEL, 2000; IPPC, 2000).
Table 3 Number of paper mills by volume in EU 1999 (CEPI, 1999)
Size of facilities (CTP) by volume (t/y) Number of paper mills
< 10,000 283
10,000-25,000 173
25,000-50,000 147
50,000-100,000 144
100,000-200,000 95
> 300,000 74
200,000-300,000 57
Table 4 Daily production volumes in Germany (Böhm et al., 1997)
Type of paper Number of sites Average production volume [t.d-1]
Newsprint 33 449
Printing and writing paper 14 66
Paper and cardboard for packaging 48 237
Paper for sanitary and domestic use (tissue paper) 16 222
Special and industrial paper 43 102
117 329 Overall paper and cardboard
213

BPT-6, 7 & 9 BIOCIDES USED AS PRESERVATIVES IN VARIOUS APPLICATIONS
Table 5 Annual Paper and cardboard production in the EU (CEPI, 1999)
Production by grade paper in EU (1999)
Newsprint (paper for newspaper printing) 9,129
4,809
Coated mechanical 7,994
Uncoated woodfree 8,957
Coated woodfree 9,058
Sanitary & Household 4,763
Total packaging 31,663
Total paper 79 874
Total graphic 39,947
Uncoated mechanical
4.2
Type of paper
WATER CONSUMPTION
The amount of water released in paper production depends on the grade of the paper produced and the nature of raw material (see Table 6). Water consumption for coated paper is typically between 10 and 15 m3.t-1 of paper. About 1 − 1.5 m3.t-1 of paper (10%) is usually evaporated in the dryer section of a machine and lost from the process.
Table 6 Water release per ton of paper produced for different types of paper (IPPC, 2000)
Water release (m3.t-1)
5-40
Printing/writing, coated 5-50
Paper board 0-20
10-300
Tissue 10-50
Printing/writing, uncoated
Speciality paper
•
•
•
• 1,000 – 30,000 m d
In a survey performed in Finland, the above figures were confirmed (printing/writing 19 m3.t-1, paper board 20 m3.t-1, newspaper 23 m3.t-1) (FEI, personal communication, 2001). In a survey performed in Germany (Böhm et al., 1997), covering 89% of the paper production in Germany, the above figures were confirmed. The overall mean for water release was 23.9 m3.t-1.
By linking the water releases presented in Table 6 with the daily paper production quantities presented in Table 4, it can be estimated that the average water releases per production site are:
500 – 25,000 m3.d-1 for printing and writing paper, 0 – 10,000 m3.d-1 for paper board, 2,000 – 10,000 m3.d-1 for tissue paper,
3. -1 for speciality paper.
The median values of wastewater effluent flow rates for different paper types in Finnish paper mills in the survey are approx. 17,000 m3.d-1 for printing and writing paper, 5,000 m3.d-1 for
214

BPT-6, 7 & 9 BIOCIDES USED AS PRESERVATIVES IN VARIOUS APPLICATIONS
paperboard, and 19,000 m3.d-1 for tissue paper/speciality paper. The median for all paper mills is 16,000 m3.d-1 (Sirkka, 2001).
For a default risk assessment according to EC (1996), it is usually assumed that the total effluent flow from a site is 2,000 m3.d-1. Given the figures above, it is evident that a higher flow of the wastewater should be assumed. A provisional figure of 5,000 m3.d-1 can be proposed. It is recognised though that the trend is towards lowering the amounts of wastewater released. The degree of closure of production processes is indeed rising (cf. Section 4.3.3). The default value of 5,000 m3.d-1 should therefore be revised periodically.
The situation in the EU is that the mill effluents are in some Member States usually (but not all) directed to on-site or municipal sewage treatment plants (STPs) whereas in other Member States the majority of paper mill effluents are not treated. In Finland, 8 of 24 paper and board mill have only minimal wastewater treatment (Sirkka, 2001). This is the case also in the UK where only 1/3 of paper mills treat their wastewaters at all (UK Environmental Agency, 2001). For a typical case, the risk assessment should be made according to the EC (1996) assuming that the wastewater from industrial sites is released to a municipal sewage treatment plant (STP). For a realistic worst-case scenario it should be assumed that the wastewater from the mill is treated only by mechanical and chemical means.
4.3 RELEASES
4.3.1 Release distribution
The input of biocides to the system together with other wet-end chemicals (e.g. starch, polyacryl amide), fillers (slurry of calcium carbonate) or reused fibres (recycled papers) has to be taken into account for the assessment of the mass flow of biocides. Papermaking generates also a number of solid wastes, such as coating residue and broke from finishing operations; broke may be re-pulped and returned to the stock preparation area (IPPC, 2000). Broke may be defined as any formed paper, from the beginning of the papermaking process to the finished product, that has been discarded anywhere in the process of manufacture (IPPC, 2000). Coating residues are generated when the coating slurry is cleaned before recirculation and when spent coating liquid is treated.
In general, the potential releases of chemical additives such as biocides are:
• to wastewater at pulp stock preparation and wet-end operations (from coated broke) ; after wastewater treatment the biocides – as far as not biodegraded – can be released to surface water and end up in the sewage sludge;
• to wastewater in the case that spent coating slurry is discharged directly into the sewerage or biocides remain in the water at treatment of the spent liquid;
• to exhaust air from the drying section of the paper machine and the coating machine respectively.
Soil may be affected via waste disposal (composting, use of paper sludge in agriculture, landfilling).
215
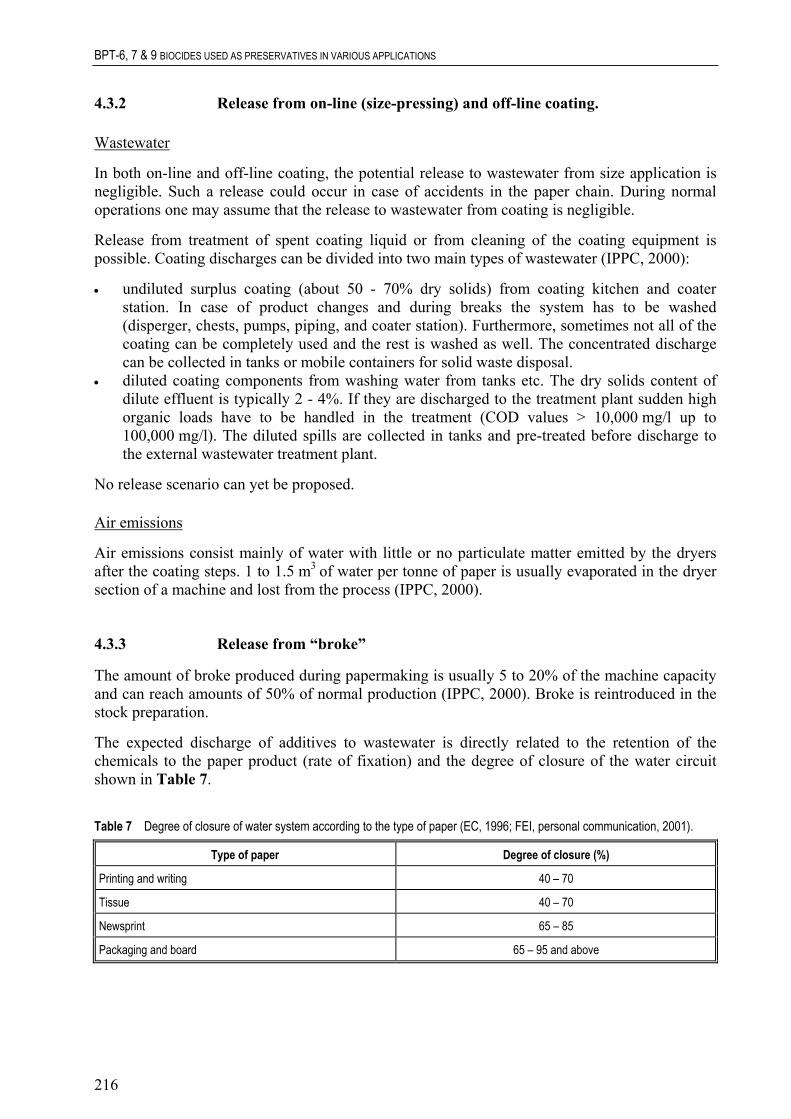
BPT-6, 7 & 9 BIOCIDES USED AS PRESERVATIVES IN VARIOUS APPLICATIONS
4.3.2 Release from on-line (size-pressing) and off-line coating.
Wastewater
In both on-line and off-line coating, the potential release to wastewater from size application is negligible. Such a release could occur in case of accidents in the paper chain. During normal operations one may assume that the release to wastewater from coating is negligible.
Release from treatment of spent coating liquid or from cleaning of the coating equipment is possible. Coating discharges can be divided into two main types of wastewater (IPPC, 2000):
• undiluted surplus coating (about 50 - 70% dry solids) from coating kitchen and coater station. In case of product changes and during breaks the system has to be washed (disperger, chests, pumps, piping, and coater station). Furthermore, sometimes not all of the coating can be completely used and the rest is washed as well. The concentrated discharge can be collected in tanks or mobile containers for solid waste disposal.
• diluted coating components from washing water from tanks etc. The dry solids content of dilute effluent is typically 2 - 4%. If they are discharged to the treatment plant sudden high organic loads have to be handled in the treatment (COD values > 10,000 mg/l up to 100,000 mg/l). The diluted spills are collected in tanks and pre-treated before discharge to the external wastewater treatment plant.
No release scenario can yet be proposed.
Air emissions
Air emissions consist mainly of water with little or no particulate matter emitted by the dryers after the coating steps. 1 to 1.5 m3 of water per tonne of paper is usually evaporated in the dryer section of a machine and lost from the process (IPPC, 2000).
4.3.3 Release from “broke”
The amount of broke produced during papermaking is usually 5 to 20% of the machine capacity and can reach amounts of 50% of normal production (IPPC, 2000). Broke is reintroduced in the stock preparation.
The expected discharge of additives to wastewater is directly related to the retention of the chemicals to the paper product (rate of fixation) and the degree of closure of the water circuit shown in Table 7.
Table 7 Degree of closure of water system according to the type of paper (EC, 1996; FEI, personal communication, 2001).
Type of paper Degree of closure (%)
Printing and writing 40 – 70
Tissue 40 – 70
Newsprint 65 – 85
Packaging and board 65 – 95 and above
216

BPT-6, 7 & 9 BIOCIDES USED AS PRESERVATIVES IN VARIOUS APPLICATIONS
In a survey performed in Germany (Böhm et al., 1997) and covering 70 sites, 4.2% reported degrees of closure of 1 − 49%, 17.1% reported degrees of closure of 50 − 80%, 15.7% reported degrees of 80 − 90% and 60% reported degrees of closure > 90%.
As indicated in EC (1996), the degree of closure will not affect the concentration of a substance in the wastewater, it will determine the volume of water and therefore the total amount of substance emitted. Note: this will not be true for slimicides, as higher concentrations in the system will be needed to retain efficacy for higher degrees of closure.
For assessment purposes, unless contrary information is available, it is suggested to use the average values of the ranges reported in Table 7 in the risk assessment.
4.3.4 Release from paper recycling
The recovery rate is the amount of paper and board recovered compared to the total consumption of paper and board. In the EU, this recovery rate is not homogeneous: indeed, according to COPACEL (2000), this rate was 40.7% and 70.2% in France and Germany respectively in 1997. The paper recycling rate, i.e. the fraction of recycled fibres used for paper production, is more homogeneous within EU. Almost half (49.1% in France) of the fibres used for papermaking came from recycled paper and boards. The average recycling rate in the EU is approx. 50% (COPACEL, 2000). Table 8 and Table 9 present average percentages of recycled fibres used in the production of different types of paper in Germany and in France respectively (values higher than 100% reflect the waste occurrence).
Table 8 Fraction of recycled paper used in Germany in 1998 (VDP, 2000)
Types of paper Use of recycled fibres (%)
All types 61
Printing and writing paper 37
Newsprint (paper for newspaper printing) 117
Board/Packaging 96
Paper for sanitary and domestic use (tissue paper) 69
Special and industrial paper 48
Table 9 Fraction of recycled paper used in France in 1998 (COPACEL, 2000)
Types of paper Use of recycled fibres (%)
All types 53.8
Corrugated board 91.6
Flat cardboard 89.5
Newsprint (paper for newspaper printing) 58.3
Paper for sanitary and domestic use (tissue paper) 46.4
Special and industrial paper 33.8
Packaging paper and cardboard 32.9
Printing and writing paper 10.9
217

BPT-6, 7 & 9 BIOCIDES USED AS PRESERVATIVES IN VARIOUS APPLICATIONS
Some of the recycled paper and board is coated. During the re-pulping step, part of the solubilised coating, including biocides, may then be released. There are two main processes for recycling fibres: processes with exclusively cleaning and processes with cleaning and deinking. Most of the coated papers pass through cleaning (washing which releases substances to wastewater) and deinking (flotation which produces a sludge which is dewatered and disposed of as a solid). The fraction of the recycled paper which will go to the deinking process is about 25% in Germany (Böhm et al., 1997) and about 30% in France (CTP, personal communication, 2001). Up to 50% ink froth and rejects are dewatered separately in a centrifuge or wire press type equipment (IPPC, 2000; EC, 1996).
Contaminants and clusters are removed continuously during the operation by a dirt trap (e.g. screen plate) and are sent to a reject conveyor, in order to avoid the contaminants breaking into small pieces or accumulating in the pulper. Normally the water for disintegration is totally re-circulated process water that comes as white water from the paper machine.
Wastewater from a recovered fibre paper mill is mainly generated during cleaning steps. It consists of water from reject separation by screens and centrifugal cleaners, filtrates from washers, thickeners and sludge handling, and excess white water depending on the rate of recycling (IPPC, 2000).
The pH of the deinking water is generally alkaline, it ranges between 9.5 and 10.5 (CTP, personal communication, 2001). Moreover, the temperature during the deinking process is about 45°C. The hydraulic retention time (HRT) is high because the process works in a closed circuit. Finally, solid retention time (SRT) ranges between 1.5 and 8 hours. Based on hydrolysis studies with the substance, the fraction decomposed during deinking can be estimated.
No specific figures are available regarding release to wastewater of biocides during the washing and/or deinking stage. However, the fixation rate is not the same for fibre preservatives and for coating preservatives (cf. Section 3). For coating preservatives which are easily soluble substances, a default value for release during the washing and/or deinking stage of 100% can be assumed.
During primary on-site wastewater treatment, it can be assumed that 80 − 100% of easily soluble substances remain in wastewater while 50 – 90% of poorly soluble substances are removed (IPPC, 2000; EC, 1996). If the fixation rate onto paper fibres during application is known, this value can be used as a default here as well.
EC (1996) suggests that the number of sites where recycling takes place is 10, i.e. each site processes 10% of the annual tonnage. Taken for the whole of the EU, the number of recycling sites seems to be grossly underestimated. For Germany alone, according to Böhm et al. (1997), 78 paper producers use recycled paper and there are 18 deinking installations. In France, there are 11 factories which have deinking installations. It is therefore proposed for substances which are produced at a high tonnage and which are used throughout the EU to apply the so-called 10% rule. Calculations are performed for a densely populated area of 200.200 km with 20 millions inhabitants. It is assumed that 10% of the European production and use take place within this region, i.e. 10% of the estimated emission is used as input for the region. Within the region, it can then be assumed that the size of the main local source of emissions into the local environment represents 10% of the total emissions within the region (fraction of main source f = 0.1). This would then be coherent with the results from Böhm et al. (1997).
For new substances or existing substances produced at low volumes and which are not used homogeneously through out the EU, it can be assumed in a first approach that the whole EU production volume is used within the region.
218

BPT-6, 7 & 9 BIOCIDES USED AS PRESERVATIVES IN VARIOUS APPLICATIONS
EC (1996) suggests that the number of working days is 250 d.y-1. For Germany, according to Böhm et al. (1997) factories work in average 317 days per year. In France, according to CTP (Personal communication, 2001), the number of working days is about 350 d.y-1. In Finland, according to the FEI (Personal communication, 2001) paper mills work in average 346 d.y-1 in the range of 269 to 358 d.y-1. An average figure of 340 d.y-1 is proposed as a default value. In principle, some biocides present in finished paper products may return via paper recycling, where the same biocide is applied again, thus accumulating on the long run, depending on removal rates at repulping as well as the fixation rate on fibres. This aspect is not yet taken into account in this document.
4.3.5 Release due to other life-cycle stages
Releases may occur during other life-cycle stages, e.g. the final use of paper or cardboard articles and the elimination of paper or cardboard articles. A large part of the biocides remaining in the finished articles can be released to the environment during the service life of the paper or cardboard articles. For volatile substances, a total release to the atmosphere can be assumed. All of these releases will be diffuse and relevant only for a regional exposure assessment. No precise quantitative release estimations can be proposed for the time being. Regarding waste elimination, a generic model for releases from landfills is under development and might be used once the model is available.
4.4 WASTEWATER TREATMENT
Usual treatments of wastewater from paper and board industries are:
• primary treatment (physical and chemical), • secondary treatment (biological treatment), • anaerobic biological treatment,
Releases in wastewater from the coating steps are negligible, only the release to air is taken into account here. No specific air estimation technique for paper coating has been developed yet. In the absence of the specific paper coating estimation, it is proposed to use the estimations derived for plastic coatings (BRE, 1998). For preservatives, the following release rates depending of the vapour pressure of the substance have been proposed for open processes:
• combined anaerobic-aerobic treatments (Valette and de Choudens, 1992).
Usually wastewaters from paper and board industry require a separate pre-treatment in a physico-chemical plant. If wastewaters are not treated before biological treatment, they may cause disturbances in the performance of the biological wastewater treatment plant (suspended solids). In recent years the membrane filtration technology has produced good results in coating colour recycling (IPPC, 2000).
4.5 EMISSION SCENARIOS
Release estimation is performed on a local scale. A release estimation model is presented below.
4.5.1 Release from drying sections after size-pressing and coating
219
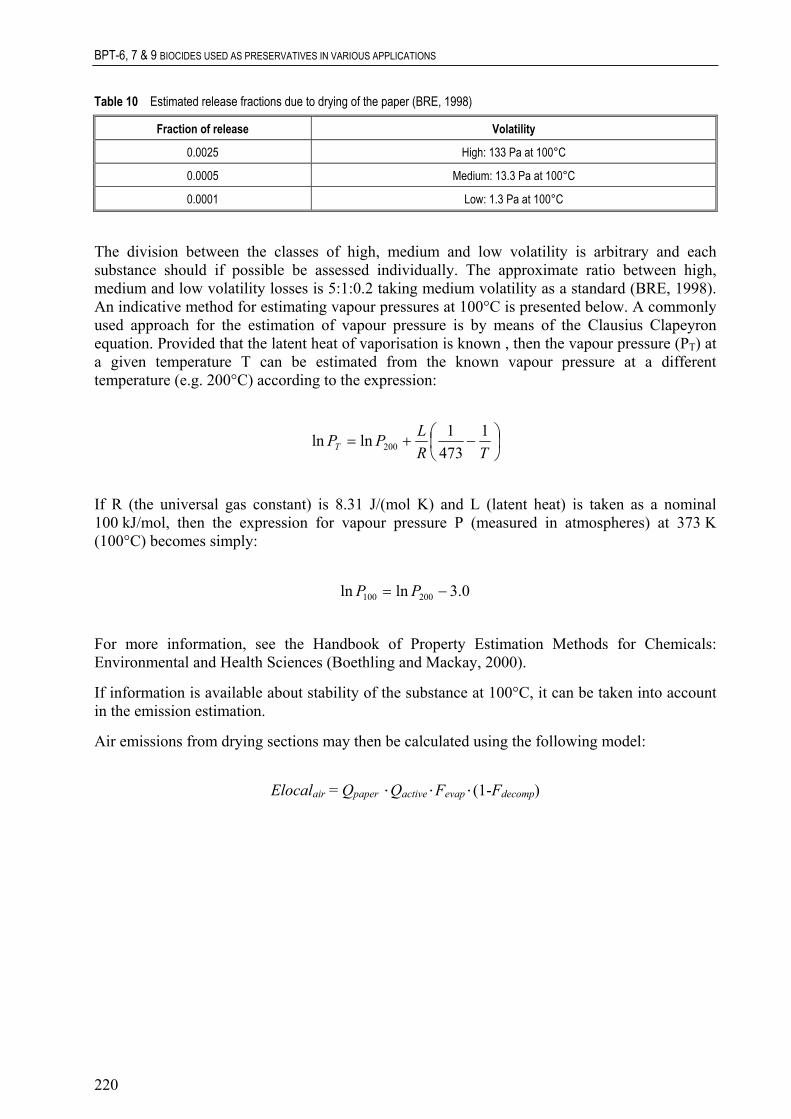
BPT-6, 7 & 9 BIOCIDES USED AS PRESERVATIVES IN VARIOUS APPLICATIONS
Table 10 Estimated release fractions due to drying of the paper (BRE, 1998)
Fraction of release Volatility
High: 133 Pa at 100°C
0.0005 Medium: 13.3 Pa at 100°C
0.0001 Low: 1.3 Pa at 100°C
0.0025
The division between the classes of high, medium and low volatility is arbitrary and each substance should if possible be assessed individually. The approximate ratio between high, medium and low volatility losses is 5:1:0.2 taking medium volatility as a standard (BRE, 1998). An indicative method for estimating vapour pressures at 100°C is presented below. A commonly used approach for the estimation of vapour pressure is by means of the Clausius Clapeyron equation. Provided that the latent heat of vaporisation is known , then the vapour pressure (PT) at a given temperature T can be estimated from the known vapour pressure at a different temperature (e.g. 200°C) according to the expression:
−+=
TRLPPT
14731lnln 200
If R (the universal gas constant) is 8.31 J/(mol K) and L (latent heat) is taken as a nominal 100 kJ/mol, then the expression for vapour pressure P (measured in atmospheres) at 373 K (100°C) becomes simply:
0.3lnln 200100 −= PP
For more information, see the Handbook of Property Estimation Methods for Chemicals: Environmental and Health Sciences (Boethling and Mackay, 2000).
Elocal Q .Q F (1-F
If information is available about stability of the substance at 100°C, it can be taken into account in the emission estimation.
Air emissions from drying sections may then be calculated using the following model:
air = paper active. evap. decomp)
220

BPT-6, 7 & 9 BIOCIDES USED AS PRESERVATIVES IN VARIOUS APPLICATIONS
Table 11 Emission scenario for calculating the releases from drying sections after size-pressing and coating
Variable/parameter (unit) Symbol Unit Default S/D/O/P Input
Quantity of coated paper produced per day (cf. Section 4.1, Table 4)
Qpaper t.d-1 1,000 D/P
Quantity of active substance applied per ton of paper for each application step
Qactive kg.t-1 S
Evaporation rate (cf. Table 10) Fevap - S/P Decomposition rate during drying Fdecomp - 0 S Output
Local emission of active substance to air for one treatment step Elocalair kg.d-1 O
4.5.2 Release from “broke”
Broke is released from the paper machine in the stock preparation. The release depends then on the rate of fixation of the active substance and the degree of closure of the water system and may be calculated using the model below.
Elocalwater = Qpaper.Qactive.Fbroke. (1 − Ffix).(1 – Fclosure)
Table 12 Emission scenario for calculating the releases from “broke”
Variable/parameter (unit) Symbol Unit Default S/D/O/P Input
Quantity of coated paper produced per day (cf. Section 4.1, Table 4)
Qpaper t.d-1 1,000 D/P
Quantity of active substance applied per ton of paper Qactive kg.t-1 S Degree of closure of the water system (cf. Table 7) - S/P
S/D
Fclosure Fraction of coated broke produced compared to overall production
Fbroke - 0.2
Fixation rate (cf. Section 3) Ffix - 0 S/D
Output
kg.d
Local emission of active substance to wastewater Elocalwater -1 O
4.5.3 Release from paper recycling
The emission in wastewater for recycling coated paper may be estimated using the model below.
TONNAGEREG = Freg.TONNAGE
221

BPT-6, 7 & 9 BIOCIDES USED AS PRESERVATIVES IN VARIOUS APPLICATIONS
For new substances or existing substances produced at low volumes and which are not used homogeneously through out the EU, it can be assumed in a first approach that Freg = 1.
Elocalwater = TONNAGEREG.Frecycling.f.Fdeinking.(1 – Fpreliminary).(1 − Fdecomp).1,000 / Nd
Unit
Table 13 Emission scenario for calculating the releases from paper recycling
Variable/parameter (unit) Symbol Default S/D/O/P Input
Relevant tonnage in EU for this application TONNAGE t.y-1 S t.y-1 O
Fraction of the region Freg - D f - 0.1 D
Paper recycling rate (cf. Table 9) Frecycling - 0.5 D/P Deinking yield (cf. section 4.3.4) Fdeinking - 1 S/D Fraction decomposed during deinking Fdecomp 0 S Fraction removed from wastewater during preliminary on-site treatment (cf. section 4.3.4)
Fpreliminary - S
Number of working days Nd d.y-1
Output
kg.d-1 Local emission of active substance to wastewater Elocalwater O
Relevant tonnage in the region for this application TONNAGEREG 0.1
Fraction of main source
-
340 D
4.6 EXAMPLE CALCULATION
4.6.1
QQFElocalair
4.6.2 Release from "broke"
Fbroke F =
=
Release from drying sections
paper = 500 t.d-1 x_active = 0.2 kg.t-1 evap = 0.0005
= 500.0.2.0.0005 = 0.05 kg.d-1
Qpaper = 500 t.d-1 Qactive = 0.2 kg.d-1
= 0.2 fix 0.8
Fclosure = 0.8 E 500.0.2.0.2.(1 – 0.8).(1 – 0.8) = 0.8 kg.d-1
222

BPT-6, 7 & 9 BIOCIDES USED AS PRESERVATIVES IN VARIOUS APPLICATIONS
4.6.3 Release from recycling paper
TONNAGEREG 25,000 kg.y=
=
[25,000.0.5.0.1.1.(1 − 0.8).(1 − 0)] / 320 = 0.78 kg.d
Baumann W, Herberg-Liedtke B (1994). Papier-chemikalien: Daten und Fakten zum Umweltschutz. Springer-Verlag.
COPACEL (2000). L’industrie papetière française en 1999. Rapport de la conférence de presse du 25 Janvier 2000. Confédération Française de l’Industrie des Papiers, Cartons et Celluloses (COPACEL), Paris (http://www.copacel.fr).
EC (1996). Technical Guidance Document on Risk Assessment in support of Commission Directive 93/67/EEC on Risk Assessment for New Notified Substances and Commission Regulation (EC) 1488/94 on Risk Assessment for Existing Substances. Part IV. Office for Official Publications of the EC, Luxembourg.
= -1 f 0.1 Frecycling = 0.5 Fdeinking 1 Fdecomp = 0 Fpreliminary = 0.8 (poorly soluble substance) Nd = 320 Elocalwater = -1
5 REFERENCES Baumann W, Hesse K, Pollkläsner D, Kümmerer K, Kümpel T (2000). Gathering and Review of Environmental Emission Scenarios for Biocides. Umweltbundesamt, Forschungsbericht FKZ 360 04 007, Berlin.
Bioexpo (1998). Development of a Concept for the Environmental Risk Assessment of Biocidal Products for Authorisation Purposes (BIOEXPO). van Dokkum HP, Scholten MCTh, Bakker DJ. Umweltbundesamt, Forschungsbericht FKZ 106 01 065, Berlin.
Boethling RS, Mackay D (2000). Handbook of Property Estimation Methods for Chemicals: Environmental and Health Sciences. Part 3: Vapor Pressure. CRC Press.
Böhm E, Hillenbrand T, Landwehr M, Marscheider-Weidemann F (1997). Untersuchungen zur Abwassereinleitung: Statistik wichtiger industrieller und gewerblicher Branchen zur Bewertung der Umweltgefährlichkeit von Stoffen. Umweltbundesamt, Forschungsbericht FKZ 106 04 144/01, Berlin.
BRE (1998). Use Category Document: Plastics Additives. Building Research Establishment (BRE), Revised draft, 100p.
COPACEL (2000). Les chiffres de l'économie papetière. L'industrie papetière française: les matières de base (bois, papiers et cartons récupérés). Confédération Française del'Industrie des papiers, Cartons et celluloses (COPACEL), Paris, (http://www.copacel.fr).
CEPI (1999). Annual Statistics for 1999. Confederation of European Paper Industries (CEPI), Brussels, 68 p. (http://www.cepi.org/htdocs/pdfs/stats/pub_a43.pdf).
CTP/Ademe (1996). Energie et environnement dans l’industrie papetière. Ed Ademe.
Dykstra GM (1999). Coatings Additives : the Important Roles for Biocides, Dispersants and Defoamers. TAPPI Coating materials Short Course: 1-9, (http://buckman.com/eng/coatings.htm).
FEI (2001). Finnish Environment Institute (FEI), Chemicals Division, (http://www.vyh.fi/eng/fei/fei.html).
FFIF (2001). Facts and Figures. The Finnish Forest Industries Federation (FFIF), (http://www.forestindustries.fi).
IPPC (2000). Papermaking and related processes. Chapter 6 in Document on Best Available Techniques in the Pulp and Paper Industry. Integrated Pollution Prevention and Control (IPPC). European IPPC Bureau, Sevilla, draft February 2000, 312-420 (http://eippcb.jrc.es/exe/FActivities.htm).
223

BPT-6, 7 & 9 BIOCIDES USED AS PRESERVATIVES IN VARIOUS APPLICATIONS
Sirkka S (2001). Environmental Exposure Assessment of Slimicides. Revision of the Emission Scenario Model for Finland. Helsinki (http://www.vyh.fi/eng/orginfo/publica/electro/femim212/femim212.htm).
UK Environmental Agency (2000). Emission Scenario Document – Water Treatment Chemicals, Chemicals Assessment Unit.
US EPA (1995). Profile of the Pulp and Paper Industry. EPA Office of Compliance Sector Notebook Project. US Environmental Protection Agency (US EPA), EPA/ 310-R-95-015. 130 p., Washington, DC.
US EPA (1999). Assessment Module for Woodyard, Papermaking and Other Operations. Section 9. Kraft Pulp Mill Compliance Assessment Guide: Chapters 6-9, US Environmental Protection Agency (US EPA).
Valette P and de Choudens C. (1992). Le bois, la pâte, le papier. 3rd edition. Centre Technique de l’Industrie des Papiers, Cartons et Cellulose. 199 p.
VDP (2000). Papier 2000. Ein Leistungsbericht. S.53. Verband Deutscher Papierfabriken (VDP), Bonn.
6 GLOSSARY Board: papers of 220 gsm (gram per square meter) and over are generally called boards. They have often more than one ply.
Broke: any formed paper, from the beginning of the papermaking process to the finished product, that has been discarded anywhere in the process of manufacture and is usually repulped.
They are two kinds – wet broke, which is accumulated at any stage on the dry end of the machine, trimmings from the reeling, slitting and cutting operations, as well as paper or board rejected during sorting.
Calender: a machine intended to smooth or otherwise finish the paper and consisting essentially of a certain number of superimposed rolls of which only one is power driven.
Coated papers: paper to which a coating has been applied on one or both sides, using a mix of clay or carbonates and latex to create a high quality printing surface.
Corrugated (paper or paperboard): paper which has undergone a treatment in order to give it a regular and permanently undulated aspect.
Deinking: the process of removing ink from printed waste papers, but also involving general removal of other undesirable materials.
Dry-end: part of the papermaking process after formation of the paper web.
Fillers (or loadings): papermaking additives in the form of powder or slurry, usually mineral clays or calcium carbonates, used to improve smoothness, opacity, brightness and dimensional stability of paper and board.
Grammage: mass of the paper / board, usually expressed as g/m².
Paper: sheet of fibres with a number of added chemicals. According to the basic weight it can be distinguished: paper < 150 g/m² < paperboard (or board) < 250 g/m² < cardboard.
Paper grades: paper is classified into different grades according to the end use, the pulp used and the treatment of the paper.
Ream: a term denoting a number of sheets of paper ranging from 480 to 516, most commonly 500.
Recycled fibre pulp: fibrous material that has already passed through paper and/or board production.
Save-all: an apparatus used for reclaiming fibres and fillers from white water. It usually operates on a filtration, sedimentation, flocculation, or flotation principle.
Size: non-fibrous materials used in papermaking to control the absorbency of paper. Rosin, Alum, starch and gelatine are the most commonly used.
Stock: terms used to describe the papermaking material in all stages, but usually referring to the wet pulp before it is fed onto the paper machine.
Supercalender: machine for giving paper a very smooth surface by passing it through a series of alternate metal and composition rolls, revolving with high speed and pressure.
224

BPT-6, 7 & 9 BIOCIDES USED AS PRESERVATIVES IN VARIOUS APPLICATIONS
Tissue paper: absorbent paper used for a variety of hygienic purposes.
Wet-end: part of the papermaking process prior to formation of the paper web.
White water: a general term for all waters of a paper mill that have been separated from the stock or pulp suspension, either on the paper machine or accessory equipment, such as thickeners, washers, save-alls, and from pulp grinders. It carries a certain amount of fibre and may contain varying amounts of f.
225


BPT 22 EMBALMING AND TAXIDERMIST FLUIDS
ASSESSMENT OF ENVIRONMENTAL RELEASE OF BIOCIDES USED IN TAXIDERMY AND EMBALMING PROCESSES
227


BPT-22 EMBALMING AND TAXIDERMISTS FLUIDS
CONTENTS
1 INTRODUCTION ........................................................................................................................................... 231
2 MAIN PROCESSES........................................................................................................................................ 232
2.1 TAXIDERMY ......................................................................................................................................... 232 2.1.1 Process ........................................................................................................................................... 232 2.1.2 Production estimation and water consumption .............................................................................. 234
2.2 EMBALMING ........................................................................................................................................ 235 2.2.1 Process before the funeral.............................................................................................................. 235 2.2.2 Process in medicine corpse donation ............................................................................................. 235 2.2.3 Production estimation and water consumption .............................................................................. 236
3 BIOCIDES ....................................................................................................................................................... 236
4 RELEASE ESTIMATION ............................................................................................................................. 237
4.1 RELEASES DISTRIBUTION ............................................................................................................... 237 4.1.1 Taxidermy...................................................................................................................................... 237 4.1.2 Embalming..................................................................................................................................... 237
4.2 WASTEWATER TREATMENT .......................................................................................................... 238
4.3 RELEASE ESTIMATION ..................................................................................................................... 238 4.3.1 Taxidermy...................................................................................................................................... 238 4.3.2 Embalming..................................................................................................................................... 239
4.4 EXAMPLE CALCULATION................................................................................................................ 241 4.4.1 Taxidermy...................................................................................................................................... 241 4.4.2 Embalming..................................................................................................................................... 241
5 REFERENCES ................................................................................................................................................ 242
229

BPT-22 EMBALMING AND TAXIDERMISTS FLUIDS
1 INTRODUCTION
The purpose of this document is to provide a realistic scenario for the releases into the environment of biocides from taxidermy and embalming installations. Taxidermy and embalming consist of the preservation of animal and human corpses respectively.
Taxidermy (Greek taxis, “arrangement”, derma, “skin”) is the art of mounting or replicating vertebrate animal specimens in a lifelike way for display or study. In some cases the skin is preserved and mounted on an artificial armature. Two types of taxidermists may be distinguished: the museum taxidermists and the professional or commercial taxidermists. In France, there are around 10 museum taxidermists and 425 professionals (Syndicat Naturaliste de France, personal communication, 2000). The main difference between them seems to be the production which is higher for professionals.
Embalming is the preservation of a human corpse. The preservation may be short term-preservation (thanatopraxis) or long-term preservation (essentially for bodies that have been donated to science). The latter is quite unusual in Europe and most of the time it is short-term preservation which is required (Schuette-Voss, 1997). The objective is to preserve the corpse in different cases : transport across state lines or for a distance of more than 600 km, transport by an airline, burial taking place more than 48 hours after death, or death due to a communicable disease (AFIF, 2000 ; Schuette-Voss, 1997). Embalming can take place also in case of medicine corpse donation. A fluid (in most cases formaldehyde) is injected into the body, while blood is removed. The concentration of formaldehyde is much lower than that for embalming (long-term preservation). The number of embalmers in France is approximately 700 and they treat approximately 40% of the deaths. Most of the universities of medicine practise embalming of corpses used by students. The estimate of corpse donations is approx. 4,000 per year in France (Université d'Angers, personal communication, 2000).
In both cases, taxidermy and embalming, biocides are applied for the preservation. The main biocide and fixative is formaldehyde. However, insect repellents are also applied in taxidermy on mounted animals subject to degradation.
The scenarios in this report are presented in the following way:
Input
[Variable/parameter (unit)] [Symbol] [Unit] S/D/O/P These parameters are the input to the scenario. The S, D, O or P classification of a parameter indicates the status: S Parameter must be present in the input data set for the calculation to be executed (there has been no method
implemented in the system to estimate this parameter; no default value is set). D Parameter has a standard value (most defaults can be changed by the user) O Parameter is the output from another calculation (most output parameters can be overwritten by the user with
alternative data). P Parameter value can be chosen from a “pick-list” of values. c Default or output parameter is closed and cannot be changed by the user. Output
[Symbol] [Description]
231

BPT-22 EMBALMING AND TAXIDERMISTS FLUIDS
Intermediate calculations
Parameter description (Unit) [Parameter = equation] (Equation no.)
End calculations [Parameter = equation] (Equation no.)
2 MAIN PROCESSES
2.1 TAXIDERMY
2.1.1 Process
The main steps in the process are described in Figure 1.
The preservation of animals concerns small as well as large mammals, fishes, birds and reptiles. Usually the main steps in preservation of large mammals for example are: skinning, rough fleshing, washing, rinsing, dry-salting, brine / pickle solution, re-fleshing, neutralisation, tanning, rinsing, oiling and breaking the hide. Yet, according to the kind of animal to be preserved, the technique differs slightly. Once the animal is completely skinned, the specimen is boned and the entire skeleton preserved, dried and saved. When the skin is ready, mounting over a manikin can proceed.
Skin treatment: After skinning and fleshing, the skin is washed in cold water with soft detergent and rinsed. The skin may then be tanned. Yet, for birds, most of the time, the skin is not tanned due to its slimness. A dry preservative treatment against insects may then be applied. This treatment may be preferred by some taxidermists also for fish and small mammals. The best known is the Becoeur soap made of arsenic powder, camphor, tartaric acid and lime in powder. Other products often used are the arsenic soap made of white soap flakes, arsenic salts, potash, camphor, alcohol and water, borax powder (very useful during the skinning and fleshing stages to absorb blood and grease) and other special products. For large mammals, the skin has to be carefully tanned and goes through the different steps described below.
Salting: After being washed carefully and drained, the skin is salted to preserve it until it is tanned. After almost 12 hours, one may proceed to the tanning or dry the skin for storage until tanning. Taxidermists often work on skins already salted and dried. The skins must then be soaked before going on with the tanning process. The salting process is important for both preventing hair from slippage and preparing the skin for the tanning process.
232

BPT-22 EMBALMING AND TAXIDERMISTS FLUIDS
Figure 1 Main processes and releases from the treatment of animal skins for taxidermy
Soaking: It aims at re-hydrating the skin and removing dirt.
Pickling: After rinsing the skin, it is plunged in an acid bath (pH around 2). This bath is made of water (200%, related to the weight of the skin), salt (12%), formic acid (2%) and of -bactericidal- formalin (0.5%). The skin soaks in this bath at least three days for a thin skin, but can stay several months if it is stirred regularly. The pH must be controlled often and be stabilised around 2.
Basification: The skin is drained and placed in clear water. A small amount of sodium bicarbonate or other neutralising agent is added to help fixing the tanning agent by raising the pH up to 4.
233

BPT-22 EMBALMING AND TAXIDERMISTS FLUIDS
Tanning: There are several kinds of tanning products :
• vegetable tannins, • mineral, such as chromium or aluminium salts, • organic, such as synthetic tannins or organic compounds (e.g. formalin),
The choice of the tanning agent is made according to the leather destination. It may be added to the pickling bath (2%) or in a new bath (5%). The skin must stay 24 hours in the bath. The skin is then rinsed and drained.
Neutralisation: The purpose of this step is to bring back the skin to a pH of 7. Sodium bicarbonate (2%) is diluted in water (200%) and the skin stays in the bath one hour. The pH must be checked and sodium bicarbonate added if the pH is too low. Then the skin is rinsed and drained.
Insects protection: The skin is put in a new bath (200%) of warm water (35 – 40°C) in which an insecticide is added (2%). The skin stays in the bath during 30 minutes and then is rinsed with ammoniated water and drained.
Fatliquoring: A variable amount of grease or specific oil is incorporated in the leather to give it flexibility and impermeability. The product is applied by brush. The skin is folded for one night and then drained several hours (Brigot, 1991).
Mothproofing agents may be applied later on new or existing mounted animals. In most cases, the active substances are absorbed into the skin and insect repelling vapours will be slowly released over a period of many years.
2.1.2 Production estimation and water consumption
For large skins or hides, taxidermists send them for tanning to large scale tanneries. In this case, the releases of biocides during the tanning are taken into account by the emission scenario developed for biocides used as preservatives in the leather industry (Product Type 9).
On the other hand, small skins or hides are tanned by taxidermists themselves. The amount is low. In France, taxidermists tan themselves an average of 50 skins or hides per year, but this figure varies from 15 to 100 per year according to taxidermists. And out of the 50 tanned skins, 20 weigh about 4 kg, and 30 less than 1 kg.
As a worst case, a figure of 1 tanned skin of 4 kg per day can be proposed. The season of tanning lasts only from September to March. (Syndicat des Naturalistes de France, personal communication, 2001).
The water consumption depends on the weight of the skin as seen in Section 2.1.1. An estimated value of 0.1 m3 of water per kg of skin seems to be used for the whole process.
234

BPT-22 EMBALMING AND TAXIDERMISTS FLUIDS
2.2 EMBALMING
2.2.1 Process before the funeral
There are three different procedures in embalming which involve the use of biocides:
• Surface disinfection (soaps, solutions), • Fluids for arterial injection to substitute body fluids, • Cavity fluids.
First, the body is washed with a disinfectant soap to prevent the spread of germs.
Then, arterial embalming is begun by injecting embalming fluid into an artery while the blood is drained from a nearby vein or from the heart. Before the injection, the solution of arterial fluids must be prepared. There is a high diversity of formaldehyde composition of arterial fluids. According to the preservation desired (short-term or long-term preservation), the age, weight, cause of death and length of time between death and embalming, the amount and type of chemicals used differ. In the case of certain cancers, some diabetic conditions, or because of the drugs used prior to death (where body deterioration has already begun), a stronger or "waterless" solution is likely to be used for better body conservation.
Usually a solution of about 6 l is injected during this first step in cases of short-term preservation and a solution of 10 l is injected for long-term preservation. The solution used is composed mainly of formaldehyde (2 − 4%) mixed with methanol, glycerine and dyes. Chemicals may also be injected by syringe into other areas of the body (Fédération Nationale Services Funéraires Publics-FNSFP, personal communication, 2000).
The second part of the embalming process is called cavity embalming. The organs in the abdominal and thoracic cavities must be treated separately with a strongly bactericide solution of formaldehyde (22%). Gas and fluids are withdrawn before “cavity fluid” is injected into the torso, by making an incision near the navel. Usually a solution of 0.5 l is injected in both long-term and short-term preservation.
All openings are carefully closed before injecting the fluids. The body is then entirely washed with a disinfectant solution (e.g. a 75% alcohol solution) for the second time. For a normal intact body, the average embalming time is approximately two hours (Mao and Woskie, 1994).
The blood and body fluids recovered may be first treated with disinfectant in cases where the person died of a contagious disease, before being released to the sewer or stored in a receptacle.
2.2.2 Process in medicine corpse donation
Besides the embalming of corpses in funeral cases, embalming can take place also for medicine corpse donations (most of the long-term conservations). An arterial injection with a solution of formaldehyde 5% (mixed with methanol 5%, glycerine 10%, lanolin 1%, potassium nitrate and dyes) is needed, followed by an immersion bath of 15 days in a preservative solution (formaldehyde 3%, methanol 3% and glycerine 5%). The cleaning step (tools, preparation table and floor) involves the use of a bactericidal solution.
235
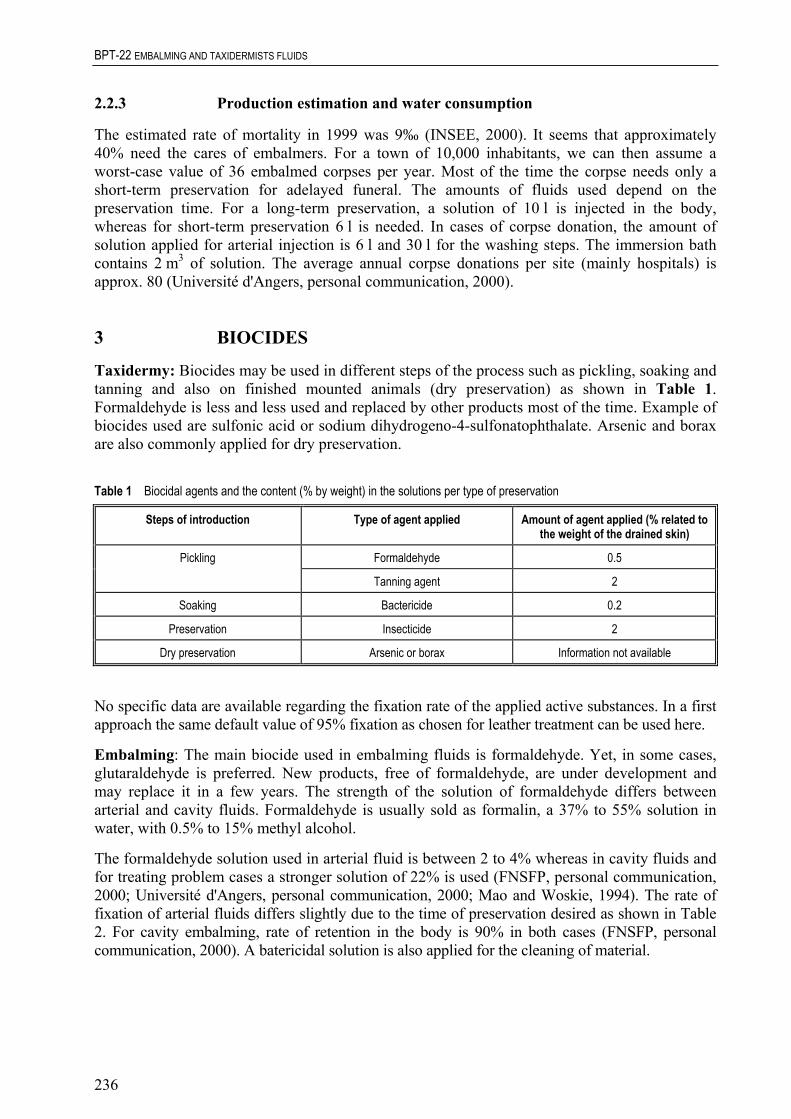
BPT-22 EMBALMING AND TAXIDERMISTS FLUIDS
2.2.3 Production estimation and water consumption
The estimated rate of mortality in 1999 was 9‰ (INSEE, 2000). It seems that approximately 40% need the cares of embalmers. For a town of 10,000 inhabitants, we can then assume a worst-case value of 36 embalmed corpses per year. Most of the time the corpse needs only a short-term preservation for adelayed funeral. The amounts of fluids used depend on the preservation time. For a long-term preservation, a solution of 10 l is injected in the body, whereas for short-term preservation 6 l is needed. In cases of corpse donation, the amount of solution applied for arterial injection is 6 l and 30 l for the washing steps. The immersion bath contains 2 m3 of solution. The average annual corpse donations per site (mainly hospitals) is approx. 80 (Université d'Angers, personal communication, 2000).
3 BIOCIDES
Taxidermy: Biocides may be used in different steps of the process such as pickling, soaking and tanning and also on finished mounted animals (dry preservation) as shown in Table 1. Formaldehyde is less and less used and replaced by other products most of the time. Example of biocides used are sulfonic acid or sodium dihydrogeno-4-sulfonatophthalate. Arsenic and borax are also commonly applied for dry preservation.
Table 1 Biocidal agents and the content (% by weight) in the solutions per type of preservation
Steps of introduction Type of agent applied Amount of agent applied (% related to the weight of the drained skin)
Formaldehyde 0.5 Pickling
Tanning agent 2
Soaking Bactericide 0.2
Preservation Insecticide 2
Dry preservation Arsenic or borax Information not available
No specific data are available regarding the fixation rate of the applied active substances. In a first approach the same default value of 95% fixation as chosen for leather treatment can be used here.
Embalming: The main biocide used in embalming fluids is formaldehyde. Yet, in some cases, glutaraldehyde is preferred. New products, free of formaldehyde, are under development and may replace it in a few years. The strength of the solution of formaldehyde differs between arterial and cavity fluids. Formaldehyde is usually sold as formalin, a 37% to 55% solution in water, with 0.5% to 15% methyl alcohol.
The formaldehyde solution used in arterial fluid is between 2 to 4% whereas in cavity fluids and for treating problem cases a stronger solution of 22% is used (FNSFP, personal communication, 2000; Université d'Angers, personal communication, 2000; Mao and Woskie, 1994). The rate of fixation of arterial fluids differs slightly due to the time of preservation desired as shown in Table 2. For cavity embalming, rate of retention in the body is 90% in both cases (FNSFP, personal communication, 2000). A batericidal solution is also applied for the cleaning of material.
236
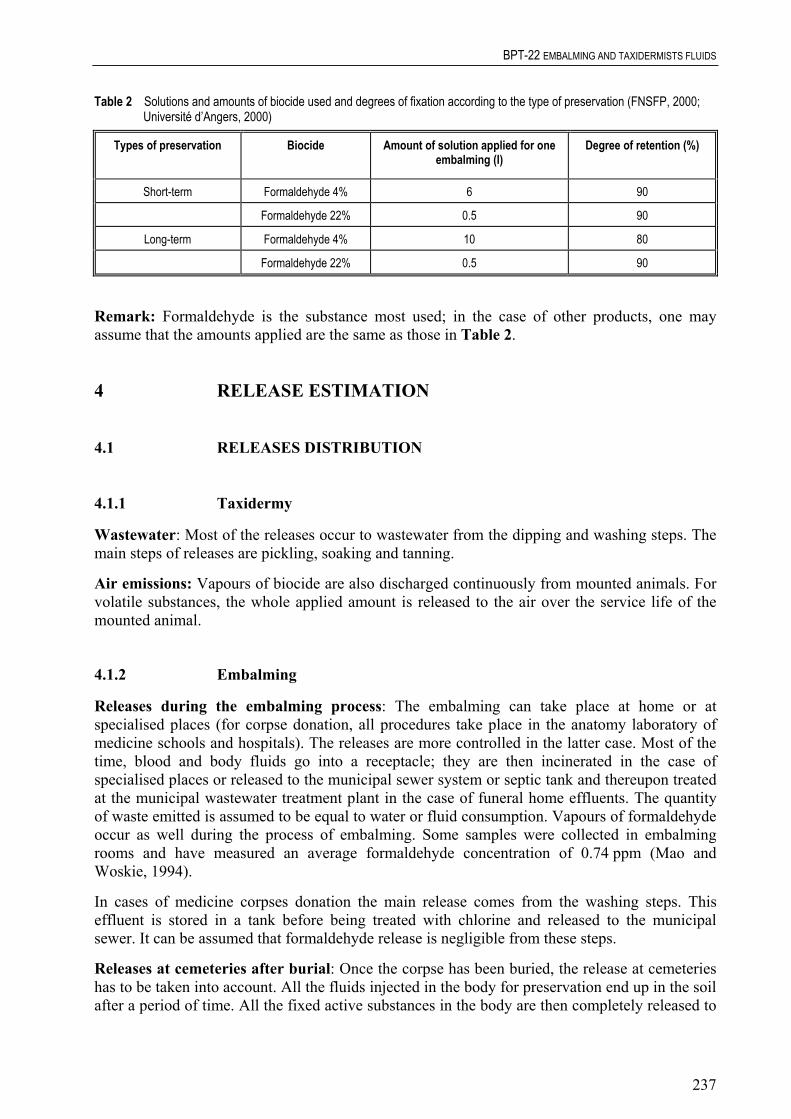
BPT-22 EMBALMING AND TAXIDERMISTS FLUIDS
Table 2 Solutions and amounts of biocide used and degrees of fixation according to the type of preservation (FNSFP, 2000; Université d’Angers, 2000)
Types of preservation
Biocide Amount of solution applied for one embalming (l)
Degree of retention (%)
Short-term Formaldehyde 4% 6 90
Formaldehyde 22% 0.5 90
Long-term Formaldehyde 4% 10 80
90 Formaldehyde 22% 0.5
Remark: Formaldehyde is the substance most used; in the case of other products, one may assume that the amounts applied are the same as those in Table 2.
4.1 RELEASES DISTRIBUTION
4.1.1 Taxidermy
Wastewater: Most of the releases occur to wastewater from the dipping and washing steps. The main steps of releases are pickling, soaking and tanning.
4.1.2 Embalming
Releases during the embalming process: The embalming can take place at home or at specialised places (for corpse donation, all procedures take place in the anatomy laboratory of medicine schools and hospitals). The releases are more controlled in the latter case. Most of the time, blood and body fluids go into a receptacle; they are then incinerated in the case of specialised places or released to the municipal sewer system or septic tank and thereupon treated at the municipal wastewater treatment plant in the case of funeral home effluents. The quantity of waste emitted is assumed to be equal to water or fluid consumption. Vapours of formaldehyde occur as well during the process of embalming. Some samples were collected in embalming rooms and have measured an average formaldehyde concentration of 0.74 ppm (Mao and Woskie, 1994).
In cases of medicine corpses donation the main release comes from the washing steps. This effluent is stored in a tank before being treated with chlorine and released to the municipal sewer. It can be assumed that formaldehyde release is negligible from these steps.
4 RELEASE ESTIMATION
Air emissions: Vapours of biocide are also discharged continuously from mounted animals. For volatile substances, the whole applied amount is released to the air over the service life of the mounted animal.
Releases at cemeteries after burial: Once the corpse has been buried, the release at cemeteries has to be taken into account. All the fluids injected in the body for preservation end up in the soil after a period of time. All the fixed active substances in the body are then completely released to
237

BPT-22 EMBALMING AND TAXIDERMISTS FLUIDS
the soil. The corpses from medicine donation are incinerated and have not been taken into account here.
4.2 WASTEWATER TREATMENT
Note: Partial degradation of an active substance can occur within the process. This is not considered in this document. If data on degradation within the process are available, they can be taken into account in the release estimation.
4.3.1 Taxidermy
Variable/parameter (unit) Symbol Default S/D/O/P
Input
Qskin kg.d-1 4 D
In both taxidermy and embalming processes, the wastewater is released to the sewer system and treated at the municipal wastewater treatment plant. As said before a pre-treatment with a disinfectant can be required in the embalming process in the case of contagious disease.
4.3 RELEASE ESTIMATION
A release estimation model is presented below.
No data is available regarding the releases from dry treatment. A release estimation technique can therefore be proposed only for tanning processes. Each step of application of a biocide involves a release into wastewater. The main steps are soaking, pickling and tanning. The release may then be calculated for each step. The model calculation is presented in following Table 3:
Table 3 Emission scenario for calculating the releases of biocides used in taxidermy
Unit
Quantity of treated drained skin per day (cf. Section 2.1.2.) Quantity of active substance applied per kg of drained skin (cf. Table 1)
Qactive kg.kg-1 0.02 S/D
Fixation rate Ffix - 0.95 S/D Output
Local emission of active substance to wastewater for one treatment step
Elocal * kg.d-1 O
Total local emission of active substance Elocaltot,water kg.d-1 0
x,water
* represents a treatment step (soaking, pickling, tanning)
Model calculation
Elocalx,water = Qskin.Qactive.(1 − Ffix) Elocaltot,water = Σ Elocalx,water
238

BPT-22 EMBALMING AND TAXIDERMISTS FLUIDS
Air emissions can occur from mounted animals, which could release all the biocide applied over the service life of the mounted animals. At this moment no values are available to estimate the release.
4.3.2 Embalming
Releases during the embalming process: The release into wastewater for a town of 10,000 inhabitants may be calculated as presented below. As statistically there will be 36 embalmed corpses per year, the releases will be estimated for a treatment rate of one corpse per day, noting that thereby treatment takes place only 36 days per year.
Table 4 Emission scenario for calculating the releases of biocides used in the embalming process
Variable/parameter (unit) Symbol Unit Default S/D/O/P Input
Volume of solution applied per embalmed corpse for arterial injection
Qarterial l P (Table 2)
Volume of solution applied per embalmed corpse for cavity treatment
Qcavity l P (Table 2)
Specific mass of solution (density) RHOsolution kg.m-3 1,000 D Content of active substance in solution for arterial injection Carterial kg.kg-1 S Content of active substance in solution for cavity treatment Ccavity kg.kg-1 S Retention rate of arterial fluid Fret,arterial - S/P (Table 2) Retention rate of cavity fluid Fret,cavity - S/P (Table 2) Output
Local emission of active substance to wastewater Elocalwater kg.d-1 O
Model calculation
Elocalwater = Qarterial.RHOsolution.Carterial.(1 − Fret,arterial).10-3 + Qcavity .RHOsolution.Ccavity.(1 − Fret,cavity).10-3
Releases in cemeteries: It is proposed to estimate only the concentration of active substances in groundwater. A simplistic model can be proposed on a preliminary basis. It is assumed that for a town of 10,000 inhabitants, the dimensions of the cemetery is 100.100 m. The rate of embalmed corpses is 36 per year (Section 2.2.3).
However, cremation is more and more used in Europe. In fact, it seems that the average rate of cremation is 33% in Europe (2000). So, the burial rate of embalmed corpses is 24 per year (AFIF, 2001). This is realistic for small towns. In large cities, mainly in southern Europe, corpses may be buried in niches, and no releases to groundwater will occur. The model presented below therefore can be considered as a realistic worst case.
Assuming an average soil concentration over a depth of 0.5 m (based on casket height and allowing for differences in burial depth), an average annual soil porewater concentration can be estimated with the following model.
239

BPT-22 EMBALMING AND TAXIDERMISTS FLUIDS
Table 5 Emission scenario for calculating the releases in cemeteries
Variable/parameter (unit) Symbol Unit Default S/D/O/P Input
Volume of solution applied per embalmed corpse for arterial injection
Qarterial l P (Table 2)
Volume of solution applied per embalmed corpse for cavity treatment
Qcavity l
F
Factor for reaction with body
Bulk density of soil Soil-water partitioning coefficient
P (Table 2)
Specific mass of solution (density) RHOsolution kg.m-3 1,000 D Content of active substance in solution for arterial injection Carterial kg.kg-1 S Content of active substance in solution for cavity treatment Ccavity kg.kg-1 S Retention rate of arterial fluid ret,arterial - S/P (Table 2) Retention rate of cavity fluid Fret,cavity - S/P (Table 2)
Fbody - 0 S Number of embalmed corpses buried per year Ncorpse y-1 24 D Length of the cemetery LENGTHcem m 100 D Width of the cemetery WIDTHcem m 100 D Mixing depth of soil DEPTHsoil m 0.5 D
RHOsoil kg.m-3 1,700 D Ksoil-water m3.m-3 O (TGD, Sec
2.3.5, eq. 10) First order rate constant for removal from soil k d-1 O (TGD, Sec
2.3.8.5, eq. 41) Output
Yearly average input of active substance to the cemetery Ecemeterysoil kg.y-1 O Average concentration in soil Ccemeterysoil mg.kgww-1 O Average concentration in soil porewater Ccemeteryporew mg.l-1 O
Model calculation:
Ecemeterysoil = [Qarterial.RHOsolution.Carterial.(Fret,arterial).10-3 + Qcavity.RHOsolution.Ccavity.(Fret,cavity).10-3].(1 − Fbody).Ncorpse
Ccemeterysoil = Ecemeterysoil.106 / (LENGTHcem.WIDTHcem.DEPTHsoil.RHOsoil.k.365)
Ccemeteryporew = (Ccemeterysoil.RHOsoil) / (Ksoil-water.1,000)
In a first approach, the concentration in porewater can be used as the concentration in groundwater.
240

BPT-22 EMBALMING AND TAXIDERMISTS FLUIDS
4.4 EXAMPLE CALCULATION
4.4.1 Taxidermy
The estimated release for the step of soaking is:
Qskin = 10 kg.d-1 Qactive = 0.02 kg.kg-1 Ffix = 0.95
The release is:
Elocalsoaking,water = 10.0.02.(1 − 0.95) Elocalsoaking,water = 0.01 kg.d-1
4.4.2 Embalming
The estimated release for a town of 10,000 inhabitants is:
In case of short-term preservation only
Qarterial = 6 l Qcavity = 0.5 l RHOsolution = 1,000 kg.m-3 Carterial = 0.04 kg.kg-1 Ccavity = 0.22 kg.kg-1 Fret,arterial = Fret,cavity = 0.9
The release is:
Ewastewater = 6.1 000.0.04.(1 − 0.9).10-3 + 0.5.1,000.0.22. (1 − 0.9) .10-3 Ewastewater = 0.035 kg.d-1
In case of long-term preservation only
Qarterial = 10 l Qcavity = 0.5 l RHOsolution = 1,000 kg.m-3 Carterial = 0.04 kg.kg-1 Ccavity = 0.22 kg.kg-1 Fret,arterial = 0.8 Fret,cavity = 0.9
The release is:
Ewastewater = 10.1,000.0.04.(1 − 0.8).10-3 + 0.5.1,000.0.22.(1 − 0.9).10-3 Ewastewater = 0.091 kg.d-1
241

BPT-22 EMBALMING AND TAXIDERMISTS FLUIDS
5 REFERENCES AFIF (2001). La crémation. Association Française de l’Information Funéraire (AFIF), (http://afif.asso.fr).
Brigot MF (1991). Technology Notes in Taxidermy : Birds and Mammals, Tanning of Small and Big Mammals. Museum d’Histoire Naturelle, Orléans, France.
INSEE (2000). (http://www.insee.fr).
Mao C and Woskie S (1994). Formaldehyde Use Reduction in Mortuaries. University of Massachussets Lowell, The 1993-1994 Toxics Use Reduction Research fellows Program, Toxics Use Reduction Institute, 25 pp.
Schuette-Voss M (1997). Funeral director job not for everyone. Journal & Herald, July 21.
242

BPT 2 PRIVATE AND PUBLIC HEALTH AREA DISINFECTANTS AND OTHER BIOCIDAL PRODUCTS
ASSESSMENT OF ENVIRONMENTAL RELEASE OF PRIVATE AND PUBLIC HEALTH AREA DISINFECTANTS USED FOR SANITARY
PURPOSES AND DISINFECTANTS FOR USE IN THE MEDICAL SECTOR
243


BPT 2 PRIVATE AND PUBLIC HEALTH AREA DISINFECTANTS AND OTHER BIOCIDAL PRODUCTS
CONTENTS
1 INTRODUCTION ........................................................................................................................................... 247
248
248
249
251
251
255
256 256 257
259 259 263
264
266
267
267
271 273
2 DISINFECTANTS USED IN THE SANITARY SECTOR .........................................................................
2.1 SCENARIO DESCRIPTION.................................................................................................................
2.2 EMISSION SCENARIO.........................................................................................................................
3 MEDICAL SECTOR ......................................................................................................................................
3.1 STERILISATION, DISINFECTION AND CLEANING ....................................................................
3.2 GENERAL ASSUMPTIONS .................................................................................................................
3.3 DISINFECTION OF ROOMS, FURNITURE AND OBJECTS ........................................................ 3.3.1 Scenario description....................................................................................................................... 3.3.2 Emission scenarios.........................................................................................................................
3.4 DISINFECTION OF INSTRUMENTS................................................................................................. 3.4.1 Scenario description endoscopes ................................................................................................... 3.4.2 Scenario description other instruments..........................................................................................
3.5 LAUNDRY DISINFECTANTS .............................................................................................................
3.6 HOSPITAL WASTE DISINFECTANTS .............................................................................................
3.7 DISINFECTANTS WITH MORE THAN ONE APPLICATION......................................................
4 REFERENCES ................................................................................................................................................
Appendix 1 Underlying data used ....................................................................................................................... Appendix 2 Differences between emission scenarios .........................................................................................
245


BPT 2 PRIVATE AND PUBLIC HEALTH AREA DISINFECTANTS AND OTHER BIOCIDAL PRODUCTS
1 INTRODUCTION
The government of The Netherlands developed the first version of the Uniform System for the Evaluation of Substances (USES 1.0) in the framework of their first National Environmental Policy Plan. USES 1.0, available since 1994, harmonised the risk assessment of new and existing substances, biocides and plant protection products. USES 1.0 was tailored to the corresponding EC and national legislation. USES 1.0 was subsequently used as one of the basic documents for the development of the EU Technical Guidance Document to assess risks of new and existing substances in support of the corresponding EC legislation and its computer implementation, the European Union System for Evaluation of Substances (EUSES 1.00).
Simultaneous with the development of EUSES 1.0 next versions of USES were developed by VROM (Ministry of Housing, Spatial Planning and the Environmentr), mainly for use in the Netherlands. USES 2.0 and 3.0 comprise risk assessment methods for biocides and plant protection products, in addition to methods for new and existing substances. The risk assessment methods for biocides and plant protection products are in accordance with the corresponding national legislation and as much as possible with the corresponding EC legislation. In USES 2.0 and 3.0, the risk assessment methods for new and existing substances are fully equivalent to EUSES 1.00.
As part of USES 1.0 and USES 2.0 several emission scenarios for biocides (non-agricultural pesticides) have been developed at the RIVM within a period of approximately 10 years (Luttik et al., 1993 and 1995; Montfoort et al., 1996).
Product Type 2 “Private and public health area disinfectants and other biocidal products” concerns a heterogeneous group of products used for disinfection, for example bathrooms, toilets, chemical closets, walls and floors in private homes and institutions such as offices, workshops, schools, hospitals and sport facilities (Van Dokkum et al., 1998). All disinfectants not included in one of the other product types belong here. The CTB (National Board of the Authorisation of Pesticides) in The Netherlands applies the following division for the fields of application:
• swimming pools, • sanitary sector, • horticulture, • tiles and surfaces, • medical sector.
The application in the fields sanitary sector and medical sector belong to some of the most urgently needed items for which emission scenario documents are required. Therefore the original report, which was the basis for this report, was produced for the Dutch situation (Van der Poel, 1999a). Discussions in the working group for the EU project “Gathering, review and development of environmental emission scenarios for biocides” and data supplied by some member states enabled the update presented in this report. The emission scenarios are applicable in all European Union Member States.
247

BPT 2 PRIVATE AND PUBLIC HEALTH AREA DISINFECTANT AND OTHER BIOCIDAL PRODUCTS
The scenarios in this report are presented in the following way:
Input
[Variable/parameter (unit)] [Symbol] [Unit] S/D/O/P These parameters are the input to the scenario. The S, D, O or P classification of a parameter indicates the status: S Parameter must be present in the input data set for the calculation to be executed (there has been no method
implemented in the system to estimate this parameter; no default value is set). D Parameter has a standard value (most defaults can be changed by the user) O Parameter is the output from another calculation (most output parameters can be overwritten by the user with
alternative data). P Parameter value can be chosen from a “pick-list” of values. c Default or output parameter is closed and cannot be changed by the user. Output
[Symbol] [Description] Intermediate calculations
Parameter description (Unit)
2.1
[Parameter = equation] (Equation no.)
End calculations [Parameter = equation] (Equation no.)
In this report two main types of scenarios are presented, one based on the tonnage applied for a specific application and one based on the consumption (average consumption per capita or the consumption of a model source). Though it is desirable to have only one scenario, there may be circumstances for which two may be necessary or advisable. Appendix 2 gives a general explanation on the differences between the two types of emission scenarios and the advantages/disadvantages.
2 DISINFECTANTS USED IN THE SANITARY SECTOR
SCENARIO DESCRIPTION
The application of disinfectants for sanitary purposes refers to nearly the same areas as the scenario “Disinfection in accommodations”, described in Luttik et al. (1993) and incorporated in USES 2.0 (RIVM, VROM, VWS, 1998). The emission scenario for accommodations was designed for disinfectants used in accommodations for humans and for preparing food and drinks. It is based on the Dutch situation and uses the tonnage of the active substance applied per year in the region considered. The first sceanrio presented here uses also the regional tonnage and follows the sceanrio approach as in EUSES for cleaning products in industrial category 5 (Personal/domestic) at the stage of private use. This means that the standard STP (sewage treatment plant) of EUSES is considered as a point source where a fraction of 0.002 (Fmainsource2) of the disinfectant ends up. The release to wastewater is 100% by default.
As the tonnage of biocides has not to be supplied by the notifier at present a second scenario is presented here. This scenario uses the post-consumer release prediction and consumption data of
248

BPT 2 PRIVATE AND PUBLIC HEALTH AREA DISINFECTANTS AND OTHER BIOCIDAL PRODUCTS
the emission scenario document for soaps and detergents used in industrial categories 5 (Personal/domestic) and 6 (Public domain) (EC, 1996). That emission scenario document gives an estimate of a 100% release to wastewater, and applies a consumption of detergents for surface cleaning at the level of 5 and 2 grams per capita per day for general purpose and lavatory cleaners respectively. The density of the detergents is assumed to be 1,000 kg.m-3. The scenario has been adapted in such a way that the market share is taken into account; this means the fraction of the cleaning product containing the same disinfectant. The market share is called penetration factor in the scenario. As no market shares for disinfectants applied for this purpose are known, a “best guess” of 0.5 is used.
2.2 EMISSION
SCENARIO
Table 1 presents the emission scenario applying the tonnage of the disinfectant and Table 2 the scenario for the average consumption. It should be noted that the standard STP of EUSES and USES is used, with 10,000 inhabitants feeding the system and an amount of 0.2 m3 wastewater per inhabitant per day.
In the case of diffuse releases to wastewater, for example emissions from households, the emissions from these small sources are collected at the STP. The receiving STP may be considered as a point source then. If the use of a substance would be evenly distributed over the population (consumers) and STPs in a region and over the week, the fraction of this substance reaching the standard STP of EUSES would be number of inhabitants connected to the STP (Nlocal) / number of inhabitants in the region (N). This means a fraction of 10,000 / 20.106 = 0.0005 with the defaults of EUSES. As the use of (formualtion containing) substances never will be distrubuted evenly over the population and the week, a safety factor of four was assumed at the time. This means that the fraction of the main source Fmainsource2 = 0.002.
Table 1 Emission scenario for calculating the releases of disinfectants used for sanitary purposes based on the annual
tonnage applied
Variable/parameter (unit) Symbol Unit Default S/D/O/P Input
A) Relevant tonnage in the region for this application TONNAGEREG 1) (tonnes.yr-1) O B) Relevant tonnage in the EU for this application TONNAGE 1) (tonnes.yr-1) Fraction for the region Freg 0.1 D A + B) Fraction of the main source (STP) Fmainsourcewater - 0.002 D Fraction released to wastewater F4, water - 1) 1 D Number of emission days for life cycle stage 4 (private use) Temission4 d 365 D
Output
Emission rate to wastewater Elocal4,water (kg.d-1) 2)
1) In principle this should be TONNAGEk to identify usage in product k but this is not shown just as in the EUSES documentation 2) The subscript “4” refers to the stage of private use in conformity with EUSES 1.0 and USES 2.0
249

BPT 2 PRIVATE AND PUBLIC HEALTH AREA DISINFECTANT AND OTHER BIOCIDAL PRODUCTS
Intermediate calculations
B): Relevant tonnage in the region for this application (tonnes.yr-1) TONNAGEREG = Freg.TONNAGE
End calculations
A + B): 4water,4water3
water,4 Temission/FeFmainsourc10TONNAGEregElocal ⋅⋅⋅=
Table 2 Emission scenario for calculating the releases of disinfectants used for sanitary purposes based on an average
consumption
Variable/parameter (unit) Symbol Unit Default S/D/O/P Input
Nlocal
Number of inhabitants feeding one STP - 10,000 D 1) Fraction released to wastewater (-) 2) F4, water - 1
D
Active substance in product (kg.l-1) Cproduct (kg.l-1) S Consumption per capita Qproduct (l.cap-1.d-1)
General purpose (tiles, floors, sinks) 0.005 D Lavatory 0.002
Penetration factor of disinfectant Fpenetr 0.5 D Output
Emission rate to wastewater Elocal4,water (kg.d-1) 1)
1) Default number as used in EUSES for the standard STP 2) The subscript “4” refers to the stage of private use in conformity with EUSES 1.0 and USES 2.0
Model calculations
Elocal4,water =Nlocal.Qproduct.Cproduct.Fpenetr.F4, water
Above a certain tonnage (at the breakeven point), as explained in Appendix 2, the scenario based on the tonnage should be applied preferably. For the number of emission days Temission4, = 365 and the fraction for the model STP of 0.002 the breakeven point can be written in the form:
TONNAGEREG = 1.825.106.Qproduct.Cproduct.Fpenetr
With the default values for the consumption per capita and the penetration factor this becomes:
TONNAGEREG = 4.56.103.Cproduct (sanitary purposes)
TONNAGEREG = 1.83.103.Cproduct (lavatory)
If, for example, the concentration of the disinfectant Cproduct = 10 g.l-1 (0.01 kg.l-1) the breakeven point will be reached at a regional tonnage of 45.6 t.y-1 for saniatry purposes and 18.3 t.y-1 for lavatory purposes. As Cproduct has to be supplied by the notifier the tonnage at the breakeven point can be estimated.
250
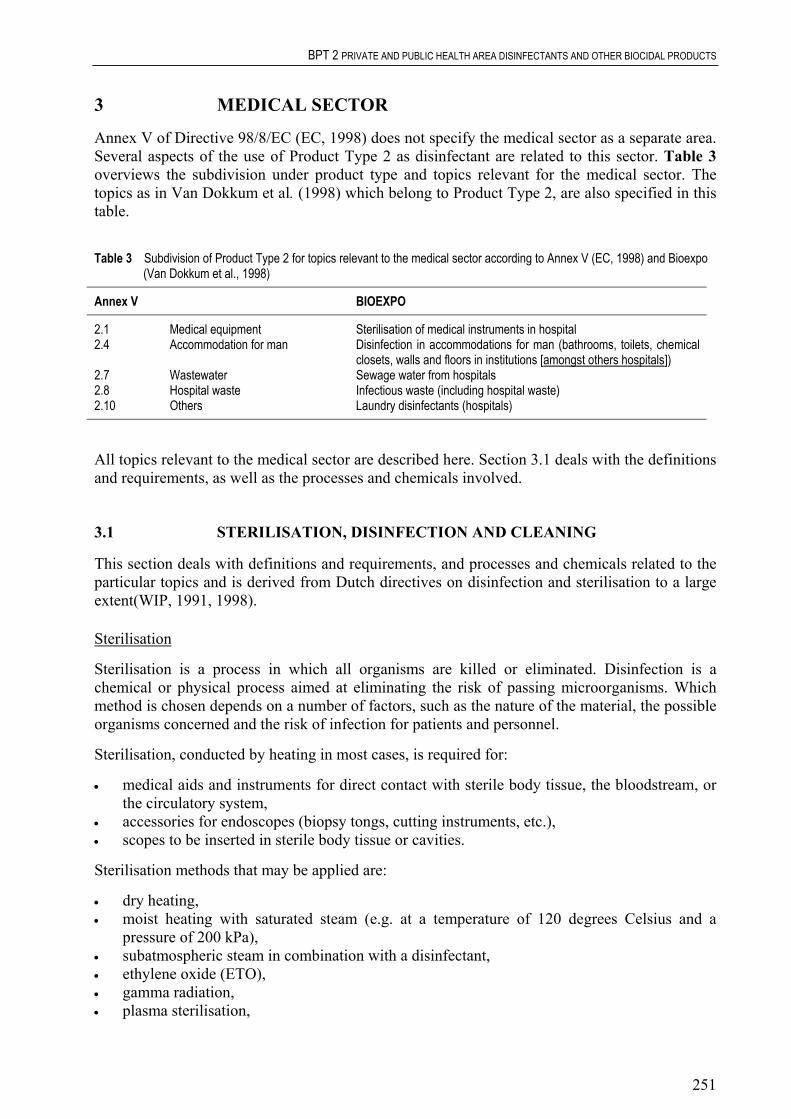
BPT 2 PRIVATE AND PUBLIC HEALTH AREA DISINFECTANTS AND OTHER BIOCIDAL PRODUCTS
3 MEDICAL SECTOR
Annex V of Directive 98/8/EC (EC, 1998) does not specify the medical sector as a separate area. Several aspects of the use of Product Type 2 as disinfectant are related to this sector. Table 3 overviews the subdivision under product type and topics relevant for the medical sector. The topics as in Van Dokkum et al. (1998) which belong to Product Type 2, are also specified in this table.
Table 3 Subdivision of Product Type 2 for topics relevant to the medical sector according to Annex V (EC, 1998) and Bioexpo
(Van Dokkum et al., 1998)
Annex V BIOEXPO
2.1 Medical equipment Sterilisation of medical instruments in hospital 2.4 Accommodation for man Disinfection in accommodations for man (bathrooms, toilets, chemical
closets, walls and floors in institutions [amongst others hospitals]) 2.7 Wastewater Sewage water from hospitals 2.8 Hospital waste Infectious waste (including hospital waste) 2.10 Others Laundry disinfectants (hospitals)
All topics relevant to the medical sector are described here. Section 3.1 deals with the definitions and requirements, as well as the processes and chemicals involved.
3.1 STERILISATION, DISINFECTION AND CLEANING
This section deals with definitions and requirements, and processes and chemicals related to the particular topics and is derived from Dutch directives on disinfection and sterilisation to a large extent(WIP, 1991, 1998).
Sterilisation
Sterilisation is a process in which all organisms are killed or eliminated. Disinfection is a chemical or physical process aimed at eliminating the risk of passing microorganisms. Which method is chosen depends on a number of factors, such as the nature of the material, the possible organisms concerned and the risk of infection for patients and personnel.
Sterilisation, conducted by heating in most cases, is required for:
• medical aids and instruments for direct contact with sterile body tissue, the bloodstream, or the circulatory system,
• accessories for endoscopes (biopsy tongs, cutting instruments, etc.), • scopes to be inserted in sterile body tissue or cavities.
Sterilisation methods that may be applied are:
• dry heating, • moist heating with saturated steam (e.g. at a temperature of 120 degrees Celsius and a
pressure of 200 kPa), • subatmospheric steam in combination with a disinfectant, • ethylene oxide (ETO), • gamma radiation, • plasma sterilisation,
251

BPT 2 PRIVATE AND PUBLIC HEALTH AREA DISINFECTANT AND OTHER BIOCIDAL PRODUCTS
• sterilisation with fluids, • ultraviolet (UV) radiation.
With reference to the sterilisation methods above, for methods 1, 2, 5, and 8 emission scenarios for none of these sterilisation methods have been developed, since no biocides are involved. The third method (3) is no longer applied in the Netherlands since the use of the disinfectant, formaldehyde, is prohibited for medical purposes in conformance with the Netherlands Pesticide Act. Since the General Administrative Order on Medical Aids took effect (Stb., 1995) formaldehyde sterilisers may be marketed in The Netherlands. A European standard is being drawn up at the moment. As only one specific substance, in this case formaldehyde, is involved and European standards are applicable, no emission scenario has been developed. The fourth method (4), sterilisation with ETO, is only applied to a limited number of objects, such as electronics and instruments containing thermolabile plastics (providing they are not sensitive to ETO). Sterilisation with ETO is only applied with extreme care and is bound to strict statutory regulations. Therefore this process is not covered by an emission scenario in this report. Plasma sterilisation (6) is a fairly new method. A plasma is a gas in which so much energy is introduced by means of radiation of a radio frequency that molecules are split into atoms and electrons are released from the atoms. Therefore a plasma is very reactive, reacting within a short time with essential substances in the cells of microorganisms. An advantage is that no hazardous residues will be formed. So far, most of the experience has been acquired using a hydrogen peroxide gas plasma; this method is not allowed on the Dutch market and no emission scenario document has been developed (the substance used is unlikely to be released as it decomposes completely). Besides plasma sterilisation, small-scale experiments are carried out at using sterilisation with fluids (7): peracetic acid with or without hydrogen peroxide. Since the status of the method is unclear, no emission scenario is presented. Furthermore, the substances involved are used as disinfectants and will be covered as such in this report. It should be noted that such equipment is designed specifically for the use of a certain chemical with unique containers and other provisions. The equipment put on the market meets the requirements of the European Union Medical Device Directive (MDD) (EEC, 1993). This means that the equipment can be placed anywhere within the EU market. It is not necessary, to ask for admission of disinfectants used in the equipment. The practical applications of UV radiation depend on the killing action of the radiation on agents such as for example yeast, bacteria and viruses (Shechmeister, 1991). UV radiation may be considered as a surface steriliser only (Russell, 1991).
Disinfection
Disinfection has been replaced by cleaning in many cases nowadays, as disinfection is not always considered necessary. Thermal disinfection is, if possible, always and in all places preferred. Disinfection is required for:
• medical aids coming into contact with mucous membranes (e.g. “scopes”, respirators, hose systems for anaesthesia),
• medical aids usually cleaned after use but which have been used incidentally on an infected patient,
• medical aids used for large amounts of excretionary products (bedpans, urinals, sputum basins); cleaning and thermal disinfection are often carried out in one operation,
• surfaces with blood or blood-containing material, pus or infected secretions.
The way disinfectants affect microorganisms can vary. Table 4 presents an overview of the action mechanisms, representative groups of chemicals and their antimicrobial activity. On the list of disinfectants of the German Society for Hygiene and Microbology (DGHM, 2001) are 78 active substances according to Gartiser und Stiene (1999). Amongst these active substances were
252
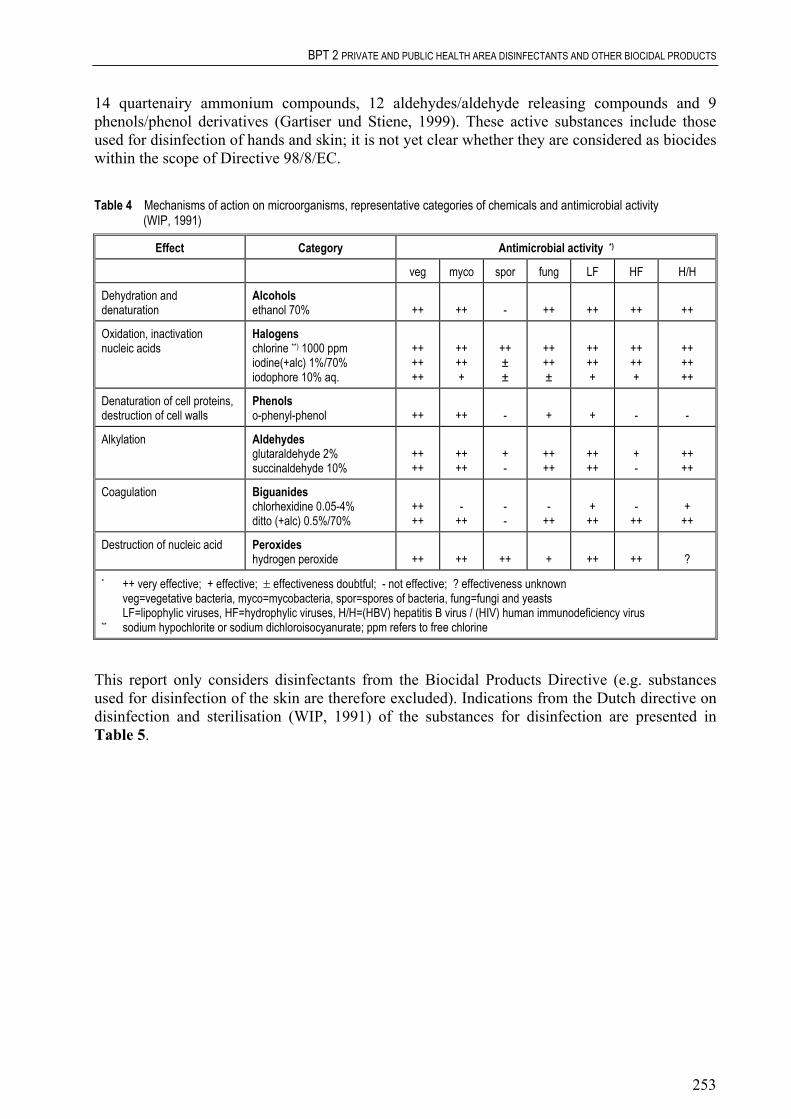
BPT 2 PRIVATE AND PUBLIC HEALTH AREA DISINFECTANTS AND OTHER BIOCIDAL PRODUCTS
14 quartenairy ammonium compounds, 12 aldehydes/aldehyde releasing compounds and 9 phenols/phenol derivatives (Gartiser und Stiene, 1999). These active substances include those used for disinfection of hands and skin; it is not yet clear whether they are considered as biocides within the scope of Directive 98/8/EC.
Table 4 Mechanisms of action on microorganisms, representative categories of chemicals and antimicrobial activity
(WIP, 1991)
Effect Category Antimicrobial activity *)
veg myco spor fung LF HF H/H
Dehydration and denaturation
Alcohols ethanol 70%
++
++
-
++
++
++
++
Oxidation, inactivation nucleic acids
Halogens chlorine **) 1000 ppm iodine(+alc) 1%/70% iodophore 10% aq.
++ ++ ++
++ ++ +
++ ± ±
++ ++ ±
++ ++ +
++ ++ +
++ ++ ++
Denaturation of cell proteins, destruction of cell walls
Phenols o-phenyl-phenol
++
++
-
+
+
-
-
Alkylation Aldehydes glutaraldehyde 2% succinaldehyde 10%
++ ++
++ ++
+ -
++ ++
++ ++
+ -
++ ++
Coagulation Biguanides chlorhexidine 0.05-4% ditto (+alc) 0.5%/70%
++ ++
-
++
- -
-
++
+
++
-
++
+
++
Destruction of nucleic acid Peroxides hydrogen peroxide
++
++
++
+
++
++
?
* ++ very effective; + effective; ± effectiveness doubtful; - not effective; ? effectiveness unknown veg=vegetative bacteria, myco =mycobacteria, spor=spores of bacteria, fung=fungi and yeasts LF=lipophylic viruses, HF=hydrophylic viruses, H/H =(HBV) hepatitis B virus / (HIV) human immunodeficiency virus ** sodium hypochlorite or sodium dichloroisocyanurate; ppm refers to free chlorine
This report only considers disinfectants from the Biocidal Products Directive (e.g. substances used for disinfection of the skin are therefore excluded). Indications from the Dutch directive on disinfection and sterilisation (WIP, 1991) of the substances for disinfection are presented in Table 5.
253

BPT 2 PRIVATE AND PUBLIC HEALTH AREA DISINFECTANT AND OTHER BIOCIDAL PRODUCTS
Table 5 Indications of substances for disinfection (WIP, 1991)
Category Example Choice Objects resistant to chemicals objects where risk for transfer after contamination
with pathogenic microorganisms is considerable: - not containing blood - possibly containing blood
o-phenyl-phenol 2% chlorine 250 ppm chlorine 1000 ppm alcohol 70%
operation room floor (as far as visibly contaminated) nursing patients in isolation quarters kitchens (surfaces and equipment coming in contact with food)
chlorine 1000 ppm chlorine 1000 ppm o-phenyl-phenol 2% chlorine 250 ppm thermal by preference
Objects and surfaces coming in direct contact with patient
thermometers, parts of anaesthesia equipment, transducers, etc.
alcohol 70% iodine 1% in alcohol 70%
Water-resistant instruments after use and before sterilisation sodium perborate 2%
Vulnerable temperature-sensitive, water-resistant instruments
endoscopes glutaraldehyde 2%
Vulnerable temperature-sensitive, not water-resistant instruments
(purpose: sterilisation) ethylene oxide
Surfaces resistant to chemicals
Furthermore, disinfectants are used as preservatives in the medical sector for media where development of microorganisms may lead to infection of patients and personnel. Usually these are fluids which are not replaced frequently enough. Often disinfectants are used, however, at a low concentration. Table 6 - derived from the Dutch directive on disinfection and sterilisation (WIP, 1991) - gives some indications for the use of disinfectants as preservatives.
Table 6 Indications of the use of disinfectants as preservatives (WIP, 1991)
Type of fluid Substance
Bath water for physiotherapy tosylchloramide 20 mg.m-3
Water mattresses aldehydes *
Water in flower vases sodium dichloroisocyanurate 10 ppm free chlorine
chlorhexidine 1:2000 in water Humidifier fluid for incubators
Water seal suction equipment chlorhexidine 1:2000 in water
* troublesome in practice, alternatives being investigated
Cleaning
Cleaning is the process of removing visible dirt and invisible organic material to prevent microorganisms maintaining themselves, multiplying and spreading (WIP, 1993). The aim is to use cleaning as much as possible instead of disinfection. Hospitals use disinfectant-free normal household detergents and cleaning agents for cleaning.
254

BPT 2 PRIVATE AND PUBLIC HEALTH AREA DISINFECTANTS AND OTHER BIOCIDAL PRODUCTS
3.2 GENERAL ASSUMPTIONS
Hospitals may be considered as rather small emission sources where emissions are diffuse as they may occur at various places in the buildings. Releases with wastewater are directed to the STP of the municipalities where they reside. So, again the STP is to be considered as a point source for the local situation. In order to develop an emission scenario for hospitals it was investigated which size of hospital could be expected to discharge its wastewater to the standard STP of EUSES. Therefore, data from Germany (Gartiser and Stiene, 1999) and the Netherlands (CBS, 1997; CUWVO, 1986; RIVM, 1996) were used. Appendix 1 presents some of the data used and calculations made. There are many differences between the two countries, for example:
Germany
• non-random sample of 8 hospitals including 4 (large) university hospitals, • correction for use during weekends, • calculation for beds regardless of the occupancy rate, • data on classes of chemicals, • distinction between application areas “surfaces” and “instruments”,
water consumption including - for example – kitchens. •
The Netherlands
• random sample for use of active ingredients (RIVM, 1996), • no correction for use during weekends, • calculation for beds regarding the occupancy rate (CBS, 1997),
• Sterilisation of medical instruments (Product Subtype 2.1)
• data for several individual chemicals, • specific application known for the individual chemicals (RIVM, 1996), • water consumption strictly per person for 6 hospitals (CUWVO, 1986).
Despite the differences it was concluded that for the scenario a medium sized hospital with about 400 beds of which some 300 are occupied (occupancy rate about 70%) may be considered. If the EU average for the hospital size should be much larger it does not seem necessary to take that into account as the amount of wastewater will be too large for the standard STP of EUSES. Then a proportionally larger STP should be considered impelling to overwriting default values without leading to different PEC calculations. It should be noted that the attention is focussed on application of biocides in aqueous solutions. Products like alcohols used as such will evaporate completely (diffuse air emissions) and not reach the sewer.
So, recapitulating the various applications of biocides in a hospital the following situations are considered:
- 1) (Section 3.3)
(Section 3.4) (Section 3.5)
(Section 3.6)
• Disinfection of rooms, furniture and objects (Product Subtype 2.4 of Table 3.2 “accomodation for man”)
• Disinfection of medical instruments • Disinfection of laundry (product subtype 2.10 of Table 3.2
“others”) • Disinfection of hospital waste
1) not considered here as this is covered in the Medical Device Directive 93/42/EC
255

BPT 2 PRIVATE AND PUBLIC HEALTH AREA DISINFECTANT AND OTHER BIOCIDAL PRODUCTS
In those cases that a disinfectant has been notified for more than one application, the results for the emission rates to wastewater (Elocal3,water) have to be summed.
3.3 DISINFECTION OF ROOMS, FURNITURE AND OBJECTS
Before disinfection, normal domestic cleaning is always carried out. Furniture and objects are cleaned with disposable cloths and soap or synthetic detergents. The cleaning of floors can be carried out wet or dry. Sanitary fittings are divided into “clean” and “dirty”. Clean sanitary fittings are e.g. sinks and tiles; dirty sanitary fittings are e.g. the inside of toilet bowls, toilet seats and the low tiles next to the toilet bowls. The cleaned surfaces and objects are then treated with a disinfecting solution so that everything will remain wet for at least five minutes, i.e. the minimum exposure time required. The disinfected surfaces are allowed to air-dry. The dosage must be exact and the prescribed operating instructions must appear on the label of the disinfectant containers.
The only place where obligatory disinfection is carried out is in isolation wards. Only in the case of strict isolation disinfection has to be carried out daily, otherwise wards can be disinfected just after termination of the isolation. The disinfection applies to floors, furniture and objects in the room itself, the sanitary facilities and the sluice. Other rooms are only disinfected in situations where contamination occurs due to spilling of possible infectious material. If the disinfectant concerned is the same as for the disinfection of lavatories and surfaces in accommodations for humans (households, offices, public places, etc.), the scenarios of Chapter 2 are used. Otherwise the scenario described in this subsection has to be used.
In order to prevent spreading of contamination it is necessary that cleaning equipment is cleaned, disinfected and dried daily. Objects disinfected are buckets and (plastic) brushes. Buckets are disinfected in the bedpan-washer machines, where thermal disinfection is applied. Brushes are immersed in a disinfecting solution (e.g. 1,000 ppm free chlorine or 2% o-phenyl-phenol), rinsed and dried. Cloths are of the disposable type. Mops are preferably disposable, otherwise will to be washed in the laundry. The text above is derived from the Dutch directive on disinfection and cleaning of rooms, furniture and objects (WIP, 1993).
3.3.1 Scenario description
As for disinfectants used for sanitary purposes two scenarios are presented, viz one with the basis of the tonnage and one applying an amount of aqueous solution. In both scenarios it is difficult to establish a representative emission factor. All disinfectant present in the fraction of the solution that remains on the surfaces will be remain there until it is degraded, transported via contact or evaporate. It may theoretically be assumed that some of the remaining disinfectant will be removed at the next cleaning operation and still transferred to the wastewater. The disinfectant applied in sinks and toilet bowls and present in the remaining solution after disinfection is discharged into the sewer. Because of the lack of data a best guess for the fraction released to wastewater of 0.75 has been made.
In the scenario where that the tonnage is used a fraction of the tonnage has to be estimated for the model hospital. This is not the fraction of the main source as here the relation is used between a realistic worst-case size hospital connected to the standard STP of EUSES. For this fraction the ratio of the average number of beds : number of beds in the region is used. The values for the Dutch (CBS, 1997) situation has been used (because the area of the Netherlands is approximately the same as the regional area of EUSES, i.e. 200.200 km2 and the fact that the
256

BPT 2 PRIVATE AND PUBLIC HEALTH AREA DISINFECTANTS AND OTHER BIOCIDAL PRODUCTS
data for the number of beds and the number of patient days were available). If data for the whole EU become available and differ much from the Dutch situation another default should be introduced. The fraction for the model hospital, Fhospital = 0.007.
For the second scenario it is assumed that 25 litres of water are used for surfaces and 25 litres for objects (brushes). If the average amount in wastewater due to use on surfaces is considered for all disinfectants (excluding alohols) (derived from UBA, 1999; see also Appendix 1) together with the number of beds in the model hospital (409, see also Appendix 1), a daily application of 409.3.08 = 1,260 g active ingredient can be estimated. With subscribed concentrations of 2 to 4% by weight of active ingredients (e.g. 2% for o-phenyl-phenol and 4% for chlorhexidin) this would be 500 – 1,000 g for a single used disinfectant with the 25 l defaults each for surfaces and objects. Because of the fact that most hospitals use more than one active ingredient for disinfection of rooms, furniture and objects the approach of 25 litres seems acceptable.
The emission factor will be different for the respective applications. It is assumed that the solution used for brushes will be discharged into the sewer after disinfection; so, as a best guess the fraction released to wastewater is set at 0.95 as a default. Together with the emission factor of the other scenario, which concerns both applications, the fraction for sanitary purposes is calculated from 0.5.fraction for brushes (Fobj3,water) + 0.5.0.95 (Fsan3,water) = 0.75, namely Fobj3,water = 0.55. This calculation is made assuming that equal amounts of disinfectant are used for both purposes.
3.3.2 Emission scenarios
Table 7 presents the emission scenario applying the tonnage of the disinfectant and Table 8 the scenario for the amount of aqueous solution used.
Table 7 Emission scenario for calculating the releases of disinfectants used for sanitary purposes in hospitals based on the
annual tonnage applied
Variable/parameter (unit) Symbol Unit Default S/D/O/P Input
A) Relevant tonnage in the region for this application TONNAGEREG 1) (tonnes.yr-1) O B) Relevant tonnage in the EU for this application TONNAGE 1) (tonnes.yr-1) Fraction for the region Freg 0.1 D A + B) Fraction for the hospital (STP) Fhospital - 0.007 D Fraction released to wastewater 2) F3, water - 0.75 D Number of emission days for life cycle stage 3 (processing) Temission3 d 260 D Output
Emission rate to wastewater Elocal3,water (kg.d-1) 2)
1) In principle this should be TONNAGEk to identify usage in product k but this is not shown just as in the EUSES documentation 2) The subscript “3” refers to the stage of processing in conformity with EUSES 1.0 and USES 2.0
257
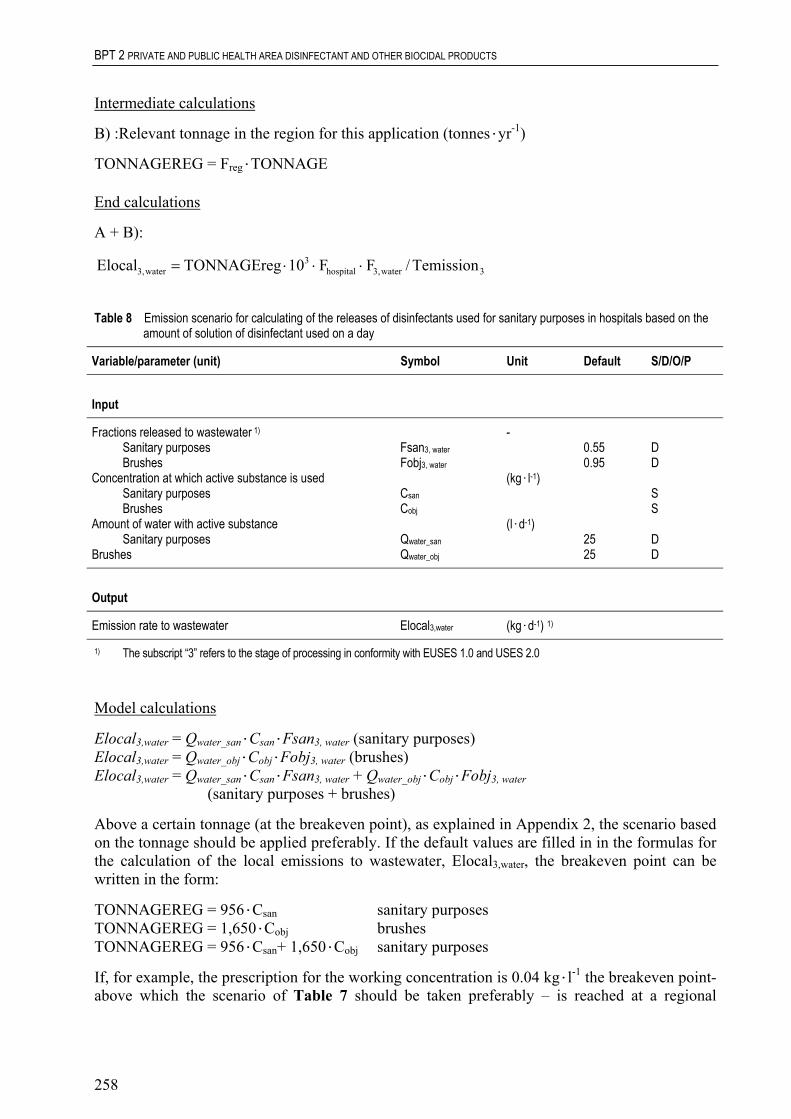
BPT 2 PRIVATE AND PUBLIC HEALTH AREA DISINFECTANT AND OTHER BIOCIDAL PRODUCTS
Intermediate calculations
B) :Relevant tonnage in the region for this application (tonnes.yr-1)
TONNAGEREG = Freg.TONNAGE
End calculations
A + B):
3water,3hospital3
water,3 Temission/FF10TONNAGEregElocal ⋅⋅⋅=
Table 8 Emission scenario for calculating of the releases of disinfectants used for sanitary purposes in hospitals based on the
amount of solution of disinfectant used on a day
Variable/parameter (unit) Symbol Unit Default S/D/O/P Input
Fractions released to wastewater 1) - Sanitary purposes Fsan3, water 0.55 D Brushes Fobj3, water 0.95 D Concentration at which active substance is used
(l.d
25
(kg.l-1) Sanitary purposes Csan S Brushes Cobj S Amount of water with active substance -1) Sanitary purposes Qwater_san 25 D Brushes Qwater_obj D Output
Emission rate to wastewater Elocal3,water (kg.d-1) 1)
1) The subscript “3” refers to the stage of processing in conformity with EUSES 1.0 and USES 2.0
Model calculations
Elocal3,water = Qwater_san.Csan.Fsan3, water (sanitary purposes) Elocal3,water = Qwater_obj.Cobj.Fobj3, water (brushes) Elocal3,water = Qwater_san.Csan.Fsan3, water + Qwater_obj.Cobj.Fobj3, water
(sanitary purposes + brushes)
Above a certain tonnage (at the breakeven point), as explained in Appendix 2, the scenario based on the tonnage should be applied preferably. If the default values are filled in in the formulas for the calculation of the local emissions to wastewater, Elocal3,water, the breakeven point can be written in the form:
TONNAGEREG = 956.Csan sanitary purposes TONNAGEREG = 1,650.Cobj brushes TONNAGEREG = 956.C .C purposes san+ 1,650 obj sanitary
If, for example, the prescription for the working concentration is 0.04 kg.l-1 the breakeven point- above which the scenario of Table 7 should be taken preferably – is reached at a regional
258

BPT 2 PRIVATE AND PUBLIC HEALTH AREA DISINFECTANTS AND OTHER BIOCIDAL PRODUCTS
tonnage of 38.2 t.y-1 for sanitary purposes, 66 t.y-1 for objects and 104 t.y-1 for sanitary purposes + objects, respectively.
3.4 DISINFECTION OF INSTRUMENTS
Disinfection of instruments like endoscopes – referred to as scopes in most cases – should be done in automated washers/disinfectors (BSG, 1998). The majority of the hospitals with endoscopy units performing several thousands procedures per year use these washers nowadays (Van Gossum et al., 1989). Where patient turnover is low, manual disinfection is still carried out. The washers are connected to the sewer for removal of the wastewater (including the spent disinfectant). As disinfectants such as aldehydes are fairly volatile, washers/disinfectors are supplied with air-exchange equipment, e.g. exhaust hood, ventilation system, etc.) (WIP, 1998; APIC, 1994). The contents of (ultrasonic) baths used for manual disinfection will also be discarded into the sewer. For the emission scenario, use of automated washers/disinfectors is considered as these will penetrate almost completely, manual disinfection being unacceptable in the light of the working conditions. Other instruments are disinfected in solutions (or suspensions) of disinfectants to prevent adhesion of blood, pus, etc. These baths are discarded into the sewer after use.
If a biocide is notified for both disinfection of scopes and other instruments, the emission for a single point source (one hospital) should be calculated by summing the results of both emission scenarios (Tables 8 and 9).
3.4.1 Scenario description endoscopes
The most widely used disinfectant is glutaraldehyde at a concentration of 2% (WIP, 1998; RIVM, 1996; APIC, 1994). The emission scenario assumes that the model hospital has all possible units for performing endoscopy procedures as the enquiry (RIVM, 1996) shows that relatively small hospitals may have washers/disinfectors for every speciality related to endoscopy. Therefore the model takes the hospitals in the enquiry with the highest glutaraldehyde consumption as the basic institution since these hospitals can be considered to be average-sized hospitals. These hospitals use 150 kg glutaraldehyde per year in three machines.
In the original report (Van der Poel, 1999a) a scenario was presented that considers washers/disinfectors with replacement of the disinfectant solutions at regular intervals. More and more systems are brought into use nowadays where a fresh disinfectant solution is applied every disinfection operation; the substance is discarded into the sewer after disinfection (communication by B. Henry at the 2nd meeting of the EUBEES meeting, January 2001). This system is considered also in this report and denoted here as “once-through” (the other system being denoted as “replacement”).
Replacement
Replacement of the disinfectant solution can be done at regular intervals or at a certain measured minimum concentration. Many hospitals contacted recently state that replacement is carried out every two weeks; however, the glutaraldehyde concentration is not known at the moment of replacement. The disinfectant concentration declines during use because of:
• dilution due to the carry-over of water (APIC, 1996; Bradley, 1994), • carry-over of disinfectant onto the scopes going to the rinsing phase,
259

BPT 2 PRIVATE AND PUBLIC HEALTH AREA DISINFECTANT AND OTHER BIOCIDAL PRODUCTS
• volatilisation from the solution, • probable decomposition or chemical reaction.
The original report (Van der Poel, 1999a) presented a scenario for a washer with periodical replacements only. There are, however, more and more scope washers being used with a “once through” system; this means that the solution is used once and discharged after the washing operation immediately (personal communication to B. D. Henry, 2001). So, this report deals with both types.
In a guideline from the United States (APIC, 1996) results of several investigations are given on glutaraldehyde declines, e.g. from 2.4% to 1.5% after 10 days in manual and automatic baths used for endoscopes (Mbithi et al., 1993). The report mentions one investigator establishing a minimum effective concentration of 1.5%. Test strips constructed to indicate concentrations above 1.5% are available. The model assumes by default that replacement is carried out at regular intervals, with those replacements carried out the same day once every two weeks in the case of more than one washer/disinfector. This is expressed in the model as a replacement frequency of 25 times per year (with 150 kg in three machines and a concentration of 2% glutaraldehyde in the fresh solution, i.e. an amount of 100 l per machine per event).
Water emissions due to rinsing treated scopes are not considered in the model as the (daily) discharges to the sewer are negligible compared to the discharges at replacement of the disinfectant solution. They are, however, taken into account for the calculation of the remaining fraction of the disinfectant at replacement of the bath.
At the time that the original report on hospital disinfectants was written (Van der Poel, 1999a) the evaporation was also considered in the model. Calculations showed that evaporation of glutaraldehyde might be responsible for the decrease in concentration. In these calculations a vapour pressure of 2.3 kPa (WHO/IPCS/ILO, 1998) was used. This vapour pressure, however, is mainly due to the partial vapour pressure of the solvent (water) (Henry, personal communication, 2001). According to the data supplied by e-mail (Henry, 2001) the partial vapour pressure of glutaraldehyde is 27 Pa at 20°C, whereas the reduction in glutaraldehyde concentration is caused by:
Carry over
• chemical properties: vapour pressure, water solubility, molecular weight, •
Evaporation ca 0.25% Reaction (aldol condensation) ca 25%
ca 75%
The emission of the disinfectant into the air because of volatilisation from the solution will decrease when the concentration in the solution decreases. The maximum emission will occur on the first day after refreshing the bath. In the original report (Van der Poel, 1999a) a scenario was presented using the method described by Thomas in Lyman et al. (1990) for the calculation of this volatilisation. This method follows the two-film concept for estimating the flux of volatiles across the air-water interface. For this method the following data are needed:
environmental characteristics: wind speed, current speed and depth of water body.
Model calculations were carried out for glutaraldehyde showed that volatilisation would be able causing the drop in concentration of 2 to 1.5% in two weeks. These calculations used the following input data. A value for the vapour pressure of 2.3 KPa (WHO/IPCS/ILO, 1998). For the solubility of glutaraldehyde the only results found in literature were “reacts with water” or “miscible”. For the calculation of Henry's law constant 950,000 mg.l-1 was used. Furthermore, in
260
BPT 2 PRIVATE AND PUBLIC HEALTH AREA DISINFECTANTS AND OTHER BIOCIDAL PRODUCTS
the calculations values for the depth of the bath ≥ 0.5 m, wind speeds of ≤ 0.5 m.sec-1 and water speeds of 0.5 m.sec-1 were applied.
According to Henry (2001) the partial vapour pressure of glutaraldehyde is 27 Pa at 20ºC. This was confirmed by recently found data (SRC, 2001) stating a vapour pressure of 6 mm Hg (approx 26.7 Pa) at 25°C and an estimated Henry coefficient of 11-10-7 atm.m3.mol-1 (approx 0.011 Pa.m3.mol-1). The calculation for air emissions is skipped in the model if the value of the Henry coefficient is less then 0.03 Pa.m3.mol-1 (erroniously 3 Pa.m3.mol-1 in the original report) as volatilisation can be considered negligible (Lyman et al., 1990).This means that the evaporation of glutaraldehyde is negligible; processes such as degaradation/reaction and dilution and transfer of bath liquid are causing the decrease in disinfectant concentration. It is very likely that other substances probably used as disinfectants in scope washers will have comparable values for the Henry coefficient. Therefore, the emission to air is left out in the scenario presented in this report. Another reason for this is the fact that we are dealing here with a small point source that will give rise to very low air concentrations.
The scopes are pre-cleaned before they are transferred to the washer/disinfector. The cleaned scopes are brought over without drying thus introducing water into the disinfectant solution. After the disinfection operation the scopes are taken out of the washer/disinfector removing some of the (slightly diluted) solution. This effect is denoted here as “carry-over” and a carry-over factor is introduced here for the model. The carry-over fraction (denoted here as r) is defined as the fraction of the bath content replaced by water introduced and removed per day. The assumptions are that (1) the the same type and scale of disinfection operation is performed every day during the period the disinfectant solution is used in the bath, and (2) the amount of water introduced is equaling the amount of water (solution) removed.
If it is assumed that the decrease in glutaraldehyde concentration of 25% stated earlier (from 2% down to 1.5%) is caused by carry-over for 75%, according to the data supplied by Henry (2001), the following calculations can be made to establish the carry-over fraction:
The concentration of glutaraldehyde in the remaining solution after 14 days (CT) is (2 - 0.5.0.75) / 2 = 0.8125 times the concentration in the fresh solution after replacement (C0):
CT = 0.8125 C0.
The concentration in the bath for the days during use of the washer/disinfector for a period of T days can be written as:
concentration on day 1 C1 = C0 / (1 + r) concentration on day 2 C2 = C1 / (1 + r) = C0 / (1 + r)2 │ concentration on day T CT = C0 / (1 + r)T
Filling in CT from [1] and T = 14, the fraction carry-over is calculated as r = 0.0149. This means that with a bath content of 100 l an amount of approximately 1.5 l is discharged into the sewer daily.
Apart from removal of disinfectant from the bath due to the process described above the concentration of a disinfectant may decrease over time due to chemical reactions. Aldehydes such as glutaraldehyde tend to form dimers and trimers, a reaction known as the aldol condensation. This reaction occurs especially under alkaline conditions which arise as glutaraldehyde is “activated” by an alkaline buffer (Henry, 2001). So far, no data on the order of the reaction could be found leading to the assumption of a 1st order reaction. The model has a possibilty to specify a rate constant for degradation (kdegdisinf) due to chemical reactions such as
261
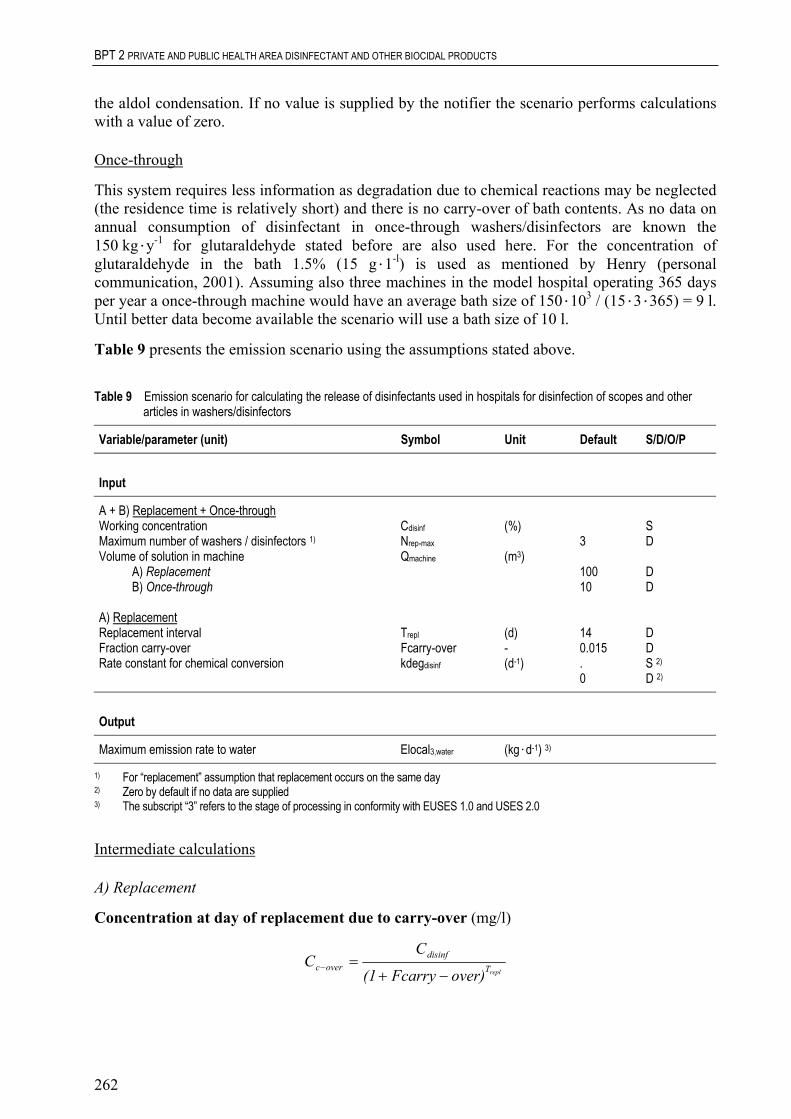
BPT 2 PRIVATE AND PUBLIC HEALTH AREA DISINFECTANT AND OTHER BIOCIDAL PRODUCTS
the aldol condensation. If no value is supplied by the notifier the scenario performs calculations with a value of zero.
Once-through
This system requires less information as degradation due to chemical reactions may be neglected (the residence time is relatively short) and there is no carry-over of bath contents. As no data on annual consumption of disinfectant in once-through washers/disinfectors are known the 150 kg.y-1 for glutaraldehyde stated before are also used here. For the concentration of glutaraldehyde in the bath 1.5% (15 g.1-l) is used as mentioned by Henry (personal communication, 2001). Assuming also three machines in the model hospital operating 365 days per year a once-through machine would have an average bath size of 150.103 / (15.3.365) = 9 l. Until better data become available the scenario will use a bath size of 10 l.
Table 9 presents the emission scenario using the assumptions stated above.
Table 9 Emission scenario for calculating the release of disinfectants used in hospitals for disinfection of scopes and other
articles in washers/disinfectors
Variable/parameter (unit) Symbol Unit Default S/D/O/P Input
A + B) Replacement + Once-through Cdisinf (%) S
Maximum number of washers / disinfectors 1) Nrep-max 3 D Volume of solution in machine Qmachine (m3)
A) Replacement 100 D 10
A) Replacement Replacement interval T D
D
repl (d) 14
Fraction carry-over Fcarry-over - 0.015 Rate constant for chemical conversion kdegdisinf (d-1) . S 2) 0 D 2) Output
Maximum emission rate to water
Elocal3,water (kg.d-1) 3)
Working concentration
B) Once-through D
1) For “replacement” assumption that replacement occurs on the same day 2) Zero by default if no data are supplied 3) The subscript “3” refers to the stage of processing in conformity with EUSES 1.0 and USES 2.0
Intermediate calculations
A) Replacement
Concentration at day of replacement due to carry-over (mg/l)
replTdisinf
overcover)Fcarry(1
CC
−+=−
262
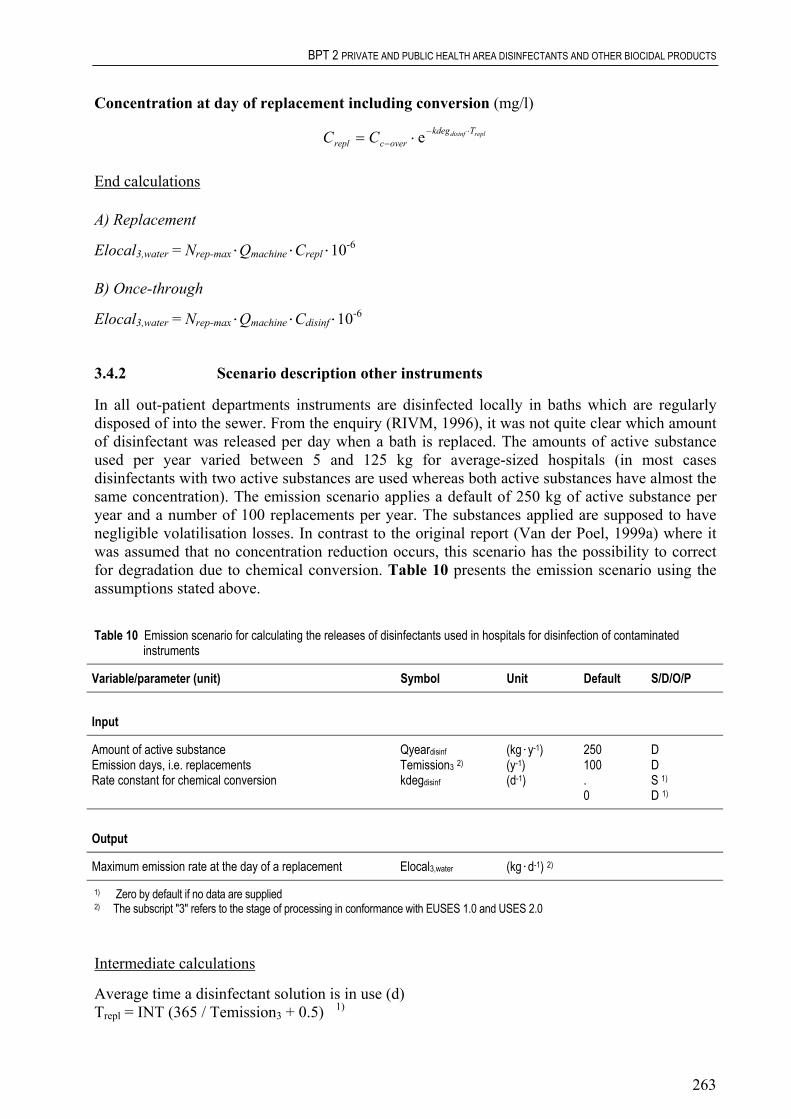
BPT 2 PRIVATE AND PUBLIC HEALTH AREA DISINFECTANTS AND OTHER BIOCIDAL PRODUCTS
Concentration at day of replacement including conversion (mg/l)
repldisinf Tkdegovercrepl CC ⋅−
− ⋅= e
End calculations
A) Replacement
Elocal3,water = Nrep-max.Qmachine.Crepl.10-6
B) Once-through
Elocal3,water = Nrep-max.Qmachine.Cdisinf.10-6
3.4.2 Scenario description other instruments
Symbol
In all out-patient departments instruments are disinfected locally in baths which are regularly disposed of into the sewer. From the enquiry (RIVM, 1996), it was not quite clear which amount of disinfectant was released per day when a bath is replaced. The amounts of active substance used per year varied between 5 and 125 kg for average-sized hospitals (in most cases disinfectants with two active substances are used whereas both active substances have almost the same concentration). The emission scenario applies a default of 250 kg of active substance per year and a number of 100 replacements per year. The substances applied are supposed to have negligible volatilisation losses. In contrast to the original report (Van der Poel, 1999a) where it was assumed that no concentration reduction occurs, this scenario has the possibility to correct for degradation due to chemical conversion. Table 10 presents the emission scenario using the assumptions stated above.
Table 10 Emission scenario for calculating the releases of disinfectants used in hospitals for disinfection of contaminated
instruments
Variable/parameter (unit) Unit Default S/D/O/P Input
Amount of active substance Qyeardisinf (kg.y-1) 250 D Emission days, i.e. replacements Temission3 2) (y-1) 100 D Rate constant for chemical conversion kdegdisinf (d-1) . S 1) 0 D 1) Output
Maximum emission rate at the day of a replacement Elocal3,water (kg.d-1) 2)
1) Zero by default if no data are supplied
2) The subscript "3" refers to the stage of processing in conformance with EUSES 1.0 and USES 2.0
Intermediate calculations
Average time a disinfectant solution is in use (d) Trepl = INT (365 / Temission3 + 0.5) 1)
263

BPT 2 PRIVATE AND PUBLIC HEALTH AREA DISINFECTANT AND OTHER BIOCIDAL PRODUCTS
End calculations
replfsindi Tdegke ⋅−⋅=3
disinfrepl Temission
QyearQ
1) INT = Integer (this notation has been used to ensure that in computer calculations a whole numer for the number of days will be returned)
3.5 LAUNDRY DISINFECTANTS
Most Dutch hospitals nowadays do not have their own laundry but send the laundry out to specialised laundries (WIP, 1993) (Sprenger, Hilversum hospital, personal communication, 1998). At the moment about 100 large laundries are in operation for the catering industry and health care (Rozenburg, 1998). One large company, active in 8 EU countries with 25 establishments in The Netherlands and 35 in Germany, offers so-called re-usable OR (operating room) systems to hospitals. These consist of a complete supply of patient-covers and clothing for the OR staff (Rentex, 1998). The Directive for linen (WIP, 1993) has no guidelines for hygiene in laundries but refers to the handbook of the Certex Foundation, which certifies laundries according to ISO 9002. It has 46 certified members with a market share of about 80% in The Netherlands (Certex, 1998).
In the certification the means for disinfection described is a time-temperature formula. It is possible, however, that disinfectants are used in laundries at present (Sprenger, Hilversum hospital, personal communication, 1998; Valk, Foundation Certex, personal communication, Tilburg, 1998). The use of disinfectants in laundries is mentioned in literature (Van Dokkum et al., 1998; Van Kasteren, 1998). It turned out that at some (large) laundries approached in case of contaminated clothing disinfectants, especially hydrogen peroxide and hypochlorite, are commonly used.
Biologically contaminated laundry is packed in special (coloured) bags to distinguish it from ordinary laundry. The contaminated laundry is then not sorted but put directly into the machine where the bag is opened automatically. Some laundries treat the contaminated laundry in a separate washing machine (like hospitals with their own laundries); others put it into the “washing street” (a series of one or more washing “tubes”, i.e. continuously operating machines where the laundry enters dirty at one end and leaves clean at the other between the normal laundry). A number of certified laundries was approached by telephone; from the information gathered it turns out that in the case of the ‘washing street’ some laundries always use hydrogen peroxide or hypochlorite, while others use tumbler washing machines (10 - 25 kg laundry per batch) and rely on the temperature-time formula. In the latter method the temperature may be raised from 80-85°C to 90-95°C or a detergent-like peracetic acid may be used at a lower temperature (60°C) for temperature-sensitive fabrics.
Scenario description
The size of commercial laundries can vary considerably but large laundries may have three or more washing tubes with a capacity of 8,000 kg.day-1 per tube, producing 48 m3.day-1 of wastewater (Van Kasteren, 1998) (Brasser, Technical University of Delft, personal communication, 1998). It is assumed here that a commercial laundry connected to the standard STP of EUSES/USES (2,000 m3 wastewater per day) can have three washing tubes (3.48 = 144 m3 wastewater per day). On the other hand, the situation is considered where a hospital is doing its own laundry or where the contaminated laundry is done at a commercial laundry using
264
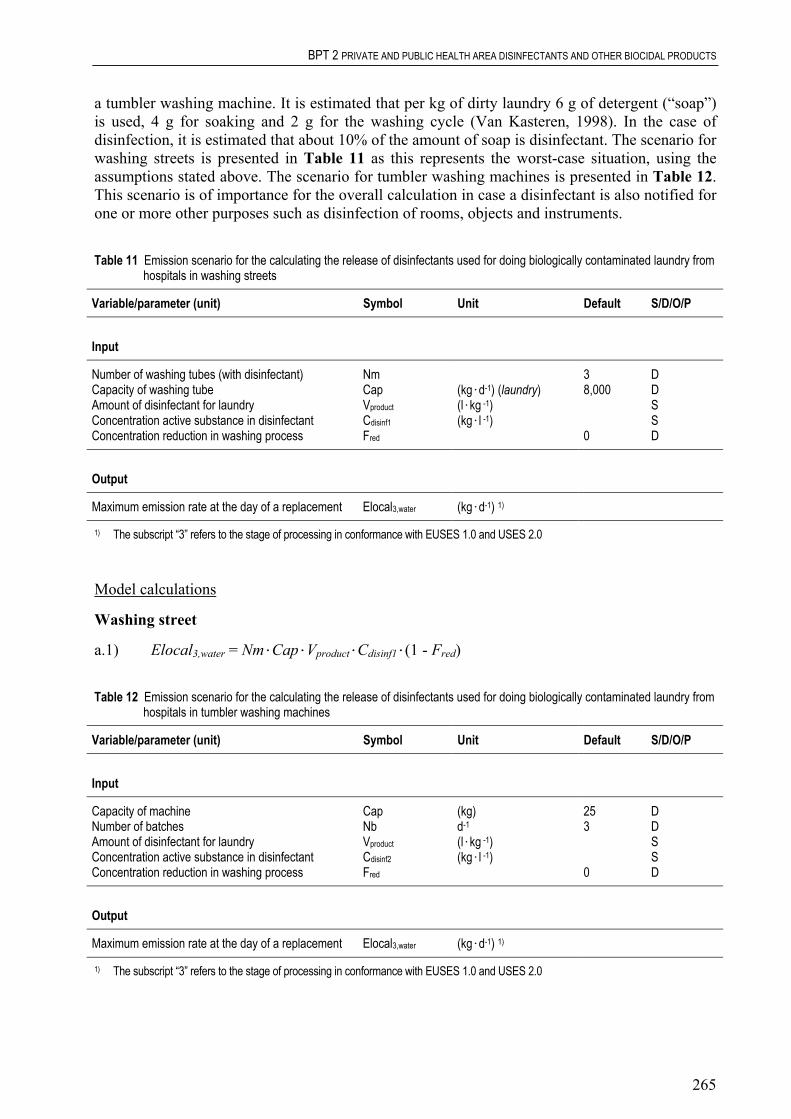
BPT 2 PRIVATE AND PUBLIC HEALTH AREA DISINFECTANTS AND OTHER BIOCIDAL PRODUCTS
a tumbler washing machine. It is estimated that per kg of dirty laundry 6 g of detergent (“soap”) is used, 4 g for soaking and 2 g for the washing cycle (Van Kasteren, 1998). In the case of disinfection, it is estimated that about 10% of the amount of soap is disinfectant. The scenario for washing streets is presented in Table 11 as this represents the worst-case situation, using the assumptions stated above. The scenario for tumbler washing machines is presented in Table 12. This scenario is of importance for the overall calculation in case a disinfectant is also notified for one or more other purposes such as disinfection of rooms, objects and instruments.
Table 11 Emission scenario for the calculating the release of disinfectants used for doing biologically contaminated laundry from
hospitals in washing streets
Variable/parameter (unit) Symbol Unit Default S/D/O/P Input
Number of washing tubes (with disinfectant) Nm 3 D (kg.d-1) (laundry) 8,000
Amount of disinfectant for laundry Vproduct (l.kg -1) S Concentration active substance in disinfectant disinf1 (kg.l -1) S
red 0 Output
Maximum emission rate at the day of a replacement Elocal3,water (kg.d-1) 1)
Capacity of washing tube Cap D
CConcentration reduction in washing process F D
1) The subscript “3” refers to the stage of processing in conformance with EUSES 1.0 and USES 2.0
Model calculations
Washing street
a.1) Elocal3,water = Nm.Cap.Vproduct.Cdisinf1.(1 - Fred)
Table 12 Emission scenario for the calculating the release of disinfectants used for doing biologically contaminated laundry from
hospitals in tumbler washing machines
Variable/parameter (unit) Symbol Unit Default S/D/O/P
Input
Capacity of machine Cap (kg) 25 D Number of batches Nb d-1 3 D Amount of disinfectant for laundry Vproduct (l.kg -1) S Concentration active substance in disinfectant Cdisinf2 (kg.l -1) S Concentration reduction in washing process Fred 0 D Output
Maximum emission rate at the day of a replacement Elocal3,water (kg.d-1) 1)
1) The subscript “3” refers to the stage of processing in conformance with EUSES 1.0 and USES 2.0
265
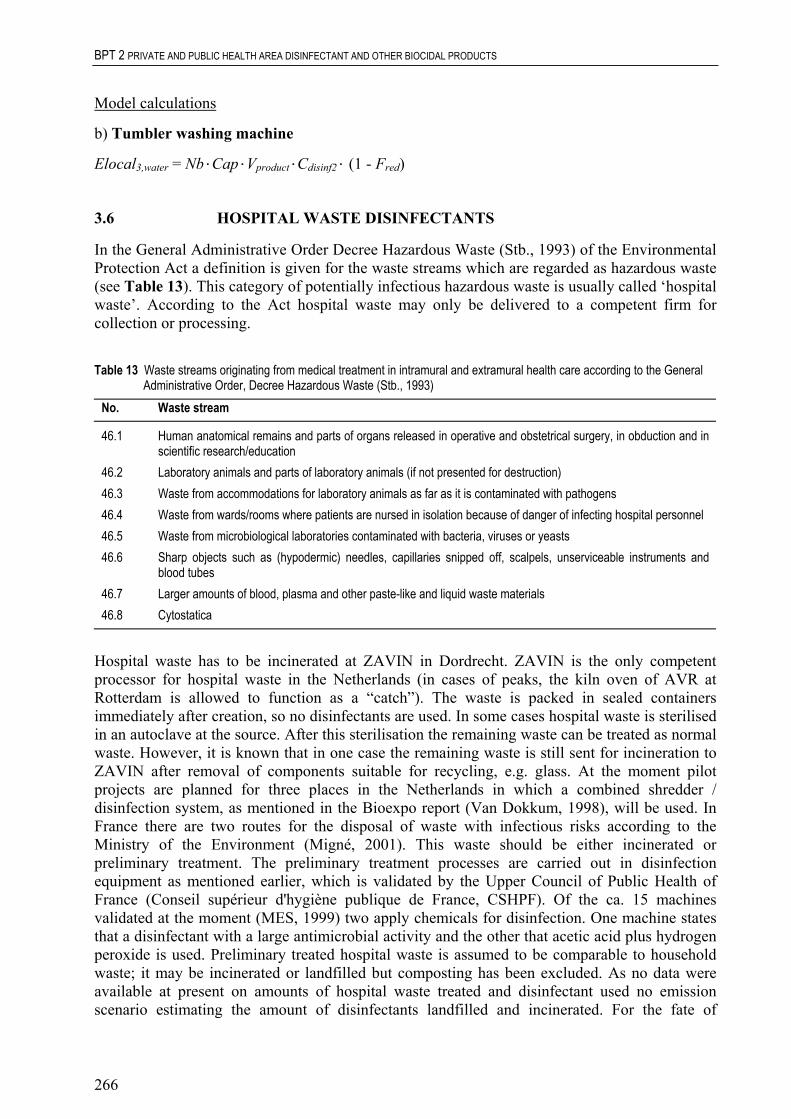
BPT 2 PRIVATE AND PUBLIC HEALTH AREA DISINFECTANT AND OTHER BIOCIDAL PRODUCTS
Model calculations
b) Tumbler washing machine
Elocal3,water = Nb.Cap.Vproduct.Cdisinf2. (1 - Fred)
3.6 HOSPITAL WASTE DISINFECTANTS
In the General Administrative Order Decree Hazardous Waste (Stb., 1993) of the Environmental Protection Act a definition is given for the waste streams which are regarded as hazardous waste (see Table 13). This category of potentially infectious hazardous waste is usually called ‘hospital waste’. According to the Act hospital waste may only be delivered to a competent firm for collection or processing.
No. Waste stream
Table 13 Waste streams originating from medical treatment in intramural and extramural health care according to the General
Administrative Order, Decree Hazardous Waste (Stb., 1993)
46.1 Human anatomical remains and parts of organs released in operative and obstetrical surgery, in obduction and in scientific research/education
46.2 Laboratory animals and parts of laboratory animals (if not presented for destruction) 46.3
46.7 Larger amounts of blood, plasma and other paste-like and liquid waste materials
Waste from accommodations for laboratory animals as far as it is contaminated with pathogens 46.4 Waste from wards/rooms where patients are nursed in isolation because of danger of infecting hospital personnel 46.5 Waste from microbiological laboratories contaminated with bacteria, viruses or yeasts 46.6 Sharp objects such as (hypodermic) needles, capillaries snipped off, scalpels, unserviceable instruments and
blood tubes
46.8 Cytostatica
Hospital waste has to be incinerated at ZAVIN in Dordrecht. ZAVIN is the only competent processor for hospital waste in the Netherlands (in cases of peaks, the kiln oven of AVR at Rotterdam is allowed to function as a “catch”). The waste is packed in sealed containers immediately after creation, so no disinfectants are used. In some cases hospital waste is sterilised in an autoclave at the source. After this sterilisation the remaining waste can be treated as normal waste. However, it is known that in one case the remaining waste is still sent for incineration to ZAVIN after removal of components suitable for recycling, e.g. glass. At the moment pilot projects are planned for three places in the Netherlands in which a combined shredder / disinfection system, as mentioned in the Bioexpo report (Van Dokkum, 1998), will be used. In France there are two routes for the disposal of waste with infectious risks according to the Ministry of the Environment (Migné, 2001). This waste should be either incinerated or preliminary treatment. The preliminary treatment processes are carried out in disinfection equipment as mentioned earlier, which is validated by the Upper Council of Public Health of France (Conseil supérieur d'hygiène publique de France, CSHPF). Of the ca. 15 machines validated at the moment (MES, 1999) two apply chemicals for disinfection. One machine states that a disinfectant with a large antimicrobial activity and the other that acetic acid plus hydrogen peroxide is used. Preliminary treated hospital waste is assumed to be comparable to household waste; it may be incinerated or landfilled but composting has been excluded. As no data were available at present on amounts of hospital waste treated and disinfectant used no emission scenario estimating the amount of disinfectants landfilled and incinerated. For the fate of
266
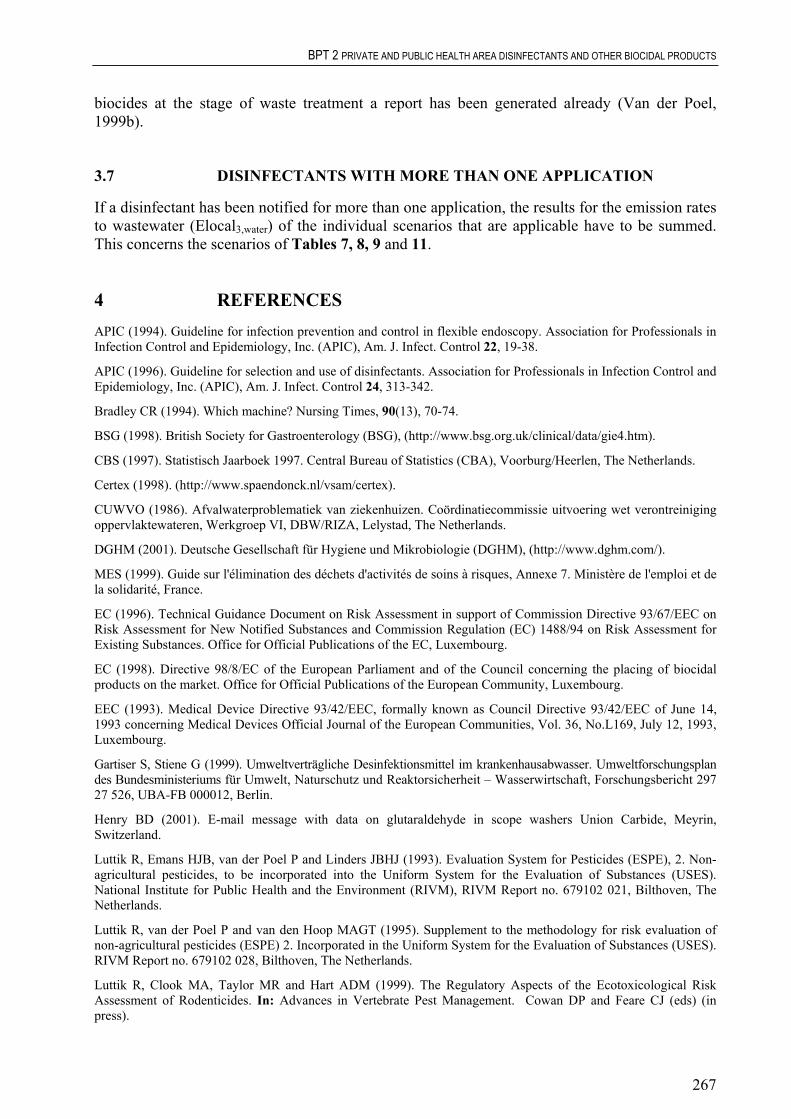
BPT 2 PRIVATE AND PUBLIC HEALTH AREA DISINFECTANTS AND OTHER BIOCIDAL PRODUCTS
biocides at the stage of waste treatment a report has been generated already (Van der Poel, 1999b).
3.7
APIC (1994). Guideline for infection prevention and control in flexible endoscopy. Association for Professionals in Infection Control and Epidemiology, Inc. (APIC), Am. J. Infect. Control 22, 19-38.
CBS (1997). Statistisch Jaarboek 1997. Central Bureau of Statistics (CBA), Voorburg/Heerlen, The Netherlands.
CUWVO (1986). Afvalwaterproblematiek van ziekenhuizen. Coördinatiecommissie uitvoering wet verontreiniging oppervlaktewateren, Werkgroep VI, DBW/RIZA, Lelystad, The Netherlands.
EEC (1993). Medical Device Directive 93/42/EEC, formally known as Council Directive 93/42/EEC of June 14, 1993 concerning Medical Devices Official Journal of the European Communities, Vol. 36, No.L169, July 12, 1993, Luxembourg.
DISINFECTANTS WITH MORE THAN ONE APPLICATION
If a disinfectant has been notified for more than one application, the results for the emission rates to wastewater (Elocal3,water) of the individual scenarios that are applicable have to be summed. This concerns the scenarios of Tables 7, 8, 9 and 11.
4 REFERENCES
APIC (1996). Guideline for selection and use of disinfectants. Association for Professionals in Infection Control and Epidemiology, Inc. (APIC), Am. J. Infect. Control 24, 313-342.
Bradley CR (1994). Which machine? Nursing Times, 90(13), 70-74.
BSG (1998). British Society for Gastroenterology (BSG), (http://www.bsg.org.uk/clinical/data/gie4.htm).
Certex (1998). (http://www.spaendonck.nl/vsam/certex).
DGHM (2001). Deutsche Gesellschaft für Hygiene und Mikrobiologie (DGHM), (http://www.dghm.com/).
MES (1999). Guide sur l'élimination des déchets d'activités de soins à risques, Annexe 7. Ministère de l'emploi et de la solidarité, France.
EC (1996). Technical Guidance Document on Risk Assessment in support of Commission Directive 93/67/EEC on Risk Assessment for New Notified Substances and Commission Regulation (EC) 1488/94 on Risk Assessment for Existing Substances. Office for Official Publications of the EC, Luxembourg.
EC (1998). Directive 98/8/EC of the European Parliament and of the Council concerning the placing of biocidal products on the market. Office for Official Publications of the European Community, Luxembourg.
Gartiser S, Stiene G (1999). Umweltverträgliche Desinfektionsmittel im krankenhausabwasser. Umweltforschungsplan des Bundesministeriums für Umwelt, Naturschutz und Reaktorsicherheit – Wasserwirtschaft, Forschungsbericht 297 27 526, UBA-FB 000012, Berlin.
Henry BD (2001). E-mail message with data on glutaraldehyde in scope washers Union Carbide, Meyrin, Switzerland.
Luttik R, Emans HJB, van der Poel P and Linders JBHJ (1993). Evaluation System for Pesticides (ESPE), 2. Non-agricultural pesticides, to be incorporated into the Uniform System for the Evaluation of Substances (USES). National Institute for Public Health and the Environment (RIVM), RIVM Report no. 679102 021, Bilthoven, The Netherlands.
Luttik R, van der Poel P and van den Hoop MAGT (1995). Supplement to the methodology for risk evaluation of non-agricultural pesticides (ESPE) 2. Incorporated in the Uniform System for the Evaluation of Substances (USES). RIVM Report no. 679102 028, Bilthoven, The Netherlands.
Luttik R, Clook MA, Taylor MR and Hart ADM (1999). The Regulatory Aspects of the Ecotoxicological Risk Assessment of Rodenticides. In: Advances in Vertebrate Pest Management. Cowan DP and Feare CJ (eds) (in press).
267
BPT 2 PRIVATE AND PUBLIC HEALTH AREA DISINFECTANT AND OTHER BIOCIDAL PRODUCTS
Lyman WJ, Reehl WF and Rosenblatt DH (1990). Handbook of Chemical Property Estimation Methods, Environmental Behavior of Organic Compounds, Chapter 15 (Thomas RG): Volatilization from water, McGrawHill, New York, NW, USA.
Mbithi JN, Springthorpe VS, Sattar SA and Pacquette M (1993). Bactericidal, virucidal and mycobactericidal activities of reused alkaline glutaraldehyde in an endoscope unit. J. Clin. Microbiol. 31, 2988-2995.
Migné V (2001). E-mail message on routes of disposal of hospital waste with infectious risks. Ineris, Verneuil en Halatte, France.
Montfoort JA, van der Poel P and Luttik R (1996). The Use of Disinfectants in Livestock Farming (Supplement to the evaluation method of non-agricultural pesticides of the Uniform System for Evaluation of Substances (USES)). National Institute for Public Health and the Environment (RIVM), RIVM Report no. 679102 033, Bilthoven, The Netherlands.
Rentex (1998). (http://www.rentex.nl/RN_INFO.HTM).
RIVM (1996). Enquiry amongst a random sample of Dutch hospitals related to disinfectant use Laboratorium voor Geneesmiddelen en Medische Hulpmiddelen, Unpublished data. National Institute for Public Health and the Environment (RIVM).
RIVM, VROM, VWS (1998). Uniform System for the Evaluation of Substances 2.0 (USES 2.0), National Institute for Public Health and the Environment (RIVM), Ministry of Housing, Spatial Planning and the Environment (VROM), Ministry of Health, Welfare and Sport (VWS), The Netherlands. RIVM Report 679102044, Bilthoven, The Netherlands.
Rozenburg J (1998). Newsletter Textielverzorging Rozenburg, Leidschendam, The Netherlands (http://www.trl.nl/nieuwsbrief.html).
Van Kasteren J (1998). Terugwinnen van zeep biedt economisch en ecologisch voordeel. Delft Integraal 14(5), Delft Technical University, Delft, pp. 9-13.
Russell AD (1991). Chapter 3 – Principles of antimicrobial activity. In: Disinfection, Sterilization and Preservation. (4th edition), Block SS, Lea & Febiger, Malvern, USA, pp. 29-58.
Shechmeister IL (1991). Chapter 31 – Sterilization by ultraviolet radiation. In: Disinfection, Sterilization and Preservation (4th edition), Block SS, Lea & Febiger, Malvern, USA, pp. 553-565.
SRC (2001). Data from SRC PhysProp Database on Pentane-1,5-dial. Syracuse Research Corporation (SRC), (http://esc.syrres.com/interkow/webprop.exe?CAS=111-30-8).
Stb. (1993). Besluit aanwijzing gevaarlijke afvalstoffen, Netherlands Government Gazette, The Hague, The Netherlands, No. 617.
Stb. (1995) Besluit medische hulpmiddelen (Wet op de geneesmiddelenvoorziening), Bulletin of Acts and Orders, The Hague, The Netherlands, No. 243.
Van der Poel (1999a). Supplement to the methodology for risk evaluation of biocides (I) Emission scenarios to be incorporated into the Uniform System for the Evaluation of Substances (USES), National Institute for Public Health and the Environment (RIVM), RIVM Report no. 601450 002, Bilthoven, The Netherlands.
Van der Poel (1999b), Supplement to the Uniform System for the Evaluation of Substances (USES), Emission scenarios for waste treatment (elaborated for biocides), National Institute for Public Health and the Environment (RIVM), RIVM Report no. 601450 003, Bilthoven, The Netherlands.
Van Dokkum HP, Bakker DJ and Scholten MCTh (1998). Development of a Concept for the Environmental Risk Assessment of Biocidal Products for Authorization Purposes (Bioexpo). Part 2: Release estimation for 23 biocidal product types. Forschungsbericht 106 01 065, UBA IV 1.4, Umweltbundesamt, Berlin.
Van Gossum A, Loriers M, Sorruy SE and Cremier M (1989). Methods of disinfecting endoscopic materials: results of an international survey. Endoscopy 21, 247-250.
WHO/IPCS/ILO (1998). International Safety Card 0158: glutaraldehyde. World Health Organisation (WHO), International Programme on Chemical Safety (IPCS), (http://hazard.com/msds/mf/cards/file/0158.html).
WIP (1991). Richtlijn No.3A: Desinfectie en sterilisatie. Werkgroep Infectie Preventie, Leiden, The Netherlands.
268

BPT 2 PRIVATE AND PUBLIC HEALTH AREA DISINFECTANTS AND OTHER BIOCIDAL PRODUCTS
WIP (1993). Richtlijn No.6a: Reiniging en desinfectie van ruimten, meubilair en voorwerpen. Werkgroep Infectie Preventie, Leiden, The Netherlands.
WIP (1998). Richtlijn No.3b: Desinfectie en sterilisatie (Draft October 1998). Werkgroep Infectie Preventie, Leiden, The Netherlands.
269


APPENDIX 1
Appendix 1 Underlying data used
For the scenarios described in this report is was assumed that the model hospital is situated near a locality that discharges its wastewater to the standard STP of EUSES, which means 2,000 m3 of wastewater per day (10,000 inhabitants, 0.2 m3 wastewater cap-1.d-1). In order to see if this can be expected to be a reasonable assumption related to the size of the hospital expressed as the number of beds and the wastewater produced some data available for Germany and The Netherlands were investigated:
Germany
The data discussed here are derived from Gartiser and Stiene (1999). The amount of wastewater for 8 selected hospitals ranges from 278 – 641 l.d-1.bed-1 with an average of 500 l.d-1.bed-1. The consumption of active ingredients – expressed as g.bed-1.d-1 - the 8 hospitals surveyed is presented in the table below; the number of observations is stated between parenthesis:
Group: Quats Alcohols Aldehydes Alkyl amines Guana-dines Surfaces (6) (8) (8) (5) (3) Average 2.13 0.94 0.78 0.46 0.06 Minimum 0.26 0.02 0.05 0.04 0.03
Instruments 1.38 0.94 0.36
Minimum: 0.33 0.00 0.14
Halogen releasers
N-acetals
Maximum 4.54 2.12 1.95 1.21 0.17
(8) (8) (6) (2) (3) Average 0.69 0.06
0.09 0.07 0.06 Maximum: 4.36 1.62 1.30 1.22 Group: Per-
compounds REST TOTAL (ex alcohols)
(1) (3) (0) (4)
Average 0.03 - 0.10 0.0002
Maximum . 0.07 0.22
(5) (5) (6) Average 0.17 0.30 0.38 0.23 Minimum: 0.02 0.03 0.03 Maximum: 0.29 0.74 1.33 0.98
Surfaces
0.71 3.08 Minimum . - 0.02
-
Instruments (5)
0.01
The Netherlands
Data on water consumption and Source
Number of hospitals 148 (-) CBS (1997) Number of beds
15,779,000 (y137,478 (-)
60.489 (-) CBS (1997) Number of patient days -1) CBS (1997) Number of employees CBS (1997) Amount of wastewater 133 – 270 (l.d-1.cap-1; patients + personnel) CUWVO (1986)
271
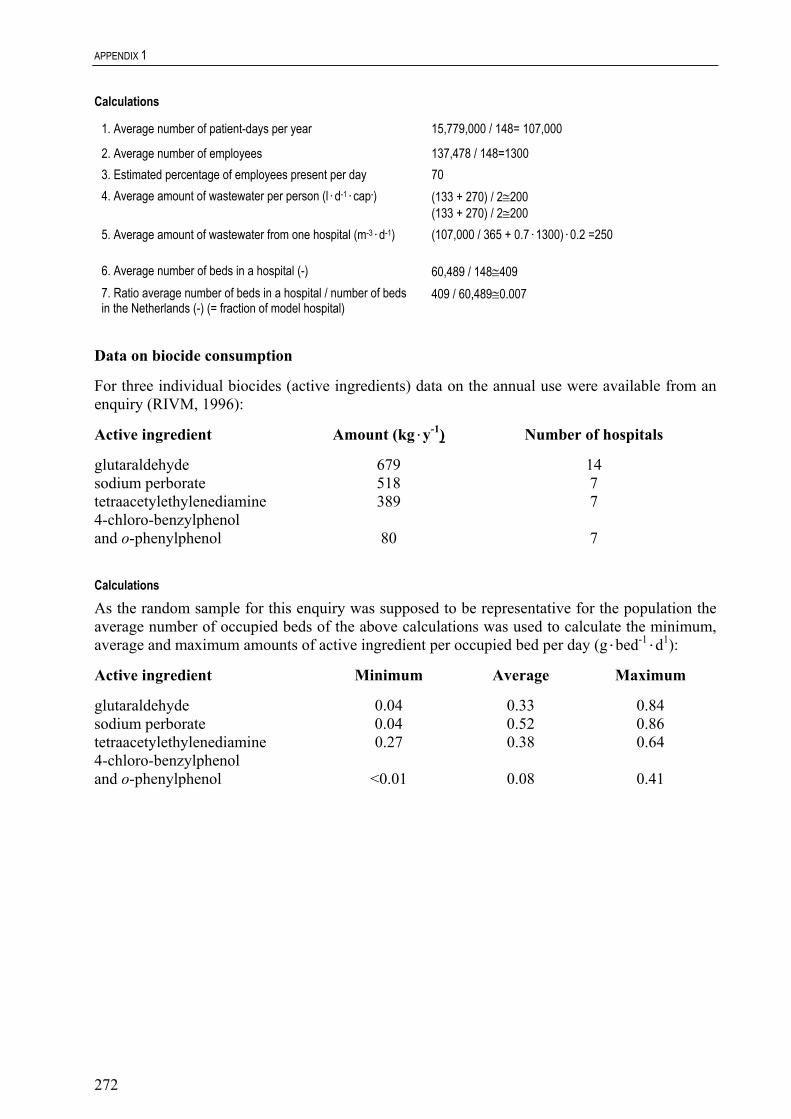
APPENDIX 1
Calculations
1. Average number of patient-days per year 15,779,000 / 148= 107,000
2. Average number of employees 137,478 / 148=1300 3. Estimated percentage of employees present per day 70 4. Average amount of wastewater per person (l.d-1.cap-) (133 + 270) / 2≅200
(133 + 270) / 2≅200 5. Average amount of wastewater from one hospital (m-3.d-1) (107,000 / 365 + 0.7.1300).0.2 =250
6. Average number of beds in a hospital (-) 60,489 / 148≅ 409 7. Ratio average number of beds in a hospital / number of beds in the Netherlands (-) (= fraction of model hospital)
409 / 60,489≅ 0.007
Data on biocide consumption
For three individual biocides (active ingredients) data on the annual use were available from an enquiry (RIVM, 1996):
Active ingredient Amount (kg.y-1) Number of hospitals
glutaraldehyde 679 14 sodium perborate 518 7 tetraacetylethylenediamine 389 7 4-chloro-benzylphenol and o-phenylphenol 80 7
Calculations
As the random sample for this enquiry was supposed to be representative for the population the average number of occupied beds of the above calculations was used to calculate the minimum, average and maximum amounts of active ingredient per occupied bed per day (g.bed-1.d1):
Active ingredient Minimum Average Maximum
glutaraldehyde 0.04 0.33 0.84 sodium perborate 0.04 0.52 0.86 tetraacetylethylenediamine 0.27 0.38 0.64 4-chloro-benzylphenol and o-phenylphenol <0.01 0.08 0.41
272

APPENDIX 2
Appendix 2 Differences between emission scenarios
In general two types of emission scenarios may be distinguished, one based on the regional tonnage and the other on the consumption.
1. Emission scenario based on tonnages
In general no regional tonnage will be known for an arbitrary substance. In that case the regional tonnage is derived from the EU tonnage by multiplication by 0.1 (10% rule). This is about twice the amount that may be expected on account of the fraction of inhabitants in the region of the EU (see 4). Such a situation will not be unlikely in most cases as it may be expected that the more densely populated areas will have more industrial activities than the rural areas.
For diffuse emissions caused by e.g. households the standard STP with 10,000 inhabitants feeding the system and an amount of 0.2 m3 wastewater per inhabitant per day is considered as a point source. If the use of a substance would be evenly distributed over the population (consumers) and STPs in a region and over the week, the fraction of this substance reaching the standard STP of EUSES would be number of inhabitants connected to the STP (Nlocal) / number of inhabitants in the region (N). This means a fraction of 10,000 / 20.0.106 = 0.0005 with the defaults of EUSES. As the use of (formualtion containing) substances never will be distrubuted evenly over the population and the week, a safety factor of four was assumed at the time. This means that the fraction of the main source = 0.002. This value is used in the emission tables of the TGD. There may be other applications where a point source is considered such as a hospital. In this report the fraction for the model hospital has been estimated to be 0.007. This fraction was calculated as from the average number of beds in a region per hospital and the total number of beds in that region.
2. Emission scenario based on the consumption
This type of emission scenarios apply either the average consumption per inhabitant or the – estimated – use in a process. An example of the average consumption is the use of soaps and detergents for cleaning and washing (l.cap-1.d-1 or g.cap-1.d-1). The emission scenario is simple and applies an emission factor, the concentration of the substance in the product (in this report a disinfectant for which the notifier has to specify the value) and the penetration factor (i.e. the fraction of the product on the market containing the specific substance). For a point source like a hospital it may be also the use of this kind of products (usually known in kg.y-1). The emission scenario is even more simple as there is no penetration factor needed. Only an emission factor and an amount of product used is needed besides the concentration of the substance in the product.
3. Tonnage versus Consumption
When a substance with diffuse emissions is assessed the scenarios based on the tonnage will produce emissions directly related to the volume of the use. This is an advantage compared to scenarios that are based on consumptions.
There are, however, also some disadvantages in using scenarios based on the tonnage; there is an uncertainty in the regional tonnage if this is not known and another uncertainty in the fraction reaching the standard STP.
The use of average consumptions has several disadvantages. First, there is no direct relation with the actual quantity of the disinfectant for the application in case of diffuse emissions. Second, the
273
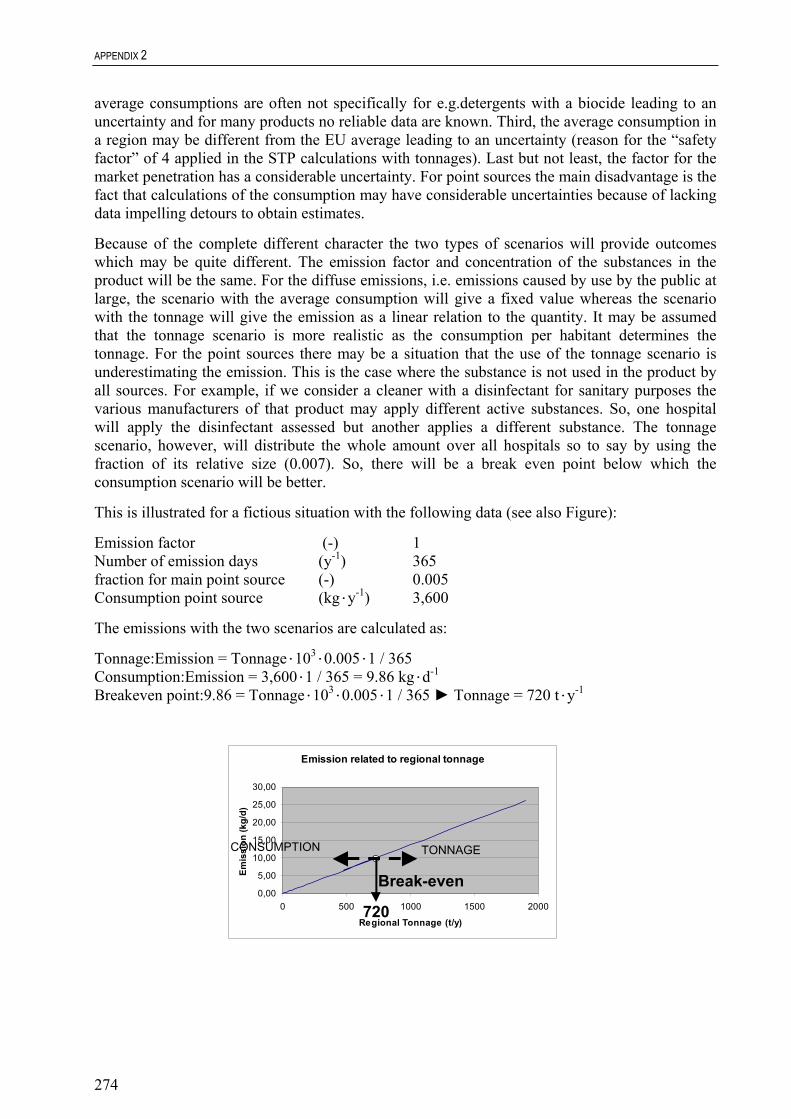
APPENDIX 2
average consumptions are often not specifically for e.g.detergents with a biocide leading to an uncertainty and for many products no reliable data are known. Third, the average consumption in a region may be different from the EU average leading to an uncertainty (reason for the “safety factor” of 4 applied in the STP calculations with tonnages). Last but not least, the factor for the market penetration has a considerable uncertainty. For point sources the main disadvantage is the fact that calculations of the consumption may have considerable uncertainties because of lacking data impelling detours to obtain estimates.
Because of the complete different character the two types of scenarios will provide outcomes which may be quite different. The emission factor and concentration of the substances in the product will be the same. For the diffuse emissions, i.e. emissions caused by use by the public at large, the scenario with the average consumption will give a fixed value whereas the scenario with the tonnage will give the emission as a linear relation to the quantity. It may be assumed that the tonnage scenario is more realistic as the consumption per habitant determines the tonnage. For the point sources there may be a situation that the use of the tonnage scenario is underestimating the emission. This is the case where the substance is not used in the product by all sources. For example, if we consider a cleaner with a disinfectant for sanitary purposes the various manufacturers of that product may apply different active substances. So, one hospital will apply the disinfectant assessed but another applies a different substance. The tonnage scenario, however, will distribute the whole amount over all hospitals so to say by using the fraction of its relative size (0.007). So, there will be a break even point below which the consumption scenario will be better.
This is illustrated for a fictious situation with the following data (see also Figure):
Emission factor (-) 1 Number of emission days (y-1) 365 fraction for main point source (-) 0.005 Consumption point source (kg.y-1) 3,600
The emissions with the two scenarios are calculated as:
Tonnage:Emission = Tonnage.103.0.005.1 / 365 Consumption:Emission = 3,600.1 / 365 = 9.86 kg.d-1 Breakeven point:9.86 = Tonnage.103.0.005.1 / 365 ► Tonnage = 720 t.y-1
Emission related to regional tonnage
0,00
5,00
10,00
15,00
20,00
25,00
30,00
0 500 1000 1500 2000
Regional Tonnage (t/y)
Emis
sion
(kg/
d)
720
Break-even
TONNAGE CONSUMPTION
274

APPENDIX 2
275
4. Number of inhabitants and area sizes in the TGD
In the TGD the area of the region is 200.200 km ore densely populated than the average region of that size elsewhere in the EU (total area of the EU 3.56.10 ber of inhabitants considered in the TGD is 2.10 .10number of inhabitants per km2 is 500 in the region and 104 in the EU. This means that the fraction of inhabitants in the region is 2.10 .10area 4.10 .10
2, which is m6 km2). The num
7 in the region and 3.7 8 in the EU. So, the
7 / 3.7 8 = 0.054 and the fraction of the regional 4 / 3.56 6 = 0.011.
F0 = 1 3.56•106 km2
F1 = 0.011 4•104 km2
F0 = 1 3.7•108 inh. F1 = 0.054 2•107
F3 = 0.0005 104
European Commission – Joint Research Centre Institute for Health and Consumer Protection European Chemicals Bureau (ECB) Technical Guidance Document on Risk Assessment in support of Commission Directive 93/67/EEC on Risk Assessment for new notified substances
Commission Regulation (EC) No 1488/94 on Risk Assessment for existing substances
Directive 98/8/EC of the European Parliament and of the Council concerning the placing of biocidal products on the market
Part IV
The mission of the JRC is to provide customer-driven scientific and technical supportfor the conception, development, implementation and monitoring of EU policies. As aservice of the European Commission, the JRC functions as a reference centre ofscience and technology for the Union. Close to the policy-making process, it serves thecommon interest of the Member States, while being independent of special interests,private or national.
OFFICE FOR OFFICIAL PUBLICATIONS OF THE EUROPEAN COMMUNITIES L – 2985 Luxembourg