Texas Oil and Gas Emissions Inventory Improvement Projects
36
Texas Oil and Gas Emissions Inventory Improvement Projects Michael Ege, Emissions Inventory Specialist Air Quality Division Texas Commission on Environmental Quality (TCEQ) Environmental Protection Agency (EPA)/States Oil and Gas Emissions Summit November 4, 2014
Transcript of Texas Oil and Gas Emissions Inventory Improvement Projects

Texas Oil and Gas Emissions Inventory Improvement Projects
Michael Ege, Emissions Inventory SpecialistAir Quality Division
Texas Commission on Environmental Quality (TCEQ)
Environmental Protection Agency (EPA)/StatesOil and Gas Emissions Summit
November 4, 2014

Air Quality Division • Texas Oil and Gas Emissions Inventory Improvement Projects • MEE • November 4, 2014 • Page 2
Overview
• Development of the TCEQ area source oil and gas calculator
• TCEQ oil and gas emissions inventory (EI) improvement projects:
– Barnett Shale Special Inventory
– Updated compressor engine profiles
– Review of other groups’ oil and gas EI’s
EPA Oil and Gas Emissions Estimation Tool
Alamo Area Council of Governments (AACOG) Eagle Ford Shale EI

Air Quality Division • Texas Oil and Gas Emissions Inventory Improvement Projects • MEE • November 4, 2014 • Page 3
Overview (Cont.)
• TCEQ-contracted oil and gas EI improvement projects:
– Condensate storage tanks
– Upstream oil and gas heaters and boilers
– Specified oil and gas well activities emissions inventory update
• Upcoming projects:
– Drilling rigs
– Volatile Organic Compound (VOC) controls
– Electric compressor motors
• Project reports posted on the TCEQ website
• Contact information

Air Quality Division • Texas Oil and Gas Emissions Inventory Improvement Projects • MEE • November 4, 2014 • Page 4
Development of the TCEQ Area Source Oil and Gas Calculator
• Eastern Research Group, Inc. (ERG) developed a set of two Excel spreadsheet calculators in a 2010 project.
• First used to develop Texas’ 2008 area source oil and gas EI.
• The TCEQ updates oil and gas activity data to develop EIs for other years as needed.
– Oil, natural gas, and condensate production
– Number of oil and gas wells

Air Quality Division • Texas Oil and Gas Emissions Inventory Improvement Projects • MEE • November 4, 2014 • Page 5
Development of the TCEQ Area Source Oil and Gas Calculator (Cont.)
• Equipment profiles and emission factors are from a variety of sources, including:
– ERG survey data;
– Central Regional Air Planning Association (CENRAP) 2008 study;
– Texas Environmental Research Consortium 2009 study on oil and condensate storage tanks; and
– The EPA’s Compilation of Air Pollutant Emission Factors (AP-42).
• Many of the original equipment profiles and emission factors were applied statewide.

Air Quality Division • Texas Oil and Gas Emissions Inventory Improvement Projects • MEE • November 4, 2014 • Page 6
TCEQ Oil and Gas EI Improvement Projects
• TCEQ continues to improve/update oil and gas emissions estimates by:
– Refining equipment profiles and emission factors to be basin and/or shale specific;
– Prioritizing research based on potential emissions;
– Researching sources that have limited published information; and
– Accounting for technological advances and new regulatory requirements.
• Between Fiscal Years 2010 and 2014, the Air Quality Division has funded $1.5 Million of oil and gas research projects.
$850,000 spent specifically on emissions inventory improvement projects

Air Quality Division • Texas Oil and Gas Emissions Inventory Improvement Projects • MEE • November 4, 2014 • Page 7
Texas’ Oil and GasBasins and Shale Plays

Air Quality Division • Texas Oil and Gas Emissions Inventory Improvement Projects • MEE • November 4, 2014 • Page 8
Barnett Shale Special Inventory
• The Barnett Shale is located in and around the Dallas-Fort Worth (DFW) area.
• The area experienced a significant increase in drilling activity starting around 2002.
• Between 2002 and 2008, the number of producing wells and natural gas production both increased by a factor of six.
• Drilling activity occurred near populated urban areas.

Air Quality Division • Texas Oil and Gas Emissions Inventory Improvement Projects • MEE • November 4, 2014 • Page 9
Barnett Shale Special Inventory (Cont.)
DallasFort Worth

Air Quality Division • Texas Oil and Gas Emissions Inventory Improvement Projects • MEE • November 4, 2014 • Page 10
Barnett Shale Special Inventory (Cont.)
• Phase I conducted in 2010 to collect site-level equipment summary data
– 9,100 upstream leases/facilities
– 500 midstream sites/facilities
• Phase II conducted in 2011 to collect source specific emissions data
– Focused on sources that had over one ton per year (tpy) of nitrogen oxides (NOx) or VOC emissions or over 0.1 tpy of Hazardous Air Pollutant emissions in 2009
– Information provided for 8,600 sites and 20,700 individual sources
1,900 compressor engines
2,800 condensate storage tanks
4,300 piping component fugitive areas

Air Quality Division • Texas Oil and Gas Emissions Inventory Improvement Projects • MEE • November 4, 2014 • Page 11
Barnett Shale Special Inventory (Cont.)
• Barnett Shale special inventory data has been used to improve emissions estimates for several source types.
• Updates made to the TCEQ Oil and Gas calculator include:
– Compressor engines;
Updated the DFW nonattainment area profile
Developed a Barnett Shale profile
Developed an East Texas profile that includes the effects of TCEQ Chapter 117 NOx emission limits
– Condensate storage tanks; and
– Piping component fugitives.

Air Quality Division • Texas Oil and Gas Emissions Inventory Improvement Projects • MEE • November 4, 2014 • Page 12
Barnett Shale Special Inventory (Cont.)
• Information about the Barnett Shale Special Inventory can be found at:
http://www.tceq.texas.gov/assets/public/implementation/air/ie/pseiforms/Barnett%20Shale%20Area%20Special%20Inventory.pdf
• An Excel spreadsheet containing county-level emissions data can be found at:
http://www.tceq.texas.gov/assets/public/implementation/air/ie/pseiforms/cnty-level-summary.xlsx

Air Quality Division • Texas Oil and Gas Emissions Inventory Improvement Projects • MEE • November 4, 2014 • Page 13
Updated CompressorEngine Profiles
An updated Barnett Shale compressor engine profile was developed using the Barnett Shale Phase II Special Inventory data.
– Data included 930 compressor engines in 15 Barnett Shale attainment counties.
– Data included 2009 NOX emissions, type of compressor engine (2 or 4 cycle, rich or lean burn), horsepower (hp) rating, hours of operation.
– An updated engine distribution was developed based on the engine workload (hp-hours) for each class of engine.
Air Quality Division • Texas Oil and Gas Emissions Inventory Improvement Projects • MEE • November 4, 2014 • Page 14
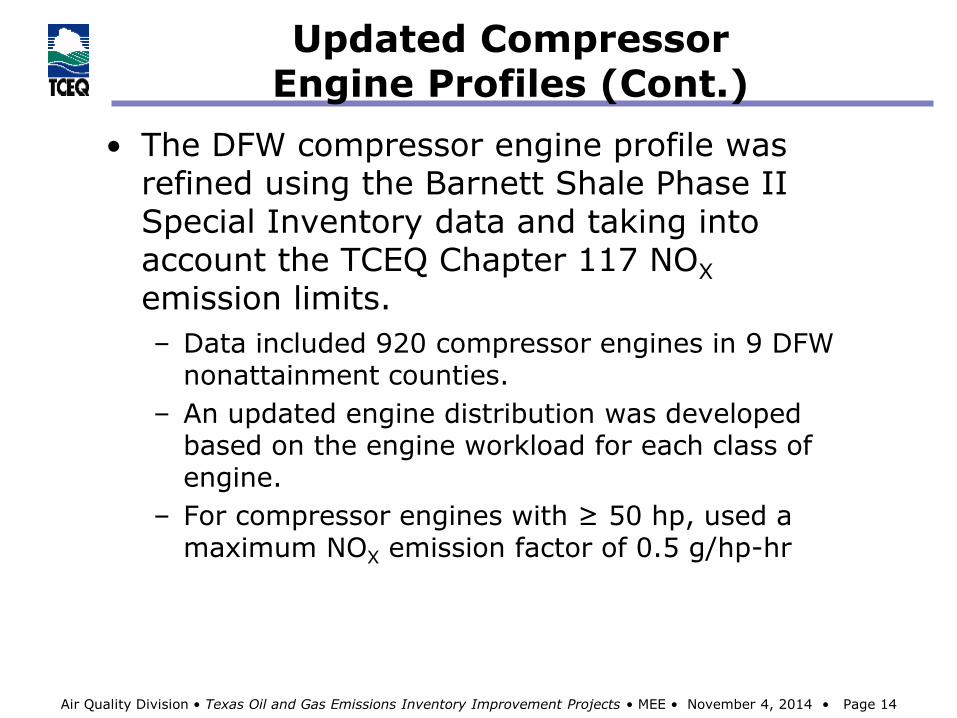
Updated CompressorEngine Profiles (Cont.)
• The DFW compressor engine profile was refined using the Barnett Shale Phase II Special Inventory data and taking into account the TCEQ Chapter 117 NOX
emission limits.
– Data included 920 compressor engines in 9 DFW nonattainment counties.
– An updated engine distribution was developed based on the engine workload for each class of engine.
– For compressor engines with ≥ 50 hp, used a maximum NOX emission factor of 0.5 g/hp-hr

Air Quality Division • Texas Oil and Gas Emissions Inventory Improvement Projects • MEE • November 4, 2014 • Page 15
Updated CompressorEngine Profiles (Cont.)
• An updated East Texas compressor engine profile was developed to take into account the TCEQ Chapter 117 NOX emission limits.
– Data included 930 compressor engines from the 15 attainment counties in the Barnett Shale Phase II Special Inventory.
– For rich-burn compressor engines ≥ 240 hp and < 500 hp, used a maximum NOX emission factor of 1.0 g/hp-hr
– For rich-burn compressor engines ≥ 500 hp, used a maximum NOX emission factor of 0.5 g/hp-hr

Air Quality Division • Texas Oil and Gas Emissions Inventory Improvement Projects • MEE • November 4, 2014 • Page 16
Review of Other Groups’Oil and Gas EI’s
EPA Oil and Gas Emissions Estimation Tool
– Added sources to the TCEQ calculator using default data taken from the EPA tool
Drilling mud degassing
Pneumatic pumps
Hydraulic pump engines
– Updated factors in the TCEQ calculator using newer factors from the EPA tool
Artificial lift pumps
Well completions
– Identified sources that require additional study

Air Quality Division • Texas Oil and Gas Emissions Inventory Improvement Projects • MEE • November 4, 2014 • Page 17
Review of Other Groups’Oil and Gas EI’s (Cont.)
AACOG Eagle Ford Shale EI
– Adjusted the number of active wells in the TCEQ calculator with the assumption that new wells completed in the current year are active on average for half the year
– Identified hydraulic pump engines as a source that needed additional study
AACOG’s hydraulic pump engine emissions estimates were higher than the EPA Oil and Gas Tool.

Air Quality Division • Texas Oil and Gas Emissions Inventory Improvement Projects • MEE • November 4, 2014 • Page 18
Condensate Storage Tank Project
• Condensate storage tanks were the largest source of oil and gas VOC emissions in Texas’ 2008 area source EI.
• Factors used for 2008 area source inventory
– 33.3 pounds VOC/barrel condensate, from 2006 Houston Advanced Research Center (HARC) H051C study
– 25% control factor state wide
• Factor based on measured test data
– 13 gas sites in Fort Worth basin
– 9 gas sites in Western Gulf basin
• Factor accounts for breathing, working, and flash loss emissions.

Air Quality Division • Texas Oil and Gas Emissions Inventory Improvement Projects • MEE • November 4, 2014 • Page 19
Condensate Storage Tank Project (Cont.)
• ERG contracted to develop updated factors for eight geographic areas of Texas.
• Data were obtained through:
– A literature review;
HARC H051C study
“Upstream Oil and Gas Storage Tank Project Flash Emissions Models Evaluation” (TCEQ, 2009)
“Upstream Oil and Gas Tank Emission Measurements” (TCEQ, 2010)
– An evaluation of data collected in the Barnett Shale Phase II Special Inventory; and
– A phone survey of Texas condensate producers during the summer of 2012.

Air Quality Division • Texas Oil and Gas Emissions Inventory Improvement Projects • MEE • November 4, 2014 • Page 20
Condensate Storage Tank Project (Cont.)
• Updated factors were determined using a production-weighted average
• Used only data from a TCEQ-approved method to determine flash emissions
• Data was weighted based on the flash emissions determination method:
Emissions Estimation Method Weight
Testing (Direct Measurement) 4
Process Simulator (HYSIM, HYSIS, VMG, PROMAX) 2
E&P TANK 1.5
Gas-Oil-Ratio 1

Air Quality Division • Texas Oil and Gas Emissions Inventory Improvement Projects • MEE • November 4, 2014 • Page 21
Updated Condensate TankVOC Emission Factors
RegionData
PointsPrevious Factor
Updated Factor
Reduction
Anadarko 26
33.3 lb/barrel (average
uncontrolled factor applied
to entire state)
3.15 91%
Eagle Ford Shale 41 10.5 68%
East Texas / Haynesville Shale
104 4.22 87%
Fort Worth / Barnett Shale
1,604 9.76 71%
Permian 21 7.07 79%
Western Gulf 37 11.0 67%
Palo Duro - 7.61a 77%
Marathon ThrustBelt
- 7.61a 77%
a Statewide average

Air Quality Division • Texas Oil and Gas Emissions Inventory Improvement Projects • MEE • November 4, 2014 • Page 22
Condensate Storage Tank Project (Cont.)
Reasons why the factor changed:
– Previous factor developed in 2006 using a limited data set (22 data points)
– 2012 ERG report based on more current data and a larger data set (1833 data points)
– Effects of new rules and permitting requirements
– Industry outreach
– Improved guidance for determining condensate storage tank emissions
– Production weighting of data to develop emissions factors
– Basin specific data and factors

Air Quality Division • Texas Oil and Gas Emissions Inventory Improvement Projects • MEE • November 4, 2014 • Page 23
Upstream Oil and GasHeaters and Boilers
• ERG contracted to develop updated equipment profiles for upstream oil and gas heaters and boilers for eight geographic regions in Texas.
• ERG researched NOX emission factors for these types of sources.

Air Quality Division • Texas Oil and Gas Emissions Inventory Improvement Projects • MEE • November 4, 2014 • Page 24
Upstream Oil and GasHeaters and Boilers (Cont.)
• The TCEQ Oil and Gas calculator used an equipment profile developed from 2008 CENRAP data:
• The TCEQ Oil and Gas calculator also used AP-42, Section 1.4 natural gas combustion emission factors for the 2011 EI.
Average # of
Heaters Per
Well
Average
Heater Size
(MMBtu/hr)
Average
Hours of
Operation
(hrs/yr)
Average Fuel
Heat Content
(Btu/scf)
0.91 0.64 4,076 1,209

Air Quality Division • Texas Oil and Gas Emissions Inventory Improvement Projects • MEE • November 4, 2014 • Page 25
Upstream Oil and GasHeaters and Boilers (Cont.)
Revised heater profiles were developed from survey data for six regions of Texas, and a statewide average was used for the rest of the state.
Basin
Average #
of Heaters
Per Well
Average
Heater Size
(MMBtu/hr)
Average
Hours of
Operation
(hrs/yr)
Average
Fuel Heat
Content
(Btu/scf)
Anadarko 1.35 0.658 5,483 1,116
Eagle Ford Shale 0.54 0.906 7,574 1,289
East Texas 0.0041 0.500 8,400 1,015
Arch Bend - Fort
Worth 0.15 0.500 1,414 1,040
Permian 0.37 0.525 3,477 1,359
Western Gulf 0.20 1.897 6,935 1,102
Marathon Thrust
Belta 0.44 0.831 5,547 1,154
Palo Duroa 0.44 0.831 5,547 1,154a Statewide average

Air Quality Division • Texas Oil and Gas Emissions Inventory Improvement Projects • MEE • November 4, 2014 • Page 26
Upstream Oil and GasHeaters and Boilers (Cont.)
• Updated the NOX emission factor from the AP-42 factor of 100 lb NOX/MMscf natural gas burned to a factor of 58.2 lbNOX/MMscf.
• The recommended emission factor for NOX
combustion is from the California Air Resources Board 1983 study “Emission Characteristics of Crude Oil Production Operations in California.”
• Statewide area source oil and gas NOX
emissions estimates decreased by 7.6%.

Air Quality Division • Texas Oil and Gas Emissions Inventory Improvement Projects • MEE • November 4, 2014 • Page 27
Specified Oil and Gas Well Activities Emissions Inventory Update
ERG contracted to:
– Develop updated emission factors and equipment profiles for hydraulic pump engines.
– Estimate the impact of New Source Performance Standards (NSPS) OOOO control requirements on oil and gas area source emissions estimates.

Air Quality Division • Texas Oil and Gas Emissions Inventory Improvement Projects • MEE • November 4, 2014 • Page 28
Hydraulic Pump Engines
TCEQ compared available hydraulic pump engine equipment profiles and emissions estimates and determined this source needed additional research.
Area
# Engines
per event
Engine hp
Engine Load
Factor
# Stages
per event
Hours per
stage
Total workload,
hp-hr
Anadarko Basin 10 1250 0.70 5.75 6.0 301,875
2012 CenSARAstudy averagea 3.5 1258 0.63 5.75 1.5 23,900
AACOG EagleFord Shale EI 12 2250 0.30 18.0 3.0 437,400
a Used for all of Texas except for the Anadarko Basin

Air Quality Division • Texas Oil and Gas Emissions Inventory Improvement Projects • MEE • November 4, 2014 • Page 29
Hydraulic Pump Engines (Cont.)
Revised equipment profiles were developed from survey data for four regions of Texas, and a statewide average was used for the rest of the state.
Area
#
Engines
per
event
Engine
hp
Engine
Load
Factor
#
Stages
per
event
Hours
per
stage
Total
workload,
hp-hr
Anadarko Basin 15 2200 0.48 10.4 1.58 254,563
Eagle Ford Shale 23 2290 0.76 16.6 2.28 1,223,667
East Texas Basin/Haynesville Shale 8 1814 0.36 2.1 1.04 11,271
Permian Basin 10 2313 0.36 16.8 1.38 266,639
Statewide
Average 14 2154 0.49 11.5 1.57 439,035

Air Quality Division • Texas Oil and Gas Emissions Inventory Improvement Projects • MEE • November 4, 2014 • Page 30
Hydraulic Pump Engines (Cont.)
• Using the updated equipment profiles, hydraulic pump engine NOX emissions estimates increased by 27,275 tpy.
• Statewide area source oil and gas NOX
emissions estimates increased by 15.7%.
NOX emissions increased from 173,992 tpy to 201,267 tpy.

Air Quality Division • Texas Oil and Gas Emissions Inventory Improvement Projects • MEE • November 4, 2014 • Page 31
NSPS OOOO Controls
• ERG evaluated the effect that NSPS OOOO controls would have on the TCEQ Oil and Gas calculator.
• Using 2013 lease-level production data from the Railroad Commission of Texas, updated emissions estimates were developed for:
– Gas well completions;
– Pneumatic devices;
– Oil storage tanks; and
– Condensate storage tanks.

Air Quality Division • Texas Oil and Gas Emissions Inventory Improvement Projects • MEE • November 4, 2014 • Page 32
NSPS OOOO Controls (Cont.)
• TCEQ is currently evaluating the NSPS OOOO updates developed by ERG.
• The project developed control estimates for 2013; new estimates may need to be developed for 2014 and future years to account for additional new sites subject to NSPS OOOO.
• Preliminary look at how NSPS OOOO controls will affect 2013 VOC emissions estimates:
Source Type % VOC reductions
Crude Oil Storage Tanks 11%
Condensate Storage Tanks 7%
Gas Well Completions 65%
Gas Well Pneumatic Devices 19%

Air Quality Division • Texas Oil and Gas Emissions Inventory Improvement Projects • MEE • November 4, 2014 • Page 33
Upcoming Projects
Drilling rigs
– Drilling rig engine profiles and emission factors were developed in a previous 2009 ERG project.
Horizontal wells
Vertical wells ≤ 7,000 feet
Vertical wells > 7,000 feet
– Upcoming project will update the engine profiles to account for a changing drill rig population:
Newer rigs will have engines that meet Tier 3 and Tier 4 emission standards.
Shift from diesel rigs to diesel-electric rigs
– Project will also estimate annual drilling activity and drilling rig engine emissions through 2040.

Air Quality Division • Texas Oil and Gas Emissions Inventory Improvement Projects • MEE • November 4, 2014 • Page 34
Upcoming Projects (Cont.)
• VOC controls
– Refine estimates for the amount of VOC controls on various oil and gas sources, including:
Crude oil storage tanks;
Condensate storage tanks; and
Loading losses.
– Determine the amount of combustion controls versus VOC capture
• Electric compressor motors
– Research the extent that electric compressor motors are being used in populated urban areas instead of natural gas fired compressor engines.

Air Quality Division • Texas Oil and Gas Emissions Inventory Improvement Projects • MEE • November 4, 2014 • Page 35
Project Reports postedon the TCEQ website
• Air Quality Research and Contract Reports can be found at:
http://www.tceq.texas.gov/airquality/airmod/project/pj_report_ei.html
• Reports include:
– Specified Oil and Gas Well Activities Emissions Inventory Update
– Upstream Oil and Gas Heaters and Boilers
– Condensate Tank Oil and Gas Activities
– Forecasting Oil and Gas Activities
– Development of Texas Statewide Drilling Rigs Emission Inventories for the years 1990, 1993, 1996, and 1999 through 2040
– Emission Factor Determination for Produced Water Storage Tanks

Air Quality Division • Texas Oil and Gas Emissions Inventory Improvement Projects • MEE • November 4, 2014 • Page 36
Contact Information
• Michael Ege
– (512) 239-5706
• TCEQ area source Web page
http://www.tceq.texas.gov/airquality/areasource