
Texas Association of REALTORS Winter Meeting...
47
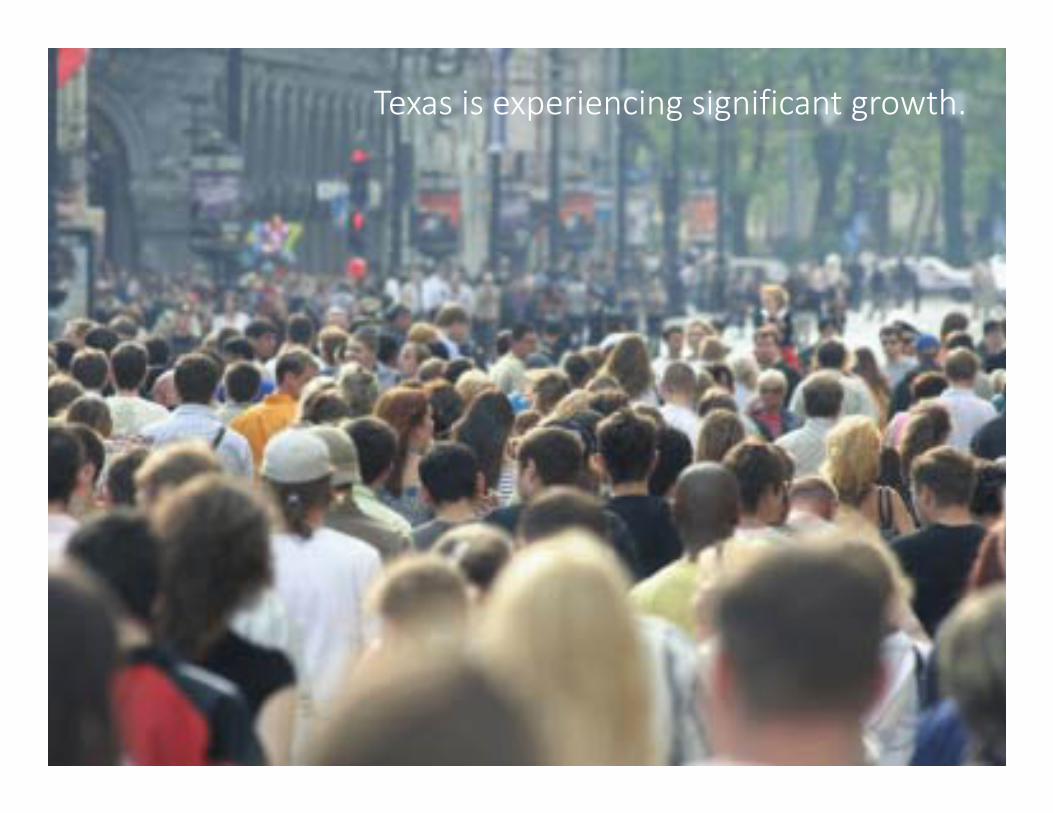
Texas Demographic Trends, Characteristics, and Projections Texas Association of REALTORS Winter Meeting February 10, 2018 @TexasDemography
-
Upload
duonghuong -
Category
Documents
-
view
215 -
download
1
Transcript of Texas Association of REALTORS Winter Meeting...

Texas Demographic Trends, Characteristics, and Projections
Texas Association of REALTORSWinter MeetingFebruary 10, 2018
@TexasDemography
Texas is experiencing significant growth.
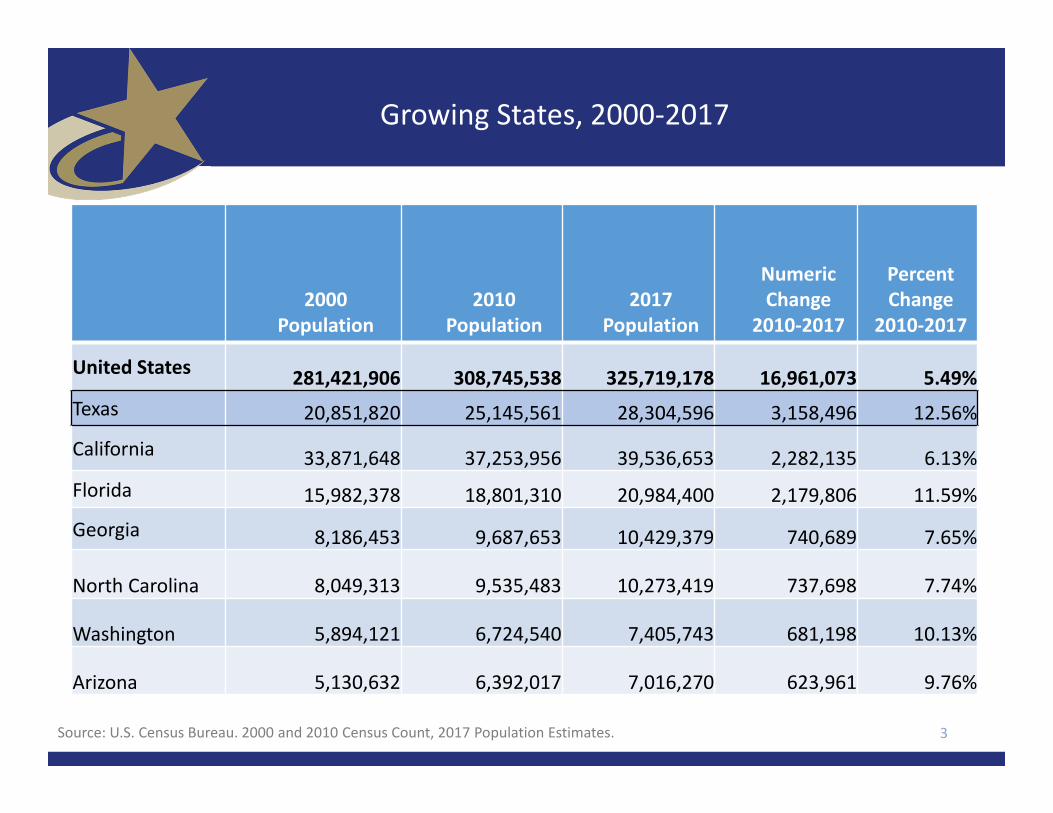
Growing States, 2000‐2017
3
2000Population
2010Population
2017 Population
NumericChange
2010‐2017
PercentChange
2010‐2017
United States 281,421,906 308,745,538 325,719,178 16,961,073 5.49%Texas 20,851,820 25,145,561 28,304,596 3,158,496 12.56%
California 33,871,648 37,253,956 39,536,653 2,282,135 6.13%Florida 15,982,378 18,801,310 20,984,400 2,179,806 11.59%
Georgia 8,186,453 9,687,653 10,429,379 740,689 7.65%
North Carolina 8,049,313 9,535,483 10,273,419 737,698 7.74%
Washington 5,894,121 6,724,540 7,405,743 681,198 10.13%
Arizona 5,130,632 6,392,017 7,016,270 623,961 9.76%
Source: U.S. Census Bureau. 2000 and 2010 Census Count, 2017 Population Estimates.

Pecos
Brewster
Webb
Hudspeth
PresidioTerrell
CulbersonReeves
Val Verde
Crockett
Hill
Duval
Harris
Frio
Bell
Kerr
Kenedy
Starr
Polk
Clay
Edwards
Irion
Hall
Ellis
Jeff Davis
Sutton
Uvalde
Bee
Hale
Dallam
Leon
Bexar
Gaines
Hidalgo
Upton
Hartley
King
Erath
Jack
Kinney
Kent
Zavala
Brazoria
Tyler
GrayOldham
Dimmit
CassLynn HuntWise
La Salle
Rusk
Kimble
Lamb
Medina
Floyd
Terry
Coke
Llano
Liberty
Ector
Andrews
Milam
Travis Lee
Knox
Mills
Smith
Falls
Ward
Collin
Jones
Nolan
Potter
Burnet
Cottle
Nueces
Taylor
Zapata
Real
Coryell
Bowie
Motley
Young
Lamar
Martin
Garza
DallasFisher
Moore
Baylor
Kleberg
Archer
Scurry
Cameron
Cooke
Mason
Parker
Castro
Navarro
Brooks
Hardin
Deaf Smith
Lavaca
Donley
Hays
Goliad
Denton
El Paso
Fannin
Tarrant
Crane
Carson
Crosby
Borden
Schleicher
Gillespie
Shelby
Foard
Wood
Menard
Panola
Walker
Winkler
Harrison
Eastland
Loving
Bandera
Wichita
Hood
Matagorda
Brown
Reagan Houston
Maverick
Jasper
Coleman
Tom Green
Bailey
DeWittAtascosa
Bosque
Wharton
Concho
Runnels
Fayette
Haskell
Calhoun
Newton
Live Oak
Randall
Sterling
Jefferson
Briscoe
McMullen
Parmer
Jim Hogg
Mitchell
Wilson
Victoria
Trinity
Roberts
Howard
Bastrop
Grayson
San Saba
Midland
Hockley Dickens
Swisher
Gonzales
Anderson
Dawson
Willacy
Grimes
Wheeler
Cherokee
Colorado
Lubbock
Karnes
Red River
Refugio
Austin
Hemphill
Williamson
Jackson
Blanco
Ochiltree
McCulloch
Sherman
Wilbarger
Hansford
Callahan
McLennan
Yoakum
Angelina
Hopkins
Lipscomb
StephensPalo Pinto
Stonewall
Hamilton
MontagueCochran
Jim Wells
Limestone
Kaufman
Fort Bend
Titus
Comal
Armstrong
Kendall
FreestoneComancheGlasscock
Johnson
Galveston
Henderson
Montgomery
Brazos
Van Zandt
Chambers
Robertson
Waller
Sabine
Upshur
Hutchinson
Shackelford
Childress
Burleson
Nacogdoches
Lampasas
Collingsworth
Hardeman
Throckmorton
Guadalupe
Caldwell
Aransas
Marion
San Patricio
Madison
San Jacinto
Delta
Washington Orange
Rains
Gregg
Morris
San Augustine
Franklin
Somervell
Rockwall
Total Estimated Population by County, Texas, 2016
Source: U.S. Census Bureau, 2016 Vintage Population Estimates
113 - 10,000
10,001 - 50,000
50,001 - 100,000
100,001 - 500,000
500,001 - 4,589,928

Pecos
Brewster
Webb
Hudspeth
PresidioTerrell
CulbersonReeves
Val Verde
Crockett
Hill
Duval
Harris
Frio
Bell
Kerr
Kenedy
Starr
Polk
Clay
Edwards
Irion
Hall
Ellis
Jeff Davis
Sutton
Uvalde
Bee
Hale
Dallam
Leon
Bexar
Gaines
Hidalgo
Upton
Hartley
King
Erath
Jack
Kinney
Kent
Zavala
Brazoria
Tyler
GrayOldham
Dimmit
CassLynn HuntWise
La Salle
Rusk
Kimble
Lamb
Medina
Floyd
Terry
Coke
Llano
Liberty
Ector
Andrews
Milam
Travis Lee
Knox
Mills
Smith
Falls
Ward
Collin
Jones
Nolan
Potter
Burnet
Cottle
Nueces
Taylor
Zapata
Real
Coryell
Bowie
Motley
Young
Lamar
Martin
Garza
DallasFisher
Moore
Baylor
Kleberg
Archer
Scurry
Cameron
Cooke
Mason
Parker
Castro
Navarro
Brooks
Hardin
Deaf Smith
Lavaca
Donley
Hays
Goliad
Denton
El Paso
Fannin
Tarrant
Crane
Carson
Crosby
Borden
Schleicher
Gillespie
Shelby
Foard
Wood
Menard
Panola
Walker
Winkler
Harrison
Eastland
Loving
Bandera
Wichita
Hood
Matagorda
Brown
Reagan Houston
Maverick
Jasper
Coleman
Tom Green
Bailey
DeWittAtascosa
Bosque
Wharton
Concho
Runnels
Fayette
Haskell
Calhoun
Newton
Live Oak
Randall
Sterling
Jefferson
Briscoe
McMullen
Parmer
Jim Hogg
Mitchell
Wilson
Victoria
Trinity
Roberts
Howard
Bastrop
Grayson
San Saba
Midland
Hockley Dickens
Swisher
Gonzales
Anderson
Dawson
Willacy
Grimes
Wheeler
Cherokee
Colorado
Lubbock
Karnes
Red River
Refugio
Austin
Hemphill
Williamson
Jackson
Blanco
Ochiltree
McCulloch
Sherman
Wilbarger
Hansford
Callahan
McLennan
Yoakum
Angelina
Hopkins
Lipscomb
StephensPalo Pinto
Stonewall
Hamilton
MontagueCochran
Jim Wells
Limestone
Kaufman
Fort Bend
Titus
Comal
Armstrong
Kendall
FreestoneComancheGlasscock
Johnson
Galveston
Henderson
Montgomery
Brazos
Van Zandt
Chambers
Robertson
Waller
Sabine
Upshur
Hutchinson
Shackelford
Childress
Burleson
Nacogdoches
Lampasas
Collingsworth
Hardeman
Throckmorton
Guadalupe
Caldwell
Aransas
Marion
San Patricio
Madison
San Jacinto
Delta
Washington Orange
Rains
Gregg
Morris
San Augustine
Franklin
Somervell
Rockwall
Estimated Population Change, Texas Counties, 2010 to 2016
5Source: U.S. Census Bureau, 2016 Vintage Population Estimates
96 counties lost population over the 6 year period.
-2,010 - 0
1 - 1,000
1,001 - 20,000
20,001 - 100,000
100,001 - 497,469

Estimated Percent Change of the Total Population by County, Texas, 2010 to 2016
6Source: U.S. Census Bureau, 2016 Vintage Population Estimates
Pecos
Brewster
Webb
Hudspeth
PresidioTerrell
CulbersonReeves
Val Verde
Crockett
Hill
Duval
Harris
Frio
Bell
Kerr
Kenedy
Starr
Polk
Clay
Edwards
Irion
Hall
Ellis
Jeff Davis
Sutton
Uvalde
Bee
Hale
Dallam
Leon
Bexar
Gaines
Hidalgo
Upton
Hartley
King
Erath
Jack
Kinney
Kent
Zavala
Brazoria
Tyler
GrayOldham
Dimmit
CassLynn HuntWise
La Salle
Rusk
Kimble
Lamb
Medina
Floyd
Terry
Coke
Llano
Liberty
Ector
Andrews
Milam
Travis Lee
Knox
Mills
Smith
Falls
Ward
Collin
Jones
Nolan
Potter
Burnet
Cottle
Nueces
Taylor
Zapata
Real
Coryell
Bowie
Motley
Young
Lamar
Martin
Garza
DallasFisher
Moore
Baylor
Kleberg
Archer
Scurry
Cameron
Cooke
Mason
Parker
Castro
Navarro
Brooks
Hardin
Deaf Smith
Lavaca
Donley
Hays
Goliad
Denton
El Paso
Fannin
Tarrant
Crane
Carson
Crosby
Borden
Schleicher
Gillespie
Shelby
Foard
Wood
Menard
Panola
Walker
Winkler
Harrison
Eastland
Loving
Bandera
Wichita
Hood
Matagorda
Brown
Reagan Houston
Maverick
Jasper
Coleman
Tom Green
Bailey
DeWittAtascosa
Bosque
Wharton
Concho
Runnels
Fayette
Haskell
Calhoun
Newton
Live Oak
Randall
Sterling
Jefferson
Briscoe
McMullen
Parmer
Jim Hogg
Mitchell
Wilson
Victoria
Trinity
Roberts
Howard
Bastrop
Grayson
San Saba
Midland
Hockley Dickens
Swisher
Gonzales
Anderson
Dawson
Willacy
Grimes
Wheeler
Cherokee
Colorado
Lubbock
Karnes
Red River
Refugio
Austin
Hemphill
Williamson
Jackson
Blanco
Ochiltree
McCulloch
Sherman
Wilbarger
Hansford
Callahan
McLennan
Yoakum
Angelina
Hopkins
Lipscomb
StephensPalo Pinto
Stonewall
Hamilton
MontagueCochran
Jim Wells
Limestone
Kaufman
Fort Bend
Titus
Comal
Armstrong
Kendall
FreestoneComancheGlasscock
Johnson
Galveston
Henderson
Montgomery
Brazos
Van Zandt
Chambers
Robertson
Waller
Sabine
Upshur
Hutchinson
Shackelford
Childress
Burleson
Nacogdoches
Lampasas
Collingsworth
Hardeman
Throckmorton
Guadalupe
Caldwell
Aransas
Marion
San Patricio
Madison
San Jacinto
Delta
Washington Orange
Rains
Gregg
Morris
San Augustine
Franklin
Somervell
Rockwall
-4.8% - 0%
0.1% - 2.5%
2.6% - 5%
5.1% - 10%
10.1% - 18.1%

Population Percent Change for Texas Counties, 2015 to 2016
7
No Growth (0% or less)
Slow Growth (.01% to 1.56%)Fast Growth (1.57% or Greater)Big Four MSAs
Source: U.S. Census Bureau, 2016 Population Estimates
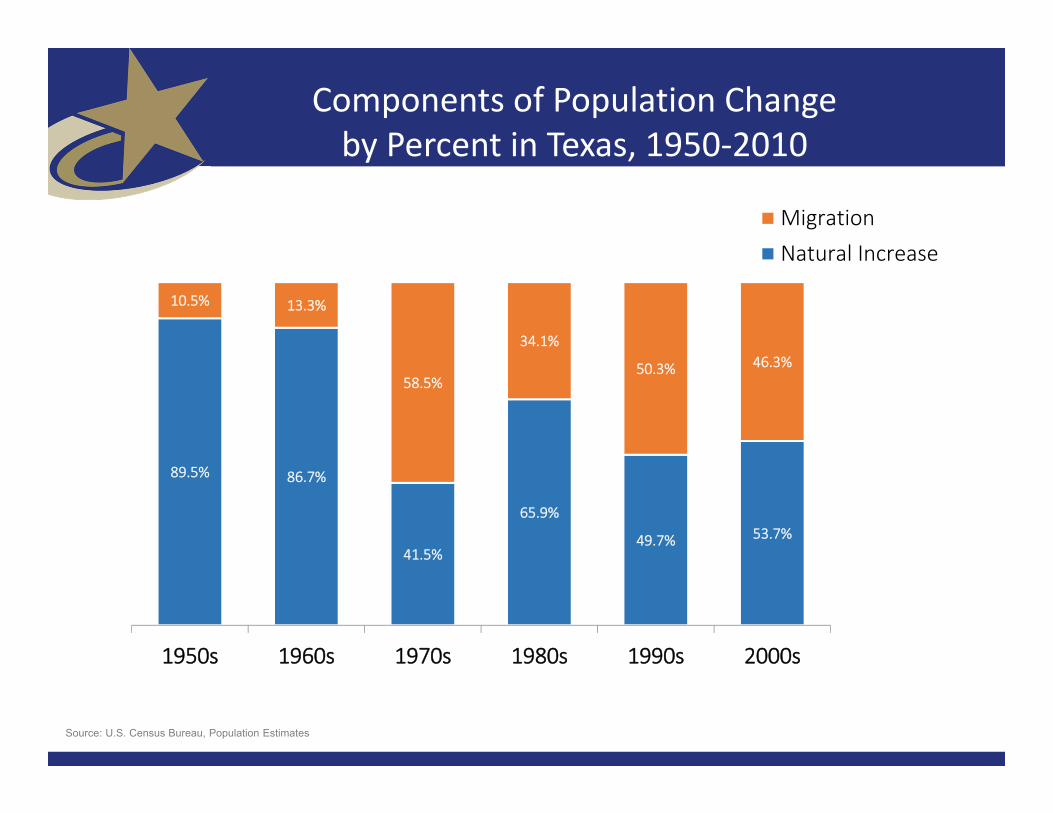
89.5% 86.7%
41.5%
65.9%
49.7% 53.7%
10.5% 13.3%
58.5%
34.1%
50.3% 46.3%
1950s 1960s 1970s 1980s 1990s 2000s
MigrationNatural Increase
Components of Population Change by Percent in Texas, 1950‐2010
Source: U.S. Census Bureau, Population Estimates
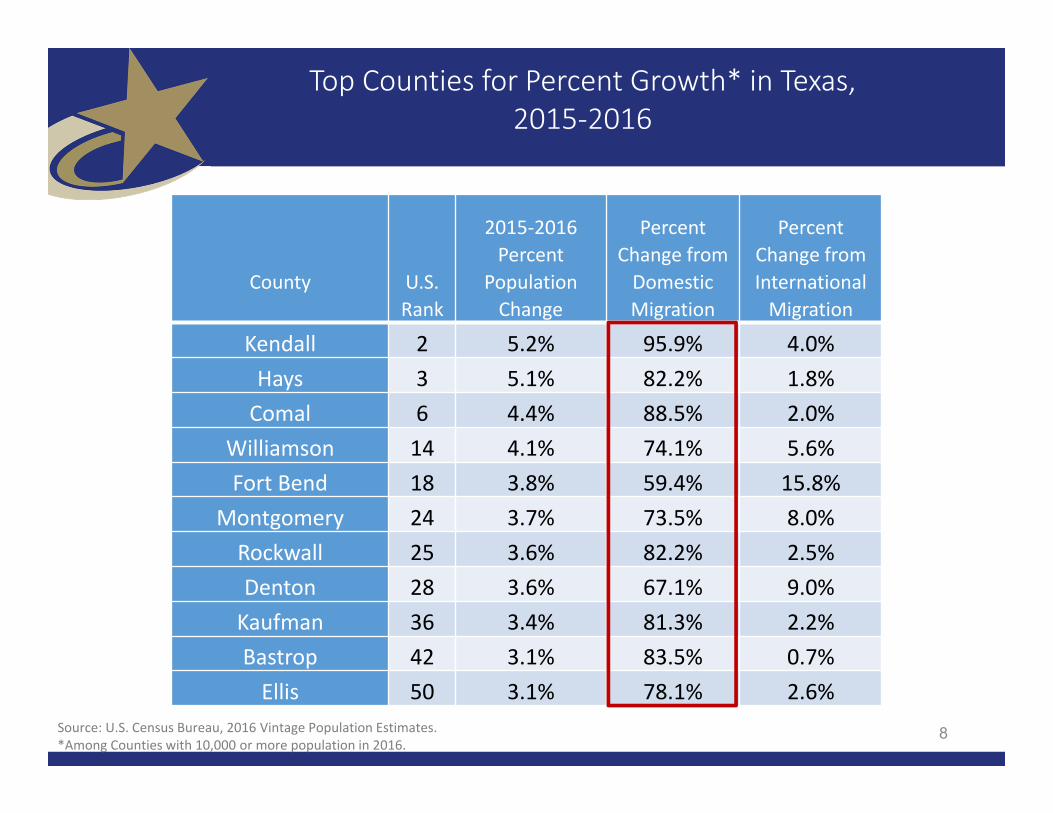
Top Counties for Percent Growth* in Texas, 2015‐2016
8Source: U.S. Census Bureau, 2016 Vintage Population Estimates.*Among Counties with 10,000 or more population in 2016.
County U.S. Rank
2015‐2016Percent
Population Change
Percent Change from Domestic Migration
Percent Change from InternationalMigration
Kendall 2 5.2% 95.9% 4.0%Hays 3 5.1% 82.2% 1.8%Comal 6 4.4% 88.5% 2.0%
Williamson 14 4.1% 74.1% 5.6%Fort Bend 18 3.8% 59.4% 15.8%
Montgomery 24 3.7% 73.5% 8.0%Rockwall 25 3.6% 82.2% 2.5%Denton 28 3.6% 67.1% 9.0%Kaufman 36 3.4% 81.3% 2.2%Bastrop 42 3.1% 83.5% 0.7%Ellis 50 3.1% 78.1% 2.6%
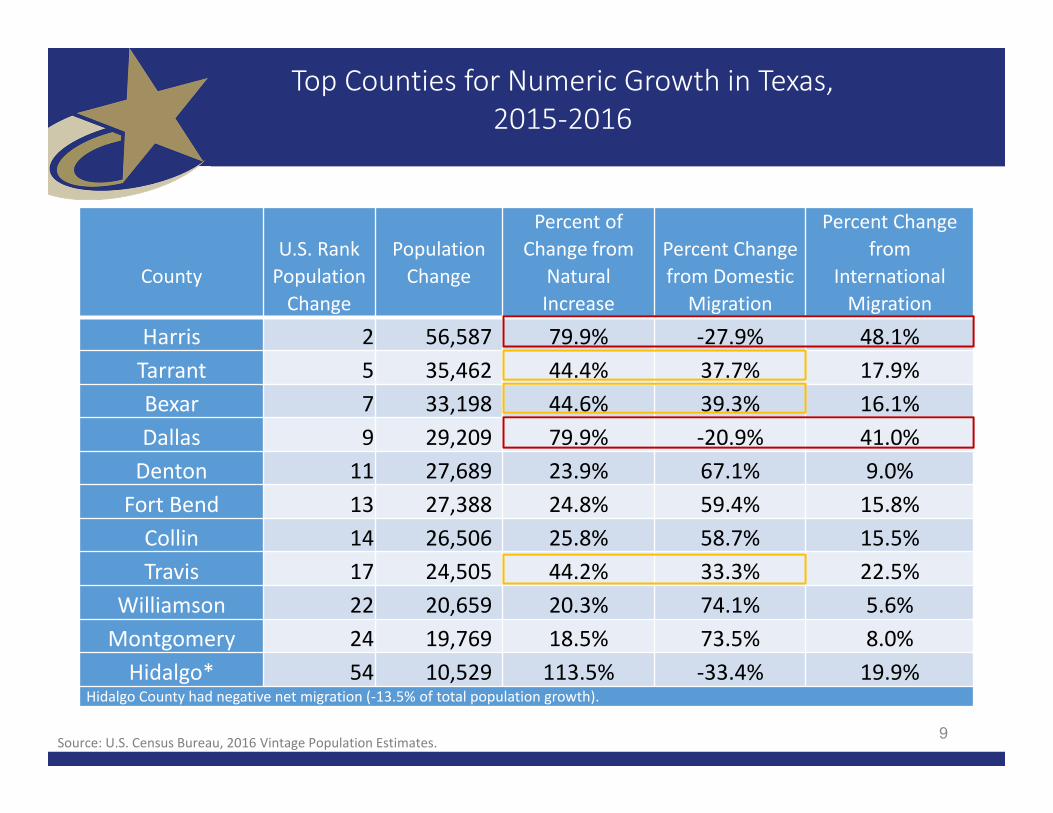
Top Counties for Numeric Growth in Texas, 2015‐2016
9Source: U.S. Census Bureau, 2016 Vintage Population Estimates.
CountyU.S. Rank Population Change
Population Change
Percent of Change from
Natural Increase
Percent Changefrom Domestic
Migration
Percent Change from
International Migration
Harris 2 56,587 79.9% ‐27.9% 48.1%Tarrant 5 35,462 44.4% 37.7% 17.9%Bexar 7 33,198 44.6% 39.3% 16.1%Dallas 9 29,209 79.9% ‐20.9% 41.0%Denton 11 27,689 23.9% 67.1% 9.0%Fort Bend 13 27,388 24.8% 59.4% 15.8%Collin 14 26,506 25.8% 58.7% 15.5%Travis 17 24,505 44.2% 33.3% 22.5%
Williamson 22 20,659 20.3% 74.1% 5.6%Montgomery 24 19,769 18.5% 73.5% 8.0%Hidalgo* 54 10,529 113.5% ‐33.4% 19.9%
Hidalgo County had negative net migration (‐13.5% of total population growth).

‐3.4% ‐2.9% ‐2.9% ‐2.8% ‐2.5%
‐0.3% ‐0.1%
4.5% 4.9% 5.1% 5.1%5.9%
7.1%
9.5%10.4%
13.2%
22.1%
‐5.0%
0.0%
5.0%
10.0%
15.0%
20.0%
25.0%
Estimated Percent of Total Net‐Migrant Flows to and From Texas and Other States, 2015
Source: U.S. Census Bureau, 2016. ACS Migration Flows, 2015

Texas continues to diversify.
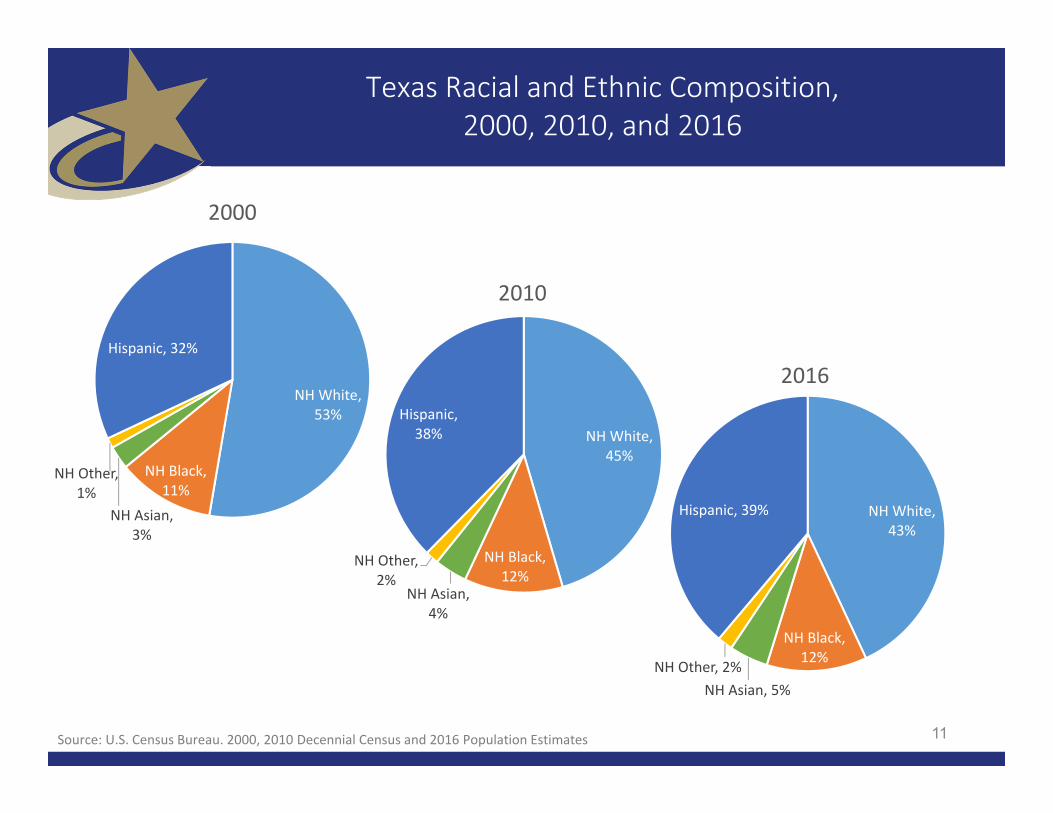
Texas Racial and Ethnic Composition, 2000, 2010, and 2016
Source: U.S. Census Bureau. 2000, 2010 Decennial Census and 2016 Population Estimates 11
NH White, 53%
NH Black, 11%
NH Asian, 3%
NH Other, 1%
Hispanic, 32%
2000
NH White, 43%
NH Black, 12%
NH Asian, 5%NH Other, 2%
Hispanic, 39%
2016
NH White, 45%
NH Black, 12%
NH Asian, 4%
NH Other, 2%
Hispanic, 38%
2010
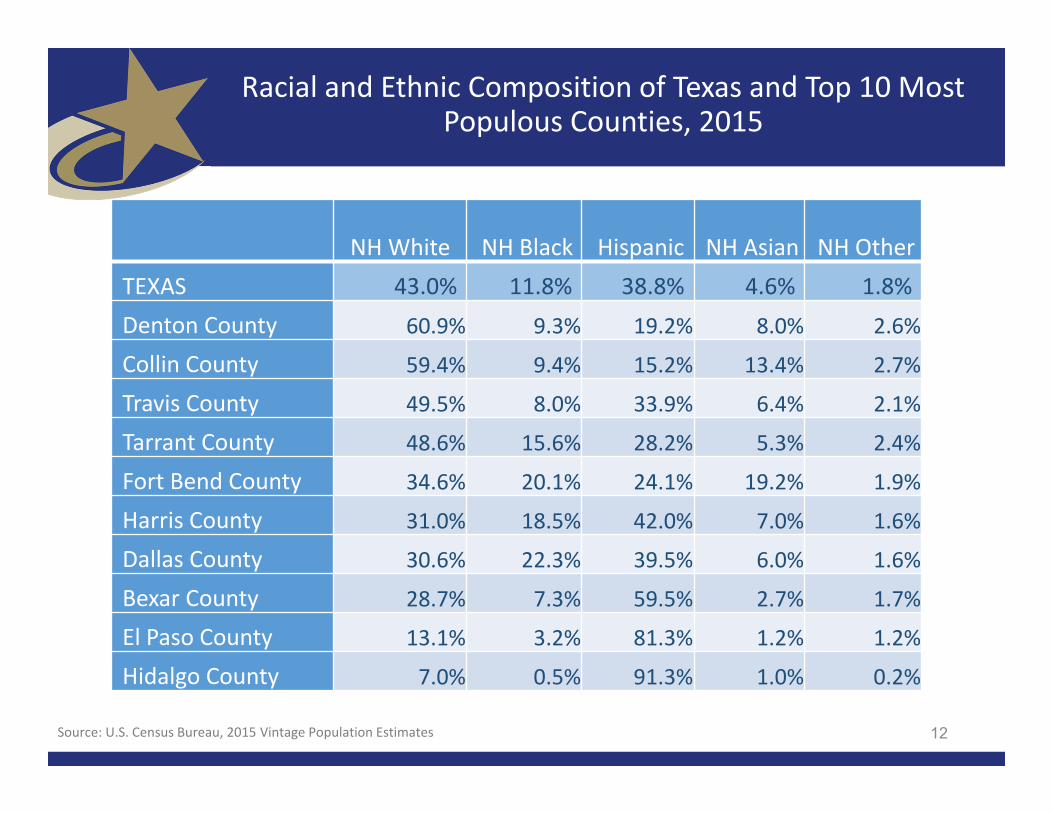
Racial and Ethnic Composition of Texas and Top 10 Most Populous Counties, 2015
NH White NH Black Hispanic NH Asian NH OtherTEXAS 43.0% 11.8% 38.8% 4.6% 1.8%Denton County 60.9% 9.3% 19.2% 8.0% 2.6%
Collin County 59.4% 9.4% 15.2% 13.4% 2.7%
Travis County 49.5% 8.0% 33.9% 6.4% 2.1%
Tarrant County 48.6% 15.6% 28.2% 5.3% 2.4%
Fort Bend County 34.6% 20.1% 24.1% 19.2% 1.9%
Harris County 31.0% 18.5% 42.0% 7.0% 1.6%
Dallas County 30.6% 22.3% 39.5% 6.0% 1.6%
Bexar County 28.7% 7.3% 59.5% 2.7% 1.7%
El Paso County 13.1% 3.2% 81.3% 1.2% 1.2%
Hidalgo County 7.0% 0.5% 91.3% 1.0% 0.2%
Source: U.S. Census Bureau, 2015 Vintage Population Estimates 12

Population Pyramids for Hispanics and Non‐Hispanic Whites in Texas, 2010
15
16
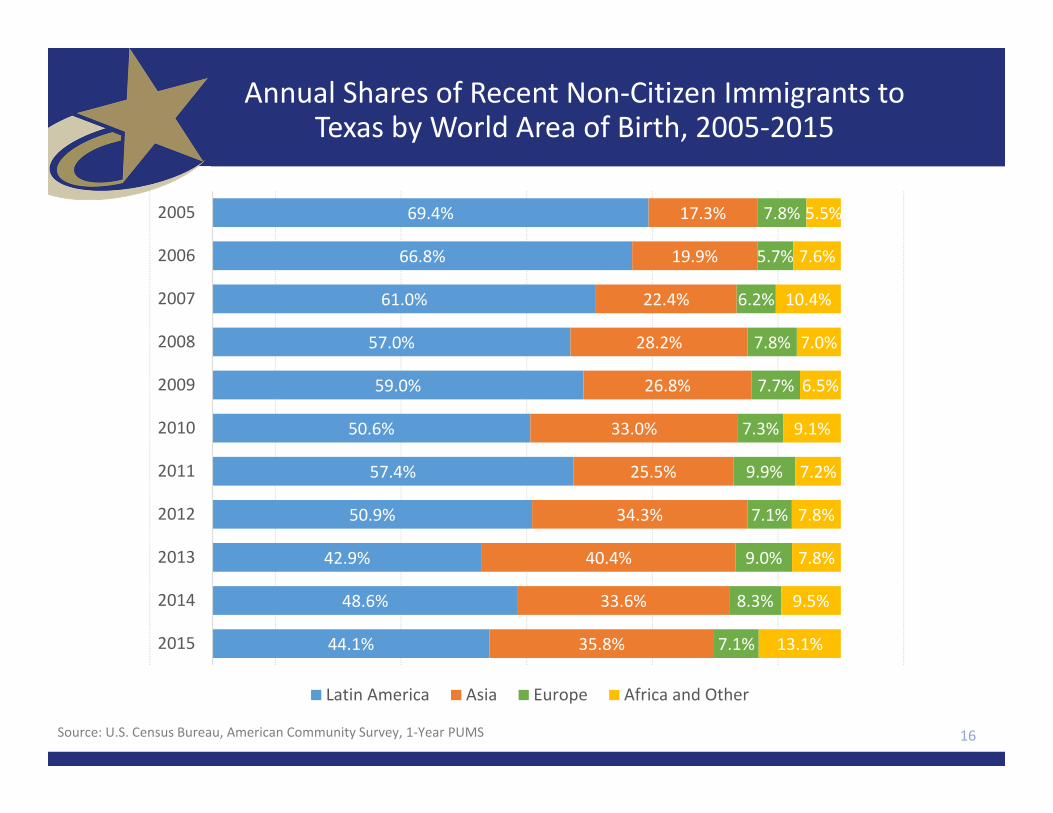
Annual Shares of Recent Non‐Citizen Immigrants to Texas by World Area of Birth, 2005‐2015
69.4%
66.8%
61.0%
57.0%
59.0%
50.6%
57.4%
50.9%
42.9%
48.6%
44.1%
17.3%
19.9%
22.4%
28.2%
26.8%
33.0%
25.5%
34.3%
40.4%
33.6%
35.8%
7.8%
5.7%
6.2%
7.8%
7.7%
7.3%
9.9%
7.1%
9.0%
8.3%
7.1%
5.5%
7.6%
10.4%
7.0%
6.5%
9.1%
7.2%
7.8%
7.8%
9.5%
13.1%
2005
2006
2007
2008
2009
2010
2011
2012
2013
2014
2015
Latin America Asia Europe Africa and Other
Source: U.S. Census Bureau, American Community Survey, 1‐Year PUMS
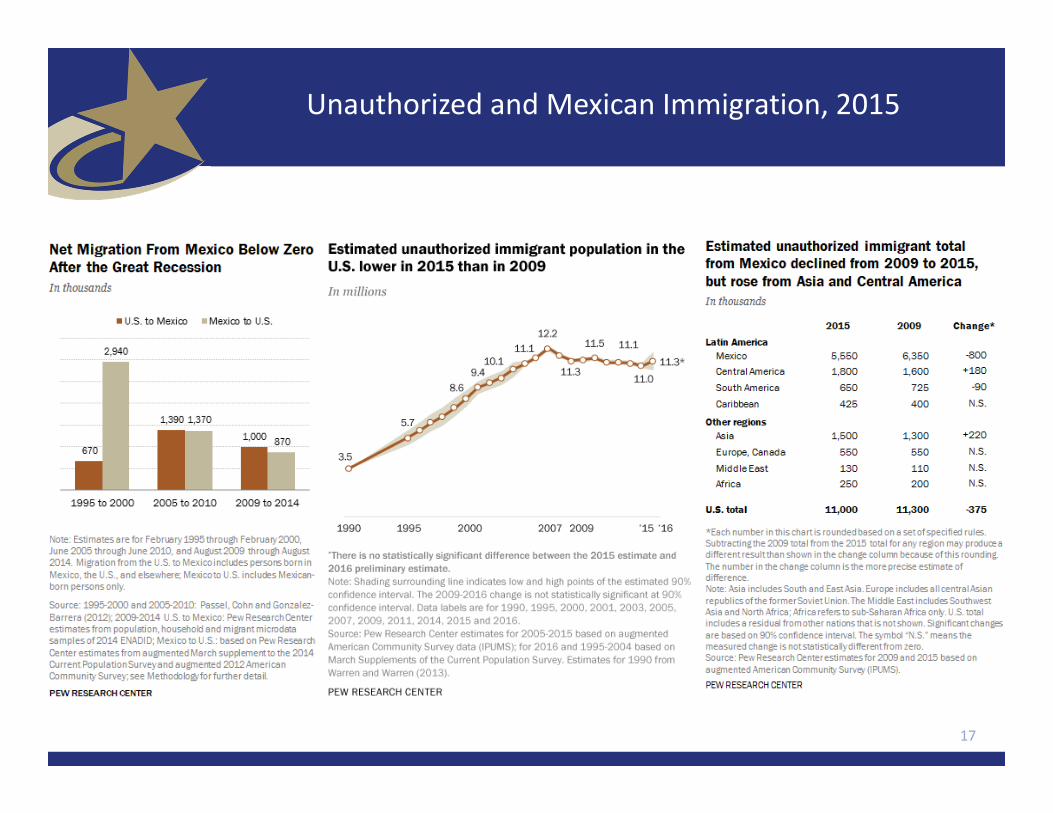
Unauthorized and Mexican Immigration, 2015
17

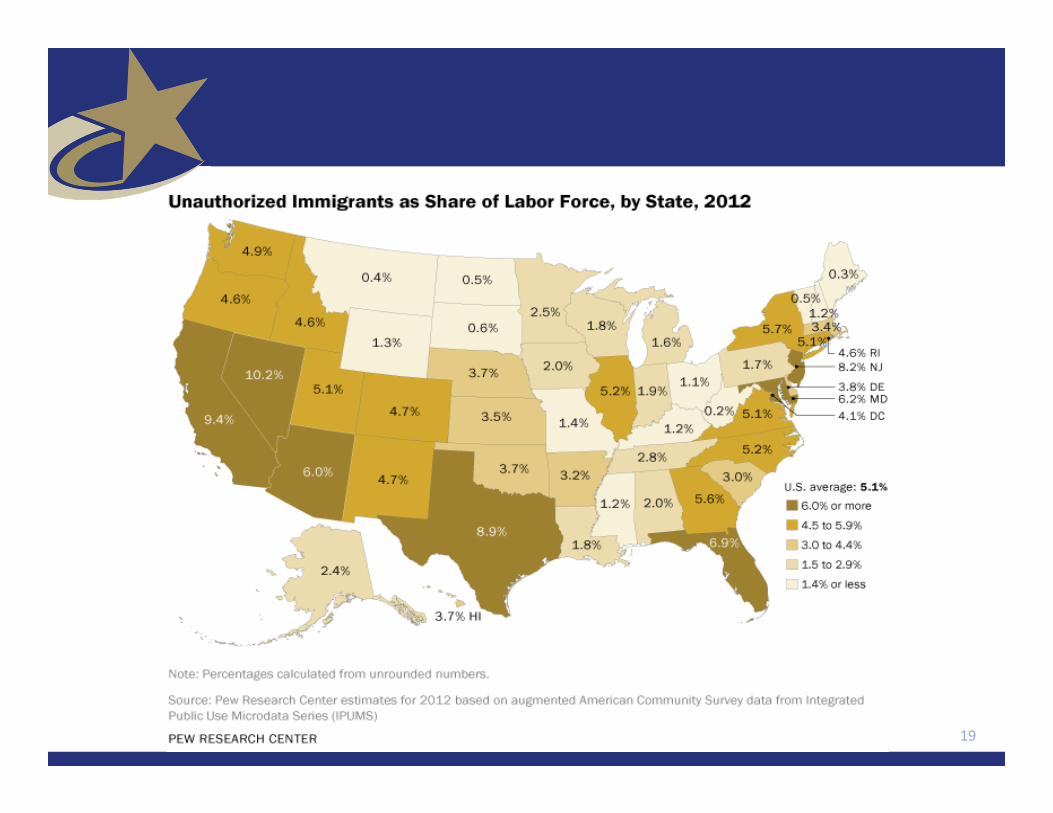
18
19
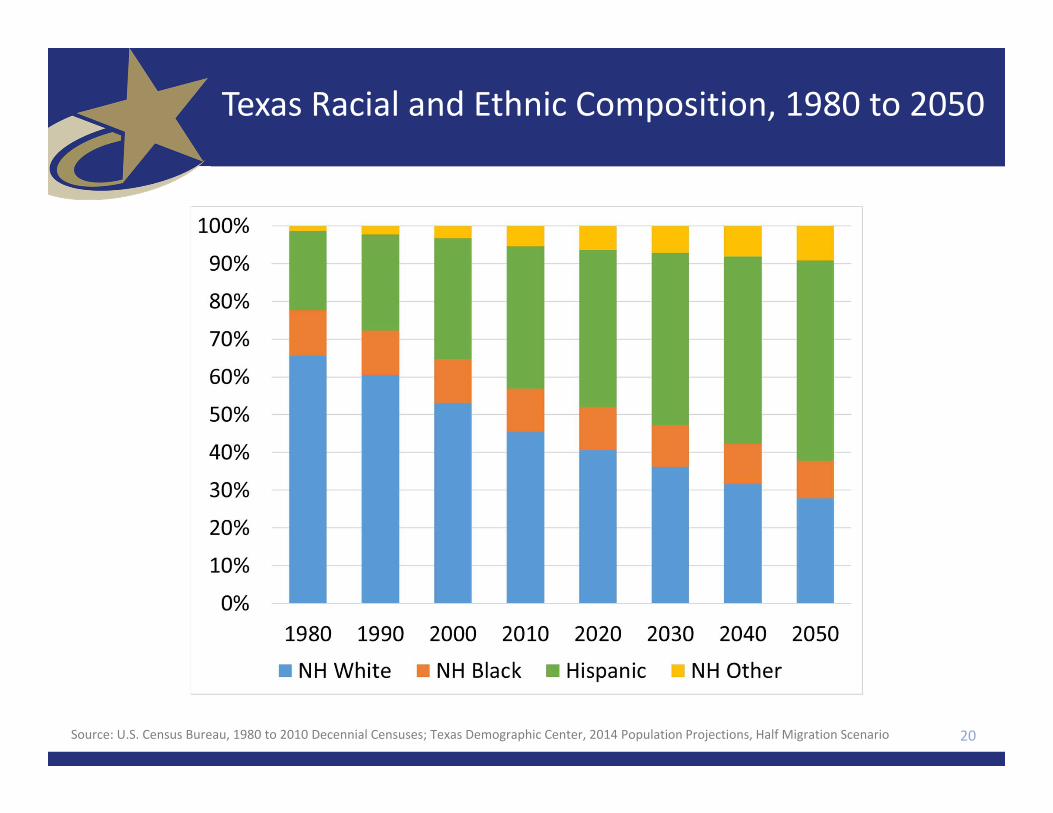
Texas Racial and Ethnic Composition, 1980 to 2050
20Source: U.S. Census Bureau, 1980 to 2010 Decennial Censuses; Texas Demographic Center, 2014 Population Projections, Half Migration Scenario

Texas is young, but aging.
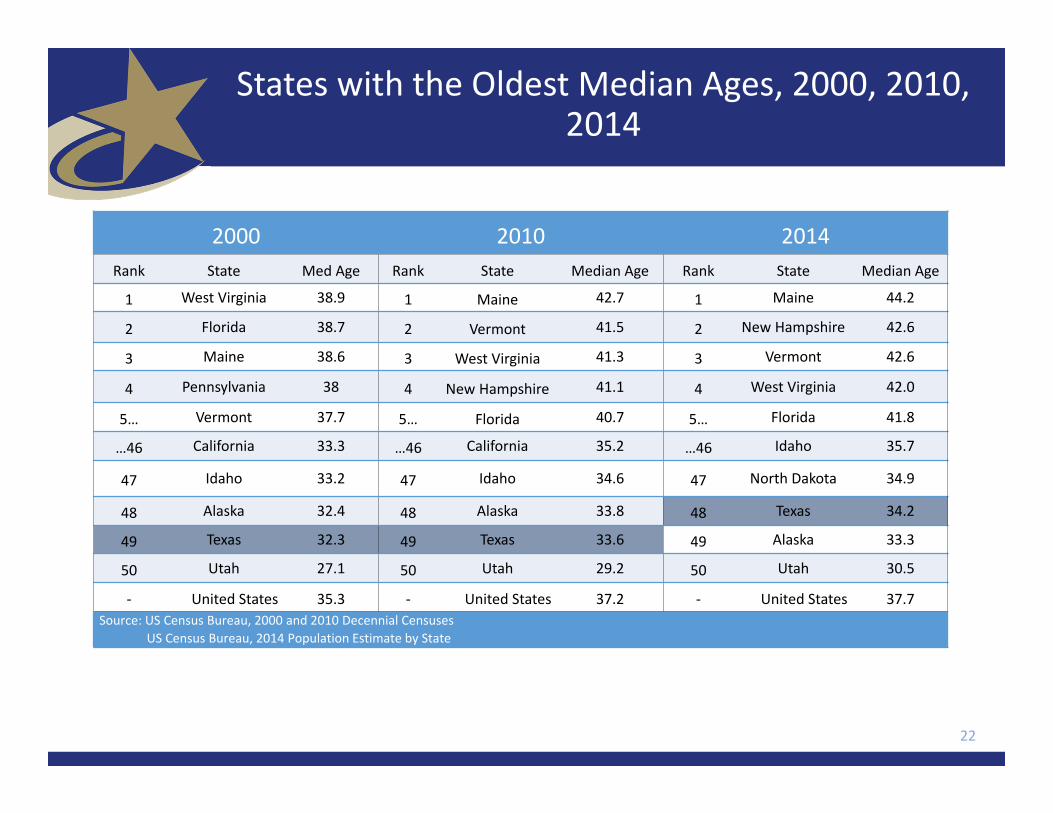
States with the Oldest Median Ages, 2000, 2010, 2014
2000 2010 2014Rank State Med Age Rank State Median Age Rank State Median Age
1 West Virginia 38.9 1 Maine 42.7 1 Maine 44.2
2 Florida 38.7 2 Vermont 41.5 2 New Hampshire 42.6
3 Maine 38.6 3 West Virginia 41.3 3 Vermont 42.6
4 Pennsylvania 38 4 New Hampshire 41.1 4 West Virginia 42.0
5… Vermont 37.7 5… Florida 40.7 5… Florida 41.8
…46 California 33.3 …46 California 35.2 …46 Idaho 35.7
47 Idaho 33.2 47 Idaho 34.6 47 North Dakota 34.9
48 Alaska 32.4 48 Alaska 33.8 48 Texas 34.2
49 Texas 32.3 49 Texas 33.6 49 Alaska 33.3
50 Utah 27.1 50 Utah 29.2 50 Utah 30.5
‐ United States 35.3 ‐ United States 37.2 ‐ United States 37.7Source: US Census Bureau, 2000 and 2010 Decennial Censuses
US Census Bureau, 2014 Population Estimate by State
22
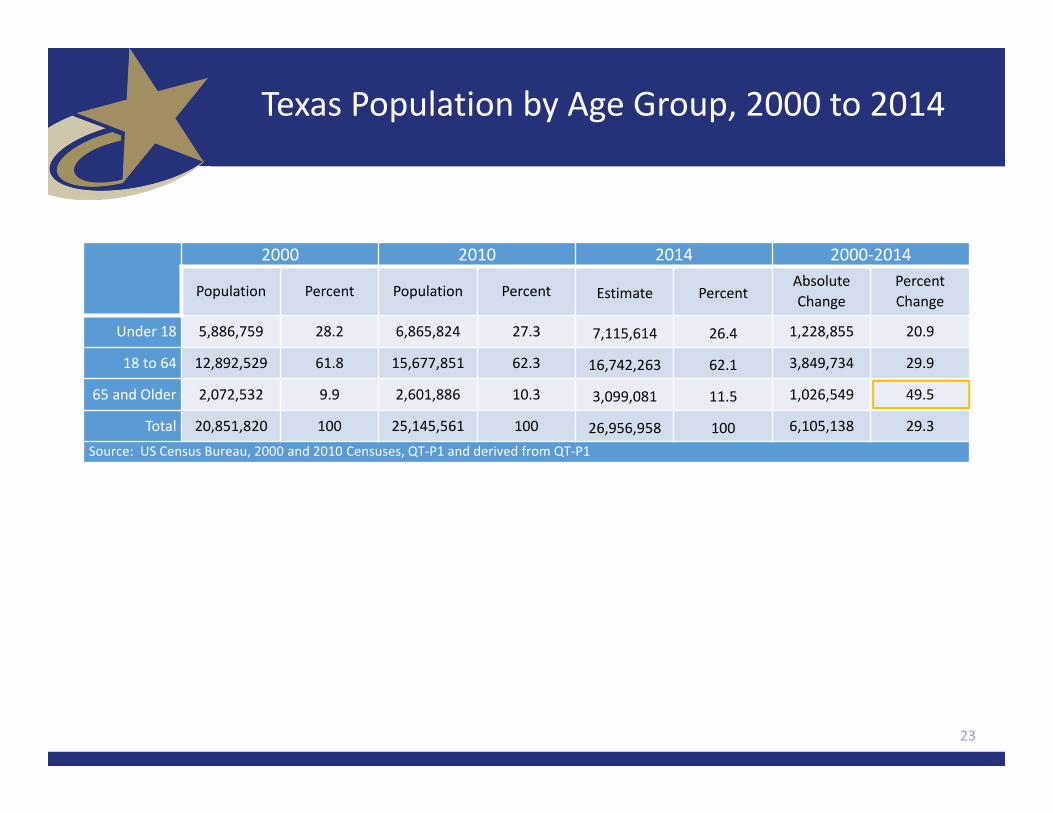
Texas Population by Age Group, 2000 to 2014
2000 2010 2014 2000‐2014
Population Percent Population Percent Estimate PercentAbsolute Change
Percent Change
Under 18 5,886,759 28.2 6,865,824 27.3 7,115,614 26.4 1,228,855 20.9
18 to 64 12,892,529 61.8 15,677,851 62.3 16,742,263 62.1 3,849,734 29.9
65 and Older 2,072,532 9.9 2,601,886 10.3 3,099,081 11.5 1,026,549 49.5
Total 20,851,820 100 25,145,561 100 26,956,958 100 6,105,138 29.3Source: US Census Bureau, 2000 and 2010 Censuses, QT‐P1 and derived from QT‐P1
23

Population Projections by Age Group, 2010 to 2050
Age Group 2010 2020 2030 2040 20502010‐2050Percent Change
65 and Older 2,601,886 4,014,083 5,929,471 7,583,385 9,442,865 262.9
65‐69 853,100 1,375,699 1,779,930 2,019,401 2,519,575 195.3
70‐74 619,156 1,081,697 1,569,556 1,747,404 2,136,439 245.1
75‐79 477,245 714,641 1,181,376 1,568,513 1,830,330 283.5
80‐84 347,206 440,399 794,965 1,186,724 1,365,653 293.3
85+ 205,501 401,647 603,644 1,061,343 1,590,868 421.3
Total Population 25,145,561 30,541,978 37,155,084 44,955,896 54,369,297 116.2
Source: US Census Bureau, 2010 CensusTexas State Data Center, 2014 Projections, 1.0 Migration Scenario
24

Percent of Population 65 Years Plus, Texas Counties, 2011‐2015
Source: U.S. Census Bureau, 2015 American Community Survey 5‐Year Estimates 30
Pecos
Brewster
Webb
Hudspeth
PresidioTerrell
CulbersonReeves
Val Verde
Crockett
Hill
Duval
Harris
Frio
Bell
Kerr
Kenedy
Starr
Polk
Clay
Edwards
Irion
Hall
Ellis
Jeff Davis
Sutton
Uvalde
Bee
Hale
Dallam
Leon
Bexar
Gaines
Hidalgo
Upton
Hartley
King
Erath
Jack
Kinney
Kent
Zavala
Brazoria
Tyler
GrayOldham
Dimmit
CassLynn HuntWise
La Salle
Rusk
Kimble
Lamb
Medina
Floyd
Terry
Coke
Llano
Liberty
Ector
Andrews
Milam
Travis Lee
Knox
Mills
Smith
Falls
Ward
Collin
Jones
Nolan
Potter
Burnet
Cottle
Nueces
Taylor
Zapata
Real
Coryell
Bowie
Motley
Young
Lamar
Martin
Garza
DallasFisher
Moore
Baylor
Kleberg
Archer
Scurry
Cameron
Cooke
Mason
Parker
Castro
Navarro
Brooks
Hardin
Deaf Smith
Lavaca
Donley
Hays
Goliad
Denton
El Paso
Fannin
Tarrant
Crane
Carson
Crosby
Borden
Schleicher
Gillespie
Shelby
Foard
Wood
Menard
Panola
Walker
Winkler
Harrison
Eastland
Loving
Bandera
Wichita
Hood
Matagorda
Brown
Reagan Houston
Maverick
Jasper
Coleman
Tom Green
Bailey
DeWittAtascosa
Bosque
Wharton
Concho
Runnels
Fayette
Haskell
Calhoun
Newton
Live Oak
Randall
Sterling
Jefferson
Briscoe
McMullen
Parmer
Jim Hogg
Mitchell
Wilson
Victoria
Trinity
Roberts
Howard
Bastrop
Grayson
San Saba
Midland
Hockley Dickens
Swisher
Gonzales
Anderson
Dawson
Willacy
Grimes
Wheeler
Cherokee
Colorado
Lubbock
Karnes
Red River
Refugio
Austin
Hemphill
Williamson
Jackson
Blanco
Ochiltree
McCulloch
Sherman
Wilbarger
Hansford
Callahan
McLennan
Yoakum
Angelina
Hopkins
Lipscomb
StephensPalo Pinto
Stonewall
Hamilton
MontagueCochran
Jim Wells
Limestone
Kaufman
Fort Bend
Titus
Comal
Armstrong
Kendall
FreestoneComancheGlasscock
Johnson
Galveston
Henderson
Montgomery
Brazos
Van Zandt
Chambers
Robertson
Waller
Sabine
Upshur
Hutchinson
Shackelford
Childress
Burleson
Nacogdoches
Lampasas
Collingsworth
Hardeman
Throckmorton
Guadalupe
Caldwell
Aransas
Marion
San Patricio
Madison
San Jacinto
Delta
Washington Orange
Rains
Gregg
Morris
San Augustine
Franklin
Somervell
Rockwall
8% - 10%
11% - 15%
16% - 20%
21% - 25%
26% - 34%

Economic Outlook

Job Growth, U.S. and Texas, 1990 to Aug 2017
27
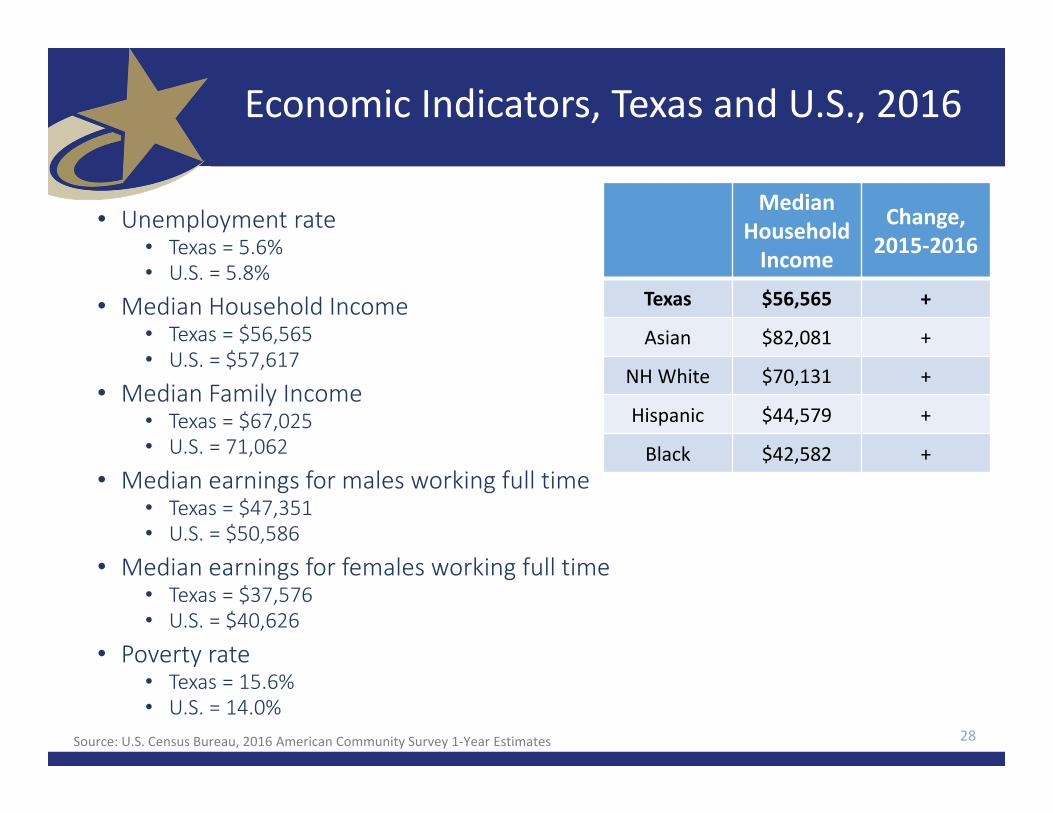
Median Household Income
Change,2015‐2016
Texas $56,565 +
Asian $82,081 +
NH White $70,131 +
Hispanic $44,579 +
Black $42,582 +
Economic Indicators, Texas and U.S., 2016
• Unemployment rate • Texas = 5.6% • U.S. = 5.8%
• Median Household Income • Texas = $56,565 • U.S. = $57,617
• Median Family Income • Texas = $67,025 • U.S. = 71,062
• Median earnings for males working full time • Texas = $47,351 • U.S. = $50,586
• Median earnings for females working full time • Texas = $37,576• U.S. = $40,626
• Poverty rate• Texas = 15.6% • U.S. = 14.0%
28Source: U.S. Census Bureau, 2016 American Community Survey 1‐Year Estimates
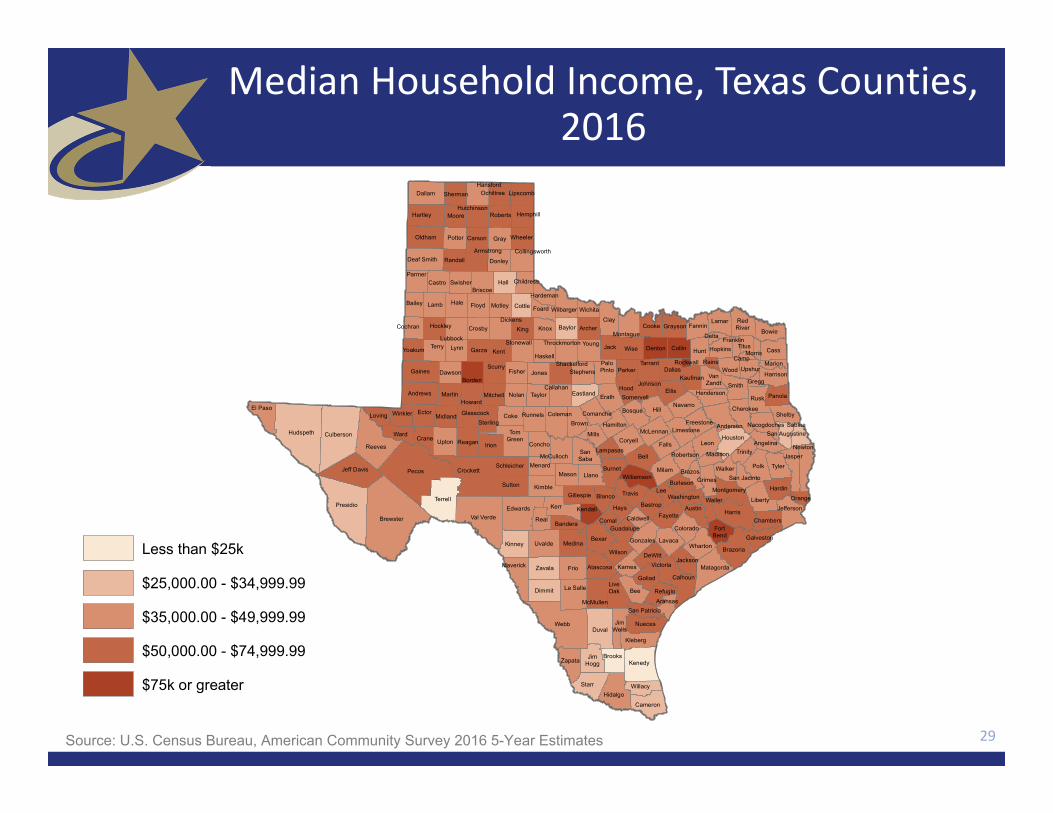
Median Household Income, Texas Counties, 2016
29Source: U.S. Census Bureau, American Community Survey 2016 5-Year Estimates
Menard
Hale
Armstrong
Calhoun
Clay
Orange
Gonzales
Fannin
Kerr
Refugio
JimHogg
Dimmit
Nolan
Brazos
Jefferson
Bell
Bandera
Hidalgo
Schleicher
GraysonCrosbyDelta
Zavala
Rockwall
Eastland
DeWitt
Angelina
McLennan
Lamar
Leon
Stonewall
McMullen
Sutton
FortBend
Parker
Kinney
Fayette
Briscoe
Harrison
Reagan
Coleman
Ochiltree
Crane
Washington
Lynn
Mills
Oldham
Sabine
Hopkins
Houston
Bexar
Upton
Erath
Randall
Rusk
Coryell
Comal
Aransas
Jack
Hemphill
Shackelford
San Jacinto
Kendall
Wharton
Floyd
Karnes
Kaufman
Duval
Johnson
Franklin
EdwardsWaller
Maverick
Kleberg
Gaines
Martin
Bowie
Andrews
Potter
Garza
Caldwell
Parmer
TitusTerry
Foard
Real
Carson
Knox
Hays
Medina
MotleyWichita
Midland
Victoria
Tyler
Falls
Presidio
Willacy
Lubbock
Henderson
Walker
Galveston
Harris
Dawson
Pecos
Nacogdoches
Guadalupe
Tarrant
Jackson
Swisher
SterlingWinkler
Frio
Lipscomb
Collingsworth
Colorado
Wise
Glasscock ShelbyComanche
Burnet
Gray
Hudspeth
Cass
Ellis
Cooke
Williamson
Cochran
VanZandt
Donley
Jones
Grimes
Irion
Navarro
Brooks
Dallam
Hunt
Mitchell
Wood
Childress
Jeff Davis
Montague
Brown
Haskell
Fisher
Concho
Coke
Polk
Cottle
Young
Lee
Cherokee
Hall
Hood
ArcherBaylor
San Augustine
Madison
Milam
Reeves
Nueces
Camp
FreestoneRunnels
Terrell
Deaf Smith
Marion
Liberty
Jasper
Hansford
Chambers
Hardin
Collin
Brazoria
Throckmorton
Bastrop
Scurry
Ector
Limestone
Denton
RedRiver
Matagorda
Hardeman
PaloPinto
LiveOak
Sherman
Uvalde
Bailey
Culberson
Atascosa
Wilson
Starr
Dallas
Kimble
McCulloch
Crockett
Hill
Kent
El PasoLoving
Dickens
La Salle
Lamb
Austin
Hutchinson
Val Verde
Smith
Robertson
Gillespie
King
TomGreen
Yoakum
Somervell
Kenedy
Borden
SanSaba
Burleson
Bee
Trinity
Castro
Brewster
Gregg
Ward
Wilbarger
Hamilton
Stephens
Lavaca
Bosque
Goliad
Roberts
Callahan
RainsMorris
Lampasas
Upshur
Wheeler
San Patricio
Moore
Webb
Blanco
Newton
Hockley
Panola
Anderson
Cameron
Montgomery
LlanoMason
Taylor
Hartley
JimWells
Zapata
Travis
Howard
Less than $25k
$25,000.00 - $34,999.99
$35,000.00 - $49,999.99
$50,000.00 - $74,999.99
$75k or greater

Unemployment Rate by Race/Ethnicity, Texas, 2003‐2015
30
4.5
8.1
4.2
6.1
0
2
4
6
8
10
12
14
16
2015201420132012201120102009200820072006200520042003
Percen
t
White Black or African American Asian Hispanic or Latino

Job Growth, Texas Metros, 2014‐2017
31

Median Home Prices, Texas and U.S., 2000‐2017
32

Housing Affordability in Select Texas Metros, 2007‐2016
33

Educational Attainment by Race/Ethnicity, Texas and Big Four Metro Areas, 2016
34
93.487.6 89.1
64.9
37.6
56.7
23.1
14.2
0
10
20
30
40
50
60
70
80
90
100
HighSchool
Graduateor Higher
NH White Asian Black Hispanic Bachelor'sDegree orHigher
NH White Asian Black Hispanic
Austin Dallas Houston San Antonio Texas

Median Household Income by Race/Ethnicity, Texas and Big Four Metro Areas, 2016
35
$56,565
$70,131
$42,582 $44,579
$82,081
$0
$10,000
$20,000
$30,000
$40,000
$50,000
$60,000
$70,000
$80,000
$90,000
$100,000
Total NH White Black Hispanic Asian
Austin Dallas Houston San Antonio Texas
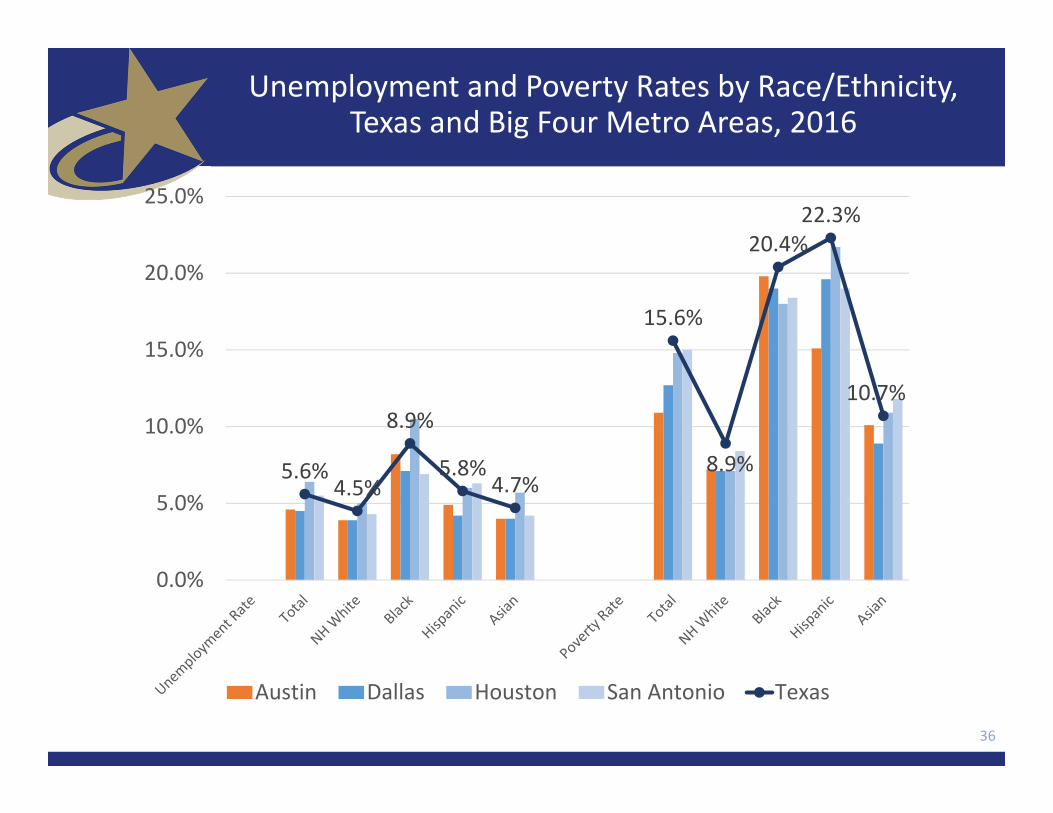
Unemployment and Poverty Rates by Race/Ethnicity, Texas and Big Four Metro Areas, 2016
36
5.6%4.5%
8.9%
5.8%4.7%
15.6%
8.9%
20.4%22.3%
10.7%
0.0%
5.0%
10.0%
15.0%
20.0%
25.0%
Austin Dallas Houston San Antonio Texas
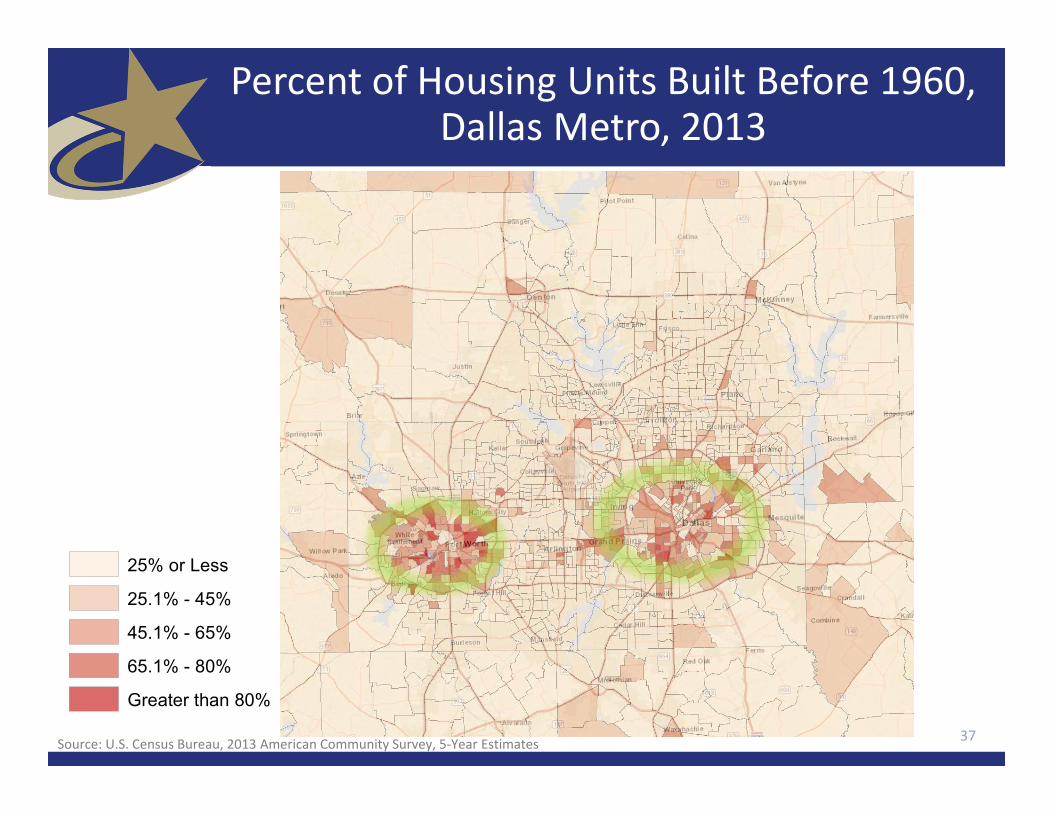
Percent of Housing Units Built Before 1960, Dallas Metro, 2013
37Source: U.S. Census Bureau, 2013 American Community Survey, 5‐Year Estimates
25% or Less
25.1% - 45%
45.1% - 65%
65.1% - 80%
Greater than 80%
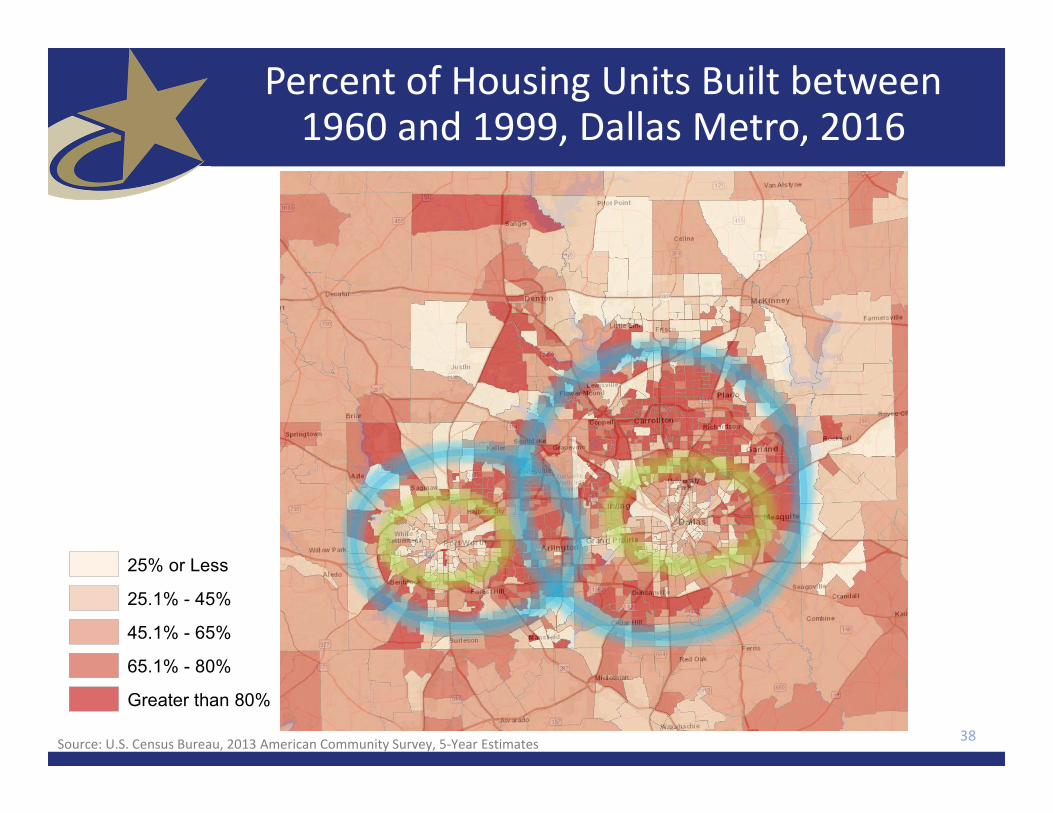
Percent of Housing Units Built between 1960 and 1999, Dallas Metro, 2016
38Source: U.S. Census Bureau, 2013 American Community Survey, 5‐Year Estimates
25% or Less
25.1% - 45%
45.1% - 65%
65.1% - 80%
Greater than 80%

Percent of Housing Units Built in 2000 and later, Dallas Metro, 2016
39Source: U.S. Census Bureau, 2016 American Community Survey, 5‐Year Estimates
25% or Less
25.1% - 45%
45.1% - 65%
65.1% - 80%
Greater than 80%

Percent of Persons with Commutes of 40 Minutes or Greater, 2015
40Source: U.S. Census Bureau, 2015 American Community Survey, 5‐Year Estimates

Percent of Person with Commutes of 40 Minutes or Greater, San Antonio and Austin Metro Areas,
2015
41Source: U.S. Census Bureau, 2015 American Community Survey, 5‐Year Estimates
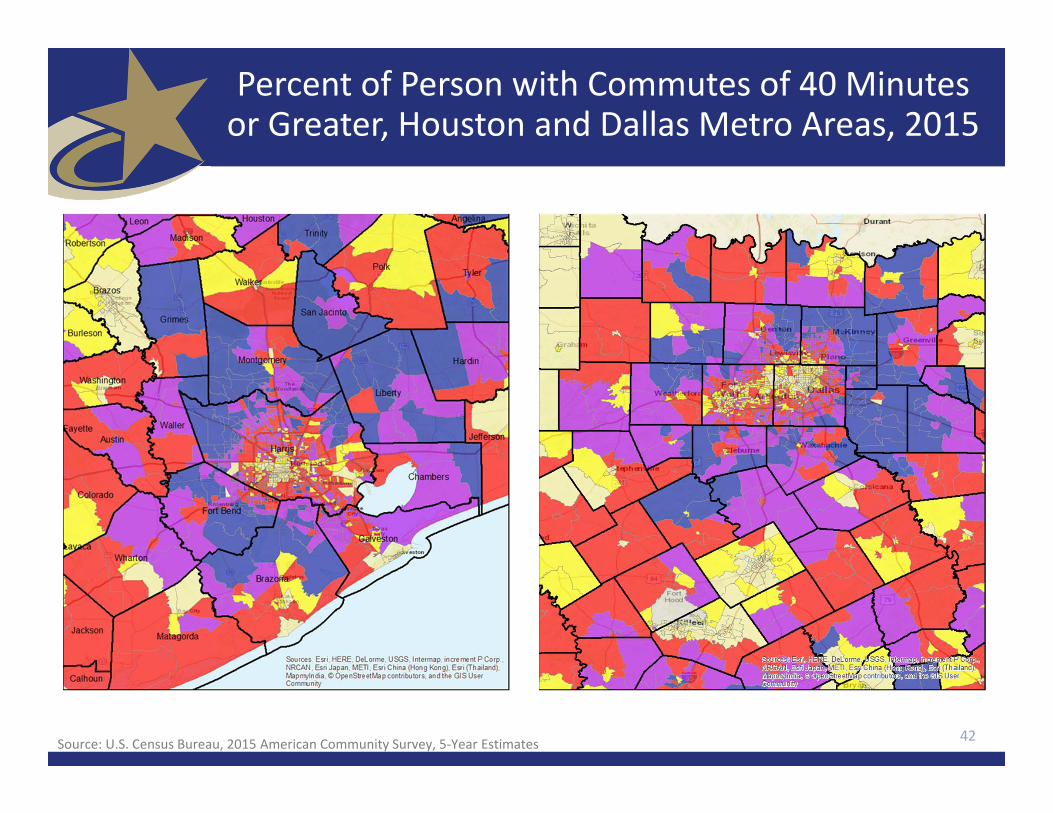
42
Percent of Person with Commutes of 40 Minutes or Greater, Houston and Dallas Metro Areas, 2015
Source: U.S. Census Bureau, 2015 American Community Survey, 5‐Year Estimates

Population Projections

20
25
30
35
40
45
50
55
60
Millions
Zero Net Migration
Half 2000 ‐2010
2000 ‐2010
2010 ‐2015
Projected Population Growth in Texas, 2010‐2050
44Source: Texas State Data Center, 2016 Preliminary Population Projections

24
25
26
27
28
29
30
31
Millions
Zero Net Migration
Half 2000 ‐2010
2000 ‐2010
2010 ‐2015
Estimates
Projected and Estimated Population Growth in Texas, 2010‐2020
45Source: Texas State Data Center, 2016 Preliminary Population Projections and U.S. Census Bureau, 2016 Population Estimates
Demographic Overview
• Texas is experiencing significant growth.• Population growth is not geographically evenly distributed.• Texas continues to racially/ethnically diversify.• The population of Texas, while relatively young, is also aging.• The components of population change have varying implications for infrastructure in Texas.
• A young and growing workforce could be a competitive edge for Texas and its growing metro areas.
• Demographic shifts may have serious implications for maintaining inclusive and equitable economic growth in the state.
46