
Texas Association of Healthcare Facilities Management ... · 75,000 patients with HAIs died ......
67
Texas Association of Healthcare Facilities Management December 12, 2014
Transcript of Texas Association of Healthcare Facilities Management ... · 75,000 patients with HAIs died ......

Texas Association of Healthcare Facilities ManagementDecember 12, 2014

Toronto, Canada Seven Oaks Home for the Aged Opened in 1989 Outbreak began 9/25/05
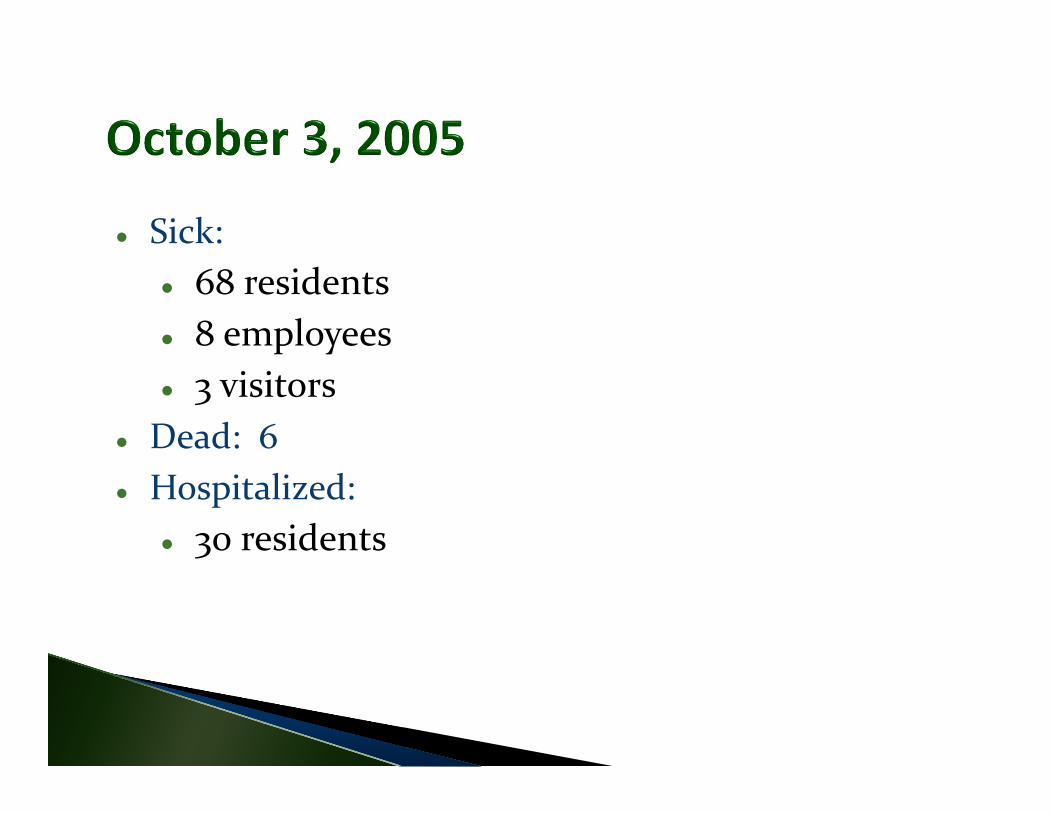
Sick: 68 residents 8 employees 3 visitors
Dead: 6 Hospitalized:
30 residents

Sick: 70 residents 12 employees 2 visitors
Dead: 10 Hospitalized:
40 residents
Testing underway to determine cause
“…we are confident this outbreak is under control,” says David McKeown, Toronto’s Medical Officer of Health
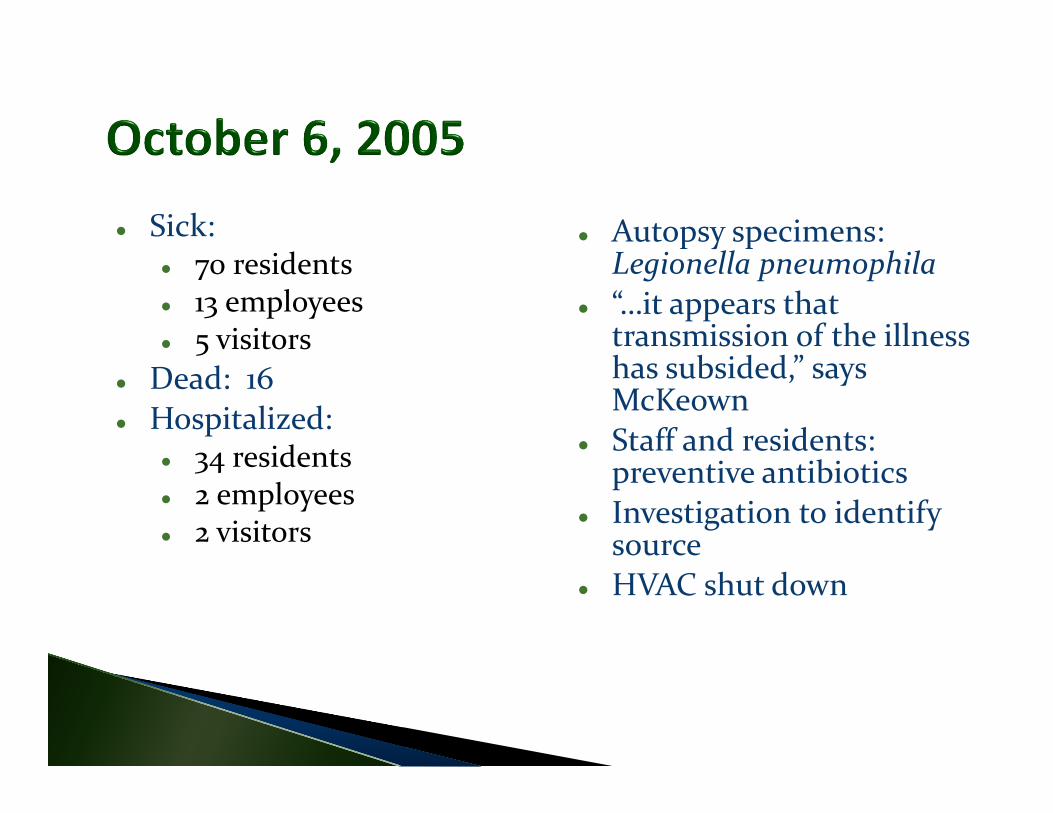
Sick: 70 residents 13 employees 5 visitors
Dead: 16 Hospitalized:
34 residents 2 employees 2 visitors
Autopsy specimens: Legionella pneumophila
“…it appears that transmission of the illness has subsided,” says McKeown
Staff and residents: preventive antibiotics
Investigation to identify source
HVAC shut down

Sick: 70 residents 18 employees 9 visitors
Dead: 17 Hospitalized:
35 residents 2 employees 5 visitors
Potable water shut down

Sick: 71 residents 23 employees 14 visitors
Dead: 17 Hospitalized:
Not available
Potable water system safe
Exhaust returned to service
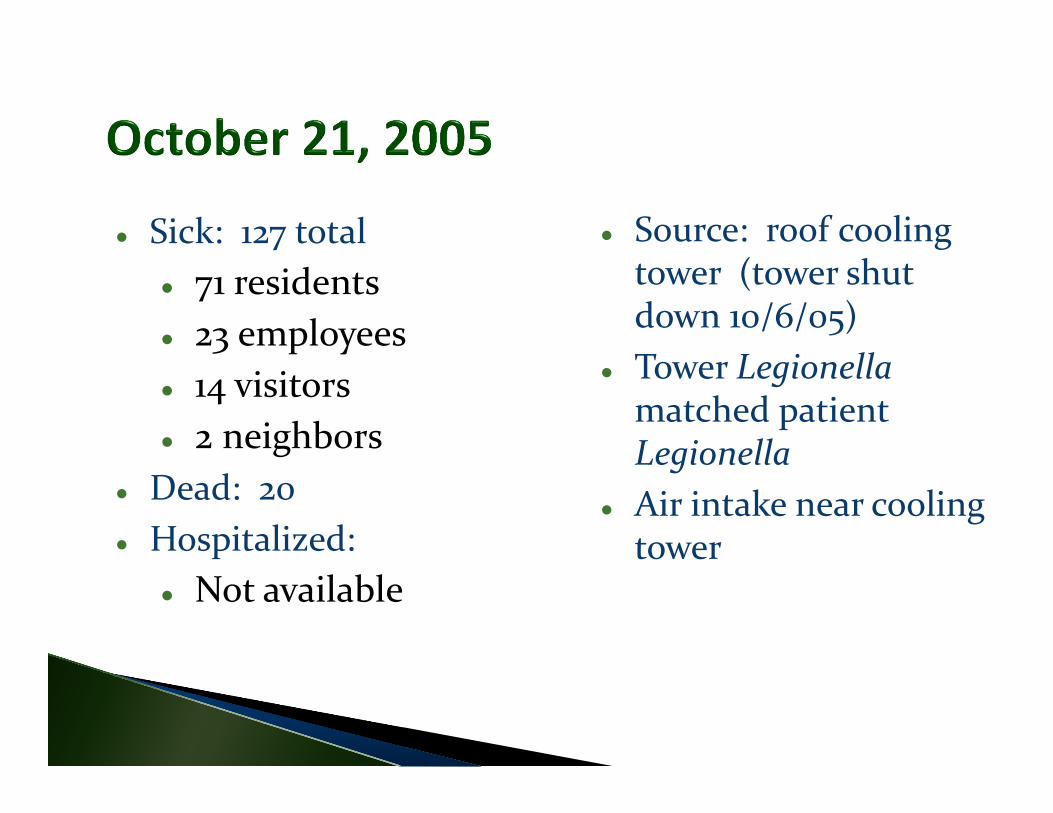
Sick: 127 total 71 residents 23 employees 14 visitors 2 neighbors
Dead: 20 Hospitalized:
Not available
Source: roof cooling tower (tower shut down 10/6/05)
Tower Legionellamatched patient Legionella
Air intake near cooling tower

Major Site of Infection Estimated Number of Infections (2011)
Healthcare‐Associated Infections (all)
721,800
Pneumonia 157,500Gastrointestinal Illness 123,100Urinary Tract Infection 93,300
Primary Bloodstream Infections 71,900
Surgical Site Infections 157,500Other infections 118,500

1 in 25 hospital patients has 1 or more HAI 75,000 patients with HAIs died Many states require hospitals to post their infection rates online

The Joint Commission Guidelines for the Design and Construction of Health Care Facilities
CDC – Guidelines on Environmental Infection Control in Healthcare Facilities
Assoc. for Professionals in Infection Control and Epidemiology (APIC)
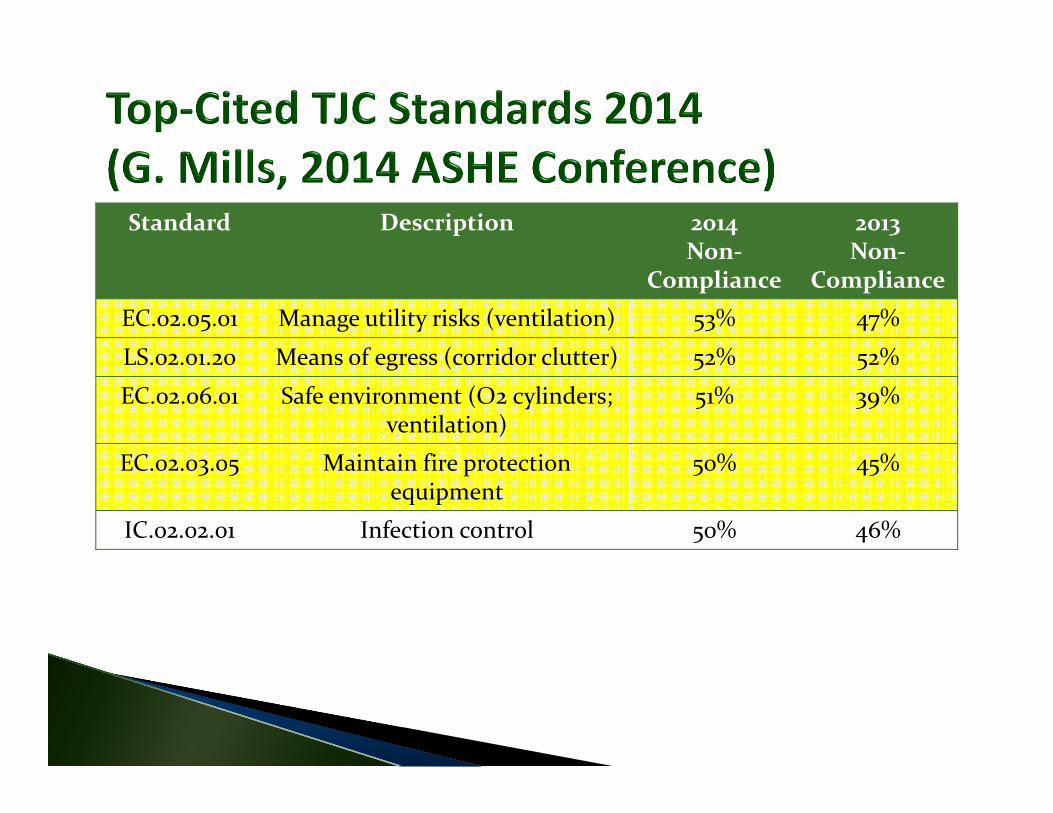
Standard Description 2014 Non‐
Compliance
2013 Non‐
ComplianceEC.02.05.01 Manage utility risks (ventilation) 53% 47%
LS.02.01.20 Means of egress (corridor clutter) 52% 52%
EC.02.06.01 Safe environment (O2 cylinders; ventilation)
51% 39%
EC.02.03.05 Maintain fire protection equipment
50% 45%
IC.02.02.01 Infection control 50% 46%
Breathing easy: The role of HVAC systems in preserving patient safety…EC.02.05.01
Specific concerns:◦ Directing airflow◦ Managing outside air◦ Reliable filtration◦ Keeping systems energy efficient while minimizing risk
Written inventory of equipment Inspection, maintenance, and testing◦ Including “infection control system components” (DI)
Minimizes biological agents in water systems (DI) Appropriate pressure relationships and air exchange rates (DI)
Written procedures for disruptions
100 million 500 million 1 billion 2 billion

Hotel MHong Kong
Guangdong Province,
China A
A
H,JA
H,J
Hong Kong SAR95 HCW
>100 close contactsU.S.A.1 HCW
I, L,M
I,L,M
K Ireland0 HCW
K
Singapore
34 HCW
37 close contacts
C,D,E
C,D,E
B
B
Vietnam37 HCW
21 close contacts
F,G
Canada18 HCWF,G
11 close contacts
SARS Epidemic
[www.cdc.gov]
27 Fungal outbreaks from construction Burn, trauma, transplant, oncology, respiratory failure, renal disease, premature infants, etc.
234 total infections At least 117 deaths(“Construction‐related Nosocomial Infections in Patients in
Healthcare Facilities,” Canada Communicable Disease Report, Volume 27S2, 7/2001.)

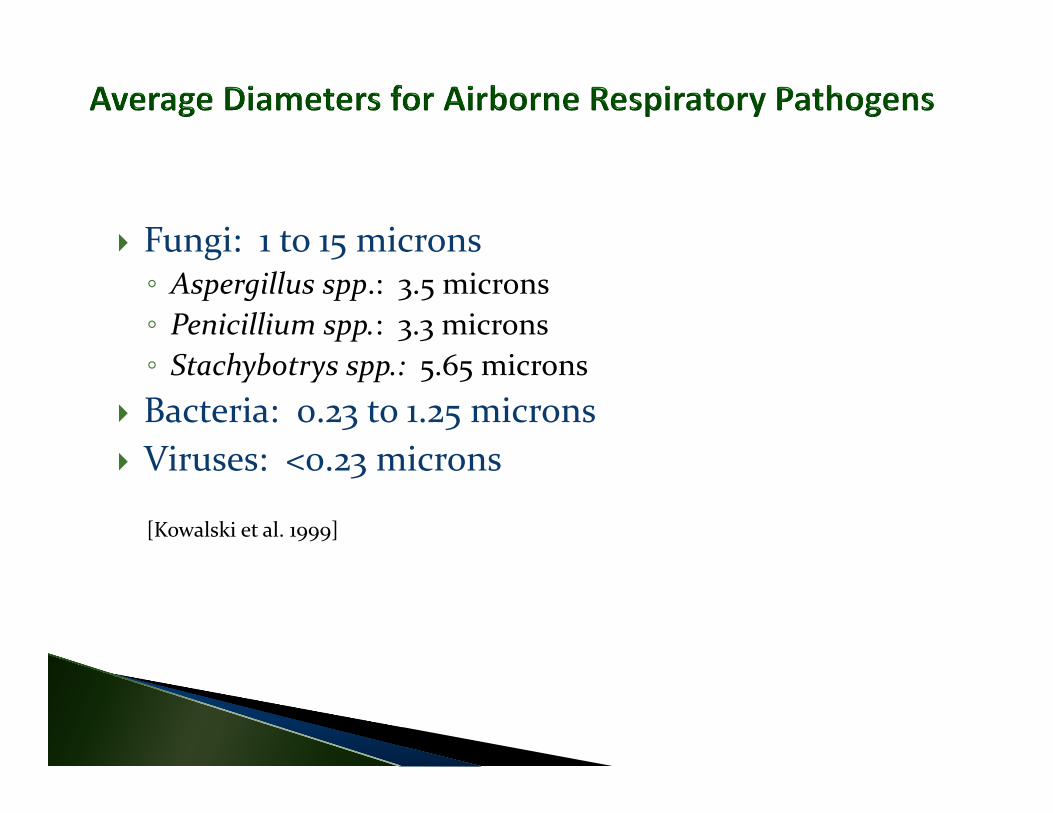
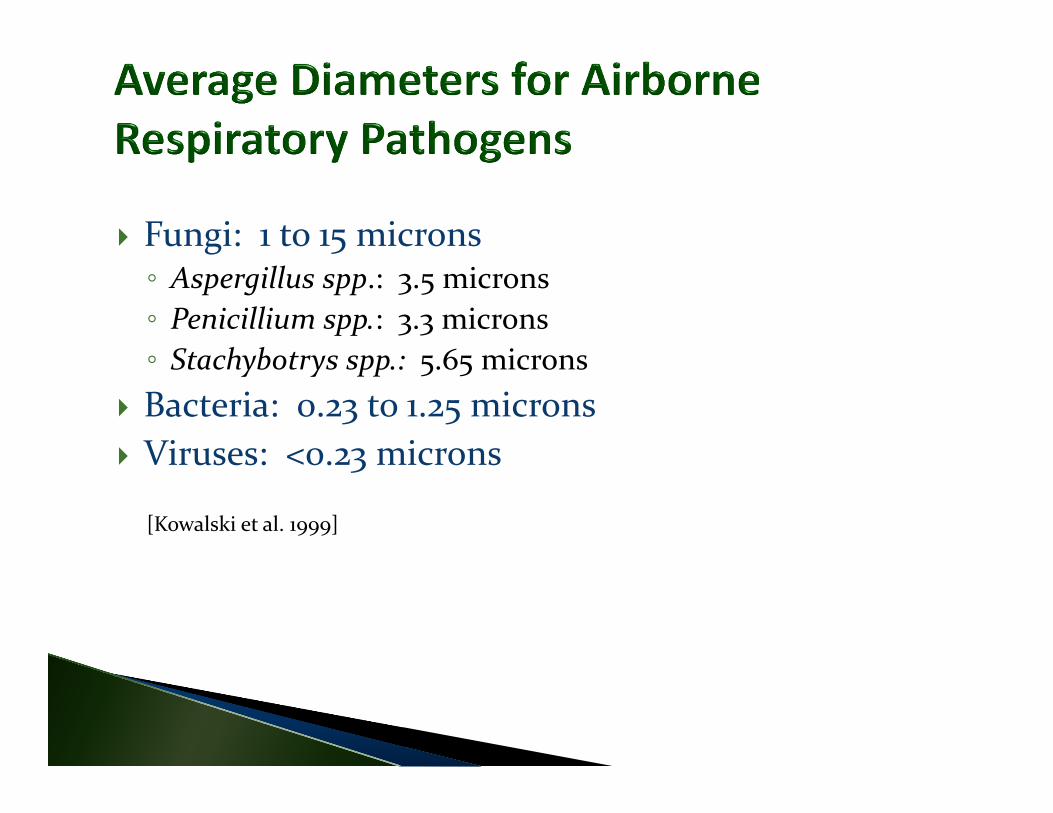
Fungi: 1 to 15 microns◦ Aspergillus spp.: 3.5 microns◦ Penicillium spp.: 3.3 microns◦ Stachybotrys spp.: 5.65 microns
Bacteria: 0.23 to 1.25 microns Viruses: <0.23 microns
[Kowalski et al. 1999]
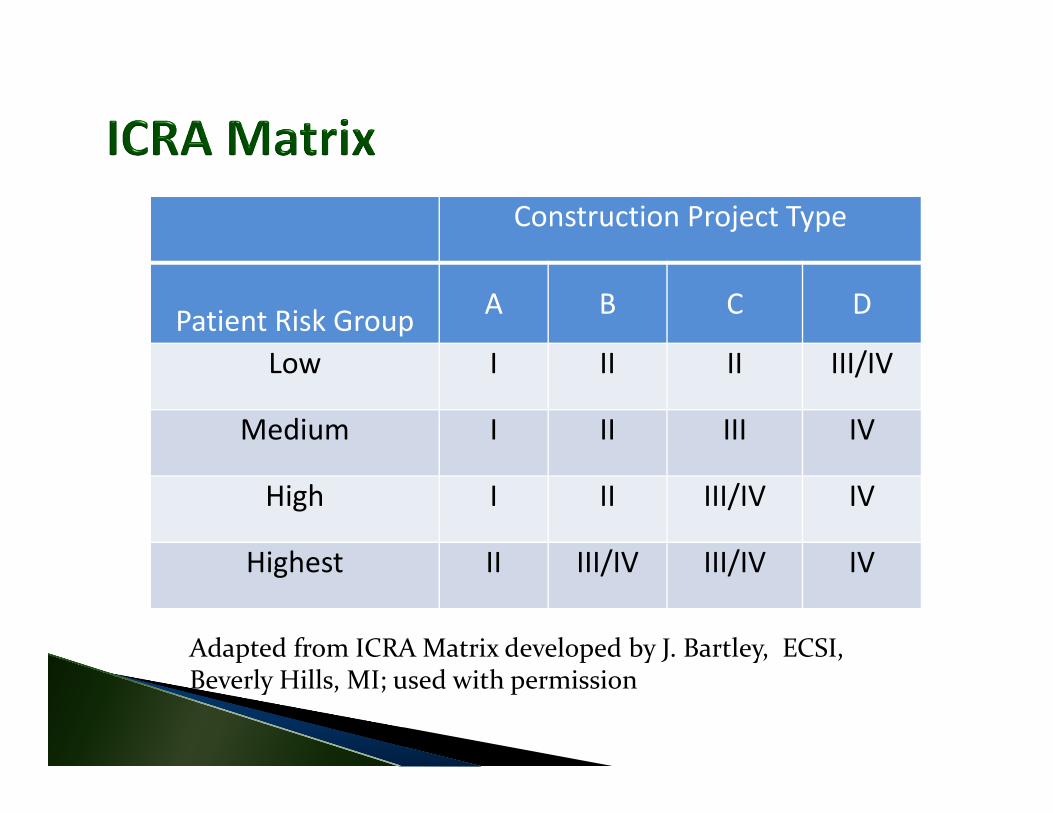
Construction Project Type
Patient Risk Group A B C D
Low I II II III/IV
Medium I II III IV
High I II III/IV IV
Highest II III/IV III/IV IV
Adapted from ICRA Matrix developed by J. Bartley, ECSI, Beverly Hills, MI; used with permission

Dust control Negative pressure of work zone Containment barriers
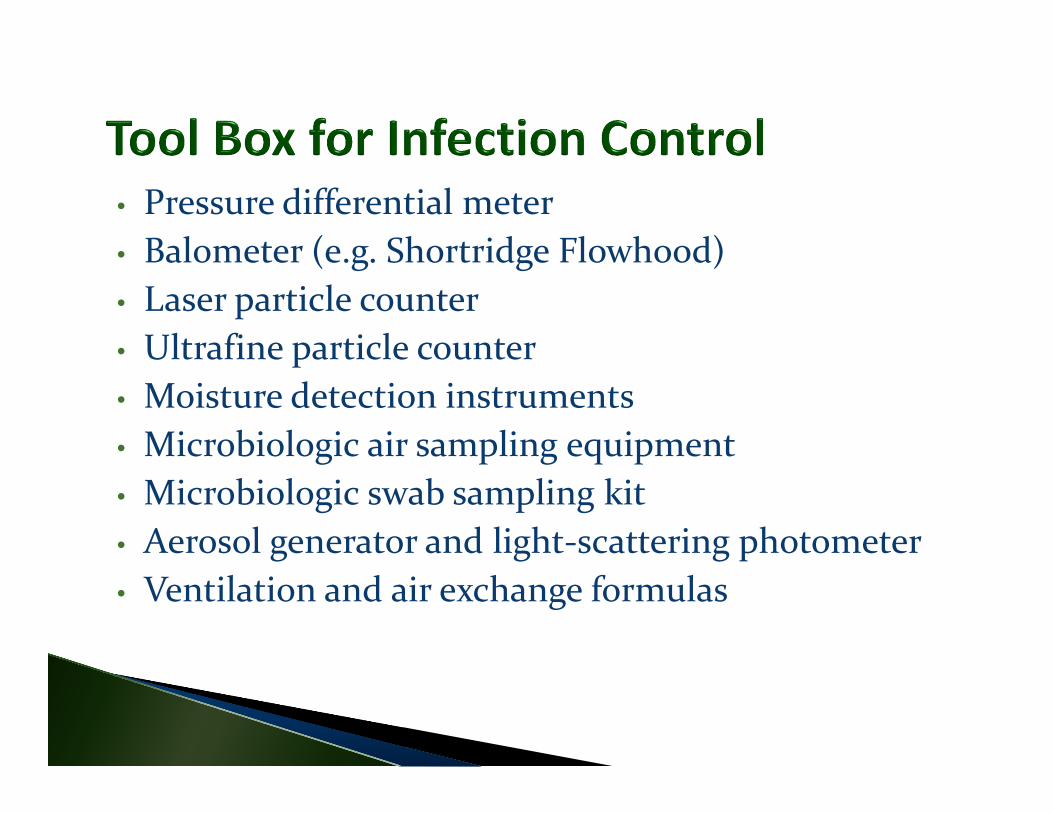
• Pressure differential meter• Balometer (e.g. Shortridge Flowhood)• Laser particle counter• Ultrafine particle counter• Moisture detection instruments• Microbiologic air sampling equipment• Microbiologic swab sampling kit• Aerosol generator and light‐scattering photometer• Ventilation and air exchange formulas

Commissioning Determination of existing conditions Verification of system performance Epidemiology evaluation

Know what question(s) you want answered Know how to interpret the results Develop a sampling plan agreed by all involved
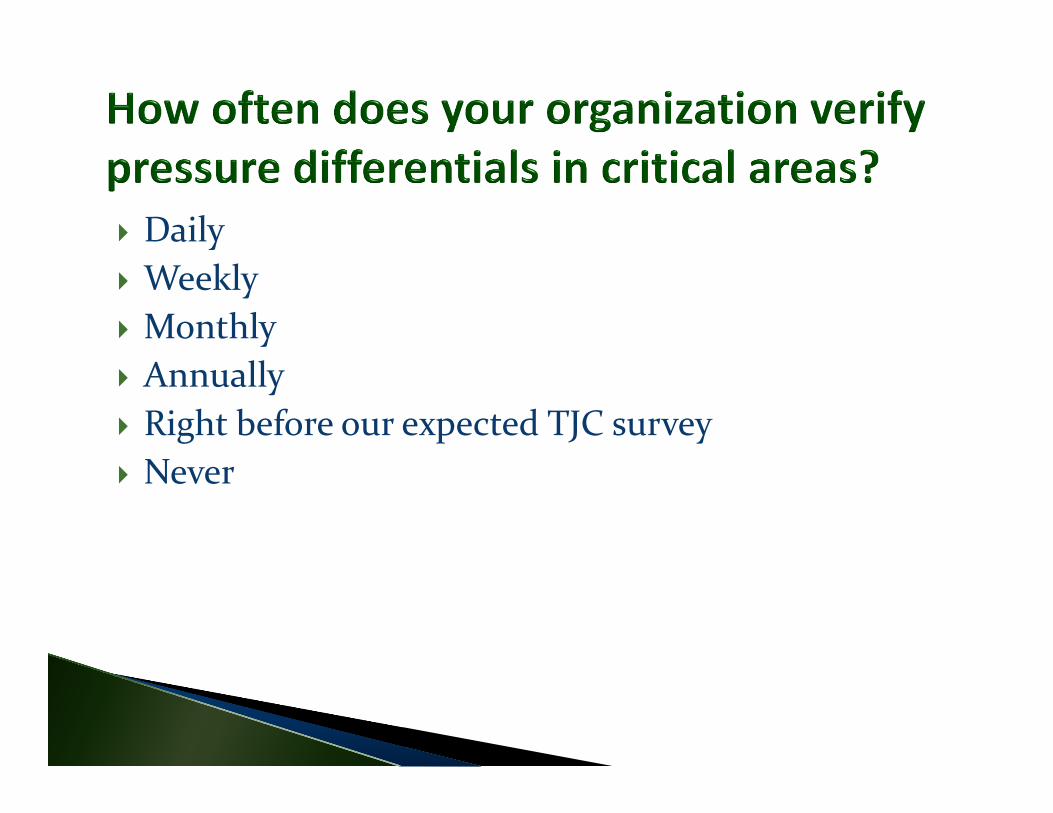
Daily Weekly Monthly Annually Right before our expected TJC survey Never

Isolation rooms Protective environment rooms
Pharmaceutical compounding areas
Building pressurization Construction work zones Laboratories More… [Photo provided by
The Energy Conservatory]
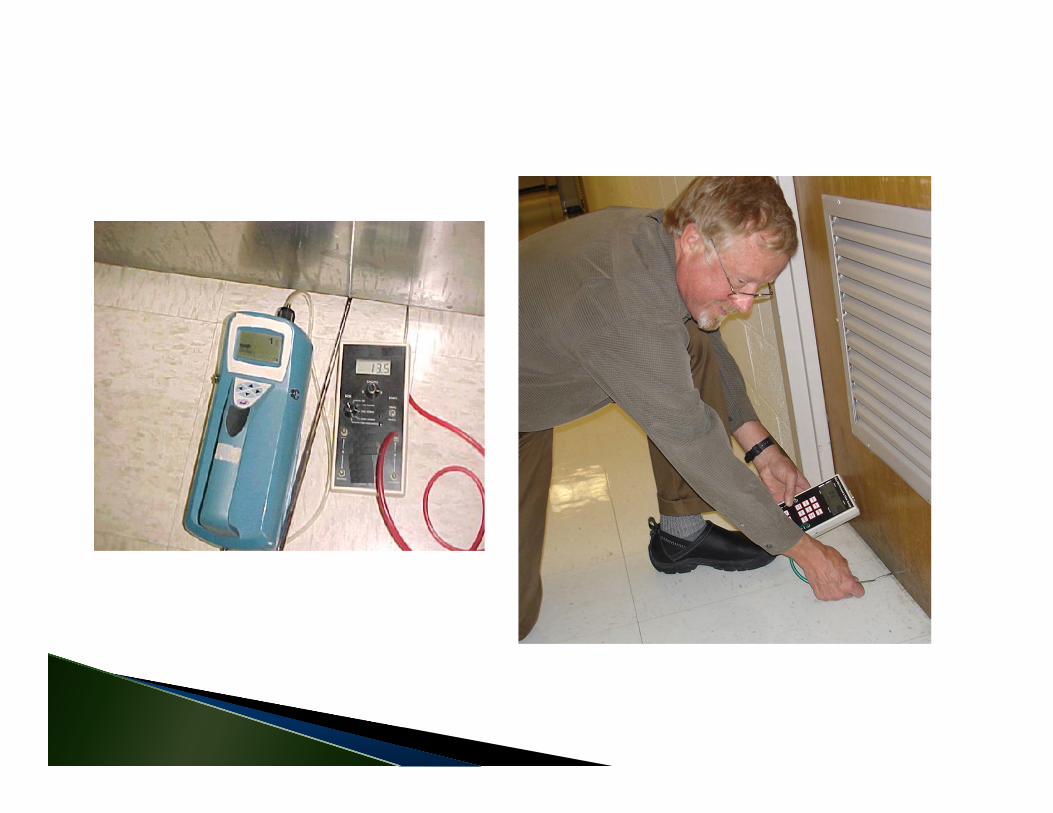

Pressurization log for AII room missing signatures for multiple days this month
Multiple entries on log show positive pressure readings
Your policy says AII room pressurization checked daily
Nearby nurse does not know how to operate digital pressure manometer display
Continuous readouts of all airborne particles
Rank‐order comparisons among clean, dirty, and outdoor areas (CDC)


Example Particle Counts Outdoors (clear, spring day) = 10,000 p/L Patient wing corridor = 1,000 p/L HEPA‐filtered OR = 100 p/L
p/L = particles greater than 0.5 microns in diameter per liter of air

Total Particles
AspergillusCon
cent
rati
on
Time
1. Outdoor particle counts impact indoor particle counts.

2. Outdoor particle counts should be measured when indoor particle counts are measured.
3. Indoor particle counts should generally be less than outdoor particle counts.
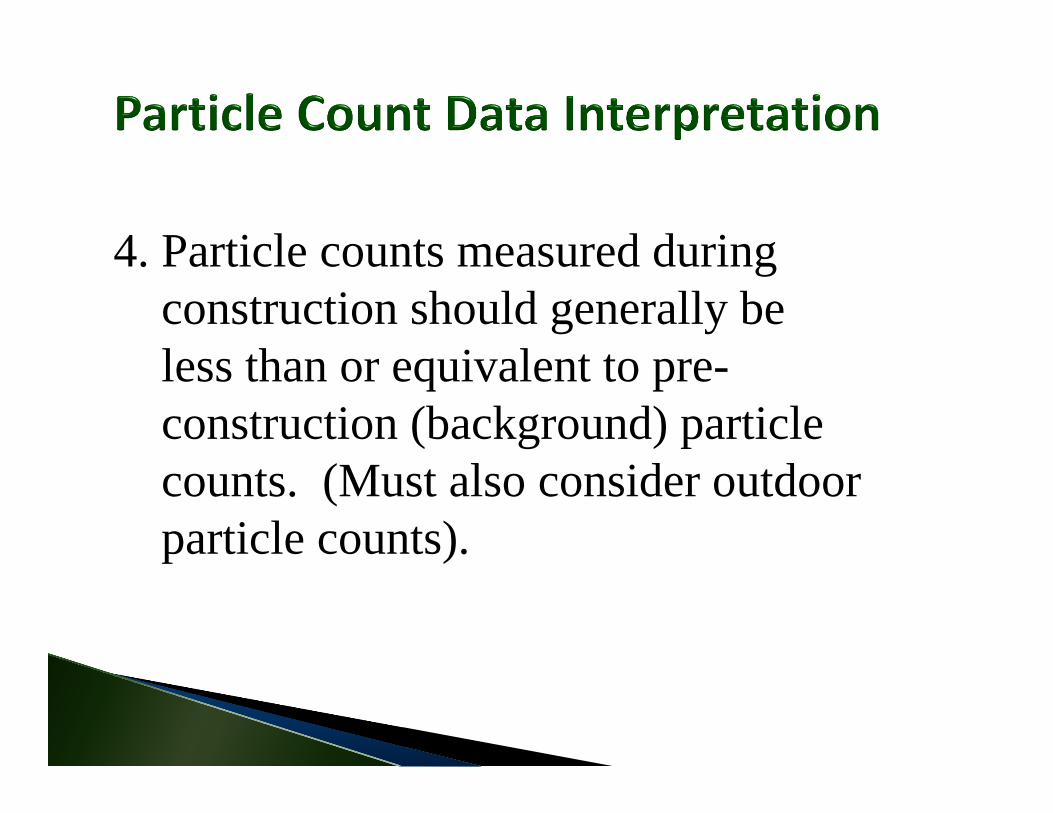
4. Particle counts measured during construction should generally be less than or equivalent to pre-construction (background) particle counts. (Must also consider outdoor particle counts).
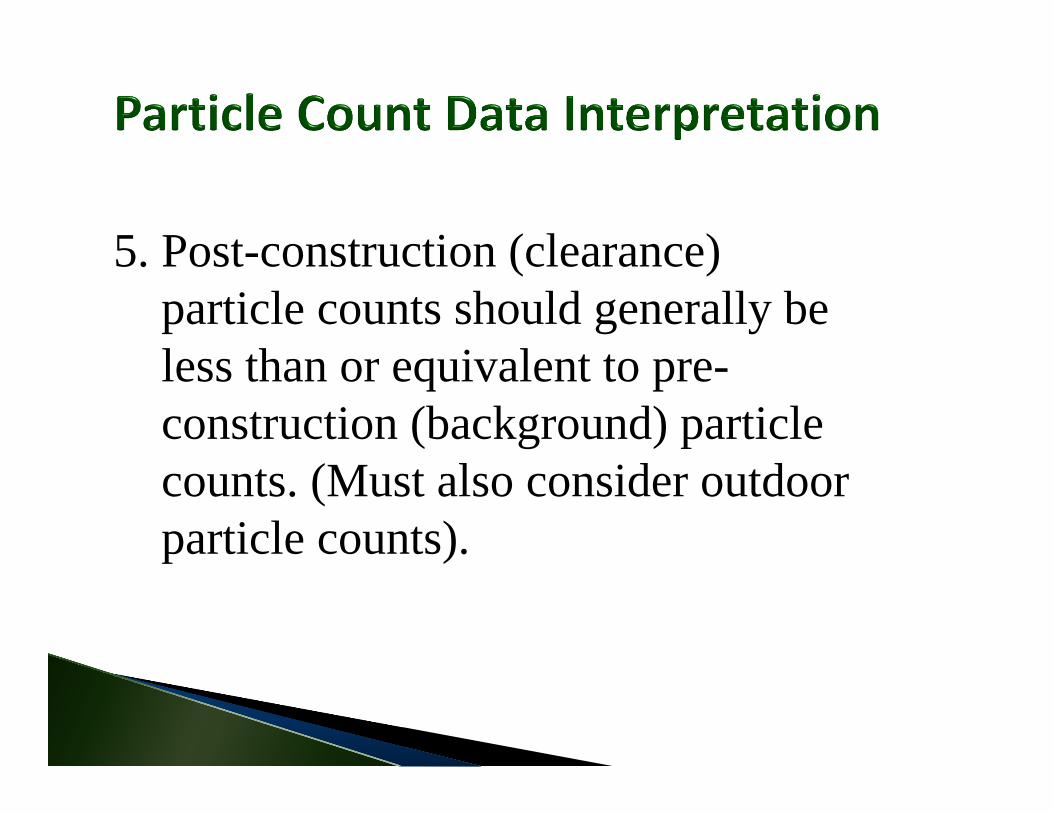
5. Post-construction (clearance) particle counts should generally be less than or equivalent to pre-construction (background) particle counts. (Must also consider outdoor particle counts).
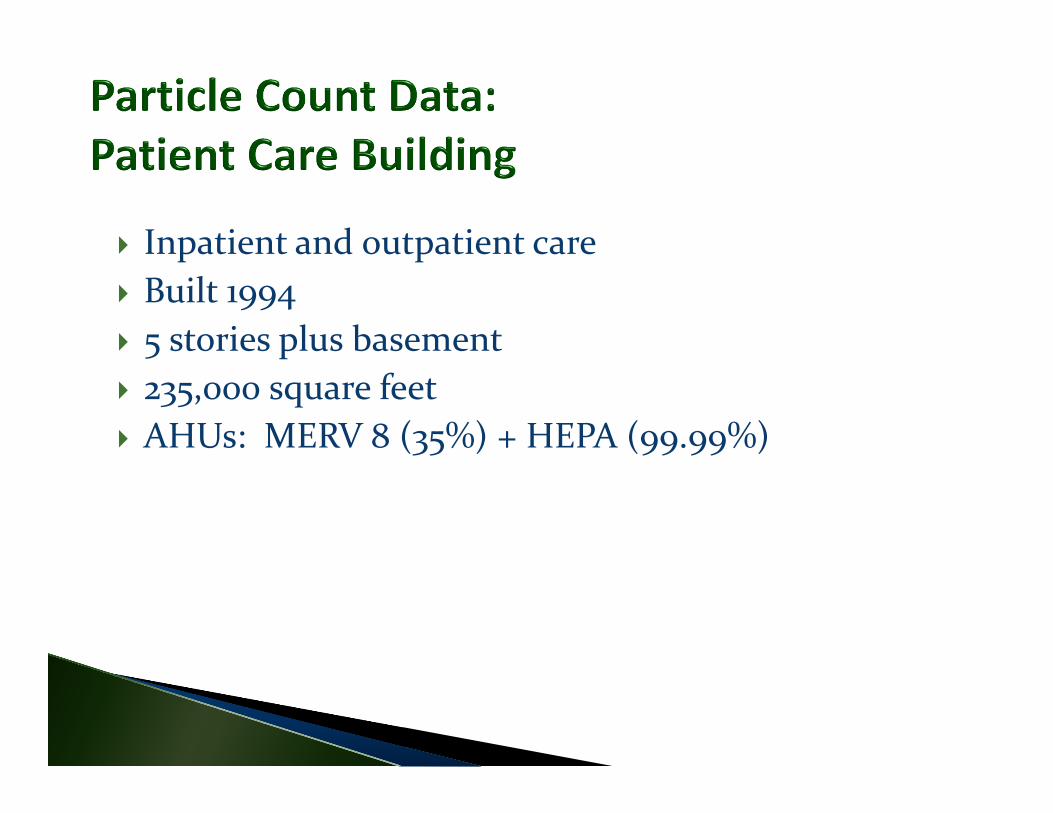
Inpatient and outpatient care Built 1994 5 stories plus basement 235,000 square feet AHUs: MERV 8 (35%) + HEPA (99.99%)
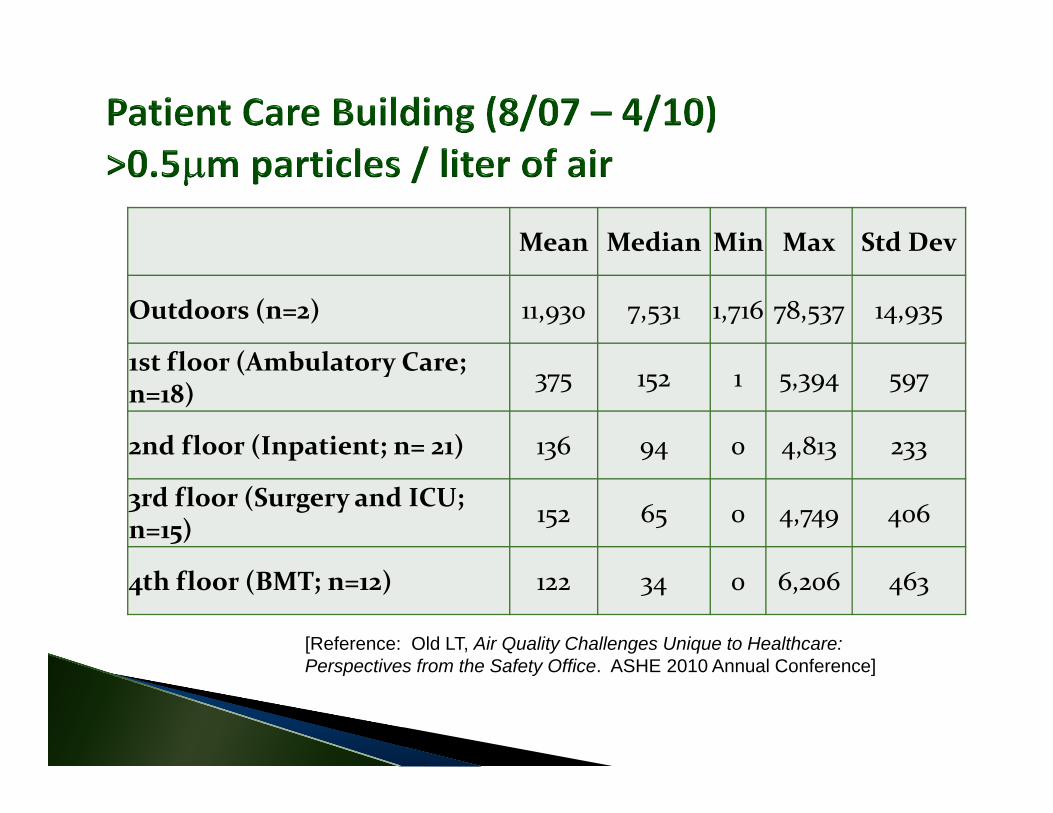
Mean Median Min Max Std Dev
Outdoors (n=2) 11,930 7,531 1,716 78,537 14,935
1st floor (Ambulatory Care; n=18) 375 152 1 5,394 597
2nd floor (Inpatient; n= 21) 136 94 0 4,813 233
3rd floor (Surgery and ICU; n=15) 152 65 0 4,749 406
4th floor (BMT; n=12) 122 34 0 6,206 463
[Reference: Old LT, Air Quality Challenges Unique to Healthcare: Perspectives from the Safety Office. ASHE 2010 Annual Conference]
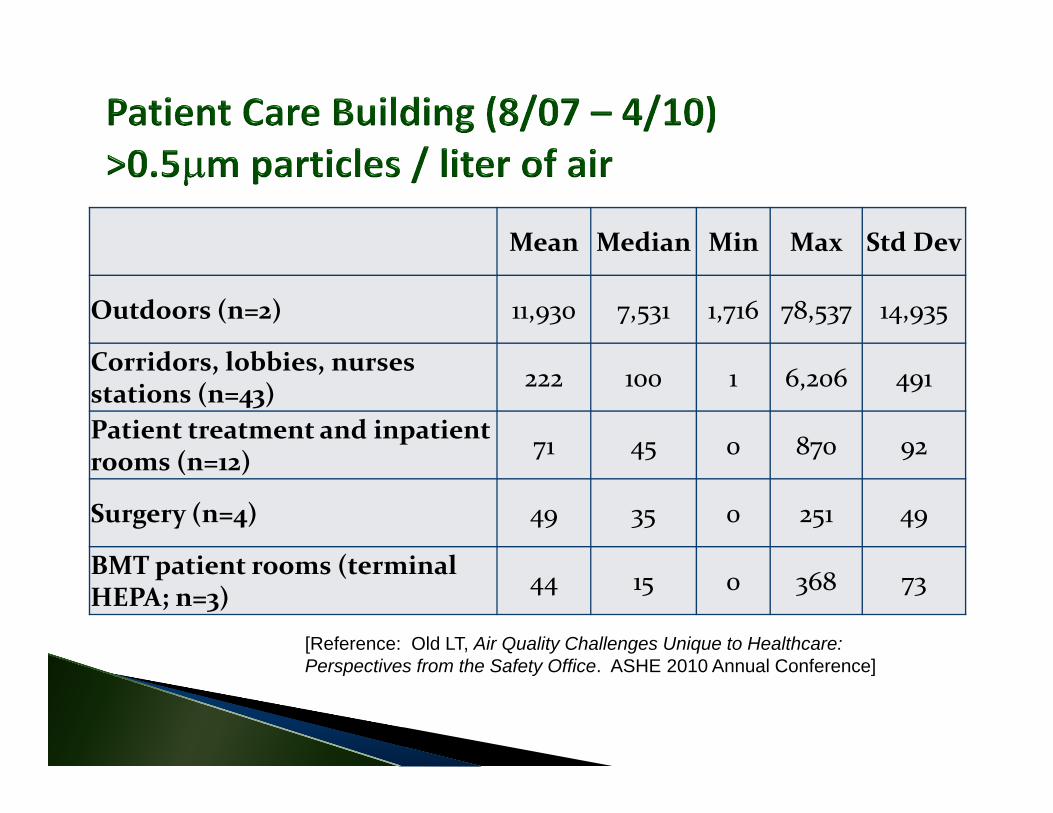
Mean Median Min Max Std Dev
Outdoors (n=2) 11,930 7,531 1,716 78,537 14,935
Corridors, lobbies, nurses stations (n=43) 222 100 1 6,206 491
Patient treatment and inpatient rooms (n=12) 71 45 0 870 92
Surgery (n=4) 49 35 0 251 49
BMT patient rooms (terminal HEPA; n=3) 44 15 0 368 73
[Reference: Old LT, Air Quality Challenges Unique to Healthcare: Perspectives from the Safety Office. ASHE 2010 Annual Conference]
Particle counters may be used to evaluate barrier integrity.
[CDC Environmental Infection Control Guidelines]
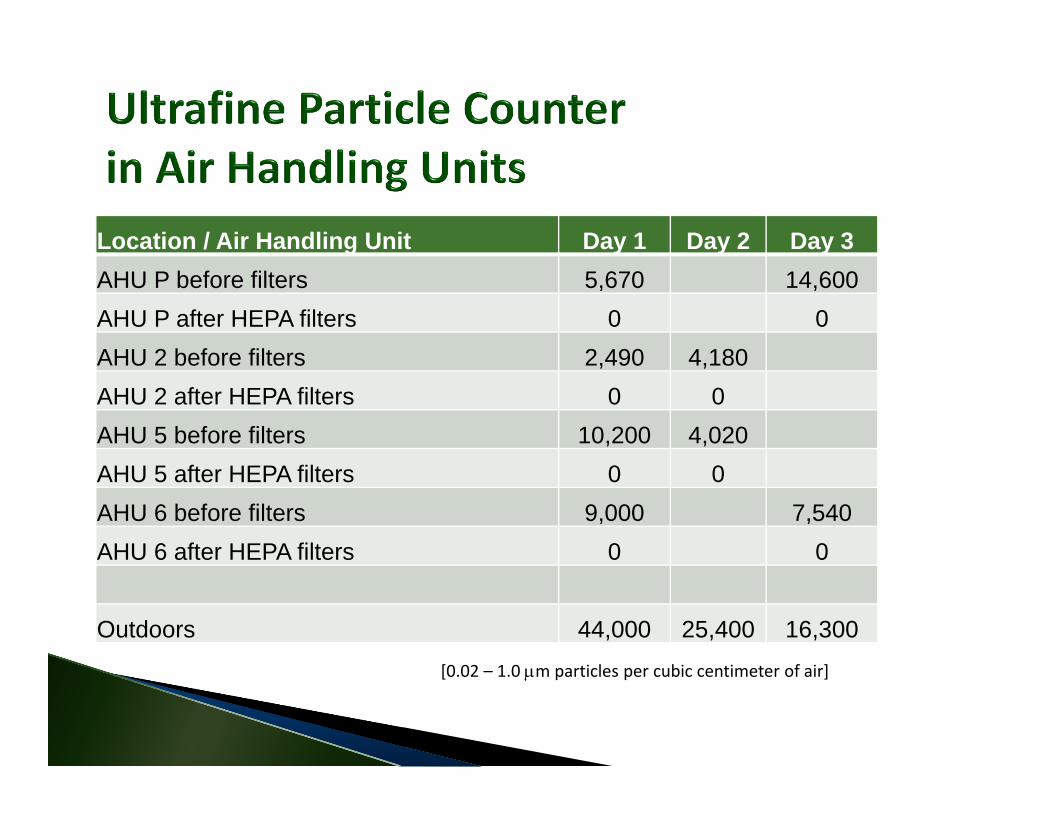
Location / Air Handling Unit Day 1 Day 2 Day 3AHU P before filters 5,670 14,600AHU P after HEPA filters 0 0AHU 2 before filters 2,490 4,180AHU 2 after HEPA filters 0 0AHU 5 before filters 10,200 4,020AHU 5 after HEPA filters 0 0AHU 6 before filters 9,000 7,540AHU 6 after HEPA filters 0 0
Outdoors 44,000 25,400 16,300[0.02 – 1.0 m particles per cubic centimeter of air]
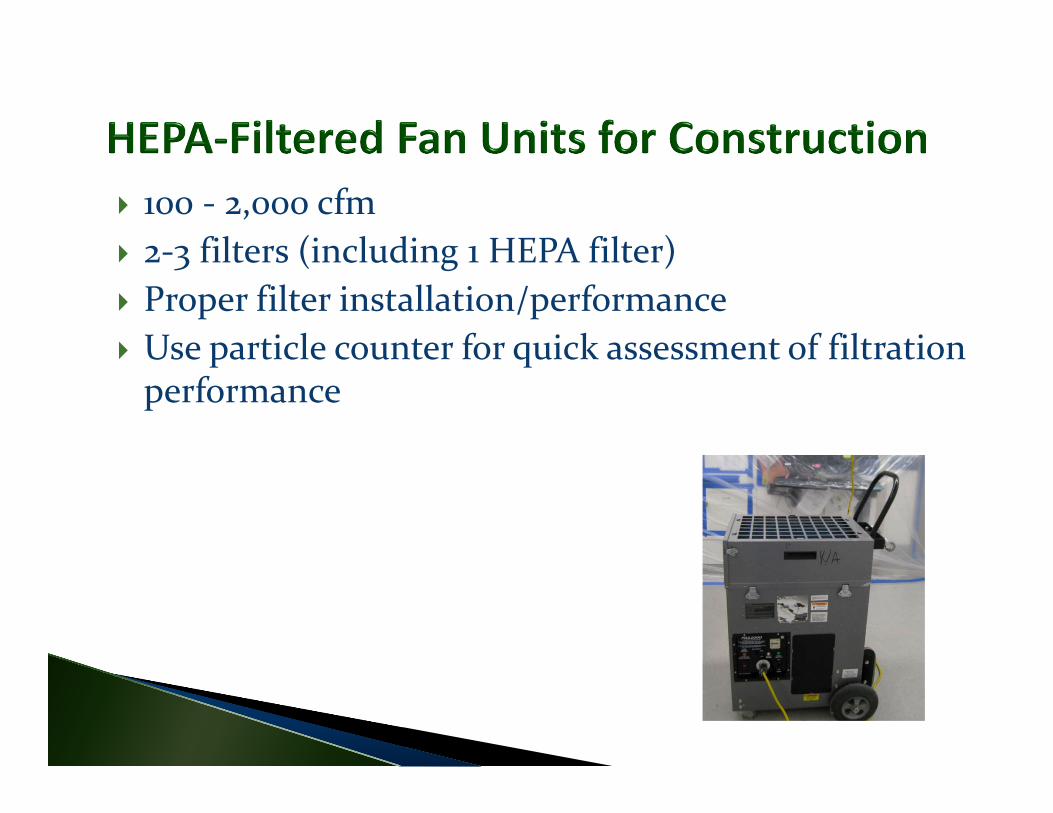
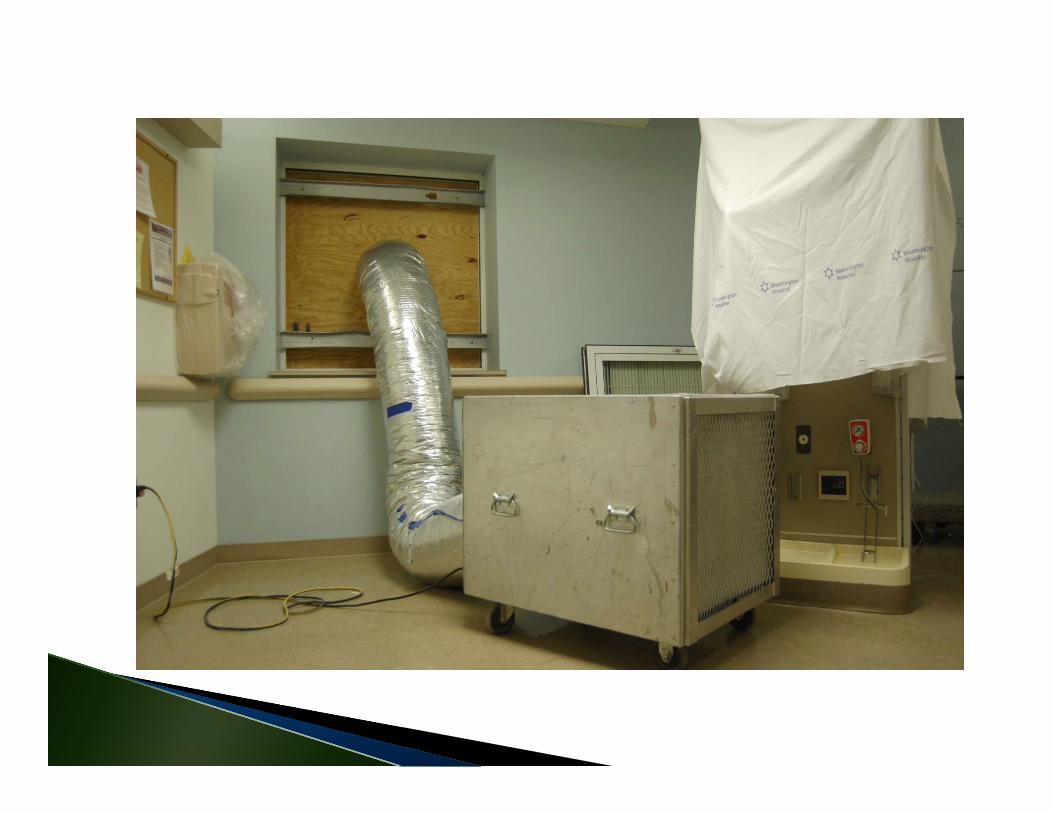
100 ‐ 2,000 cfm 2‐3 filters (including 1 HEPA filter) Proper filter installation/performance Use particle counter for quick assessment of filtration performance
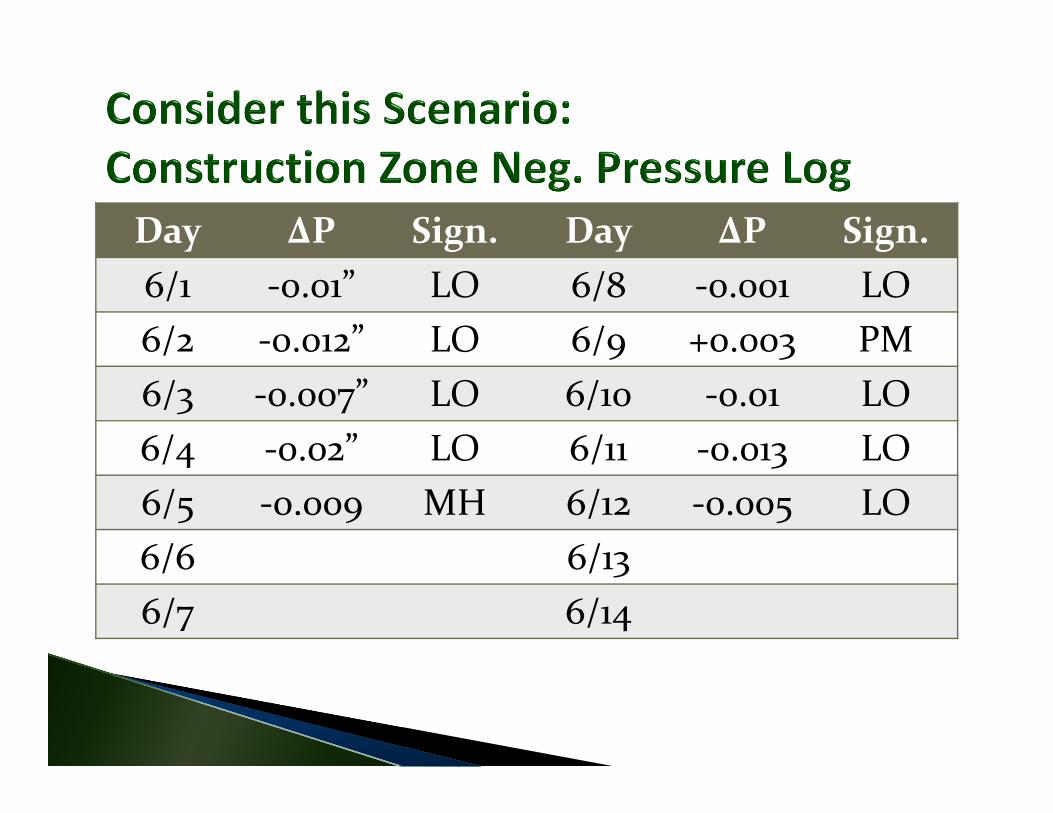
Day ΔP Sign. Day ΔP Sign.6/1 ‐0.01” LO 6/8 ‐0.001 LO6/2 ‐0.012” LO 6/9 +0.003 PM6/3 ‐0.007” LO 6/10 ‐0.01 LO6/4 ‐0.02” LO 6/11 ‐0.013 LO6/5 ‐0.009 MH 6/12 ‐0.005 LO6/6 6/136/7 6/14
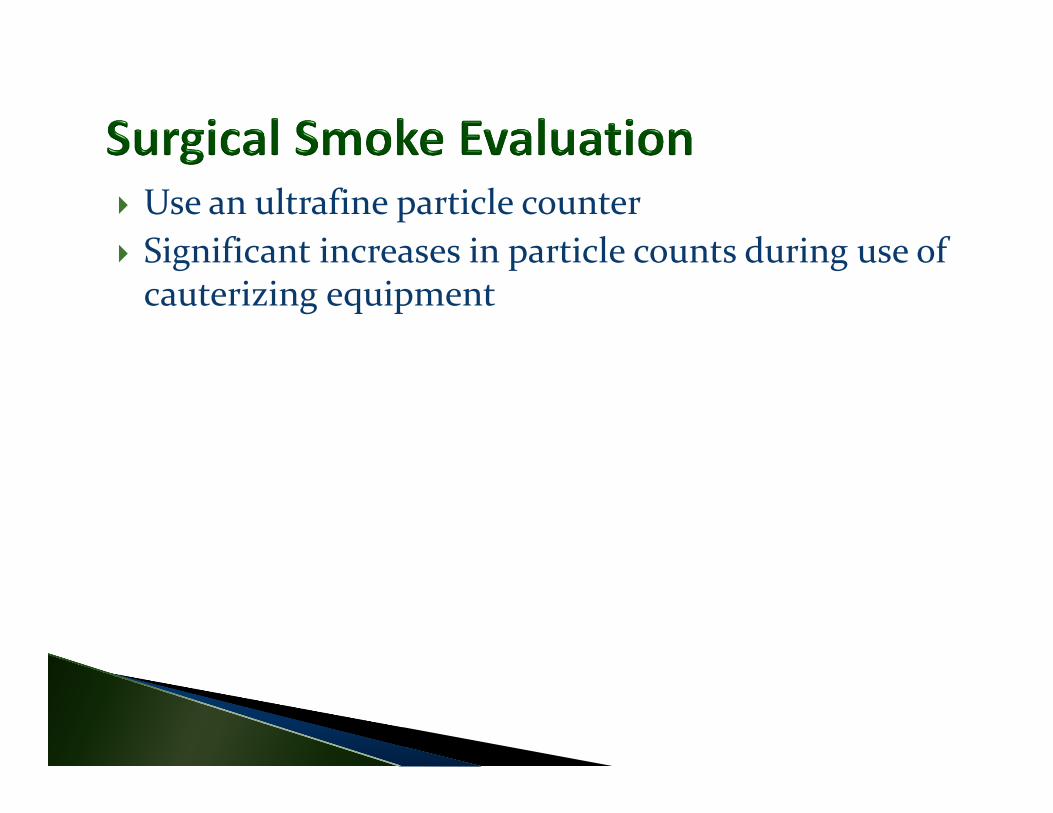
Use an ultrafine particle counter Significant increases in particle counts during use of cauterizing equipment

Situation Room Location
Particle Count Range
Average Particle Count
Patient prep OR perimeter 0 - 31 6Behind surgeon
0 - 14 3
Surgery w/o cautery
OR perimeter 1 - 393 78
Behind surgeon
1 - 179 37
Surgery w/ cautery
OR perimeter 67 - 5,770 939
Behind surgeon
46 - 7,590 2185

ACH = (CFM * 60) / (Work zone volume)
For example:‐10,000 cubic feet work zone‐1,000 cfm exhaust fan
ACH = (1000 cfm * 60) / (10,000 cf) = 6 ACH
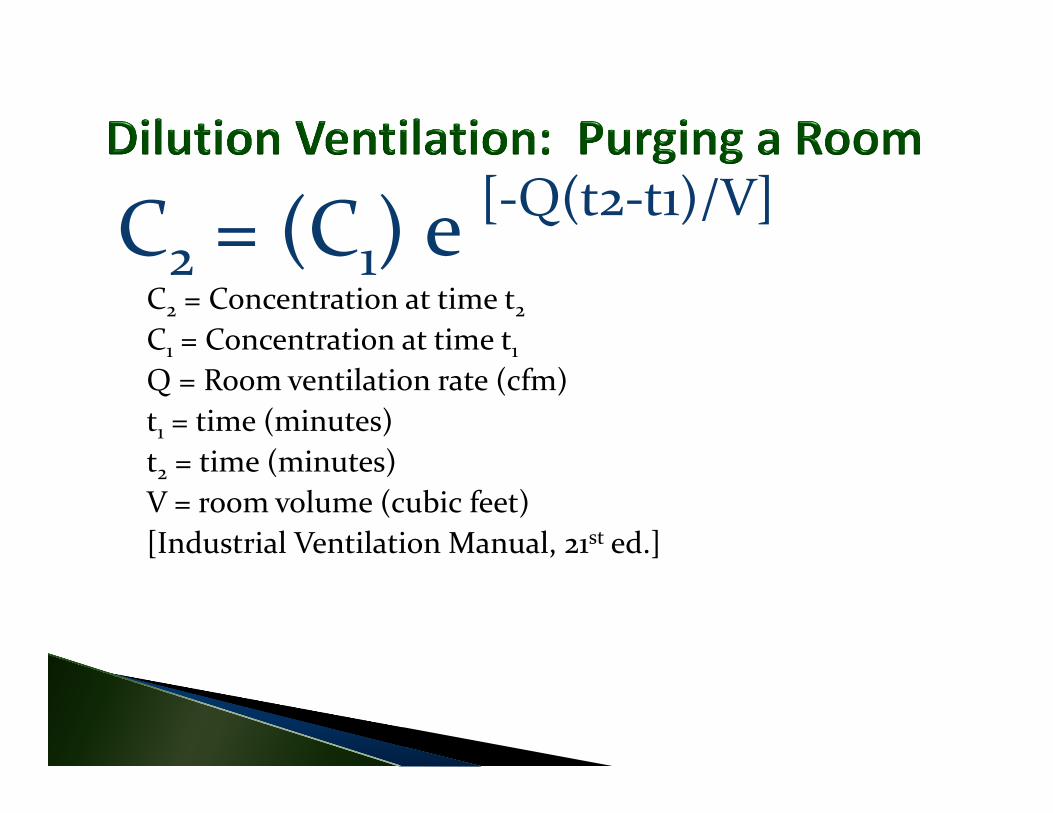
C2 = (C1) e [‐Q(t2‐t1)/V]
C2 = Concentration at time t2C1 = Concentration at time t1Q = Room ventilation rate (cfm)t1 = time (minutes)t2 = time (minutes)V = room volume (cubic feet)[Industrial Ventilation Manual, 21st ed.]

Time (minutes)% of Original Concentration
0 100.005 36.7910 13.5315 4.9820 1.8325 0.6730 0.2535 0.0940 0.0345 0.0150 0.00
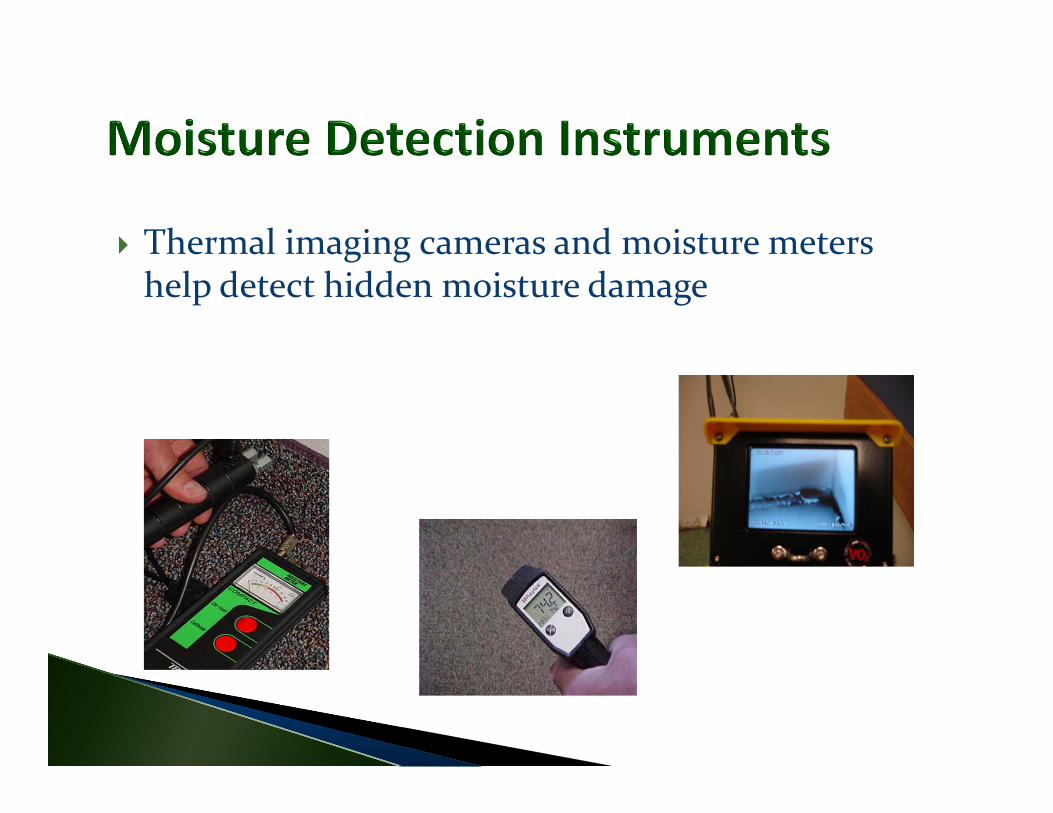
Thermal imaging cameras and moisture meters help detect hidden moisture damage

Fungi: 1 to 15 microns◦ Aspergillus spp.: 3.5 microns◦ Penicillium spp.: 3.3 microns◦ Stachybotrys spp.: 5.65 microns
Bacteria: 0.23 to 1.25 microns Viruses: <0.23 microns
[Kowalski et al. 1999]

[Kowalski et al. 1999]
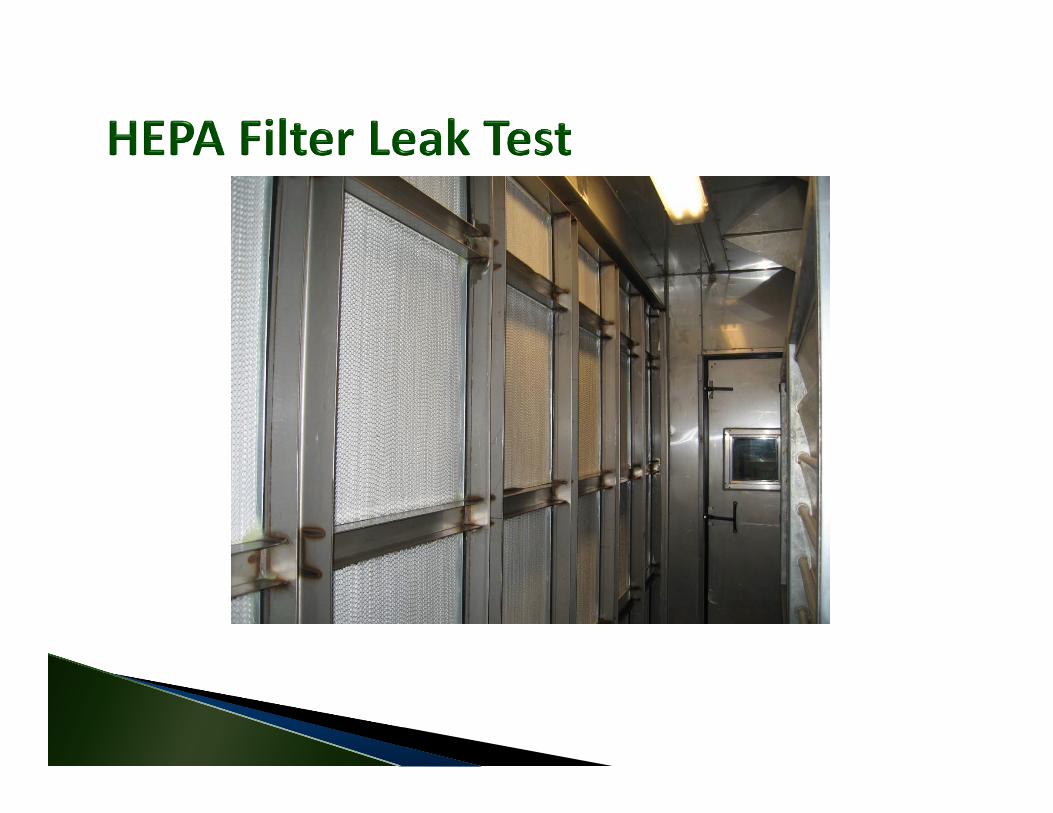

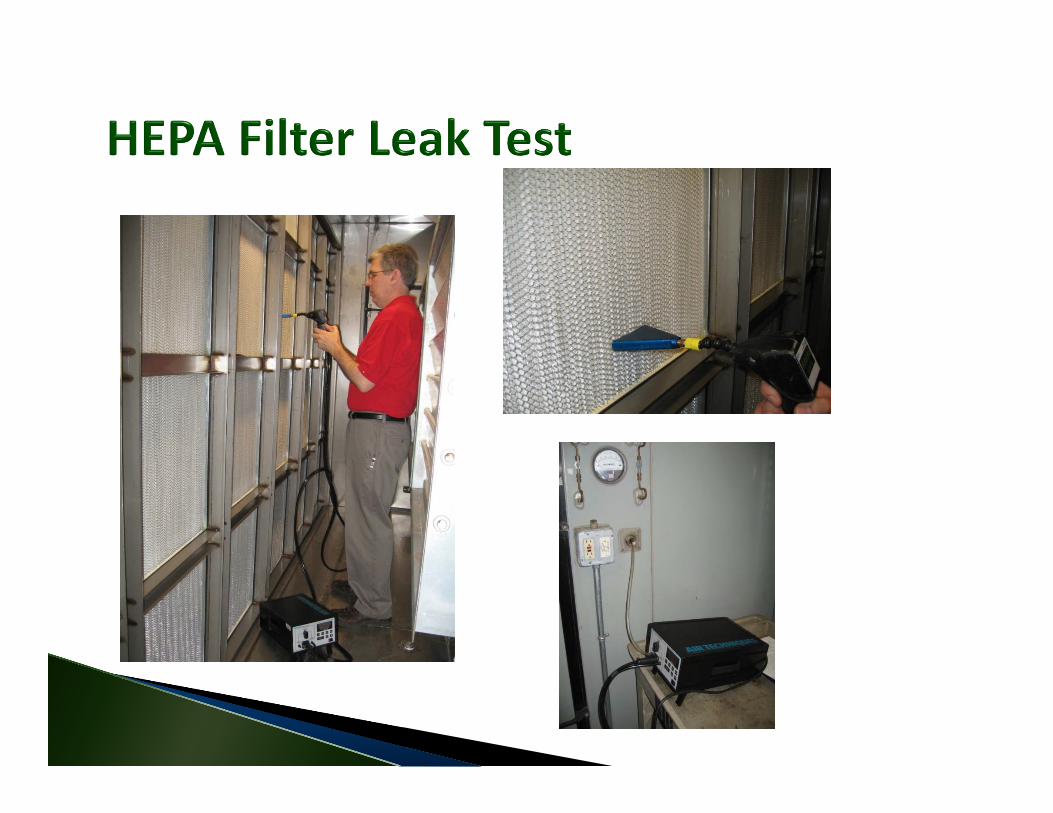
Based on Institute of Environmental Sciences and Technology Standard IEST‐RP‐CC034.2: HEPA and ULPA Filter Leak Tests
PAO aerosol generator Aerosol photometer Passing rate = no greater than 0.01% leakage

Outbreak investigation Research Monitor potentially hazardous condition Bioterrorism Validate successful abatement Evaluate change in IC practices

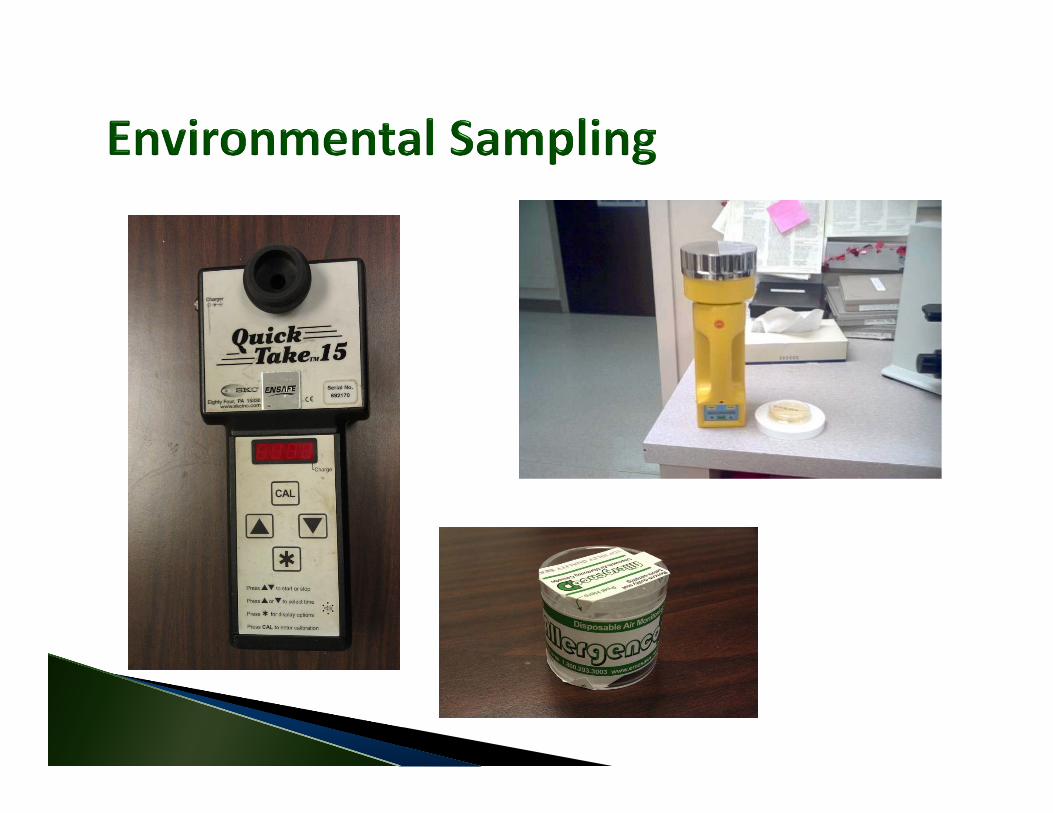
Type and concentration of microorganism Type of sampler Number of samples Sampling time Analytical methods Shipping samples Timeframe
Lack of exposure standards Lack of standard sampling protocols Variable disease susceptibility High‐risk patient issues Unknown incubation period for Aspergillus Variations in sampling equipment

Remove wet absorbent items (e.g., furniture, wallboard, carpeting, etc.) if they cannot be cleaned and dried within 72 hours (i.e., moisture content <20% as determined by moisture meter readings).
You receive a call from a nursing unit that an isolation room is in alarm. There is a TB patient in the room with active TB disease (coughing continually). You are a small hospital and only have a limited number of isolation rooms. All other rooms have potentially infectious patients in them. You discover the roof‐top exhaust fan serving the room has failed. It will take 48 hours to receive parts and repair the fan.

Leo OldEnSafe Inc.
901‐372‐7962 (office)901‐232‐4415 (cell)