Testing of concrete in structures
292
-
Upload
tarapong-pata -
Category
Documents
-
view
79 -
download
6
Transcript of Testing of concrete in structures


Testing of Concrete in Structures
Copyright 1996 Chapman & Hall

Testing of Concrete in Structures
Third Edition
J.H.BUNGEYProfessor of Civil Engineering
University of Liverpool
and
S.G.MILLARDSenior Lecturer in Civil Engineering
University of Liverpool
BLACKIE ACADEMIC & PROFESSIONALAn Imprint of Chapman & Hall
London · Glasgow · Weinheim · New York · Tokyo · Melbourne · Madras
Copyright 1996 Chapman & Hall
Published byBlackie Academic & Professional, an imprint of Chapman & Hall,Wester Cleddens Road, Bishopbriggs, Glasgow G64 2NZ
This edition published in the Taylor & Francis e-Library, 2004.
Chapman & Hall, 2–6 Boundary Row, London SE1 8HN, UK
Blackie Academic & Professional, Wester Cleddens Road, Bishopbriggs,Glasgow G64 2NZ, UK
Chapman & Hall GmbH, Pappelallee 3, 69469 Weinheim, Germany
Chapman & Hall USA, Fourth Floor, 115 Fifth Avenue, New York, NY 10003,USA
Chapman & Hall Japan, ITP-Japan, Kyowa Building, 3F, 2–2–1 Hirakawacho,Chiyoda-ku, Tokyo 102, Japan
DA Book (Aust.) Pty Ltd, 648 Whitehorse Road, Mitcham 3132, Victoria, Australia
Chapman & Hall India, R.Seshadri, 32 Second Main Road, CIT East,Madras 600 035, India
First edition 1982Second edition 1989This edition 1996
© 1996 Chapman & Hall
ISBN 0-203-48783-4 Master e-book ISBN ISBN 0-203-79607-1 (Adobe eReader Format)ISBN 0 7514 0241 9 (Print Edition)
Apart from any fair dealing for the purposes of research or private study, orcriticism or review, as permitted under the UK Copyright Designs and PatentsAct, 1988, this publication may not be reproduced, stored, or transmitted, inany form or by any means, without the prior permission in writing of thepublishers, or in the case of reprographic reproduction only in accordancewith the terms of the licences issued by the Copyright Licensing Agency inthe UK, or in accordance with the terms of licences issued by the appropriateReproduction Rights Organization outside the UK. Enquiries concerningreproduction outside the terms stated here should be sent to the publishersat the Glasgow address printed on this page.
The publisher makes no representation, express or implied, with regard tothe accuracy of the information contained in this book and cannot accept anylegal responsibility or liability for any errors or omissions that may be made.
A catalogue record for this book is available from the British LibraryLibrary of Congress Catalog Card Number: 95–80537
Copyright 1996 Chapman & Hall

Preface
Interest in testing of hardened concrete in-situ has increased considerably since the1960s, and significant advances have been made in techniques, equipment, andmethods of application since publication of the first edition of this book in 1982.This has largely been a result of the growing number of concrete structures,especially those of recent origin, that have been showing signs of deterioration.Changes in cement manufacture, increased use of cement replacements andadmixtures, and a decline in standards of workmanship and construction supervisionhave all been blamed. Particular attention has thus been paid to development of testmethods which are related to durability performance and integrity. There is also anincreasing awareness of the shortcomings of control or compliance tests whichrequire a 28-day wait before results are available. Even then, such tests reflect onlythe adequacy of the material supplied rather than overall construction standards.
In each case the need for in-situ measurements is clear, but to many engineersthe features, and especially the limitations, of available test methods are unknownand consequently left to ‘experts’. Although it is essential that the tests should beperformed and interpreted by experienced specialists, many difficulties arise bothat the planning and interpretation stages because of a lack of commonunderstanding. A great deal of time, effort and money can be wasted on unsuitableor badly planned testing, leading to inconclusive results which then become thesubject of heated debate.
The principal aim of this book is to provide an overview of the subject for non-specialist engineers who are responsible for the planning of test programmes. Thescope is wide in order to cover comprehensively as many aspects as possible ofthe testing of hardened concrete in structures. The tests, however, are treated insufficient depth to create a detailed awareness of procedures, scope andlimitations, and to enable meaningful discussions with specialists about specificmethods. Carefully selected references are also included for the benefit of thosewho wish to study particular methods in greater detail. The information and datacontained in the book have been gathered from a wide variety of internationalsources. In addition to established methods, new techniques which show potentialfor future development are outlined, although in many cases the application ofthese to concrete is still at an early stage and of limited practical value at present.Emphasis has been placed on the reliability and limitations of the varioustechniques described, and the interpretation of results is discussed from the pointof view both of specification compliance and application to design calculations.A number of illustrative examples have been included with this in mind.
Copyright 1996 Chapman & Hall

In preparing this third edition the original author has been joined by hiscolleague Dr Steve Millard and the opportunity has been taken to reflect trends inequipment and procedures which have developed over the past six years. Theseinclude a general move to automate test methods, particularly in terms of datacollection, storage and presentation. It is important to recognize that this does notimply increased accuracy. Interest in the application of statistical methods tointerpretation of strength test results has grown, especially in the USA, and detailshave been incorporated into Chapter 1 and illustrated by an additional example inAppendix A.
The growing importance of performance monitoring is reflected in Chapter 6,whilst Chapter 7 which deals with durability has a good deal of new materialrelating to corrosion assessment and surface zone permeability measurementtechniques. Both of these areas have seen significant developments of apparatusand procedures since the second edition was prepared. The coverage of sub-surface radar, which has now become an established technique, is similarlyincreased in Chapter 8, whilst many other developments have also beenincorporated throughout the book. References to Standards have been updatedand a significant number of recent new references have been added.
The basic testing techniques will be similar in all parts of the world, althoughnational standards may introduce minor procedural variations and units will ofcourse differ. This book has been based on the SI units currently in use in Britain,and where reference to Codes of Practice has been necessary, emphasis is placedon the current recommendations of British Standards. The most recent versions ofstandards should always be consulted, since recommendations will inevitably bemodified from time to time.
We are very grateful to many engineers worldwide for discussions in whichthey have provided valuable advice and guidance. Particular thanks are due tomembers of the former BSI Subcommittee CAB/4/2 (Non-destructive Testing ofConcrete) for the stimulation provided by their contributions to meetings of thatsubcommittee and to our colleague at Liverpool, Mr R.G. Tickell for his assistancewith statistical material. Our thanks are also extended to Mr M.Grantham of M.GAssociates for his advice relating to the updating of Chapter 9 on ChemicalAnalysis. Photographs have been kindly provided by Tysons Plc, ProfessorF.Sawko, CNS Electronics Ltd, Steinweg UK Ltd, Hammond Concrete Services,Agema Infrared Systems, Protimeter Plc, Dr A.Poulsen and Germann Aps andthese are gratefully acknowledged. Thanks are also due to Ms M.A.Revell fortyping the original manuscript, to Ms A.Ventress for typing new materialassociated with this edition and Mrs B.Cotgreave for preparation of the diagrams.
J.H.B.S.G.M.
Copyright 1996 Chapman & Hall

Contents
1 Planning and interpretation of in-situ testing1.1 Aims of in-situ testing
1.1.1 Compliance with specification1.1.2 Assessment of in-situ quality and integrity
1.2 Guidance available from ‘standards’ and other documents1.3 Test methods available1.4 Test programme planning
1.4.1 General sequential approach1.4.2 Visual inspection1.4.3 Test selection1.4.4 Number and location of tests
1.5 In-situ concrete variability1.5.1 Within-member variability1.5.2 In-situ strength relative to standard specimens
1.6 interpretation1.6.1 Computation of test results1.6.2 Examination of variability1.6.3 Calibration and application of test results
1.7 Test combinations1.7.1 Increasing confidence level of results1.7.2 Improvement of calibration accuracy1.7.3 Use of one method as preliminary to another1.7.4 Test calibration1.7.5 Diagnosis of causes of deterioration
1.8 Documentation by standards
2 Surface hardness methods2.1 Rebound test equipment and operation2.2 Procedure2.3 Theory, calibration and interpretation
2.3.1 Factors influencing test results2.3.2 Calibration2.3.3 Interpretation2.3.4 Applications and limitations
3 Ultrasonic pulse velocity methods3.1 Theory of pulse propagation through concrete3.2 Pulse velocity equipment and use
3.2.1 Equipment3.2.2 Use
3.3 Test calibration and interpretation of results3.3.1 Strength calibration3.3.2 Practical factors influencing measured results
3.4 Applications3.4.1 Laboratory applications3.4.2 In-situ applications
3.5 Reliability and limitations
Copyright 1996 Chapman & Hall
4 Partially destructive strength tests4.1 Penetration resistance testing
4.1.1 Windsor probe4.1.2 Pin penetration test
4.2 Pull-out testing4.2.1 Cast-in methods4.2.2 Drilled-hole methods
4.3 Pull-off methods4.4 Break-off methods
4.4.1 Norwegian method4.4.2 Stoll tork test4.4.3 Shearing-rib method
5 Cores5.1 General procedures for core cutting and testing
5.1.1 Core location and size5.1.2 Drilling5.1.3 Testing
5.2 Interpretation of results5.2.1 Factors influencing measured core compressive strength5.2.2 Estimation of cube strength5.2.3 Reliability, limitations and applications
5.3 Small cores5.3.1 Influence of specimen size5.3.2 Reliability, limitations and applications
6 Load testing and monitoring6.1 In-situ load testing
6.1.1 Testing procedures6.1.2 Load application techniques6.1.3 Measurement and interpretation6.1.4 Reliability, limitations and applications
6.2 Monitoring6.2.1 Monitoring during construction6.2.2 Long-term monitoring
6.3 Strain measurement techniques6.3.1 Methods available6.3.2 Selection of methods
6.4 Ultimate load testing6.4.1 Testing procedures and measurement techniques6.4.2 Reliability, interpretation and applications
7 Durability tests7.1 Corrosion of reinforcement and prestressing steel
7.1.1 Electromagnetic cover measurement7.1.2 Half-cell potential measurement7.1.3 Resistivity measurements7.1.4 Perturbative measurement of corrosion rate7.1.5 Other electrical techniques
7.2 Moisture measurement7.2.1 Simple methods7.2.2 Neutron moisture gauges7.2.3 Electrical methods7.2.4 Microwave absorption
7.3 Absorption and permeability tests7.3.1 Initial surface absorption test
Copyright 1996 Chapman & Hall
7.3.2 Figg air and water permeability tests7.3.3 Combined ISAT and Figg methods7.3.4 Hansen gas permeability test7.3.5 ‘Autoclam’ permeability system7.3.6 Flow tests7.3.7 BS absorption test7.3.8 DIN 1048 absorption test7.3.9 ‘Sorptivity’ test7.3.10Capillary rise test7.3.11Vacuum test
7.4 Tests for alkali-aggregate reaction7.5 Tests for freeze-thaw resistance7.6 Abrasion resistance testing
8 Performance and integrity tests8.1 Infrared thermography8.2 Radar
8.2.1 Radar systems8.2.2 Structural applications and limitations
8.3 Dynamic response testing8.3.1 Simple ‘non-instrumented’ approaches8.3.2 Pulse-echo techniques8.3.3 Surface wave techniques8.3.4 Testing large-scale structures
8.4 Radiography and radiometry8.4.1 X-radiography8.4.2 Gamma radiography8.4.3 Gamma radiometry
8.5 Holographic and acoustic emission techniques8.5.1 Holographic techniques8.5.2 Acoustic emission
8.6 Photoelastic methods8.7 Maturity and temperature matched curing
8.7.1 Maturity measurements8.7.2 Temperature matched curing
8.8 Screed soundness tester8.9 Tests for fire damage
9 Chemical testing and allied techniques9.1 Sampling and reporting
9.1.1 Sampling9.1.2 Reporting
9.2 Cement content and aggregate/cement ratio9.2.1 Theory9.2.2 Procedures9.2.3 Reliability and interpretation of results
9.3 Original water content9.3.1 Theory9.3.2 Procedure9.3.3 Reliability and interpretation of results
9.4 Cement type and cement replacements9.4.1 Theory9.4.2 Procedures9.4.3 Reliability and interpretation of results
9.5 Aggregate type and grading9.5.1 Aggregate type9.5.2 Aggregate grading
Copyright 1996 Chapman & Hall

9.6 Sulphate determination9.7 Chloride determination
9.7.1 Procedures9.7.2 Reliability and interpretation of results
9.8 Alkali reactivity tests9.8.1 Alkali content9.8.2 Alkali immersion test
9.9 Admixtures9.10Carbonation9.11Microscopic methods
9.11.1Surface examination by reflected light9.11.2Thin-section methods
9.12Thermoluminescence testing9.12.1Theory9.12.2Equipment and procedure9.12.3Reliability, limitations and applications
9.13Specialized instrumental methods9.13.1X-ray fluorescence spectrometry9.13.2Differential thermal methods9.13.3Thermogravimetry, X-ray diffraction, infrared and atomic
absorption spectrometry and scanning electron microscopy
Appendix A Typical cases of test planning and interpretation of resultsA1 28-day cubes fail (cube results suspect)A2 28-day cubes fail (cube results genuine)A3 Cubes non-existent for new structureA4 Cubes damaged for new structureA5 Cubes non-existent for existing structureA6 Surface crackingA7 Reinforcement corrosion
Appendix B Examples of pulse velocity corrections for reinforcement
Appendix C Example of evaluation of core results
References
Copyright 1996 Chapman & Hall

1 Planning and interpretation of in-situ testing
A great deal of time, effort and expense can be wasted on in-situ testing unless theaims of the investigation are clearly established at the outset. These will affect thechoice of test method, the extent and location of the tests and the way in whichthe results are handled—inappropriate or misleading test results are often obtainedas a result of a genuine lack of knowledge or understanding of the proceduresinvolved. If future disputes over results are to be avoided, liaison of all partiesinvolved is essential at an early stage in the formulation of a test programme.Engineering judgement is inevitably required when intepreting results, but theuncertainties can often be minimized by careful planning of the test programme.
A full awareness of the range of tests available, and in particular theirlimitations and the accuracies that can be achieved, is important if disappointmentand disillusion is to be avoided. Some methods appear to be very simple, but allare subject to complex influences and the use of skilled operators and anappropriately experienced engineer are vital.
In-situ testing of existing structures is seldom cheap, since complex accessarrangements are often necessary and procedures may be time-consuming. Ideallya programme should evolve sequentially, in the light of results obtained, to providethe maximum amount of worthwhile information with minimum cost anddisruption. This approach, which requires ongoing interpretation, will alsofacilitate changes of objectives which may arise during the course of aninvestigation.
1.1 Aims of in-situ testing
Three basic categories of concrete testing may be identified.
(i) Control testing is normally carried out by the contractor or concreteproducer to indicate adjustments necessary to ensure an acceptablesupplied material.
(ii) Compliance testing is performed by, or for, the engineer according to anagreed plan, to judge compliance with the specification.
(iii) Secondary testing is carried out on hardened concrete either in, orextracted from, the structure. This may be required in situations wherethere is doubt about the reliability of control and compliance results orthey are unavailable or inappropriate, as in an old, damaged, or
Copyright 1996 Chapman & Hall

deteriorating structure. All testing which is not planned beforeconstruction will be in this category, although long-term monitoring isalso included.
Control and compliance tests have traditionally been performed on ‘standard’hardened specimens made from samples of the same concrete as used in a structure;it is less common to test fresh concrete. There are also instances in which in-situtests on the hardened concrete may be used for this purpose. This is most commonin the precasting industry for checking the quality of standardized units, and theresults can be used to monitor the uniformity of units produced as well as theirrelationship to some pre-established minimum acceptable value. There is, generally,an increasing awareness amongst engineers that ‘standard’ specimens, althoughnotionally of the same material, may misrepresent the true quality of concreteactually in a structure. This is due to a variety of causes, including non-uniformsupply of material and differences of compaction, curing and general workmanship,which may have a significant effect on future durability. As a result, a trend towardsin-situ compliance testing, using methods which are either non-destructive or causeonly very limited damage, is emerging, particularly in North America andScandinavia. Such tests are most commonly used as a back-up for conventionaltesting, although there are notable instances such as the Storebaelt project wherethey have played a major role (1). They offer the advantage of early warning ofsuspect strength, as well as the detection of defects such as inadequate cover, highsurface permeability, voids, honeycombing or use of incorrect materials whichmay otherwise be unknown but lead to long-term durability problems. Testing ofthe integrity of repairs is another important and growing area of application.
The principal usage of in-situ tests is nevertheless as secondary testing, whichmay be necessary for a wide variety of reasons. These fall into two basiccategories.
1.1.1 Compliance with specificationThe most common example is where additional evidence is required in contractualdisputes following non-compliance of standard specimens. Other instancesinvolve retrospective checking following deterioration of the structure, and willgenerally then be related to apportionment of blame in legal actions. Strengthrequirements form an important part of most specifications, and the engineer mustselect the most approriate methods of assessing the in-situ strength on arepresentative basis, with full knowledge of the likely variations to be expectedwithin various structural members (as discussed in section 1.5). The results shouldbe interpreted to determine in-situ variability as well as strength, but a majordifficulty arises in relating measured in-situ strength to anticipated corresponding‘standard’ specimen strength at a specific but different age. Borderline cases maythus be difficult to prove conclusively. This problem is examined in detail insection 1.5.2.
Copyright 1996 Chapman & Hall

Minimum cement content will usually be specified to satisfy durabilityrequirements, and chemical or petrographic tests may be necessary to confirmcompliance. Similar tests may also be required to check for the presence offorbidden admixtures, contamination of concrete constituents (e.g. chlorides insea-dredged aggregates) or entrained air, and to verify cement contentfollowing deterioration. Poor workmanship is often the principal cause ofdurability problems, and tests may also be aimed at demonstrating inadequatecover or compaction, incorrect reinforcement quantities or location, or poorquality of curing or specialist processes such as grouting of post-tensionedconstruction.
1.1.2 Assessment of in-situ quality and integrityThis is primarily concerned with the current adequacy of the existing structureand its future performance. Routine maintenance needs of concrete structures arenow well established, and increasingly utilize in-situ testing to assist ‘lifetimepredictions’ (2, 3). It is important to distinguish between the need to assess theproperties of the material, and the performance of a structural member as a whole.The need for testing may arise from a variety of causes, which include
(i) Proposed change of usage or extension of a structure(ii) Acceptability of a structure for purchace or insurance
(iii) Assessment of structural integrity or safety following materialdeterioration, or structural damage such as caused by fire, blast, fatigueor overload
(iv) Serviceability or adequacy of members known or suspected to containmaterial which does not meet specifications, or with design faults
(v) Assessment of cause and extent of deterioration as a preliminary to thedesign of repair or remedial schemes
(vi) Assessment of the quality or integrity of applied repairs(vii) Monitoring of strength development in relation to formwork stripping,
curing, prestressing or load application(viii) Monitoring long-term changes in materials properties and structural
performance. Although in specialized structures, features such as density or permeability maybe relevant, generally it is either the in-situ strength or durability performancethat is regarded as the most important criterion. Where repairs are to be appliedusing a different material from the ‘parent’ concrete, it may be desirable tomeasure the elastic modulus to determine if strain incompatibilities undersubsequent loading may lead to a premature failure of the repair. A knowledge ofelastic modulus may also be useful when interpreting the results of load tests. Forstrength monitoring during construction, it will normally only be necessary tocompare test results with limits established by trials at the start of the contract, but
Copyright 1996 Chapman & Hall

in other situations a prediction of actual concrete strength is required to incorporateinto calculations of member strength. Where calculations are to be based onmeasured in-situ strength, careful attention mut be paid to the numbers and locationof tests and the validity of the safety factors adopted, and this problem is discussedin section 1.6.
Durability assessments will concentrate upon identifying the presence ofinternal voids or cracking, materials likely to cause disruption of the concrete (e.g.sulphates or alkali-reactive aggregates), and the extent or risk of reinforcementcorrosion. Carbonation depths, chloride concentrations, cover thicknesses andsurface zone resistivity and permeability will be key factors relating to corrosion.Electrochemical activity associated with corrosion can also be measured to assesslevels of risk, using passive or perturbative test methods.
Difficulties in obtaining an accurate quantitative estimate of in-situ concreteproperties can be considerable: wherever possible the aim of testing should be tocompare suspect concrete with similar concrete in other parts of the structurewhich is known to be satisfactory, or of proven quality.
Investigation of the overall structural performance of a member is frequentlythe principal aim of in-situ testing, and it should be recognized that in manysituations this would be most convincingly demonstrated directly by means of aload test. The confidence attached to the findings of the investigation may then beconsiderably greater than if member strength predictions are derived indirectlyfrom strength estimates based on in-situ materials tests. Load testing may howeverbe prohibitively expensive or simply not a practical proposition.
1.2 Guidance available from ‘standards’ and other documents
National standards are available in a number of countries, notably the UK, USAand Scandinavia, detailing procedures for the most firmly established testingmethods. Principal British and ASTM standards are listed at the end of this chapterand specific references are also included in the text. ISO standards are also underdevelopment in some cases. Details of all methods are otherwise contained in anextensive body of published specialist research papers, journals, conferenceproceedings and technical reports. References to a key selection of these areprovided as appropriate.
General guidance concerning the philosophy of maintenance inspection ofexisting structures is provided by FIP (4) and also by the Institution of StructuralEngineers (5) who consider appraisal processes and methods as well as testingrequirements. Advice is also offered on sources of information, reporting, andindentification of defects with their possible causes. Specific guidance on damageclassification is proposed by RILEM (6) whilst ACI committee 364 have produceda guide for evaluation of concrete structures prior to rehabilitation (7). Guidancerelating to assessment approaches to specialized situations such as high alumina
Copyright 1996 Chapman & Hall
cement concrete (8), fire (9) and bomb-damaged structures (10) is also available.BS 1881: Part 201, Guide to the use of non-destructive methods of test forhardened concrete (11), provides outline descriptions of 23 wide-rangingmethods, together with guidance on test selection and planning, whilst BS 6089(12) relates specifically to in-situ strength assessment. Methods and apparatuswhich are commercially available are constantly changing and developing, butCIRIA Technical Note 143 (13) reviewed those existing in the UK in 1992 whilstSchickert has outlined the situation in Germany in 1994 (14). Carino has alsorecently reviewed the worldwide historical development of non-destructive testingof concrete from the North American perspective and has identified futureprospects (15). As newer methods become established it is likely that furtherstandards and reports will appear. ACI Committee 228 is currently preparing asubstantial report reviewing non-destructive methods whilst RILEM Committee126 is considering in-place strength testing. In the UK, the Concrete Society isalso preparing technical reports on reinforcement corrosion assessment and sub-surface radar methods.
1.3 Test methods available
Details of individual methods are given in subsequent chapters and may beclassified in a variety of ways. Table 1.1 lists the principal tests in terms of theproperty under investigation. The range of available tests is large, and there areothers which are not included in the table but are described in this book. Visualinspection, assisted where necessary by optical devices, is a valuable assessmenttechnique which must be included in any investigation. There will of course beoverlap of usage of some tests between the applications listed (see section 1.4.3),and where a number of options are available considerations of access, damage,cost, time and reliability will be important.
The test methods may also be classified as follows:
Non-destructive methods. Non-destructive testing is generally defined as notimpairing the intended performance of the element or member under test, andwhen applied to concrete is taken to include methods which cause localizedsurface zone damage. Such tests are commonly described as partially-destructive and many of those listed in Table 1.1 are of this type. All non-destructive methods can be performed directly on the in-situ concrete withoutremoval of a sample, although removal of surface finishes is likely to benecessary.
Methods requiring sample extraction. Samples are most commonly taken inthe form of cores drilled from the concrete, which may be used in the laboratoryfor strength and other physical tests as well as visual, petrographic and chemicalanalysis. Some chemical tests may be performed on smaller drilled powdered
Copyright 1996 Chapman & Hall

sample taken directly from the structure, thus causing substantially less damage,but the risk of sample contamination is increased and precision may be reduced.Making good the sampling damage will be necessary, as with partially-destructivemethods.
The nature of the testing equipment ranges from simple inexpensive hand-helddevice to complex, expensive, highly specialized items, possibly requiring extensive
Table 1.1 Principal test methods
Copyright 1996 Chapman & Hall

preparation or safety precautions, which will be used only where no simplealternative exists. Few of the methods give direct quantitative measurement of thedesired property, and correlations will often be necessary. Practical limitations,reliability and accuracy vary widely and are discussed in the sections of this bookdealing with the various individual methods. Selection of the most appropriatetests within the categories of Table 1.1 is discussed in section 1.4.3 of this chapter.
1.4 Test programme planning
This involves consideration of the most appropriate tests to meet the establishedaims of the investigation, the extent or number of tests required to reflect the truestate of the concrete, and the location of these tests. Investigations have been madeinto the use of Expert Systems to assist this process but at the present time it seemslikely that their application will be largely confined to a training role (16). Visualinspection is an essential feature whatever the aims of the test programme, andwill enable the most worthwhile application of the tests which have beensummarized in section 1.3. Some typical illustrative examples of test programmesto meet specific requirements are given in Appendix A.
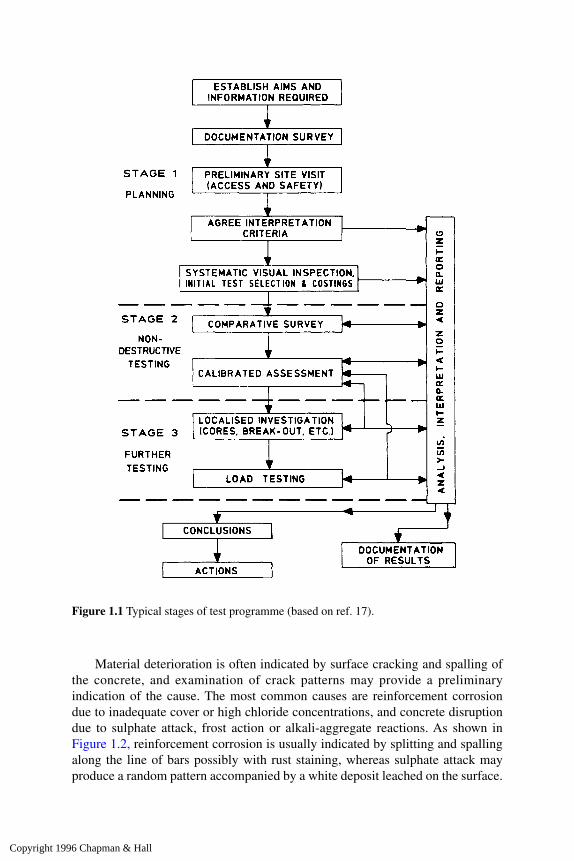
1.4.1 General sequential approachA properly structured programme is essential, with interpretation as an ongoingactivity, whatever the cause or nature of an investigation. Figure 1.1 illustrates thestages typically involved (17), which will generally require increasing costcommitment, and the investigation will proceed only as far as is necessary to reachfirm relevant conclusions.
1.4.2 Visual inspectionThis can often provide valuable information to the well-trained eye. Visualfeatures may be related to workmanship, structural serviceability and materialdeterioration, and it is particularly important that the engineer be able todifferentiate between the various types of cracking which may be encountered.Figure 1.2 illustrates a few of these in their typical forms.
Segregation or excessive bleeding at shutter joints may reflect problems withthe concrete mix, as might plastic shrinkage cracking, whereas honeycombingmay be an indication of low standards of construction workmanship. Lack ofstructural adequacy may show itself by excessive deflection or flexural cracking,and this may frequently be the reason for an in-situ assessment of a structure.Long-term creep deflections, thermal movements, or structural movements maycause distortion of door frames, cracking of windows, or cracking of a structureor its finishes. Visual comparison of similar members is particularly valuable as apreliminary to testing to determine the extent of the problem in such cases.
Copyright 1996 Chapman & Hall
Material deterioration is often indicated by surface cracking and spalling ofthe concrete, and examination of crack patterns may provide a preliminaryindication of the cause. The most common causes are reinforcement corrosiondue to inadequate cover or high chloride concentrations, and concrete disruptiondue to sulphate attack, frost action or alkali-aggregate reactions. As shown inFigure 1.2, reinforcement corrosion is usually indicated by splitting and spallingalong the line of bars possibly with rust staining, whereas sulphate attack mayproduce a random pattern accompanied by a white deposit leached on the surface.
Figure 1.1 Typical stages of test programme (based on ref. 17).
Copyright 1996 Chapman & Hall
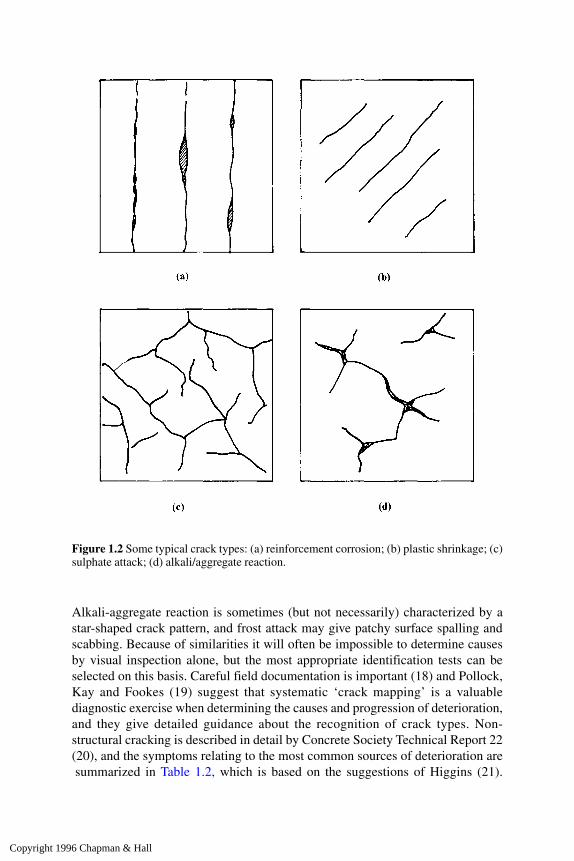
Alkali-aggregate reaction is sometimes (but not necessarily) characterized by astar-shaped crack pattern, and frost attack may give patchy surface spalling andscabbing. Because of similarities it will often be impossible to determine causesby visual inspection alone, but the most appropriate identification tests can beselected on this basis. Careful field documentation is important (18) and Pollock,Kay and Fookes (19) suggest that systematic ‘crack mapping’ is a valuablediagnostic exercise when determining the causes and progression of deterioration,and they give detailed guidance about the recognition of crack types. Non-structural cracking is described in detail by Concrete Society Technical Report 22(20), and the symptoms relating to the most common sources of deterioration are summarized in Table 1.2, which is based on the suggestions of Higgins (21).
Figure 1.2 Some typical crack types: (a) reinforcement corrosion; (b) plastic shrinkage; (c)sulphate attack; (d) alkali/aggregate reaction.
Copyright 1996 Chapman & Hall

Observation of concrete surface texture and colour variations may be a usefulguide to uniformity, and colour change is a widely recognized indicator of theextent of fire damage.
Visual inspection is not confined to the surface, but may also includeexamination of bearings, expansion joints, drainage channels, post-tensioningducts and similar features of a structure. Binoculars, telescopes and borescopesmay be useful where access is difficult and portable ultra-violet inspection systemsmay be useful in identifying alkali-aggregate reactions (see section 9.11.1).Recently there has been an increasing acceptance of ‘unconventional’ methodssuch as abseiling and robotics to provide cost-effective inspection and remediationaccess (22). For existing structures, the existence of some feature requiring furtherinvestigation is generally initially indicated by visual inspection, and it must beconsidered the single most important component of routine maintenance. RecentRILEM (6) proposals attempt to provide a numerical classification system topermit the quantification of visual features to assist planning and prioritization.Visual inspection will also provide the basis of judgments relating to access andsafety requirements (22) when selecting test methods and test locations.
1.4.3 Test selectionTest selection for a particular situation will be based on a combination of factorssuch as access, damage, cost, speed and reliability, but the basic features of visualinspection followed by a sequence of tests according to convenience andsuitability will generally apply. The use of combinations of test methods isdiscussed in section 1.7.
Table 1.2 Diagnosis of defects and deterioration
Copyright 1996 Chapman & Hall

Testing for durability including causes and extent of deterioration. Relativefeatures of various test methods are summarized in Table 1.3. Corrosion risk ofembedded reinforcement is related to the loss of passivity which is provided bythe alkaline concrete environment. This is usually as a result of carbonation orchlorides. Simple initial tests will thus involve localized measurements ofreinforcement cover, carbonation depths and chloride concentrations. These maybe followed by more complex half-cell potential and resistivity testing to providea more comprehensive survey of large areas. If excessive carbonation is found tobe the cause of deterioration, then chemical or petrographic analysis andabsorption tests may follow if it is necessary to identify the reasons for this. Directmeasurement of the rate of corrosion of reinforcing steel is slowly gainingacceptance as an effective means of assessing the severity of ongoing durabilitydamage and has the potential for use to predict the remaining service lifetime of acorrosion-afflicted structure.
Surface absorption and permeability tests are important in relation to corrosionsince both oxygen and water are required to fuel the process, and carbonationrates are also governed by moisture conditions and the ability of atmosphericcarbon dioxide to pass through the concrete surface zone. Most other forms ofdeterioration are also related to moisture which is needed to transport aggressivechemicals and to fuel reactions, thus moisture content, absorption andpermeability measurements may again be relevant. Expansion tests on samples ofconcrete may indicate future performance, and chemical and petrographic testingto assess mix components may be required to identify the causes of disruption ofconcrete (23).
Table 1.3 Durability tests—relative features
Copyright 1996 Chapman & Hall
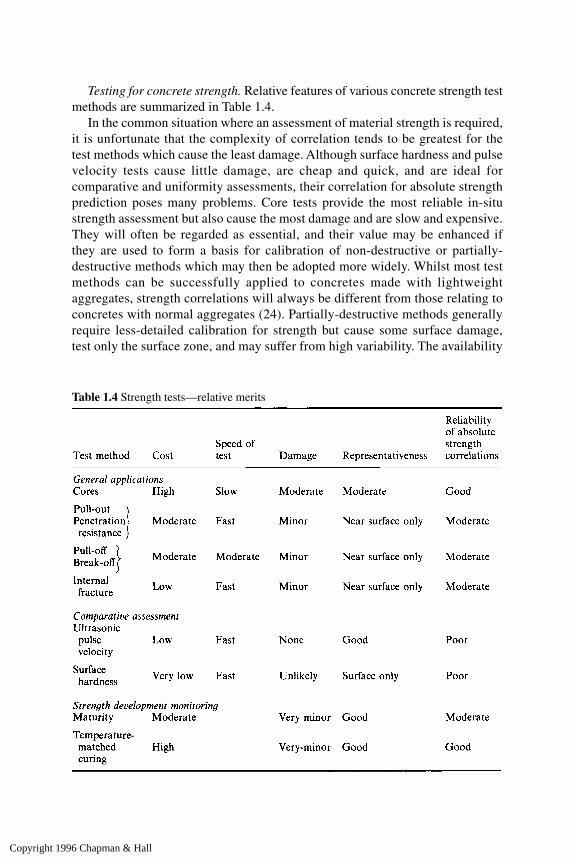
Testing for concrete strength. Relative features of various concrete strength testmethods are summarized in Table 1.4.
In the common situation where an assessment of material strength is required,it is unfortunate that the complexity of correlation tends to be greatest for thetest methods which cause the least damage. Although surface hardness and pulsevelocity tests cause little damage, are cheap and quick, and are ideal forcomparative and uniformity assessments, their correlation for absolute strengthprediction poses many problems. Core tests provide the most reliable in-situstrength assessment but also cause the most damage and are slow and expensive.They will often be regarded as essential, and their value may be enhanced ifthey are used to form a basis for calibration of non-destructive or partially-destructive methods which may then be adopted more widely. Whilst most testmethods can be successfully applied to concretes made with lightweightaggregates, strength correlations will always be different from those relating toconcretes with normal aggregates (24). Partially-destructive methods generallyrequire less-detailed calibration for strength but cause some surface damage,test only the surface zone, and may suffer from high variability. The availability
Table 1.4 Strength tests—relative merits
Copyright 1996 Chapman & Hall

and reliability of strength correlations and the accuracy required from the strengthpredictions may be important factors in selecting the most appropriate methods touse. This must be coupled with the acceptability of making good any damagedareas for appearance and structural integrity.
When comparison with concrete of similar quality is all that is necessary, thechoice of test will be dominated by the practical limitations of the variousmethods. The least destructive suitable method will be used initially, possibly withback-up tests using another method in critical regions. For example, surfacehardness methods may be used for new concrete, or ultrasonics where twoopposite surfaces are accessible. When there is only one exposed face, penetrationresistance testing is quick and suitable for large members such as slabs, but pull-out or pull-off tests may be more suitable for smaller members. Pull-out testing isparticularly useful for direct in-situ measurements of early age strengthdevelopment, while maturity and temperature-matched curing techniques arebased on measurements of within-pour temperatures.
Testing for comparative concrete quality, and localized integrity. Comparativetesting is the most reliable application of a number of methods for whichcalibration to give absolute values of a well-defined physical parameter is not easy.In general, these methods cause little or no surface damage, and most are quick touse, enabling large areas to be surveyed systematically. Some do, however, requirerelatively complex and expensive equipment.
The most widely used methods are surface hardness, ultrasonic pulse velocityand chain dragging or surface tapping. The latter is particularly useful in locatingdelamination near to the surface and has been developed with more compleximpact-echo techniques. Surface-scanning radar and infrared thermography areboth sophisticated methods of locating hidden voids, moisture and similar featureswhich have recently grown in popularity; radiography and radiometry may alsobe used. Wear tests, surface hardness measurements or surface absorption methodsmay be use to assess surface abrasion resistance, and thermoluminescence is aspecialized technique to assess fire damage.
Testing for structural performance. Large-scale dynamic response testing isavailable to monitor structural performance, but large-scale static load tests,possibly in conjunction with monitoring of cracking by acoustic emission, maybe more appropriate despite the cost and disruption.
Static load tests usually incorporate measurement of deflections and cracking,but problems of isolating individual members can be substantial. Where largenumbers of similar elements (such as precast beams) are involved, it may be betterto remove a small number of typical elements for laboratory load testing and touse non-destructive methods to compare these elements with those remaining inthe structure.
It is essential that the test programme relates the costs of the various test
Copyright 1996 Chapman & Hall

methods to the value of the project involved, the costs of delays to construction,and the cost of possible remedial works. Accessibility of the suspect concrete andthe handling of test equipment must be considered, together with the safety of sitepersonnel and the general public during testing operations. Typical examples oftest programmes suggested for particular situations are included in Appendix A.
1.4.4 Number and location of testsEstablishing the most appropriate number of tests is a compromise betweenaccuracy, effort, cost and damage. Test results will relate only to the specificlocations at which the readings or samples were obtained. Engineering judgementis thus required to determine the number and location of tests, and the relevanceof the results to the element or member as a whole. The importance of integrationof planning with interpretation is thus critical. A full understanding of concretevariability (as discussed in section 1.5) is essential, as well as a knowledge of thereliability of the test method used. This is discussed here with particular referenceto concrete strength, since many other properties are strength-related. This shouldprovide a useful general basis for judgments, and further guidance is contained inthe chapters dealing with the various test methods. If aspects of durability areinvolved, care should be taken to allow for variations in environmental exposureand test conditions. Corrosion activity may vary significantly with ambientfluctuations in temperature and rainfall. Care should be taken when estimatingmean annual behaviour on the basis of measurements taken on a single occasion.Test positions must also take into account the possible effects of reinforcementupon results, as well as any physical restrictions relating to the method in use.
Table 1.5 lists the number of tests which may be considered equivalent to asingle result. The accuracy of strength prediction will depend in most cases onthe reliability of the correlation used, but for ‘standard’ cores 95% confidence
Table 1.5 Relative numbers of readings recommended for various test methods
Copyright 1996 Chapman & Hall

limits may be taken as ±(12/% where n is the number of cores from the particularlocation. Statistical methods taking acount of the number of tests, test variabilityand material variability have been developed and are considered more fully insection 1.6.3. Where cores are being used to provide a direct indication ofstrength or as a basis of calibration for other methods, it is important thatsufficient are taken to provide an adequate overall accuracy. It is also essentialto remember that the results will relate only to the particular location tested,thus the number of locations to be assessed will be a further factor requiringconsideration.
For comparative purposes the truly non-destructive methods are the mostefficient, since their speed permits a large number of locations to be easily tested.For a survey of concrete within an individual member, at least 40 locations aresuggested, spread on a regular grid over the member, whereas for comparison ofsimilar members a smaller number of points on each member, but at comparablepositions, should be examined. Where it is necessary to resort to other methodssuch as internal fracture or Windsor probe tests, practicalities are more likely torestrict the number of locations examined, and the survey may be lesscomprehensive.
In-situ strength estimates determining structural adequacy should ideally beobtained for critically stressed locations, in the light of anticipated strengthdistributions within members (described in section 1.5.1). Attention will thus oftenbe concentrated on the upper zones of members, unless particular regions aresuspect.
Tests for material specification compliance must be made on typical concrete,and hence the weaker top zones of members should be avoided. Testing at aroundmid-height is recommended for beams, columns and walls, and surface zone testson slabs must be restricted to soffits unless the top layer is first removed. Caremust similarly be taken to discard material from the top 20% (or at least 50 mm)of slabs when testing cores.
Where specification compliance is being investigated, it is recommended thatno fewer than four cores be taken from the suspect batch of concrete. Wheresmall cores are used, a larger number will be required to give a comparableaccuracy, due to greater test variability, and probably at least 12 results arerequired. With other test methods, a minimum number of readings is less clearlydefined but should reflect the values given in Table 1.5 coupled with thecalibration reliability. Likely maximum accuracies are summarized in section1.6. It is inevitable that a considerable ‘grey’ or ‘not proven’ area will existwhen comparing strength estimates from in-situ testing with specified cube orcylinder strengths, and a best possible accuracy of ±15% has been suggested fora group of four cores (25). This value may increase when dealing with oldconcrete, due to uncertainties about age effects on strength development. Testsmay, however, sometimes be necessary on areas which show signs of poorcompaction or workmanship for comparison with other aspects ofspecifications.
Copyright 1996 Chapman & Hall

The number of load tests that can be undertaken on a structure will be limited,and these should be concentrated on critical or suspect areas. Visual inspectionand non-destructive tests may be valuable in locating such regions. Whereindividual members are to be tested destructively to provide a calibration for non-destructive methods, they should preferably be selected to cover as wide a rangeof concrete quality as possible.
1.5 In-situ concrete variability
It is well established that the properties of in-situ concrete will vary within amember, due to differences of compaction and curing as well as non-uniformsupply of material. Supply variations will be assumed to be random, butcompaction and curing variations follow well-defined patterns according tomember type. A detailed appreciation of these variations is essential to planningany in-situ test programme and also to permit sensible interpretation of results.
The average in-situ strength of a member, expressed as the strength of anequivalent cube, will almost invariably be less than that of a standard cube of thesame concrete which has been properly compacted and moist-cured for 28 days.The extent of the difference will depend upon materials characteristics,construction techniques, workmanship and exposure, but general patterns can bedefined according to member type. This aspect, which is particularly importantfor interpretation of test results, is discussed in detail in section 1.5.2.
1.5.1 Within-member variabilityVariations in concrete supply will be due to differences in materials, batching,transport and handling techniques. These will reflect the degree of control overproduction and will normally be indicated by control and compliance testspecimens in which other factors are all standardized. In-situ measurement ofthese variations is difficult because of the problem of isolating them fromcompaction and curing effects. They may however be roughly assessed byconsideration of the coefficient of variation of tests taken at a number ofcomparable locations within a member or structure. Compaction and curingeffects will depend partially upon construction techniques but are also closelyrelated to member types and location within the member.
Reinforcement may hinder compaction but there will be a tendency formoisture to rise and aggregate to settle during construction. Lower levels ofmembers will further be compacted due to hydrostatic effects, related to memberdepth, with the result that the general tendency will be for strengths to be highestnear the base of pours and lowest in the upper regions. The basic aim of curing isto ensure that sufficient water is present to enable hydration to proceed. For lowwater: cement ratio mixes, self-desiccation must be avoided by allowing wateringress, and for other mixes, drying out must be prevented. Incomplete hydration
Copyright 1996 Chapman & Hall

resulting from poor curing may cause variations of strength between interior andsurface zones of members. A figure of only 5–10% has been suggested for thiseffect in gravel concretes (26); higher values may apply to lightweight concretes(27). Temperature rises due to cement hydration may cause further strengthdifferences between the interior and outer regions, especially at early ages.Differential curing across members may serve to further increase the variationsfrom compactional factors.
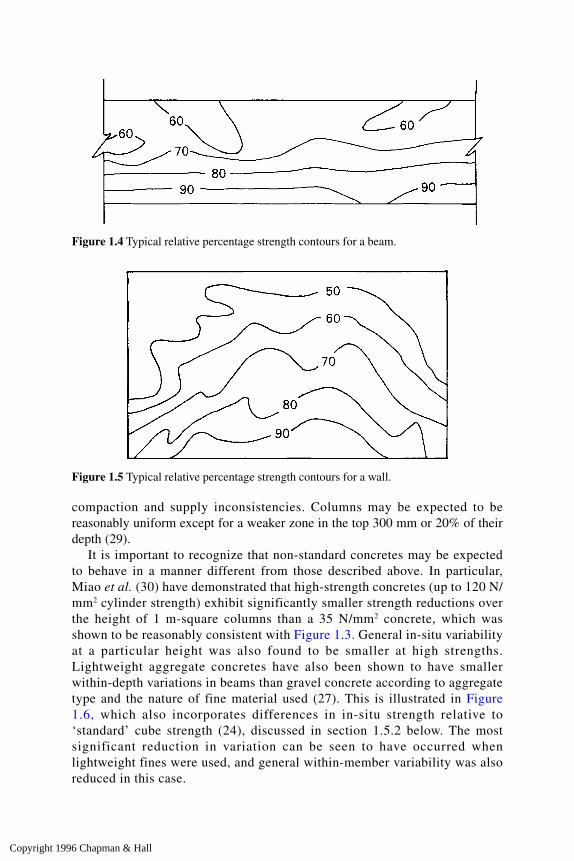
Typical relative strength variations for normal concretes according to membertype are illustrated in Figure 1.3. These results have been derived from numerousreports of non-destructive testing including that by Maynard and Davis (28) andcan only be regarded as indicating general trends which may be expected, sinceindividual construction circumstances may vary widely. For beams and walls thestrength gradients will be reasonably uniform, although variations in compactionand supply may cause the type of variability indicated by the relative strengthcontours of Figures 1.4 and 1.5. Few data are available for slabs, but it has beensuggested that the reduced differential of about 25% across the depths may beconcentrated in the top 50 mm in thin slabs (26). Thicker slabs will be more similarto beams. Variations in plan may, however, be expected to be random due to
Figure 1.3 Within-member variations.
Copyright 1996 Chapman & Hall
compaction and supply inconsistencies. Columns may be expected to bereasonably uniform except for a weaker zone in the top 300 mm or 20% of theirdepth (29).
It is important to recognize that non-standard concretes may be expectedto behave in a manner different from those described above. In particular,Miao et al. (30) have demonstrated that high-strength concretes (up to 120 N/mm2 cylinder strength) exhibit significantly smaller strength reductions overthe height of 1 m-square columns than a 35 N/mm2 concrete, which wasshown to be reasonably consistent with Figure 1.3. General in-situ variabilityat a particular height was also found to be smaller at high strengths.Lightweight aggregate concretes have also been shown to have smallerwithin-depth variations in beams than gravel concrete according to aggregatetype and the nature of fine material used (27). This is illustrated in Figure1.6, which also incorporates differences in in-situ strength relative to‘standard’ cube strength (24), discussed in section 1.5.2 below. The mostsignificant reduction in variation can be seen to have occurred whenlightweight fines were used, and general within-member variability was alsoreduced in this case.
Figure 1.4 Typical relative percentage strength contours for a beam.
Figure 1.5 Typical relative percentage strength contours for a wall.
Copyright 1996 Chapman & Hall

1.5.2 In-situ strength relative to standard specimensLikely strength variations within members have been described in section 1.5.1.If measured in-situ values are expressed as equivalent cube strengths, it willusually be found that they are less than the strengths of cubes made of concretefrom the same mix which are compacted and cured in a ‘standard’ way. In-situcompaction and curing will vary widely, and other factors such as mixing,bleeding and susceptibility to impurities are difficult to predict. Nevertheless ageneral trend according to member type can be identified and the values given inTable 1.6 may be regarded as typical. Although these are generally accepted (12),cases have been reported where in-situ strengths were found to be closer to that ofstandard specimens (31) and this is also likely for lightweight aggregate concretes(see Figure 1.6). The likely relationships between standard specimen strength andin-situ strength are also illustrated in Figure 1.7 for a typical structural concretemix using natural aggregates.
A ‘standard’ cube is tested whilst saturated, and for ease of comparison thevalues of Table 1.6 are presented on this basis also. Dry cubes generally yieldstrengths which are approximately 10–15% higher, and this must be appreciatedwhen interpreting in-situ strength test results. Cores will be tested while saturatedunder normal circumstances, and the above relationships will apply, but if the in-situ concrete is dry the figures for likely in-situ strength must be increasedaccordingly. Where non-destructive or partially-destructive methods are used in
Figure 1.6 Average relative strength distributions within beams of different concrete types(based on ref. 24).
Copyright 1996 Chapman & Hall
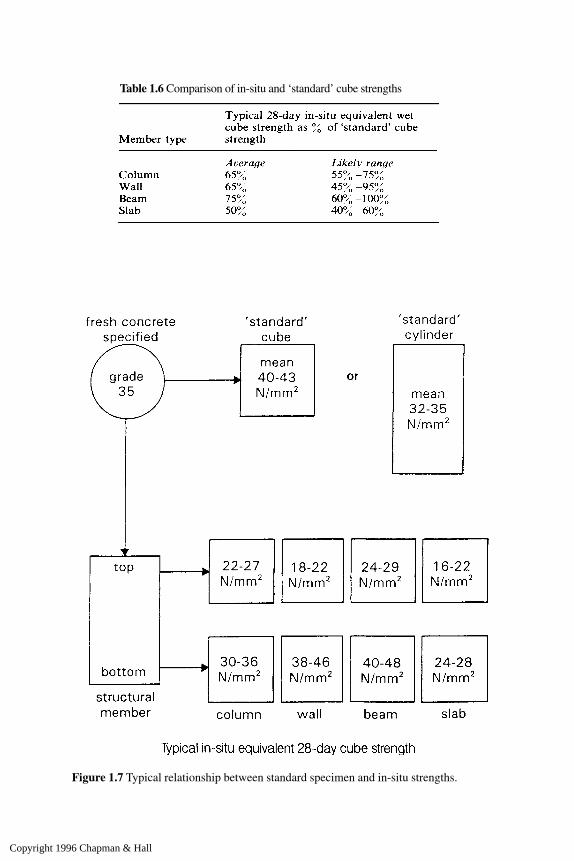
Table 1.6 Comparison of in-situ and ‘standard’ cube strengths
Figure 1.7 Typical relationship between standard specimen and in-situ strengths.
Copyright 1996 Chapman & Hall
conjunction with a strength calibration, it is essential to know whether thiscalibration is based on wet or dry specimens. Another feature of such calibrationsis the size of cube upon which they are based. Design and specification are usuallybased on a 150-mm cube, but laboratory calibrations may sometimes be related toa 100-mm cube which may be up to 4% stronger.
The age at which the concrete is tested is a further cause of differences betweenin-situ and ‘standard’ values. Although ‘age correction’ factors are given in Codesof Practice, care is needed when attempting to adjust in-situ measurements to anequivalent 28-day value. Developments in cement manufacture have tendedtowards yielding a high early strength with reduced long-term increases, andstrength development also is largely dependent on curing. If concrete is naturallywet the strength may increase, but often concrete is dry in service and unlikely tomake significant gains after 28 days.
The incorporation of cement replacements such as pulverized fuel ash or groundgranulated blast-furnace slag into the mix will also influence longer-term strengthdevelopment characteristics, and age adjustments should be treated with caution.
1.6 Interpretation
Interpretation of in-situ test results may be considered in three distinct phasesleading to the development of conclusions:
(i) Computation(ii) Examination of variability
(iii) Calibration and/or application. The emphasis will vary according to circumstances (detailed interpretativeinformation is given in other chapters) but the principles will be similar whateverprocedures are used, and these are outlined below. The examples of Appendix Afurther illustrate the application of those procedures to a number of commonlyoccurring situations.
The need for comprehensive and detailed recording and reporting of results isof considerable significance, no matter how small or straightforward theinvestigation may at first appear to be. In the event of subsequent dispute orlitigation, the smallest detail may be crucial and documentation should always bekept wth this in mind. Comprehensive photographs are often of particular valuefor future reference. In-situ test results are also increasingly being incorporatedinto computer databases, associated with prioritization and management ofmaintenance and repair strategies (16).
1.6.1 Computation of test resultsThe amount of computation required to provide the appropriate parameter at atest location will vary according to the test method but will follow well-defined
Copyright 1996 Chapman & Hall

procedures. For example, cores must be corrected for length, orientation andreinforcement to yield an equivalent cube strength.
Pulse velocities must be calculated making due allowance for reinforcement,and pull-out, penetration resistance and surface hardness tests must be averagedto give a mean value. Attempts should not be made at this stage to invokecorrelations with a property other than that measured directly. Chemical or similartests will be evaluated to yield the appropriate parameter such as cement contentor mix proportions. Load tests will usually be summarized in the form of load/deflection curves with moments evaluated for critical conditions, and creep andrecovery indicated as described in Chapter 6.
1.6.2 Examination of variabilityWhenever more than one test is carried out, a comparison of the variability ofresults can provide valuable information. Even where few results are available(e.g. in load tests), these provide an indication of the uniformity of the constructionand hence the significance of the results. In cases where more numerous resultsare available, as in non-destructive surveys, a study of variability can be used todefine areas of differing quality. This can be coupled with a knowledge of testvariability associated with the method to provide a measure of the constructionstandards and control used.
Tomsett (32) has also reported the development of an analysis procedure foruse on large-scale integrity assessment projects involving a coefficient of variationratio relating local variability to expected values, an area factor relating the areaof the assessed problem to the total area and a comparative damage factor.Interpretation is facilitated by the use of interaction diagrams incorporating thesethree parameters. Some test methods such as radar and impact-echo rely onrecognition of characteristic patterns of test results, and the possibilities forapplication of neural networks to such cases are currently being studied.
1.6.2.1 Graphical methods. ‘Contour’ plots showing, for example, zones of equalstrength (Figures 1.4 and 1.5) are valuable in locating areas of concrete which areabnormally high or low in strength relative to the remainder of the member. Suchcontours should be plotted directly on the basis of the parameter measured (e.g.pulse velocity) rather than after conversion to strength. Under normalcircumstances the contours will follow well-defined patterns, and any departurefrom this pattern will indicate an area of concern. ‘Contour’ plots are also valuablein showing the range of relative strengths within a member and may assist thelocation of further testing which may be of a more costly or damaging nature. Theuse of contours is not restricted to strength assessment and they are commonlyused for reinforcement corrosion and integrity surveys.
Concrete variability can also be usefully expressed as histograms, especiallywhere a large number of results is available, as when large members are under test
Copyright 1996 Chapman & Hall

or where many similar members are being compared. Figure 1.8(a) shows a typicalplot for well-constructed members using a uniform concrete supply. Theparameter measured should be plotted directly, and although the spread will reflectmember type and distribution of test locations as well as construction features, asingle peak should emerge with an approximately normal distribution. A long‘tail’ as in Figure 1.8(b) suggests poor construction procedures, and twin peaks,Figure 1.8(c), indicate two distinct qualities of concrete supply.
1.6.2.2 Numerical methods. Calculation of the coefficient of variation (equal tothe standard deviation×100/mean) of test results may provide valuableinformation about the construction standards employed. Table 1.7 contains typical
Figure 1.8 Typical histogram plots of in-situ test results: (a) uniform supply; (b) poorconstruction; (c) two sources.
Copyright 1996 Chapman & Hall

values of coefficients of variation relating to the principal test methods which maybe expected for a single site-made unit constructed from a number of batches.This information is based on the work of Tomsett (33), the authors (26), ConcreteSociety Report 11 (25) and other sources. Results for concrete from one batchwould be expected to be correspondingly lower, whereas if a number of differentmember types are involved, the values may be expected to be higher. The valuesin Table 1.7 offer only a very approximate guide, but they should be sufficient todetect the presence of abnormal circumstances.
The coefficient of variation of concrete strength is not constant with varyingstrength for a given level of control because it is calculated using the averagestrength. Leshchinsky et al. (34) have also confirmed that the distribution ofwithin-test coefficient of variation is asymmetrical. Hence general relationshipsbetween coefficient of variation of measured concrete strength and level ofconstruction quality should not be used. Figure 1.9 illustrates typical relationshipsfor ‘standard’ control cubes and in-situ strengths based on a variety of Europeanand North American sources. From these values, anticipated standard deviationscan be deduced (for example at 30 N/mm2 mean in-situ strength, a standarddeviation of 0.2×30=6 N/mm2 is likely for normal quality construction) and henceconfidence limits can be placed on the results obtained. Values such as those givenlater in Table 1.8 can be derived in this way, and in-situ strength accuracypredictions must make allowance for this as well as the accuracy of the testmethod.
1.6.3 Calibration and application of test resultsThe likely accuracies of calibration between measured test results and desiredconcrete properties are discussed in detail in the sections of this book dealingwith each specific test. It is essential that the application of the results of in-situ testing takes account of such factors to determine their significance.
Table 1.7 Typical coefficients of variation (COV) of test results and maximum accuraciesof in-situ strength prediction for principal methods
Copyright 1996 Chapman & Hall

Particular attention must be paid to the differences between laboratory conditions(for which calibration curves will normally be produced) and site conditions.Differences in maturity and moisture conditions are especially relevant in thisrespect. Concrete quality will vary throughout members and may not necessarilybe identical in composition or condition to laboratory specimens. Also, the testsmay not be so easy to perform or control due to adverse weather conditions,difficulties of access or lack of experience of operatives. Calibration of non-destructive and partially-destructive strength tests by means of cores from the in-situ concrete may often be possible and will reduce some of these differences.
Interpretation of strength results requires the use of statistical procedures sinceit is not sufficient simply to average the values of the in-situ test results and thencompute the equivalent compressive strength by means of the previouslyestablished relationship. Efforts have been made to establish lower confidence
Figure 1.9 Coefficient of variation of test results related to concrete strength.
Copyright 1996 Chapman & Hall

limits for the correlation relationship (1, 35) based on statistical tolerance factors,and the procedures outlined in the following sections are based on this relativelysimple approach. These methods fail however to take account of measurementerrors in the in-situ test result, as demonstrated by Stone et al. (36). A rigorousmethod incorporated into a report by ACI 228 (37) in 1989 has not been usedextensively because of its complexity, but a simplified version (38) is likely to beincorporated into a forthcoming revision.
The current lack of a consensus-based statistical procedure is a barrier to morewidespread use of in-place testing for compliance purposes. Leshchinsky (39) hasreviewed current provisions of existing national standards and the matter is underconsideration by RILEM Committee 126 at present.
Table 1.7 summarizes the maximum accuracies of in-situ strength predictionthat can realistically be hoped for under ideal conditions, with specific calibrationsfor the particular concrete mix in each case. If any factor varies from this ideal,the accuracies of prediction will be reduced, although at present there is littleavailable information to permit this to be quantified. Wherever possible, testmethods should be used which directly measure the required property, therebyreducing the uncertainties involved in calibration. Even in these situations,however, care must be taken to make a realistic assessment of the accuracy of thevalues emerging when formulating conclusions.
1.6.3.1 Application to specifications. It is essential that the concrete tested isrepresentative of the material under examination and this will influence thenumber and location of tests (section 1.4.4). Where some clearly defined property,such as cover or cement content, is being measured, it will generally be sufficientto compare measured results with the minimum specified value, bearing in mindthe likely accuracy of the test. A small proportion of results marginally below thespecified value may be acceptable, but the average for a number of locationsshould exceed the minimum limit. If the test has a low order of accuracy (forexample cement content determination is unlikely to be better than ±40 kg/m3)the area of doubt concerning marginal results may be considerable. This is anunfortunate fact of life, although engineering judgements may perhaps be assistedby corroborative measurements of a different property.
Strength is the most common criterion for the judgement of compliance withspecifications, and unfortunately the most difficult to resolve from in-situ testingbecause of the basic differences between in-situ concrete and the ‘standard’ testspecimens upon which most specifications are based (section 1.5.2). The numberof in-situ test results will seldom be sufficient to permit a full statistical assessmentof the appropriate confidence limits (usually 95%), hence it is better to comparemean in-situ strength estimates with the expected mean ‘standard’ test specimenresult. This requires an estimate to be made of the likely standard deviation ofstandard specimens unless the value of target mean strength for the mix is known.
Copyright 1996 Chapman & Hall

The mean ‘standard’ cube strength using British ‘limit state’ design procedures isgiven by
fmean=fcu+1.64s (1.1)
where fcu=characteristic strength of control cubess=standard deviation of control cubes.
The accuracy of this calculation will increase with the number of results available;50 readings could be regarded as the minimum necessary to obtain a sufficientlyaccurate estimate of the actual standard deviation. If sufficient information is notavailable the values given in Table 1.8 may be used as a guide.
In theory it is possible to estimate the in-situ characteristic strength f’cu fromthe measured in-situ values of the mean f’mean and standard deviation s’. The valuesof s’ given in Table 1.8 may be used in the absence of more specific data, butcannot be considered very reliable in view of within-member variations and themany variable constructional factors.
In most cases the number of readings available from in-situ results will besignificantly less than 50, in which case the coefficient of 1.64 used in eqn (1.1)will increase. Equation (1.2) for the 95% confidence limit will thus apply, with kgiven by Table 1.9 according to the number of results n.
f’cu=f’mean-ks’ (1.2)
Table 1.8 Typical values of standard deviation of control cubesand in-situ concrete
Table 1.9 Suggested 95% confidence limit factor relatedto number of tests (13)
Copyright 1996 Chapman & Hall
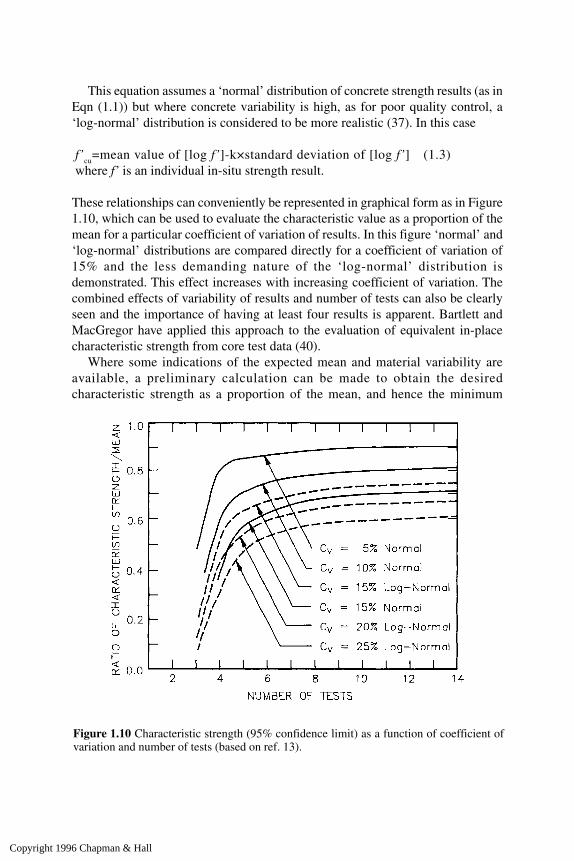
This equation assumes a ‘normal’ distribution of concrete strength results (as inEqn (1.1)) but where concrete variability is high, as for poor quality control, a‘log-normal’ distribution is considered to be more realistic (37). In this case
f’cu
=mean value of [log f’]-k×standard deviation of [log f’] (1.3) where f’ is an individual in-situ strength result.
These relationships can conveniently be represented in graphical form as in Figure1.10, which can be used to evaluate the characteristic value as a proportion of themean for a particular coefficient of variation of results. In this figure ‘normal’ and‘log-normal’ distributions are compared directly for a coefficient of variation of15% and the less demanding nature of the ‘log-normal’ distribution isdemonstrated. This effect increases with increasing coefficient of variation. Thecombined effects of variability of results and number of tests can also be clearlyseen and the importance of having at least four results is apparent. Bartlett andMacGregor have applied this approach to the evaluation of equivalent in-placecharacteristic strength from core test data (40).
Where some indications of the expected mean and material variability areavailable, a preliminary calculation can be made to obtain the desiredcharacteristic strength as a proportion of the mean, and hence the minimum
Figure 1.10 Characteristic strength (95% confidence limit) as a function of coefficient ofvariation and number of tests (based on ref. 13).
Copyright 1996 Chapman & Hall
number of tests required to confirm the desired acceptability can be evaluated(13). Similar plots can be produced for different confidence limits anddistributions (37) and it should be noted that less demanding 90% confidencelimits are adopted in some countries. The choice of distribution type andconfidence limits for use in particular circumstances is thus a matter ofjudgement.
If an in-situ characteristic strength is estimated it can be compared with thespecified value, but this approach is not recommended unless numerous in-situresults are available.
Whichever approach is adopted, the comparison between in-situ and standardspecimen strengths must allow for the type of differences indicated in Table 1.6and Figure 1.7 and this is illustrated in the examples of Appendix A.
1.6.3.2 Application to design calculations. Measured in-situ values can beincorporated into calculations to assess structural adequacy. Although this mayoccasionally relate to reinforcement quantities and location, or concreteproperties such as permeability, in most instances it will be the concrete strengthwhich is relevant. It is essential that the measured values relate to critical regionsof the member under examination and tests must be planned with this in mind(section 1.4.4).
Calculations are generally based on minimum likely, or characteristic,‘standard specimen’ values being modified by an appropriate factor of safety togive a minimum in-situ design value. In-situ measurements will yield directlyan in-situ strength of the concrete tested and this must be related to a similarspecimen type and size to the ‘standard’ used in the calculations. If this concreteis from a critical location, it could be argued that the minimum measured valuecan be used directly as the design concrete strength with no further factors ofsafety applied. In practice, however, it is more appropriate to use the mean valuefrom a number of test readings at critical locations, and to apply a factor ofsafety to this to account for test variability, possible lack of concretehomogeneity and future deterioration. The accuracy of strength prediction willvary according to the method used, but a factor of safety of 1.2 is recommendedby BS 6089 (12) for general use. Providing the recommendations of section1.4.4 have been followed when determining the number of readings, this valueshould be adequate. The application of this approach is illustrated in detail bythe examples of Appendix A. If there is particular doubt about the reliability ofthe test results, or if the concrete tested is not from the critical locationconsidered, then it may be necessary for the engineer to adopt a higher valuefor the factor of safety guided by the information contained in sections 1.5.1,1.5.2 and 1.6.3.1. Alternatively, other features discussed in section 1.5.2,including moisture condition and age, may possibly be used to justify a lowervalue for the factor of safety. The in-situ stress state and rate of loading mayalso be taken into account in critical circumstances.
Copyright 1996 Chapman & Hall

1.7 Test combinations
All the test methods which are available for in-situ concrete assessment suffer fromlimitations, and reliability is often open to question. Combining methods may helpto overcome some of these difficulties, and some examples of typical combinationsare outlined below.
1.7.1 Increasing confidence level of resultsConsiderably greater weight can be placed on results if corroborative conclusionscan be obtained from separate methods. Expense will usually restrict large-scaleduplication, but if different properties are measured, confidence will be muchincreased by the emergence of similar patterns of results. This will generally berestricted to tests which are quick, cheap and non-destructive, such ascombinations of surface hardness and ultrasonic pulse velocity measurements onrecently cast concrete. In other circumstances, radiometry, pulse-echo, radar,thermography, or slower near-to-surface strength methods may be invaluable.
If small volumes are involved and a specific property (e.g. strength) is required,it may sometimes be worth while to compare absolute estimates achieved bydifferent methods.
1.7.2 Improvement of calibration accuracyIt may, in some cases, be possible to produce correlations of combinations ofmeasured values with desired properties, to a greater accuracy than is possible foreither individual method. This has been most widely developed in relation tostrength assessment using ultrasonic pulse velocities in conjunction with density(41) or rebound hammer readings (which are related to surface density).
In the latter case, appropriate strength correlations must be produced for bothmethods enabling multiple regression equations to be developed with compressivestrength as the dependent variable (42). This approach is likely to be of greatestvalue in quality control situations but is not widely used. A more complex versionof the technique has been encompassed in the SONREB method as a draft RILEMrecommendation (43). This is based largely on work in eastern Europe andinvolves the principle that correlation graphs may be produced involvingcoefficients relating to various properties of the mix constituents. The increasedaccuracy is attributed to the opposing influences of some of the many variablesfor each of the methods, and strength predictions to an accuracy of ±10% areclaimed under ideal conditions.
Other combinations that have been proposed include the use of pulse velocityand pulse attenuation measurements on site (44). The procedures are complexand require specialized equipment, and for practical purposes this approach muststill be considered as a research tool. The more common in-situ tests may certainlybe combined in a variety of other ways but although valuable corroborative
Copyright 1996 Chapman & Hall

evidence may be gained it is unlikely that the accuracy of absolute strengthpredictions will be significantly improved.
1.7.3 Use of one method as preliminary to anotherCombinations of methods are widely used in situations where one method isregarded as a preliminary to the other. Common examples include the location of
Table 1.10 Relevant standards
Copyright 1996 Chapman & Hall

reinforcement prior to other forms of testing, and the use of simple non-destructivemethods for comparative surveys to assist the most worthwhile location of moreexpensive or damaging tests (see Figure 1.1). Tomsett has reported the successfulcombination of thermography and ultrasonic pulse velocity measurements usedin this way (33).
Where monitoring strength development is important, maturity measurementsmay provide useful preliminary information, for confirmation by other strengthassessment methods. A further case is the use of half-cell potential measurementsto indicate the level of possibility of corrosion occurring, and subsequentresistivity measurements on zones shown to be at risk will identify the likelihoodof corrosion actually occurring.
1.7.4 Test calibrationThe most frequently occurring examples of calibration involving testcombinations will be the use of cores or destructive load tests to establishcorrelations for non-destructive or partially-destructive methods which relatedirectly to the concrete under investigation. Coring or drilling may also berequired to calibrate or validate the results of radar surveys.
1.7.5 Diagnosis of causes of deteriorationIt is most likely that more than one type of testing will be required to identify thenature and cause of deterioration, and to assess future durability. Covermeasurements will be included if reinforcement corrosion is involved, togetherwith a possible range of chemical, petrographic and absorption tests. Wheredeterioration is due to disruption of the concrete, a variety of tests on samplesremoved from the concrete is likely to be required, as discussed in section 1.4.3.
1.8 Documentation by standards
Many British and American Standards now available are applicable to in-situconcrete testing. A selection of those which are most relevant is listed in Table1.10, and is fully referenced in the appropriate parts of the text elsewhere inthis book.
Copyright 1996 Chapman & Hall

2 Surface hardness methods
One of many factors connected with the quality of concrete is its hardness. Effortsto measure the surface hardness of a mass of concrete were first recorded in the1930s; tests were based on impacting the concrete surface with a specified massactivated by a standard amount of energy. Early methods involved measurementsof the size of indentation caused by a steel ball either fixed to a pendulum orspring hammer, or fired from a standardized testing pistol. Later, however, theheight of rebound of the mass from the surface was measured. Although it isdifficult to justify a theoretical relationship between the measured values fromany of these methods and the strength of a concrete, their value lies in the abilityto establish empirical relationships between test results and quality of the surfacelayer. Unfortunately these are subject to many specific restrictions includingconcrete and member details, as well as equipment reliability and operatortechnique.
Indentation testing has received attention in Germany and in former states ofthe USSR as well as the United Kingdom, but has never become very popular. Pinpenetration tests have, however, recently received attention in the USA and Japan(see section 4.1.2). The rebound principle, on the other hand, is more widelyaccepted: the most popular equipment, the Schmidt Rebound Hammer, has beenin use worldwide for many years. Recommendations for the use of the reboundmethod are given in BS 1881: Part 202 (45) and ASTM C805 (46).
2.1 Rebound test equipment and operation
The Swiss engineer Ernst Schmidt, first developed a practicable rebound testhammer in the late 1940s, amd modern versions are based on this. Figure 2.1shows the basic features of a typical type N hammer, which weighs less than 2 kg,and has an impact energy of approximately 2.2 Nm.
The spring-controlled hammer mass slides on a plunger within a tubular housing.The plunger retracts against a spring when pressed against the concrete surface andthis spring is automatically released when fully tensioned, causing the hammer massto impact against the concrete through the plunger. When the spring-controlled massrebounds, it takes with it a rider which slides along a scale and is visible through asmall window in the side of the casing. The rider can be held in position on the scaleby depressing the locking button. The equipment is very simple to use (Figure 2.2),and may be operated either horizontally or vertically either upwards or downwards.
Copyright 1996 Chapman & Hall

The plunger is pressed strongly and steadily against the concrete at right angles toits surface, until the spring-loaded mass is triggered from its locked position. Afterthe impact, the scale index is read while the hammer is still in the test position.Alternatively, the locking button may be pressed to enable the reading to be
Figure 2.1 Typical rebound hammer.
Figure 2.2 Schmidt hammer in use.
Copyright 1996 Chapman & Hall
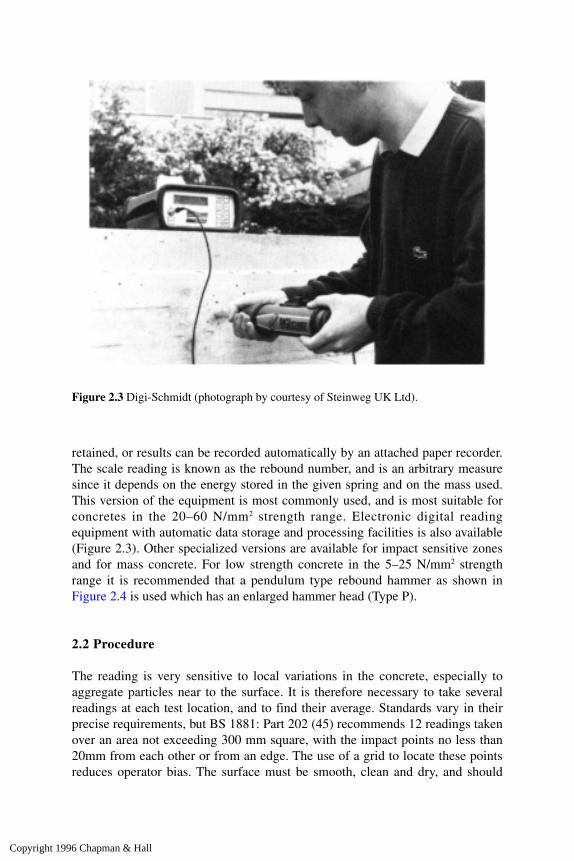
retained, or results can be recorded automatically by an attached paper recorder.The scale reading is known as the rebound number, and is an arbitrary measuresince it depends on the energy stored in the given spring and on the mass used.This version of the equipment is most commonly used, and is most suitable forconcretes in the 20–60 N/mm2 strength range. Electronic digital readingequipment with automatic data storage and processing facilities is also available(Figure 2.3). Other specialized versions are available for impact sensitive zonesand for mass concrete. For low strength concrete in the 5–25 N/mm2 strengthrange it is recommended that a pendulum type rebound hammer as shown inFigure 2.4 is used which has an enlarged hammer head (Type P).
2.2 Procedure
The reading is very sensitive to local variations in the concrete, especially toaggregate particles near to the surface. It is therefore necessary to take severalreadings at each test location, and to find their average. Standards vary in theirprecise requirements, but BS 1881: Part 202 (45) recommends 12 readings takenover an area not exceeding 300 mm square, with the impact points no less than20mm from each other or from an edge. The use of a grid to locate these pointsreduces operator bias. The surface must be smooth, clean and dry, and should
Figure 2.3 Digi-Schmidt (photograph by courtesy of Steinweg UK Ltd).
Copyright 1996 Chapman & Hall
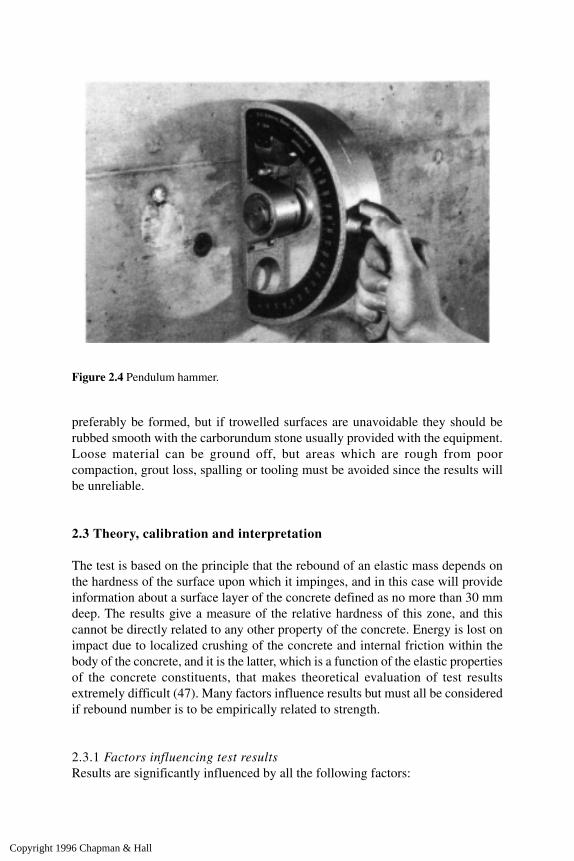
preferably be formed, but if trowelled surfaces are unavoidable they should berubbed smooth with the carborundum stone usually provided with the equipment.Loose material can be ground off, but areas which are rough from poorcompaction, grout loss, spalling or tooling must be avoided since the results willbe unreliable.
2.3 Theory, calibration and interpretation
The test is based on the principle that the rebound of an elastic mass depends onthe hardness of the surface upon which it impinges, and in this case will provideinformation about a surface layer of the concrete defined as no more than 30 mmdeep. The results give a measure of the relative hardness of this zone, and thiscannot be directly related to any other property of the concrete. Energy is lost onimpact due to localized crushing of the concrete and internal friction within thebody of the concrete, and it is the latter, which is a function of the elastic propertiesof the concrete constituents, that makes theoretical evaluation of test resultsextremely difficult (47). Many factors influence results but must all be consideredif rebound number is to be empirically related to strength.
2.3.1 Factors influencing test resultsResults are significantly influenced by all the following factors:
Figure 2.4 Pendulum hammer.
Copyright 1996 Chapman & Hall
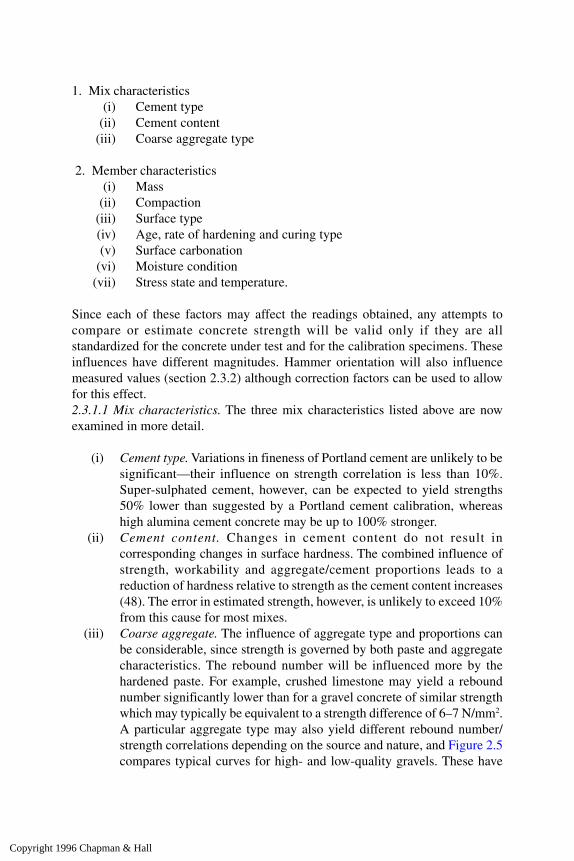
1. Mix characteristics (i) Cement type(ii) Cement content
(iii) Coarse aggregate type
2. Member characteristics(i) Mass
(ii) Compaction(iii) Surface type(iv) Age, rate of hardening and curing type(v) Surface carbonation
(vi) Moisture condition(vii) Stress state and temperature.
Since each of these factors may affect the readings obtained, any attempts tocompare or estimate concrete strength will be valid only if they are allstandardized for the concrete under test and for the calibration specimens. Theseinfluences have different magnitudes. Hammer orientation will also influencemeasured values (section 2.3.2) although correction factors can be used to allowfor this effect.2.3.1.1 Mix characteristics. The three mix characteristics listed above are nowexamined in more detail.
(i) Cement type. Variations in fineness of Portland cement are unlikely to besignificant—their influence on strength correlation is less than 10%.Super-sulphated cement, however, can be expected to yield strengths50% lower than suggested by a Portland cement calibration, whereashigh alumina cement concrete may be up to 100% stronger.
(ii) Cement content. Changes in cement content do not result incorresponding changes in surface hardness. The combined influence ofstrength, workability and aggregate/cement proportions leads to areduction of hardness relative to strength as the cement content increases(48). The error in estimated strength, however, is unlikely to exceed 10%from this cause for most mixes.
(iii) Coarse aggregate. The influence of aggregate type and proportions canbe considerable, since strength is governed by both paste and aggregatecharacteristics. The rebound number will be influenced more by thehardened paste. For example, crushed limestone may yield a reboundnumber significantly lower than for a gravel concrete of similar strengthwhich may typically be equivalent to a strength difference of 6–7 N/mm2.A particular aggregate type may also yield different rebound number/strength correlations depending on the source and nature, and Figure 2.5compares typical curves for high- and low-quality gravels. These have
Copyright 1996 Chapman & Hall
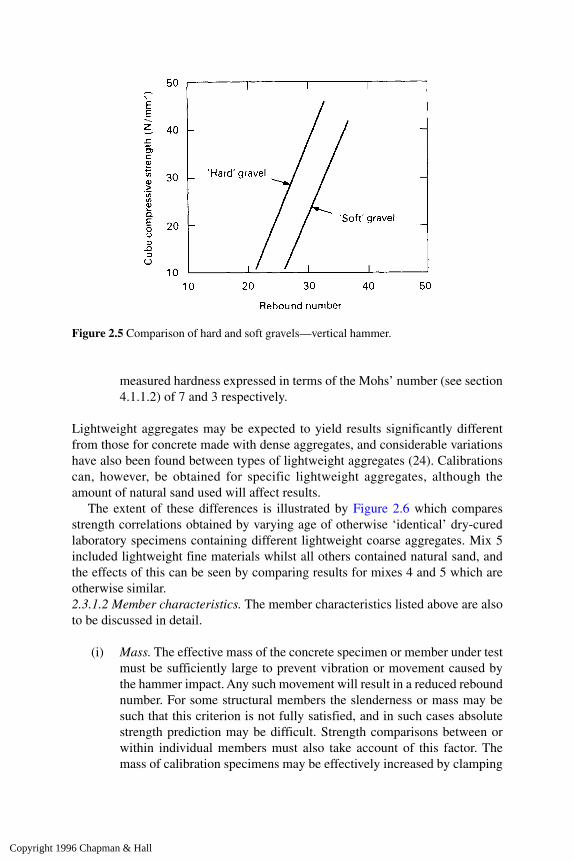
measured hardness expressed in terms of the Mohs’ number (see section4.1.1.2) of 7 and 3 respectively.
Lightweight aggregates may be expected to yield results significantly differentfrom those for concrete made with dense aggregates, and considerable variationshave also been found between types of lightweight aggregates (24). Calibrationscan, however, be obtained for specific lightweight aggregates, although theamount of natural sand used will affect results.
The extent of these differences is illustrated by Figure 2.6 which comparesstrength correlations obtained by varying age of otherwise ‘identical’ dry-curedlaboratory specimens containing different lightweight coarse aggregates. Mix 5included lightweight fine materials whilst all others contained natural sand, andthe effects of this can be seen by comparing results for mixes 4 and 5 which areotherwise similar.2.3.1.2 Member characteristics. The member characteristics listed above are alsoto be discussed in detail.
(i) Mass. The effective mass of the concrete specimen or member under testmust be sufficiently large to prevent vibration or movement caused bythe hammer impact. Any such movement will result in a reduced reboundnumber. For some structural members the slenderness or mass may besuch that this criterion is not fully satisfied, and in such cases absolutestrength prediction may be difficult. Strength comparisons between orwithin individual members must also take account of this factor. Themass of calibration specimens may be effectively increased by clamping
Figure 2.5 Comparison of hard and soft gravels—vertical hammer.
Copyright 1996 Chapman & Hall
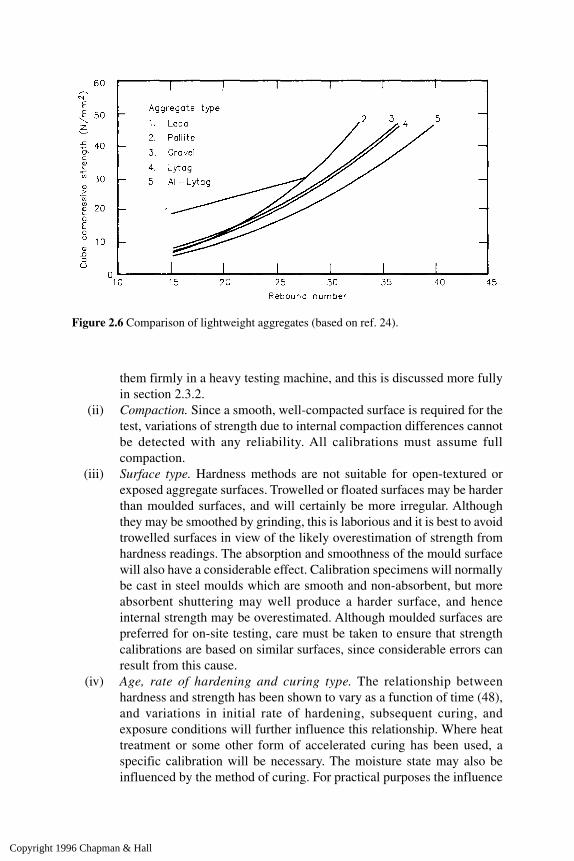
them firmly in a heavy testing machine, and this is discussed more fullyin section 2.3.2.
(ii) Compaction. Since a smooth, well-compacted surface is required for thetest, variations of strength due to internal compaction differences cannotbe detected with any reliability. All calibrations must assume fullcompaction.
(iii) Surface type. Hardness methods are not suitable for open-textured orexposed aggregate surfaces. Trowelled or floated surfaces may be harderthan moulded surfaces, and will certainly be more irregular. Althoughthey may be smoothed by grinding, this is laborious and it is best to avoidtrowelled surfaces in view of the likely overestimation of strength fromhardness readings. The absorption and smoothness of the mould surfacewill also have a considerable effect. Calibration specimens will normallybe cast in steel moulds which are smooth and non-absorbent, but moreabsorbent shuttering may well produce a harder surface, and henceinternal strength may be overestimated. Although moulded surfaces arepreferred for on-site testing, care must be taken to ensure that strengthcalibrations are based on similar surfaces, since considerable errors canresult from this cause.
(iv) Age, rate of hardening and curing type. The relationship betweenhardness and strength has been shown to vary as a function of time (48),and variations in initial rate of hardening, subsequent curing, andexposure conditions will further influence this relationship. Where heattreatment or some other form of accelerated curing has been used, aspecific calibration will be necessary. The moisture state may also beinfluenced by the method of curing. For practical purposes the influence
Figure 2.6 Comparison of lightweight aggregates (based on ref. 24).
Copyright 1996 Chapman & Hall
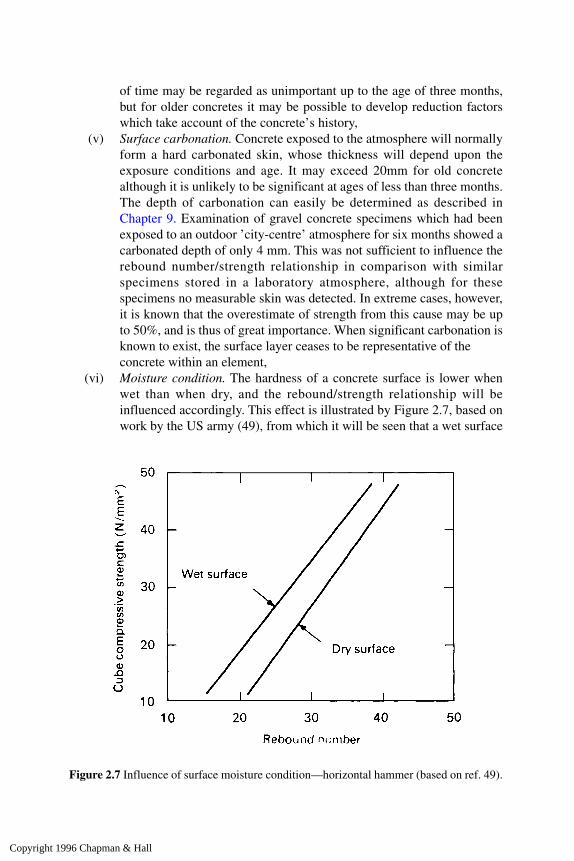
of time may be regarded as unimportant up to the age of three months,but for older concretes it may be possible to develop reduction factorswhich take account of the concrete’s history,
(v) Surface carbonation. Concrete exposed to the atmosphere will normallyform a hard carbonated skin, whose thickness will depend upon theexposure conditions and age. It may exceed 20mm for old concretealthough it is unlikely to be significant at ages of less than three months.The depth of carbonation can easily be determined as described inChapter 9. Examination of gravel concrete specimens which had beenexposed to an outdoor ’city-centre’ atmosphere for six months showed acarbonated depth of only 4 mm. This was not sufficient to influence therebound number/strength relationship in comparison with similarspecimens stored in a laboratory atmosphere, although for thesespecimens no measurable skin was detected. In extreme cases, however,it is known that the overestimate of strength from this cause may be upto 50%, and is thus of great importance. When significant carbonation isknown to exist, the surface layer ceases to be representative of theconcrete within an element,
(vi) Moisture condition. The hardness of a concrete surface is lower whenwet than when dry, and the rebound/strength relationship will beinfluenced accordingly. This effect is illustrated by Figure 2.7, based onwork by the US army (49), from which it will be seen that a wet surface
Figure 2.7 Influence of surface moisture condition—horizontal hammer (based on ref. 49).
Copyright 1996 Chapman & Hall

test may lead to an underestimate of strength of up to 20%. Field testsand strength calibrations should normally be based on dry surfaceconditions, but the effect of internal moisture on the strength of controlspecimens must not be overlooked. This is considered in more detail insection 2.3.2.
(vii) Stress state and temperature. Both these factors may influence hardnessreadings, although in normal practical situations this is likely to be smallin comparison with the many other variables. Particular attention should,however, be paid to the functioning of the test hammer if it is to be usedunder extremes of temperature.
2.3.2 CalibrationClearly, the influences of the variables described above are so great that it is veryunlikely that a general calibration curve relating rebound number to strength, asprovided by the equipment manufacturers, will be of any practical value. The sameapplies to the use of computer data processing to give strength predictions basedon results from the electronic rebound hammer shown in Figure 2.3 unless theconversions are based on case-specific data. Strength calibration must be basedon the particular mix under investigation, and the mould surface, curing and ageof laboratory specimens should correspond as closely as possible to the in-placeconcrete. It is essential that correct functioning of the rebound hammer is checkedregularly using a standard steel anvil of known mass. This is necessary becausewear may change the spring and internal friction characteristics of the equipment.Calibrations prepared for one hammer will also not necessarily apply to another.It is probable that very few rebound hammers used for in-situ testing are in factregularly checked against a standard anvil, and the reliability of results may sufferas a consequence.
The importance of specimen mass has been discussed above; it is essential thattest specimens are either securely clamped in a heavy testing machine or supportedupon an even solid floor. Cubes or cylinders of at least 150 mm should be used,and a minimum restraining load of 15% of the specimen strength has beensuggested for cylinders (50), and BS 1881 (45) recommends not less than 7 N/mm2 for cubes tested with a type N hammer. Some typical relationships betweenrebound number and restraining load are given in Figure 2.8, which shows thatonce a sufficient load has been reached the rebound number remains reasonablyconstant.
It is well established that the crushing strength of a cube tested wet is likely tobe about 10% lower than the strength of a corresponding cube tested dry. Sincerebound measurements should be taken on a dry surface, it is recommended thatwet cured cubes be dried in the laboratory atmosphere for 24 hours before test,and it is therefore to be expected that they will yield higher strengths than if testedwet in the standard manner (51). Depending
Copyright 1996 Chapman & Hall

upon the purpose of the test programme it may be necessary to confirm thisrelationship, and the relative moisture conditions of the calibration specimens andin-place concrete must also be considered when interpreting the field results. Theuse of cores cut following in-situ hardness tests may help to overcome thesedifficulties in developing calibrations.
If cubes are used, readings should be taken on at least two vertical faces of thespecimen as cast, as described in section 2.2, and the hammer orientation must besimilar to that to be used for the in-place tests. The influence of gravity on themass will depend on whether it is moving vertically up or down, horizontally oron an inclined plane. The effect on the rebound number will be considerable,although the relative values suggested by the manufacturer are likely to be reliablein this instance because this is purely a function of the equipment.
Figure 2.8 Effect of restraining load on calibration specimen (incorporating data from ref. 50).
Copyright 1996 Chapman & Hall

2.3.3 InterpretationThe interpretation of surface hardness readings relies upon a knowledge of theextent to which the factors described in section 2.3.1 have been standardizedbetween readings being compared. This applies whether the results are being usedto assess relative quality or to estimate strength. It will be apparent from Figure2.9, which shows a typical strength calibration chart produced under ‘ideal’laboratory conditions, that the scatter of results is considerable, and the strengthrange corresponding to a given rebound number is about ±15% even for ‘identical’concrete. In a practical situation it is very unlikely that a strength prediction canbe made to an accuracy better than ±25% (50). The calibration scatter alsosuggests that even if a strength prediction is not required, a considerable variationof rebound number can be expected for ‘identical’ concrete, and acceptable limitsmust be determined in conjunction with some other form of testing. It is suggested(12) that where the total number of readings (n) taken at a location is not less than10, the accuracy of the mean rebound number is likely to be within with 95%confidence. The results may usefully be presented in graphical form as describedin section 1.6.2.1, and calculation of the coefficient of variation may yield anindication of concrete uniformity, as described in section 1.6.2.2, when sufficientresults are available.
The test location within the member is important when interpreting results
Figure 2.9 Typical rebound number/compressive strength calibration chart.
Copyright 1996 Chapman & Hall
(Chapter 1) but it should be noted that the test yields information about a thinsurface layer only. Results are unrelated to the properties of the interior, andfurthermore are not regarded as reliable on concrete more than three months oldunless special steps are taken to allow for age effects and surface carbonation, asdescribed above.
Although it is generally the relationship between rebound number andcompressive strength that is of interest, similar relationships can be establishedwith flexural strength although with an even greater scatter. It appears that nogeneral relationship between rebound number and elastic modulus exists althoughit may be possible to produce such a calibration for a specific mix.
2.3.4 Applications and limitationsThe useful applications of surface hardness measurements can be divided intofour categories:
(i) Checking the uniformity of concrete quality(ii) Comparing a given concrete with a specified requirement
(iii) Approximate estimation of strength(iv) Abrasion resistance classification.
Whatever the application, it is essential that the factors influencing test results arestandarized or allowed for, and it should be remembered that results relate only tothe surface zone of the concrete under test. A further overriding limitation relatesto testing at early ages or low strengths, because the rebound numbers may be toolow for accurate reading and the impact may also cause damage to the surface(Figure 2.10). It is therefore not recommended that the method is used for concretewhich has a cube strength of less than 10 N/mm2 or which is less than 7 days old,unless of high strength.
(i) Concrete uniformity checking. The most important and reliable applications ofsurface hardness testing are where it is not necessary to attempt to convert theresults to some other property of the concrete. It is claimed (48) that surfacehardness measurements give more consistently reproducible results than any othermethod of testing concrete. Although they do not detect poor internal compaction,results are sensitive to variations of quality between batches, or due to inadequatemixing or segregation. The value as a control test is further enhanced by the abilityto monitor the concrete in members cheaply and more comprehensively than ispossible by a small number of control specimens. For such comparisons to bevalid for a given mix it is only necessary to standardize age, maturity, surfacemoisture conditions (which should preferably be dry), and location on thestructure or unit.
This approach has been extensively used to control uniformity of precastconcrete units, and may also prove valuable for the comparison of suspect in-situelements with similar elements which are known to be sound. A further valuableuse for such comparative tests may be to establish the representation of other
Copyright 1996 Chapman & Hall

forms of testing, possibly destructive, which may yield more specific but localizedindications of quality.
(ii) Comparison with a specific requirement. This application is also popular inthe precasting industry, where a minimum hardness reading may be calibratedagainst some specific requirement of the concrete. For instance, the readiness ofprecast units for transport may be checked, with calibration based on proof loadtests. The approach may also be used as an acceptance criterion, in relation to theremoval of temporary supports from structural members, or commencement ofstress transfer in prestressed concrete construction.
(iii) Approximate strength estimation. This represents the least reliableapplication and (unfortunately, since a strength estimate is frequently requiredby engineers) is where misuse is most common. The accuracy depends entirelyupon the elimination of influences which are not taken into account in thecalibration. For laboratory specimens cast, cured and tested under conditionsidentical to those used for calibration, it is unlikely that a strength estimate betterthan ±15% can be achieved for concrete up to three months old. Although itmay be possible to correct for one or two variables which may not be identicalon site, the accuracy of absolute strength prediction will decline as aconsequence and is unlikely to be better than ±25%. The use of the rebound
Figure 2.10 Surface damage on green concrete.
Copyright 1996 Chapman & Hall

hammer for strength estimation of in-place concrete must never be attemptedunless specific calibration charts are available, and even then, the use of thismethod alone is not recommended, although the value of results may beimproved if used in conjunction with other forms of testing as described inChapter 1.
(iv) Abrasion resistance classification. Abrasion resistance is generally affectedby the same influences as surface hardness, and Chaplin (52) has suggested thatthe rebound hammer may be used to classify this property. This is discussed inChapter 7. It is also reasonable to suppose that other durability characteristics thatare related to a dense, well cured, outer surface zone may similarly be classified.
Copyright 1996 Chapman & Hall

3 Ultrasonic pulse velocity methods
The first reports of the measurement of the velocity of mechanically generatedpulses through concrete appeared in the USA in the mid 1940s. It was foundthat the velocity depended primarily upon the elastic properties of the materialand was almost independent of geometry. The potential value of this approachwas apparent, but measurement problems were considerable, and led to thedevelopment in France, a few years later, of repetitive mechanical pulseequipment. At about the same time work was undertaken in Canada and theUnited Kingdom using electro-acoustic transducers, which were found to offergreater control on the type and frequency of pulses generated. This form oftesting has been developed into the modern ultrasonic method, employing pulsesin the frequency range of 20–150 kHz, generated and recorded by electroniccircuits. Ultrasonic testing of metals commonly uses a reflective pulse techniquewith much higher frequencies, but this cannot readily be applied to concretebecause of the high scattering which occurs at matrix/aggregate interfaces andmicrocracks. Concrete testing is thus at present based largely on pulse velocitymeasurements using through-transmission techniques. The method has becomewidely accepted around the world, and commercially produced robustlightweight equipment suitable for site as well as laboratory use is readilyavailable.
Andrews (53) has suggested that there is much scope for new applications withthe development of improved fidelity transducers and computer interpretation.Study of pulse attenuation characteristics has been shown by the authors toprovide useful data relating to deterioration of concrete due to alkali-silicareactions (54) although there are practical problems of achieving consistentcoupling on site. Hillger (55) and Kroggel (56) have both described thedevelopment of pulse-echo techniques to permit detection of defects and cracksfrom tests on one surface as well as the use of a vacuum coupling system, and theapplication of signal processing techniques to yield information about internaldefects and features is the subject of current research. Another interestingdevelopment described by Sack and Olson (57) involves the use of rollingtransmitter and receiver scanners which do not need any coupling medium with acomputer data acquisition system which permits straight line scans of up to 9 m tobe made within a time-scale of less than 30 seconds.
Although it is likely that such developments will expand into commercial usein the near future, the remainder of this chapter will concentrate upon conventionalpulse velocity techniques.
Copyright 1996 Chapman & Hall

If the method is properly used by an experienced operator, a considerableamount of information about the interior of a concrete member can be obtained.However, since the range of pulse velocities relating to practical concrete qualitiesis relatively small (3.5–4.8 km/s), great care is necessary, especially for site usage.Furthermore, since it is the elastic properties of the concrete which affect pulsevelocity, it is often necessary to consider in detail the relationship between elasticmodulus and strength when interpreting results. Recommendations for the use ofthis method are given in BS 1881: Part 203 (58) and also in ASTM C597 (59).
3.1 Theory of pulse propagation through concrete
Three types of waves are generated by an impulse applied to a solid mass. Surfacewaves having an elliptical particle displacement are the slowest, whereas shear ortransverse waves with particle displacement at right angles to the direction oftravel are faster. Longitudinal waves with particle displacement in the direction oftravel (sometimes known as compression waves) are the most important sincethese are the fastest and generally provide more useful information. Electro-acoustical transducers produce waves primarily of this type; other types generallycause little interference because of their lower speed.
The wave velocity depends upon the elastic properties and mass of the medium,and hence if the mass and velocity of wave propagation are known it is possible toassess the elastic properties. For an infinite, homogeneous, isotropic elasticmedium, the compression wave velocity is given by:
(3.1) where V=compression wave velocity (km/s)
Ed=dynamic modulus of elasticity (kN/mm2)
ρ=density (kg/m3)
and v=dynamic Poisson’s ratio.
In this expression the value of K is relatively insensitive to variations of thedynamic Poisson’s ratio v, and hence, provided that a reasonable estimate of thisvalue and the density can be made, it is possible to compute E
d using a measured
value of wave velocity V. Since v and p will vary little for mixes with naturalaggregates, the relationship between velocity and dynamic elastic modulus maybe expected to be reasonably consistent despite the fact that concrete is notnecessarily the ‘ideal’ medium to which the mathematical relationship applies, asindicated in section 3.3.
Copyright 1996 Chapman & Hall
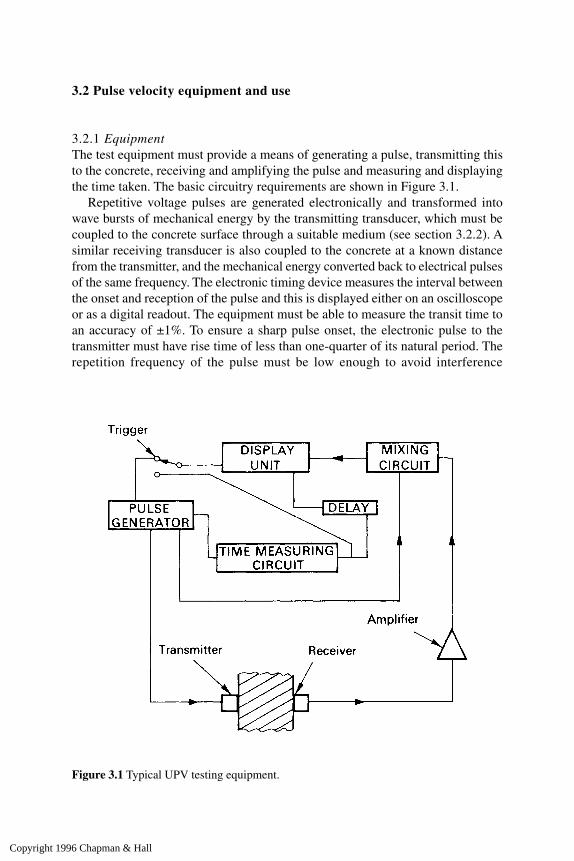
3.2 Pulse velocity equipment and use
3.2.1 EquipmentThe test equipment must provide a means of generating a pulse, transmitting thisto the concrete, receiving and amplifying the pulse and measuring and displayingthe time taken. The basic circuitry requirements are shown in Figure 3.1.
Repetitive voltage pulses are generated electronically and transformed intowave bursts of mechanical energy by the transmitting transducer, which must becoupled to the concrete surface through a suitable medium (see section 3.2.2). Asimilar receiving transducer is also coupled to the concrete at a known distancefrom the transmitter, and the mechanical energy converted back to electrical pulsesof the same frequency. The electronic timing device measures the interval betweenthe onset and reception of the pulse and this is displayed either on an oscilloscopeor as a digital readout. The equipment must be able to measure the transit time toan accuracy of ±1%. To ensure a sharp pulse onset, the electronic pulse to thetransmitter must have rise time of less than one-quarter of its natural period. Therepetition frequency of the pulse must be low enough to avoid interference
Figure 3.1 Typical UPV testing equipment.
Copyright 1996 Chapman & Hall
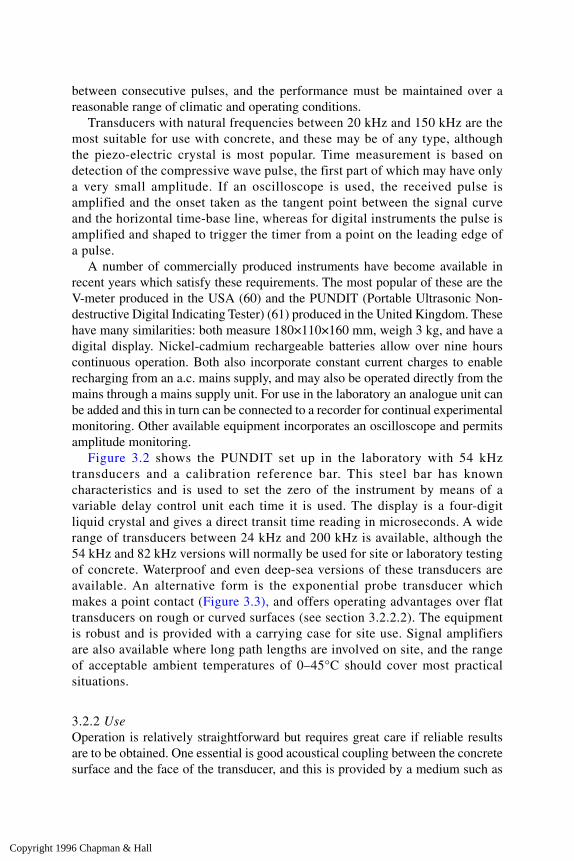
between consecutive pulses, and the performance must be maintained over areasonable range of climatic and operating conditions.
Transducers with natural frequencies between 20 kHz and 150 kHz are themost suitable for use with concrete, and these may be of any type, althoughthe piezo-electric crystal is most popular. Time measurement is based ondetection of the compressive wave pulse, the first part of which may have onlya very small amplitude. If an oscilloscope is used, the received pulse isamplified and the onset taken as the tangent point between the signal curveand the horizontal time-base line, whereas for digital instruments the pulse isamplified and shaped to trigger the timer from a point on the leading edge ofa pulse.
A number of commercially produced instruments have become available inrecent years which satisfy these requirements. The most popular of these are theV-meter produced in the USA (60) and the PUNDIT (Portable Ultrasonic Non-destructive Digital Indicating Tester) (61) produced in the United Kingdom. Thesehave many similarities: both measure 180×110×160 mm, weigh 3 kg, and have adigital display. Nickel-cadmium rechargeable batteries allow over nine hourscontinuous operation. Both also incorporate constant current charges to enablerecharging from an a.c. mains supply, and may also be operated directly from themains through a mains supply unit. For use in the laboratory an analogue unit canbe added and this in turn can be connected to a recorder for continual experimentalmonitoring. Other available equipment incorporates an oscilloscope and permitsamplitude monitoring.
Figure 3.2 shows the PUNDIT set up in the laboratory with 54 kHztransducers and a calibration reference bar. This steel bar has knowncharacteristics and is used to set the zero of the instrument by means of avariable delay control unit each time it is used. The display is a four-digitliquid crystal and gives a direct transit time reading in microseconds. A widerange of transducers between 24 kHz and 200 kHz is available, although the54 kHz and 82 kHz versions will normally be used for site or laboratory testingof concrete. Waterproof and even deep-sea versions of these transducers areavailable. An alternative form is the exponential probe transducer whichmakes a point contact (Figure 3.3), and offers operating advantages over flattransducers on rough or curved surfaces (see section 3.2.2.2). The equipmentis robust and is provided with a carrying case for site use. Signal amplifiersare also available where long path lengths are involved on site, and the rangeof acceptable ambient temperatures of 0–45°C should cover most practicalsituations.
3.2.2 UseOperation is relatively straightforward but requires great care if reliable resultsare to be obtained. One essential is good acoustical coupling between the concretesurface and the face of the transducer, and this is provided by a medium such as
Copyright 1996 Chapman & Hall
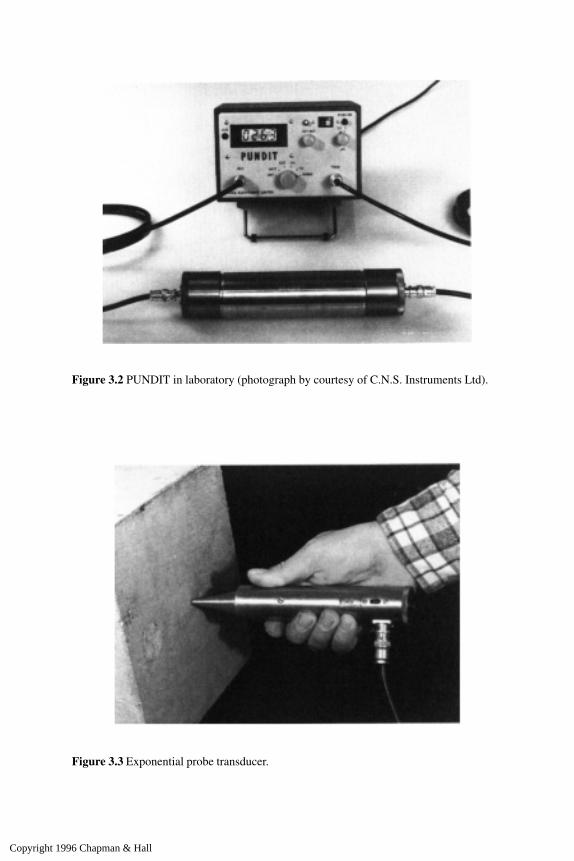
Figure 3.3 Exponential probe transducer.
Figure 3.2 PUNDIT in laboratory (photograph by courtesy of C.N.S. Instruments Ltd).
Copyright 1996 Chapman & Hall

petroleum jelly, liquid soap or grease. Air pockets must be eliminated, and it isimportant that only a thin separating layer exists—any surplus must be squeezedout. A light medium, such as petroleum jelly or liquid soap, has been found to bethe best for smooth surfaces, but a thicker grease is recommended for roughersurfaces which have not been cast against smooth shutters. If the surface is veryrough or uneven, grinding or preparation with plaster of Paris or quick-settingmortar may be necessary to provide a smooth surface for transducer application.It is also important that readings are repeated by complete removal and re-application of transducers to obtain a minimum value for the transit time.Although the measuring equipment is claimed to be accurate to ±0.1microseconds, if a transit time accuracy of ±1% is to be achieved it may typicallybe necessary to obtain a reading to ±0.7 microseconds over a 300mm path length.This can only be achieved with careful attention to measurement technique, andany dubious readings should be repeated as necessary, with special attention tothe elimination of any other source of vibration, however slight, during the test.
The path length must also be measured to an accuracy of ±1%. This shouldpresent little difficulty with paths over about 500 mm, but for shorter paths it isrecommended that calipers be used. The nominal member dimensions shown ondrawings will seldom be adequate.
3.2.2.1 Transducer arrangement. There are three basic ways in which thetransducers may be arranged, as shown in Figure 3.4. These are:
(i) Opposite faces (direct transmission)(ii) Adjacent faces (semi-direct transmission)
(iii) Same face (indirect transmission). Since the maximum pulse energy is transmitted at right angles to the face of thetransmitter, the direct method is the most reliable from the point of view of transittime measurement. Also, the path is clearly defined and can be measuredaccurately, and this approach should be used wherever possible for assessingconcrete quality. The semi-direct method can sometimes be used satisfactorily ifthe angle between the transducers is not too great, and if the path length is not toolarge. The sensitivity will be smaller, and if these requirements are not met it ispossible that no clear signal will be received because of attenuation of thetransmitted pulse. The path length is also less clearly defined due to the finitetransducer size, but it is generally regarded as adequate to take this from centre tocentre of transducer faces.
The indirect method is definitely the least satisfactory, since the received signalamplitude may be less than 3% of that for a comparable direct transmission. Thereceived signal is dependent upon scattering of the pulse by discontinuities and isthus highly subject to errors. The pulse velocity will be predominantly influencedby the surface zone concrete, which may not be representative of the body, and
Copyright 1996 Chapman & Hall
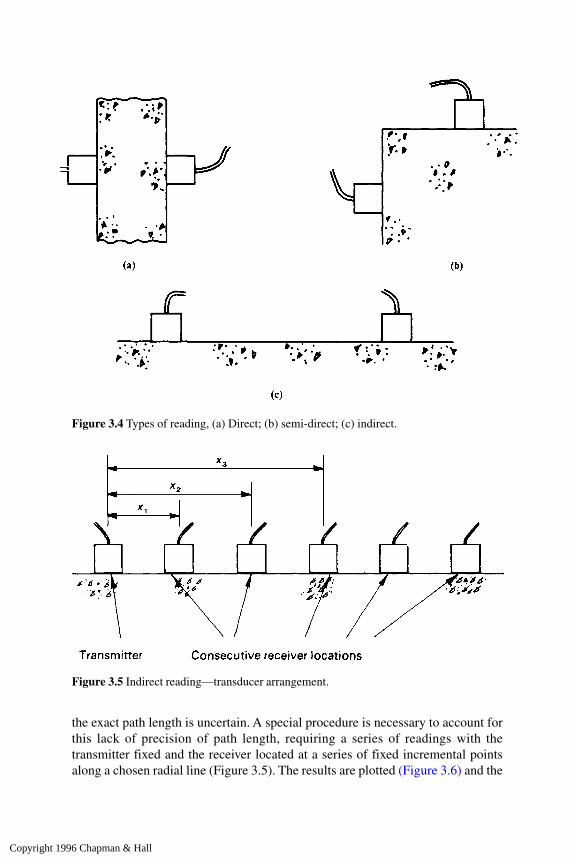
the exact path length is uncertain. A special procedure is necessary to account forthis lack of precision of path length, requiring a series of readings with thetransmitter fixed and the receiver located at a series of fixed incremental pointsalong a chosen radial line (Figure 3.5). The results are plotted (Figure 3.6) and the
Figure 3.4 Types of reading, (a) Direct; (b) semi-direct; (c) indirect.
Figure 3.5 Indirect reading—transducer arrangement.
Copyright 1996 Chapman & Hall
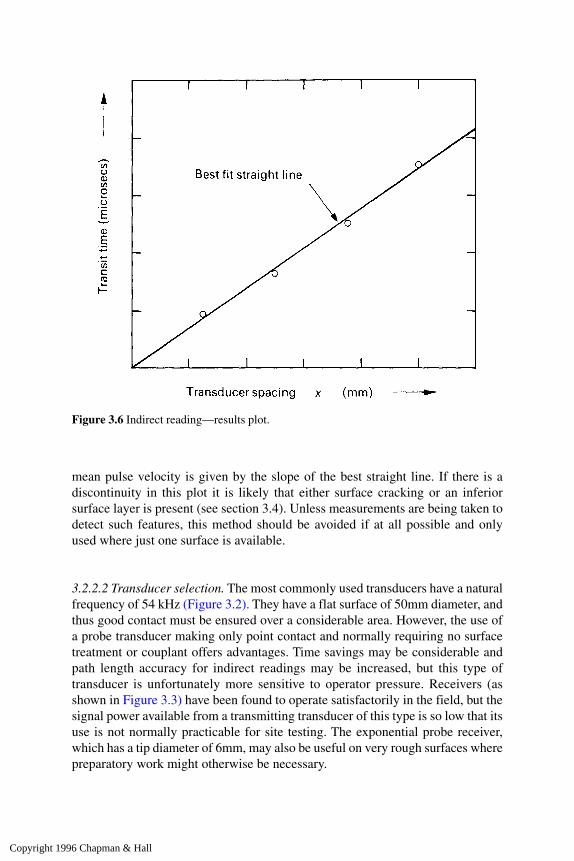
mean pulse velocity is given by the slope of the best straight line. If there is adiscontinuity in this plot it is likely that either surface cracking or an inferiorsurface layer is present (see section 3.4). Unless measurements are being taken todetect such features, this method should be avoided if at all possible and onlyused where just one surface is available.
3.2.2.2 Transducer selection. The most commonly used transducers have a naturalfrequency of 54 kHz (Figure 3.2). They have a flat surface of 50mm diameter, andthus good contact must be ensured over a considerable area. However, the use ofa probe transducer making only point contact and normally requiring no surfacetreatment or couplant offers advantages. Time savings may be considerable andpath length accuracy for indirect readings may be increased, but this type oftransducer is unfortunately more sensitive to operator pressure. Receivers (asshown in Figure 3.3) have been found to operate satisfactorily in the field, but thesignal power available from a transmitting transducer of this type is so low that itsuse is not normally practicable for site testing. The exponential probe receiver,which has a tip diameter of 6mm, may also be useful on very rough surfaces wherepreparatory work might otherwise be necessary.
Figure 3.6 Indirect reading—results plot.
Copyright 1996 Chapman & Hall

The only important factors which are likely to require the selection of analternative transducer frequency relate to the dimensions of the member under test.Difficulties arise with small members as the medium under test cannot be consideredas effectively infinite. This will occur when the path width is less than thewavelength λ. Since λ=pulse velocity/frequency of vibration, it follows that the leastlateral dimensions given in Table 3.1 should be satisfied. Aggregate size shouldsimilarly be less than λ to avoid reduction of wave energy and possible loss of signalat the receiver, although this will not normally be a problem. Although use of higherfrequencies may reduce the maximum acceptable path length (10 m for 54 kHz to 3m for 82 kHz), due to the lower energy output associated with the higher frequency,this problem can easily be overcome by the use of an inexpensive signal amplifier.
3.2.2.3 Equipment calibration. The time delay adjustment must be used to set thezero reading for the equipment before use, and this should also be regularlychecked during and at the end of each period of use. Individual transducer andconnecting lead characteristics will affect this adjustment, which is performedwith the aid of a calibrated steel reference bar which has a transit time of around25 µs. A reading through this bar (Figure 3.2) is taken in the normal way ensuringthat only a very thin layer of couplant separates the bar and transducers. It is alsorecommended that the accuracy of transit time measurement of the equipment ischecked by measurement on a second reference specimen, preferably with atransit time of around 100 µs.
3.3 Test calibration and interpretation of results
The basic problem is that the material under test consists of two separateconstituents, matrix and aggregate, which have different elastic and strengthproperties. The relationship between pulse velocity and dynamic elastic modulusof the composite material measured by resonance tests on prisms is fairly reliable,as shown in Figure 3.7. Although this relationship is influenced by the value ofdynamic Poisson’s ratio, for most practical concretes made with naturalaggregates the estimate of modulus of elasticity should be accurate within 10%.
Table 3.1 Minimum lateral path and maximum aggregatedimensions
Copyright 1996 Chapman & Hall

3.3.1 Strength calibrationThe relationship between elastic modulus and strength of the composite materialcannot be defined simply by consideration of the properties and proportions ofindividual constituents. This is because of the influence of aggregate particleshape, efficiency of the aggregate/matrix interface and variability of particledistribution, coupled with changes of matrix properties with age. Although someattempts have been made to represent this theoretically, the complexity of theinterrelationships is such that experimental calibration for elastic modulus andpulse velocity/strength relationships is normally necessary. Aggregate may varyin type, shape, size and quantity, and the cement type, sand type, water/cementratio and maturity are all important factors which influence the matrix propertiesand hence strength correlations. A pulse velocity/strength curve obtained withmaturity as the only variable, for example, will differ from that obtained byvarying the water/cement ratio for otherwise similar mixes, but testing atcomparable maturities. Similarly, separate correlations will exist for varyingaggregate types and proportions (Figures 3.8, 3.9 and 3.10) as well as for cementcharacteristics (62). This will include lightweight concretes (24) and specialcements (63).
Strength calibration for a particular mix should normally be undertaken in thelaboratory with due attention to the factors listed above. Pulse velocity readingsare taken between both pairs of opposite cast faces of cubes of known moisturecondition, which are then crushed in the usual way. Ideally, at least 10 sets ofthree specimens should be used, covering as wide a range of strengths as possible,
Figure 3.7 Pulse velocity vs. dynamic elastic modulus (based on ref. 58).
Copyright 1996 Chapman & Hall
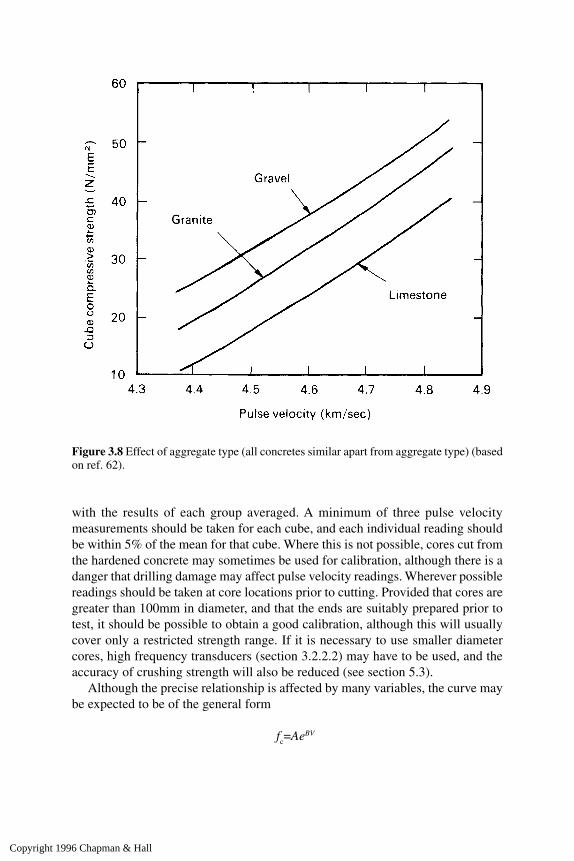
with the results of each group averaged. A minimum of three pulse velocitymeasurements should be taken for each cube, and each individual reading shouldbe within 5% of the mean for that cube. Where this is not possible, cores cut fromthe hardened concrete may sometimes be used for calibration, although there is adanger that drilling damage may affect pulse velocity readings. Wherever possiblereadings should be taken at core locations prior to cutting. Provided that cores aregreater than 100mm in diameter, and that the ends are suitably prepared prior totest, it should be possible to obtain a good calibration, although this will usuallycover only a restricted strength range. If it is necessary to use smaller diametercores, high frequency transducers (section 3.2.2.2) may have to be used, and theaccuracy of crushing strength will also be reduced (see section 5.3).
Although the precise relationship is affected by many variables, the curve maybe expected to be of the general form
fc=AeBV
Figure 3.8 Effect of aggregate type (all concretes similar apart from aggregate type) (basedon ref. 62).
Copyright 1996 Chapman & Hall

Figure 3.9 Comparison of lightweight and gravel aggregates (based on ref. 27).
Figure 3.10 Effect of aggregate proportions (based on ref. 62).
Copyright 1996 Chapman & Hall
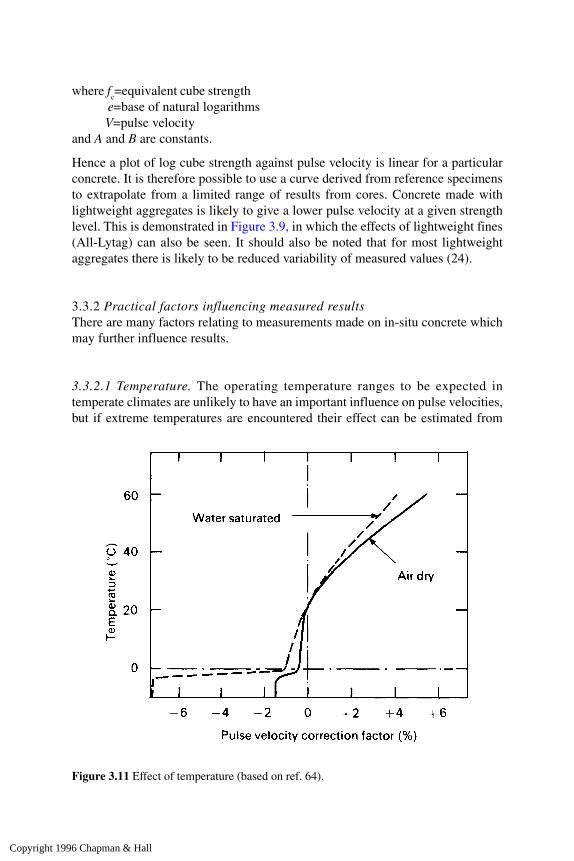
where fc=equivalent cube strength
e=base of natural logarithmsV=pulse velocity
and A and B are constants.
Hence a plot of log cube strength against pulse velocity is linear for a particularconcrete. It is therefore possible to use a curve derived from reference specimensto extrapolate from a limited range of results from cores. Concrete made withlightweight aggregates is likely to give a lower pulse velocity at a given strengthlevel. This is demonstrated in Figure 3.9, in which the effects of lightweight fines(All-Lytag) can also be seen. It should also be noted that for most lightweightaggregates there is likely to be reduced variability of measured values (24).
3.3.2 Practical factors influencing measured resultsThere are many factors relating to measurements made on in-situ concrete whichmay further influence results.
3.3.2.1 Temperature. The operating temperature ranges to be expected intemperate climates are unlikely to have an important influence on pulse velocities,but if extreme temperatures are encountered their effect can be estimated from
Figure 3.11 Effect of temperature (based on ref. 64).
Copyright 1996 Chapman & Hall

Figure 3.11. These factors are based on work by Jones and Facaoaru (64) andreflect possible internal microcracking at high temperatures and the effects ofwater freezing within the concrete at very low temperatures.
3.3.2.2 Stress history. It has been generally accepted that the pulse velocity oflaboratory cubes is not significantly affected until a stress of approximately 50%of the crushing strength is reached. This has been confirmed by the authors (65)who have also shown from tests on beams that concrete subjected to flexural stressshows similar characteristics. At higher stress levels, an apparent reduction inpulse velocity is observed due to the formation of internal microcracks which willinfluence both path length and width.
It has been clearly shown that under service conditions in which stresses wouldnot normally exceed cube strength the influence of compressive stress on pulsevelocity is insignificant, and that pulse velocities for prestressed concrete membersmay be used with confidence. Only if a member has been seriously overstressedwill pulse velocities be affected. Tensile stresses have been found to have asimilarly insignificant effect, but potentially cracked regions should be treatedwith caution, even when measurements are parallel to cracks, since these mayintroduce path widths below acceptable limits.
3.3.2.3 Path length. Pulse velocities are not generally influenced by path lengthprovided that this is not excessively small, in which case the heterogeneous natureof the concrete may become important. Physical limitations of the time-measuringequipment may also introduce errors where short path lengths are involved. Theseeffects are shown in Figure 3.12, in which a laboratory specimen has beenincrementally reduced in length by sawing. BS 1881: Part 203 (58) recommendsminimum path lengths of 100mm and 150 mm for concrete with maximumaggregate sizes of 20 and 40 mm respectively. For unmoulded surfaces a minimumlength of 150 mm should be adopted for direct, or 400mm for indirect, readings.
There is evidence (50) that the measured velocity will decrease with increasingpath length, and a typical reduction of 5% for a path length increase fromapproximately 3m to 6m is reported. This is because attenuation of the higherfrequency pulse components results in a less clearly defined pulse onset. Thecharacteristics of the measuring equipment are therefore an important factor. Ifthere is any doubt about this, it is recommended that some verification tests areperformed, although in most practical situations path length is unlikely to presenta serious problem.
3.3.2.4 Moisture conditions. The pulse velocity through saturated concrete maybe up to 5% higher than through the same concrete in a dry condition, althoughthe influence will be less for high-strength than for low-strength concretes. Theeffect of moisture condition on both pulse velocity and concrete strength is thus afurther factor contributing to calibration difficulties, since the moisture content of
Copyright 1996 Chapman & Hall
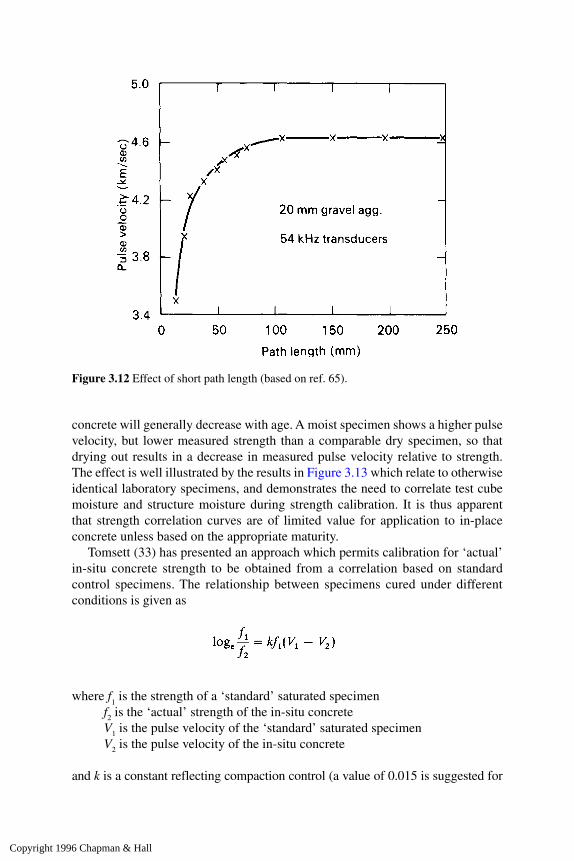
concrete will generally decrease with age. A moist specimen shows a higher pulsevelocity, but lower measured strength than a comparable dry specimen, so thatdrying out results in a decrease in measured pulse velocity relative to strength.The effect is well illustrated by the results in Figure 3.13 which relate to otherwiseidentical laboratory specimens, and demonstrates the need to correlate test cubemoisture and structure moisture during strength calibration. It is thus apparentthat strength correlation curves are of limited value for application to in-placeconcrete unless based on the appropriate maturity.
Tomsett (33) has presented an approach which permits calibration for ‘actual’in-situ concrete strength to be obtained from a correlation based on standardcontrol specimens. The relationship between specimens cured under differentconditions is given as
where f1 is the strength of a ‘standard’ saturated specimen
f2 is the ‘actual’ strength of the in-situ concreteV1 is the pulse velocity of the ‘standard’ saturated specimenV2 is the pulse velocity of the in-situ concrete
and k is a constant reflecting compaction control (a value of 0.015 is suggested for
Figure 3.12 Effect of short path length (based on ref. 65).
Copyright 1996 Chapman & Hall
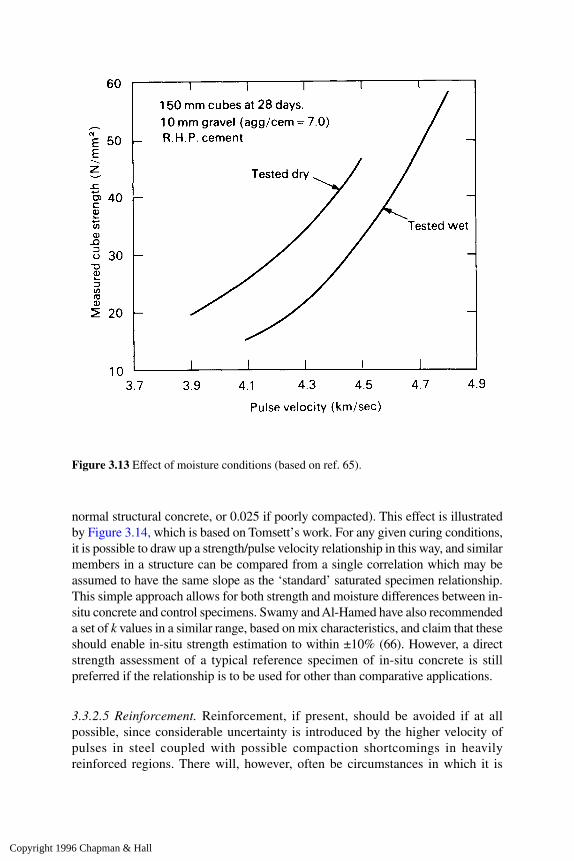
normal structural concrete, or 0.025 if poorly compacted). This effect is illustratedby Figure 3.14, which is based on Tomsett’s work. For any given curing conditions,it is possible to draw up a strength/pulse velocity relationship in this way, and similarmembers in a structure can be compared from a single correlation which may beassumed to have the same slope as the ‘standard’ saturated specimen relationship.This simple approach allows for both strength and moisture differences between in-situ concrete and control specimens. Swamy and Al-Hamed have also recommendeda set of k values in a similar range, based on mix characteristics, and claim that theseshould enable in-situ strength estimation to within ±10% (66). However, a directstrength assessment of a typical reference specimen of in-situ concrete is stillpreferred if the relationship is to be used for other than comparative applications.
3.3.2.5 Reinforcement. Reinforcement, if present, should be avoided if at allpossible, since considerable uncertainty is introduced by the higher velocity ofpulses in steel coupled with possible compaction shortcomings in heavilyreinforced regions. There will, however, often be circumstances in which it is
Figure 3.13 Effect of moisture conditions (based on ref. 65).
Copyright 1996 Chapman & Hall

impossible to avoid reinforcing steel close to the pulse path, and corrections to themeasured value will then be necessary. Corrections are not easy to establish, andthe influence of the steel may dominate over the properties of the concrete so thatconfidence in estimated concrete pulse velocities will be reduced.
The pulse velocity in an infinite steel medium is close to 5.9 km/s, but this hasbeen shown to reduce with bar diameter to as little as 5.1 km/s along the length ofa 10 mm reinforcing bar in air (65). The velocity along a bar embedded in concreteis further affected by the velocity of pulses in the concrete and the condition ofthe bond between steel and concrete.
The apparent increase in pulse velocity through a concrete member dependsupon the proximity of measurements to reinforcing bars, the diameter and numberof bars and their orientation with respect to the propagation path. An increase willoccur if the first pulse to arrive at the receiving transducer travels partly in concreteand partly in steel. Correction factors originally suggested by RILEM (67)assumed an average constant value of pulse velocity in steel and gave themaximum possible influence of the steel. The procedure adopted by BS 1881:Part 203 (58) is based on extensive experimental work by the authors (68) and
Figure 3.14 Desiccation line method (based on ref. 33).
Copyright 1996 Chapman & Hall

takes bar diameter into account, yielding smaller corrections (see Figure 3.18).For practical purposes, with concrete pulse velocities of 4.0 km/s or above, 20-mm diameter bars running transversely to the pulse path will have no significantinfluence upon measured values, but bars larger than 6mm diameter running alongthe path may have a significant effect.
There are two principal cases to be considered: (i) Axis of bars parallel to pulse pathAs shown in Figure 3.15, if a bar is sufficiently close to the path, the first wave tobe received may have travelled along the bar for part of its journey. BS 1881: Part203 suggests that a relationship of
(3.2)
is appropriate, where Vs=pulse velocity in steel bar
and Vc=pulse velocity in concrete
and that this effect disappears when
hence steel effects may be significant when a/L<0.15 in high-quality concrete or<0.25 in low-quality material. The difficulty in applying eqn (3.2) lies in decidingthe value of Vs. The equation can be expressed as
(3.3)
where Vm is the measured apparent pulse velocity (L/T) in km/s, and k is the
Vc=kVm
Figure 3.15 Reinforcement parallel to pulse path.
Copyright 1996 Chapman & Hall
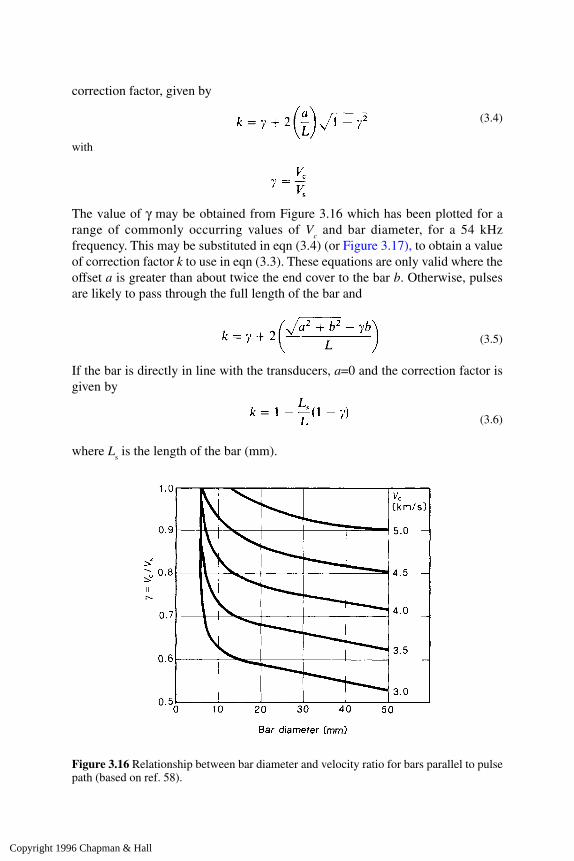
correction factor, given by
(3.4)
with
The value of γ may be obtained from Figure 3.16 which has been plotted for arange of commonly occurring values of V
c and bar diameter, for a 54 kHz
frequency. This may be substituted in eqn (3.4) (or Figure 3.17), to obtain a valueof correction factor k to use in eqn (3.3). These equations are only valid where theoffset a is greater than about twice the end cover to the bar b. Otherwise, pulsesare likely to pass through the full length of the bar and
(3.5) If the bar is directly in line with the transducers, a=0 and the correction factor isgiven by
(3.6)
where Ls is the length of the bar (mm).
Figure 3.16 Relationship between bar diameter and velocity ratio for bars parallel to pulsepath (based on ref. 58).
Copyright 1996 Chapman & Hall
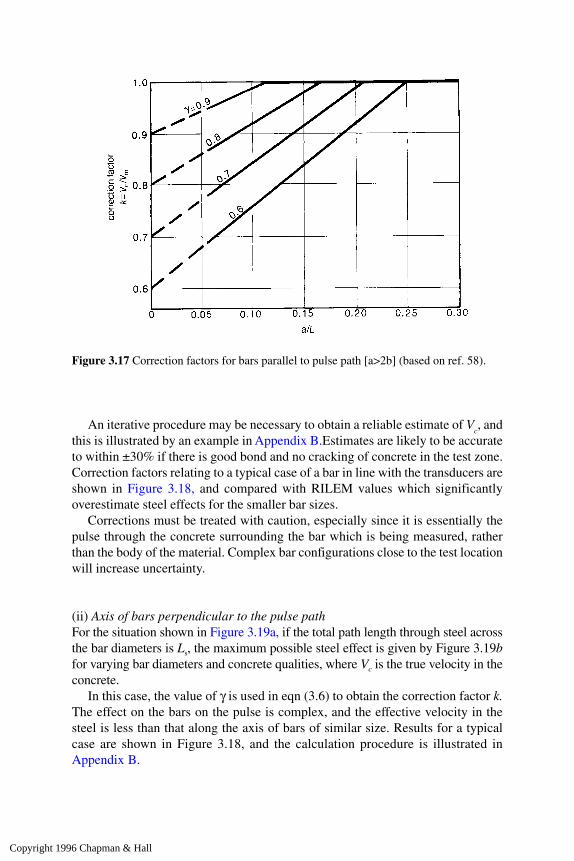
An iterative procedure may be necessary to obtain a reliable estimate of Vc, and
this is illustrated by an example in Appendix B.Estimates are likely to be accurateto within ±30% if there is good bond and no cracking of concrete in the test zone.Correction factors relating to a typical case of a bar in line with the transducers areshown in Figure 3.18, and compared with RILEM values which significantlyoverestimate steel effects for the smaller bar sizes.
Corrections must be treated with caution, especially since it is essentially thepulse through the concrete surrounding the bar which is being measured, ratherthan the body of the material. Complex bar configurations close to the test locationwill increase uncertainty.
(ii) Axis of bars perpendicular to the pulse path For the situation shown in Figure 3.19a, if the total path length through steel acrossthe bar diameters is Ls, the maximum possible steel effect is given by Figure 3.19bfor varying bar diameters and concrete qualities, where Vc is the true velocity in theconcrete.
In this case, the value of γ is used in eqn (3.6) to obtain the correction factor k.The effect on the bars on the pulse is complex, and the effective velocity in thesteel is less than that along the axis of bars of similar size. Results for a typicalcase are shown in Figure 3.18, and the calculation procedure is illustrated inAppendix B.
Figure 3.17 Correction factors for bars parallel to pulse path [a>2b] (based on ref. 58).
Copyright 1996 Chapman & Hall

3.4 Applications
The applications of pulse velocity measurements are so wide-ranging that itwould be impossible to list or describe them all. The principal applications
Figure 3.18 Typical correction factors.
Figure 3.19 Reinforcement transverse to pulse path (based on ref. 58). (a) Path throughtransverse reinforcement, (b) Bar diameter/velocity ratio.
Copyright 1996 Chapman & Hall
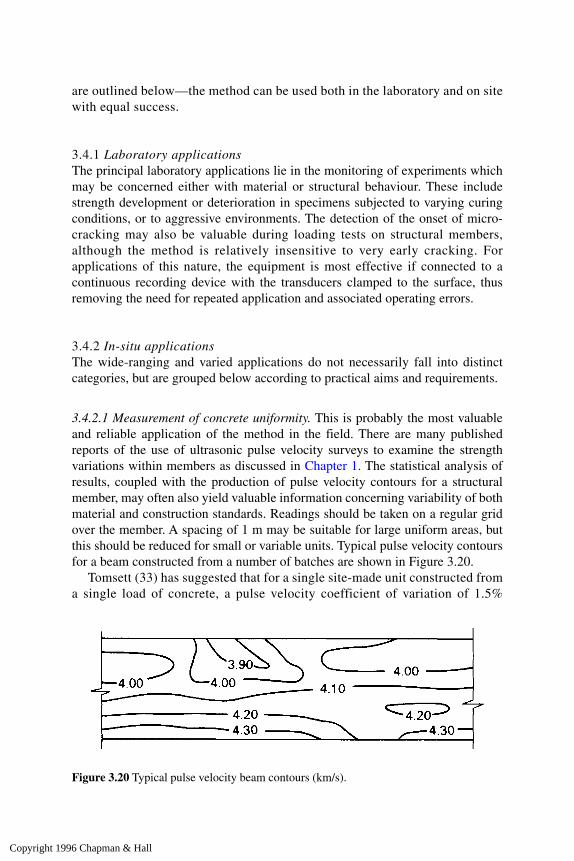
are outlined below—the method can be used both in the laboratory and on sitewith equal success.
3.4.1 Laboratory applicationsThe principal laboratory applications lie in the monitoring of experiments whichmay be concerned either with material or structural behaviour. These includestrength development or deterioration in specimens subjected to varying curingconditions, or to aggressive environments. The detection of the onset of micro-cracking may also be valuable during loading tests on structural members,although the method is relatively insensitive to very early cracking. Forapplications of this nature, the equipment is most effective if connected to acontinuous recording device with the transducers clamped to the surface, thusremoving the need for repeated application and associated operating errors.
3.4.2 In-situ applicationsThe wide-ranging and varied applications do not necessarily fall into distinctcategories, but are grouped below according to practical aims and requirements.
3.4.2.1 Measurement of concrete uniformity. This is probably the most valuableand reliable application of the method in the field. There are many publishedreports of the use of ultrasonic pulse velocity surveys to examine the strengthvariations within members as discussed in Chapter 1. The statistical analysis ofresults, coupled with the production of pulse velocity contours for a structuralmember, may often also yield valuable information concerning variability of bothmaterial and construction standards. Readings should be taken on a regular gridover the member. A spacing of 1 m may be suitable for large uniform areas, butthis should be reduced for small or variable units. Typical pulse velocity contoursfor a beam constructed from a number of batches are shown in Figure 3.20.
Tomsett (33) has suggested that for a single site-made unit constructed froma single load of concrete, a pulse velocity coefficient of variation of 1.5%
Figure 3.20 Typical pulse velocity beam contours (km/s).
Copyright 1996 Chapman & Hall

would represent good construction standards, rising to 2.5% where severalloads or a number of small units are involved. A corresponding typical valueof 6–9% is also suggested for similar concrete throughout a whole structure.An analysis of this type may therefore be used as a measure of constructionquality, and the location of substandard areas can be obtained from the‘contour’ plot. The plotting of pulse velocity readings in histogram form mayalso prove valuable, since concrete of good quality will provide one clearlydefined peak in the distribution (see section 1.6.2.1). Used in this way,ultrasonic pulse velocity testing could be regarded as a form of control testing,although the majority of practical cases in which this method has been usedare related to suspected construction malpractice or deficiency of concretesupply. A survey of an existing structure will reveal and locate such features,which may not otherwise be detected. Although it is preferable to performsuch surveys by means of direct readings across opposite faces of the member,Tomsett (69) has reported the successful use of indirect readings forcomparison and determination of substandard areas of floor slabs.
Decisions concerning the seriousness of defects suggested by surveys ofthis type will normally require an estimate of concrete strength. As indicatedin section 3.4.2.3, a reliable estimate of absolute strength is not possibleunless a calibration is available. If the mean strength of the supply is known,the relationship fc=kV4 has been found satisfactory for estimating relativevalues over small ranges (33). Failing this, it will be necessary to resort to amore positive partially-destructive method, or core sampling, to obtainstrength values, with the locations determined on the basis of the ultrasoniccontour plot.
3.4.2.2 Detection of cracking and honeycombing. A valuable application of theultrasonic pulse velocity techniques which does not require detailed correlationof pulse velocity with any other property of the material is in the detection ofhoneycombing and cracking. Since the pulse cannot travel through air, thepresence of a crack or void on the path will increase the path length (as it goesaround the flaw) and increase attenuation so that a longer transit time will berecorded. The apparent pulse velocity thus obtained will be lower than for thesound material. Since compression waves will travel through water it followsthat this philosophy will apply only to cracks or voids which are not water-filled (shear waves will not pass through water). Tomsett (33) has examined thisin detail and concluded that although water-filled cracks cannot be detected,water-filled voids will show a lower velocity than the surrounding concrete.Voids containing honeycombed concrete of low pulse velocity will behavesimilarly. The variation in pulse velocity due to experimental error is likely tobe at least 2% notwithstanding variations in concrete properties, hence the sizeof a void must be sufficient to cause an increase in path length greater than 2%if it is to be detected. A given void is thus more difficult to detect as the path
Copyright 1996 Chapman & Hall
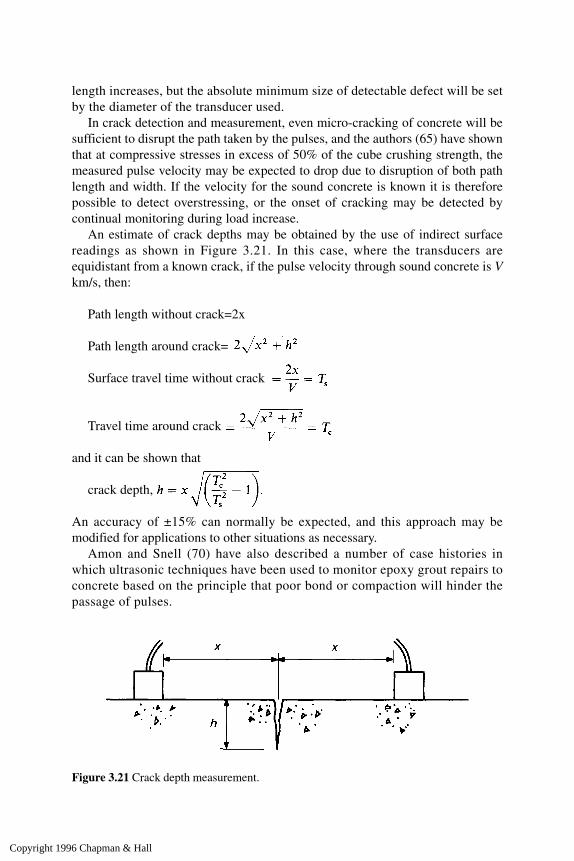
length increases, but the absolute minimum size of detectable defect will be setby the diameter of the transducer used.
In crack detection and measurement, even micro-cracking of concrete will besufficient to disrupt the path taken by the pulses, and the authors (65) have shownthat at compressive stresses in excess of 50% of the cube crushing strength, themeasured pulse velocity may be expected to drop due to disruption of both pathlength and width. If the velocity for the sound concrete is known it is thereforepossible to detect overstressing, or the onset of cracking may be detected bycontinual monitoring during load increase.
An estimate of crack depths may be obtained by the use of indirect surfacereadings as shown in Figure 3.21. In this case, where the transducers areequidistant from a known crack, if the pulse velocity through sound concrete is Vkm/s, then:
Path length without crack=2x
Path length around crack=
Surface travel time without crack
Travel time around crack and it can be shown that
crack depth, An accuracy of ±15% can normally be expected, and this approach may bemodified for applications to other situations as necessary.
Amon and Snell (70) have also described a number of case histories inwhich ultrasonic techniques have been used to monitor epoxy grout repairs toconcrete based on the principle that poor bond or compaction will hinder thepassage of pulses.
Figure 3.21 Crack depth measurement.
Copyright 1996 Chapman & Hall

The location of honeycombing is best determined by the use of directmeasurements through the suspect member, with readings taken on a regular grid.If the member is of constant thickness, a ‘contour map’ of transit times will readilyshow the location and extent of areas of poor compaction.
3.4.2.3 Strength estimation. Unless a suitable calibration curve can beobtained it is virtually impossible to predict the absolute strength of a body ofin-situ concrete by pulse velocity measurements. Although it is possible toobtain reasonable correlations with both compressive and flexural strength inthe laboratory, enabling the strength of comparable specimens to be estimatedto ±10%, the problems of relating these to in-situ concrete are considerable. Ifit is to be attempted, then the most reliable method is probably the use ofcores to establish the calibration curve coupled with Tomsett’s moisturecorrection. The authors (65) have suggested that if a reliable calibration chartis available, together with good testing conditions, it may be possible toachieve 95% confidence limits on a strength prediction of ±20% relating to alocalized area of interest. Expected within-member variations are likely toreduce the corresponding accuracy of overall strength prediction of a memberto the order of ±10 N/mm2 at the 30 N/mm2 mean level. Accuracy decreases athigher strength levels, and estimates above 40 N/mm2 should be treated withgreat caution.
Although not perfect, there may be situations in which this approach mayprovide the only feasible method of in-situ strength estimation, and if this isnecessary it is particularly important that especial attention is given to the relativemoisture conditions of the calibration samples and the in-situ concrete. Failure totake account of this is most likely to cause an underestimate of in-place strength,and this underestimate may be substantial.
It is claimed (43) that significant improvements in accuracy can be obtainedby combination with other techniques such as rebound hammer tests asdescribed in Chapter 1, but this approach has never achieved popularity in theUK or USA.
3.4.2.4 Assessment of concrete deterioration. Ultrasonics are commonly used inattempting to define the extent and magnitude of deterioration resulting from fire,mechanical, frost or chemical attack. A general survey of the type described insection 3.4.2.1 will easily locate suspect areas (71), whilst a simple method forassessing the depth of fire or surface chemical attack has been suggested byTomsett (33). In this approach it is assumed that the pulse velocity for the soundinterior regions of the concrete can be obtained from unaffected areas, and thatthe damaged surface velocity is zero. A linear increase is assumed between thesurface and interior to enable the depth to sound concrete to be calculated from atransit time measured across the damaged zone. For example, if a time T isobtained for a path length L including one damaged surface zone of thickness t,
Copyright 1996 Chapman & Hall

and the pulse velocity for sound concrete is Vc it can be shown that the thickness is
given by
t=(TVc-L)
Although this provides only a very rough estimate of damage depth, it is reportedthat the method has been found to give reasonable results in a number of firedamage investigations.
Where deterioration of the member is more general, it is possible that pulsevelocities may reflect relative strengths either within or between members. Thereis a danger that elastic modulus, and hence pulse velocity, may not be affected tothe same degree as strength and caution should therefore be exercised when usingpulse velocities in this way.
Although it may be possible to develop laboratory calibrations for a mixsubjected to a specific form of attack or deterioration, as was attempted whenevaluating high alumina cement decomposition in the United Kingdom (72),absolute strength predictions of in-situ deteriorated concrete must be regarded asunreliable. In-situ comparison of similar members to identify those which aresuspect for subsequent load testing, has however been carried out successfully inthe course of a number of HAC investigations, and pulse velocities have been shownto be sensitive to the initiation and development of alkali—silica reaction (54, 73).This provides a relatively quick and cheap approach where a large number of precastunits, for example, are involved. Long-term performance of concrete can also bemonitored very successfully by conducting repetitive tests on the same element.
3.4.2.5 Measurement of layer thickness. This is essentially a development of theindirect reading method which is based on the fact that as the path length increasesthe pulse will naturally tend to travel through concrete at an increasing depthbelow the surface. This is particularly appropriate for application to slabs in whicha surface layer of different quality exists due to construction, weathering, or otherdamage such as fire. The procedure is exactly as described for obtaining anindirect measurement (section 3.2.2.1). When the transducers are close togetherthe pulse will travel in the surface layer only, but at greater spacings the path willinclude the lower layer. This effect will be shown by a discontinuity in the plot oftransit time v. transducer spacing, with the pulse velocities through the two layershaving different slopes, as shown in Figure 3.22. The thickness t of the upperlayer is related to the velocities V1 and V2, and the spacing x at which thediscontinuity is observed, by the expression
Although this is most suitable for a distinct layer of uniform thickness, the valueobtained can be at best only an estimate, and it must be borne in mind that there
Copyright 1996 Chapman & Hall

will be a maximum thickness of layer that can be detected. Little information isavailable concerning the depth of penetration of indirect readings, and in viewof the weakness of signal received using this method the results must be treatedwith care.
3.4.2.6 Measurement of elastic modulus. This is the property that can be measuredwith the greatest numerical accuracy. Values of pulse modulus can be calculatedtheoretically using an assumed value of Poisson’s ratio to yield a value within±10%, or more commonly an estimate of dynamic modulus can be obtained fromthe reliable correlations with resonant frequency values. Whereas suchmeasurements may be valuable in the laboratory when undertaking model testing,their usefulness on site is limited, although they may be used to provide anestimated static elastic modulus value for use in calculations relating to load tests.
3.4.2.7 Strength development monitoring. It has been well established that pulsevelocity measurements will accurately monitor changes in the quality of the pastewith time, and this may be usefully applied to the control of demoulding orstressing operations both in precasting works and on site. In this situation aspecific pulse velocity/strength relationship for the mix, subject to the appropriatecuring conditions, can be obtained and a safe acceptance level of pulse velocity
Figure 3.22 Layer thickness measurement.
Copyright 1996 Chapman & Hall

established. In the same way, quality control of similar precast units may easily beundertaken and automated techniques incorporating amplitude assessment havebeen proposed (74).
3.5 Reliability and limitations
Ultrasonic pulse velocity measurement has been found to be a valuable andreliable method of examining the interior of a body of concrete in a truly non-destructive manner. Modern equipment is robust, reasonably cheap and easy tooperate, and reliable even under site conditions; however, it cannot beoveremphasized that operators must be well trained and aware of the factorsaffecting the readings. It is similarly essential that results are properly evaluatedand intepreted by experienced engineers who are familiar with the technique. Forcomparative purposes the method has few limitations, other than when twoopposite faces of a member are not available. The method provides the onlyreadily available method of determining the extent of cracking within concrete;however, the use for detection of flaws within the concrete is not reliable whenthe concrete is wet.
Unfortunately, the least reliable application is for strength estimation ofconcrete. The factors influencing calibrations are so many that even under idealconditions with a specific calibration it is unlikely that 95% confidence limits ofbetter than ±20% can be achieved for an absolute strength prediction for in-placeconcrete. Although it is recognized that there may be some circumstances in whichattempts must be made to use the method for strength prediction, this is notrecommended. It is far better that attention is concentrated upon the use of themethod for comparison of supposedly similar concrete, possibly in conjunctionwith some other form of testing, rather than attempt applications which arerecognized as unreliable and which will therefore be regarded with scepticism.
Copyright 1996 Chapman & Hall

4 Partially destructive strength tests
Considerable developments have taken place in recent years in methods which areintended to assess in-situ concrete strength, but cause some localized damage. Thisdamage is sufficiently small to cause no loss in structural performance. All aresurface zone tests which require access to only one exposed concrete face.Methods incorporate variations of the concepts of penetration resistance, pull-out, pull-off and break-off techniques which have been proposed over many years.Estimation of strength is by means of correlation charts which, in general, are notsensitive to as many variables as are rebound hammer or pulse-velocity testing.There are drawbacks in application and accuracy, which vary according to themethod, but there are many circumstances in which these methods have beenshown to be of considerable value. A key feature is that an estimate of strength isimmediately available, compared with delays of several days for core testing, andalthough accuracy may not be as good, the testing is considerably less disruptiveand damaging.
The best-established of these methods are covered by American and othernational standards, and are incorporated in BS 1881: Part 207 (75) and a report byACI Committee 228 (37). The choice of method for particular circumstances willdepend largely upon whether the testing is preplanned before casting, togetherwith practical factors such as access, cost, speed and prior knowledge of theconcrete involved. The tests can be used only where making good of surfaces isacceptable.
4.1 Penetration resistance testing
The technique of firing steel nails or bolts into a concrete surface to providefixings is well established, and it is known that the depth of penetration isinfluenced by the strength of the concrete. A strength determination method basedon this approach, using a specially designed bolt and standardized explosivecartridge, was developed in the USA during the mid 1960s and is known as theWindsor probe test (76). It has gained popularity in the USA and Canada,especially for monitoring strength development on site, and is the subject ofASTM C803 (77). Many authorities in North America regard it as equivalent tosite cores, and in some cases it is accepted in lieu of control cylinders forcompliance testing. Use outside North America has been limited, but theequipment is readily available and the method is included in BS 1881: Part 207.
Copyright 1996 Chapman & Hall
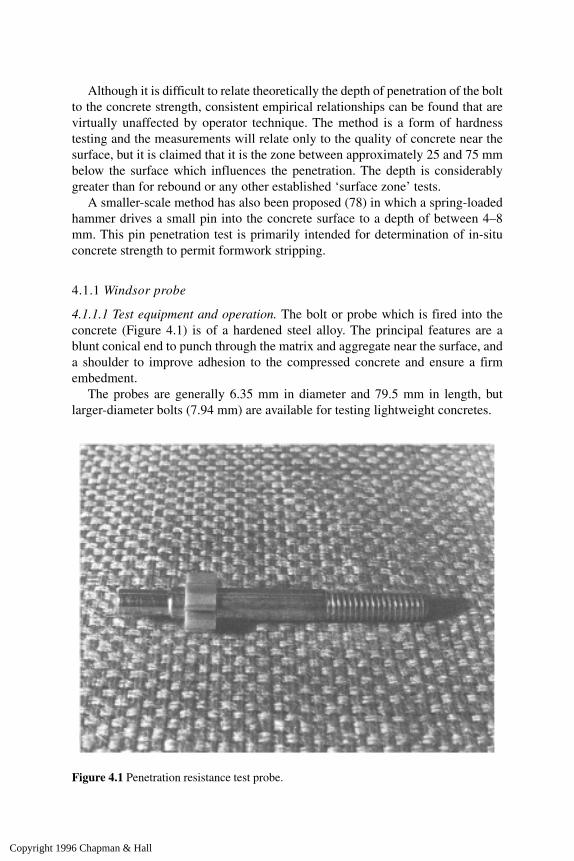
Although it is difficult to relate theoretically the depth of penetration of the boltto the concrete strength, consistent empirical relationships can be found that arevirtually unaffected by operator technique. The method is a form of hardnesstesting and the measurements will relate only to the quality of concrete near thesurface, but it is claimed that it is the zone between approximately 25 and 75 mmbelow the surface which influences the penetration. The depth is considerablygreater than for rebound or any other established ‘surface zone’ tests.
A smaller-scale method has also been proposed (78) in which a spring-loadedhammer drives a small pin into the concrete surface to a depth of between 4–8mm. This pin penetration test is primarily intended for determination of in-situconcrete strength to permit formwork stripping.
4.1.1 Windsor probe
4.1.1.1 Test equipment and operation. The bolt or probe which is fired into theconcrete (Figure 4.1) is of a hardened steel alloy. The principal features are ablunt conical end to punch through the matrix and aggregate near the surface, anda shoulder to improve adhesion to the compressed concrete and ensure a firmembedment.
The probes are generally 6.35 mm in diameter and 79.5 mm in length, butlarger-diameter bolts (7.94 mm) are available for testing lightweight concretes.
Figure 4.1 Penetration resistance test probe.
Copyright 1996 Chapman & Hall

A steel firing head is screwed on to the threaded end of the bolt and the plasticguide locates the probe within the muzzle of the driver from which it is fired. Thedriver, which is shown in operation in Figure 4.2, utilizes a carefully standardizedpowder cartridge. This imparts a constant amount of energy to the probeirrespective of firing orientation, and produces a velocity of 183 m/s which doesnot vary by more than ±1%. The power level can be reduced when dealing withlow strength concretes simply by locating the probe at a fixed position within thedriver barrel. The driver is pressed firmly against a steel locating plate held on thesurface of the concrete which releases a safety catch and permits firing when thetrigger is pulled. After firing, the driver head and locating plate are removed andany surface debris around the probe is scraped or brushed away to give a levelsurface. A flat steel plate is placed on this surface, and a steel cap screwed ontothe probe to enable the exposed length to be measured to the nearest 0.5 mm witha spring-loaded calibrated depth gauge, as in Figure 4.3.
Probe penetrations may be measured individually as described, or alternativelythe probes may be measured in groups of three using a triangular template withthe probes at 177 mm centres. In this case, a system of triangular measuring platesis used which will provide one averaged reading of exposed length for the groupof probes. This approach may mask inconsistencies between individual probes,and it is preferable to measure each probe individually. The measured average
Figure 4.2 Driver in use.
Copyright 1996 Chapman & Hall
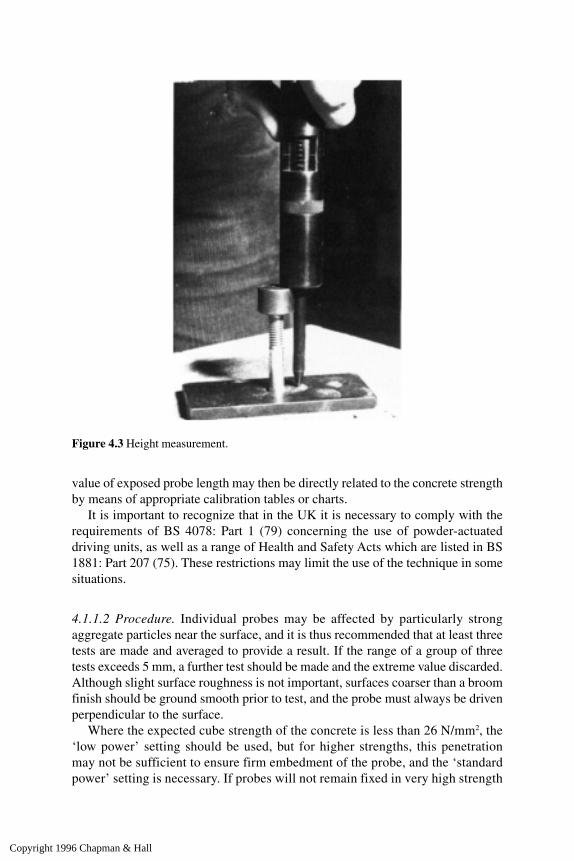
value of exposed probe length may then be directly related to the concrete strengthby means of appropriate calibration tables or charts.
It is important to recognize that in the UK it is necessary to comply with therequirements of BS 4078: Part 1 (79) concerning the use of powder-actuateddriving units, as well as a range of Health and Safety Acts which are listed in BS1881: Part 207 (75). These restrictions may limit the use of the technique in somesituations.
4.1.1.2 Procedure. Individual probes may be affected by particularly strongaggregate particles near the surface, and it is thus recommended that at least threetests are made and averaged to provide a result. If the range of a group of threetests exceeds 5 mm, a further test should be made and the extreme value discarded.Although slight surface roughness is not important, surfaces coarser than a broomfinish should be ground smooth prior to test, and the probe must always be drivenperpendicular to the surface.
Where the expected cube strength of the concrete is less than 26 N/mm2, the‘low power’ setting should be used, but for higher strengths, this penetrationmay not be sufficient to ensure firm embedment of the probe, and the ‘standardpower’ setting is necessary. If probes will not remain fixed in very high strength
Figure 4.3 Height measurement.
Copyright 1996 Chapman & Hall

concrete it may be possible to measure directly the depth of hole formed, aftercleaning, and subtract this from the probe length. It should be noted, however,that this does not conform to BS 1881: Part 207 requirements. Themanufacturers of the system recommend that a minimum edge distance of100mm should be maintained (75 mm for low power) but the authors’experience suggests that these values may not always be sufficient to preventsplitting. Probes should also be at least 175 mm apart to avoid overlapping ofzones of influence.
BS 1881: Part 207 recommends a 150 mm edge distance and 200 mmminimum spacing, with the added restriction that a test should not be locatedwithin 50 mm of a reinforcing bar. A minimum concrete element thickness of 150mm is also recommended.
Aggregate hardness is an important factor in relating penetration to strength,and it may therefore be necessary to determine its value. This is assessed on thebasis of the Mohs’ hardness scale, which is a system for classifying minerals interms of hardness into ten groups. Group 10 is the hardest and Group 1 thesoftest, thus any mineral will scratch another from a group lower than itself.Testing consists of scratching the surface of a typical aggregate particle withminerals of known hardness from a test kit; the hardest is used first, then theothers in order of decreasing hardness until the scratch mark will wipe off. Thefirst scratch that can be wiped off represents the Mohs’ classification for theaggregate.4.1.1.3 Theory, calibration and interpretation. A convincing theoreticaldescription of the penetration of a concrete mass by a probe is not available,since there is little doubt that a complex combination of compressive, tensile,shear and friction forces must exist. The manufacturers of the Windsor probeequipment have suggested that penetration is resisted by a subsurfacecompressive compaction bulb as shown in Figure 4.4. The surface concrete willcrush under the tip of the probe, and the shock waves associated with the impactwill cause fracture lines, and hence surface spalling, adjacent to the probe as itpenetrates the body of concrete. The energy required to cause this spalling, orto break pieces of aggregate, is a low percentage of the total energy of a drivenprobe, and will therefore have a small effect upon the depth of penetration.Penetration will continue, with cracks not necessarily reaching the surface andeventually ceasing to form as the stress drops. Energy is absorbed by thecontinuous crushing at the point, by surface friction and by compression of thebulb of contained concrete. It is this latter effect which prevents rebound of theprobe, and it is claimed that the bulb, and depth of penetration, will be inverselyproportional to the compressive strength. Data are not currently available tosupport these proposals, which must be regarded as rather simplistic, althoughthe concept of the measured property relating to concrete below rather than atthe surface seems reasonable.
Although it may theoretically be possible to undertake calculations based onthe absorption of the kinetic energy of the probe, this would be difficult, and it is
Copyright 1996 Chapman & Hall

very much easier to establish empirical relationships between penetration andstrength.
Calibration is hampered by the minimum edge distance requirement whichprevents splitting. Although it may be possible to use standard 150 mm cubes orcylinders for tests at low power, the specimen must be securely held during thetest. A holding jig for cylinders is available from the Windsor probemanufacturers, and cubes are most conveniently clamped in a compression-testingmachine, although no data concerning the infuence of applied compressivestrength are available. It is recommended by Malhotra (50) that groups of at leastsix specimens from the same batch are used, with three tested in compression andthree each with one probe test, and the results averaged to produce one point onthe calibration graph. Malhotra has also shown that the reduction in measuredcompressive strength of cylinders which have been previously probed may be upto 17.5%, and such specimens cannot therefore be tested in compression forcalibration purposes.
Where the cube strength of the concrete is greater than 26 N/mm2 it is necessaryto use a combination of cubes or cylinders for compression testing and larger slabor beam specimens from the same batch for probing. The size of such specimensis unimportant provided that they are large enough to accommodate at least threeprobes which satisfy the minimum edge distance and spacing requirements. Thesetest specimens must be similarly compacted, and all should be cured together. Insuch situations, the use of ultrasonic pulse velocity measurements to compareconcrete quality between specimens would be valuable. This approach has beenused by the authors (80) in an investigation in which 1000×250×150 mm beamswere used for probing, and 100 mm cubes for compression testing, and it was
Figure 4.4 Compaction bulb.
Copyright 1996 Chapman & Hall
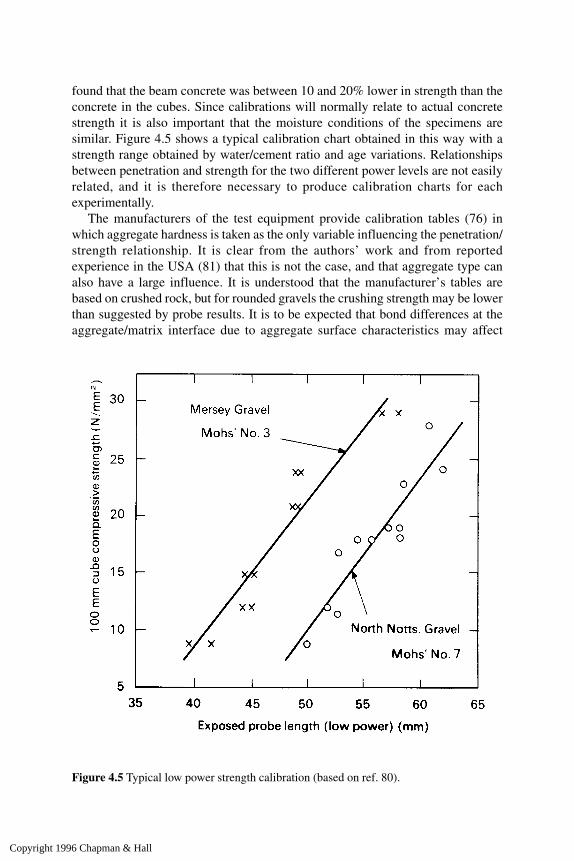
found that the beam concrete was between 10 and 20% lower in strength than theconcrete in the cubes. Since calibrations will normally relate to actual concretestrength it is also important that the moisture conditions of the specimens aresimilar. Figure 4.5 shows a typical calibration chart obtained in this way with astrength range obtained by water/cement ratio and age variations. Relationshipsbetween penetration and strength for the two different power levels are not easilyrelated, and it is therefore necessary to produce calibration charts for eachexperimentally.
The manufacturers of the test equipment provide calibration tables (76) inwhich aggregate hardness is taken as the only variable influencing the penetration/strength relationship. It is clear from the authors’ work and from reportedexperience in the USA (81) that this is not the case, and that aggregate type canalso have a large influence. It is understood that the manufacturer’s tables arebased on crushed rock, but for rounded gravels the crushing strength may be lowerthan suggested by probe results. It is to be expected that bond differences at theaggregate/matrix interface due to aggregate surface characteristics may affect
Figure 4.5 Typical low power strength calibration (based on ref. 80).
Copyright 1996 Chapman & Hall
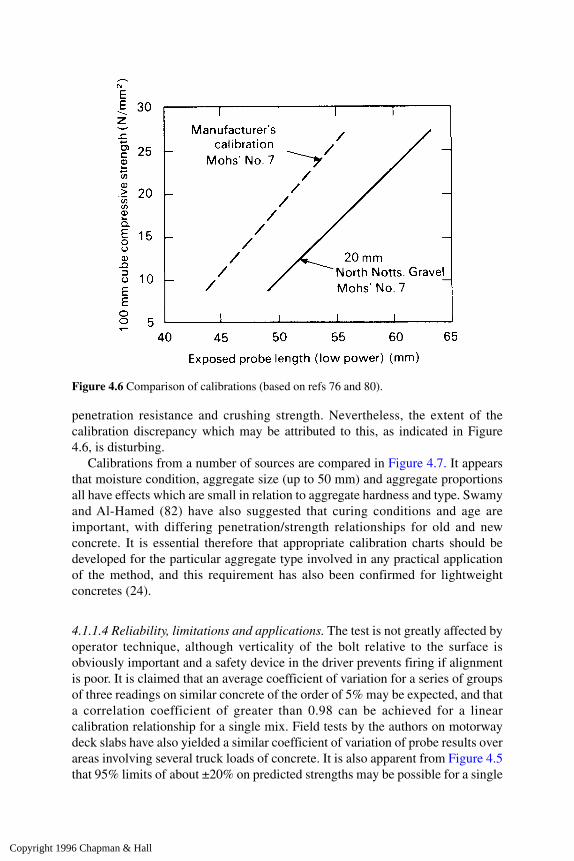
penetration resistance and crushing strength. Nevertheless, the extent of thecalibration discrepancy which may be attributed to this, as indicated in Figure4.6, is disturbing.
Calibrations from a number of sources are compared in Figure 4.7. It appearsthat moisture condition, aggregate size (up to 50 mm) and aggregate proportionsall have effects which are small in relation to aggregate hardness and type. Swamyand Al-Hamed (82) have also suggested that curing conditions and age areimportant, with differing penetration/strength relationships for old and newconcrete. It is essential therefore that appropriate calibration charts should bedeveloped for the particular aggregate type involved in any practical applicationof the method, and this requirement has also been confirmed for lightweightconcretes (24).
4.1.1.4 Reliability, limitations and applications. The test is not greatly affected byoperator technique, although verticality of the bolt relative to the surface isobviously important and a safety device in the driver prevents firing if alignmentis poor. It is claimed that an average coefficient of variation for a series of groupsof three readings on similar concrete of the order of 5% may be expected, and thata correlation coefficient of greater than 0.98 can be achieved for a linearcalibration relationship for a single mix. Field tests by the authors on motorwaydeck slabs have also yielded a similar coefficient of variation of probe results overareas involving several truck loads of concrete. It is also apparent from Figure 4.5that 95% limits of about ±20% on predicted strengths may be possible for a single
Figure 4.6 Comparison of calibrations (based on refs 76 and 80).
Copyright 1996 Chapman & Hall
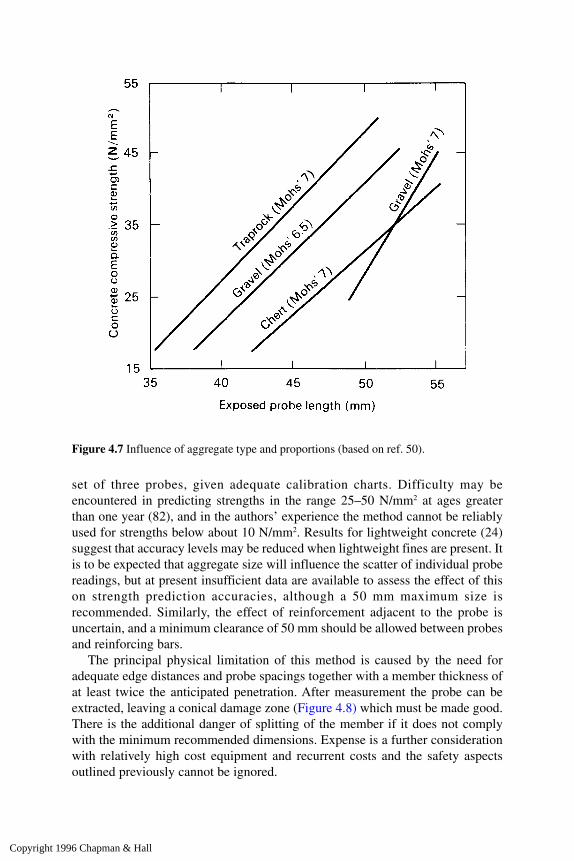
set of three probes, given adequate calibration charts. Difficulty may beencountered in predicting strengths in the range 25–50 N/mm2 at ages greaterthan one year (82), and in the authors’ experience the method cannot be reliablyused for strengths below about 10 N/mm2. Results for lightweight concrete (24)suggest that accuracy levels may be reduced when lightweight fines are present. Itis to be expected that aggregate size will influence the scatter of individual probereadings, but at present insufficient data are available to assess the effect of thison strength prediction accuracies, although a 50 mm maximum size isrecommended. Similarly, the effect of reinforcement adjacent to the probe isuncertain, and a minimum clearance of 50 mm should be allowed between probesand reinforcing bars.
The principal physical limitation of this method is caused by the need foradequate edge distances and probe spacings together with a member thickness ofat least twice the anticipated penetration. After measurement the probe can beextracted, leaving a conical damage zone (Figure 4.8) which must be made good.There is the additional danger of splitting of the member if it does not complywith the minimum recommended dimensions. Expense is a further considerationwith relatively high cost equipment and recurrent costs and the safety aspectsoutlined previously cannot be ignored.
Figure 4.7 Influence of aggregate type and proportions (based on ref. 50).
Copyright 1996 Chapman & Hall
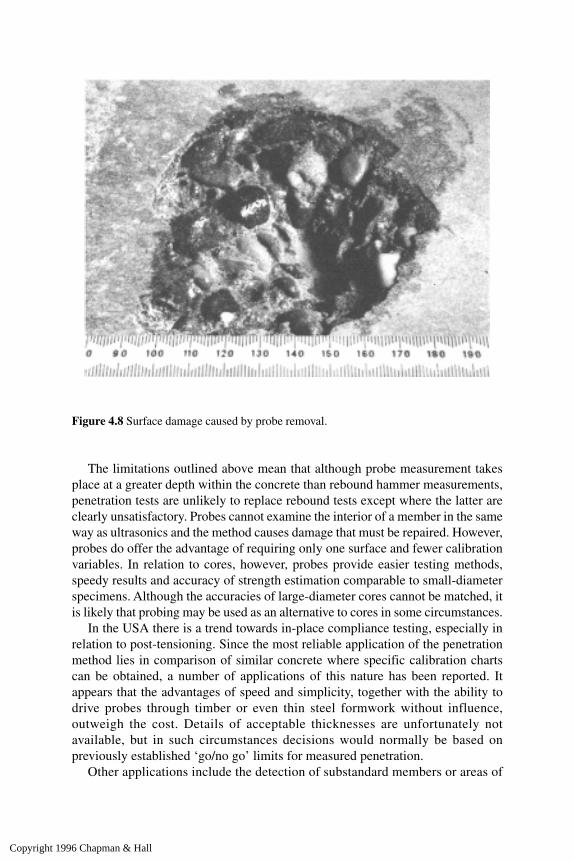
The limitations outlined above mean that although probe measurement takesplace at a greater depth within the concrete than rebound hammer measurements,penetration tests are unlikely to replace rebound tests except where the latter areclearly unsatisfactory. Probes cannot examine the interior of a member in the sameway as ultrasonics and the method causes damage that must be repaired. However,probes do offer the advantage of requiring only one surface and fewer calibrationvariables. In relation to cores, however, probes provide easier testing methods,speedy results and accuracy of strength estimation comparable to small-diameterspecimens. Although the accuracies of large-diameter cores cannot be matched, itis likely that probing may be used as an alternative to cores in some circumstances.
In the USA there is a trend towards in-place compliance testing, especially inrelation to post-tensioning. Since the most reliable application of the penetrationmethod lies in comparison of similar concrete where specific calibration chartscan be obtained, a number of applications of this nature has been reported. Itappears that the advantages of speed and simplicity, together with the ability todrive probes through timber or even thin steel formwork without influence,outweigh the cost. Details of acceptable thicknesses are unfortunately notavailable, but in such circumstances decisions would normally be based onpreviously established ‘go/no go’ limits for measured penetration.
Other applications include the detection of substandard members or areas of
Figure 4.8 Surface damage caused by probe removal.
Copyright 1996 Chapman & Hall

mature concrete, and this method is particularly appropriate for large walls orslabs having only one exposed surface free of finishes. Investigations of thistype have been successfully performed by the authors on highway bridge deckslabs. Probing was carried out on the deck soffit from a small mobile hydraulicplatform while the road above was in normal use, and in one such investigationa total of 18 sets of probes were placed by one operator in a period of six hours.The speed of operation, together with the immediate availability of results,means that many more tests can be made than if cores were being taken, andtest locations can be determined in the light of the results obtained. This isparticularly valuable when attempting to define the location and extent ofsubstandard concrete.
Whether or not the test will be of significant value in the strengthassessment of ‘unknown’ concrete is uncertain, but it is clear that results basedsolely on aggregate hardness are inadequate. It may be, however, that as moreresults are made available it will be possible to increase the confidence withwhich the method may be extended beyond comparative situations.
4.1.2 Pin penetration testNasser and Al-Manaseer (78) have developed this new method, aimed atdetermining formwork stripping times. The apparatus consists of a spring-loadedhammer which can grip a pin of 30.5 mm length and 3.56 mm diameter with thetip machined at an angle of 22.5°. The spring is compressed by pressing thehammer against the concrete surface, and is released by a trigger causing the pinand the attaached shaft and hammer to impact the concrete surface with an energyof about 108 Nm. The depth of the hole created is measured with a dial gaugedevice after cleaning with an air blower.
Calibration testing with gravel and lightweight concretes with cylinderstrengths between 3.1 and 24.1 N/mm2 has shown linear relationships betweenpenetration and compressive strength which have good correlation coefficientsand are very close to each other (78). It is suggested that for practical purposesthese can be combined. The same authors have subsequently compared theperformance with a range of other test methods (81) and shown that themethod compared well in terms of correlation accuracy being the only methodnot requiring separate calibration for lightweight concrete.
It is suggested that a reading should be taken as the average of the best fiveof a group of seven tests to allow for local influences. The principal advantagesof the method seem to be its speed, simplicity, low cost and low level of damage.The depth of penetration is unlikely to exceed 8 mm, hence reinforcement posesno problem. Results at present are limited, both in terms of strength range andaggregate and mix types. Features such as carbonation and temperature haveyet to be examined in detail, but Shoya et al. (83) have provided some datasuggesting coefficients of variation up to 18% and indicating difficulties of
Copyright 1996 Chapman & Hall

strength prediction with deteriorated or carbonated surfaces. The method seemsto offer potential, however, worthy of further investigation.
4.2 Pull-out testing
The concept of measuring the force needed to pull a bolt or some similar devicefrom a concrete surface has been under examination for many years. Proposedtests fall into two basic categories; those which involve an insert which is cast intothe concrete, and those which offer the greater flexibility of an insert fixed into ahole drilled into the hardened concrete. Cast-in methods must be preplanned andwill thus be of value only in testing for specification compliance, whereas drilled-hole methods will be more appropriate for field surveys of mature concrete. Inboth cases, the value of the test depends upon the ability to relate pull-out forcesto concrete strengths and a particularly valuable feature is that this relationship isrelatively unaffected by mix characteristics and curing history. Although theresults will relate to the surface zone only, the approach offers the advantage ofproviding a more direct measure of strength and at a greater depth than surfacehardness testing by rebound methods, but still requires only one exposed surface.Procedures have recently been reviewed in detail by Carino (84).
4.2.1 Cast-in methodsReports were first published in the USA and USSR in the late 1930s describingtests in which a cast-in bolt is pulled from the concrete. These methods do notappear to have become popular, and it was not until 30 years later that practicallyfeasible tests were developed. Two basic methods, both of which require athreaded insert which is fixed to the shuttering prior to concreting, have emerged.A bolt is then screwed into the insert and pulled hydraulically against a circularreaction ring. The principal difference between the two systems, developed inDenmark and Canada respectively, lies in the shape of insert and loadingtechnique. In both cases a cone of concrete is ‘pulled out’ with the bolt, and theforce required to achieve this is translated to compressive strength by the use ofan empirical calibration.
4.2.1.1 The Lok-test. This approach, developed at the Danish Technical Universityin the late 1960s, has gained popularity in Scandinavia and is now accepted by anumber of public agencies in Denmark as equivalent to cylinders for acceptancetesting (1).
The insert (Figure 4.9) consists of a steel sleeve which is attached to a 25 mmdiameter, 8 mm thick anchor plate located at a depth of 25 mm below the concretesurface (85). The sleeve is normally screwed to the shuttering, or fixed to a plasticbuoyancy cup where slabs are to be tested. This is later removed and replaced bya rod of 7.2 mm diameter which is screwed into the anchor plate and coupled to a
Copyright 1996 Chapman & Hall

tension jack. The whole assembly is pre-coated to prevent bonding to the concrete,and rotation of the plate is prevented by the ‘cut-off’. A special extension deviceis also available to permit tests at greater depth if required. Load is applied to thepull-bolt by means of a portable hand-operated hydraulic jack with a reaction ringof 55 mm diameter. This equipment (Figure 4.10) is compact, with a weight ofless than 5 kg.
The loading equipment can determine the force required to cause failure bypulling the disc, and a range of jacks is available to cover all practical concretestrengths including ‘high-strength’ concretes. The load is measured with anaccuracy of ±2% over normal operating temperatures, and a precision valvesystem combined with a friction coupling ensures a constant loading rate of 30±10kN/min. Electronic digital reading apparatus with data storage facilities hasrecently become available. Load is released as soon as a peak is reached, leavingonly a fine circular crack on the concrete surface. Calibration charts as thoseprovided by Petersen (1, 86) (Figure 4.11) or the authors (87) are then used toestimate the compressive strength of the concrete.
BS 1881: Part 207 recommends that the centres of test positions should beseparated by at least eight times the insert head diameter, and that minimum edgedistances should be four diameters. An element thickness of at least four inserthead diameters is needed and tests should be located so that there is no reinforcingsteel within one bar diameter (or maximum aggregate size if greater) of theexpected conic fracture surface. A minimum of four tests is recommended toprovide a result for a given location.
The geometric configuration indicated in Figure 4.9 ensures that the failure
Figure 4.9 Lok-test insert.
Copyright 1996 Chapman & Hall

surface is conical and at an angle of approximately 31° to the axis of applied tensileforce. This is close to the angle of friction of concrete, which is generally assumedto be 37°, and extensive theoretical work has shown that this produces the mostreliable measure of compressive strength. Plasticity theory for concrete using amodified Coulomb’s failure criterion indicates that where the failure angle andfriction angle are equal, the pull-out force is proportional to compressive strength.Finite element analyses of the failure mechanism (88) have indicated that failure isinitiated by crushing, rather than cracking, of the concrete. It is suggested that anarrow symmetrical band of compressive forces runs between the cast-in disc andthe reaction tube on the surface. Further theoretical (89) and experimental (90)research effort has been devoted to attempts to explain the failure mechanisms,and differing views remain. These primarily concern the relative importance ofcompressive crushing and aggregate interlock effects following initialcircumferential cracking which is generally agreed to be fully developed at about65% of the final pull-out load.
Stone and Giza (91) have examined in detail the effect of changes ingeometry and the test assembly and the effect of concrete aggregate propertieson the reliability of the pull-out test. For concrete with cylinder strengths in the14–17 N/mm2 range they have concluded that pull-out force decreases withincreasing apex angle, but that there is no change in variability for apex anglesbetween 54° and 86°, although scatter increases rapidly for lower angles. Aswould be expected, pull-out load increases with depth of embedment and it isconfirmed that it is not affected by aggregate type or size. Variability was,however, shown to be greater for 19-mm aggregate than for smaller sizes, and
Figure 4.10 Lok-test equipment (photograph by courtesy of Lok-test Aps.).
Copyright 1996 Chapman & Hall
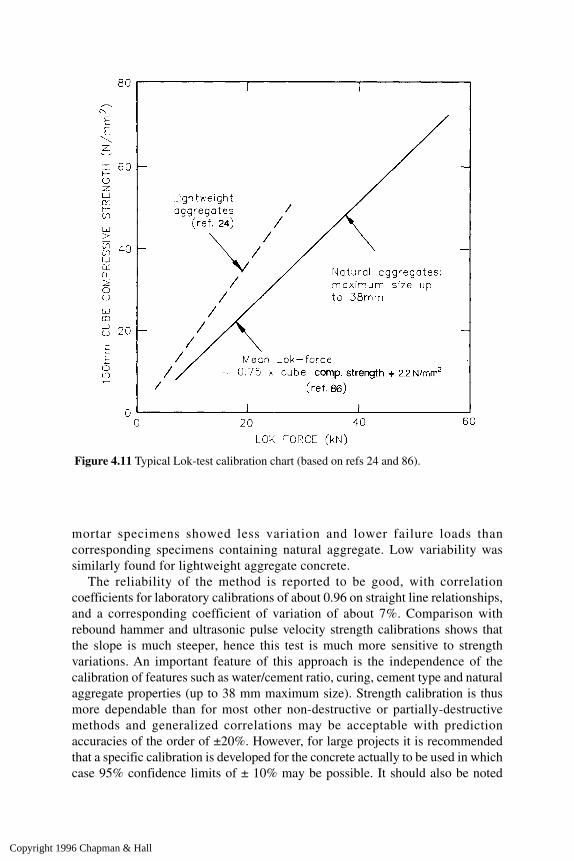
mortar specimens showed less variation and lower failure loads thancorresponding specimens containing natural aggregate. Low variability wassimilarly found for lightweight aggregate concrete.
The reliability of the method is reported to be good, with correlationcoefficients for laboratory calibrations of about 0.96 on straight line relationships,and a corresponding coefficient of variation of about 7%. Comparison withrebound hammer and ultrasonic pulse velocity strength calibrations shows thatthe slope is much steeper, hence this test is much more sensitive to strengthvariations. An important feature of this approach is the independence of thecalibration of features such as water/cement ratio, curing, cement type and naturalaggregate properties (up to 38 mm maximum size). Strength calibration is thusmore dependable than for most other non-destructive or partially-destructivemethods and generalized correlations may be acceptable with predictionaccuracies of the order of ±20%. However, for large projects it is recommendedthat a specific calibration is developed for the concrete actually to be used in whichcase 95% confidence limits of ± 10% may be possible. It should also be noted
Figure 4.11 Typical Lok-test calibration chart (based on refs 24 and 86).
Copyright 1996 Chapman & Hall

that artificial lightweight aggregates are likely to require specific calibration asillustrated in Figure 4.11 (24) which shows a reduced value of pull-out force for aparticular compressive strength level. The two principal limitations are preplannedusage (although the Capo test, section 4.2.2.3, overcomes this), and the surfacezone nature of the test. The test equipment can be obtained in a convenientbriefcase kit form containing all the necessary ancillary items, although the costis relatively high.
Bickley (92) indicates that the use of this approach is growing rapidly in NorthAmerica, especially for determination of form stripping times, and providesillustrative examples of statistical analysis in relation to specification criteria.There seem to be few practical problems associated with in-situ usage, and anarrangement such as that shown in Figure 4.12 may be convenient in this situation.The technique has been shown to be particularly suitable for testing at very lowconcrete strengths and at early ages as illustrated by the authors’ results in Figure4.13. Other applications include determination of stressing time in post-tensionedconstruction, whilst in Denmark the approach is accepted as a standard in-situstrength determination method and may form the basis of specificationcompliance assessment (1). Its use in many parts of the world for in-situ strengthmonitoring has been considerable, and this is likely to spread in the future.
4.2.1.2 North American pull-out methods. In the early 1970s Richards publisheddata from tests made using equipment of his design (84), the basic form of which
Figure 4.12 Arrangement for formwork stripping time tests.
Copyright 1996 Chapman & Hall
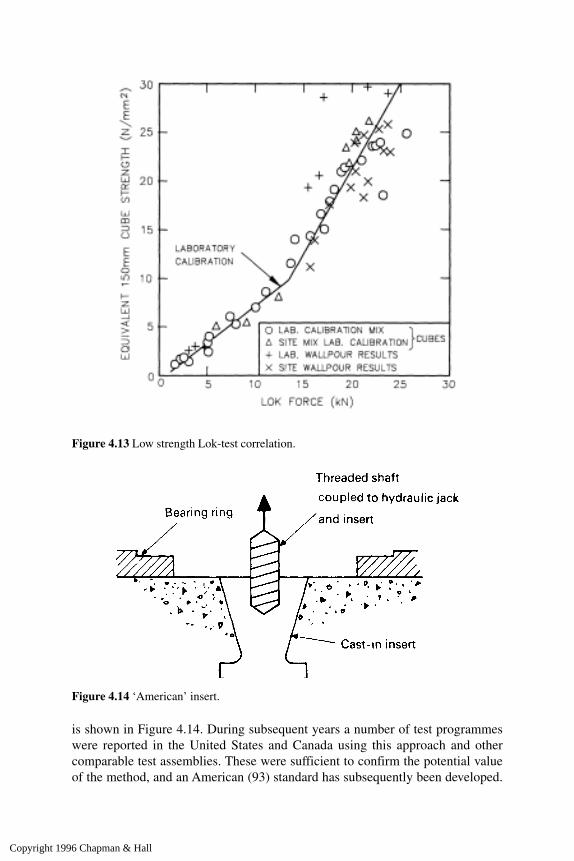
is shown in Figure 4.14. During subsequent years a number of test programmeswere reported in the United States and Canada using this approach and othercomparable test assemblies. These were sufficient to confirm the potential valueof the method, and an American (93) standard has subsequently been developed.
Figure 4.13 Low strength Lok-test correlation.
Figure 4.14 ‘American’ insert.
Copyright 1996 Chapman & Hall

ASTM C900 allows considerable latitude in the details of the test assembly whilespecifying ranges of basic relative dimensions. It is intended that a hydraulic ramis used for load application, which should be at a uniform rate over a period ofapproximately two minutes. The depth of test may be greater than that of the Lok-test (section 4.2.1.1) athough this equipment does satisfy the requirements of bothAmerican and Canadian standards. Indeed, recent reports suggest that use of thecommercially available Lok-test system dominates in these countries in preferenceto other versions of the method.
The failure surface will be less precisely defined than with the Lok-test becauseof the range of allowable dimensions, but Richards (94) suggests that an apexangle of 67° is most satisfactory. Although little theoretical work has beenpublished relating to this type of insert it is likely that mechanisms will occurwhich are similar to those for the Lok-test. Presentation of results, however,according to ASTM C900 (93) should be in the form of a pull-out strength (fp)calculated from the ratio of pull-out force to the failure surface area
where F=force on ramand A=failure surface area.A may be calculated from
where d
2=diameter of pull-out insert head
d3=inside diameter of reaction ringh=distance from insert head to the surface.
The published numerical data relating to this method are not extensive, butcorrelation coefficients of 0.99 are claimed (94) between pull-out and corestrength, with a relationship of pull-out strength=0.21×core strength. Coefficientsof variation on testing would appear to be influenced by the nature of the insert,but Richards (94) also reports values as low as 7% for precision turned inserts.
Applications are obviously limited to preplanned situations and will be similarto those discussed for the Lok-test; similar limitations will also apply.
4.2.2 Drilled-hole methodsThese offer the great advantage that use need not be preplanned. Early proposalsfrom the USSR involved bolts grouted into the holes, but more recently twoalternative methods have been developed and are both commanding interest. In1977 the use of expanding wedge anchor bolts was proposed by Chabowski andBryden-Smith (95), working for the Building Research Establishment. Their
Copyright 1996 Chapman & Hall

technique was initially developed for use with pretensioned high alumina cementconcrete beams and is known as the internal fracture test. This work hassubsequently been extended to Portland cement concretes (96), and the authorshave suggested that an alternative loading technique offers greater reliability (97).In Denmark, work on the Lok-test (see 4.2.1.1) has been extended (1) to producethe Capo test (cut and pull-out) in which an expanding ring is fixed into an under-reamed groove, producing a similar pull-out configuration to that used for theLok-test.
Research in Canada (98) has also considered drilled-hole methodsincorporating split sleeve assemblies, as well as reviving the concept of bolts setinto hardened concrete using epoxy. This suggests that, despite practical problemsand high test variability, both of these approaches are worthy of futuredevelopment. An expanding sleeve device has also been proposed in the UK (99)and called ESCOT. There is little doubt that if a reliable drilled-hole pull-outapproach could be established, it would be extremely valuable for in-situ concretestrength assessment, especially when the concrete mix details are unknown.
4.2.2.1 Internal fracture tests. The basic procedures for this method (95) are asfollows. A hole is drilled 30–35 mm deep into the concrete using a roto-hammerdrill with a nominal 6 mm bit. The hole is then cleared of dust with an air blowerand a 6 mm wedge anchor bolt with expanding sleeve is tapped lightly into thehole until the sleeve is 20 mm below the surface (Figure 4.15). Verticality of boltalignment relative to the surface can be checked using a simple slotted template.
Figure 4.15 Internal fracture test.
Copyright 1996 Chapman & Hall
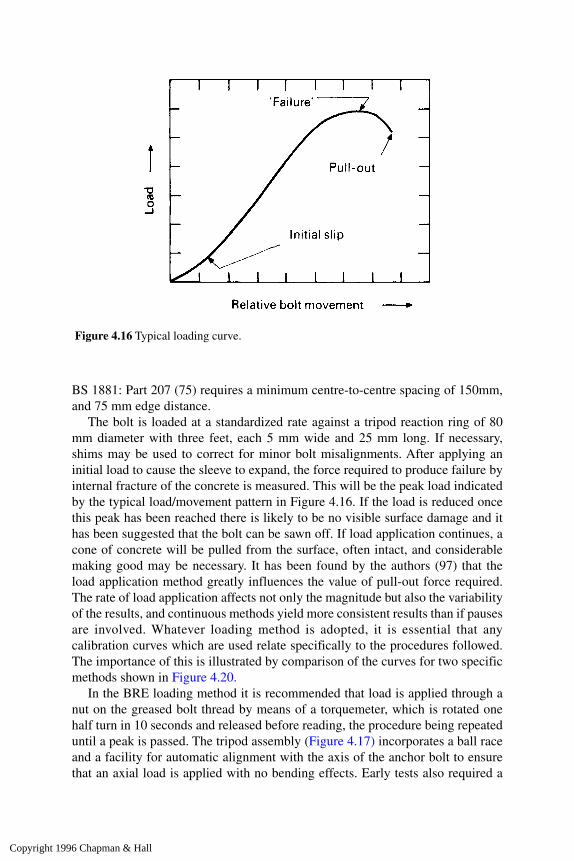
BS 1881: Part 207 (75) requires a minimum centre-to-centre spacing of 150mm,and 75 mm edge distance.
The bolt is loaded at a standardized rate against a tripod reaction ring of 80mm diameter with three feet, each 5 mm wide and 25 mm long. If necessary,shims may be used to correct for minor bolt misalignments. After applying aninitial load to cause the sleeve to expand, the force required to produce failure byinternal fracture of the concrete is measured. This will be the peak load indicatedby the typical load/movement pattern in Figure 4.16. If the load is reduced oncethis peak has been reached there is likely to be no visible surface damage and ithas been suggested that the bolt can be sawn off. If load application continues, acone of concrete will be pulled from the surface, often intact, and considerablemaking good may be necessary. It has been found by the authors (97) that theload application method greatly influences the value of pull-out force required.The rate of load application affects not only the magnitude but also the variabilityof the results, and continuous methods yield more consistent results than if pausesare involved. Whatever loading method is adopted, it is essential that anycalibration curves which are used relate specifically to the procedures followed.The importance of this is illustrated by comparison of the curves for two specificmethods shown in Figure 4.20.
In the BRE loading method it is recommended that load is applied through anut on the greased bolt thread by means of a torquemeter, which is rotated onehalf turn in 10 seconds and released before reading, the procedure being repeateduntil a peak is passed. The tripod assembly (Figure 4.17) incorporates a ball raceand a facility for automatic alignment with the axis of the anchor bolt to ensurethat an axial load is applied with no bending effects. Early tests also required a
Figure 4.16 Typical loading curve.
Copyright 1996 Chapman & Hall
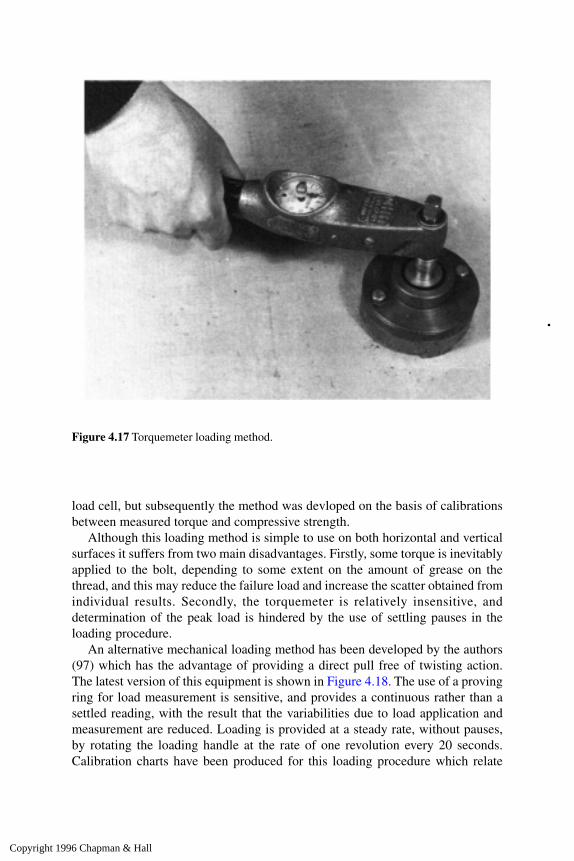
load cell, but subsequently the method was devloped on the basis of calibrationsbetween measured torque and compressive strength.
Although this loading method is simple to use on both horizontal and verticalsurfaces it suffers from two main disadvantages. Firstly, some torque is inevitablyapplied to the bolt, depending to some extent on the amount of grease on thethread, and this may reduce the failure load and increase the scatter obtained fromindividual results. Secondly, the torquemeter is relatively insensitive, anddetermination of the peak load is hindered by the use of settling pauses in theloading procedure.
An alternative mechanical loading method has been developed by the authors(97) which has the advantage of providing a direct pull free of twisting action.The latest version of this equipment is shown in Figure 4.18. The use of a provingring for load measurement is sensitive, and provides a continuous rather than asettled reading, with the result that the variabilities due to load application andmeasurement are reduced. Loading is provided at a steady rate, without pauses,by rotating the loading handle at the rate of one revolution every 20 seconds.Calibration charts have been produced for this loading procedure which relate
Figure 4.17 Torquemeter loading method.
Copyright 1996 Chapman & Hall

compressive strength to direct force, and the variability due to testing using thisapproach has been shown to be lower than for the BRE method.
The load transfer mechanisms in these methods are complex, due to theconcentrated localized actions of the expanding sleeve. The location of largeaggregate particles relative to the sleeve will further complicate matters and affectthe distribution of internal stresses. This is partially responsible for the high testvariability found for the internal fracture test. The basic test-assembly dimensionshave been determined largely from practical considerations of suitable magnitudeof force, and obtaining a depth of test generally to avoid surface carbonationeffects while minimizing likely reinforcement interference. As the name of themethod implies, failure is thought to be initiated by internal cracking. Attemptshave been made to represent this theoretically on the basis of an observed averagefailure depth of 17 mm which corresponds to a failure half angle of 78°. This isconsiderably greater than the likely angle of friction for the concrete of 37°, andapplication of the modified Coulomb failure criterion (as for the Lok-test, section4.2.1.1) indicates failure by a combination of sliding and separation. This confirms
Figure 4.18 Proving ring loading method.
Copyright 1996 Chapman & Hall
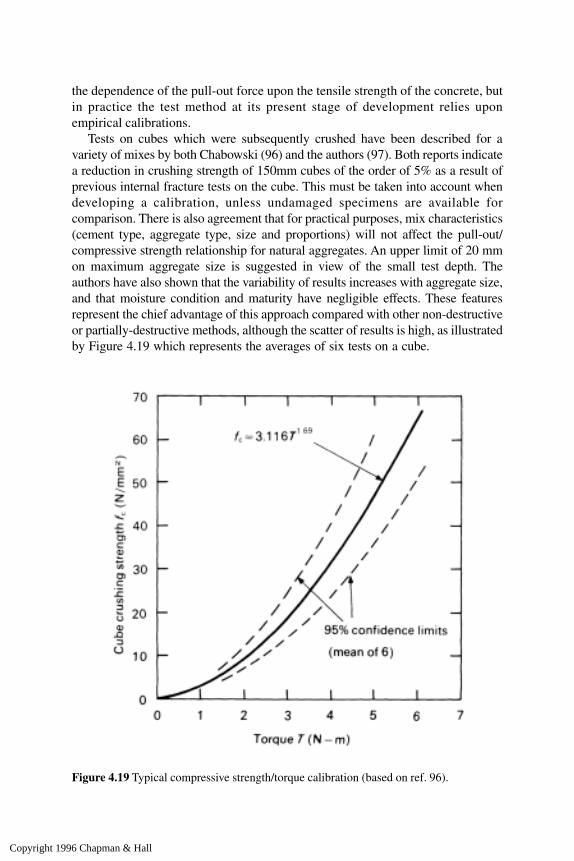
the dependence of the pull-out force upon the tensile strength of the concrete, butin practice the test method at its present stage of development relies uponempirical calibrations.
Tests on cubes which were subsequently crushed have been described for avariety of mixes by both Chabowski (96) and the authors (97). Both reports indicatea reduction in crushing strength of 150mm cubes of the order of 5% as a result ofprevious internal fracture tests on the cube. This must be taken into account whendeveloping a calibration, unless undamaged specimens are available forcomparison. There is also agreement that for practical purposes, mix characteristics(cement type, aggregate type, size and proportions) will not affect the pull-out/compressive strength relationship for natural aggregates. An upper limit of 20 mmon maximum aggregate size is suggested in view of the small test depth. Theauthors have also shown that the variability of results increases with aggregate size,and that moisture condition and maturity have negligible effects. These featuresrepresent the chief advantage of this approach compared with other non-destructiveor partially-destructive methods, although the scatter of results is high, as illustratedby Figure 4.19 which represents the averages of six tests on a cube.
Figure 4.19 Typical compressive strength/torque calibration (based on ref. 96).
Copyright 1996 Chapman & Hall

This means that a considerable number of specimens is required to produce acalibration curve.
The effects of precompression, as may be experienced in columns orprestressed construction, have also been examined by Chabowski (96) whoconcludes that there is no clearly defined influence. Although a trend towards anincrease in pull-out force with increasing lateral compression is indicated, it issuggested that (provided zones of low stress are selected) this effect can be ignoredin practice. The authors (97) have reported tests on beams in flexure whichdemonstrate a similar conclusion, although the variability of results appears toincrease with increasing lateral bending compressive stress. The presence of directlateral tensile stress will have a similar effect, and tests must not be made adjacentto visible cracks. Surface carbonation is another effect which both investigatorsconclude can be neglected in most circumstances. Only in very old concrete wherethe depth of carbonation approaches the depth of the test will this effect have anyinfluence. The shallowness of test also offers the advantage that reinforcement isunlikely to affect results, but BS 1881: Part 207 (75) requires that it must be atleast one bar diameter, or maximum aggregate size, outside the expected conicfracture surface.
The influence of the loading method has been indicated above. Results forthe torquemeter loading method are generally expressed in the form of acompressive strength/torque relationship, but an average force/torque ratio of1.15 is reported by Chabowski (96). Comparative tests by the authors (97)between the direct pull and torquemeter methods suggest a corresponding ratioof 1.4 which reflects the differences in loading technique. The averagerelationships for the techniques are compared in Figure 4.20. It must also bepointed out that a calibration obtained by the author using the torquemetersuggests compressive strengths up to 20% lower than the BRE calibration. Asimilar feature has also been indicated by Keiller (100) and Long (101), andcannot be ignored.
The variability of test results is high for a variety of reasons. These include thelocalized nature of the test, the imprecise load transfer mechanisms and variationsdue to drilling. 95% confidence limits on estimated strength of ±30% based onthe mean of six test results are accepted for the torquemeter load method (75),provided that individual results causing a coefficient of variation of greater than16% are discarded. The authors (97) have claimed a corresponding range of ±20%based on four results for 10mm aggregates using the direct pull equipment. Theaverage coefficients of variation observed for cubes of 20 mm maximumaggregate size were 16.5% for torque and 7.0% for direct force, with values 20%lower for 10mm aggregate.
The method can be applied to lightweight concretes (24) although difficultiesmay be encountered with very soft aggregate types. Typical correlations using thetorquemeter method are compared in Figure 4.21 from which the effects ofaggregate type can be clearly seen. The measured torque corresponding to a givencompressive strength is reduced in comparison to natural aggregates, but is also
Copyright 1996 Chapman & Hall

Figure 4.20 Comparison of calibration curves for natural aggregates (based on refs 96 and 97).
Figure 4.21 Comparison of calibration curves for lightweight aggregates (torquemeter method)(based on ref. 24).
Copyright 1996 Chapman & Hall
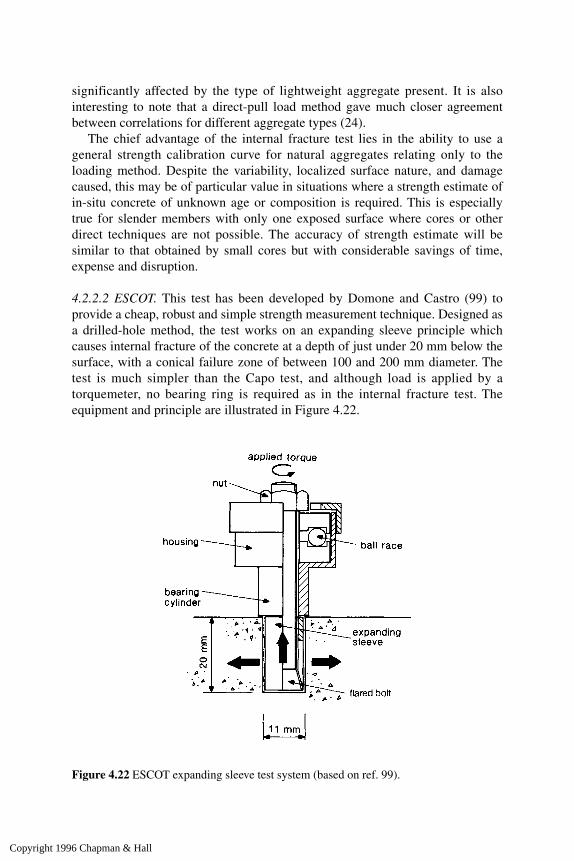
significantly affected by the type of lightweight aggregate present. It is alsointeresting to note that a direct-pull load method gave much closer agreementbetween correlations for different aggregate types (24).
The chief advantage of the internal fracture test lies in the ability to use ageneral strength calibration curve for natural aggregates relating only to theloading method. Despite the variability, localized surface nature, and damagecaused, this may be of particular value in situations where a strength estimate ofin-situ concrete of unknown age or composition is required. This is especiallytrue for slender members with only one exposed surface where cores or otherdirect techniques are not possible. The accuracy of strength estimate will besimilar to that obtained by small cores but with considerable savings of time,expense and disruption.
4.2.2.2 ESCOT. This test has been developed by Domone and Castro (99) toprovide a cheap, robust and simple strength measurement technique. Designed asa drilled-hole method, the test works on an expanding sleeve principle whichcauses internal fracture of the concrete at a depth of just under 20 mm below thesurface, with a conical failure zone of between 100 and 200 mm diameter. Thetest is much simpler than the Capo test, and although load is applied by atorquemeter, no bearing ring is required as in the internal fracture test. Theequipment and principle are illustrated in Figure 4.22.
Figure 4.22 ESCOT expanding sleeve test system (based on ref. 99).
Copyright 1996 Chapman & Hall

Tests to illustrate the effects of hole size (which should not exceed 0.2 mmoversize), depth and inclination (which should not exceed 10° fromperpendicular) are reported (99) as well as the effects of reinforcement withinthe failure zone. The test can also be used in a hole preformed by a steel dowelduring casting, but in this case measured values will be slightly reduced.Laboratory correlations with compressive strength are shown to be similar innature but better than for the BRE internal fracture test, and comparable inaccuracy to a modified ASTM pull-out approach described in section 4.2.1.2.On the basis of the average of four results, it is suggested that strength can beestimated to ±25% with no prior knowledge of the concrete other than aggregatesize and type. Increased accuracy is likely with calibration for a particularconcrete, and the possible benefits from combination with ultrasonic pulsevelocity readings are suggested.
Further investigation is clearly required before the test can be generallyaccepted, but it does appear to offer a simpler and more reliable alternative to theBRE internal fracture method when aggregate details are known.
4.2.2.3 The Capo test. This has been developed in Denmark (1) as an equivalentto the Lok-test for situations where use cannot be preplanned. The basic geometryof the Lok-test described in section 4.2.1.1 has been maintained, although thepull-out insert consists of an expanding ring inserted into an undercut groove.The name is based on the expression ‘cut and pull-out’, and the procedure consistsof drilling a 45 mm deep, 18 mm diameter hole, after which a 25 mm groove iscut at a depth of 25 mm using a portable milling machine illustrated in Figure4.23. The expanding ring insert is then placed and expanded in the groove, asshown in Figure 4.24, and conventional Lok-test pulling equipment can be usedas described previously. Testing must continue to pull out the plug of concrete,and the ring may be recovered, recompressed and re-used up to three or four times.
Extensive laboratory testing prgrammes (86) have shown that the behaviourof this test is effectively identical to the Lok-test and that the strengthcalibration and reliability may be regarded as the same. It is claimed that theentire testing operation, including drilling, may be completed in about tenminutes, and the equipment is available in the form of a comprehensive kit. InDenmark this method has been accepted as equivalent to the Lok-test and hasbeen used on a number of projects for in-situ strength determination in criticalzones (1). The potential areas of application are wide and although surfacezone effects must be considered, the approach appears to offer the mostreliable available indication of in-situ strength apart from cores. Althoughequipment costs are high, the damage, time and cost of testing will beconsiderably less than for cores. Problems may arise from the presence ofreinforcement within the test zone, and bars must be avoided, but the value ofthis test is considerable in situations where mix details are not known.
Copyright 1996 Chapman & Hall

4.2.2.4 Wood-screw method. A simple pull-out technique utilizing wood-screwshas been described by Jaegermann (102). This is intended for use to monitorstrength development in the 5–15 N/mm2 strength range for formwork strippingpurposes in industrialized buildings.
A nail is driven into the surface of the fresh concrete to push aside aggregateparticles, and the screw with a plastic stabilizing ring attached at the appropriateheight is inserted until the ring touches the concrete surface. The unthreaded upper
Figure 4.23 Capo test equipment.
Figure 4.24 Capo test configuration.
Copyright 1996 Chapman & Hall

part of of the screw is painted to prevent bonding and tests can be made at differentdepths by using screws of different lengths. Load is applied to the screw head bymeans of a proving ring or hydraulic jacking device. The principal assumption isthat the force required to pull the screw from the concrete is dominated by thefine mortar surrounding the screw threads, and laboratory trials suggest goodstrength correlations with reasonable repeatability but further development isneeded to facilitate field usage.
4.3 Pull-off methods
This approach has been developed to measure the in-situ tensile strength ofconcrete by applying a direct tensile force. The method may also be useful formeasuring bonding of surface repairs (103) and a wide selection of equipment iscommercially available (104) with disk diameters typically 50 mm or 75 mm.Procedures are covered by BS 1881: Part 207 and it should be noted that thefracture surface will be below the concrete surface and will thus leave somesurface damage that must be made good.
Pull-off tests have been described (101) which were developed initially in theearly 1970s for suspect high alumina concrete beams. A disk is glued to theconcrete surface with an epoxy resin and jacked off to measure the force necessaryto pull a piece of concrete away from the surface. The direct tension failure isillustrated in Figure 4.25, and if surface carbonation or skin effects are presentthese can be avoided by the use of partial coring to an appropriate depth. ‘Limpet’loading equipment with a 10 kN capacity is commercially available to apply atensile force through a rod screwed axially into a 50 mm diameter disk. This
Figure 4.25 Pull-off method—surface and partially cored.
Copyright 1996 Chapman & Hall

equipment (Figure 4.26) bears on the concrete surface adjacent to the test zoneand is operated manually by steady turning of the handle, with the load presenteddigitally. Another common type of loading system is by means of a tripodapparatus, with the load applied mechanically (as in Figure 4.27) or hydraulically.Despite wide variations in loading rates and reaction configurations betweendifferent systems the authors (105) have concluded that results are unlikely to beaffected provided there is adequate clearance between the disk and reaction points.Considerable care is needed in surface preparation of the concrete by sanding anddegreasing to ensure good bonding of the adhesive, which may need curing forbetween 1.5 and 24 hours according to material and circumstances. Difficultiesmay possibly be encountered with damp surfaces.
BS 1881: Part 207 requires that the mean of six valid tests should be used, andthat these should be centred at least two disk diameters apart. The stiffness of thedisk has been shown to be an important parameter and the limiting thickness/diameter ratio will depend upon the material used (105). This is illustrated inFigure 4.28 from which it can be seen that to ensure a uniform stress distribution,and hence maximum failure load, steel disk thickness must be 40% of the diameter
Figure 4.26 ‘Limpet’ equipment.
Copyright 1996 Chapman & Hall
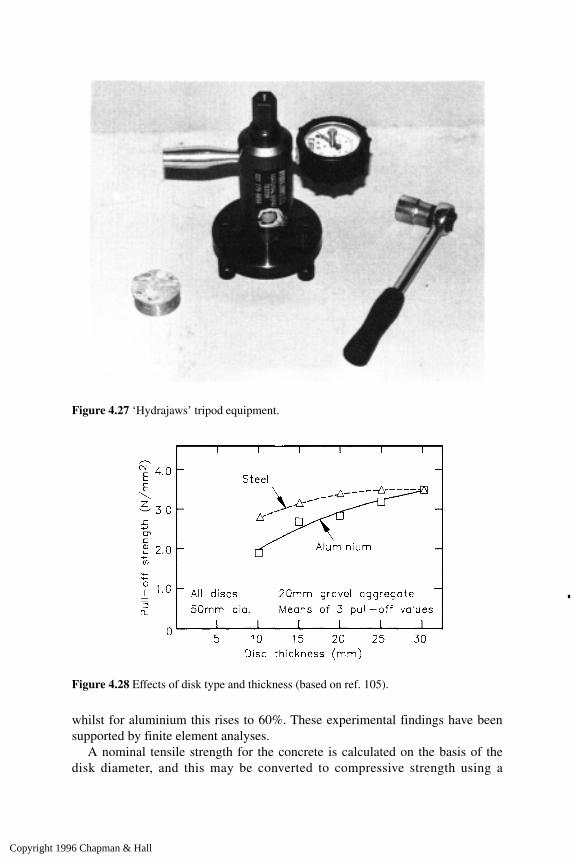
whilst for aluminium this rises to 60%. These experimental findings have beensupported by finite element analyses.
A nominal tensile strength for the concrete is calculated on the basis of thedisk diameter, and this may be converted to compressive strength using a
Figure 4.27 ‘Hydrajaws’ tripod equipment.
Figure 4.28 Effects of disk type and thickness (based on ref. 105).
Copyright 1996 Chapman & Hall

calibration chart appropriate to the concrete. This calibration will differ accordingto whether coring is used or not (100), with cored tests generally requiring a lowerpull-off force. Partial coring will transfer the failure surface lower into the bodyof the concrete, but the depth of coring may also be critical, as illustrated by Figure4.29, and should always exceed 20mm. Reinforcing steel clearly must be avoidedwhen partial coring is used. A test coefficient of variation of 7.9% with a range ofpredicted/actual strength between 0.85 and 1.25 related to 150mm Portlandcement cubes has been reported by Long and Murray (101) using the mean ofthree test results. A typical calibration curve is illustrated in Figure 4.30, and it isclaimed that factors such as age, aggregate type and size, air entrainment,compressive stress and curing have only marginal influences upon this. Extensivefield tests during the construction of a multistorey car park have also beensuccessfully undertaken (106).
BS 1881: Part 207 recommends that a strength correlation should beestablished for the concrete under investigation and that site results from onelocation are likely to yield a coefficient of variation of about 10%. Accuracies ofstrength predictions under laboratory conitions of about ±15% (95% confidencelimits) are likely. The authors (105) have also demonstrated that separatecorrelations are required for different types of lightweight aggregates, asillustrated in Figure 4.31, and that these are different to those for naturalaggregates due to different tensile/compressive strength relationships. It can benoted that pull-off values for lightweight aggregates are higher than for naturalaggregates at a given strength level.
This test is aimed primarily at unplanned in-situ strength determination. Themethod is particularly suitable for small-section members, and long-term
Figure 4.29 Effects of partial coring (based on ref. 105).
Copyright 1996 Chapman & Hall

monitoring procedures could also be developed involving proof load tests atintervals on a series of permanent probes. It is also particularly suited, with theuse of partial coring into the base material, for assessment of bonding strength ofrepairs as indicated above.
This is an area receiving considerable industrial interest and many repairspecifications now require pull-off testing as part of quality control procedures(107). In such cases it is usual to specify a minimum pull-off stress and it is thusvital that the test procedures are carefully specified or standardized if this is to bemeaningful.
Figure 4.30 Typical pull-off/strength correlation for natural aggregate (based on ref. 106).
Figure 4.31 Typical strength correlations for lightweight aggregates.
Copyright 1996 Chapman & Hall

4.4 Break-off methods
4.4.1 Norwegian methodJohansen (108) has reported the use of a break-off technique developed inNorway. This is intended primarily as a quality control test, and makes a directdetermination of flexural strength in a plane parallel and at a certain distance fromthe concrete surface. A tubular disposable form is inserted into the fresh concrete,or alternatively a shaped hole can be drilled, to form a slot of the type shown inFigure 4.32. The core left after the removal of the insert is broken off by atransverse force applied at the top surface as shown. This force is providedhydraulically using specially developed portable equipment available under thename ‘TNS-Tester’.
The ‘break-off strength calculated from the results has been shown to give alinear correlation with the modulus of rupture measured on prism specimens,although values were 30% higher on average. Christiansen et al. (109) have alsoexamined relationships between break-off values and bending tensile strengthsand have shown water/cement ratio, age, curing and cement type to be significant.Values obtained (108) for an airfield pavement contract have suggestedcoefficients of variation of 6.4% for laboratory samples and 12.6% in-situ.Comparable values have also been found on other construction sites (110). It is
Figure 4.32 Break-off method.
Copyright 1996 Chapman & Hall

suggested that the mean of five test results should be used in view of high within-test variation. BS 1881: Part 207 (75) requires a concrete element thickness of atleast 100 mm, with a minimum clear spacing or edge distance from the outer faceof the groove of four times the maximum aggregate size (50mm). Reinforcingbars must obviously be avoided and particular care is needed to ensure thatcompaction and curing at prepared test positions are representative of thesurrounding body of concrete.
It is claimed that the method is quick and uncomplicated, taking less thantwo minutes per test. Results are not significantly affected by the surfacecondition or local shrinkage and temperature effects. A correlation withcompressive strength has been developed which covers a wide range ofconcrete, but this is likely to be less reliable than a tensile strength correlationin view of the factors influencing the tensile/compressive strengthrelationship. Compressive strength estimates to within ±20% should bepossible with the aid of appropriate calibrations. The method is regarded asespecially suitable for very young concrete, and although leaving a sizeabledamage zone, may gain acceptance as an in-situ quality control test wheretensile strength is important. Although quicker than compression testing ofcores, the use of results for strength estimation of old concrete may beunreliable unless a specific calibration relationship is available. Fieldexperience in a variety of situations has been reported by Carlsson et al. (111).Naik (112) has also reviewed field experience and indicated that crushedaggregates may give strengths about 10% higher than those of roundedaggregates, and that drilled tests give results 9% higher than when a sleeve isinserted into the fresh concrete.
Dahl-Jorgensen and Johansen (110) also describe a modified version of thetest in which a steel cylinder is glued to the surface and jacked against a counter-support. This is intended for bond testing of concrete overlays or epoxy surfacecoatings, and lower test variability is claimed than with pull-off methods.
4.4.2 Stoll tork testThis proposed approach (113) is intended to improve upon the variabilityencountered with other methods and to permit tests at greater depths below thesurface than pull-out, pull-off or penetration resistance methods. A cylindricalcleated spindle of 18 mm height and 35 mm diameter (Figure 4.33) is removablyattached to a 19 mm torque bolt at least 51 mm in length and cast into the concreteat the required depth. A compressible tape is attached to the periphery except forthe radially extending symmetrically opposed cleat surfaces which bear directlyagainst the concrete mortar. A small grating prevents intrusion of large aggregateparticles into the mortar cusp which is fractured by application of torque to thebolt by a conventional torque wrench.
The maximum load is correlated to the compressive strength. The mortar cuspis subjected to a semi-confined compressive stress leading to a compressive/shear
Copyright 1996 Chapman & Hall
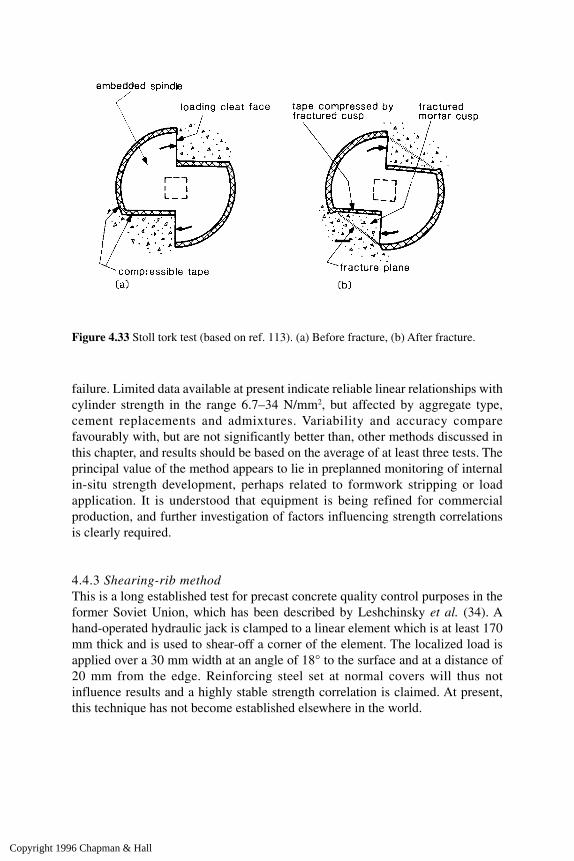
failure. Limited data available at present indicate reliable linear relationships withcylinder strength in the range 6.7–34 N/mm2, but affected by aggregate type,cement replacements and admixtures. Variability and accuracy comparefavourably with, but are not significantly better than, other methods discussed inthis chapter, and results should be based on the average of at least three tests. Theprincipal value of the method appears to lie in preplanned monitoring of internalin-situ strength development, perhaps related to formwork stripping or loadapplication. It is understood that equipment is being refined for commercialproduction, and further investigation of factors influencing strength correlationsis clearly required.
4.4.3 Shearing-rib methodThis is a long established test for precast concrete quality control purposes in theformer Soviet Union, which has been described by Leshchinsky et al. (34). Ahand-operated hydraulic jack is clamped to a linear element which is at least 170mm thick and is used to shear-off a corner of the element. The localized load isapplied over a 30 mm width at an angle of 18° to the surface and at a distance of20 mm from the edge. Reinforcing steel set at normal covers will thus notinfluence results and a highly stable strength correlation is claimed. At present,this technique has not become established elsewhere in the world.
Figure 4.33 Stoll tork test (based on ref. 113). (a) Before fracture, (b) After fracture.
Copyright 1996 Chapman & Hall

5 Cores
The examination and compression testing of cores cut from hardened concrete is awell-established method, enabling visual inspection of the interior regions of amember to be coupled with strength estimation. Other physical properties whichcan be measured include density, water absorption, indirect tensile strength andmovement characteristics including expansion due to alkali-aggregate reactions.Cores are also frequently used as samples for chemical analysis following strengthtesting. In most countries standards are available which recommend proceduresfor cutting, testing and intepretation of results; BS 1881: Part 120 (114) in theUK, whilst ASTM C42 (115) and ACI 318 (116) are used in the USA. Extremelyvaluable and detailed supplementary information and guidance is also given byConcrete Society Technical Report 11 (25) and its addendum.
5.1 General procedures for core cutting and testing
5.1.1 Core location and sizeCore location will be governed primarily by the basic purpose of the testing,bearing in mind the likely strength distributions within the member, discussed inChapter 1, related to the expected stress distributions. Where serviceabilityassessment is the principal aim, tests should normally be taken at points wherelikely minimum strength and maximum stress coincide, for example from the topsurface at near midspan for simple beams and slabs, or from any face near the topof lifts for columns or walls. If the member is slender, however, and core cuttingmay impair future performance, cores should be taken at the nearest non-criticallocations. Aesthetic considerations concerning the appearance after coring mayalso sometimes influence the choice of locations. Alternatively, areas of suspectconcrete may have been located by other methods.
If specification compliance determination is the principal aim, the cores shouldbe located to avoid unrepresentative concrete, and for columns, walls or deep beamswill normally be taken horizontally at least 300mm below the top of the lift. If it isnecessary to drill vertically downwards, as in slabs, the core must be sufficientlylong to pass through unrepresentative concrete which may occupy the top 20% ofthe thickness. In such cases drilling upwards from the soffit, if this is feasible, mayconsiderably reduce the extent of drilling, but the operation may be more difficult
Copyright 1996 Chapman & Hall

and may introduce additional uncertainties relating to the effects of possible tensilecracking. Reinforcement bars passing through a core will increase the uncertaintyof strength testing, and should be avoided wherever possible. The use of acovermeter to locate reinforcement prior to cutting is therefore recommended.
Where the core is to be used for compression testing, British and AmericanStandards require that the diameter is at least three times the nominal maximumaggregate size. BS 1881: Part 120 (114) further requires that a minimum diameterof 100 mm is used, with 150 mm preferred, although in Australia 75 mm isconsidered to be generally acceptable. In general, the accuracy decreases as theratio of aggregate size to core diameter increases and 100 mm diameter coresshould not be used if the maximum aggregate size exceeds 25 mm, and this shouldpreferably be less than 20 mm for 75 mm cores. In some circumstances smallerdiameters are used, especially in small-sized members where large holes wouldbe unacceptable, but the interpretation of results for small cores becomes morecomplex and is considered separately in section 5.3. The choice of core diameterwill also be influenced by the length of specimen which is possible. It is generallyaccepted that cores for compression testing should have a length/diameter ratio ofbetween 1.0 and 2.0, but opinions vary concerning the optimum value.
The Concrete Society (25) and BS 1881: Part 120 (114) suggest that coresshould be kept as short as possible (l/d=1.0→1.2) for reasons of drilling costs,damage, variability along length, and geometric influences on testing. Althoughthese points are valid, procedures for relating core strength to cylinder or cubestrength usually involve correction to an equivalent standard cylinder with l/d=2.0,and it can be argued that uncertainties of correction factors are minimized if thecore length/diameter ratio is close to 2.0 (117) (see section 5.2.2) and this view issupported by ASTM C42 (115).
The number of cores required will depend upon the reasons for testing thevolume of concrete involved. The likely accuracies of estimated strength arediscussed in section 5.2.3, but the numbers of cores must be sufficient to berepresentative of the concrete under examination as well as provide a strengthestimate of acceptable accuracy as discussed in Chapter 1. ACI 318 (116) requiresthat at least three cores are always used.
5.1.2 DrillingA core is usually cut by means of a rotary cutting tool with diamond bits, as shownin Figure 5.1. The equipment is portable, but it is heavy and must be firmlysupported and braced against the concrete to prevent relative movement whichwill result in a distorted or broken core, and a water supply is also necessary tolubricate the cutter. Vacuum assisted equipment can be used to obtain a firmattachment for the drilling rig without resorting to expansion bolts or cumbersomebracing. Uniformity of pressure is important, so it is essential that drilling isperformed by a skilled operator. Hand-held equipment is available for cores up to75 mm diameter. A cylindrical specimen is obtained, which may contain
Copyright 1996 Chapman & Hall

embedded reinforcement, and which will usually be removed by breaking off byinsertion of a cold chisel down the side of the core, once a sufficient depth hasbeen drilled. The core, which will have a rough inner end, may then be removedusing the drill or tongs, and the hole made good. This is best achieved either byramming a dry, low shrinkage concrete into the hole, or by wedging a cast cylinderof suitable size into the hole with cement grout or epoxy resin. It is important thateach core is examined at this stage, since if there is insufficient length for testing,or excessive reinforcement or voids, extra cores must be drilled from adjacentlocations. Each core must be clearly labelled for identification, with the drilledsurface shown, and cross-referenced to a simple sketch of the element drilled.Photographs of cores are valuable for future reference, especially as confirmation
Figure 5.1 Core cutting drill.
Copyright 1996 Chapman & Hall
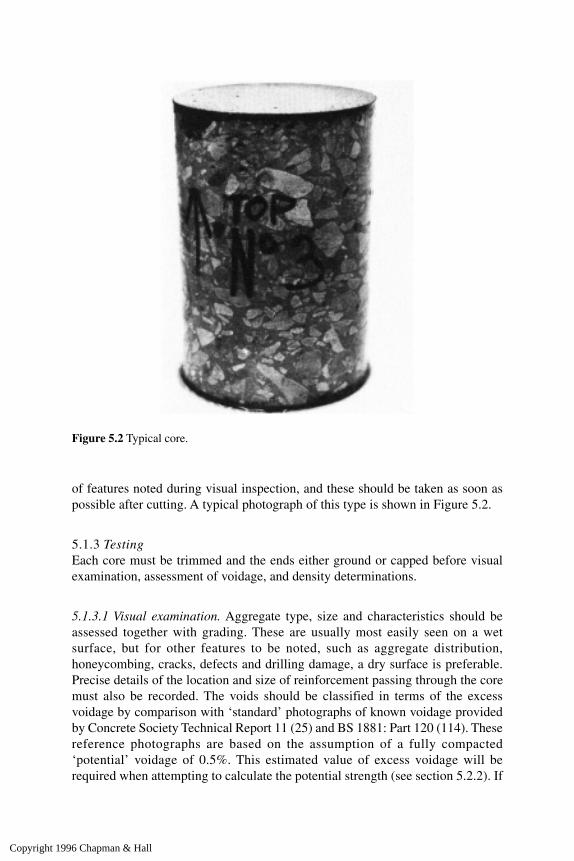
of features noted during visual inspection, and these should be taken as soon aspossible after cutting. A typical photograph of this type is shown in Figure 5.2.
5.1.3 TestingEach core must be trimmed and the ends either ground or capped before visualexamination, assessment of voidage, and density determinations.
5.1.3.1 Visual examination. Aggregate type, size and characteristics should beassessed together with grading. These are usually most easily seen on a wetsurface, but for other features to be noted, such as aggregate distribution,honeycombing, cracks, defects and drilling damage, a dry surface is preferable.Precise details of the location and size of reinforcement passing through the coremust also be recorded. The voids should be classified in terms of the excessvoidage by comparison with ‘standard’ photographs of known voidage providedby Concrete Society Technical Report 11 (25) and BS 1881: Part 120 (114). Thesereference photographs are based on the assumption of a fully compacted‘potential’ voidage of 0.5%. This estimated value of excess voidage will berequired when attempting to calculate the potential strength (see section 5.2.2). If
Figure 5.2 Typical core.
Copyright 1996 Chapman & Hall

a more detailed description of the voids is required, this should refer to small voids(0.5–3 mm), medium voids (3–6 mm), and large voids (>6 mm) with the term‘honeycombing’ being used if these are interconnected.
5.1.3.2 Trimming. Trimming, preferably with a masonry or water-lubricateddiamond saw, should give a core of a suitable length with parallel ends which arenormal to the axis of the core. If possible, reinforcement and unrepresentativeconcrete should be removed.
5.1.3.3 Capping. Unless their ends are prepared by grinding, cores should becapped with high alumina cement mortar or sulphur-sand mixture to provideparallel end surfaces normal to the axis of the core. (Other materials should not beused as they have been shown to give unreliable results.) Caps should be kept asthin as possible, but if the core is hand trimmed they may be up to about themaximum aggregate size at the thickest points.
5.1.3.4 Density determination. This is recommended in all cases, and is bestmeasured by the following procedure (25):
(i) Measure volume (Vu) of trimmed core by water displacement
(ii) Establish density of capping materials (Dc)
(iii) Before compressive testing, weigh soaked/surface-dry capped core in airand water to determine gross weight W
t and volume V
t
(iv) If reinforcement is present this should be removed from the concrete aftercompression testing, and the weight W
s and volume V
s determined
(v) Calculate saturated density of concrete in the uncapped core from Ifno steel is present, W
s and V
s are both zero.
The value thus obtained may be used, if required, to assess the excess voidage ofthe concrete using the relationship
estimated excess voidage
where Dp=the potential density based on available values for 28-days-old cubes
of the same mix.
5.1.3.5 Compression testing. The standard procedure in the United Kingdom is totest cores in a saturated condition, although in the USA (116) dry testing is used if
Copyright 1996 Chapman & Hall
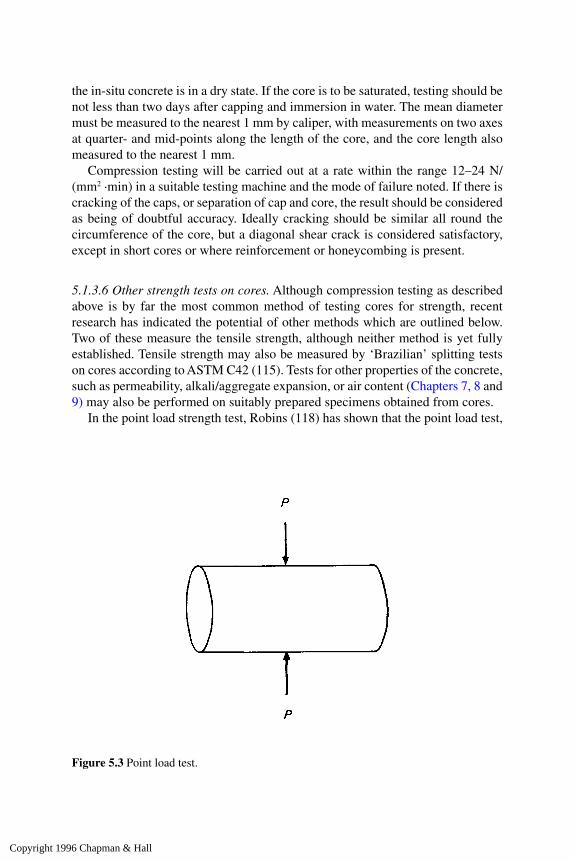
the in-situ concrete is in a dry state. If the core is to be saturated, testing should benot less than two days after capping and immersion in water. The mean diametermust be measured to the nearest 1 mm by caliper, with measurements on two axesat quarter- and mid-points along the length of the core, and the core length alsomeasured to the nearest 1 mm.
Compression testing will be carried out at a rate within the range 12–24 N/(mm2 ·min) in a suitable testing machine and the mode of failure noted. If there iscracking of the caps, or separation of cap and core, the result should be consideredas being of doubtful accuracy. Ideally cracking should be similar all round thecircumference of the core, but a diagonal shear crack is considered satisfactory,except in short cores or where reinforcement or honeycombing is present.
5.1.3.6 Other strength tests on cores. Although compression testing as describedabove is by far the most common method of testing cores for strength, recentresearch has indicated the potential of other methods which are outlined below.Two of these measure the tensile strength, although neither method is yet fullyestablished. Tensile strength may also be measured by ‘Brazilian’ splitting testson cores according to ASTM C42 (115). Tests for other properties of the concrete,such as permeability, alkali/aggregate expansion, or air content (Chapters 7, 8 and9) may also be performed on suitably prepared specimens obtained from cores.
In the point load strength test, Robins (118) has shown that the point load test,
Figure 5.3 Point load test.
Copyright 1996 Chapman & Hall

which is an accepted method of rock strength classification, may usefully beapplied to concrete cores. A compressive load is applied across the diameter(Figure 5.3) by means of a manually operated hydraulic jack, with the specimenheld between spherically truncated conical platens with a point of 5 mm radius. Ithas been found that the point load strength index is indirectly related to theconcrete compressive strength, although core size and aggregate type affect therelationship. For a given aggregate and core size, the index varies linearly withcube strength for strengths greater than 20 N/mm2. Robins (118) also claims thatthe testing variability is comparable to that expected for conventional core testing.The advantages of this approach are that trimming and capping are not requiredand that the testing forces are lower, thus permitting the use of small portableequipment on site at a reduced unit cost.
The point load test is essentially a tensile test, and Robins (119) has alsoconfirmed that a simple linear relationship exists between point load index andflexural strength. This test may thus be particularly useful for sprayed and fibrousconcretes (120).
In the gas pressure tension test, Clay ton (121) has demonstrated that appliedgas pressure may be used on cylinders to simulate the effects of uniaxial tensiletests, and that cores may also be used for this purpose. The specimen is insertedinto a cylindrical steel jacket with seals at each end, and gas pressure is applied tothe bare curved surface. Nitrogen has been found to be safe and convenient. Theflow is controlled by a single-stage regulator, and a pressure gauge is used formeasurement. Pressure is increased manually at a specified rate, until failureoccurs by the formation of a single cleavage plane transverse to the axis of thespecimen. The two sections are forced violently apart and safety precautions arenecessary to prevent ejection of the fragments from the testing jacket.
The method has been developed using 100-mm cylinders, but has beensuccessfully applied to 75-mm cores of high alumina cement concrete which insome cases had length/diameter ratios of less than 1.0. Although preliminaryevidence suggests that this may provide a reliable method of determining in-situtensile strength, further research is necessary before results can be regarded withconfidence.
A third type of ‘strength’ test on cores which has been developed by Chrisp etal. (122) utilizes low strain rate compressive load cycling on 72 mm diametercores with a length/diameter ratio of 2.5 to quantify damage in cases wheredeterioration has occurred. Strain data are recorded using a sensitive‘compressometer’, and processed automatically on a microcomputer to yieldhysteresis and stiffness characteristics. These can be used to establish a series ofparameters of damage caused by deterioration, and cores are not significantlyfurther damaged by the test, thus allowing them to be subjected to further testing.Good results have been achieved with this ‘stiffness damage’ test applied toconcrete affected by alkali-aggregate reactions and the approach is likely to beextended to other damage mechanisms.
Copyright 1996 Chapman & Hall
5.2 Interpretation of results
5.2.1 Factors influencing measured core compressive strengthThese may be divided into two basic categories according to whether they arerelated to concrete characteristics or testing variables.
5.2.1.1 Concrete characteristics. The moisture condition of the core will influencethe measured strength—a saturated specimen has a value 10–15% lower than acomparable dry specimen. It is thus very important that the relative moistureconditions of core and in-situ concrete are taken into account in determining actualin-situ concrete strengths. If the core is tested while saturated, comparison withstandard control specimens which are also tested saturated will be morestraightforward but there is evidence (123) that moisture gradients within a corespecimen will also tend to influence measured strength. This introduces additionaluncertainties when procedures involving only a few days of either soaking or airdrying are used since the effects of this conditioning are likely to penetrate only asmall distance below the surface.
The curing regime, and hence strength development, of a core and of the parentconcrete will be different from the time of cutting. This effect is very difficult toassess, and in mature concrete may be ignored, but for concrete of less than 28days should be considered.
Voids in the core will reduce the measured strength, and this effect can beallowed for by measurement of the excess voidage when comparing core resultswith standard control specimens from the point of view of material specificationcompliance. Figure 5.4, based on reference (25), shows the influence of this effect.Under normal circumstances an excess voidage of less than 2.5% would beexpected.
5.2.1.2 Testing variables. These are numerous, and in many cases will have asignificant influence upon measured strength. The most significant factors areoutlined below.
(i) Length/diameter ratio of core. As the ratio increases, the measured strengthwill decrease due to the effect of specimen shape on stress distributions whilstunder test. Since the standard cylinder used in many parts of the world has alength/diameter ratio of 2.0, this is normally regarded as the datum forcomputation of results, and the relationship between this and a standard cube isestablished. Monday and Dhir (117) have indicated the influence of strength onlength/diameter effects and this is confirmed by Bartlett and MacGregor (124)who also indicate the influence of moisture conditions. It is claimed that correctionfactors to an equivalent length/diameter ratio of 2.0 will move towards 1.0 forsoaked cores and as concrete strength increases. The authors have also
Copyright 1996 Chapman & Hall

demonstrated the influence of aggregate type when lightweight aggregates arepresent (24). This issue is widel yrecognized to be subject to many uncertainties,but the average values shown in Figure 5.5, based on the Concrete Societyrecommendations (25), have been adopted by BS 1881. These differ from ASTM(115) suggestions which recognize but do not allow for, strength effects and arealso limited to cylinder strengths in the range 13–41 N/mm2.
(ii) Diameter of core. The diameter of core may influence the measuredstrength and variability (see section 5.1.1). Measured concrete strength willgenerally decrease as the specimen size increases; for sizes above 100mm thiseffect will be small, but for smaller sizes this effect may become significant. Asthe diameter decreases, the ratio of cut surface area to volume increases, and hencethe possibility of strength reduction due to cutting damage will increase. It isgenerally accepted that a minimum diameter/maximum aggregate size ratio of 3is required to make test variability acceptable.
(iii) Direction of drilling. As a result of layering effects, the measured strengthof a specimen drilled vertically relative to the direction of casting is likely to begreater than that for a horizontally drilled specimen from the same concrete.Published data on this effect are variable, but an average difference of 8% issuggested (25) although there is evidence that this effect is not found withlightweight aggregate concretes (24). Whereas standard cylinders are testedvertically, cubes will normally be tested at right angles to the plane of casting andhence can be related directly to horizontally drilled cores.
Figure 5.4 Excess voidage corrections (based on ref. 25).
Copyright 1996 Chapman & Hall
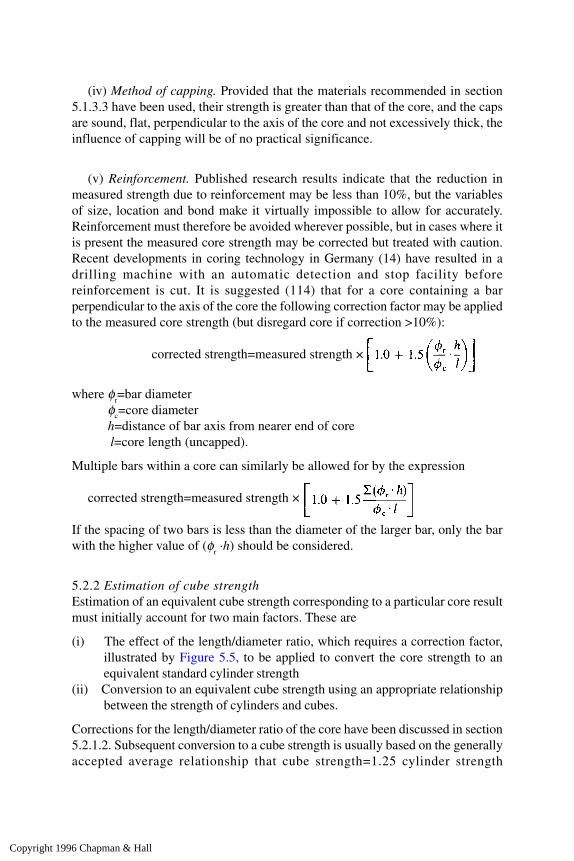
(iv) Method of capping. Provided that the materials recommended in section5.1.3.3 have been used, their strength is greater than that of the core, and the capsare sound, flat, perpendicular to the axis of the core and not excessively thick, theinfluence of capping will be of no practical significance.
(v) Reinforcement. Published research results indicate that the reduction inmeasured strength due to reinforcement may be less than 10%, but the variablesof size, location and bond make it virtually impossible to allow for accurately.Reinforcement must therefore be avoided wherever possible, but in cases where itis present the measured core strength may be corrected but treated with caution.Recent developments in coring technology in Germany (14) have resulted in adrilling machine with an automatic detection and stop facility beforereinforcement is cut. It is suggested (114) that for a core containing a barperpendicular to the axis of the core the following correction factor may be appliedto the measured core strength (but disregard core if correction >10%):
corrected strength=measured strength ×
where φr=bar diameter
φc=core diameterh=distance of bar axis from nearer end of corel=core length (uncapped).
Multiple bars within a core can similarly be allowed for by the expression
corrected strength=measured strength ×
If the spacing of two bars is less than the diameter of the larger bar, only the barwith the higher value of (φ
r ·h) should be considered.
5.2.2 Estimation of cube strengthEstimation of an equivalent cube strength corresponding to a particular core resultmust initially account for two main factors. These are
(i) The effect of the length/diameter ratio, which requires a correction factor,illustrated by Figure 5.5, to be applied to convert the core strength to anequivalent standard cylinder strength
(ii) Conversion to an equivalent cube strength using an appropriate relationshipbetween the strength of cylinders and cubes.
Corrections for the length/diameter ratio of the core have been discussed in section5.2.1.2. Subsequent conversion to a cube strength is usually based on the generallyaccepted average relationship that cube strength=1.25 cylinder strength
Copyright 1996 Chapman & Hall

(for l/d=2.0). Monday and Dhir (117) have shown that this relationship is asimplification, and that a more reliable conversion can be obtained from
cube strength=Afcy-Bf 2cy
where fcy is the strength of a core with l/d=2.0, and constants A=1.5 and B=0.007tentatively.
Within the range of 20–50 N/mm2 cylinder strengths this produces valueswithin 10% of those given by the average factor 1.25, but the discrepanciesincrease for lower- and higher-strength concrete. Such discrepancies will,however, be partially offset for cores with l/d close to 1.0 by the errors resultingfrom the use of (l/d) ratio correction factors which are not strength-related.Particular care will be needed to take account of this issue when dealing withcores of high-strength concrete, which is increasingly being used worldwide.
The Concrete Society (25) recommends a procedure incorporating thecorrection factors of Figure 5.5, coupled with an allowance of 6% strengthdifferential between a core with a cut surface relative to a cast cylinder. A strengthreduction of 15% is also incorporated to allow for the weaker top surface zone ofa corresponding cast cylinder, before conversion to an equivalent cube strengthby the multiplication factor of 1.25. An 8% difference between vertical andhorizontally drilled cores is also incorporated with the resulting expressions (asadopted by BS 1881) emerging.
Horizontally drilled core:
estimated in-situ cube strength=
Figure 5.5 Length/diameter ratio influence (based on refs 25, 114 and 115).
Copyright 1996 Chapman & Hall

Vertically drilled core:
estimated in-situ cube strength=
where fλ is the measured strength of a core with length/diameter=λ.
It is interesting to note that, using these expressions, the strength of a horizontallydrilled core of length/diameter (λ)=1 will be the same as the estimated cubestrength. The cube strengths evaluated in this way will be estimates of the actualin-situ strength of the concrete in a wet condition and may underestimate thestrength of the dry concrete by 10–15%.
The strength differences between in-situ concrete and standard specimens havebeen fully discussed in Chapter 1. An average recommended relationship is thatthe ‘potential’ strength of a standard specimen made from a particular mix is about30% higher than the actual ‘fully compacted’ in-situ strength (25). If this value isused to estimate a potential strength for comparison with specifications, theuncertainty of the relationship must be remembered. Appendix 3 of the ConcreteSociety Report offers detailed guidance relating to curing history, but potentialstrength estimations are increasingly unpopular due to the difficulties ofaccounting for all variable factors.
The expressions for cube strength will change as follows:
Horizontally drilled core:
estimated potential cube strength=
Vertically drilled core:
estimated potential cube strength=
A worked example of evaluation of core results using the Concrete Societyrecommendations is given in Appendix C of this book.
ACI 318 (116) suggests that an average in-situ strength of at least 85% theminimum specified value is adequate, and that cores may be tested after air-dryingfor 7 days if the structure is to be dry. This is based on equivalent cylinderstrengths derived from ASTM C42 (115) factors.
The effect of the calculation method can be considerable, as illustrated inFigure 5.6, and this emphasizes the importance of agreement between all partiesof the method to be used in advance of the testing.
5.2.3 Reliability, limitations and applicationsThe likely coefficient of variation due to testing is about 6% for carefully cut andtested cores, which can be compared with a corresponding value of 3% for cubes.
Copyright 1996 Chapman & Hall
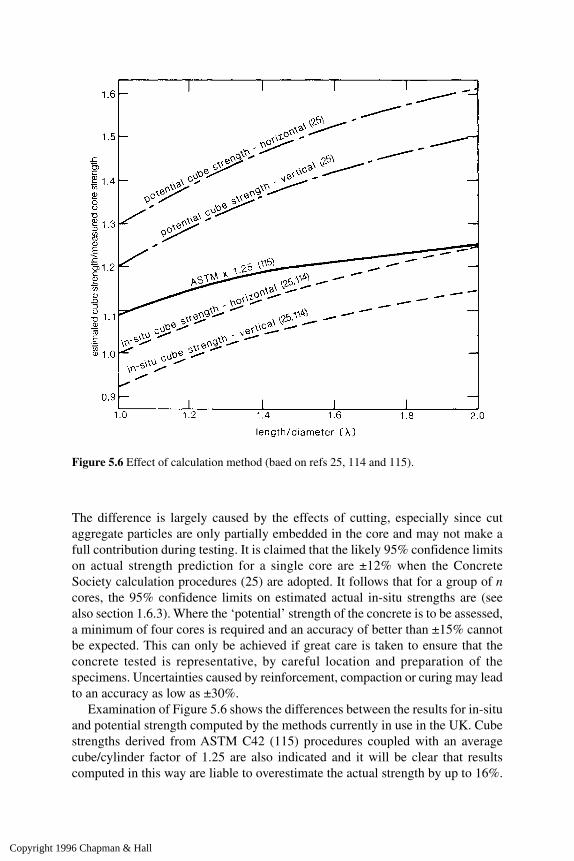
The difference is largely caused by the effects of cutting, especially since cutaggregate particles are only partially embedded in the core and may not make afull contribution during testing. It is claimed that the likely 95% confidence limitson actual strength prediction for a single core are ±12% when the ConcreteSociety calculation procedures (25) are adopted. It follows that for a group of ncores, the 95% confidence limits on estimated actual in-situ strengths are (seealso section 1.6.3). Where the ‘potential’ strength of the concrete is to be assessed,a minimum of four cores is required and an accuracy of better than ±15% cannotbe expected. This can only be achieved if great care is taken to ensure that theconcrete tested is representative, by careful location and preparation of thespecimens. Uncertainties caused by reinforcement, compaction or curing may leadto an accuracy as low as ±30%.
Examination of Figure 5.6 shows the differences between the results for in-situand potential strength computed by the methods currently in use in the UK. Cubestrengths derived from ASTM C42 (115) procedures coupled with an averagecube/cylinder factor of 1.25 are also indicated and it will be clear that resultscomputed in this way are liable to overestimate the actual strength by up to 16%.
Figure 5.6 Effect of calculation method (baed on refs 25, 114 and 115).
Copyright 1996 Chapman & Hall

The Concrete Society method makes detailed allowance for the many variablefactors influencing core results, and will provide the more reliable estimates ofequivalent cube strengths.
Damage caused by drilling may be particularly significant for old brittleconcretes, where internal cracking of the core may be aggravated by the loss ofthe confining effect of the surrounding body of concrete. Difficulties associatedwith core testing of concrete which has been damaged by alkali-aggregatereactions have similarly been identified (125). Tests on cores from flexurallycracked tensile zones must be regarded as unreliable, whilst Yip (126) hasdemonstrated that compressive load history of the concrete before coring maylead to reductions in measured strength of up to 30% due to internalmicrocracking. This latter effect may be quite significant even at relatively lowstress levels and adds to interpretation uncertainties. The estimated cube strengthsobtained from core compression tests may tend to underestimate the true in-situcapacity in all these situations. Strength changes with age may also be consideredwhen interpreting core results, but any allowances must be carefully consideredas discussed in section 1.5.2.
The principal limitations of core testing are those of cost, inconvenience anddamage, and the localized nature of the results. It is strongly recommended thatcore testing is used in conjunction with some other form of testing which is lesstedious and less destructive. The aim is to provide data on relative strengths withinthe body of the concrete under test. The size of core needed for reliable strengthtesting can pose a serious practical problem; ‘small’ cores may be worthy ofconsideration with slender members. It may also be appropriate to consider usinga larger number of ‘small’-diameter cores to obtain an improved spread of testlocations where large volumes of concrete are involved. The cutting effort forthree 50-mm cores may be as low as one-third of that for one 150 mm specimen.A comparable overall strength accuracy may be expected (see section 5.3.2)provided that maximum aggregate size is less than 17 mm. Where cores are usedfor other purposes, it will often be possible to use a ‘small’ diameter withconsiderable savings of cost, inconvenience and damage.
Apart from physical testing, cores often provide the simplest method ofobtaining a sample of the in-situ concrete for a variety of purposes, but care mustbe taken that the effects of drilling, including heat generated by friction, or thepresence of water, do not distort the subsequent results. A sample taken from thecentre of a core may conveniently overcome this problem. Chemical analysis canoften be performed on the remains of a crushed core, or specimens may be takenspecifically for that purpose. Visual inspection of the interior of the concrete maybe extremely valuable both for the assessment of compaction and workmanship,and for obtaining basic data about concrete for which no records are available. Incases where structural assessments of old structures are required, cores may alsoprove valuable in confirming covermeter results concerning the location and sizeof reinforcement.
Copyright 1996 Chapman & Hall

5.3 Small cores
Although standards normally require cores to have a minimum diameter of 100mm for compressive strength testing, cores of smaller diameter offer considerableadvantages in terms of reduced cutting effort, time and damage. For applicationssuch as visual inspection, density, or voidage determination, reinforcementlocation or chemical testing, these savings may be valuable. However, thereliability of small diameter cores for compression testing is lower than for‘normal’ specimens. The many factors which affect normal core results may alsobe expected to influence small cores, but the extent of these factors may vary andother effects which are normally unimportant may become significant.
5.3.1 Influence of specimen sizeIt is well-established that measured concrete strength usually increases as the sizeof the test specimen decreases, and that results tend to be more variable. Thislatter effect has been shown to be particularly true for core specimens since theratio of cut surface area to volume increases as diameter decreases and hence thepotential influence of drilling damage is increased. Also, the ratio of aggregatesize to core diameter is increased and may possibly exceed the generallyrecognized acceptable limit of 1:3. It is also well established that concrete strengthis a further factor that may influence the behaviour of a core. These various factorsare inter-related and difficult to isolate. For example, increased strength due tosmall specimen size may be offset by a reduction due to cutting effects.
The most common diameter for small cores is 40–50 mm. The authors havereported extensive laboratory tests to investigate the behaviour of 44 mm specimens(127), in which a total of 23 mixes were used, ranging from 10 to 82 N/mm2 with 10and 20 mm gravel aggregates, and cores were cut from 500×100×100 mmlaboratory cast prism specimens to provide a range of length/diameter ratios.
5.3.1.1 Length/diameter ratio. The average relationship for length/diametereffects on 44 mm cores (127) is shown in Figure 5.7 which compares therelationships discussed in section 5.2.1.2 for normal cores. This relationship wasfound to be independent of drilling orientation, aggregate size and cement type,for practical purposes, although the scatter of results is high since each point inFigure 5.7 represents the average of four similar cores. It will be seen that thecorrection factor for length/diameter ratio is reasonably close to the ConcreteSociety recommendation (25) for larger cores. Lightweight concretes are likely tohave values closer to 1.0 (24).
5.3.1.2 Variability of results. No significant change of variability was foundbetween the extremes of length/diameter ratio for either aggregate size, and theaverage coefficient of variation of 8% was also independent of orientation.However, taking account of concrete variability as indicated by control cubes, it
Copyright 1996 Chapman & Hall

is clear that 20 mm aggregate cores show a higher variability due to cutting andtesting than 10 mm aggregates (127). The range of coefficients of variation ofstrength for groups of similar cores was large, and made identification of theeffects of other variables impossible to assess. Bowman (128) has reported acoefficient of variation of 28.9% for 50 mm cores from in-situ concrete on a sitein Hong Kong compared with a value of 19.5% for corresponding 150mm coresfrom the same concrete. Swamy and Al-Hamed have also suggested thatvariability reduces as strength increases (129), whilst lightweight aggregateconcretes may also be less variable (24).
5.3.1.3 Measured strength. Based on the authors’ tests (127) the factors requiredto convert the measured core strength (after correction to λ=2.0) to an equivalent100mm cube strength are given in Table 5.1. If an equivalent 150mm cube strengthis required, these values may be reduced by 4%.
It can be seen that for 10-mm aggregates, the vertically drilled cores areapproximately 8% stronger than comparable horizontally drilled specimensrelative to cubes. This is as anticipated for larger specimens, but the measuredstrengths are approximately 10% stronger than expected from the ConcreteSociety recommendations (25), resulting in a lower correction factor to obtain anequivalent cube strength.
Figure 5.7 Length/diameter ratio for small cores (based on refs 25, 115 and 127).
Copyright 1996 Chapman & Hall

With 20 mm maximum aggregate, however, the cores were considerably
weaker relative to cubes, confirming the influence of the aggregate size/corediameter ratio discussed above. In this case the orientation effect could not bedetected. It is suggested that 10-mm and 20-mm aggregate concrete should betreated separately when converting 44-mm cores to equivalent cube strength. Ifthis is done, the 95% confidence limits on the average of the results of groups offour cores of this size under laboratory conditions are unlikely to be better thanthe values given in Table 5.1. These may be approximated by when n is the numberof cores in the group. Bowman’s reported results (128) also show a 7% higherstrength for 50mm cores when compared with 150 mm cores, but the aggregatesize is not indicated. The Concrete Society (25), however suggests that strengthdifferences between ‘large’ and ‘small’ cores are negligible and recommend theuse of the formulae in section 5.2.2 for cores of 50 mm diameter and greater.
5.3.2 Reliability, limitations and applicationsThe reliability of compressive tests on small diameter cores is known to be less thanfor ‘normal’ specimens, and the authors have suggested a factor of 3 applied to the95% confidence limits of predicted actual cube strengths under laboratoryconditions. This gives a value of for n cores with an aggregate size/diameter ratio ofless than 1:3. But if the ratio of aggregate size/diameter is greater than 1:3, thisaccuracy is likely to decrease and may be as low as Site cutting difficulties may
Table 5.1 Cube/corrected core conversion factors for 44mm cores with λ=2.0 (ref. 127)
Copyright 1996 Chapman & Hall
further reduce accuracy. All the procedures described in section 5.1 concerninglocation, drilling and testing must be followed, just as for larger cores, and the effectsof excess voidage and moisture accounted for as described in section 5.2. Smallcores containing reinforcement should not be tested. Particular care must be takento ensure that the core is representative of the mass of the concrete, and this isparticularly critical in slabs drilled from the top surface in view of the reduceddrilling depth required for a small core. BS 1881: Part 120 (114) does not refer toparticular concrete densities, but ASTM C42 (115) specifically includes lightweightconcrete in the range 1600 to 1920 kg/m3, as well as normal-weight concrete.
There is no doubt that for applications other than compressive strength testing,small cores offer many economical and practical advantages compared with largerspecimens. These applications include visual examination (including materialsand mix details, compaction, reinforcement location and sizing); densitydetermination; other physical tests, including point load or gas pressure tests; andchemical testing. For compressive strength testing, the chief limitation isvariability of results and consequent lack of accuracy of strength prediction, unlessmany more specimens are taken than would normally be necessary. At least threetimes the number of ‘standard’ cores is required to give comparable accuracy, butit can be argued that this would still require less drilling in many instances andpermits a wider spread of sample location. It is clear that considerable differencesof predicted cube strength will arise from use of the various calculation methods,and as for larger cores it is essential that agreement is reached between all parties,before testing, about the method to be used.
Bowman (128) has described a successful approach in which 50-mm coreswere used for strength tests on cast in-place piles because of their cheapness andease of cutting, but were backed up by 150-mm cores where results were on theborderline of the specification. Another common situation in which small coresmay be necessary for strength testing is when the slenderness of the member doesnot permit a larger diameter from the point of view of continued serviceability oradequate length/diameter ratio (>1.0). This will apply especially to prestressedconcrete members. Although in such cases small diameters are inevitable it isessential that the engineer fully appreciates the limitations of accuracy that hemay expect. It may be that some other non-destructive approach will yieldcomparable accuracies of strength prediction, according to the availability ofcalibrations, with less expense, time and damage.
Copyright 1996 Chapman & Hall
6 Load testing and monitoring
Where member strength cannot be adequately determined from the results of in-situ materials tests, load testing may be necessary. The expense and disruption ofthis operation may be offset by the psychological benefits of a positivedemonstration of structural capacity which may be more convincing to clientsthan detailed calculations. In most cases where load tests are used, the mainpurpose will be proof of structural adequacy, and so tests will be concentrated onsuspect or critical locations. Static tests are most common but where variableloading dominates, dynamic testing may be necessary.
Load testing may be divided into two main categories:
(i) In-situ testing, generally non-destructive(ii) Tests on members removed from a structure, which will generally be
destructive.
The choice of method will depend on circumstances, but members will normallyonly be removed from a structure if in-situ testing is impracticable, or if ademonstration of ultimate strength rather than serviceability is required. Ultimatestrength capacity may sometimes be used as a calibration for other forms of testingif large numbers of similar members are in question.
Monitoring of structural behaviour under service conditions is an important aspectof testing which has received increased attention in recent years due to the growingnumber of older structures which are causing concern as a result of deterioration. Thisis considered in section 6.2 and many of the measurement techniques used for in-situload testing and monitoring may also be useful for ultimate load test monitoring. Thereis also a growing trend towards monitoring the performance of older structures suchas bridges during demolition to increase understanding of structural behaviour andthe effects of deterioration (130, 131). Strain measurement techniques are describedin section 6.3, and more specialized methods such as dynamic response and acousticemission are included in Chapter 8.
6.1 In-situ load testing
The principal aim will generally be to demonstrate satisfactory performanceunder an overload above the design working value. This is usually judged bymeasurement of deflections under this load, which may be sustained for aspecified period. The need may arise from doubts about the quality of
Copyright 1996 Chapman & Hall

construction or design, or where some damage has occurred, and the approach isparticularly valuable where public confidence is involved. In Switzerland, staticload tests on bridges are an established component of acceptance criteria anduseful information concerning testing and deflection measurement procedureshas been given by Ladner (132, 133). In other circumstances the test may beintended to establish the behaviour of a structure whose analysis is impossiblefor a variety of reasons. In this case strain measurements will also be necessaryto establish load paths in complex structures. Views on detailed test proceduresand requirements vary widely, but some commonly adopted methods aredescribed in the following sections, together with suitable loading andmonitoring techniques. Further guidance on general principles and basicprocedures is provided by the Institution of Structural Engineers (5), whilstsimple guidelines for static load tests on building structures have been given byMoss and Currie (134). Jones and Oliver (135) have also discussed somepractical aspects of load testing, and Garas et al. (136) describe a number ofmore complex investigations. The philosophy of instrumentation of structureshas also been considered by Menzies et al. (137). Practical difficulties of accessand restraint will influence the preparatory work required, but in allcircumstances it is essential to provide adequate safety measures to cater for thepossible collapse of the member under test. The test loads will normally beapplied twice, with the first cycle used for ‘bedding-in’ purposes.
6.1.1 Testing proceduresIn-situ load tests should not be performed before the concrete is 28 days old unlessthere is evidence that the characteristic strength has been reached. ACI 318 (116)requires a minimum age of 56 days. Preliminary work is always necessary andmust ensure safety in the event of a collapse under test, and that the full calculatedload is carried by the members actually under test.
The selection of specific members or portions of a structure to be tested willdepend upon general features of convenience, as well as the relative importanceof strength and expected load effects at various locations. Attention must also begiven to the parts of the structure supporting the test member. Selection ofmembers may often be assisted by non-destructive methods coupled with visualinspection to locate the weakest zones or elements. Dynamic response approachesdescribed in Chapter 8 may be useful in this respect.
6.1.1.1 Preliminary work. Scaffolding must be provided to support at least twicethe total load from any members liable to collapse together with the test load.This should be set to ‘catch’ falling members after a minimum drop, but at thesame time should not interfere with expected deflections. Especial care must betaken to ensure that parts of the structure supporting such scaffolding are notoverloaded in the event of a collapse under test, and that safeguards for unexpectedfailure modes (such as shear at supports) are provided.
Copyright 1996 Chapman & Hall
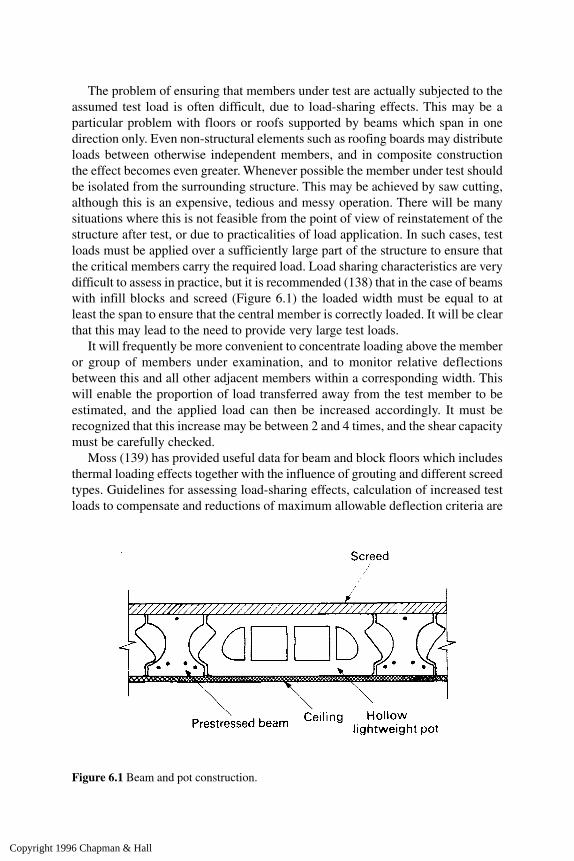
The problem of ensuring that members under test are actually subjected to theassumed test load is often difficult, due to load-sharing effects. This may be aparticular problem with floors or roofs supported by beams which span in onedirection only. Even non-structural elements such as roofing boards may distributeloads between otherwise independent members, and in composite constructionthe effect becomes even greater. Whenever possible the member under test shouldbe isolated from the surrounding structure. This may be achieved by saw cutting,although this is an expensive, tedious and messy operation. There will be manysituations where this is not feasible from the point of view of reinstatement of thestructure after test, or due to practicalities of load application. In such cases, testloads must be applied over a sufficiently large part of the structure to ensure thatthe critical members carry the required load. Load sharing characteristics are verydifficult to assess in practice, but it is recommended (138) that in the case of beamswith infill blocks and screed (Figure 6.1) the loaded width must be equal to atleast the span to ensure that the central member is correctly loaded. It will be clearthat this may lead to the need to provide very large test loads.
It will frequently be more convenient to concentrate loading above the memberor group of members under examination, and to monitor relative deflectionsbetween this and all other adjacent members within a corresponding width. Thiswill enable the proportion of load transferred away from the test member to beestimated, and the applied load can then be increased accordingly. It must berecognized that this increase may be between 2 and 4 times, and the shear capacitymust be carefully checked.
Moss (139) has provided useful data for beam and block floors which includesthermal loading effects together with the influence of grouting and different screedtypes. Guidelines for assessing load-sharing effects, calculation of increased testloads to compensate and reductions of maximum allowable deflection criteria are
Figure 6.1 Beam and pot construction.
Copyright 1996 Chapman & Hall

all provided. Precautions must also be taken to ensure that members under test arenot inadvertently supported by non-structural elements, such as partitions orservices, although permanent finishes on the member need not be removed.Provision of a constant datum for deflection measurements is essential and mustalso be considered when carrying out preliminary work.
6.1.1.2 Test loads. Views on test loads, which should always be added andremoved incrementally, vary considerably. BS 8110 (140) requires that the totalload carried should not be less than the sum of the characteristic design dead andimposed loads, but should normally be the greater of:
design dead load+1.25 design imposed loador 1.125 (design dead load+design imposed load)
(If any final dead load is not in position, compensating loads should be added.)
The test load is applied at least twice, with at least one hour between tests andwith 5-minute settling time after the application of each increment beforerecording measurements. A third loading, sustained for 24 hours, may be usefulin some cases. Performance is based initially on the acceptability of measureddeflection and cracking in terms of the design requirements coupled withexamination for unexpected defects. If significant deflections occur, the deflectionrecovery rates after removal of loading should also be examined. This deflectionlimit is not specified, but a value of 40l2/h mm is sometimes used where l is theeffective span in metres and h the overall depth in mm. Percentage recovery afterthe second test should not be less than that after the first load cycle, nor less than75% for reinforced or partially prestressed concrete. Class 1 and 2 prestressedconcrete members must satisfy a corresponding recovery limit of 85%.
ACI 318 (116) has similar provisions but with a test load sustained for 24 hourssuch that
total load=0.85 (1.4 dead load+1.7 imposed load). Any shortfall of dead load should be made up 48 hours before the test starts, andthe maximum acceptable deflection under test loads is given by:
deflection limit= If this limit is exceeded, recovery must be checked.
The recovery limit for prestressed concrete is 80% but this may not be retested,whilst reinforced concrete failing to meet the 75% recovery criterion may be testedafter 72 hours unloaded, but must achieve 80% recovery of deflections caused bythe second test load.
The ACI requirements are 15–20% more stringent in terms of test load than
Copyright 1996 Chapman & Hall

BS 8110, and it is felt by many engineers that a total overload of only 12 1/2% isinadequate when certifying the long-term safety of a structure. The Institution ofStructural Engineers (138) recognize this in recommending
total load=1.25 (dead load+imposed load) when testing high alumina cement concrete structures. In such situations, wherefuture deterioration is predicted, an even higher load may be justified. Lee (141)has proposed that a load of 1.5 (dead load+imposed load) should be adopted in allcases, but with greater emphasis on recording and analysing the members’ responseby means of load/deflection plots. Figure 6.2 shows a typical plot for an under-reinforced beam; experience would be required to recognize impending failure inorder to stop load application.
6.1.2 Load application techniquesThese are governed almost entirely by the practicalities of providing an adequateload as cheaply as possible at locations which are often difficult to access. Therate of application and distribution of the load must be controlled, and themagnitude must be easily assessed.
Water, bricks, bags of cement, sandbags and steel weights are amongst thematerials which may be used and the choice will depend upon the nature andmagnitude of load required as well as the availability of materials and ease of
Figure 6.2 Typical load deflection curve for under-reinforced beam.
Copyright 1996 Chapman & Hall
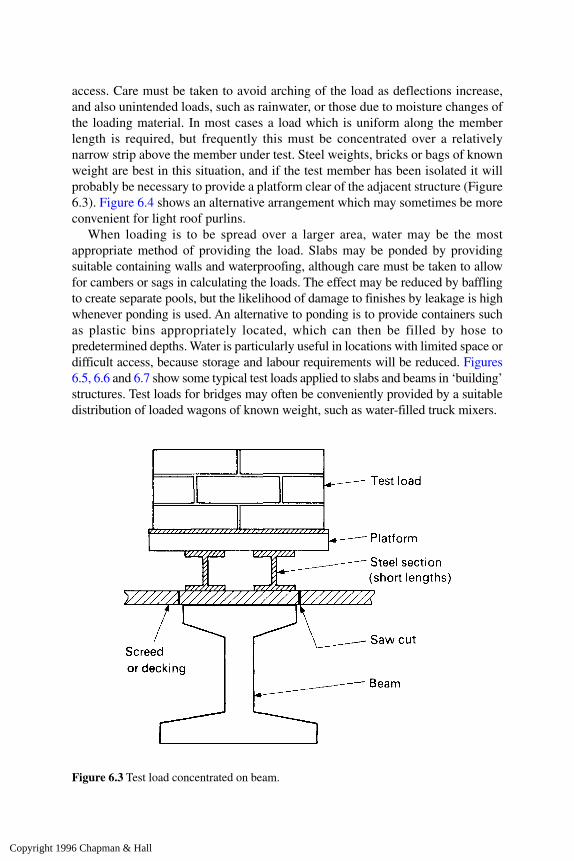
access. Care must be taken to avoid arching of the load as deflections increase,and also unintended loads, such as rainwater, or those due to moisture changes ofthe loading material. In most cases a load which is uniform along the memberlength is required, but frequently this must be concentrated over a relativelynarrow strip above the member under test. Steel weights, bricks or bags of knownweight are best in this situation, and if the test member has been isolated it willprobably be necessary to provide a platform clear of the adjacent structure (Figure6.3). Figure 6.4 shows an alternative arrangement which may sometimes be moreconvenient for light roof purlins.
When loading is to be spread over a larger area, water may be the mostappropriate method of providing the load. Slabs may be ponded by providingsuitable containing walls and waterproofing, although care must be taken to allowfor cambers or sags in calculating the loads. The effect may be reduced by bafflingto create separate pools, but the likelihood of damage to finishes by leakage is highwhenever ponding is used. An alternative to ponding is to provide containers suchas plastic bins appropriately located, which can then be filled by hose topredetermined depths. Water is particularly useful in locations with limited space ordifficult access, because storage and labour requirements will be reduced. Figures6.5, 6.6 and 6.7 show some typical test loads applied to slabs and beams in ‘building’structures. Test loads for bridges may often be conveniently provided by a suitabledistribution of loaded wagons of known weight, such as water-filled truck mixers.
Figure 6.3 Test load concentrated on beam.
Copyright 1996 Chapman & Hall

For safety reasons, personnel working in a test load area must be restricted tothose essential for load application and taking of measurements. Loads will alwaysbe applied in predetermined increments and in a way which will cause as littlelack of symmetry or uniformity as possible. Similar precautions should be takenduring unloading, and particular care is necessary to ensure that test load storageareas are not inadvertently overloaded. Deflection gauges must be carefullyobserved throughout the loading cycle, and if there are signs of deflectionsincreasing with time under constant load, further loading should be stopped andthe load reduced as quickly as possible. The potential speed of load removal isthus an important safety consideration, and ‘bulk’ loads which rely heavily oneither manual or mechanical labour suffer the disadvantage of being relativelyslow to handle. Water may be dispersed quickly if ponded, by the provision of‘knock-out’ areas in the containing dyke, but the resultant damage to finishes maybe considerable.
Non-gravity loading offers advantages of greater control, which can also beeffected at a distance from the immediate test area, but is usually more expensive,and is restricted to use with load tests of a specialized or complex nature.Hydraulic systems may employ soil anchors, ballast or shoring to other parts ofthe structure to provide a reaction for jacking. The loading may be rapidlymanipulated, and offers the advantage of simple cycling if required. In caseswhere a horizontal test load is required this approach may also be useful. Another
Figure 6.4 Test load arrangement for purlins.
Copyright 1996 Chapman & Hall
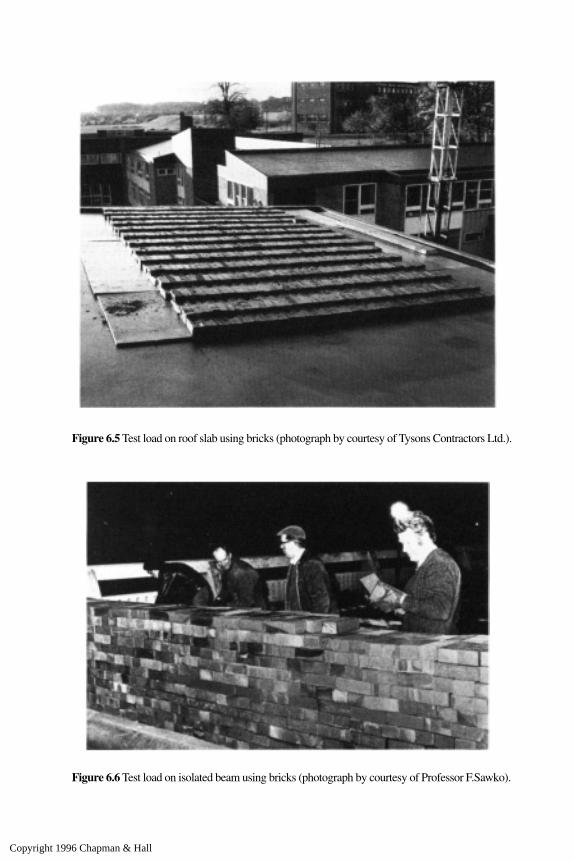
Figure 6.5 Test load on roof slab using bricks (photograph by courtesy of Tysons Contractors Ltd.).
Figure 6.6 Test load on isolated beam using bricks (photograph by courtesy of Professor F.Sawko).
Copyright 1996 Chapman & Hall
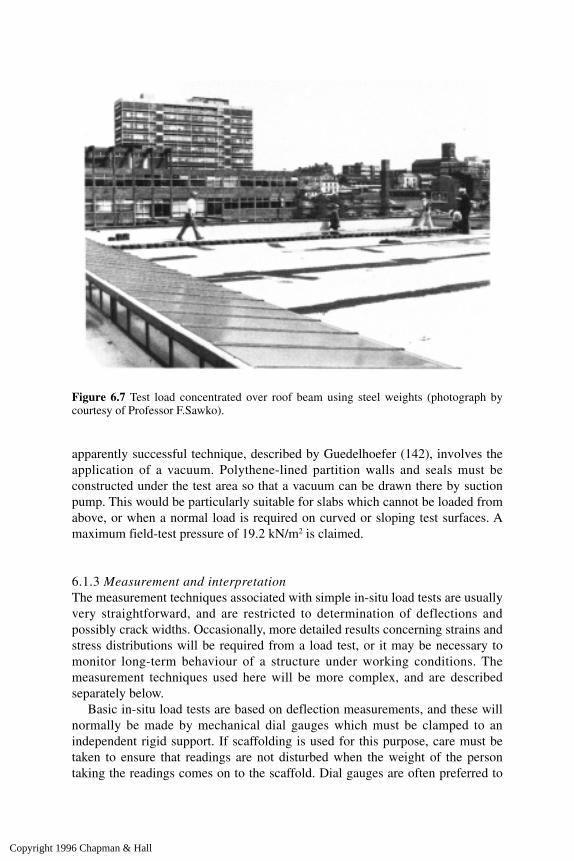
apparently successful technique, described by Guedelhoefer (142), involves theapplication of a vacuum. Polythene-lined partition walls and seals must beconstructed under the test area so that a vacuum can be drawn there by suctionpump. This would be particularly suitable for slabs which cannot be loaded fromabove, or when a normal load is required on curved or sloping test surfaces. Amaximum field-test pressure of 19.2 kN/m2 is claimed.
6.1.3 Measurement and interpretationThe measurement techniques associated with simple in-situ load tests are usuallyvery straightforward, and are restricted to determination of deflections andpossibly crack widths. Occasionally, more detailed results concerning strains andstress distributions will be required from a load test, or it may be necessary tomonitor long-term behaviour of a structure under working conditions. Themeasurement techniques used here will be more complex, and are describedseparately below.
Basic in-situ load tests are based on deflection measurements, and these willnormally be made by mechanical dial gauges which must be clamped to anindependent rigid support. If scaffolding is used for this purpose, care must betaken to ensure that readings are not disturbed when the weight of the persontaking the readings comes on to the scaffold. Dial gauges are often preferred to
Figure 6.7 Test load concentrated over roof beam using steel weights (photograph bycourtesy of Professor F.Sawko).
Copyright 1996 Chapman & Hall
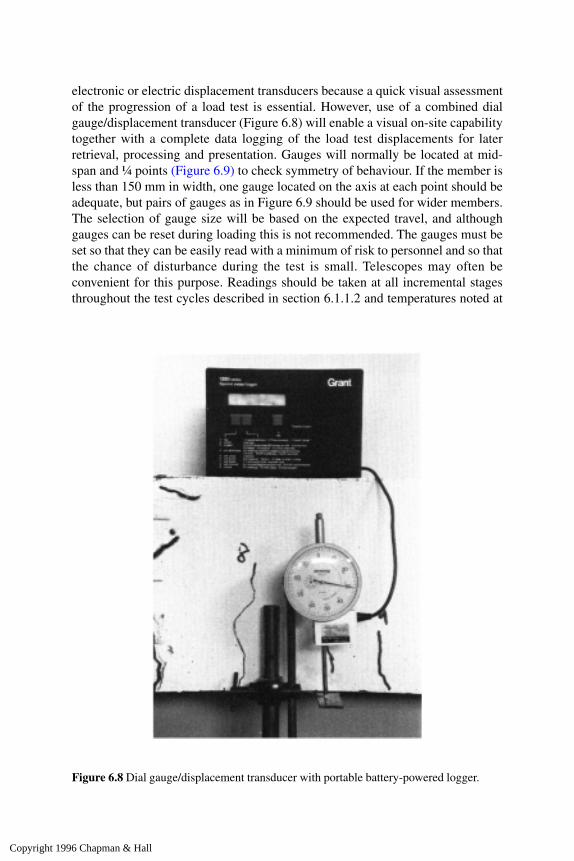
electronic or electric displacement transducers because a quick visual assessmentof the progression of a load test is essential. However, use of a combined dialgauge/displacement transducer (Figure 6.8) will enable a visual on-site capabilitytogether with a complete data logging of the load test displacements for laterretrieval, processing and presentation. Gauges will normally be located at mid-span and ¼ points (Figure 6.9) to check symmetry of behaviour. If the member isless than 150 mm in width, one gauge located on the axis at each point should beadequate, but pairs of gauges as in Figure 6.9 should be used for wider members.The selection of gauge size will be based on the expected travel, and althoughgauges can be reset during loading this is not recommended. The gauges must beset so that they can be easily read with a minimum of risk to personnel and so thatthe chance of disturbance during the test is small. Telescopes may often beconvenient for this purpose. Readings should be taken at all incremental stagesthroughout the test cycles described in section 6.1.1.2 and temperatures noted at
Figure 6.8 Dial gauge/displacement transducer with portable battery-powered logger.
Copyright 1996 Chapman & Hall
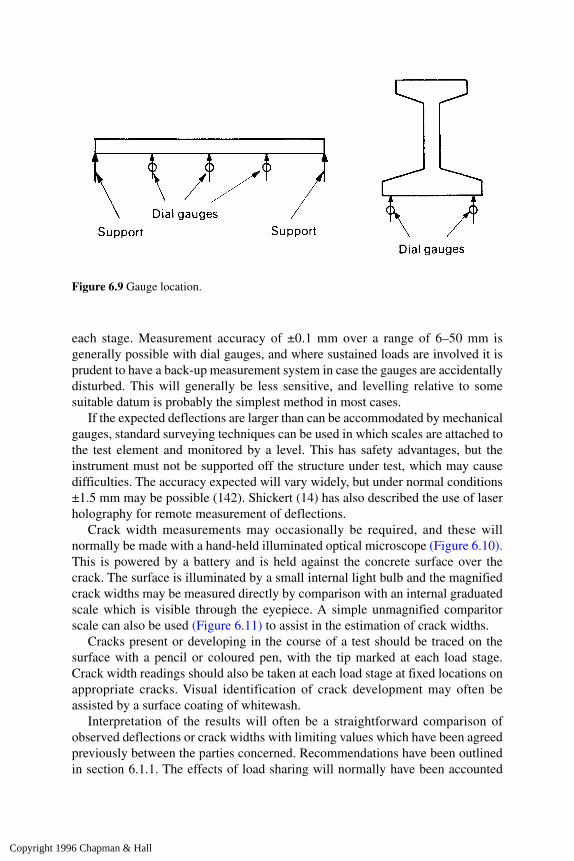
each stage. Measurement accuracy of ±0.1 mm over a range of 6–50 mm isgenerally possible with dial gauges, and where sustained loads are involved it isprudent to have a back-up measurement system in case the gauges are accidentallydisturbed. This will generally be less sensitive, and levelling relative to somesuitable datum is probably the simplest method in most cases.
If the expected deflections are larger than can be accommodated by mechanicalgauges, standard surveying techniques can be used in which scales are attached tothe test element and monitored by a level. This has safety advantages, but theinstrument must not be supported off the structure under test, which may causedifficulties. The accuracy expected will vary widely, but under normal conditions±1.5 mm may be possible (142). Shickert (14) has also described the use of laserholography for remote measurement of deflections.
Crack width measurements may occasionally be required, and these willnormally be made with a hand-held illuminated optical microscope (Figure 6.10).This is powered by a battery and is held against the concrete surface over thecrack. The surface is illuminated by a small internal light bulb and the magnifiedcrack widths may be measured directly by comparison with an internal graduatedscale which is visible through the eyepiece. A simple unmagnified comparitorscale can also be used (Figure 6.11) to assist in the estimation of crack widths.
Cracks present or developing in the course of a test should be traced on thesurface with a pencil or coloured pen, with the tip marked at each load stage.Crack width readings should also be taken at each load stage at fixed locations onappropriate cracks. Visual identification of crack development may often beassisted by a surface coating of whitewash.
Interpretation of the results will often be a straightforward comparison ofobserved deflections or crack widths with limiting values which have been agreedpreviously between the parties concerned. Recommendations have been outlinedin section 6.1.1. The effects of load sharing will normally have been accounted
Figure 6.9 Gauge location.
Copyright 1996 Chapman & Hall

for in the determination of the test load, so that the principal factor for whichallowance must be made is temperature. This may cause significant changes ofstress distributions within a member or structure between winter and summer, anddifferential of temperature across a member such as a roof beam may causeconsiderable deflection changes. Sometimes it may be possible to compensate forthese by the establishment of a ‘footprint’ of movement for the structure for arange of temperatures (134).
As indicated previously, examination of the load/deflection plot can yieldvaluable information about the behaviour of the test member. A typical plot for abeam is given in Figure 6.12, in which the effects of creep during the period ofsustained load and recovery can be seen. Since full recovery is not requiredinstantaneously, some non-linearity of behaviour under sustained load is to beexpected, but any marked non-linearity during the period of load application, otherthan that attributed to bedding-in and breakdown of non-structural finishes, mustbe taken as a sign that failure may be approaching. Comparison with Figure 6.2
Figure 6.10 Crack microscope.
Copyright 1996 Chapman & Hall

Figure 6.11 Crack width measurement scale.
Copyright 1996 Chapman & Hall
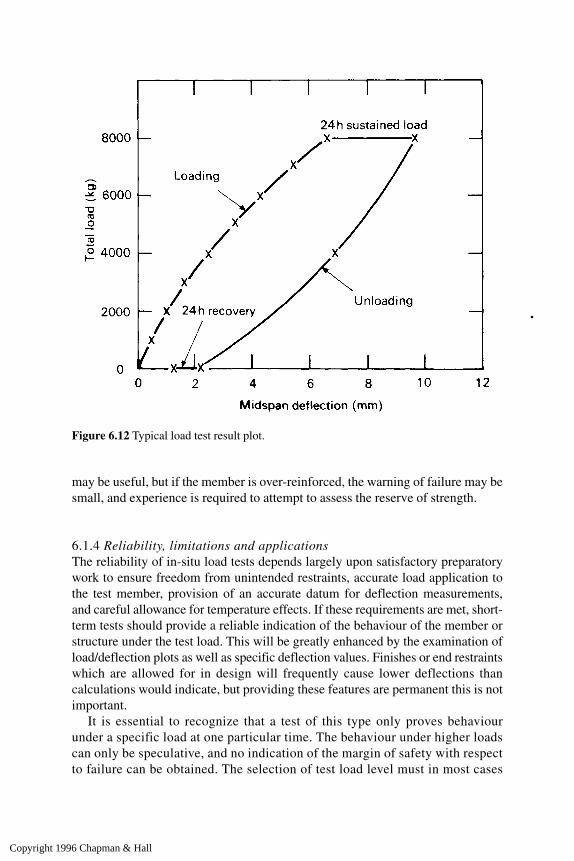
may be useful, but if the member is over-reinforced, the warning of failure may besmall, and experience is required to attempt to assess the reserve of strength.
6.1.4 Reliability, limitations and applicationsThe reliability of in-situ load tests depends largely upon satisfactory preparatorywork to ensure freedom from unintended restraints, accurate load application tothe test member, provision of an accurate datum for deflection measurements,and careful allowance for temperature effects. If these requirements are met, short-term tests should provide a reliable indication of the behaviour of the member orstructure under the test load. This will be greatly enhanced by the examination ofload/deflection plots as well as specific deflection values. Finishes or end restraintswhich are allowed for in design will frequently cause lower deflections thancalculations would indicate, but providing these features are permanent this is notimportant.
It is essential to recognize that a test of this type only proves behaviourunder a specific load at one particular time. The behaviour under higher loadscan only be speculative, and no indication of the margin of safety with respectto failure can be obtained. The selection of test load level must in most cases
Figure 6.12 Typical load test result plot.
Copyright 1996 Chapman & Hall

therefore be a compromise between continued serviceability of the test memberand demonstration of adequate load-bearing capacity. If there is any possibilityof future deterioration of the strength of materials, this must also be recognizedin determining the test load together with any decisions based on the testresults.
For short-term static tests instrumentation will generally be simple, but forlong-term or dynamic tests, measurement devices must be carefully selected,particularly where strains are to be monitored. Gauges may be liable to physicaldamage or deterioration as well as temperature, humidity and electricalinstability, and must also be selected and located with regard to the anticipatedstrain levels and orientation, as well as the gauge lengths and accuraciesavailable.
Cost and inconvenience are serious disavantages of in-situ load testing, butthese are usually outweighed by the benefits of a positive demonstration of abilityto sustain required loads. Applications will therefore tend to be concentrated oncritical or politically ‘sensitive’ structures, as well as those where lack ofinformation precludes strength calculations. In-situ load tests are most likely tobe needed in the following circumstances:
(i) Deterioration of structures, due to material degradation or physicaldamage.
(ii) Structures which are substandard due to quality of design or construction,(iii) Non-standard design methods which may cause the designer, building
authorities or other parties to require proof of the concept used,(iv)Change in occupancy or structural modification which may increaseloadings. Analysis is frequently impossible where drawings for existingstructures are not available, but in other cases an inadequate margin mayexist above original design values,
(v) Proof of performance following major repairs, which may be politicallynecesary in the case of public structures such as schools, halls and othergathering places.
In many cases chemical, non-destructive or partially-destructive methods mayhave been used as a preliminary to load testing to confirm the need for such tests,and to determine the relative materials properties of comparable members.Although estimates of the ultimate structural strength may be possible in the casesof deterioration of materials or suspect construction quality, a carefuly plannedand executed in-situ load test will provide valuable information as to satisfactorybehaviour under working loads.
Long-term monitoring of behaviour under service conditions will normallyonly be necessary if there is considerable doubt about future performance, or time-dependent changes are expected. This may occur if deterioration is expected,loadings are uncertain, or load testing is impracticable and there is a lack ofconfidence in strength estimates based on other methods.
Copyright 1996 Chapman & Hall

6.2 Monitoring
This may range from relatively short-term measurements of behaviour duringconstruction to long-term observations of behaviour during service.
6.2.1 Monitoring during constructionThere has been a growing awareness of the need to monitor factors such as heatgeneration or strength development during construction of critical structures orparts of structures. Techniques for this purpose are outlined in other parts of thisbook. Interest has also grown in the implications of the use of newly developinghigh performance materials upon stresses and structural performance and somereports of monitoring are available (143).
6.2.2 Long-term monitoringIn cases of uncertainty about future performance of an element or structure it maybe necessary to undertake regular long-term monitoring of behaviour. The scopeof this ranges across the following:
(i) modifications to existing structures(ii) structures affected by external works
(iii) behaviour during demolition(iv) long-term movements(v) degradation of materials
(vi) feedback to design(vii) fatigue assessment
(viii) novel construction system performance.
Moss and Matthews (144) have comprehensively reviewed these applications aswell as practical issues concerning instrumentation and techniques to be used. Awide range of techniques are described ranging from simple visual and surveyingmethods, often supplemented by automatic data collection systems, to remotelaser sensing systems to detect movements. Automation of data collection andstorage is seen as a key aspect of many long-term monitoring situations. It isessential that measurements are taken at regular times each year to allow forseasonal effects, which may be considerable. Temperature, and preferably alsohumidity, should always be measured in conjunction with regular testing.Deflections and crack widths will normally be monitored, although strainmeasurements may also be valuable, particularly where the structure is subject torepetitive loading. In cases where there are large-scale movements of one part ofa structure relative to another, permanent reference marks may be established andmeasured by rule, or if the area is normally not visible, a scale and pointer may befirmly fixed to the adjacent elements to indicate relative movement. This is asimple approach: more refined measurement systems will be required wheremovements are small.
Copyright 1996 Chapman & Hall

Deflections may be monitored by levelling, using conventional surveyingtechniques, and this will detect major movements. Levels should always betaken at permanently-marked points on test members, preferably on a studfirmly cemented to the surface. Midspan readings should be related to readingstaken as close as possible to the supports for each test member to determinedeflection changes. Variations of this approach include taut string lines orpiano wires stretched between the datum points at the supports, with a scaleattached to the midspan point. A refinement involving a laser beam provides ameans of detecting very small movements and may be appropriate for criticalstructures or members. This is suitable for continuous measurement, and mayalso be adapted to trigger an alarm system by replacing the scale with asuitable hole or slot through which the beam passes. A light-sensitive targetwould then react if the beam is cut off by excessive movement of the hole orslot (Figure 6.13). A similar approach using an infrared transmitter andreceiver has also been described whilst another automatic system uses a tautstainless steel wire with proximity switches fixed to the beams to detectrelative movement. Temperature-compensating springs maintain the tension,and a wire-break indicator is included in the control system which can providean audible or light warning when a switch is triggered. A maximum wirelength of 50 metres, with a control box handling up to 30 rooms, eachcontaining 50 switches, has been claimed. Remote sensing photogrammatictechniques are also available (145).
Electrical variable-resistance potentiometers or displacement transducersmay provide a useful method of accurate deflection measurement, particularlyif automatic recording is an advantage. These consist of a spring-loadedcentrally located plunger which is connected to a slide contact and moves up
Figure 6.13 Laser beam for long-term monitoring.
Copyright 1996 Chapman & Hall

and down the core of a long wound resistor, usually 50–100 mm in length, and avoltage is applied to the system and recorded by simple digital voltmeter. It isclaimed (142) that accuracies of 0.025 mm can be achieved in this way. Theproblem with long-term deflection measurements involving this type ofequipment lies in providing suitable independent rigid supports and protectionfor the equipment, together with the long-term stability of calibration of thedevices.
Crack widths may be measured using the optical equipment described insection 6.1.3, but this is inevitably subject to operators’judgements. A simplemethod of detecting the continued widening of established cracks is the locationof a brittle tell-tale firmly cemented to the surface either side of the crack whichwill fracture if widening occurs. Thin glass slips, such as microscope slides, arecommonly used but calibrated plastic tell-tales are also available. A mechanicalmethod, using a Demec gauge as described in section 6.3, will provide directnumerical data on crack width changes and is simple to use if measuring studsare fixed permanently on either side of appropriate cracks. Equipment with anominal 100 mm gauge length is recommended, and the same device mustalways be used for a particular test location.
If a precise measurement across cracks, or an automatic recording system, isrequired, the electrical displacement devices described above may be useful buttheir long-term performance should be carefully considered. Crack propagationmay also be recorded automatically by electrical gauges consisting of a numberof resistor strands connected in parallel and bonded to the concrete surface in asimilar manner to strain gauges. As a crack propagates, individual strands withinthe high-endurance alloy foil grid will fracture and increase the overall electricalresistance across the gauge. This can be measured with a low voltage d.c. powersupply and ohmmeter, and can be recorded automatically on a strip chart recorder.Additional low voltage instrumentation can be employed to trigger an alarm ifthis is necessary.
Strains may be measured by a variety of methods as described in section6.3, but in most cases a simple mechanical approach using a Demec gaugewill be the most successful for long-term monitoring. Provided that the studsare not damaged, readings may be repeated indefinitely over many years, andalthough the method suffers the disadvantage of a lack of remote readout, theproblems of calibration and long-term ‘drift’ of electrical methods areavoided. If a remote reading system is preferred, vibrating wire gauges aregenerally regarded as reliable for long-term testing. The use of optical fibresto monitor strains is an important new development. This has become possibleas a result of new technology and reported applications include monitoringcrack widths in post-tensioned bridges as well as incorporation intoprestressing tendons to monitor their in-service loads (144, 146). Two typesof optical fibre are used:
(i) Stranded optical fibre sensors. Measurements can be made of light that
Copyright 1996 Chapman & Hall

is lost or attenuated whilst passing through regions containing microbendsas illustrated in Figure 6.14. The intensity of light emerging as the sensoris strained or relaxed is compared with the light supplied, to enablechanges in overall length to be made to an accuracy of ±0.02 mm forgauge lengths up to 30 m. This accuracy is independent of gauge length,but the precise position of localized straining is not given. Optical timedomain reflectometry apparatus can be used to transmit pulses of light ofabout 1 ns duration into the sensor and measure the transit times of echoesfrom reflections at points of attenuation. This backscatter permitspositions of attenuation to be located within ± 0.75 m.
(ii) Multi-reflection sensors. These consist of single fibres containing up to30 partial mirrors at intervals along their length. About 97% of the lightpasses through each partial mirror and the time for a pulse to be reflectedback to the source is measured. The position of individual reflectors canbe measured to an accuracy of ±0.15 mm using picosecond optical timedomain reflectivity equipment.
Stranded optical fibres can easily be fitted to an existing structure to monitor long-term behaviour, and they are typically connected only at node points to enablestrain distribution to be assessed. Multi-reflection sensors are particularlyappropriate for incorporation into prestressing strands as a potentially ‘intelligent’element in a ‘smart’ structure. Further practical details are given by Dill and Curtis(146), including information about control systems.
Vibrating wire gauges can be used for long-term monitoring in conjunction witha calibration load which is wheeled on a trolley across the floor or roof under test.This method is particularly suitable for monitoring slabs, and may be cheaper thanmaking repeated readings which require scaffolding or ceiling removal for access.
Interpretation of long-term monitoring will normally consist of examinationof load/deflection or load/crack width plots or the development of crack maps.Care must be taken to ensure that the effects of seasonal temperature andhumidity changes are minimized or accounted for, and that loading conditionsare similar whenever readings are taken for comparison. The importance of
Figure 6.14 Stranded optical fibre (based on ref. 146).
Copyright 1996 Chapman & Hall
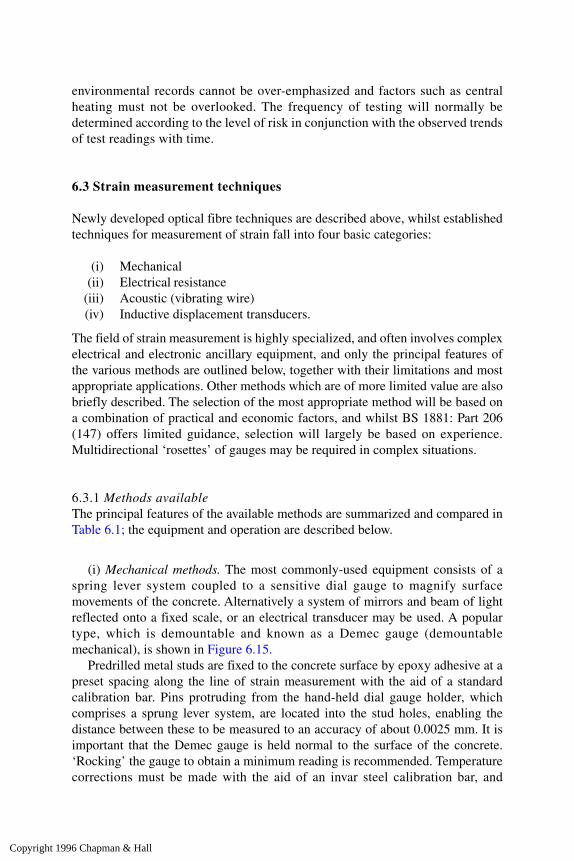
environmental records cannot be over-emphasized and factors such as centralheating must not be overlooked. The frequency of testing will normally bedetermined according to the level of risk in conjunction with the observed trendsof test readings with time.
6.3 Strain measurement techniques
Newly developed optical fibre techniques are described above, whilst establishedtechniques for measurement of strain fall into four basic categories:
(i) Mechanical(ii) Electrical resistance
(iii) Acoustic (vibrating wire)(iv) Inductive displacement transducers.
The field of strain measurement is highly specialized, and often involves complexelectrical and electronic ancillary equipment, and only the principal features ofthe various methods are outlined below, together with their limitations and mostappropriate applications. Other methods which are of more limited value are alsobriefly described. The selection of the most appropriate method will be based ona combination of practical and economic factors, and whilst BS 1881: Part 206(147) offers limited guidance, selection will largely be based on experience.Multidirectional ‘rosettes’ of gauges may be required in complex situations.
6.3.1 Methods availableThe principal features of the available methods are summarized and compared inTable 6.1; the equipment and operation are described below.
(i) Mechanical methods. The most commonly-used equipment consists of aspring lever system coupled to a sensitive dial gauge to magnify surfacemovements of the concrete. Alternatively a system of mirrors and beam of lightreflected onto a fixed scale, or an electrical transducer may be used. A populartype, which is demountable and known as a Demec gauge (demountablemechanical), is shown in Figure 6.15.
Predrilled metal studs are fixed to the concrete surface by epoxy adhesive at apreset spacing along the line of strain measurement with the aid of a standardcalibration bar. Pins protruding from the hand-held dial gauge holder, whichcomprises a sprung lever system, are located into the stud holes, enabling thedistance between these to be measured to an accuracy of about 0.0025 mm. It isimportant that the Demec gauge is held normal to the surface of the concrete.‘Rocking’ the gauge to obtain a minimum reading is recommended. Temperaturecorrections must be made with the aid of an invar steel calibration bar, and
Copyright 1996 Chapman & Hall

Table 6.1 Strain gauge summary
Copyright 1996 Chapman & Hall

readings may be repeated indefinitely provided the studs are not damaged orcorroded. Cleanliness of the gauge and studs is important, and careful preparationof the surface is essential prior to fixing of the reference studs, which should bestainless steel for long-term testing.
The equipment is available in a range of gauge lengths, although 100, 200and 250 mm are most commonly used. In general the greatest length should beused unless some localized feature is under examination, as in the case oflaboratory model tests. The method is cheap, simple and the equipmentrelatively robust in comparison with other techniques, with the long gaugelengths particularly well suited to post-cracking testing of concrete and in-situuse. The principal disadvantage is the lack of a remote readout, and this canlead to very tedious operation where a large number of measurements arerequired. A further disadvantage is that different readings may be obtained bydifferent operators.
A development of the method to give a remote readout is shown in Figure6.16. This has a gauge length of 100 mm or 200 mm and uses Demec studs,with a standardized tension spring system to hold the equipment in position onthe concrete surface. The flexible aluminium alloy strip is bent by relativemovement of the pins, and this bending is measured by electrical resistancestrain gauges. The equipment is particularly suited to laboratory use where alarge gauge length is required. A similar approach has also been described byDin and Lovegrove (148) in which bending of a formed metal strip bolted to theconcrete surface is monitored by electrical resistance gauges. This version isintended for long-term measurements where cyclic strains are involved.
Figure 6.15 Photo of Demec gauge.
Copyright 1996 Chapman & Hall
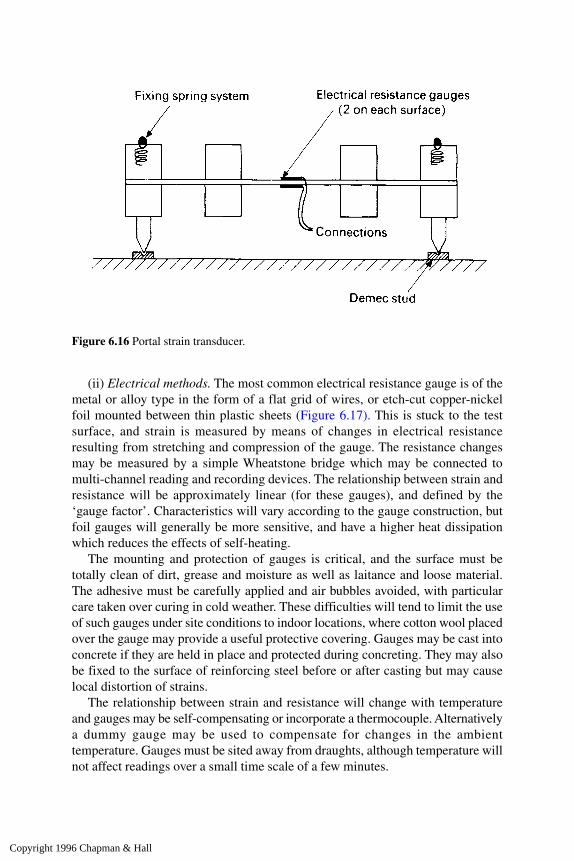
(ii) Electrical methods. The most common electrical resistance gauge is of themetal or alloy type in the form of a flat grid of wires, or etch-cut copper-nickelfoil mounted between thin plastic sheets (Figure 6.17). This is stuck to the testsurface, and strain is measured by means of changes in electrical resistanceresulting from stretching and compression of the gauge. The resistance changesmay be measured by a simple Wheatstone bridge which may be connected tomulti-channel reading and recording devices. The relationship between strain andresistance will be approximately linear (for these gauges), and defined by the‘gauge factor’. Characteristics will vary according to the gauge construction, butfoil gauges will generally be more sensitive, and have a higher heat dissipationwhich reduces the effects of self-heating.
The mounting and protection of gauges is critical, and the surface must betotally clean of dirt, grease and moisture as well as laitance and loose material.The adhesive must be carefully applied and air bubbles avoided, with particularcare taken over curing in cold weather. These difficulties will tend to limit the useof such gauges under site conditions to indoor locations, where cotton wool placedover the gauge may provide a useful protective covering. Gauges may be cast intoconcrete if they are held in place and protected during concreting. They may alsobe fixed to the surface of reinforcing steel before or after casting but may causelocal distortion of strains.
The relationship between strain and resistance will change with temperatureand gauges may be self-compensating or incorporate a thermocouple. Alternativelya dummy gauge may be used to compensate for changes in the ambienttemperature. Gauges must be sited away from draughts, although temperature willnot affect readings over a small time scale of a few minutes.
Figure 6.16 Portal strain transducer.
Copyright 1996 Chapman & Hall
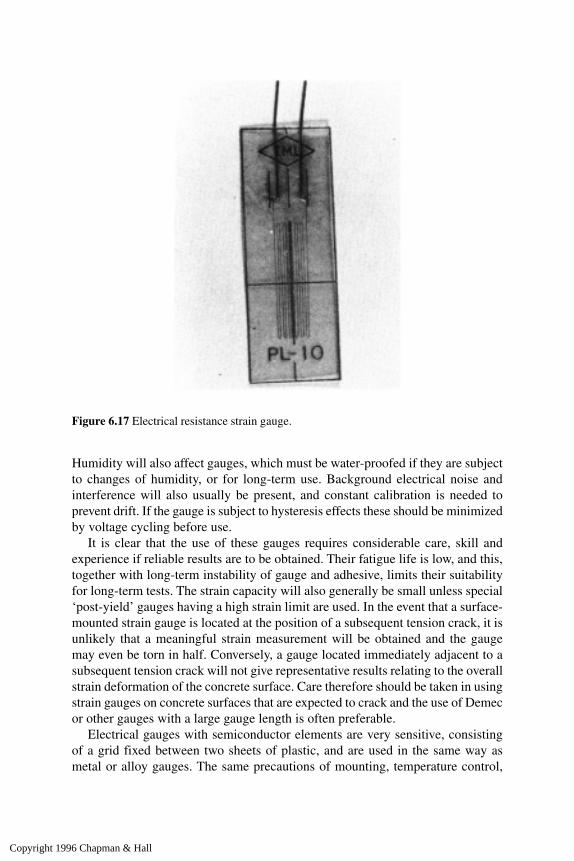
Humidity will also affect gauges, which must be water-proofed if they are subjectto changes of humidity, or for long-term use. Background electrical noise andinterference will also usually be present, and constant calibration is needed toprevent drift. If the gauge is subject to hysteresis effects these should be minimizedby voltage cycling before use.
It is clear that the use of these gauges requires considerable care, skill andexperience if reliable results are to be obtained. Their fatigue life is low, and this,together with long-term instability of gauge and adhesive, limits their suitabilityfor long-term tests. The strain capacity will also generally be small unless special‘post-yield’ gauges having a high strain limit are used. In the event that a surface-mounted strain gauge is located at the position of a subsequent tension crack, it isunlikely that a meaningful strain measurement will be obtained and the gaugemay even be torn in half. Conversely, a gauge located immediately adjacent to asubsequent tension crack will not give representative results relating to the overallstrain deformation of the concrete surface. Care therefore should be taken in usingstrain gauges on concrete surfaces that are expected to crack and the use of Demecor other gauges with a large gauge length is often preferable.
Electrical gauges with semiconductor elements are very sensitive, consistingof a grid fixed between two sheets of plastic, and are used in the same way asmetal or alloy gauges. The same precautions of mounting, temperature control,
Figure 6.17 Electrical resistance strain gauge.
Copyright 1996 Chapman & Hall

and calibration apply, although they do not suffer from hysteresis effects. Thegauges are very brittle however, requiring care in handling, and are unsuitable forcasting into the concrete. The change in resistance is not directly proportional tostrain and a precise calibration is therefore necessary, but the accuracy ofmeasurement achieved is high.
(iii) Acoustic (vibrating wire) methods. These are based on the principle thatthe resonant frequency of a taut wire will vary with changes in tension. Atensioned wire is sealed into a protective tube and fixed to the concrete. Anelectromagnet close to the centre is used to pluck the wire, and it is then used as apick-up to detect the frequency of vibration. This will normally be compared withthe frequency of a dummy gauge by a recording device such as a cathode rayoscilloscope or comparative oscillator, to account for temperature effects. Thistype of gauge may be cast into the concrete (often encapsulated in precast mortar‘dog-bones’), and if adequately protected is considered suitable for long-termtests, although it is not appropriate for dynamic tests with a strain rate of greaterthan 1 microstrain/s (147) because of its slow response time. Particular care isnecessary to avoid magnetic influences, and a stabilized electrical supply isrecommended for the recording devices.
(iv) Inductive displacement transducers. Two series-connected coils form theactive arms of an electrical bridge network fed by a high frequency a.c. supply. Anarmature moves between these coils, varying the inductance of each andunbalancing the bridge network. The phase and magnitude of the signal resultingfrom this lack of balance will be proportional to the displacement of the armaturefrom its central position. The body of the gauge will be fixed to the concrete or areference frame, so that the armature bears upon a metal plate fixed to the concrete.In this way lateral or diagonal as well as longitudinal strains may be measured; anadjusting mechanism allows zeroing of the equipment. These gauges are particularlysensitive over small lengths, but much expensive, complicated electrical equipmentis needed to operate them and to interpret their output. This, together with theextensive precautions necessary, means that considerable experience is required.
(v) Photoelastic methods. These involve a mirror-backed sheet of photoelasticresin stuck to the concrete face. Polarized light is directed at this surface, andfringe patterns will show the strain configuration at the concrete surface undersubsequent loading. The strain range of up to 1.5% is larger than any gauge canaccommodate, but it is very difficult to obtain a precise value of strain from thismethod. The method may prove useful in examining strain distributions orconcentrations at localized critical points of a member.
(vi) Piezo-electric gauges. The electrical energy generated by smallmovements of a transducer crystal coupled to the concrete surface is measuredand related to strain. This is particularly suitable if small, rapid strain changes
Copyright 1996 Chapman & Hall

are to be recorded, since the changes generated are very short-lived, and thesegauges are most likely to find applications in the laboratory rather than on site.
6.3.2 Selection of methodsThe non-homogeneous nature of concrete generally excludes small gauge lengthsunless very small aggregates are involved. For most practical in-situ testing,mechanical gauges will be most suitable, unless there is a particular need forremote reading, in which case vibrating wire gauges may be useful and moreaccurate over gauge lengths of about 100–150 mm. Both of these types aresuitable for long-term use, given adequate protection. Optical fibres may beappropriate where measurements are required over considerable lengths.
Electrical resistance gauges may be useful if reinforcement strains are to bemonitored, or for examining pre-cracking behaviour in the laboratory, and areusually associated with smaller gauge lengths, offering greater accuracy thanmechanical methods. These gauges are, however, not re-usable; mechanical gaugeshave the advantage of not being damaged by crack formation across the gaugelength. Semi-conductor gauges are very accurate, although delicate, and are likelyto be restricted to specialized laboratory usage. For dynamic tests, electricalresistance or transducer gauges will be most suitable, although the operation of thelatter will generally be more complicated and expensive. Photoelastic and piezo-electric methods have their own specialist applications outlined above. A great dealof information concerning the wide range of commercially available gaugesincluding their maximum strain capacity is to be found in literature supplied byvarious equipment manufacturers, and it is recommended that this should beconsulted carefully before selection of a particular gauge.
6.4 Ultimate load testing
Apart from its use as a quality control check on standard precast elements, ultimateload testing is an uncommon but important approach when in-situ overload testsare impossible or inadequate. The effort and disruption involved in the removaland replacement of members of a completed structure are considerable, but theresults of a carefully monitored test, preferably carried out in a laboratory, provideconclusive evidence relating to the member examined. Comparison of the testedmember with those remaining must be a matter of judgement, often assisted bynon-destructive testing.
6.4.1 Testing procedures and measurement techniquesUltimate load tests should preferably be carried out in a laboratory where carefullycontrolled hydraulic load application and recording systems are available. Forsmall members it may be possible to use standard testing machines, and for largermembers a suitable frame or rig can be assembled. If the size of the test member
Copyright 1996 Chapman & Hall

prevents transportation to a laboratory it may be possible to assemble a test frameon site, adjacent to the structure from which the member has been removed. Inthis case load may be applied by manually operated jacks, with other techniquessimilar to those used in the laboratory. The control of load application andmeasurement will generally be less precise, however, and site tests should beavoided whenever possible.
6.4.1.1 Load arrangements. The most commonly used load arrangement forbeams will consist of third point loading. This has the advantage of a substantialregion of nearly uniform moment coupled with very small shears, enabling thebending capacity of the central portion to be assessed. If the shear capacity of themember is to be assessed, the load will normally be concentrated at a suitableshorter distance from a support.
Third point loading can be conveniently provided by the arrangement shownin Figure 6.18. The load is transmitted through a load cell or proving ring andspherical seating on to a spreader beam. This beam bears on rollers seated on steelplates bedded on the test member with mortar, high-strength plaster or somesimilar material. The test member is supported on roller bearings acting on similarspreader plates. Corless and Morice (149) have examined in detail therequirements of a mechanical test arrangement to avoid unwanted restraint and toensure stability.
Details of the test frame will vary according to the facilities available and thesize of loads involved, but it must be capable of carrying the expected test loadswithout significant distortion. Ease of access to the middle third for crackobservations, deflection readings and possibly strain measurements is animportant consideration, as is safety when failure occurs. Slings or stops may needto be provided to support the member after collapse.
In exceptional circumstances where two members are available it may bepossible to test them ‘back-to-back’. The ends can be clamped together with aspacer block by means of bolted steel frames, and the centres of the beams jackedapart by some suitable system incorporating a load cell. This method may beparticularly suitable for tests conducted on site.
6.4.1.2 Measurements. Crack widths, crack development, and deflections willusually be monitored using the techniques described for in-situ testing. Dialgauges will be adequate for deflection readings unless automatic recording isrequired, in which case electrical displacement transducers may be useful. Strainmeasurements may not be required for straightforward strength tests, but arevaluable for tests on prototype members or where detailed information about stressdistributions is needed. The techniques available for strain measurement have beendescribed in section 6.3, and the choice of method will involve manyconsiderations, but the advantages of a large gauge length in the ‘constantmoment’ zone are considerable.
Copyright 1996 Chapman & Hall
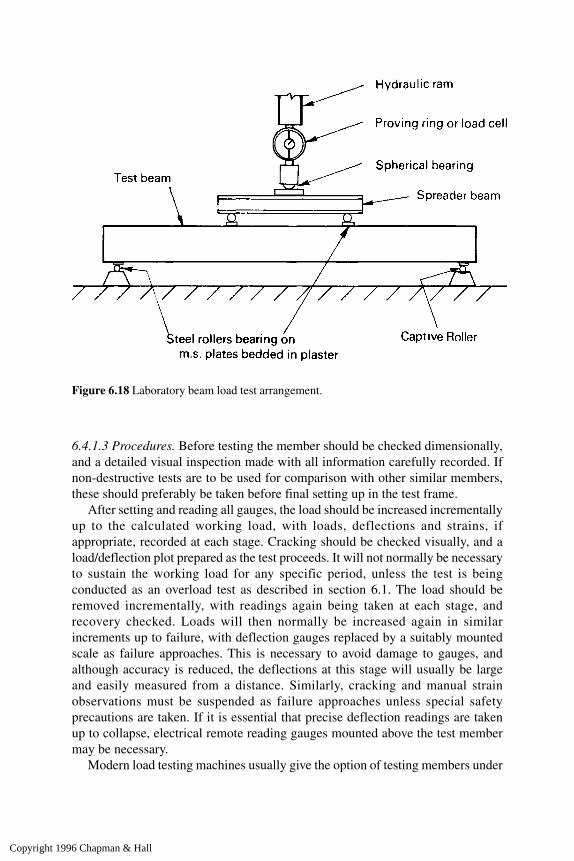
6.4.1.3 Procedures. Before testing the member should be checked dimensionally,and a detailed visual inspection made with all information carefully recorded. Ifnon-destructive tests are to be used for comparison with other similar members,these should preferably be taken before final setting up in the test frame.
After setting and reading all gauges, the load should be increased incrementallyup to the calculated working load, with loads, deflections and strains, ifappropriate, recorded at each stage. Cracking should be checked visually, and aload/deflection plot prepared as the test proceeds. It will not normally be necessaryto sustain the working load for any specific period, unless the test is beingconducted as an overload test as described in section 6.1. The load should beremoved incrementally, with readings again being taken at each stage, andrecovery checked. Loads will then normally be increased again in similarincrements up to failure, with deflection gauges replaced by a suitably mountedscale as failure approaches. This is necessary to avoid damage to gauges, andalthough accuracy is reduced, the deflections at this stage will usually be largeand easily measured from a distance. Similarly, cracking and manual strainobservations must be suspended as failure approaches unless special safetyprecautions are taken. If it is essential that precise deflection readings are takenup to collapse, electrical remote reading gauges mounted above the test membermay be necessary.
Modern load testing machines usually give the option of testing members under
Figure 6.18 Laboratory beam load test arrangement.
Copyright 1996 Chapman & Hall
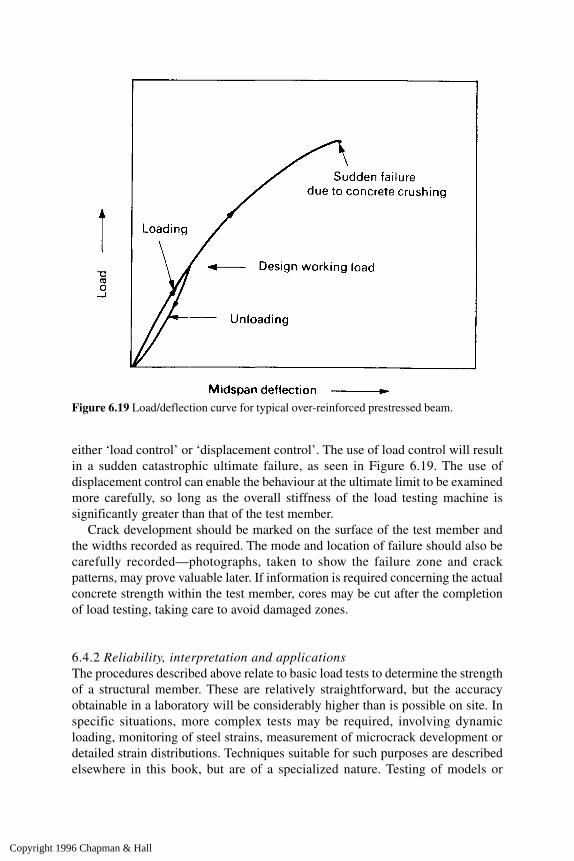
either ‘load control’ or ‘displacement control’. The use of load control will resultin a sudden catastrophic ultimate failure, as seen in Figure 6.19. The use ofdisplacement control can enable the behaviour at the ultimate limit to be examinedmore carefully, so long as the overall stiffness of the load testing machine issignificantly greater than that of the test member.
Crack development should be marked on the surface of the test member andthe widths recorded as required. The mode and location of failure should also becarefully recorded—photographs, taken to show the failure zone and crackpatterns, may prove valuable later. If information is required concerning the actualconcrete strength within the test member, cores may be cut after the completionof load testing, taking care to avoid damaged zones.
6.4.2 Reliability, interpretation and applicationsThe procedures described above relate to basic load tests to determine the strengthof a structural member. These are relatively straightforward, but the accuracyobtainable in a laboratory will be considerably higher than is possible on site. Inspecific situations, more complex tests may be required, involving dynamicloading, monitoring of steel strains, measurement of microcrack development ordetailed strain distributions. Techniques suitable for such purposes are describedelsewhere in this book, but are of a specialized nature. Testing of models or
Figure 6.19 Load/deflection curve for typical over-reinforced prestressed beam.
Copyright 1996 Chapman & Hall

prototypes will also employ many of the techniques described but is regarded asbeing outside the scope of this book.
In most cases the results of load tests will be compared directly with strengthsrequired by calculations, and serviceability limits required by specifications. Thelinear part of the load/deflection curve can be compared with the working loadscarried by the member, and deflections and crack widths also compared withappropriate limits. The collapse load can be used to calculate the moment ofresistance for comparison with required ultimate values. A typical load/deflectionplot for an under-reinforced beam such as is shown in Figure 6.2 can also be usedto determine the flexural stiffness. BS 8110 (140) requires that where tests aremade on new precast units for acceptance purposes, the ultimate strength shouldbe at least 5% greater than the design ultimate load and that the deflection at thisload is less than 1/40 of the span.
Calculation of the collapse moment of resistance on the basis of tests onmaterials will not always provide a value which agrees closely with a measuredvalue, as illustrated by Figure 6.20, which shows measured collapse loads for aseries of pretensioned beams compared with predicted values calculated from
Figure 6.20 Measured vs. calculated collapse moments for prestressed concrete beams.
Copyright 1996 Chapman & Hall

small core strength estimates from the same beams. For over-reinforced beams,the dependence of collapse moment on concrete strength is likely to be greater(Figure 6.19). Particular care must be taken when testing over-reinforced beamsunless displacement control is used as discussed above because of the suddennature of failure, which often provides little warning from increasing deflections.
A test to destruction is obviously the most reliable method of assessing thestrength of a concrete member, but the practical value of tests on members fromexisting structures depends upon the representativeness of the member tested.Visual and non-destructive methods may be used for comparisons, but uncertaintywill always remain. The most likely application, apart from quality controlchecking of precast concrete, will be where a large number of similar units are thesubject of doubt. The sacrifice of some of these may be justified in relation to thepotential cost of remedial works.
Copyright 1996 Chapman & Hall
7 Durability tests
Deterioration of structural concrete may be caused either by chemical and physicalenvironmental effects upon the concrete itself, or by damage resulting from thecorrosion of embedded steel. The tests described in this chapter are concernedprimarily with assessment of material characteristics which are likely to influencethe resistance to such deterioration, and to assist identification of the cause andextent if it should occur. These tests have been summarized in Table 1.3, althoughthose involving chemical or petrographic analysis (including carbonation depth,and sulphate and chloride content) are considered in detail in Chapter 9. Otherrelevant tests relating to structural integrity and performance are described inChapter 8, and test selection is discussed in section 1.4.3 of Chapter 1.
The principal causes of degradation of the concrete are sulphate attack,alkali-aggregate reaction, freeze-thaw, abrasion and fire. Reinforcementcorrosion is an electro-chemical process requiring the presence of moisture andoxygen and can only occur when the passifying influence of the alkaline porefluids in the matrix surrounding the steel has been destroyed, most commonlyby carbonation or chlorides (150). The presence of moisture and its ability toenter and move through the concrete are thus critical features since bothsulphates and chlorides require moisture for mobility and alkali-aggregatereactions cannot occur in dry concrete. Carbonation rates depend on gaspermeability and are also influenced by moisture levels. Tests which assesswater and gas absorption or permeability, and moisture content, are thus of greatimportance with respect to durability. Planning and interpretation of a typicalcorrosion-related investigation are outlined in Appendix A7.
7.1 Corrosion of reinforcement and prestressing steel
Corrosion of embedded steel is probably the major cause of deterioration of concretestructures at the present time. This may lead to structural weakening due to loss ofsteel cross-section, surface staining and cracking or spalling. In some instancesinternal delamination may occur. The corrosion process has been described in detailby many authors but is summarized in simple form by Figure 7.1.
This may involve either localized ‘micro-corrosion’ cells in which pitting mayseverely reduce a bar cross-section with little external evidence, or generalized‘macro-corrosion’ cells which are likely to be more disruptive and easier to detectdue to expansion of the rusting steel (151).
Copyright 1996 Chapman & Hall
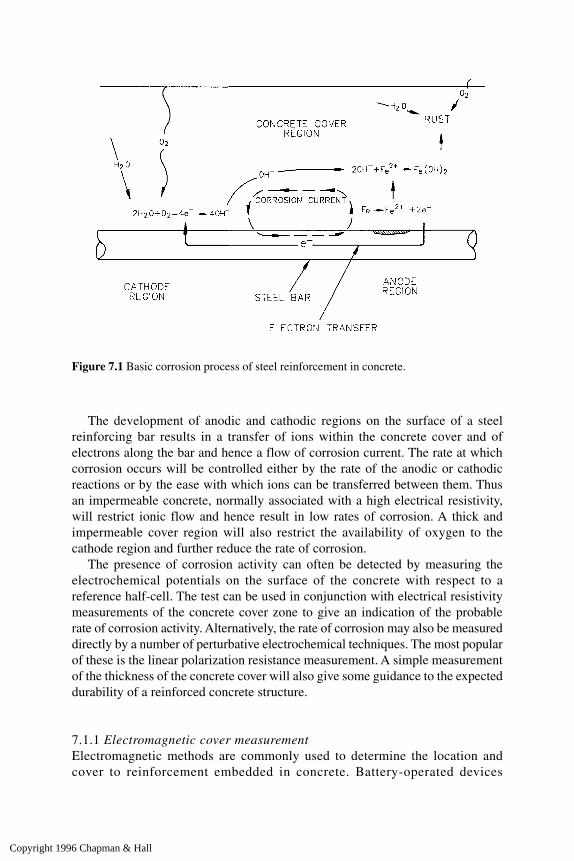
The development of anodic and cathodic regions on the surface of a steelreinforcing bar results in a transfer of ions within the concrete cover and ofelectrons along the bar and hence a flow of corrosion current. The rate at whichcorrosion occurs will be controlled either by the rate of the anodic or cathodicreactions or by the ease with which ions can be transferred between them. Thusan impermeable concrete, normally associated with a high electrical resistivity,will restrict ionic flow and hence result in low rates of corrosion. A thick andimpermeable cover region will also restrict the availability of oxygen to thecathode region and further reduce the rate of corrosion.
The presence of corrosion activity can often be detected by measuring theelectrochemical potentials on the surface of the concrete with respect to areference half-cell. The test can be used in conjunction with electrical resistivitymeasurements of the concrete cover zone to give an indication of the probablerate of corrosion activity. Alternatively, the rate of corrosion may also be measureddirectly by a number of perturbative electrochemical techniques. The most popularof these is the linear polarization resistance measurement. A simple measurementof the thickness of the concrete cover will also give some guidance to the expecteddurability of a reinforced concrete structure.
7.1.1 Electromagnetic cover measurementElectromagnetic methods are commonly used to determine the location andcover to reinforcement embedded in concrete. Battery-operated devices
Figure 7.1 Basic corrosion process of steel reinforcement in concrete.
Copyright 1996 Chapman & Hall

commercially available for this purpose are commonly known as covermeters. Awide range of these is commercially available and their use is covered by BS1881: Part 204 (152).
7.1.1.1 Theory, equipment and calibration. The basic principle is that the presenceof steel affects the field of an electromagnet. This may take the form of an iron-cored inductor of the type shown in Figure 7.2. An alternating current is passedthrough one of the coils, while the current induced in the other is amplified andmeasured. The search head may in fact consist of a single or multiple coil system,with the physical principle involving either eddy current or magnetic inductioneffects. Eddy current instruments involve measurement of impedance changes andwill be affected by any conducting metal, and magnetic induction instrumentsinvolve induced voltage measurements and are less sensitive to non-magneticmaterials.
The influence of steel on the induced current is non-linear in relation to distanceand is also affected by the diameter of the bar, which makes calibration difficult.Commonly used simple types of covermeter (Figure 7.3) overcome this problem byusing two ranges for cover, typically 0–40 mm and 40–100 mm. The calibratedscale is marked in bands associated with varying cover, and this accommodates theinfluence of reinforcement diameter. Small bars will give a reading at the ‘high’ endbut large bars will give a reading at the ‘low’ end of a particular band, because theeffect of diameter is relatively small over the range of bar sizes from 10–32 mm. Ifbars of less than 10mm or greater than 32mm are to be measured, it may benecessary to develop a special calibration, and the linear scale which is usually
Figure 7.2 Typical simple covermeter circuitry.
Copyright 1996 Chapman & Hall
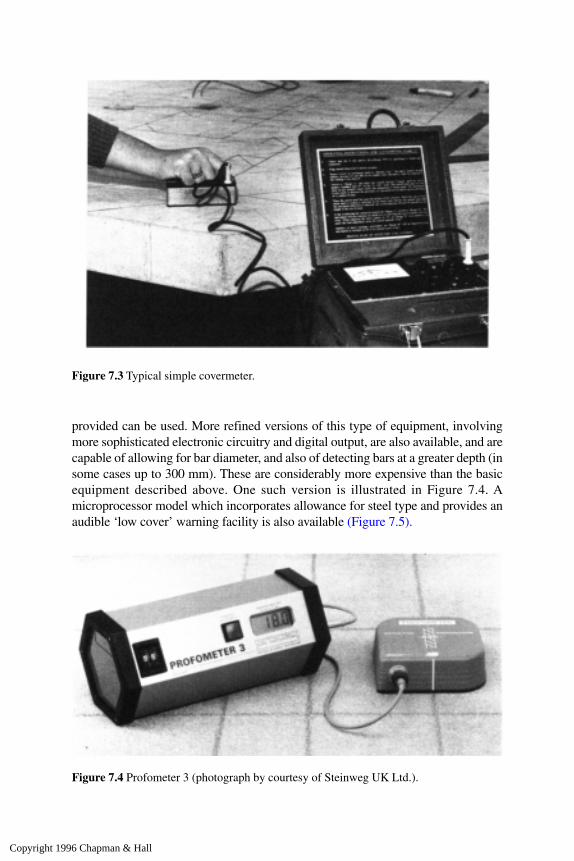
provided can be used. More refined versions of this type of equipment, involvingmore sophisticated electronic circuitry and digital output, are also available, and arecapable of allowing for bar diameter, and also of detecting bars at a greater depth (insome cases up to 300 mm). These are considerably more expensive than the basicequipment described above. One such version is illustrated in Figure 7.4. Amicroprocessor model which incorporates allowance for steel type and provides anaudible ‘low cover’ warning facility is also available (Figure 7.5).
Figure 7.3 Typical simple covermeter.
Figure 7.4 Profometer 3 (photograph by courtesy of Steinweg UK Ltd.).
Copyright 1996 Chapman & Hall
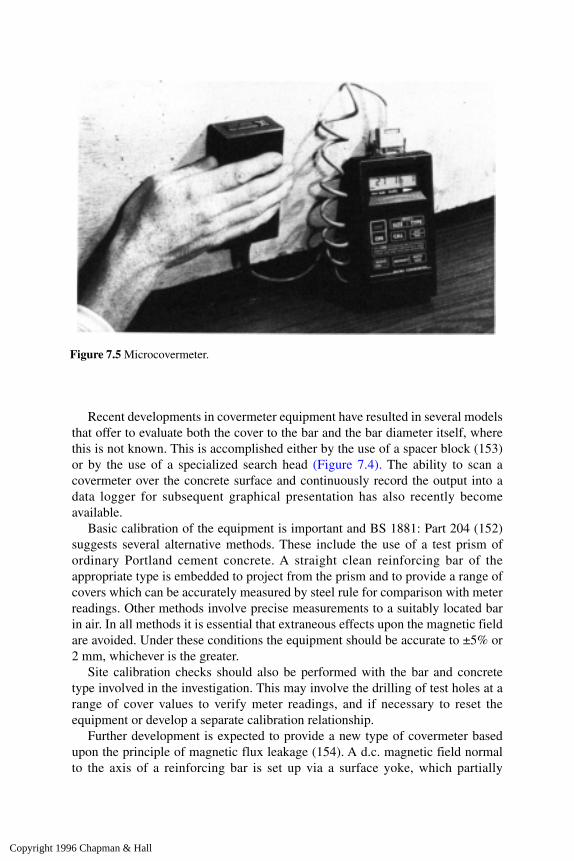
Recent developments in covermeter equipment have resulted in several models
that offer to evaluate both the cover to the bar and the bar diameter itself, wherethis is not known. This is accomplished either by the use of a spacer block (153)or by the use of a specialized search head (Figure 7.4). The ability to scan acovermeter over the concrete surface and continuously record the output into adata logger for subsequent graphical presentation has also recently becomeavailable.
Basic calibration of the equipment is important and BS 1881: Part 204 (152)suggests several alternative methods. These include the use of a test prism ofordinary Portland cement concrete. A straight clean reinforcing bar of theappropriate type is embedded to project from the prism and to provide a range ofcovers which can be accurately measured by steel rule for comparison with meterreadings. Other methods involve precise measurements to a suitably located barin air. In all methods it is essential that extraneous effects upon the magnetic fieldare avoided. Under these conditions the equipment should be accurate to ±5% or2 mm, whichever is the greater.
Site calibration checks should also be performed with the bar and concretetype involved in the investigation. This may involve the drilling of test holes at arange of cover values to verify meter readings, and if necessary to reset theequipment or develop a separate calibration relationship.
Further development is expected to provide a new type of covermeter basedupon the principle of magnetic flux leakage (154). A d.c. magnetic field normalto the axis of a reinforcing bar is set up via a surface yoke, which partially
Figure 7.5 Microcovermeter.
Copyright 1996 Chapman & Hall

magnetizes the bar. A sensor moved from one pole of the yoke to the other detectsthe induced magnetic leakage field, which can be used to determine both the depthand diameter of the bar. Magnetic flux leakage also has the potential to enabledetection of a reduction in the section of the reinforcing bar, such as might becaused by severe pitting corrosion. Efforts are being made to use neural networkartificial intelligence to simplify interpretation of the results.
7.1.1.2 Procedure. Most covermeters consist of a unit containing the powersource, amplifier and meter, and a separate search unit containing theelectromagnet whch is coupled to the main unit by a cable. In use, the readingwill be zeroed and the hand-held search unit moved over the surface of theconcrete under test. The presence of reinforcement within the working range ofthe equipment will be indicated by movement of the indicator needle or digitalvalue. The search unit is then moved and rotated to obtain a maximum readingand this position will correspond to the location of a bar (minimum cover). Withsome instruments this is assisted by a variable-pitch audible output. The needle oroutput will then indicate the cover on the appropriate scale, whilst the direction ofthe bar will be parallel to the alignment of the search unit. The use of spacers mayalso be necessary to improve the accuracy of cover measurements which are lessthan 20 mm.
7.1.1.3 Reliability, limitations and applications. Although the equipment can beaccurately calibrated for specific reinforcement bars (section 7.1.1.1) in mostpractical situations the accuracy that can be achieved will be considerably reduced.The factors most likely to cause this are those which affect the magnetic fieldwithin the range of the meter, and include:
(i) Presence of more than one reinforcing bar. Laps, transverse steel as asecond layer or closely-spaced bars (less than three times the cover) maycause misleading results. With some equipment a small, non-directional‘spot probe’ can be used to improve discrimination between closelyspaced bars and to locate lateral bars.
(ii) Metal tie wires. Where these are present or suspected, readings shouldbe taken at intervals along the line of the reinforcement and averaged.
(iii) Variations in the iron content of the cement, and the use of aggregateswith magnetic properties, may cause reduced covers to be indicated.
(iv) A surface coating of iron oxide on the concrete, resulting from the use ofsteel form work, has been claimed to cause a significant underestimateof the reinforcement cover and should be guarded against.
BS 1881: Part 204 (152) suggests that an average site accuracy at covers less than100mm of about ±15% may be expected, with a maximum of ±5 mm, and it isimportant to remember that the calibrated scales are generally based on medium-
Copyright 1996 Chapman & Hall

sized plain round mild steel bars in Portland cement concrete. If the equipment isto be used in any of the following circumstances a specific recalibration should bemade:
(i) Reinforcement less than 10 mm diameter, high tensile steel or deformedbars. In these cases the indicated cover is likely to be higher than the truevalue. This will also apply if the bars are curved and hence not parallelto the core of the electromagnet.
(ii) Special cements, including high alumina cement, or added pigments. Inthese cases the indicated cover is likely to be lower than the true value.
(iii) Reinforcement in excess of 32 mm diameter may require a recalibrationfor some models of covermeter.
Estimates of bar diameter may only be possible to within two bar sizes. Theoperating temperature range of covermeters is also generally relatively small, andbattery-powered models will not usually function satisfactorily at temperaturesbelow freezing, which may seriously limit their field use in winter. Stability ofreading may be a problem with some types of instrument and frequent zerochecking is essential.
The most reliable application of this method to in-situ reinforcement locationand cover measurement will be for lightly reinforced members. As the complexityand quantity of reinforcement increases, the value of the test decreasesconsiderably (155), and special care should also be taken in areas where theaggregates may have magnetic properties. Malhotra (50) has described anapplication to precast concrete quality checking, in which the linear scale iscalibrated to enable an acceptable range of values to be established for routinecomponent monitoring. Snell, Wallace and Rutledge (156) have also considereddetailed sampling plans for in-situ investigations and developed a statisticalmethodology for such situations. Alldred (157) has compared a number ofdifferent covermeters on congested steel reinforcement and gives some correctionfactors that may be used to accommodate errors of measurement.
7.1.2 Half-cell potential measurementThis method has been developed and widely used with success in recent yearswhere reinforcement corrosion is suspected, and normally involves measuring thepotential of embedded reinforcing steel relative to a reference half-cell placed onthe concrete surface as shown in Figure 7.6. ASTM C876 (158) covers thismethod.
7.1.2.1 Theory, equipment and procedures. The reference half-cell is usually acopper/copper sulphate or silver/silver chloride cell but other combinations havebeen used (159). Different types of cell will produce different values of surfacepotential and corrections of results to an appropriate standardized cell may be
Copyright 1996 Chapman & Hall

necessary during interpretation. The concrete functions as an electrolyte andanodic, corroding regions of steel reinforcement in the immediate vicinity of thetest point may be related empirically to the potential difference measured by thehigh-impedance voltmeter.
It is usually necessary to break away the concrete cover to enable electricalcontact to be made with the steel reinforcement. This connection is critical and aself-tapping screw is recommended, but adequate electrical continuity is usuallypresent within a mesh or cage of reinforcement to avoid the need for repeatedconnections (160). Some surface preparation, including wetting, is also likely tobe necessary to ensure good electrical contact. Two-cell methods, avoiding theneed for electrical connections to reinforcement can be used for comparativetesting (159), but are regarded as less reliable.
The basic equipment is very simple and permits a non-destructive survey ofthe surface of a concrete member to produce iso-potential contour maps asillustrated by Figure 7.7.
A range of commercially available equipment is available including digitalsingle-reading devices (161) (Figure 7.8), as well as ‘multi-cell’ and ‘wheel’devices (Figure 7.9) with automatic data logging and printout facilities designedto permit large areas to be tested quickly and economically (162).
7.1.2.2 Reliability, limitations and applications. Early studies on half-cellpotentials (163) were primarily concerned with elevated bridge decks in theUSA, where unwaterproofed concrete was treated every winter with largequantities of deicing salts. In conditions where there is a plentiful availability of
Figure 7.6 Reinforcement potential measurement.
Copyright 1996 Chapman & Hall
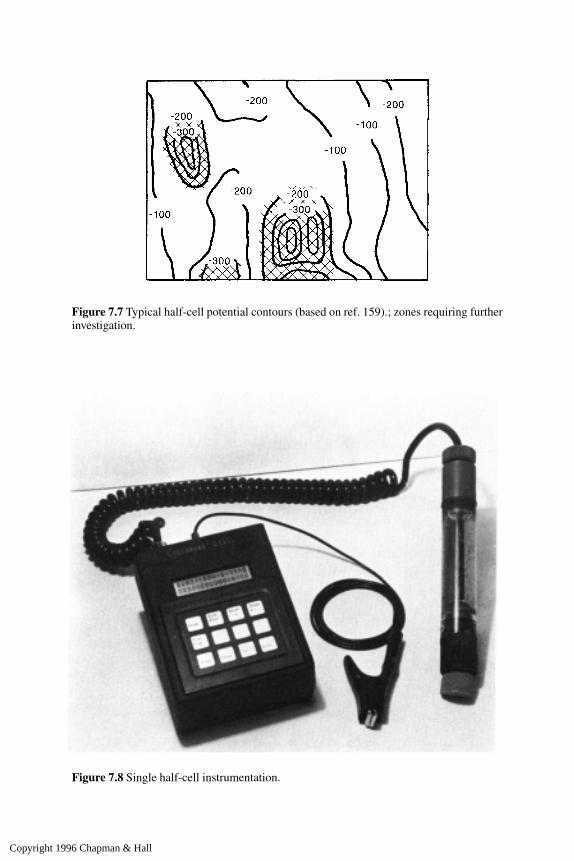
Figure 7.7 Typical half-cell potential contours (based on ref. 159).; zones requiring furtherinvestigation.
Figure 7.8 Single half-cell instrumentation.
Copyright 1996 Chapman & Hall
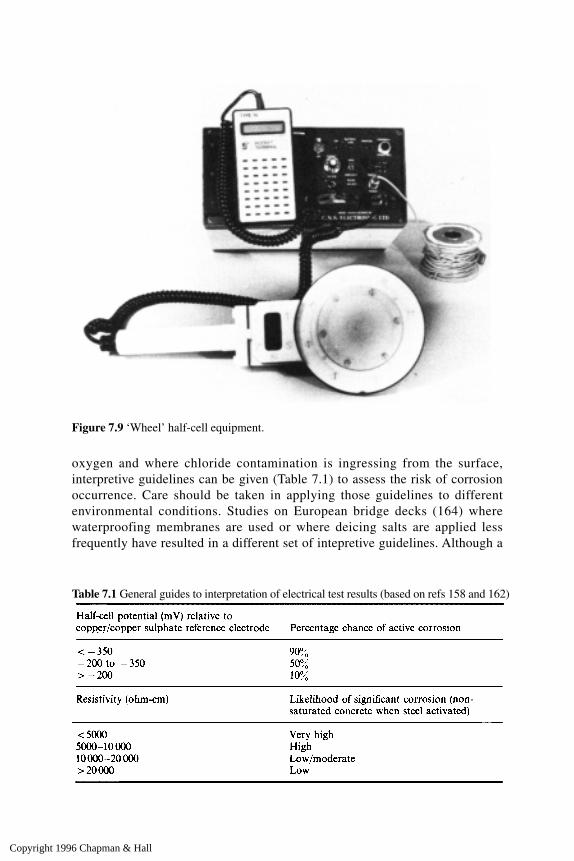
oxygen and where chloride contamination is ingressing from the surface,interpretive guidelines can be given (Table 7.1) to assess the risk of corrosionoccurrence. Care should be taken in applying those guidelines to differentenvironmental conditions. Studies on European bridge decks (164) wherewaterproofing membranes are used or where deicing salts are applied lessfrequently have resulted in a different set of intepretive guidelines. Although a
Figure 7.9 ‘Wheel’ half-cell equipment.
Table 7.1 General guides to interpretation of electrical test results (based on refs 158 and 162)
Copyright 1996 Chapman & Hall
wet contact is needed between the half-cell and the concrete, a complete wettingof the concrete surface can cause significantly more negative potential resultsby up to 200 mV (160,165), whilst completely water-saturated concrete can leadto oxygen starvation, resulting in potential values more negative than -700mV(166).
Studies on carbonated concrete have shown (167) that corrosion is typicallyassociated with half-cell potential readings in the range -200 mV to -500 mV butwith considerably more shallow potential gradients than seen with externalchloride contamination.
Where chlorides are present in the concrete, due to the use of calcium chlorideaccelerator in the original mix, corrosion is typically associated with half-cellpotential readings in the range +100mV to -400mV (167), with often a verynarrow range of potentials separating rapidly corroding and, apparently,uncorroding areas. Half-cell potential gradients are frequently shallow, due to theclose proximity of adjacent corrosion ‘micro-cells’ on the surface of the steelreinforcement.
In the light of these conflicting interpretive criteria, it is now morecommon not to use absolute potential values as a means of assessing theprobability of corrosion occurrence. The plotting of iso-potential contourmaps such as in Figure 7.7 is preferred. Local corrosion risk is identified by‘islands’ of more negative, anodic regions and by steep potential gradients,seen by closely spaced iso-potential lines. Regions which are more negativethan 200 mV from the ‘background potential’ are often indicative ofcorrosion activity (160).
In carrying out a potential survey, an initial grid of 0.5 m to 1 m is commonlyused to sample the surface potentials. In regions of particular interest or wheremicro-cell corrosion activity is suspected, a grid as fine as 0.1 m may be used. It isessential to recognize that the half-cell method cannot indicate the actual corrosionrate or even whether corrosion has already commenced. The test only indicateszones requiring further investigation, and an assessment of the likelihood ofcorrosion occurring may be improved by resistivity measurements in theseregions.
This method is widely used when assessing maintenance and repairrequirements. It is particularly valuable in comparatively locating regions in whichcorrosion may cause future difficulties, and those in which it has already occurredbut with no visible evidence at the surface. It can also often be of use to confirmthat passivity has been restored following remediation to a corrosion-damagedreinforced concrete structure.
7.1.3 Resistivity measurementsThe ability of corrosion currents to flow through the concrete can be assessed interms of the electrolytic resistivity of the material. Procedures for in-situ
Copyright 1996 Chapman & Hall
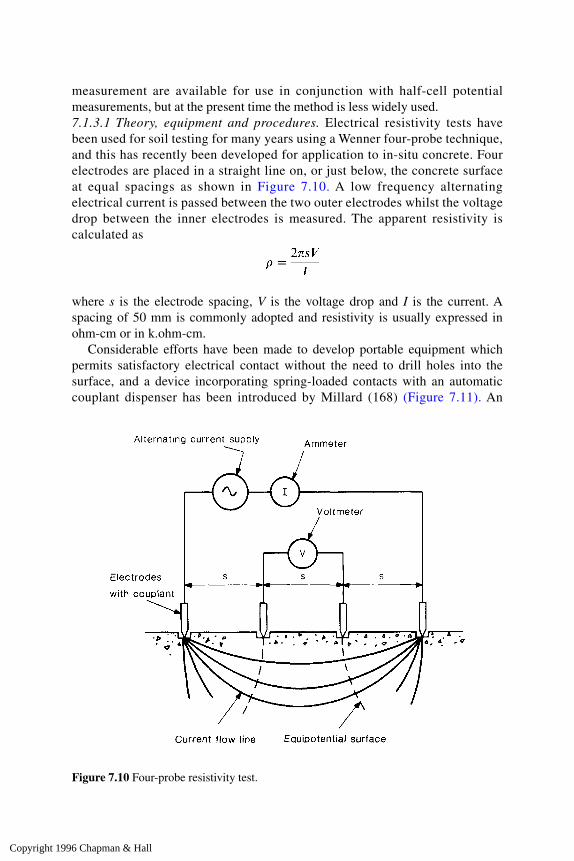
measurement are available for use in conjunction with half-cell potentialmeasurements, but at the present time the method is less widely used.7.1.3.1 Theory, equipment and procedures. Electrical resistivity tests havebeen used for soil testing for many years using a Wenner four-probe technique,and this has recently been developed for application to in-situ concrete. Fourelectrodes are placed in a straight line on, or just below, the concrete surfaceat equal spacings as shown in Figure 7.10. A low frequency alternatingelectrical current is passed between the two outer electrodes whilst the voltagedrop between the inner electrodes is measured. The apparent resistivity iscalculated as
where s is the electrode spacing, V is the voltage drop and I is the current. Aspacing of 50 mm is commonly adopted and resistivity is usually expressed inohm-cm or in k.ohm-cm.
Considerable efforts have been made to develop portable equipment whichpermits satisfactory electrical contact without the need to drill holes into thesurface, and a device incorporating spring-loaded contacts with an automaticcouplant dispenser has been introduced by Millard (168) (Figure 7.11). An
Figure 7.10 Four-probe resistivity test.
Copyright 1996 Chapman & Hall
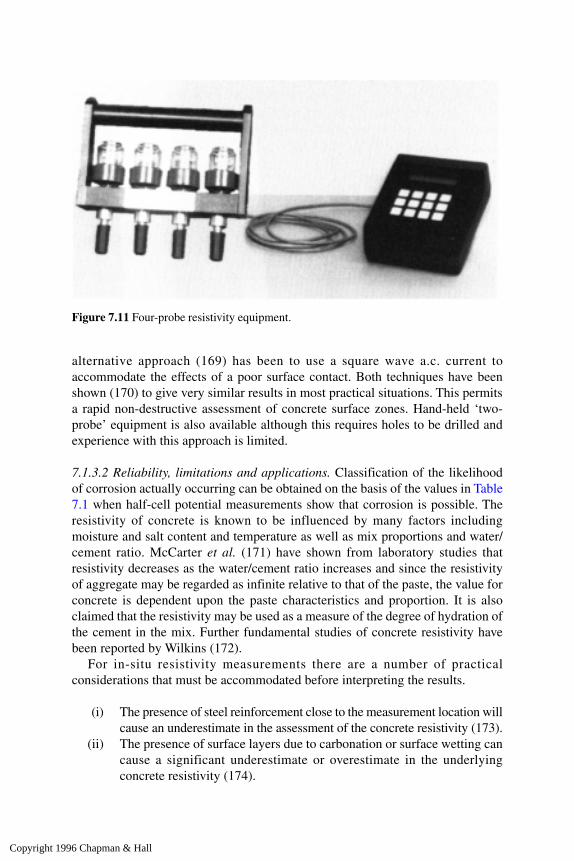
alternative approach (169) has been to use a square wave a.c. current toaccommodate the effects of a poor surface contact. Both techniques have beenshown (170) to give very similar results in most practical situations. This permitsa rapid non-destructive assessment of concrete surface zones. Hand-held ‘two-probe’ equipment is also available although this requires holes to be drilled andexperience with this approach is limited.
7.1.3.2 Reliability, limitations and applications. Classification of the likelihoodof corrosion actually occurring can be obtained on the basis of the values in Table7.1 when half-cell potential measurements show that corrosion is possible. Theresistivity of concrete is known to be influenced by many factors includingmoisture and salt content and temperature as well as mix proportions and water/cement ratio. McCarter et al. (171) have shown from laboratory studies thatresistivity decreases as the water/cement ratio increases and since the resistivityof aggregate may be regarded as infinite relative to that of the paste, the value forconcrete is dependent upon the paste characteristics and proportion. It is alsoclaimed that the resistivity may be used as a measure of the degree of hydration ofthe cement in the mix. Further fundamental studies of concrete resistivity havebeen reported by Wilkins (172).
For in-situ resistivity measurements there are a number of practicalconsiderations that must be accommodated before interpreting the results.
(i) The presence of steel reinforcement close to the measurement location willcause an underestimate in the assessment of the concrete resistivity (173).
(ii) The presence of surface layers due to carbonation or surface wetting cancause a significant underestimate or overestimate in the underlyingconcrete resistivity (174).
Figure 7.11 Four-probe resistivity equipment.
Copyright 1996 Chapman & Hall

(iii) Taking resistivity measurements on a very small member section orclose to a section edge may result in an overestimate of the actualresistivity (175).
(iv) Resistivity measurements will fluctuate with changes in ambienttemperature and with rainfall. In external conditions in the UK, whereconcrete is normally moist, temperature is found to be the more dominantparameter (176).
Some efforts have been made (177, 178) to relate half-cell potential and resistivitymeasurements to rates of corrosion through computer modelling, but this approachhas not yet seen significant practical usage.
Although the principal application is for assessment of maintenance and repairrequirements in conjunction with half-cell potential measurements, the techniquemay be applied on a larger scale with greater spacings to estimate highway pavementthicknesses. Moore (179) has described US Federal Highway Administration workbased on the differing resistivity characteristics of pavement concrete and subgrade.Electrode spacings are varied and a change of slope of the resistivity/spacing plotwill occur as a proportion of the current flows through the base material.
7.1.4 Perturbative measurement of corrosion rateA number of perturbative electrochemical techniques have been developed todetermine directly the rate of corrosion by measuring the response of the corrosioninterface to a small perturbation. The principal methods are:
(i) Linear polarization resistance measurement.(ii) Galvanostatic pulse transient response measurement,
(iii) AC impedance analysis,(iv) AC harmonic analysis.
These methods have been very little tried in the field to date in the UK, althoughlinear polarization has seen some limited usage in the rest of Europe (180,181)and in the USA (182) and the galvanostatic pulse method has been applied tosome European bridges (183, 184).
Linear polarization resistance measurement is carried out by applying a smallelectrochemical perturbation to the steel reinforcement via an auxiliary electrodeplaced on the surface of the concrete (Figure 7.12). The perturbance is often a smalld.c. potential change, ∆E, to the half-cell potential of the steel in the range ±20 mV.From a meaurement of the resulting current, ∆I, after a suitable equilibration time,typically 30 seconds to 2 minutes, the polarization resistance, Rp, is obtained, where
Rp=∆E/∆I
Rp is inversely related to the corrosion current, Icorr, flowing between anodicand cathodic regions on the surface of the steel bar. Hence
Icorr=B/Rp,
Copyright 1996 Chapman & Hall
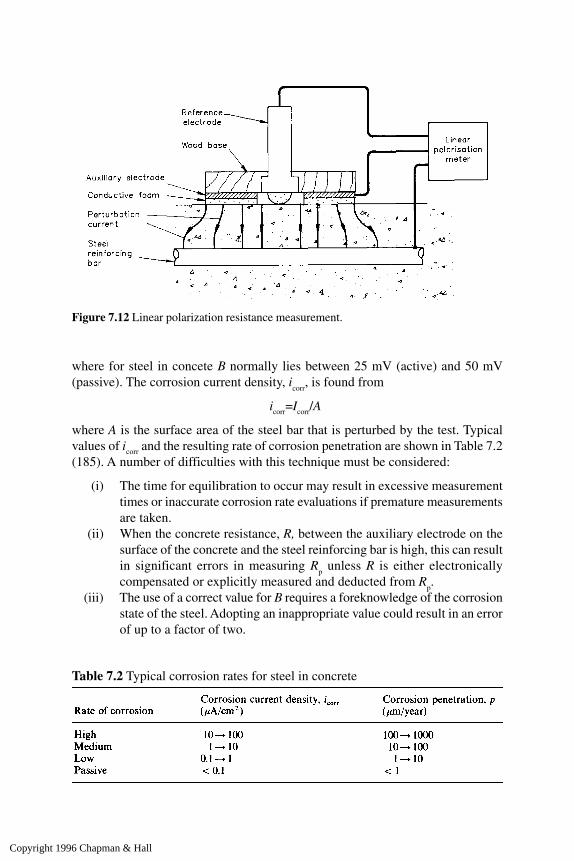
where for steel in concete B normally lies between 25 mV (active) and 50 mV(passive). The corrosion current density, i
corr, is found from
icorr=Icorr/A
where A is the surface area of the steel bar that is perturbed by the test. Typicalvalues of icorr and the resulting rate of corrosion penetration are shown in Table 7.2(185). A number of difficulties with this technique must be considered:
(i) The time for equilibration to occur may result in excessive measurementtimes or inaccurate corrosion rate evaluations if premature measurementsare taken.
(ii) When the concrete resistance, R, between the auxiliary electrode on thesurface of the concrete and the steel reinforcing bar is high, this can resultin significant errors in measuring R
p unless R is either electronically
compensated or explicitly measured and deducted from Rp.
(iii) The use of a correct value for B requires a foreknowledge of the corrosionstate of the steel. Adopting an inappropriate value could result in an errorof up to a factor of two.
Figure 7.12 Linear polarization resistance measurement.
Table 7.2 Typical corrosion rates for steel in concrete
Copyright 1996 Chapman & Hall
(iv) It is tacitly assumed that corrosion occurs uniformly over themeasurement area, A. Where localized pitting occurs then thisassumption could result in a significant underestimate of the localizedrate of corrosion.
(v) Evaluating the area of measurement A is not simple. Some studies (186)recommend using a large (250 mm diameter) auxiliary electrode andassume that the surface area of measurement is the ‘shadow area’ of steelreinforcement lying directly beneath the auxiliary electrode. An alternativeapproach (187) is to accept that the perturbation current will try to spreadlaterally to steel lying outside the shadow area and to confine this lateralspread by use of a guard ring positioned around the auxiliary electrode.Both techniques show considerable promise in the field, but the accuracyof each approach has yet to be independently verified.
(vi) Corrosion rates measured on one occasion may not be typical of themean annual rate of corrosion. Fluctuations in ambient temperature,moisture levels in the concrete, oxygen availability, etc. may all causethe instantaneous corrosion rate to vary significantly. Only by taking aseries of measurements under different environmental conditions can anoverall evaluation of the annual rate of corrosion be made.
The galvanostatic pulse transient response method uses a surface electrodearrangement similar to the linear polarization method (Figure 7.12). A smallcurrent perturbation, ∆I, is applied to the steel reinforcing bar and the resultingshift in the half-cell potential, ∆E, is measured. The transient behaviour of ∆E canbe used to evaluate the concrete resistance, R, and to evaluate the rate of corrosion,I
corr (188). Equipment specifically designed for field application of the
galvanostatic pulse transient response method has not yet been commerciallydeveloped but the technique holds considerable promise.
Both the a.c. impedance and the a.c. harmonic analysis techniques arelaboratory perturbative electrochemical methods that can evaluate theinstantaneous rate of corrosion. However, neither of these methods has seenthe field developments that have been applied to the linear polarization andgalvanostatic pulse transient response techniques. Their complexity makes itless likely that they will ever be used in the field for routine corrosionmeasurements.
7.1.5 Other electrical techniquesSome studies (189) have related small fluctuations (0.1 to 10 mV) in the half-cellpotential of the reinforcing steel to the spontaneous formation and repassivationof corrosion anodes. These fluctuations are called ‘potential noise’ and can berelated to the rate of corrosion. This technique looks promising but has yet to seeextensive use in the field.
A method of embedding a series of mild steel samples at increasing depth has
Copyright 1996 Chapman & Hall

been used (190) to monitor the ingress of carbonation or chlorides and to evaluatethe influence upon the rate of corrosion. Effective use of this technique requireseither planning before construction of the structure or subsequent embedding intoa void cut into the hardened concrete. The latter technique may place the sensorsin an environment unrepresentative of the rest of the structure and care should beused in implementing this approach.
7.2 Moisture measurement
Measurement of the internal moisture content in concrete is surprisingly difficult,but nevertheless of considerable importance when assessing durabilityperformance. Alkali-aggregate reactions are moisture dependent whilst the effectof moisture conditions upon the interpretation of resistivity, absorption andpermeability test results is critical. The techniques described below permitquantitative assessments of varying accuracy, and other methods described inChapter 8 such as infra-red thermography and short wave radar may detectmoisture variations on a comparative basis.
7.2.1 Simple methodsOne simple approach that is often adopted is to measure the moisture content, byoven drying and weighing, of a small timber insert or mortar prism (191) whichhas been sealed into a surface-drilled hole. The insert must be left in the sealedhole for sufficient time to reach moisture equilibrium with the surroundingconcrete. A chemically based disposable humidity meter is also available fromDenmark (192) which is inserted into a surface-drilled hole. Little publishedevidence concerning its reliability is however currently available.
7.2.2 Neutron moisture gaugesThese work on the principle that hydrogen rapidly decreases the energy of ‘fast’or high-energy neutrons. Hydrogen is present in water in the concrete, and if theretarded or scattered neutrons resulting from interaction of ‘fast’ neutrons with amatrix containing hydrogen are counted, the hydrogen, and hence moisturecontent, can be assessed. The most commonly used sources produce neutronsindirectly by the interaction of a-particles generated by the decay of an X-rayemitting isotope, such as radium, with beryllium.
Although instruments are commercially available that could be used to determinethe moisture content of concrete, these are normally calibrated for a sample of semi-infinite volume and uniform moisture content. Since they operate on the basis ofmeasurement of backscatter of the neutrons (see section 8.4.3), results will onlyrelate to a surface zone not exceeding 65 mm to 90 mm deep (according toequipment used). Further sources of inaccuracy in this approach will be moisturegradients near to the surface and the presence of neutron absorbers.
Calibration is not simple and accuracy generally improves with increasing
Copyright 1996 Chapman & Hall
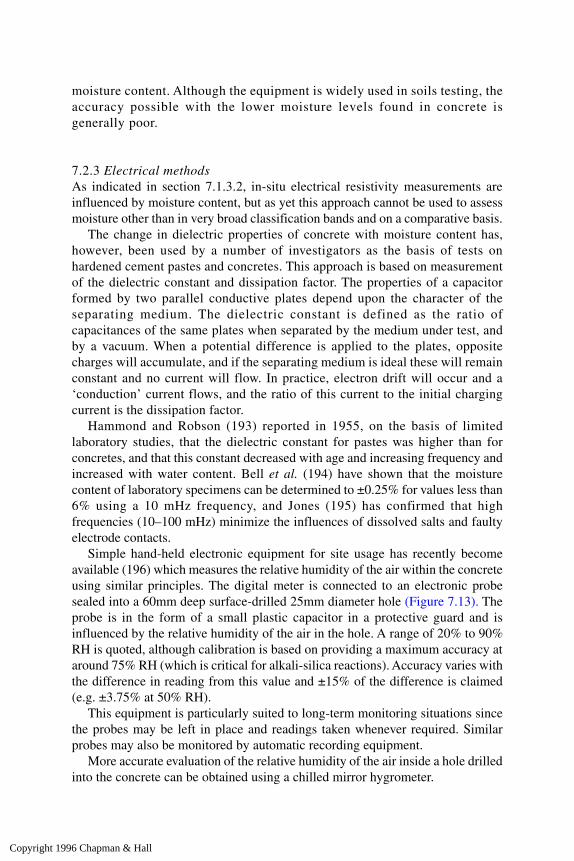
moisture content. Although the equipment is widely used in soils testing, theaccuracy possible with the lower moisture levels found in concrete isgenerally poor.
7.2.3 Electrical methodsAs indicated in section 7.1.3.2, in-situ electrical resistivity measurements areinfluenced by moisture content, but as yet this approach cannot be used to assessmoisture other than in very broad classification bands and on a comparative basis.
The change in dielectric properties of concrete with moisture content has,however, been used by a number of investigators as the basis of tests onhardened cement pastes and concretes. This approach is based on measurementof the dielectric constant and dissipation factor. The properties of a capacitorformed by two parallel conductive plates depend upon the character of theseparating medium. The dielectric constant is defined as the ratio ofcapacitances of the same plates when separated by the medium under test, andby a vacuum. When a potential difference is applied to the plates, oppositecharges will accumulate, and if the separating medium is ideal these will remainconstant and no current will flow. In practice, electron drift will occur and a‘conduction’ current flows, and the ratio of this current to the initial chargingcurrent is the dissipation factor.
Hammond and Robson (193) reported in 1955, on the basis of limitedlaboratory studies, that the dielectric constant for pastes was higher than forconcretes, and that this constant decreased with age and increasing frequency andincreased with water content. Bell et al. (194) have shown that the moisturecontent of laboratory specimens can be determined to ±0.25% for values less than6% using a 10 mHz frequency, and Jones (195) has confirmed that highfrequencies (10–100 mHz) minimize the influences of dissolved salts and faultyelectrode contacts.
Simple hand-held electronic equipment for site usage has recently becomeavailable (196) which measures the relative humidity of the air within the concreteusing similar principles. The digital meter is connected to an electronic probesealed into a 60mm deep surface-drilled 25mm diameter hole (Figure 7.13). Theprobe is in the form of a small plastic capacitor in a protective guard and isinfluenced by the relative humidity of the air in the hole. A range of 20% to 90%RH is quoted, although calibration is based on providing a maximum accuracy ataround 75% RH (which is critical for alkali-silica reactions). Accuracy varies withthe difference in reading from this value and ±15% of the difference is claimed(e.g. ±3.75% at 50% RH).
This equipment is particularly suited to long-term monitoring situations sincethe probes may be left in place and readings taken whenever required. Similarprobes may also be monitored by automatic recording equipment.
More accurate evaluation of the relative humidity of the air inside a hole drilledinto the concrete can be obtained using a chilled mirror hygrometer.
Copyright 1996 Chapman & Hall
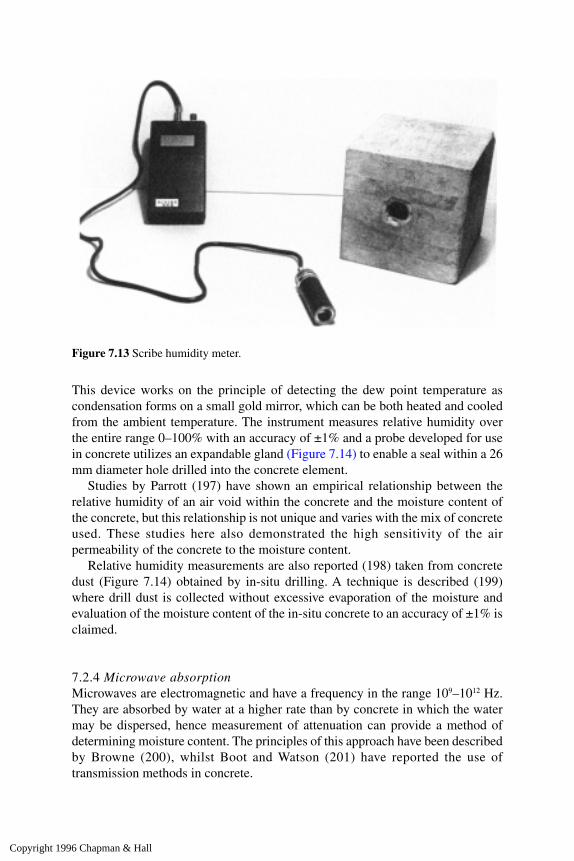
This device works on the principle of detecting the dew point temperature ascondensation forms on a small gold mirror, which can be both heated and cooledfrom the ambient temperature. The instrument measures relative humidity overthe entire range 0–100% with an accuracy of ±1% and a probe developed for usein concrete utilizes an expandable gland (Figure 7.14) to enable a seal within a 26mm diameter hole drilled into the concrete element.
Studies by Parrott (197) have shown an empirical relationship between therelative humidity of an air void within the concrete and the moisture content ofthe concrete, but this relationship is not unique and varies with the mix of concreteused. These studies here also demonstrated the high sensitivity of the airpermeability of the concrete to the moisture content.
Relative humidity measurements are also reported (198) taken from concretedust (Figure 7.14) obtained by in-situ drilling. A technique is described (199)where drill dust is collected without excessive evaporation of the moisture andevaluation of the moisture content of the in-situ concrete to an accuracy of ±1% isclaimed.
7.2.4 Microwave absorptionMicrowaves are electromagnetic and have a frequency in the range 109–1012 Hz.They are absorbed by water at a higher rate than by concrete in which the watermay be dispersed, hence measurement of attenuation can provide a method ofdetermining moisture content. The principles of this approach have been describedby Browne (200), whilst Boot and Watson (201) have reported the use oftransmission methods in concrete.
Figure 7.13 Scribe humidity meter.
Copyright 1996 Chapman & Hall
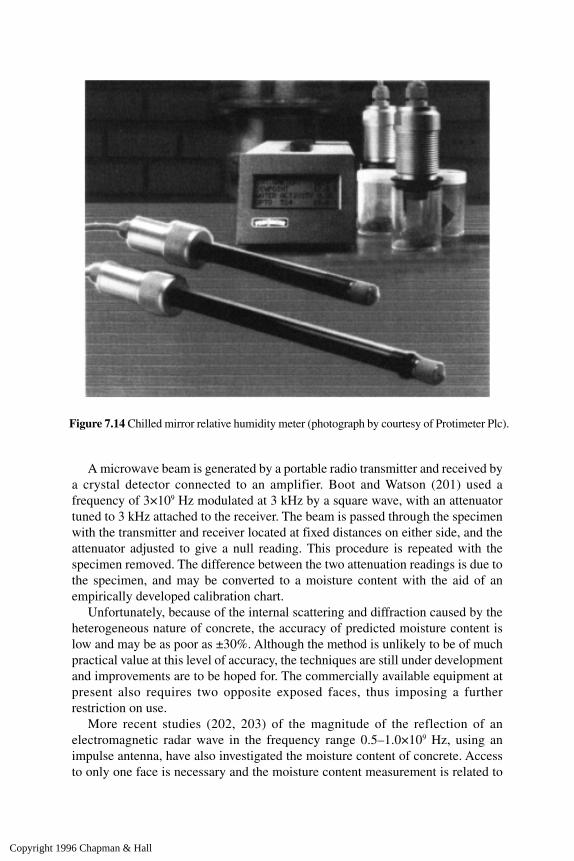
A microwave beam is generated by a portable radio transmitter and received bya crystal detector connected to an amplifier. Boot and Watson (201) used afrequency of 3×10⁹ Hz modulated at 3 kHz by a square wave, with an attenuatortuned to 3 kHz attached to the receiver. The beam is passed through the specimenwith the transmitter and receiver located at fixed distances on either side, and theattenuator adjusted to give a null reading. This procedure is repeated with thespecimen removed. The difference between the two attenuation readings is due tothe specimen, and may be converted to a moisture content with the aid of anempirically developed calibration chart.
Unfortunately, because of the internal scattering and diffraction caused by theheterogeneous nature of concrete, the accuracy of predicted moisture content islow and may be as poor as ±30%. Although the method is unlikely to be of muchpractical value at this level of accuracy, the techniques are still under developmentand improvements are to be hoped for. The commercially available equipment atpresent also requires two opposite exposed faces, thus imposing a furtherrestriction on use.
More recent studies (202, 203) of the magnitude of the reflection of anelectromagnetic radar wave in the frequency range 0.5–1.0×10⁹ Hz, using animpulse antenna, have also investigated the moisture content of concrete. Accessto only one face is necessary and the moisture content measurement is related to
Figure 7.14 Chilled mirror relative humidity meter (photograph by courtesy of Protimeter Plc).
Copyright 1996 Chapman & Hall

the surface zone of concrete. Electromagnetic radiation is also used to detectsimilar thicknesses, reinforcing bars and voids. A fuller description of this is givenin Chapter 8.
Figg (204) has described the use of a microwave moisture meter of 2450 MHzfrequency on sections sawn from commercially-produced precast cladding panels.These were constructed from flint and limestone aggregate concretes with anexposed aggregate finish on one face. The tests confirmed a linear relationshipbetween microwave attenuation and percentage of absorbed water, but with a slopewhich varies with different types of concrete. Prior preparation of a specificcalibration chart is therefore necessary to permit an absolute value of moisturecontent to be obtained in a practical situation. A further limitation to practical usewas also indicated by anomalous results obtained during freezing weather.
7.3 Absorption and permeability tests
These properties are particularly important in concrete used for water-retainingstructures or watertight basements, as well as being critical for durability. Testsare available for assessing water absorption as well as gas and water permeability.Considerable attention has been paid to this area recently and the topic is coveredcomprehensively in the Concrete Society Technical Report 31 (205) and byBasheer (206) which both review a wide range of testing techniques andfundamental theory. Only a selection of these test methods is included in thischapter.
The terms permeability and porosity are often used as though their meaningswere synonymous. Porous concrete is often permeable and vice-versa. However,the term porosity is a volume property that relates the volume of the pores to thetotal volume. Unless the pores are interconnected (Figure 7.15) the material willnot be permeable. The term permeability normally relates to the ease with whicha fluid will pass through a material under a pressure gradient, but is also used todescribe capillary, diffusion, adsorption and absorption processes (205).
The mechanism of water transport through an interconnected pore system isschematically shown in Figure 7.16, where a single pore has restrictions on eachside. Under dry conditions the principal mechanism is molecular adsorption tothe sides of the pores (stage a). Once the pore walls have reached their adsorptionlimits (stage b), water vapour will diffuse across the pore. Under moistureconditions the restrictions to the pore inlet and outlet become blocked with water(stage c) and further water movement must involve a transfer across this film. Atmuch higher moisture levels (stages d to f) water is transported by liquid flowthrough the pore.
Ionic diffusion occurs as a result of a concentration gradient rather than apressure gradient and will occur through the liquid contained in partially or fullysaturated pores (stage g).
Copyright 1996 Chapman & Hall
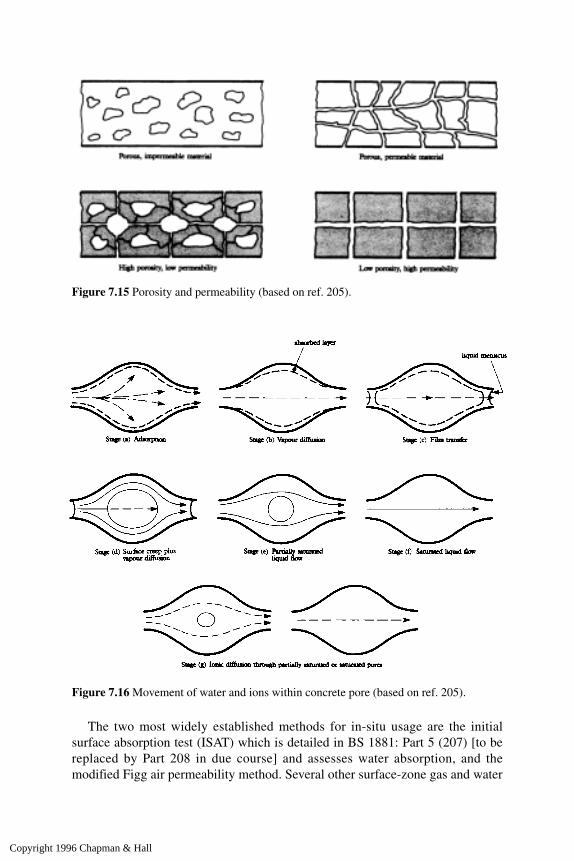
The two most widely established methods for in-situ usage are the initialsurface absorption test (ISAT) which is detailed in BS 1881: Part 5 (207) [to bereplaced by Part 208 in due course] and assesses water absorption, and themodified Figg air permeability method. Several other surface-zone gas and water
Figure 7.15 Porosity and permeability (based on ref. 205).
Figure 7.16 Movement of water and ions within concrete pore (based on ref. 205).
Copyright 1996 Chapman & Hall

permeability methods (often similar) are available, but reported experience islimited. These include the ‘cover concrete permeability tester’ (13) developed bythe British Cement Association, which is based on the time for air pressure in adrilled cavity to dissipate and also incorporates relative humidity measurementfor incorporation into interpretation. The initial surface absorption method wasoriginally devised for testing precast concrete products, and presents somepractical difficulties in use on site. Although the Figg method was developed forsite use, and is growing in popularity, reported field experience is not extensive.In all cases emphasis must be on comparative rather than quantitative application,and results only relate to surface-zone properties. It must be recognized, however,that this is the critical region as far as durability performance is concerned.
Laboratory specimens may be tested to measure water flow, and it is possiblethat suitably prepared samples taken from site may give useful results, althoughthere is no standard procedure available for this approach.
Absorption by an immersed core is also covered by BS 1881: Part 122 (208)but this is again directed towards control testing of precast components.Observation of the rate of penetration of moisture from one wetted surface maybe valuable as a comparative test in the laboratory, and some applications of thisare outlined below.
Generalized relationships between results of some of the more common testmethods are summarized in Table 7.3 (205, 209).
Further, more detailed guidance concerning the application of test results isgiven by the Concrete Society (205), but the interpretation of site results ishampered by the major influence of existing moisture conditions. Many of thesetests are nevertheless used very successfully under laboratory conditions forassessing the characteristics of differing concrete types, constituents, and curingtreatments.
Table 7.3 General relationship between permeability and absorption testresults on dry concrete (205, 209)
Note: See ref. 205 for details of calculation of water and gas coefficient ofpermeability from ‘intrinsic permeability’ k. Approximate values for water at20°C K
w=9.75×10⁶ k m/s, air at 20°C K
g=6.5×10⁵ k m/s.
Copyright 1996 Chapman & Hall
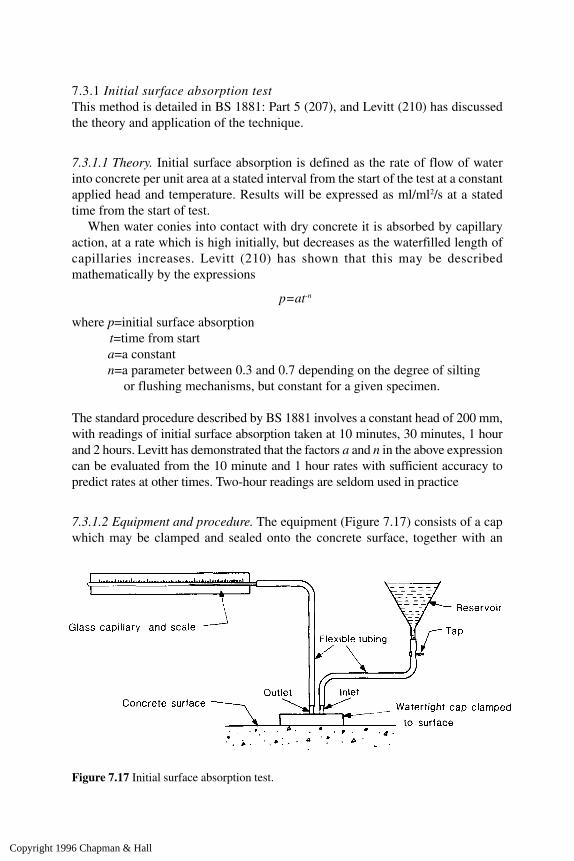
7.3.1 Initial surface absorption testThis method is detailed in BS 1881: Part 5 (207), and Levitt (210) has discussedthe theory and application of the technique.
7.3.1.1 Theory. Initial surface absorption is defined as the rate of flow of waterinto concrete per unit area at a stated interval from the start of the test at a constantapplied head and temperature. Results will be expressed as ml/ml2/s at a statedtime from the start of test.
When water conies into contact with dry concrete it is absorbed by capillaryaction, at a rate which is high initially, but decreases as the waterfilled length ofcapillaries increases. Levitt (210) has shown that this may be describedmathematically by the expressions
p=at-n
where p=initial surface absorptiont=time from starta=a constantn=a parameter between 0.3 and 0.7 depending on the degree of silting
or flushing mechanisms, but constant for a given specimen.
The standard procedure described by BS 1881 involves a constant head of 200 mm,with readings of initial surface absorption taken at 10 minutes, 30 minutes, 1 hourand 2 hours. Levitt has demonstrated that the factors a and n in the above expressioncan be evaluated from the 10 minute and 1 hour rates with sufficient accuracy topredict rates at other times. Two-hour readings are seldom used in practice
7.3.1.2 Equipment and procedure. The equipment (Figure 7.17) consists of a capwhich may be clamped and sealed onto the concrete surface, together with an
Figure 7.17 Initial surface absorption test.
Copyright 1996 Chapman & Hall
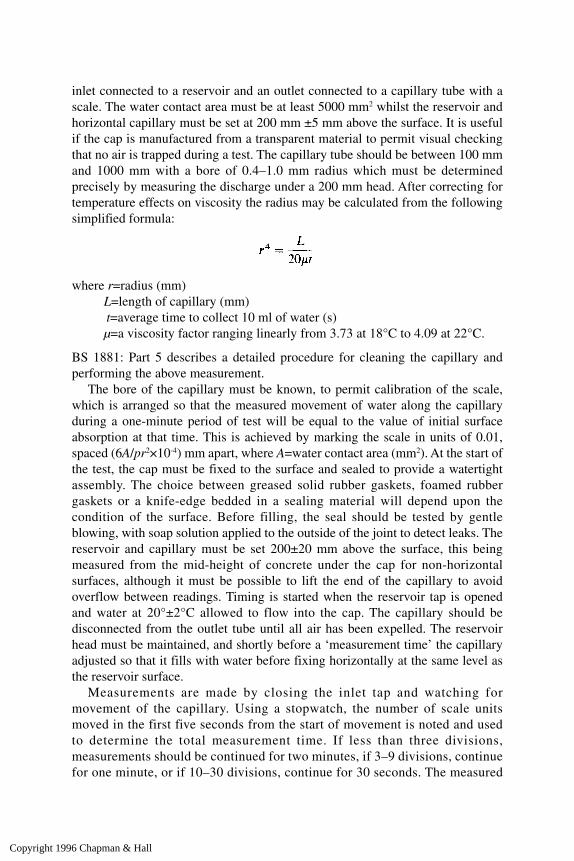
inlet connected to a reservoir and an outlet connected to a capillary tube with ascale. The water contact area must be at least 5000 mm2 whilst the reservoir andhorizontal capillary must be set at 200 mm ±5 mm above the surface. It is usefulif the cap is manufactured from a transparent material to permit visual checkingthat no air is trapped during a test. The capillary tube should be between 100 mmand 1000 mm with a bore of 0.4–1.0 mm radius which must be determinedprecisely by measuring the discharge under a 200 mm head. After correcting fortemperature effects on viscosity the radius may be calculated from the followingsimplified formula:
where r=radius (mm)
L=length of capillary (mm)t=average time to collect 10 ml of water (s)µ=a viscosity factor ranging linearly from 3.73 at 18°C to 4.09 at 22°C.
BS 1881: Part 5 describes a detailed procedure for cleaning the capillary andperforming the above measurement.
The bore of the capillary must be known, to permit calibration of the scale,which is arranged so that the measured movement of water along the capillaryduring a one-minute period of test will be equal to the value of initial surfaceabsorption at that time. This is achieved by marking the scale in units of 0.01,spaced (6A/pr2×10-4) mm apart, where A=water contact area (mm2). At the start ofthe test, the cap must be fixed to the surface and sealed to provide a watertightassembly. The choice between greased solid rubber gaskets, foamed rubbergaskets or a knife-edge bedded in a sealing material will depend upon thecondition of the surface. Before filling, the seal should be tested by gentleblowing, with soap solution applied to the outside of the joint to detect leaks. Thereservoir and capillary must be set 200±20 mm above the surface, this beingmeasured from the mid-height of concrete under the cap for non-horizontalsurfaces, although it must be possible to lift the end of the capillary to avoidoverflow between readings. Timing is started when the reservoir tap is openedand water at 20°±2°C allowed to flow into the cap. The capillary should bedisconnected from the outlet tube until all air has been expelled. The reservoirhead must be maintained, and shortly before a ‘measurement time’ the capillaryadjusted so that it fills with water before fixing horizontally at the same level asthe reservoir surface.
Measurements are made by closing the inlet tap and watching formovement of the capillary. Using a stopwatch, the number of scale unitsmoved in the first five seconds from the start of movement is noted and usedto determine the total measurement time. If less than three divisions,measurements should be continued for two minutes, if 3–9 divisions, continuefor one minute, or if 10–30 divisions, continue for 30 seconds. The measured
Copyright 1996 Chapman & Hall

reading should then be factored as necessary to give the number of scale unitsmoved in one minute, and hence the value of initial surface absorption. If themovement is more than 30 divisions in five seconds, the result can only bequoted as more than 3.60 ml/m2/s. This procedure should be performed 10min, 30 min, one hour and two hours after the start of the test, and at leastthree separate samples tested in this way.
Laboratory samples for testing should be oven-dry, but for large units orsamples this is not possible. If the test is to be performed in a laboratory, theconcrete must have been in the dry laboratory atmosphere for at least 48 hours.For in-situ testing a minimum dry period of 48 hours is specified, but theserequirements are very unlikely to produce comparable moisture conditionswithin the concrete and this will cause major problems in the interpretation ofresults.
An in-situ vacuum drying technique has been developed by Dhir et al. (211)which overcomes the difficulty of the uncertain moisture content of the in-situconcrete and gives ISAT 10-minute results with a standard deviation similar tothat obtained with oven-dried specimens. Several other surface-drying proceduresinvolving the use of heaters have been proposed but, as yet, no standardizedprocedure has been agreed.
A further development of the ISAT test (212) proposes the use of a guard ringlocated around the perimeter of the standard cap containing water at the samehydrostatic pressure. Water flowing into the concrete surface from the guard ringwill confine the absorption of water from the central cap to a uniaxial flow in theconcrete. Using this modification, an improved correlation with the cumulative 2hour ISAT result and with adsorption tests carried out on 50mm oven-dried coreswas found.
7.3.1.3 Reliability, interpretation and applications. It has been found that testson oven-dried specimens give reasonably consistent results, but that in othercases results are less reliable. Particular difficulties have been encountered within-situ use in achieving a watertight fixing. Levitt (210) has suggested thatspecific limits could be laid down as an acceptability criterion for various typesof construction, but insufficient evidence is yet available. Values of greater than0.50 ml/m2/s at 10 minutes for dry concrete have been tentatively suggested ascorresponding to a high absorption (see Table 7.3) whilst Dhir, Hewlett andChan (213) have reported repeatability tests. The test has been found to be verysensitive to changes in quality and to correlate with observed weatheringbehaviour. The main application is as a quality control test for precast units butapplication to durability assessment of in-situ concrete is growing. A minimumedge distance of 30 mm is proposed (213). The pressure used is low andalthough this may relate well to normal surface weather exposure conditions itis of little relevance to general behaviour under higher pressures. The methodcan be applied to exposed aggregate or profiled surfaces provided that an
Copyright 1996 Chapman & Hall

effective seal can be obtained, but is not suitable for porous or honeycombedconcretes.
Dhir et al. (214) have also considered use of the 10 minute ISAT result toevaluate resistance of the concrete to chloride diffusion and to carbonation andgive guidance for lightweight concrete and for concrete with cement replacementsin addition to normal o.p.c. concrete.
7.3.2 Figg air and water permeability testsFigg (215) in 1973 described the development of a test for air and waterpermeability which involved a hole drilled into the concrete surface. This wascommonly known as the Building Research Establishment Test. A number ofversions of this approach have subsequently been developed in various countries(205) but the most widely accepted procedure is that proposed by Gather, Figg,Marsden and O’Brien (216) on the basis of extensive experience with the method.This is commonly known as the modified Figg method and is described below.Earlier work (215) was based on a smaller hole depth and diameter (30 mm and5.5 mm respectively) and comparison of results from different investigationsshould be treated cautiously because of the lack of standardization of hole sizes.
7.3.2.1 Equipment and procedure. A hole of 10 mm diameter is drilled 40mmdeep normal to the concrete surface with a masonry drill. After cleaning, a disc of3 mm thick polyether foam sheet is pressed 20 mm into the hole and a catalysedliquid silicone rubber is added. This hardens to provide a resilient seal to the smallcavity in the concrete, and a gas-and-liquid-tight seal is obtained by a hypodermicneedle through this plug.
Air permeability measurements are by means of a hand-operated vacuum pumpand digital manometer connected by a three-way tap and plastic tubing to thehypodermic needle as illustrated in Figure 7.18. The pressure is reduced to -55kPa and the pump then isolated, with the manometer and concrete connectedtogether. The time, in seconds, for air to permeate through the concrete to increasethe cavity pressure to -50 kPa is noted and taken as a measure of the airpermeability of the concrete.
Water permeabiity is measured at a head of 100 mm with a very fine canulapassing through the hypodermic needle to touch the base of the cavity. A two-wayconnector is used to connect this to a horizontal capillary tube set 100 mm abovethe base of the cavity, and a syringe. Water is injected by syringe to displace allair, and after one minute the syringe is isolated with the water meniscus in thecapillary in a suitable position. The time, in seconds, for the meniscus to move 50mm is taken as a measure of water permeability of the concrete.
An automated system (217), the ‘poroscope’ utilizes a preformed silicone plug(Figure 7.19) to avoid delays in waiting for sealant to set and can be used for bothair and water permeability Figg tests. Results obtained are similar to those using a
Copyright 1996 Chapman & Hall

liquid silicone sealant and manual control. The use of a preformed plug alsoenables tests to be carried out on a slab soffit, which was not previously possibleusing a liquid sealant (218).
7.3.2.2 Reliability, limitations and applications. Using this method, therelationships between air pressure and time, and meniscus movement and time,were both found to be nearly linear. The test criteria of hole depth, plug thickness,pressure and test time have been investigated. Results have been obtained onlaboratory concrete which show that both air and water permeability measured inthis way correlate well with water/cement ratio, strength and ultrasonic pulsevelocity. Aggregate characteristics have a profound effect on results, limiting thepotential usage to comparative testing, but variations of drilling and plugging ofthe test hole are less significant. As with the initial surface absorption method, themoisture condition of the concrete will considerably influence the results. Thisseriously restricts in-situ usage, but a general classification for dry concrete isgiven in Table 7.3. Values should be treated with caution because of variations inhole dimensions used by various investigators. It has also been suggested that useof an even larger hole will improve repeatability (213).
The principal use of this method, which involves cheap and simple techniques,is as an alternative to the initial surface absorption method for quality controlchecking in relation to durability. It is usually the outer 50 mm of concrete which
Figure 7.18 Modified Figg air permeability test (based on ref. 216).
Copyright 1996 Chapman & Hall
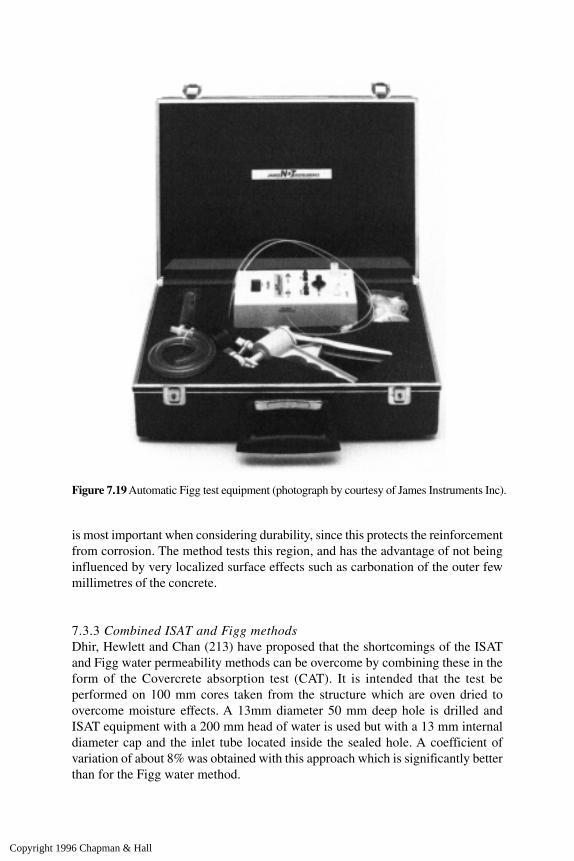
is most important when considering durability, since this protects the reinforcementfrom corrosion. The method tests this region, and has the advantage of not beinginfluenced by very localized surface effects such as carbonation of the outer fewmillimetres of the concrete.
7.3.3 Combined ISAT and Figg methodsDhir, Hewlett and Chan (213) have proposed that the shortcomings of the ISATand Figg water permeability methods can be overcome by combining these in theform of the Covercrete absorption test (CAT). It is intended that the test beperformed on 100 mm cores taken from the structure which are oven dried toovercome moisture effects. A 13mm diameter 50 mm deep hole is drilled andISAT equipment with a 200 mm head of water is used but with a 13 mm internaldiameter cap and the inlet tube located inside the sealed hole. A coefficient ofvariation of about 8% was obtained with this approach which is significantly betterthan for the Figg water method.
Figure 7.19 Automatic Figg test equipment (photograph by courtesy of James Instruments Inc).
Copyright 1996 Chapman & Hall

7.3.4 Hansen gas permeability testThis Danish method is described in detail by Hansen, Ottosen and Petersen (219).An 18 mm hole is drilled at a shallow angle below the concrete surface. Thepressure rise within this hole is monitored by a sensor inserted in the hole ascompressed air pressure is applied to a sealed surface region. The equipment iscommercially available, although published experience is limited at present.
7.3.5 ‘Autoclam’ permeability systemThe hydrostatic pressure used in the ISAT is low and there are circumstancesrelated to severe exposure conditions or testing of surface coatings where a higherpressure in-situ test is needed. The Autoclam is a commercially available systemdeveloped at Queen’s University, Belfast (220) which is similar in principle to theISAT, but which uses a hydrostatic pressure of 1.5 bar to measure in-situ waterpermeability (Figure 7.20). The equipment can alternatively be used to measure alow-pressure, 0.01 bar water sorptivity. In addition a measure of air permeability,through decay of air pressure applied to the concrete surface, can also bemeasured. All three tests are carried out by clamping the Autoclam to a 50 mmmetal ring which is glued to the concrete surface. The low-pressure watersorptivity test can be carried out at the same location as the air permeability test,but it is recommended that the high-pressure water permeability test is done at adifferent test location.
Once each test is commenced, the control of the test and monitoring of resultsis fully automatic. Each test takes about 15 minutes and all tests are sensitive to
Figure 7.20 AUTOCLAM air and water permeability instrumentation.
Copyright 1996 Chapman & Hall

the moisture condition of the in-situ concrete. On laboratory cubes, the influenceof the internal moisture in the concrete can be eliminated by oven drying to aconstant weight. For in-situ concrete, a method of surface-drying for 20 minutesusing a propane heater followed by cooling for 1 hour was found to give reliableresults unaffected by the original moisture condition of the concrete. TheAutoclam tests were found to correlate well with other permeability and sorptivitytests and can be used to rank different concretes into poor, medium and highdurability categories. The high-pressure permeability test is thought to testconcrete up to 40 mm below the surface and the results have the potential to beused to evaluate the intrinsic water permeability of the concrete (221).
7.3.6 Flow testsHigh-pressure permeability tests hve been used in the laboratory for many yearsand consist of the measurement of the steady flow of water through a concretespecimen under a specified head. The equipment is usually simple and anarrangement of the form shown in Figure 7.21 may be suitable. The specimen issealed in a permeameter so that air or water under pressure can be applied to one
Figure 7.21 Typical permeability equipment.
Copyright 1996 Chapman & Hall

face and the amount of fluid that permeates and emerges from the other face ismeasured. Leakage must be avoided and a constant head must be maintainedwhilst measuring the fluid passing through the sample; precautions must also betaken to avoid evaporation losses from the reservoir when water is being used.
Van der Meulen and Van Dijk (222) have described an approach of this typeand paid particular attention to the method of sealing the specimen. Whilst thismay be reasonably easy for laboratory cast specimens, if the concrete has beenobtained from an in-situ location, by coring, the surface will be irregular. It issuggested that a specimen of this type can be cast into an epoxy ring which has anaccurate outer surface and can then be fitted, with the aid of neoprene seals, into abrass ring mounted in the permeameter pot.
The observed flow will be of the form shown in Figure 7.22, and the test isusually continued to enable a steady state to be reached. The results from samplesof similar dimensions tested under similar heads may be used comparatively toassess the characteristics of the interior of a body of concrete, and this approach ismost likely to find applications in the field of water-containing structures.
7.3.7 BS absorption testBS 1881: Part 122 (208) describes a standard absorption test to be carried out on75 mm diameter (±3 mm) cored specimens. The test is intended as a durabilityquality control check and the specified test age is 28–32 days. The apparatusrequired is simple, consisting only of a balance, an airtight vessel, a container ofwater and an oven, and the test is also straightforward to perform.
The procedure involves drying the measured core specimen, which should be75 mm long if the member thickness is greater than 150 mm, in an oven at
Figure 7.22 Typical flow results.
Copyright 1996 Chapman & Hall
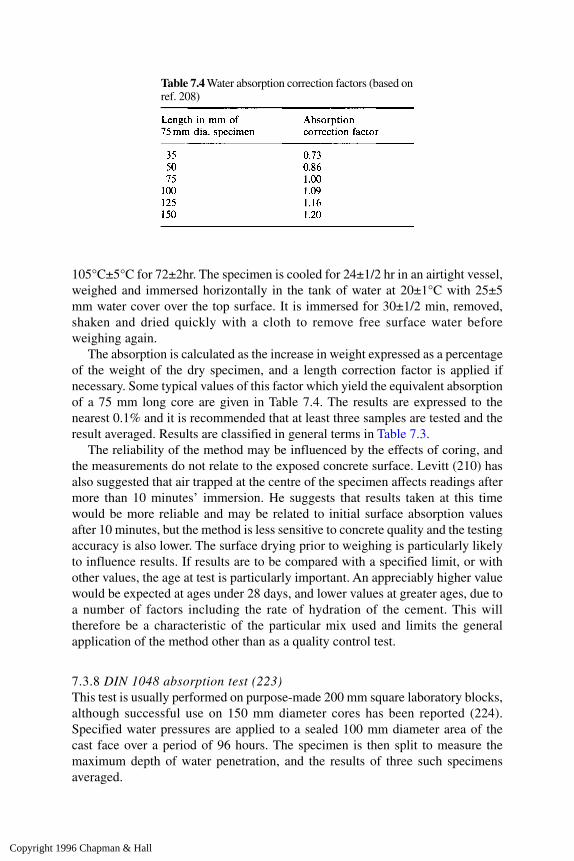
105°C±5°C for 72±2hr. The specimen is cooled for 24±1/2 hr in an airtight vessel,weighed and immersed horizontally in the tank of water at 20±1°C with 25±5mm water cover over the top surface. It is immersed for 30±1/2 min, removed,shaken and dried quickly with a cloth to remove free surface water beforeweighing again.
The absorption is calculated as the increase in weight expressed as a percentageof the weight of the dry specimen, and a length correction factor is applied ifnecessary. Some typical values of this factor which yield the equivalent absorptionof a 75 mm long core are given in Table 7.4. The results are expressed to thenearest 0.1% and it is recommended that at least three samples are tested and theresult averaged. Results are classified in general terms in Table 7.3.
The reliability of the method may be influenced by the effects of coring, andthe measurements do not relate to the exposed concrete surface. Levitt (210) hasalso suggested that air trapped at the centre of the specimen affects readings aftermore than 10 minutes’ immersion. He suggests that results taken at this timewould be more reliable and may be related to initial surface absorption valuesafter 10 minutes, but the method is less sensitive to concrete quality and the testingaccuracy is also lower. The surface drying prior to weighing is particularly likelyto influence results. If results are to be compared with a specified limit, or withother values, the age at test is particularly important. An appreciably higher valuewould be expected at ages under 28 days, and lower values at greater ages, due toa number of factors including the rate of hydration of the cement. This willtherefore be a characteristic of the particular mix used and limits the generalapplication of the method other than as a quality control test.
7.3.8 DIN 1048 absorption test (223)This test is usually performed on purpose-made 200 mm square laboratory blocks,although successful use on 150 mm diameter cores has been reported (224).Specified water pressures are applied to a sealed 100 mm diameter area of thecast face over a period of 96 hours. The specimen is then split to measure themaximum depth of water penetration, and the results of three such specimensaveraged.
Table 7.4 Water absorption correction factors (based onref. 208)
Copyright 1996 Chapman & Hall
7.3.9 ‘Sorptivity’ testThe mechanisms of water penetration into unsaturated concrete have beenanalysed by Kelham (225) who proposes a technique for measuring the criticalmaterial constant known as the sorptivity. The test is based on measuring theweight change of a submerged 50 mm thick 150 mm diameter cylindrical sampleas water is absorbed through one of the flat faces. The opposite face is exposed tothe atmosphere whilst the curved surface is sealed against water penetration. Thesorptivity is derived from the slope of a plot of sample weight against the squareroot of time. The effective porosity can also be obtained by allowing the sampleto become saturated.
Although reported results are for laboratory cast specimens, slices of corescould be used after suitable moisture conditioning.
7.3.10 Capillary rise testA porosity test to assess the quality of high alumina cement concrete has beendescribed by the Institution of Structural Engineers (226). A piece of concrete atleast 50 mm long is sawn flat on one face and placed with this surface on a blockof felt or blotting paper 10mm thick. This is placed in a dish containing water to alevel below the top surface of the felt, and the dish covered by an open-mouthedbell jar to prevent evaporation.
Capillary rise is measured by visual observation of colour change, and readingsup to 8 hours and at 24 hours are suggested. The rise of water in the specimen atthese times can be related to percentage conversion of the concrete, with values of15–20 mm at 24 hours quoted for unconverted concrete. This represents goodquality, well compacted concrete; 25–35 mm may be expected for similar concreteif unfavourably converted. A higher value may indicate serious deterioration.Whilst this method is described in relation to one specific application, it may haveother worthwhile applications of a comparative nature both in the laboratory andon site.
7.3.11 Vacuum testA vacuum test has been developed in the USA (227) which measures the airpermeability of concrete by studying the decay in the vacuum as air passes fromthe cover zone into a cap sealed to the surface. To date, this test has seen verylittle usage elsewhere.
7.4 Tests for alkali-aggregate reaction
Reactions between the aggregates and alkaline matrix pore fluids are common insome parts of the world, and have been the subject of widespread research. Awide variety of such reactions exist which generally cause internal expansion in
Copyright 1996 Chapman & Hall

the presence of moisture due to the formation of hygroscopic gel at the aggregate/matrix interface and within aggregate particles. In the UK the most common formexperienced is alkali-silica reaction.
Several tests exist to aid assessment of potential reactivity of materials, whichare outside the scope of this book. In-situ tests related to diagnosis, andassessment of existing and future damage are not well developed althoughultrasonic pulse velocity and pulse-echo techniques may offer potential.Assessment of existing structures is primarily based on cores which may besubjected to expansion tests, alkali-immersion tests, cement content andpetrographic (sawn surface and thin section) analysis (see Chapter 9). Visualidentification of crack characteristics as well as a knowledge of moisture contentwill also be important aids to diagnosis, which is considered in detail by a recentBritish Cement Association report (23).
Expansion tests basically involve strain measurements on cores with at least 4Demec gauge spans along their length. The reaction may be accelerated fordiagnosis purposes by a 38°C, 100% RH environment (23), although a number ofvariations on this are possible to obtain an indication of likely future performance.A ‘stiffness damage’ test on cores has also been described in section 5.1.3.6, anda technique of staining the alkali reaction gel with an ultra-violet fluorescent dyeto facilitate visual identification is discussed in section 9.11.1.
7.5 Tests for freeze-thaw resistance
These usually take the form of petrographic analysis of a polished surface of asample removed from the structure to determine entrained air content. ASTMC457 (228) covers this type of testing which is considered further in section 9.11.Laboratory temperature cycling of samples may also be used.
7.6 Abrasion resistance testing
Abrasion resistance is likely to be of critical importance for floors of industrialpremises such as factories or warehouses where disputes involving very highrepair or replacement costs may often arise. The pore structure of the surfacezone has been found to be the principal determining factor by Sadegzadeh, Pageand Kettle (229) using an accelerated wear apparatus. This consists of a rotatingsteel plate carrying three case-hardened steel wheels which wear a 20mm widegroove with 205mm inside diameter in the concrete surface. Abrasion resistanceis assessed by measurement of the depth of this groove after a 15 minutestandardized test period. Field studies using this equipment and reboundhammer tests are reported by Kettle and Sadegzadeh (230). These cover a rangeof practical situations and surface finishing techniques, and it is concluded thatthe relationship between rebound number and abrasion resistance is morecomplex than previously proposed by Chaplin (52). Results from the
Copyright 1996 Chapman & Hall
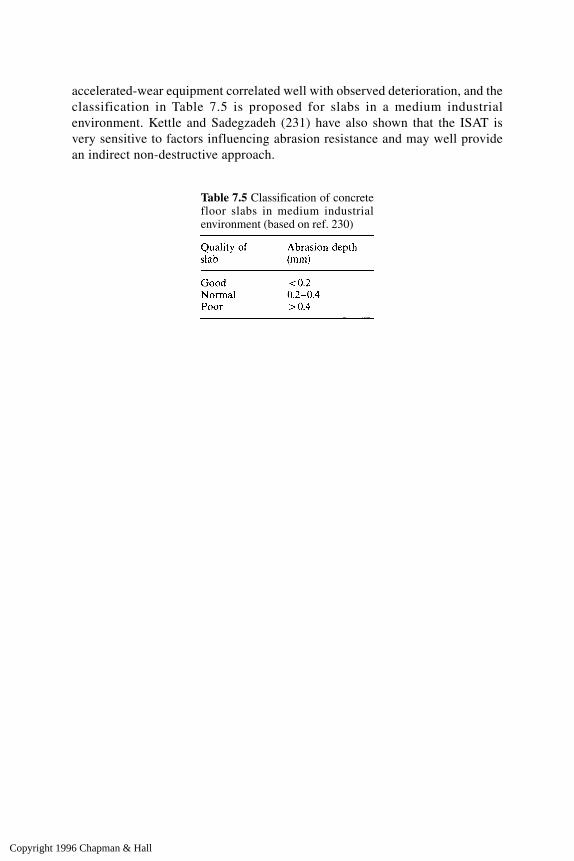
accelerated-wear equipment correlated well with observed deterioration, and theclassification in Table 7.5 is proposed for slabs in a medium industrialenvironment. Kettle and Sadegzadeh (231) have also shown that the ISAT isvery sensitive to factors influencing abrasion resistance and may well providean indirect non-destructive approach.
Table 7.5 Classification of concretefloor slabs in medium industrialenvironment (based on ref. 230)
Copyright 1996 Chapman & Hall

8 Performance and integrity tests
The tests described in this chapter are wide ranging and measure a variety ofdifferent properties related to performance and integrity which have not beenconsidered elsewhere in the book. Many of the durability tests described inChapter 7 and chemical tests in Chapter 9 are also related to performance, andload testing has been covered in Chapter 6. Integrity tests are generally concernedwith the location and development of voids and cracks which are not visible at thesurface but may influence structural or durability performance.
8.1 Infrared thermography
The use of this technique, in which infrared photographs are taken during thecooling of a heated structure, has been described by Manning and Holt (232).Infrared thermography offers many potential advantages over physical methods forthe detection of delamination of bridge decks which are discussed in section 8.3.The detection of laminations or voids by infrared thermography is based on thedifference in surface temperature between sound and unsound concrete undercertain atmospheric conditions. The concrete surface temperature changesthroughout the day due to heating by sunlight and cooling at night, this beingparticularly marked in summer. During the hottest part of the day the concretetemperature decreases with depth below the surface, whereas at night the situationis reversed. Delamination will affect these temperature gradients, and hence surfacetemperatures, which may be compared by infrared measurements. Because of thesmall temperature differentials involved, the results cannot be directly recorded byinfrared film, and the image from the camera must be displayed on a cathode raytube. The temperature of the surface is indicated by a range of greys, althoughthermal contours can be automatically superimposed, and colour monitors are alsoavailable. This image is normally recorded on film to provide a hard copy.
Early trials have been performed with a camera held by an operator standingon the deck (232), but the limited field of view and oblique alignment render thisimpracticable. Greater success was obtained by using a bucket truck to scan thedeck from a height of up to 20 m, provided that the surface temperaturedifferentials were greater than 2°C. Airborne testing avoided the necessity for laneclosures and reduced the difficulties of piecing together photographs to form acomposite picture (the equipment was mounted on a helicopter and trial flightswere made at heights up to 400 m) but the images obtained were often poor.
Copyright 1996 Chapman & Hall
It was found that surface temperature differentials existed in delaminated decksat most times, but were greatest in summer, peaking in mid-afternoon. Attenuationof the reflected heat by the atmosphere, however, poses a major problem, and thisis increased by wind. Moisture on the surface was also found to mask surfacetemperature differences. While the potential advantages of airborne operation areconsiderable despite the high cost, there remain problems to be resolved beforethis technique can be considered fully reliable and economical.
Holt and Eales (233) have also described the successful use of thermographyto evaluate defects in highway pavements with an infrared scanner and coupledreal-life video scanner mounted on a 5 m high mast attached to a van. This isdriven at up to 15 mph and images are matched by computer. Procedures forthermography in the investigation of bridge deck delamination are given in ASTMD4788 (234).
Other applications of infrared thermography to structural investigations involvecomparative assessment of concrete moisture conditions, which will influencethermal gradients, as well as location of hidden voids or ducts (235). Techniquesare also available to detect reinforcing bars which are heated by electricalinduction. More recent development of 12 bit equipment (237) has improved thesensitivity to temperature differences to within ±0.1oC (Figure 8.1) and enabledhigh definition imaging and accurate temperature measurement. Studies of mosaiccladding to multi-storey buildings have been conducted to detect delaminationand defective areas (238). The location of ‘hot spots’ during daytime or ‘coldspots’ at night are used to identify where remediation is required. The smallestdetectable defect is reported to be 200 mm×200 mm. Studies of the insulationproperties of buildings (239) using infrared imaging can be used to reduce heatlosses at hot spots by identifying missing thermal insulation.
8.2 Radar
Over the past decade there has been an increasing usage of sub-surface impulseradar to investigate civil engineering problems and, in particular, concretestructures (240). Electromagnetic waves, typically in the frequncy range 500 MHzto 1 GHz, will propagate through solids, with the speed and attenuation of thesignal influenced by the electrical properties of the solid materials. The dominantphysical properties are the electrical permittivity which determines the signalvelocity, and the electrical conductivity which determines the signal attenuation(241). Reflections and refractions of the radar wave will occur at interfacesbetween different materials and the signal returning to the surface antenna can beinterpreted to provide an evaluation of the properties and geometry of sub-surfacefeatures (Figure 8.2).
Copyright 1996 Chapman & Hall

8.2.1 Radar systemsThere are three fundamentally different approaches to using radar to investigateconcrete structures.
(i) Frequency modulation: in which the frequency of the transmitted radarsignal is continuously swept between pre-defined limits. The returnsignal is mixed with the currently transmitted signal to give a differencefrequency, depending upon the time delay and hence depth of thereflective interface. This system has seen limited use to date on relativelythin walls (242).
(ii) Synthetic pulse radar: in which the frequency of the transmitted radarsignal is varied over a series of discontinuous steps. The amplitude andphase of the return signal is analysed and a ‘time domain’ synthetic pulseis produced. This approach has been used to some extent in the field
Figure 8.1 Infrared thermography apparatus.
Copyright 1996 Chapman & Hall

(243) and also in laboratory transmission line studies (244) to determinethe electrical properties of concrete at different radar frequencies.
(iii) Impulse radar: in which a series of discrete sinusoidal pulses within aspecified broad frequency band are transmitted into the concrete,typically with a repetition rate of 50 kHz. The transmitted signal is oftenfound to comprise three peaks (Figure 8.3), with a well-defined nominalcentre frequency.
Impulse radar systems have gained the greatest acceptance for field use and mostcommercially obtainable systems are of this type, e.g. as shown in Figure 8.4. Thepower output of the transmitted radar signal is very low and no special safetyprecautions are needed. However, in the UK a Department of Trade and IndustryRadiocommunications Agency licence is required to permit use of investigativeradar equipment.
Figure 8.2 Investigation of sub-surface anomaly using radar.
Copyright 1996 Chapman & Hall

Figure 8.3 Radar reflections from a concrete slab (based on ref. 241).
Copyright 1996 Chapman & Hall
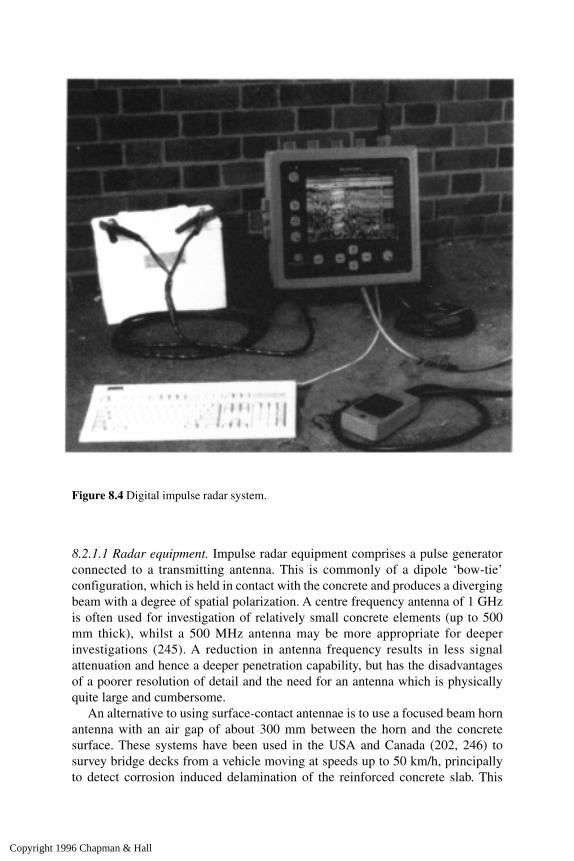
8.2.1.1 Radar equipment. Impulse radar equipment comprises a pulse generatorconnected to a transmitting antenna. This is commonly of a dipole ‘bow-tie’configuration, which is held in contact with the concrete and produces a divergingbeam with a degree of spatial polarization. A centre frequency antenna of 1 GHzis often used for investigation of relatively small concrete elements (up to 500mm thick), whilst a 500 MHz antenna may be more appropriate for deeperinvestigations (245). A reduction in antenna frequency results in less signalattenuation and hence a deeper penetration capability, but has the disadvantagesof a poorer resolution of detail and the need for an antenna which is physicallyquite large and cumbersome.
An alternative to using surface-contact antennae is to use a focused beam hornantenna with an air gap of about 300 mm between the horn and the concretesurface. These systems have been used in the USA and Canada (202, 246) tosurvey bridge decks from a vehicle moving at speeds up to 50 km/h, principallyto detect corrosion induced delamination of the reinforced concrete slab. This
Figure 8.4 Digital impulse radar system.
Copyright 1996 Chapman & Hall
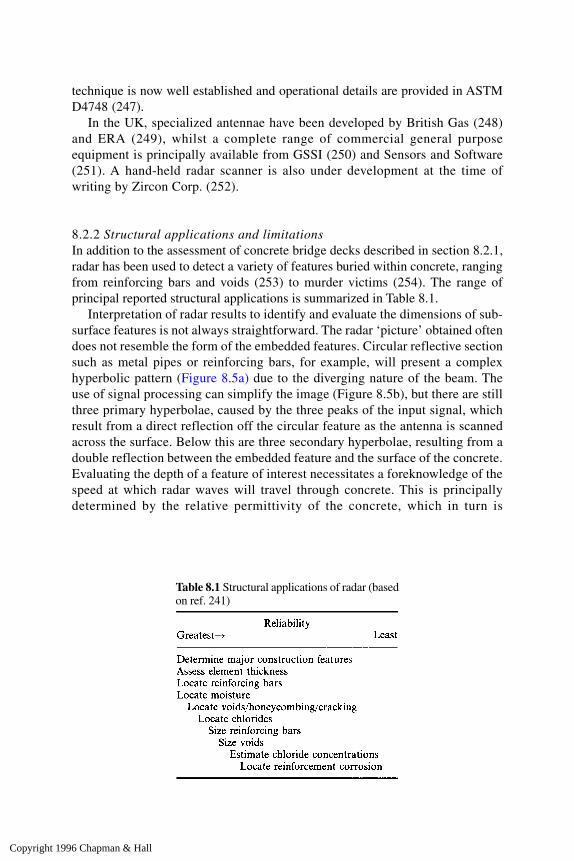
technique is now well established and operational details are provided in ASTMD4748 (247).
In the UK, specialized antennae have been developed by British Gas (248)and ERA (249), whilst a complete range of commercial general purposeequipment is principally available from GSSI (250) and Sensors and Software(251). A hand-held radar scanner is also under development at the time ofwriting by Zircon Corp. (252).
8.2.2 Structural applications and limitationsIn addition to the assessment of concrete bridge decks described in section 8.2.1,radar has been used to detect a variety of features buried within concrete, rangingfrom reinforcing bars and voids (253) to murder victims (254). The range ofprincipal reported structural applications is summarized in Table 8.1.
Interpretation of radar results to identify and evaluate the dimensions of sub-surface features is not always straightforward. The radar ‘picture’ obtained oftendoes not resemble the form of the embedded features. Circular reflective sectionsuch as metal pipes or reinforcing bars, for example, will present a complexhyperbolic pattern (Figure 8.5a) due to the diverging nature of the beam. Theuse of signal processing can simplify the image (Figure 8.5b), but there are stillthree primary hyperbolae, caused by the three peaks of the input signal, whichresult from a direct reflection off the circular feature as the antenna is scannedacross the surface. Below this are three secondary hyperbolae, resulting from adouble reflection between the embedded feature and the surface of the concrete.Evaluating the depth of a feature of interest necessitates a foreknowledge of thespeed at which radar waves will travel through concrete. This is principallydetermined by the relative permittivity of the concrete, which in turn is
Table 8.1 Structural applications of radar (basedon ref. 241)
Copyright 1996 Chapman & Hall
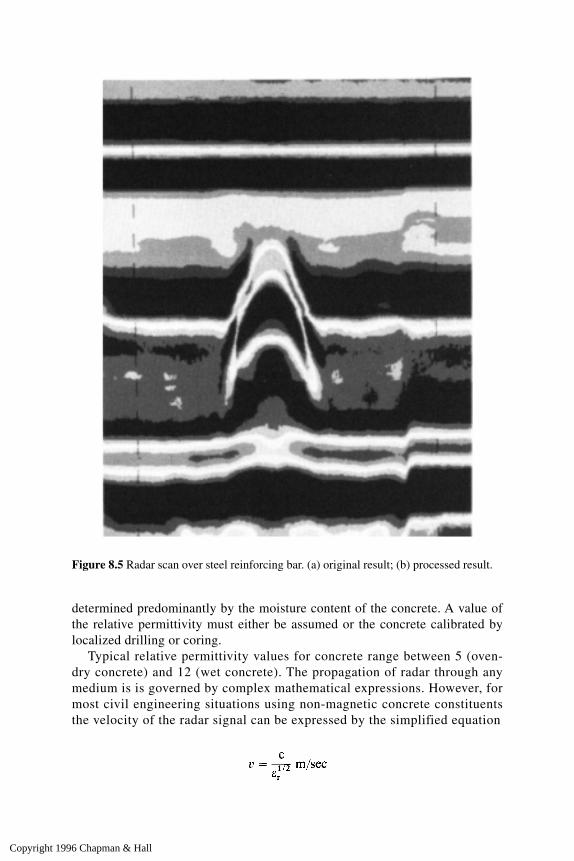
determined predominantly by the moisture content of the concrete. A value ofthe relative permittivity must either be assumed or the concrete calibrated bylocalized drilling or coring.
Typical relative permittivity values for concrete range between 5 (oven-dry concrete) and 12 (wet concrete). The propagation of radar through anymedium is is governed by complex mathematical expressions. However, formost civil engineering situations using non-magnetic concrete constituentsthe velocity of the radar signal can be expressed by the simplified equation
Figure 8.5 Radar scan over steel reinforcing bar. (a) original result; (b) processed result.
Copyright 1996 Chapman & Hall

where c=speed of light (3×10⁸ m/sec)εr=relative permittivity of material.
If the properties of materials are known precisely it may be possible to make depthestimates to within about ±5 mm, but in practice uncertainties and concretevariability are likely to increase this range significantly.
Because of the difficulties in interpreting radar results, surveys are normallyconducted by testing specialists who rely on practical experience, have aknowledge of the fundamental principles involved and have a sense of realismconcerning the likely limitations in a given practical situation. Experience has
Figure 8.5 Continued
Copyright 1996 Chapman & Hall

shown (255) that features such as voids can be particularly difficult to detect iflocated very deep or beneath a layer of closely spaced steel reinforcing bars. Theuse of neural network ‘artificial intelligence’ has been used (256) to facilitate theinterpretation of radar results and these preliminary studies are encouraging.
Radar reflects most strongly off metallic objects or off an interface betweentwo materials with very different relative permittivities. Thus an air-filled void indry concrete (εr, air=1; εr, air dried concrete=6) can be quite difficult to detect, especially ifthe void is small. Fifty millimetres has been suggested as a practical lower limit tosize (253). Conversely, the same void if filled with water (εr water=81; εr, wet concrere=12)may be much easier to detect.
Moisture in the concrete will not only influence the speed of the radar signaland the strength of interfacial reflections, but in additon a high conductivity willalso cause a greater degree of signal attenuation, resulting in a reduction in themaximum depth of penetration possible. Using a 1 GHz antenna, typical practicalpenetration limits are around 500mm for dry concrete and 300 mm for water-saturated concrete. If the concrete is saturated with salt water, the limit of signalpenetration is likely to be even smaller.
8.3 Dynamic response testing
Testing ranges from simple surface tapping to investigation of the response oflarge structures to applied dynamic loads. Simple methods are useful for assessinglocalized integrity, such as delamination, whilst more complex methods arecommonly used for pile integrity testing, determination of member thicknesses,and examination of stiffnesses of members affected by cracking or otherdeterioration.
8.3.1 Simple ‘non-instrumented’ approachesExperience has shown that the human ear used in conjunction with surfacetapping is the most efficient and economical method of determining majordelamination. Delamination may be caused in bridge decks (232) by corrosionexpansion of the top layer of reinforcement causing a fracture plane at that level,and is especially likely where cover is low. In order to carry out repairs, thedeterioration must be detected and its extent determined. Methods currently inroutine use are based on the characteristic dull sound when the deck surface isstruck over a delamination. Hammers, steel bars and chains are sometimes usedto strike the deck and the sound produced is assessed subjectively by theoperator. The operation is performed over a grid to ‘map out’ the deck. Thesemanual impact techniques have many disadvantages, and ‘chain-dragging’provides a quicker and more efficient approach. A single heavy chain with 50mm links, weighing 2.2 kg/m, has been found to be the optimum, and a 2 mlength is passed over the surface with a whip-like action. Sound differences may
Copyright 1996 Chapman & Hall
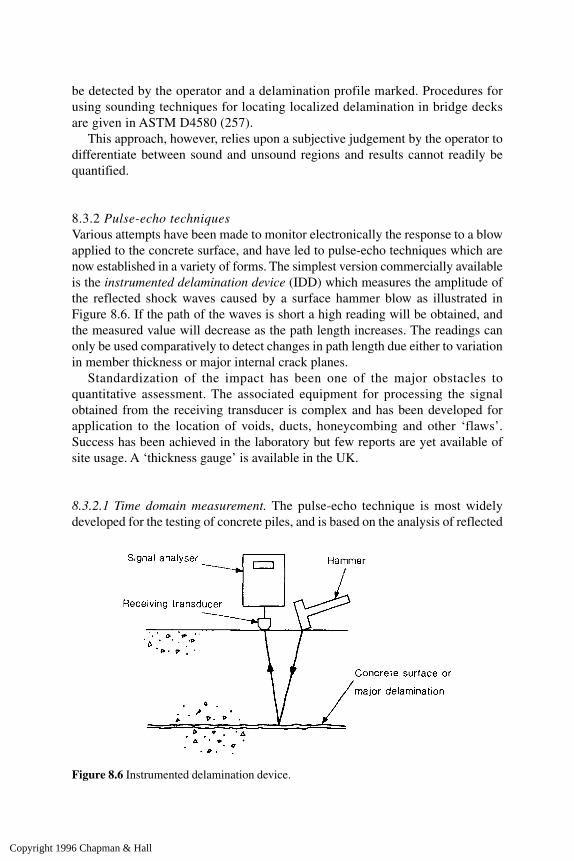
be detected by the operator and a delamination profile marked. Procedures forusing sounding techniques for locating localized delamination in bridge decksare given in ASTM D4580 (257).
This approach, however, relies upon a subjective judgement by the operator todifferentiate between sound and unsound regions and results cannot readily bequantified.
8.3.2 Pulse-echo techniquesVarious attempts have been made to monitor electronically the response to a blowapplied to the concrete surface, and have led to pulse-echo techniques which arenow established in a variety of forms. The simplest version commercially availableis the instrumented delamination device (IDD) which measures the amplitude ofthe reflected shock waves caused by a surface hammer blow as illustrated inFigure 8.6. If the path of the waves is short a high reading will be obtained, andthe measured value will decrease as the path length increases. The readings canonly be used comparatively to detect changes in path length due either to variationin member thickness or major internal crack planes.
Standardization of the impact has been one of the major obstacles toquantitative assessment. The associated equipment for processing the signalobtained from the receiving transducer is complex and has been developed forapplication to the location of voids, ducts, honeycombing and other ‘flaws’.Success has been achieved in the laboratory but few reports are yet available ofsite usage. A ‘thickness gauge’ is available in the UK.
8.3.2.1 Time domain measurement. The pulse-echo technique is most widelydeveloped for the testing of concrete piles, and is based on the analysis of reflected
Figure 8.6 Instrumented delamination device.
Copyright 1996 Chapman & Hall
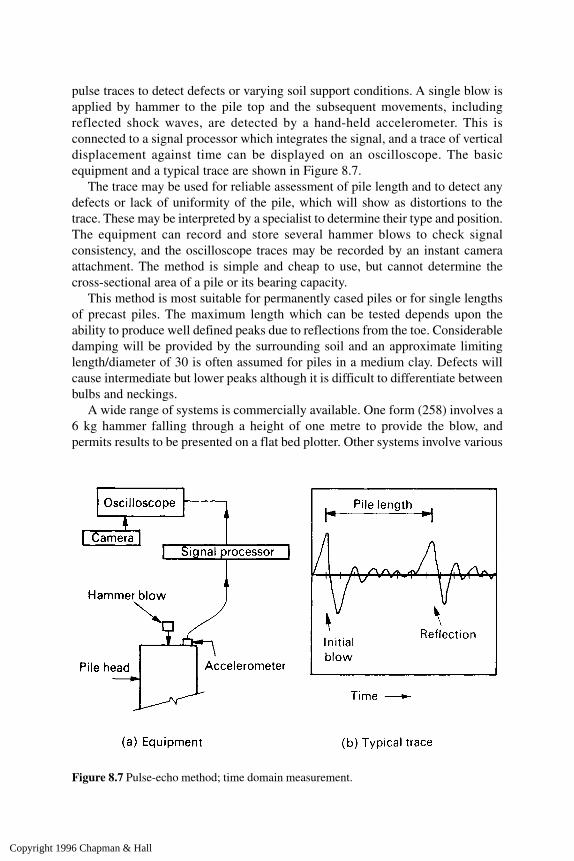
pulse traces to detect defects or varying soil support conditions. A single blow isapplied by hammer to the pile top and the subsequent movements, includingreflected shock waves, are detected by a hand-held accelerometer. This isconnected to a signal processor which integrates the signal, and a trace of verticaldisplacement against time can be displayed on an oscilloscope. The basicequipment and a typical trace are shown in Figure 8.7.
The trace may be used for reliable assessment of pile length and to detect anydefects or lack of uniformity of the pile, which will show as distortions to thetrace. These may be interpreted by a specialist to determine their type and position.The equipment can record and store several hammer blows to check signalconsistency, and the oscilloscope traces may be recorded by an instant cameraattachment. The method is simple and cheap to use, but cannot determine thecross-sectional area of a pile or its bearing capacity.
This method is most suitable for permanently cased piles or for single lengthsof precast piles. The maximum length which can be tested depends upon theability to produce well defined peaks due to reflections from the toe. Considerabledamping will be provided by the surrounding soil and an approximate limitinglength/diameter of 30 is often assumed for piles in a medium clay. Defects willcause intermediate but lower peaks although it is difficult to differentiate betweenbulbs and neckings.
A wide range of systems is commercially available. One form (258) involves a6 kg hammer falling through a height of one metre to provide the blow, andpermits results to be presented on a flat bed plotter. Other systems involve various
Figure 8.7 Pulse-echo method; time domain measurement.
Copyright 1996 Chapman & Hall
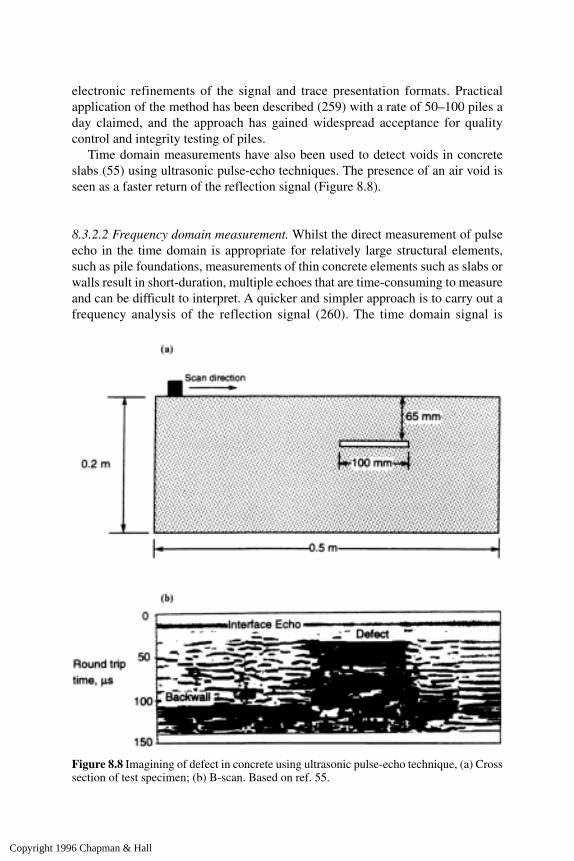
electronic refinements of the signal and trace presentation formats. Practicalapplication of the method has been described (259) with a rate of 50–100 piles aday claimed, and the approach has gained widespread acceptance for qualitycontrol and integrity testing of piles.
Time domain measurements have also been used to detect voids in concreteslabs (55) using ultrasonic pulse-echo techniques. The presence of an air void isseen as a faster return of the reflection signal (Figure 8.8).
8.3.2.2 Frequency domain measurement. Whilst the direct measurement of pulseecho in the time domain is appropriate for relatively large structural elements,such as pile foundations, measurements of thin concrete elements such as slabs orwalls result in short-duration, multiple echoes that are time-consuming to measureand can be difficult to interpret. A quicker and simpler approach is to carry out afrequency analysis of the reflection signal (260). The time domain signal is
Figure 8.8 Imagining of defect in concrete using ultrasonic pulse-echo technique, (a) Crosssection of test specimen; (b) B-scan. Based on ref. 55.
Copyright 1996 Chapman & Hall
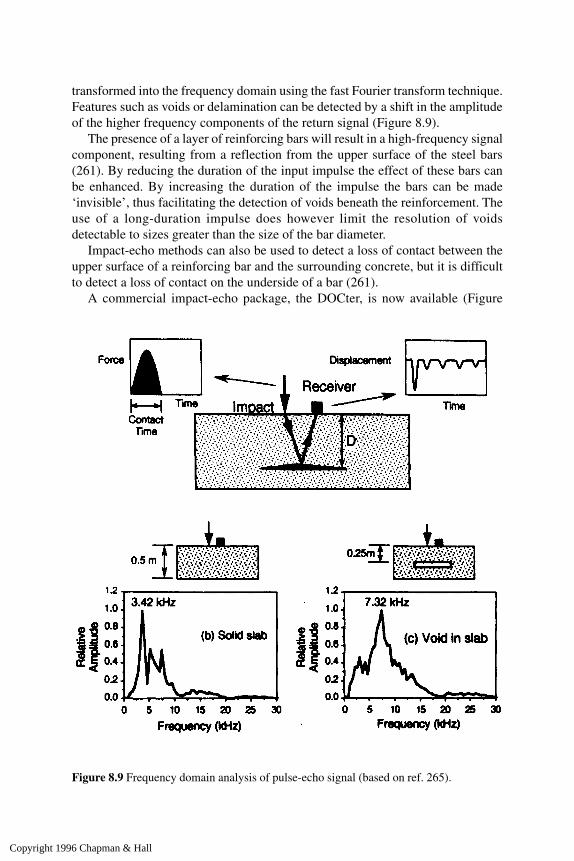
transformed into the frequency domain using the fast Fourier transform technique.Features such as voids or delamination can be detected by a shift in the amplitudeof the higher frequency components of the return signal (Figure 8.9).
The presence of a layer of reinforcing bars will result in a high-frequency signalcomponent, resulting from a reflection from the upper surface of the steel bars(261). By reducing the duration of the input impulse the effect of these bars canbe enhanced. By increasing the duration of the impulse the bars can be made‘invisible’, thus facilitating the detection of voids beneath the reinforcement. Theuse of a long-duration impulse does however limit the resolution of voidsdetectable to sizes greater than the size of the bar diameter.
Impact-echo methods can also be used to detect a loss of contact between theupper surface of a reinforcing bar and the surrounding concrete, but it is difficultto detect a loss of contact on the underside of a bar (261).
A commercial impact-echo package, the DOCter, is now available (Figure
Figure 8.9 Frequency domain analysis of pulse-echo signal (based on ref. 265).
Copyright 1996 Chapman & Hall

8.10) and is suitable for use in the field (262). It has been used in the USA tomonitor the thickness and integrity of concrete pavements and walls (263) andalso for detecting cracking in beams (264). Using an impact duration of 20–80 us,sections up to 1 m thick have been studied. Studies on the use of impact-echotechniques to detect air voids resulting from inadequate grouting of steelprestressing ducts are promising (265) and recent studies (266) have investigatedthe use of neural network ‘artificial intelligence’ to facilitate the interpretation ofcomplex frequency domain results.
8.3.3 Surface wave techniquesThe use of fast Fourier transformation of impulse responses has also been usedfor spectral analysis of surface waves (SASW) that are transmitted laterallythrough a medium (267). A pair of surface transducers are positioned adjacent tothe impulse location (Figure 8.11) and are used to measure variations in thesurface wave velocity at different frequencies. The results are then furtheranalysed to determine both the thickness and elastic modulus of the material andof underlying layers. This technique has the potential to detect interlayered goodand poor quality concrete, but the complex signal processing required has resultedin infrequent usage in the field. Efforts are now being made to automate theanalysis of results (268).
Figure 8.10 DOCter impact-echo apparatus.
Copyright 1996 Chapman & Hall

8.3.4 Testing large-scale structuresDynamic response testing of entire structures may similarly involve hammerimpacts or application of vibrating loads. In either case the response is recordedby carefully located accelerometers and complex signal processing equipment isrequired. Maguire and Severn (269) have described the application of hammerblow techniques to a range of structures including chimneys and bridge beams.Vibration methods have been reported by a number of authors, including Williams(270) and are commercially available.
Model analysis and dynamic stiffness approaches are under development inthe UK but are not yet widely used on site.
The aim of testing will usually be to monitor stiffness changes due to cracking,deterioration or repair. The ‘dynamic signature’ of a structure may be obtainedand compared at various time intervals to monitor changes. This is particularlyvaluable when monitoring the effects of a suspected overload or deterioration withtime, and delamination of screeds or toppings from slabs may be detected.Comparisons may in some cases also be possible with theoretically calculatedfrequencies of vibration and member stiffness.
A range of vibration and ‘shock’ methods is also regularly used for testingpiles. The basic principles have been described by Stain (271) and permitestimates with varying degrees of confidence of dynamic pile head stiffness, cross-sectional area and limiting stiffness values of end bearing piles. As with pulse-echo techniques, the principal advantage is speed of test in comparison withtraditional static methods.
Figure 8.11 Spectral analysis of surface waves.
Copyright 1996 Chapman & Hall

8.4 Radiography and radiometry
Radioactive methods have developed steadily over recent years, and althoughgenerally expensive and more appropriate to laboratory conditions, their fieldapplications are increasing in number. There are three basic methods currently inuse for testing concrete: X-ray radiography, γ-ray radiography, and γ-rayradiometry.
The radiographic methods consist essentially of a ‘photograph’ taken througha specimen to reveal a picture of the interior, whereas radiometry involves the useof a concentrated source and a detector to pick up and measure the receivedemissions at a localized point on the member.
X-rays and γ-rays are both at the high energy end of the electro-magneticspectrum and will penetrate matter, but undergo attenuation according to itsnature and thickness. The energies of these rays are expressed in electron volts,and the sources available for concrete testing will typically be in the range 30–125 keV for X-rays and 0.3–1.3 MeV for γ-rays. The attenuation of radiationpassing through matter is exponential and may be expressed (62) in simplifiedterms as
I=I0e-µm
where I=emergent intensity of radiation
I0=incident intensityµ=mass absorption coefficientm=mass per unit area of material traversed.
In the X-ray energy range, attenuation is dependent on both the atomic numberand density of the material, whilst for the γ-ray range, density is the principal factor.The cost and immobility of X-ray equipment, which requires high voltages, hasbeen a major limitation to the development of field usage although the method isof considerable value in the laboratory. Sources of γ-rays are more easily portable,and so this has become the principal radioactive method for on-site use.
BS 1881: Part 205 (272) provides guidance on radiographic work, includingsuitable sources of radiation, safety precautions and testing procedures. Forrester(273) has described the techniques in detail.
8.4.1 X-radiographyLaboratory applications of this approach have been principally aimed at the studyof the internal structure of concrete, and are summarized by Malhotra (50). Studieshave included the arrangement of aggregate particles, including their spacing, andpaste film thicknesses, three-dimensional observation of air voids, segregation,and the presence of cracks. Although some field applications were reported in the1950s, little attention seems to have been paid to the use of X-rays in the field
Copyright 1996 Chapman & Hall
since that time, apart from the use of lorry-mounted high energy 8 MeV Linacequipment capable of penetrating up to 1600 mm of concrete (274).
Concern over corrosion of post-tensioned prestressing strands as a result ofinadequate grouting has led to a recent focus of interest in systems capable ofinvestigating the interior of steel prestressing ducts of bridge beams. TheScorpion II system, developed in France, comprises a miniature 4 MeV linearaccelerator which produces a beam of high-powered X-rays (275). A lorry-mounted system is used to investigate the integrity of post-tensioned bridgebeams by tracking the accelerator on one side of a beam web and locating adetector on the other side. Results are obtained as real-time video display.However, the risk of backscatter radiation reflected back from the concretesurface has necessitated a 250 m exclusion zone below bridges to safeguard thehealth of pedestrians and boatmen.
8.4.2 Gamma radiographyThe use of γ-rays to provide a ‘photograph’ of the interior of a concrete memberhas gained considerable acceptance. It is especially valuable for determining theposition and condition of reinforcement, voids in the concrete or grouting of post-tensioned construction, or variable compaction.
The source will normally be a radioactive isotope enclosed in a portablecontainer which permits a beam of radiation to be emitted. The choice of isotopewill depend upon the thickness of concrete involved: Iridium 192 for 25–250mm thickness, and Cobalt 60 for 125–500 mm thickness, are most commonlyused. The beam is directed at the area of the member under investigation and aphotograph produced on a standard X-ray film held against the back face. Incases where particularly precise details are required, such as specificidentification of reinforcing bars or grouting voids, the image can be intensifiedby sandwiching the film between very thin lead screens. After development ofthe film, reinforcement will appear as light areas due to the higher absorption ofrays by the high density material, whilst voids will appear as dark areas. If it isrequired to determine the size and position of reinforcement or defects,photogrammetric techniques can be used in conjunction with stereoscopicradiographs.
Although this technique has become established for examination of steeland voids, it is expensive and requires stringent safety precautions. It is alsolimited by member thickness; although 600mm is sometimes quoted as anupper limit, for thicknesses greater than 450 mm the exposure times becomeunacceptably long.
The National NDT Centre at Harwell (276) has studied use in-situ of cobalt60 source (1.17 and 1.33 MeV gamma rays) for bridge beams between 300 mmand 800 mm thick, but report that exposure times of several hours may berequired. An alternative is to use a 6 MeV Betatron as a switchable X-ray source,providing a higher-power and more effective radiographic facility (277). This
Copyright 1996 Chapman & Hall

has enabled exposure times to be reduced to 15–30 minutes for a section of 600mm thickness.
8.4.3 Gamma radiometryAs in radiography, γ-rays are generated by a suitable radioisotope and directed atthe concrete. In this case, however, the intensity of radiation emerging is detectedby a Geiger or scintillation counter and measured by electronic equipment. Thisapproach will primarily be used for the measurement of in-situ density of theconcrete, although it may also be applied to thickness determination.
As the high-energy radiation passes through concrete some is absorbed, somepasses through completely, and a considerable amount is scattered by collisionswith electrons in the concrete. This scattering forms the basis of ‘backscatter’methods which may be used to examine the properties of material near the surfaceas an alternative to ‘direct’ meaurements of the energy passing through themember completely.
The first use of this approach seems to have been in the early 1950s whenSmith and Whiffin (278), Hass (279), and others reported applications. Morerecently, Simpson (280) has described developments of the backscatter technique,whilst Honig (281) has outlined methods adopted in the former Czechoslovakia.
8.4.3.1 Direct methods. A variety of test arrangements have been adopted, butthe basic equipment consists of a suitably housed radioactive source, similarto that used for radiography, together with a detector. The detector will usuallyconsist of a counter housed in a thick lead sheath to exclude signals other thanthose coming directly from the source. The radiation beam may pass directlythrough the concrete member as shown in Figure 8.12 or alternatively sourceand/or detector may be lowered into predrilled holes in the body of theconcrete if density variations with depth are required.
Figure 8.12 Direct radiometry.
Copyright 1996 Chapman & Hall

Calibrations may be made by cutting cores in the path of radiation after test andusing these to provide samples for physical density measurements. As withradiography, the thickness of concrete tested is limited to about 600 mm, whichposes a serious restriction to the use of the method. As an alternative to measuringdensity, this approach may also be adapted to assess member thickness or thelocation of reinforcing bars.
Computerized tomography analysis methods are being studied (282) todetermine if accurate mapping of internal features of concrete elements can bederived from the differential absorption of gamma rays. This is a specialisttechnique that has yet to be used on full-sized structural elements, but initiallaboratory studies are promising.
8.4.3.2 Backscatter methods. It is generally considered that this method tests thedensity of the outer 100mm of concrete. The γ-ray source and detector are fixedclose together in a suitably screened frame which is placed on the concrete surface.A typical device of this type has source and detector angled at approximately 45°to the surface and at a spacing of approximately 250 mm. In this case the rayspropagate through the concrete at an angle to the surface and the intensity ofradiation returning to the surface at this fixed distance from the source is measuredas illustrated in Figure 8.13.
If density measurements are required at a greater depth, a device consisting of ascreened source and detector assembly which may be lowered into a singleborehole may be used. Simpson (280) and others have developed calibratedgauges based on the backscatter technique to permit quantitative assessment ofthe bulk density of concrete, but the results obtained from other forms ofequipment can be used for comparative measurements. While this method appearsto be simple, difficulties may arise from the non-uniform radiation absorptioncharacteristics of concrete, and inaccuracies may result where there is a density
Figure 8.13 Backscatter radiometry.
Copyright 1996 Chapman & Hall
gradient. A number of instruments using the backscatter method are commerciallyavailable, with provision also for near-surface direct measurements up to 300 mmdeep, with a drilled hole; some instruments also permit neutron moisturemeasurement (see section 7.2.2).
8.4.3.3 Limitations and applications. A major problem with γ-radiometry is theexpense of the detecting equipment, which requires skilled personnel for itsoperation, although this has been reduced with the development of commerciallyavailable gauges. Scintillation detectors have been favoured in recent years becauseof the higher maximum count rate which permits the use of a less intense source.The direct method offers the greatest versatility, despite path restrictions, and can beused to detect reinforcement or member thickness in addition to densitymeasurements. Backscatter methods are limited to surface density measurements inmost cases. Although valuable in specialized in-situ situations when large numbersof repetitive measurements are required, or as a quality control method for precastconstruction, radiometry is unlikely to replace conventional gravimetric methods ofdensity determination when the number of specimens is small.
8.5 Holographic and acoustic emission techniques
Attempts have been made in recent years to apply these established techniques tothe examination of concrete structures. Both provide means of monitoring theintitiation of cracking under increasing load, and although successful applicationhas so far been reported only for laboratory use, it is possible that they may befurther developed for in-situ load test monitoring.
8.5.1 Holographic techniquesHolographic techniques provide a method of measuring minute surfacedisplacements by examination of the fringe patterns generated when the surfaceis illuminated by a light beam and photographed under successive loadingconditions, and the results superimposed. Hawkins et al. (283) have describedthe application of these methods to concrete models in the laboratory and haveconcluded that holographic interferometry, which is capable of measuring out-of-plane displacements of the order of one wavelength of the light used, andspeckle holography, which can detect in-plane movements of less than onewavelength, are the most useful. In both cases the elimination of vibrations andrigid body motions is essential. Whilst the latter can be achieved by rigidlyfixing the optics to the member under test, the elimination of vibrations poses aserious problem even under laboratory conditions. Although these methods maypermit the examination of crack development in the laboratory, the equipmentis complex and the practical problems associated with site usage appear to bedifficult to overcome. Recent developments in laser technology may howeverhelp in this respect.
Copyright 1996 Chapman & Hall
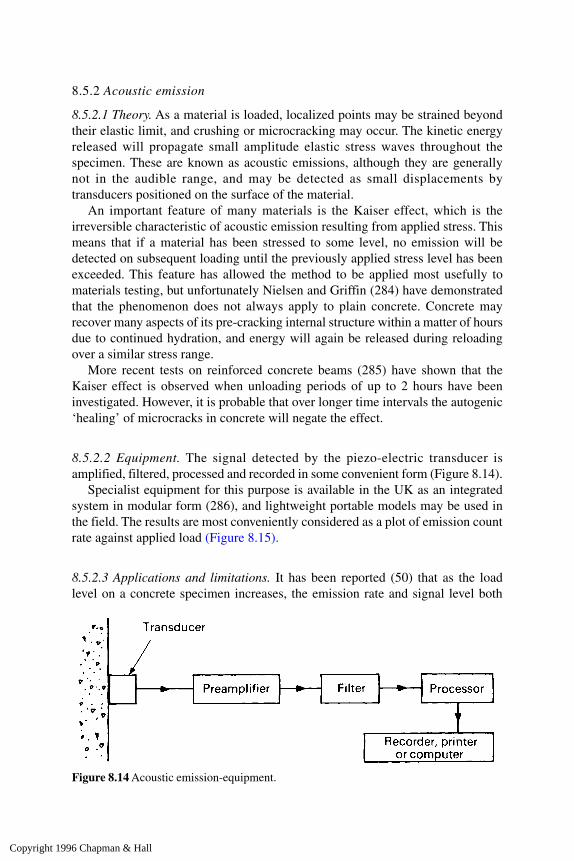
8.5.2 Acoustic emission
8.5.2.1 Theory. As a material is loaded, localized points may be strained beyondtheir elastic limit, and crushing or microcracking may occur. The kinetic energyreleased will propagate small amplitude elastic stress waves throughout thespecimen. These are known as acoustic emissions, although they are generallynot in the audible range, and may be detected as small displacements bytransducers positioned on the surface of the material.
An important feature of many materials is the Kaiser effect, which is theirreversible characteristic of acoustic emission resulting from applied stress. Thismeans that if a material has been stressed to some level, no emission will bedetected on subsequent loading until the previously applied stress level has beenexceeded. This feature has allowed the method to be applied most usefully tomaterials testing, but unfortunately Nielsen and Griffin (284) have demonstratedthat the phenomenon does not always apply to plain concrete. Concrete mayrecover many aspects of its pre-cracking internal structure within a matter of hoursdue to continued hydration, and energy will again be released during reloadingover a similar stress range.
More recent tests on reinforced concrete beams (285) have shown that theKaiser effect is observed when unloading periods of up to 2 hours have beeninvestigated. However, it is probable that over longer time intervals the autogenic‘healing’ of microcracks in concrete will negate the effect.
8.5.2.2 Equipment. The signal detected by the piezo-electric transducer isamplified, filtered, processed and recorded in some convenient form (Figure 8.14).
Specialist equipment for this purpose is available in the UK as an integratedsystem in modular form (286), and lightweight portable models may be used inthe field. The results are most conveniently considered as a plot of emission countrate against applied load (Figure 8.15).
8.5.2.3 Applications and limitations. It has been reported (50) that as the loadlevel on a concrete specimen increases, the emission rate and signal level both
Figure 8.14 Acoustic emission-equipment.
Copyright 1996 Chapman & Hall
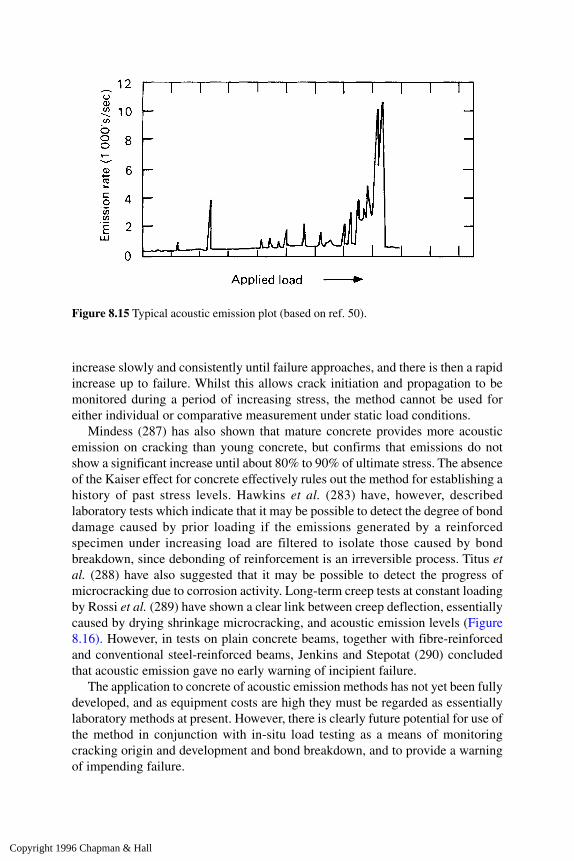
increase slowly and consistently until failure approaches, and there is then a rapidincrease up to failure. Whilst this allows crack initiation and propagation to bemonitored during a period of increasing stress, the method cannot be used foreither individual or comparative measurement under static load conditions.
Mindess (287) has also shown that mature concrete provides more acousticemission on cracking than young concrete, but confirms that emissions do notshow a significant increase until about 80% to 90% of ultimate stress. The absenceof the Kaiser effect for concrete effectively rules out the method for establishing ahistory of past stress levels. Hawkins et al. (283) have, however, describedlaboratory tests which indicate that it may be possible to detect the degree of bonddamage caused by prior loading if the emissions generated by a reinforcedspecimen under increasing load are filtered to isolate those caused by bondbreakdown, since debonding of reinforcement is an irreversible process. Titus etal. (288) have also suggested that it may be possible to detect the progress ofmicrocracking due to corrosion activity. Long-term creep tests at constant loadingby Rossi et al. (289) have shown a clear link between creep deflection, essentiallycaused by drying shrinkage microcracking, and acoustic emission levels (Figure8.16). However, in tests on plain concrete beams, together with fibre-reinforcedand conventional steel-reinforced beams, Jenkins and Stepotat (290) concludedthat acoustic emission gave no early warning of incipient failure.
The application to concrete of acoustic emission methods has not yet been fullydeveloped, and as equipment costs are high they must be regarded as essentiallylaboratory methods at present. However, there is clearly future potential for use ofthe method in conjunction with in-situ load testing as a means of monitoringcracking origin and development and bond breakdown, and to provide a warningof impending failure.
Figure 8.15 Typical acoustic emission plot (based on ref. 50).
Copyright 1996 Chapman & Hall

8.6 Photoelastic methods
Photoelastic and similar techniques for tests on concrete members will be relatedto load testing or monitoring (Chapter 6). Photoelastic coatings may be bonded tothe concrete surface and will develop the same strains and act like a continuousfull-field strain gauge. Commercially produced sheets of 1–3 mm thickness areavailable for flat surfaces, and ‘contoured’ sheeting may be produced to fit curvedsurfaces. A portable reflection polariscope can be used to produce an overall strain
Figure 8.16 Acoustic emission tests on creep specimens (based on ref. 289).
Copyright 1996 Chapman & Hall

pattern, and Redner (291) claims that measurement of fringes by an experiencedoperator can yield concrete stress sensitivities of ±0.15 N/mm2 in the laboratoryor ±0.35 N/mm2 under field conditions.
Moiré fringe techniques, in which two sets of equidistant parallel lines are placedclose together and their relative movement measured, are also described by Redner(291). A grid is cemented to the structure and compared with a master by reflectedlight. The technique may be used in similar situations to a photoelastic coating but isrestricted to flat surfaces and has a lower sensitivity than photoelastic methods.
The principal use of these methods for the testing of concrete in structures willbe to determine patterns of behaviour at stress concentrations, or in complexlocalized areas under an increasing load or with time. They are best suited to alaboratory environment, although field use is possible.
8.7 Maturity and temperature matched curing
These two techniques may be useful when attempting to monitor performance interms of in-situ concrete strength development for timing of safe formwork or propremoval, application of loading (including pre-stress) or some similar purpose.Companion test cubes or cylinders stored in air alongside the pour will notexperience the same temperature regime as the concrete in the pour, and will usuallyindicate lower early age strength values. Even if covered by damp hessian or plasticsheeting, test specimens in steel moulds will remain close to air temperature whilein-situ concrete temperatures may commonly rise initially by up to 20° or 30°Cwithin the first 12 hours after casting and remain above ambient for several days.The effect of this is particularly critical in cold weather, when the true in-situ strengthmay be seriously underestimated by companion specimens. Maturity andtemperature matched curing approaches both involve measurement of within-pourtemperatures to overcome this problem, but location of test points is critical becauseof the internal temperature variations which will exist.
8.7.1 Maturity measurementsStrength development is a function of time and temperature, and for a particularconcrete mix and curing conditions this may be related to the maturity, which isdefined as the product of time with temperature above a predetermined datum.Maturity is commonly calculated as
where M(t) is maturity in degree-hours or degree-days
∆t is time interval in hours or daysTa is average concrete temperature during time interval ∆tT0 is datum temperature.
The datum is the temperature at which concrete is assumed not to gain strengthwith respect to time and is commonly taken as -10°C.
Copyright 1996 Chapman & Hall
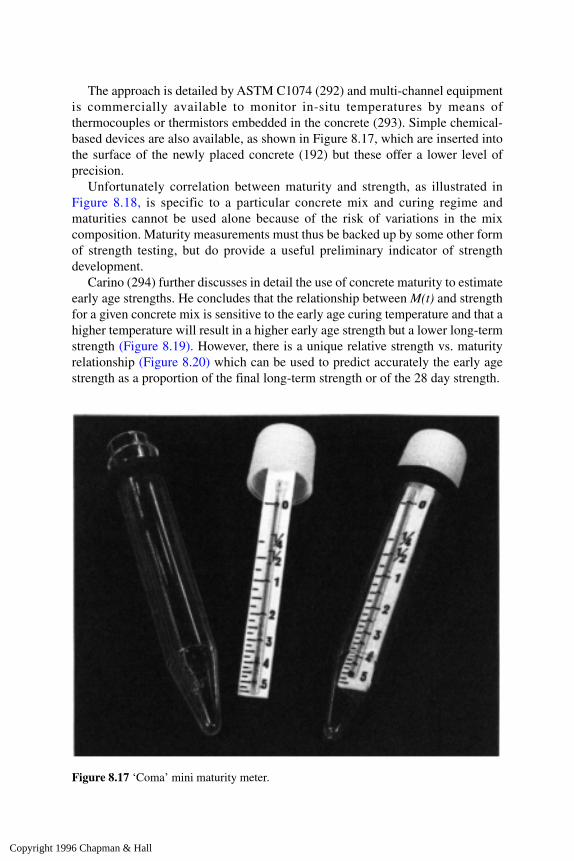
The approach is detailed by ASTM C1074 (292) and multi-channel equipmentis commercially available to monitor in-situ temperatures by means ofthermocouples or thermistors embedded in the concrete (293). Simple chemical-based devices are also available, as shown in Figure 8.17, which are inserted intothe surface of the newly placed concrete (192) but these offer a lower level ofprecision.
Unfortunately correlation between maturity and strength, as illustrated inFigure 8.18, is specific to a particular concrete mix and curing regime andmaturities cannot be used alone because of the risk of variations in the mixcomposition. Maturity measurements must thus be backed up by some other formof strength testing, but do provide a useful preliminary indicator of strengthdevelopment.
Carino (294) further discusses in detail the use of concrete maturity to estimateearly age strengths. He concludes that the relationship between M(t) and strengthfor a given concrete mix is sensitive to the early age curing temperature and that ahigher temperature will result in a higher early age strength but a lower long-termstrength (Figure 8.19). However, there is a unique relative strength vs. maturityrelationship (Figure 8.20) which can be used to predict accurately the early agestrength as a proportion of the final long-term strength or of the 28 day strength.
Figure 8.17 ‘Coma’ mini maturity meter.
Copyright 1996 Chapman & Hall

Figure 8.18 Typical strength/maturity results.
Figure 8.19 The effect of early age curing temperature on the strength-maturity relationship(based on ref. 294).
Copyright 1996 Chapman & Hall
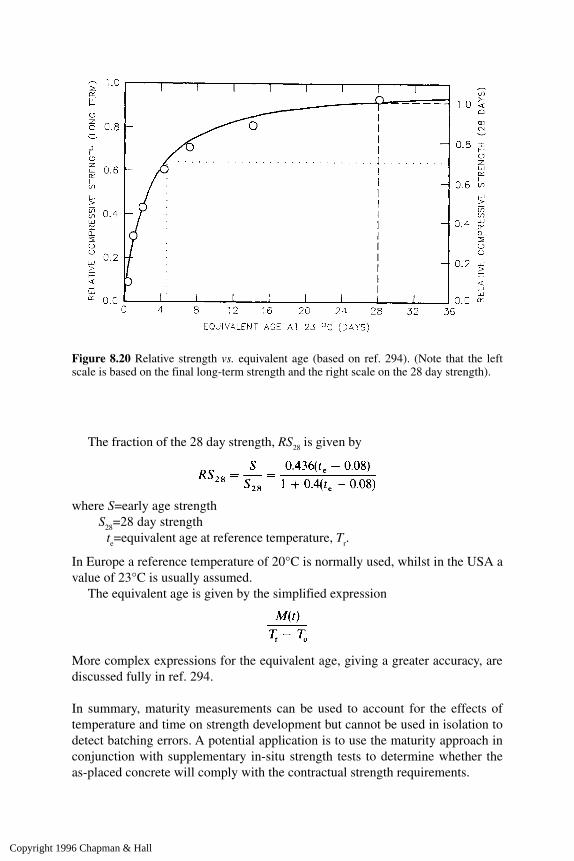
Figure 8.20 Relative strength vs. equivalent age (based on ref. 294). (Note that the leftscale is based on the final long-term strength and the right scale on the 28 day strength).
The fraction of the 28 day strength, RS28 is given by
where S=early age strengthS28=28 day strength
te=equivalent age at reference temperature, Tr.
In Europe a reference temperature of 20°C is normally used, whilst in the USA avalue of 23°C is usually assumed.
The equivalent age is given by the simplified expression
More complex expressions for the equivalent age, giving a greater accuracy, arediscussed fully in ref. 294.
In summary, maturity measurements can be used to account for the effects oftemperature and time on strength development but cannot be used in isolation todetect batching errors. A potential application is to use the maturity approach inconjunction with supplementary in-situ strength tests to determine whether theas-placed concrete will comply with the contractual strength requirements.
Copyright 1996 Chapman & Hall

8.7.2 Temperature matched curingThe temperature at a pre-selected point within the concrete element may bemonitored and used to control the temperature of a water bath in which testspecimens (cubes or cylinders) are placed. Their temperature regime, and hencematurity, will thus be identical to that at the selected point in the pour. Thesespecimens may then be tested for strength and may be related to the in-situproperties with due allowance for likely difference in compaction.
The fundamental requirements are detailed by British Standards Draft forDevelopment DD92 (295), to be revised as BS 1881: Part 130 in due course.Features include a tank with sufficient capacity to take at least four testspecimens in their moulds and with a water-circulating device and heatercapable of producing a temperature rise of at least 10°C/hr. The temperaturesensor in the concrete is coupled to control equipment which maintains the watertemperature within 1°C of the sensor temperature. A continuous record of bothtemperatures must be produced to permit conformation of the correctfunctioning of the equipment and calculation of maturity. Commerciallyavailable equipment exists which fulfils these requirements. Harrison (296) andCannon (297) have both discussed this technique, which is growing inpopularity, in greater detail.
8.8 Screed soundness tester
Floor screeds often fail by deformation under a concentrated load, such as a chairleg, and Pye and Warlow (298) have reported a test method to measuresoundness of dense floor screeds. The equipment, commonly known as the BREscreed tester, includes a 4 kg weight which is dropped one metre down a verticalrod on to a ‘foot’ to impact the surface over a 500 mm2 area. The surfaceindentation caused by four blows on the same area is measured, using a simpleportable dial gauge device. If the indentation is more than 5 mm the screed isunsatisfactory and Pye (299) has indicated classification criteria. These limitswill apply to screeds which are at least 14 days old and where the test area is flatand free of all loose dirt and grit. The test must not be used if the screed is laidover a weak or soft insulating material, as a core may be punched out, but isparticularly useful in identifying zones of poor compaction beneath anapparently good surface.
8.9 Tests for fire damage
Visual observation of spalling and colour change (9) possibly aided by surfacetapping is the principal method of assessment of fire damage. Ultrasonic pulsevelocity measurements may perhaps help (300)—see also Chapter 3—but use on
Copyright 1996 Chapman & Hall

site for this application poses many problems. Surface zone residual concretestrength can be assessed by appropriate partially destructive tests (see Chapter 6),whilst thermoluminescence, as described in section 9.12, may help to determinefire history. Further guidance regarding the assessment of fire damage is given byACI Special Publication No. 92 (301).
Copyright 1996 Chapman & Hall

9 Chemical testing and allied techniques
Chemical testing of hardened concrete is mainly limited to the identification of thecauses of deterioration, such as sulphates or chlorides, or to specificationcompliance, involving cement content, aggregate/cement ratio or alkali contentdetermination. Water/cement ratio, and hence strength, is difficult to assess to anyworthwhile degree of accuracy, and direct chemical methods are of limited valuein this respect. Some chemical tests are expensive, and will often only be used incases of uncertainty, or in resolving disputes, rather than as a means of qualitycontrol of concrete.
Specialist laboratory facilities are required for most forms of chemical testing.Basic procedures for the principal tests are outlined below, and emphasis has beenplaced on the interpretation and reliability of results. Techniques and proceduresare generally complex, and extreme care must be taken both during sampling andtesting if accuracies are to be achieved which are of practical value. One of themajor problems of basic chemical testing is the lack of a suitable solvent whichwill dissolve hardened cement without affecting the aggregates, and if possiblesamples of the aggregates and cement should also be available for testing. Otherinstrumental techniques, such as differential thermal analysis, requires expensiveand complex equipment together with a high degree of skill and experience, butare growing in usage. The range of techniques available to the cement chemist iswide, and many are of such a highly specialized nature that they are outside of thescope of this chapter. Attention has therefore been concentrated on those methodswhich are most commonly used for in-situ investigations, whilst the moreimportant of the other techniques are indicated together with their most commonlyused applications.
ASTM standards are available for commonly used chemical tests, but BS 1881:Part 124 (302) provides more comprehensive guidance and procedural details formany tests. These include cement content, aggregate content and grading,aggregate type, cement type, original water content and bulk density, as well aschloride, sulphate and alkali contents. These procedures apply to calcareouscements, and to natural or inorganic artificial aggregates. Additional backgroundinformation and details are given by Figg and Bowden (303), and a comprehensiveConcrete Society Technical Report offers further detailed guidance (304).
It is particularly important that an engineer requiring chemical analysis ofconcrete should be aware of the limitations of the methods available, and inparticular the effect that some materials’ properties may have on the accuracy ofanalysis. The most likely causes of lack of accuracy are:
Copyright 1996 Chapman & Hall

(i) Inadequate sampling or testing(ii) Aggregates contributing to the analysis
(iii) Cements with unusual and unknown composition(iv) Changes to the concrete from chemical attack or similar cause(v) Presence of other materials.
It is also essential that an experienced concrete analyst should be employed. Hemust be given a clear brief of the information required from testing, and allrelevant data concerning the constituents and history of the concrete must be madeavailable.
9.1 Sampling and reporting
9.1.1 SamplingThe tests undertaken on a sample will relate only to the concrete at that particularlocation in a structure. It is therefore essential that sufficient samples are taken torepresent the body of concrete under examination. Results from particular samplescannot be assumed to provide information on the concrete at points other thanthose from which the samples were taken. The natural variability of concreteproperties as well as the mobility of some chemicals (e.g. chlorides) must thus beconsidered. At least two, and preferably four, separate samples are recommendedfor volumes up to 10 m3 of concrete, and at least ten samples should be used forvery large volumes under examination followed by more extensive investigationat particular locations if necessary. It is important that, in cases of dispute,agreement is reached between all parties involved about the location and methodof sampling, together with the extent of the material which is to be considered tobe represented by the sample.
The basic requirements for a sample for chemical analysis are that:
(i) The minimum linear dimension should be at least five times themaximum aggregate size
(ii) The sample should be in a single piece(iii) The sample should be free from reinforcement and foreign matter unless
they are the subject of the test. The sample should be clearly labelled with the date, precise location andmethod of sampling with any other relevant details and sealed in a heavy-dutypolythene bag, which is also labelled. The size of the sample will varyaccording to the tests to be performed; some tests may require only a smalldrilled dust sample whilst others will need a sizeable lump of concrete. Mostchemical tests can be carried out on a sample obtained from a core aftercompressive testing, although if an undamaged specimen is required fororiginal water content determination an untested core will be required. In
Copyright 1996 Chapman & Hall
many cases it will be necessary to determine the cement content of the concretein addition to the particular component under examination (e.g., water content,sulphate content, etc.). The original sample must therefore be large enough toallow for all the tests to be performed. The quantities of sample subjected topreparation, such as grinding, should also take account of this. It is importantthat the sampling method does not influence the sample in relation to theproperty to be measured, for example by washing-out.
9.1.2 ReportingIt is desirable that the reports must contain the following information in additionto that required by BS 1881: Part 124 (302):
(i) Methods used(ii) Variation to standard methods, with justification
(iii) Assumptions made, such as aggregate type or properties, withjustification
(iv) Raw analytical data(v) Conclusions with a statement of their reliability.
BS 1881: Part 124 further requires that full details of identification marks shouldbe given with a full qualitative description of the sample. Particular reference mustbe made to factors which are likely to reduce the accuracy of results. Details ofother results obtained coincidentally to the principal tests, or any tests done at theanalyst’s discretion, should also be given.
9.2 Cement content and aggregate/cement ratio
9.2.1 TheoryThe most common methods for determining the cement content of a hardenedmortar or concrete are based on the fact that lime compounds and silicates inPortland cement are generally much more readily decomposed by, and solublein, dilute hydrochloric acid, than the corresponding compounds in aggregate.The quality of soluble silica or calcium oxide is determined by simpleanalytical procedures, and if the composition of the cement is known, thecement content of the original volume of the sample can be calculated.Allowance must be made for any material which may be dissolved from theaggregate, and representative samples of aggregate should be analysed byidentical procedures to permit corrections to be made. It will not be possibleto treat all concretes in an identical manner because of differences in aggregateproperties, but the aggregate/cement ratio will be found as well as cementcontent, whichever method is used.
Copyright 1996 Chapman & Hall

9.2.2 ProceduresASTM C85 (305) uses a crushed sample, dehydrated at 550°C for three hours andtreated with 1:3 hydrochloric acid. Dissolved silica is determined by standardchemical methods, and the filtrate from this is then tested for calcium oxidecontent. Calculations depend upon the nature of the aggregate (a sample of whichmust be available) and figures are provided to assist interpretation.
The techniques recommended by BS 1881: Part 124 (302) are more complex,but follow the same basic procedures with variations in the significance placedupon analytical methods according to the type of aggregate. Aggregates areclassified into three broad groups for this purpose:
Type I—Natural aggregates essentially insoluble in dilute HClType S—Natural aggregates mainly soluble in dilute HClType O—Other aggregates.
9.2.2.1 Sample preparation. The sample is initially broken into lumps not largerthan about 50 mm, taking care as far as possible to prevent aggregate fracture.These are dried in an oven at 105°C for 15–24 hours, allowed to cool to roomtemperature, and divided into sub-samples.
A portion of the dried sample is crushed, ground, and subdivided to provide apowder which passes a 150 µm fine mesh sieve. The recommended procedure isdetailed, but care is essential if a representative sample is to be obtained. Theoperations should also be performed as quickly as possible to minimize exposureto atmospheric carbon dioxide.
The portion is first crushed to pass a 5.0 mm sieve and a subsample of 500–1000 g obtained, which is then crushed to pass a 2.63 mm sieve and quartered togive a sample which is ground to pass a 600 µm sieve. This is also quartered andfurther ground to pass the 150 µm sieve.
9.2.2.2 Determination of calcium oxide content alone. A portion of the preparedanalytical sample weighing 5±0.005 g is treated with boiling dilute hydrochloricacid. Triethanolamine, sodium hydroxide and calcein indicator are added to thefiltered solution which is then titrated against a standard EDTA solution. The CaOcontent may be calculated to the nearest 0.1% in this way.
Reliance upon measurements of CaO content alone may be consideredacceptable if the calcium oxide content of the aggregate is less than 0.5%, butadditional determination of soluble silica content is recommended.
9.2.2.3 Determination of soluble silica, calcium oxide and insoluble residue.Soluble silica is extracted from a 5±0.005 g portion of the prepared sample bytreatment with hydrochloric acid and the insoluble residue collected by filtering.The filtrate is reduced by evaporation and treated with hydrochloric acid andpolyethylene oxide before again being filtered and diluted to provide a stocksolution.
Copyright 1996 Chapman & Hall

The filter paper containing the precipitate produced at this last stage is ignitedin a weighed platinum crucible at 1200±50°C until constant mass is achieved,before cooling and weighing. The soluble silica content can be calculated to thenearest 0.1% from the ratio of the weight of the ignited residue to that of theanalytical sample.
The calcium oxide content is determined from the stock solution usingprocedures similar to those in section 9.2.2.2. The insoluble residue is determinedfrom the material retained during the initial filtration process by repeatedtreatment with hot ammonium chloride solution, hydrochloric acid and hot waterfollowed by ignition in a weighed crucible to 925±25°C.
9.2.2.4 Calculation of cement and aggregate content. The cement content shouldbe calculated separately from both the measured calcium oxide and soluble silicacontents, unless the calcium oxide content of the aggregate is less then 0.5% (seesection 9.2.2.2), or greater than 35% in which case results based on calcium oxideare not recommended. In the latter case, if the soluble silica content of theaggregate is greater than 10% analysis should be undertaken to determine someother constituent such as iron or aluminium compound known to be present insubstantially different amounts in the cement and aggregate. This shouldpreferably be present in the larger quantity in the cement.
It is assumed that the combined water of hydration is 0.23×the percentagecement content, and that 100% oven dried concrete consists of C% cement+R%aggregate+0.23C% combined water of hydration. Thus if
a=calcium oxide or soluble silica content of cement (%)b=calcium oxide or soluble silica content of aggregate (%)c=measured calcium oxide or soluble silica content of the analytical
sample (%),
then percentage cement content
% (to nearest 0.1%) and percentage aggregate content
% (to nearest 0.1%) thus the aggregate/cement ratio=R/C to the nearest 0.1.
The cement content by weight is given by
If coarse and fine aggregates have differing calcium oxide and soluble silica
Copyright 1996 Chapman & Hall
contents the overall weighted means should be used as the values for b determinedon the basis of assessed grading, mix design or visual inspection.
Use of these expressions requires an analysis of both the cement andaggregate to be available. If an analysis for the cement is not available,ordinary and rapid hardening cements complying with the relevant BritishStandard may be assumed with little loss in accuracy to have a calcium oxidecontent of 64.5%. An assumed soluble silica content of 20.7% is less reliable.Appendix A of BS 1881: Part 124 (302) provides detailed typical analyses ofthese and other common cement types. Absence of an aggregate analysis posesgreater problems, although in some cases the silica content may justifiably beassumed to be zero (many laboratories are known to use a value of 0.5% silicacorrection as routine), and for type I aggregates the calcium oxide contentmay be taken as zero. Otherwise microscopic examination may be necessary(see section 9.11).
If the two estimated cement contents are within 25 kg/m3 or 1% by mass, thevalue is adopted. If a greater difference exists, and no reason can be found for thediscrepancy, both results may be quoted with an indication of the preferred valuebased on the factors outlined above.
Where pulverized fuel ash or natural pozzolans have been used as reactivecomponents it is difficult to determine the content of the addition, but anapproximate estimate may be made of the ordinary Portland cement contentprovided the added material has a calcium oxide content below about 2%.Mathematical methods involving the use of X-ray fluorescence techniques todetermine slag and pfa contents have however recently been reported (306), andother techniques involving chemical analysis of individual grains are believedto be in use. Provided that such additions have not been used, a value ofaggregate content may be calculated from the insoluble residue values of theanalytical sample and of the aggregate assuming no insoluble residue in thecement. Where the aggregate is type I, the percentage insoluble residue valueobtained for the analytical sample may be taken as the percentage cementcontent.
9.2.3 Reliability and interpretation of resultsThe procedures used above will yield the Portland cement content of a hardenedconcrete, whilst the content of blended cements can only be determined if theactual analysis of the blend is known. It is however virtually impossible tomeasure the relative proportions of the blended ingredients. The ConcreteSociety Technical Report (304) provides details of extensive precision trialsinvolving several test laboratories. Errors may be divided into those caused bysampling, for which ±50 kg/m3 for one sample reducing to ±25 kg/m3 for foursamples may be assumed, and those due to testing. Testing accuracy isdependent upon the aggregate type and test procedures, but may be of the orderof ±15 kg/m3 for limestone ranging to ±40 kg/m3 for flint aggregates.
Copyright 1996 Chapman & Hall
Combining these effects typically gives an overall accuracy of between ±30 kg/m3 to ±50 kg/m3 based on the mean of four independent samples. A figure of±45 kg/m3 is often regarded as typical for a gravel concrete with a cementcontent of the order of 350 kg/m3. This value will be considerably worse foratypical cements, or when blast furnace slag or pulverized fuel ash are present.Whenever assumptions about the contribution of acid-soluble aggregatecomponents must be made because of lack of availablity of a separate sample,the accuracy will decrease. Similarly, assumptions of CaO and SiO2 proportionsin the cement will affect accuracy, but since the range of CaO in a typical UKPortland cement is less than that of SiO2, assumptions based on CaO should bepreferred whenever possible. If the aggregate effect is high, the silica approachmay be used, but although this is less aggregate-sensitive it is not so easy orreliable.
The importance of careful sampling and sample preparation cannot beoveremphasized. If the aggregates prevent analysis of cement content andaggregate/cement ratio by chemical means, it may be possible to obtain estimatesbased on micrometric methods outlined in section 9.11, or by instrumentaltechniques such as X-ray fluorescence spectrometry.
Whatever method is used to determine cement content, it is essential torecognize that no statistical statement about a particular batch of concrete can bemade from a test on a single sample. Where several separate samples are used, anestimate of an average value may be possible, and a minimum of four individualsamples should be used to obtain a reliable estimate. Selection of the location forthese should preferably take account of variations caused by position in mixerdischarge, bearing in mind that for a truck mixer the first portion will generally bericher than average whilst the later portions may be leaner. Differences of up to100 kg/m3 have been reported (304) between the top and bottom of walls andcolumns.
9.3 Original water content
9.3.1 TheoryThe quantity of water present in the original concrete mix can be assessed bydetermining the volume of the capillary pores which would be filled with water atthe time of setting, and measuring the combined water present as cement hydrates.The total original water content will be given by the sum of the pore water andcombined water. This approach was originally developed by Brown (307) andforms the basis of the BS 1881: Part 124 method (302). It requires a single sampleof concrete which has not been damaged either physically or chemically. Usuallythe water/cement ratio is of greatest interest, so that a cement contentdetermination will also be necessary. Alternative methods of assessing water/cement ratios include thin section microscopy and reflected light fluorescencemicroscopy (308).
Copyright 1996 Chapman & Hall
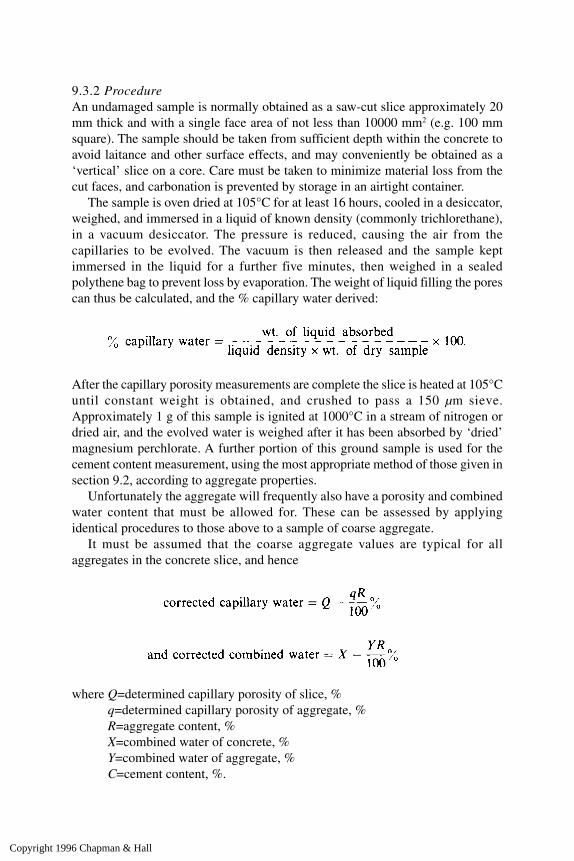
9.3.2 ProcedureAn undamaged sample is normally obtained as a saw-cut slice approximately 20mm thick and with a single face area of not less than 10000 mm2 (e.g. 100 mmsquare). The sample should be taken from sufficient depth within the concrete toavoid laitance and other surface effects, and may conveniently be obtained as a‘vertical’ slice on a core. Care must be taken to minimize material loss from thecut faces, and carbonation is prevented by storage in an airtight container.
The sample is oven dried at 105°C for at least 16 hours, cooled in a desiccator,weighed, and immersed in a liquid of known density (commonly trichlorethane),in a vacuum desiccator. The pressure is reduced, causing the air from thecapillaries to be evolved. The vacuum is then released and the sample keptimmersed in the liquid for a further five minutes, then weighed in a sealedpolythene bag to prevent loss by evaporation. The weight of liquid filling the porescan thus be calculated, and the % capillary water derived:
After the capillary porosity measurements are complete the slice is heated at 105°Cuntil constant weight is obtained, and crushed to pass a 150 µm sieve.Approximately 1 g of this sample is ignited at 1000°C in a stream of nitrogen ordried air, and the evolved water is weighed after it has been absorbed by ‘dried’magnesium perchlorate. A further portion of this ground sample is used for thecement content measurement, using the most appropriate method of those given insection 9.2, according to aggregate properties.
Unfortunately the aggregate will frequently also have a porosity and combinedwater content that must be allowed for. These can be assessed by applyingidentical procedures to those above to a sample of coarse aggregate.
It must be assumed that the coarse aggregate values are typical for allaggregates in the concrete slice, and hence
where Q=determined capillary porosity of slice, %
q=determined capillary porosity of aggregate, %R=aggregate content, %X=combined water of concrete, %Y=combined water of aggregate, %C=cement content, %.
Copyright 1996 Chapman & Hall

If it is assumed that no water of hydration has been replaced by carbon dioxide,the original free water/cement ratio is given by the sum of the above expressionsdivided by the cement content C%. The original total water/cement ratio cansimilarly be derived using the uncorrected percentage capillary porosity Q withthe corrected percentage of combined water.
If aggregate control samples are not available it must be assumed that thecombined water of hydration is typically 0.23 times the percentage cementcontent. This value is often adopted as a matter of routine because ofinaccuracies which are likely in combined water measurements. The capillaryporosity of the aggregate may also be taken to be equal to the water absorptionvalue of the aggregate, if this is known, thus permitting an estimate of originalfree water/cement ratio. If the aggregate absorption value is not known, thenonly the original total water/cement ratio can be quoted and is given by (Q/C)+0.23.
9.3.3 Reliability and interpretation of resultsSince this determination requires a sound specimen of concrete, strength-testedcores or cubes cannot be used. It is suggested that a precision better than ±0.1 forthe original water/cement ratio is unlikely to be achieved even under idealconditions (304). A major source of difficulty lies in the corrections for aggregateporosity and combined water which may be overestimated by the procedures used.This will lead to an underestimate of the true original water content although it isalso possible that continued hydration in older concretes may lead to low apparentoriginal water/cement ratios. The original cement content must also be measuredwith reasonable accuracy, and the problems associated with this are discussed insection 9.2.
The method is not suitable for semi-dry or poorly compacted concrete,although in the case of air entrainment, Neville (309) suggests that since thevoids are discontinuous they will remain air-filled under vacuum and willabsorb no water although this view is regarded by others as doubtful. If this isthe case, entrained air will not affect the results, which are influenced only bycapillary voids. Carbonated concrete must also be avoided. Where theaggregates are very porous or contain an appreciable amount of combinedwater the corrections required will be so large that the results may be of littlevalue. This shortcoming is likely to limit the value of the method for artificialaggregates.
9.4 Cement type and cement replacements
9.4.1 TheoryThe basic type of cement used in a concrete may be established by separationand chemical analysis of the matrix, for comparison with established
Copyright 1996 Chapman & Hall
analyses of particular cement types. Alternatively, microscopic examinationcan be used to detect unhydrated cement particles which can be comparedwith known specimens. The complexity of the analysis varies according tocement type, admixture, replacements and aggregates, and BS 1881: Part124 (302) strongly recommends that chemical analysis should besupplemented by microscopic examination. It is not possible to distinguishbetween ordinary and rapid hardening Portland cements, although cementreplacements can usually be detected. Complex techniques such asdifferential thermal analysis may also be used to establish cement type on acomparative basis. A simple site test has been developed for high aluminacement identification (see section 9.4.2.4).
9.4.2 Procedures
9.4.2.1 Analysis of matrix. A very fine sample is obtained by sieving material froma broken piece of concrete through a 90µm mesh. It is essential that this containsno more than minute traces of aggregate which may contribute to the analysis.The very fine sample can then be analysed for basic cement components such asSiO2, CaO, A12O3, Fe2O3, MgO and SO3 and the resulting composition comparedwith analyses of known cements.
9.4.2.2 Microscopic method. A small solid piece of concrete, about 20 mmcube, should be selected, preferably not containing any large aggregate piecesnor having a finished surface. This is dried for 12 h at 105°C and embedded inepoxy mortar before saw cutting and grinding with carborundum powder. Thesurface is finally polished with diamond powder and examined by reflectedlight microscopy. Coarse unhydrated cement particles will be visible, andthese may be etched to show the phases characteristic of cement type. BS1881: Part 124 (302) offers guidance concerning the most appropriate etchingmethods, and comparative reference specimens of known cement type may bevaluable for identification. Power and Hammersley (310), Petersen andPoulsen (192) and French (311) have also described approaches using thinmicroscopic sections.
9.4.2.3 Cement replacements. The most commonly used cement replacementsare blast furnace slag and pulverised fuel ash (pfa). Blast furnace slags containconsiderably higher levels of manganese and sulphides than are to be found innormal cements, and this can be used for their identification by chemicalanalysis. If the slag is from a single source of known composition it may bepossible to obtain quantitative data, provided there is no slag in the aggregate. Acharacteristic green or greenish black coloration of the interior of the concrete
Copyright 1996 Chapman & Hall
may aid identification, and microscopic methods may also be used. Pfa is mosteasily detected by microscopic examination of the acid-insoluble residue of asample of separated matrix. Particular characteristic spherical particle shapesmay be recognized, although quantitative assessment of the pfa content is notpossible. Microscopic examination of thin sections as described by Power andHammersley (310) and French (311) may also be used.
9.4.2.4 Identification of high alumina cement (simple method). A simple rapidchemical test for the identification of high alumina cement has been developed byRoberts and Jaffrey (312). Whilst this type of cement can be identified bymicroscopic or complex methods such as X-ray spectrometry, the need for asimple test that could be used on site arose following problems with this materialin the UK. This method is based on the assumption that an appreciable quantity ofaluminium will be present in HAC concrete dissolved in dilute sodium hydroxide,whereas little will be found in a similar solution of Portland or other types ofcement.
A powdered sample is obtained by drilling by masonry drill, or by crushingsmall pieces of concrete with a pestle and mortar and grinding after removal ofaggregate particles. Approximately 1 g of this powdered sample is placed in a25ml test tube with about 10ml of 0.1 N cold sodium hydroxide solution, sealedand then shaken by hand for 2–3 minutes. The solution is then filtered through amedium-grade paper and the filtrate acidified with five drops of dilute HCl. Tendrops of ‘Oxine’ and 1ml ammonium acetate are then added, and if aluminium ispresent in appreciable quantities, as in HAC, turbidity and the formation of ayellow precipitate will occur. If the solution remains clear or only slightly cloudy,HAC is not likely to be present. The presence of gypsum, which may result fromcontamination of the sample by plaster, can interfere with the test and producemisleading results. Care must therefore be taken to avoid such contaminationduring sampling.
9.4.3 Reliability and interpretation of resultsBoth chemical and microscopic methods of cement type determination rely upona carefully prepared sample and a great deal of specialist skill and experience.Whilst under favourable conditions it should be possible to identify cement type,neither method is accurate enough to tell whether that cement complied with aparticular specification. Cement replacements can usually be identified, but thelevel can only be determined for blast furnace slag, and then ony if conditionsconcerning the source and aggregate properties are favourable. The simple HACdetermination method has been developed for site use and has proved to be areliable indicator of the presence of this type of cement provided that sampling iscarefully executed.
Copyright 1996 Chapman & Hall

9.5 Aggregate type and grading
9.5.1 Aggregate typeThis is best determined in a cut slice or core which will allow the cut sections ofaggregate to be examined visually, physically or chemically to determine its type.ASTM 856 (313) provides guidance on petrographic examination. The descriptionand group classification of aggregates is dealt with in BS 812: Part 1 (314) butpetrographical examination by a qualified geologist is required. If a more detailedanalysis relating to mineralogy, texture and microstructure is needed microscopicmethods described by Power and Hammersley (310) and French (311) may beuseful. These can yield information on hardness, porosity, permeability, specificgravity and thermal properties of the aggregate as well as the presence ofpotentially deleterious substances. This is also the only reliable method ofdistinguishing between frost attack and alkali/aggregate reactions as the cause ofdeterioration of hardened concrete.
In many instances a detailed aggregate identification will be unnecessary, anda broad chemical classification based on reaction with acid will be adequate. Thiswill apply particularly to the selection of the analytical method to apply to theconcrete for cement content determination.
9.5.2 Aggregate gradingThis can only be reliably achieved for aggregates which are essentially insolublein dilute hydrochloric acid. An initial sample of at least 4 kg will be necessary,and a sub-sample of approximately one quarter of this will be tested. This isinitially broken down into coarse and fine fractions using a 5 mm sieve withoutfracturing the aggregate, assisted as necessary by heating. Coarse aggregateparticles are cleaned by chipping and both fractions treated with hydrochloric acidto dissolve the paste prior to sieve analysis. Care must be taken to remove chippedportions of coarse aggregate from the fines, and gradings obtained are not ofsufficient accuracy to assess compliance with detailed aggregate specifications.
9.6 Sulphate determination
The sulphate content is obtained by chemical analysis of a weighed, groundsample of concrete which is expected to contain about 1g of cement. The use of aconcentrated sample of fine materials, obtained as described in section 9.2.2.2may be worth while. This is treated with HCl, ammonia solution and bariumchloride solution to obtain a precipitate which is ignited at 800°C–900°C andweighed. If the sulphate content of the original sample exceeds about 3% of thecement content for Portland cement concretes, chemical attack may be indicated.A cement content determination must therefore be performed in conjunction withsulphate tests, and an accuracy better than ±0.3% SO3/cement is unlikely.
Copyright 1996 Chapman & Hall
Specialized instrumental techniques (see section 9.13) are growing in popularityand may improve on this accuracy.
Cases of suspected sulphate attack may be identified by measuring the sulphatedistribution between sulphoaluminate and gypsum. Since sulphoaluminate isstable only in alkaline conditions and is converted to gypsum by acid, attack bygroundwater may be detected and distinguished from the products of suphur-oxidizing bacteria.
Sulphate attack may also be identified by petrographic methods (see section9.11) involving the microscopic study of thin sections to reveal the presence ofcrystalline calcium sulphoaluminate. This is commonly known as ettringite andmay be found along cracks when reactions have occurred between sulphate-bearing solutions and the cement paste. When high alumina cement is used,complex methods such as differential thermal analysis may be required (seesection 9.13).
9.7 Chloride determination
The need to assess the chloride content of hardened concrete is most likely toarise in relation to the corrosion risk to embedded reinforcement or ties. Smallquantities of chloride (up to approx. 0.01% chloride ion by weight of concrete)will normally be present in concrete, but substantially more can result if calciumchloride (as an admixture) or sea-dredged aggregates are used, and may present apotential hazard. Chlorides may also be absorbed from the surface, as in thepresence of sea water or de-icing salts, or enter through cracks in the concrete. Insome parts of the world, such as the Middle East, contaminated sand may alsopresent a major problem.
9.7.1 ProceduresIn addition to the ‘Volhard’ laboratory method described in BS 1881: Part 124(302), X-ray fluorescence spectrometry and other sophisticated techniquesmay be used to determine chloride content. Simplified methods are alsoavailable which may be suitable for site use, athough the accuracy of thesewill be lower than is possible from a detailed analysis. The Building ResearchEstablishment has outlined procedures in information sheets (315, 316) fortwo common methods, and other available methods have been compared byFigg (317).
Whichever analysis technique is to be used, a powdered sample of concreteis required with a total weight of at least 25 g. This can be obtained by themethods described previously (section 9.2.2), usually from sliced cores or elseby drilling with a masonry bit in a hand-held slow-speed rotary percussion drill(Figure 9.1). Care must be taken to avoid steel, which may be located byCovermeter. Views differ concerning sampling techniques using drilling (317)
Copyright 1996 Chapman & Hall
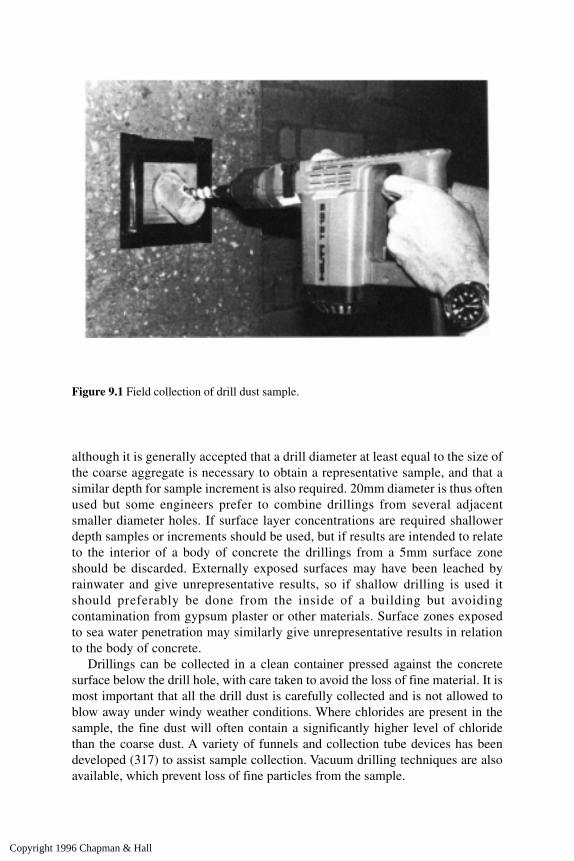
although it is generally accepted that a drill diameter at least equal to the size ofthe coarse aggregate is necessary to obtain a representative sample, and that asimilar depth for sample increment is also required. 20mm diameter is thus oftenused but some engineers prefer to combine drillings from several adjacentsmaller diameter holes. If surface layer concentrations are required shallowerdepth samples or increments should be used, but if results are intended to relateto the interior of a body of concrete the drillings from a 5mm surface zoneshould be discarded. Externally exposed surfaces may have been leached byrainwater and give unrepresentative results, so if shallow drilling is used itshould preferably be done from the inside of a building but avoidingcontamination from gypsum plaster or other materials. Surface zones exposedto sea water penetration may similarly give unrepresentative results in relationto the body of concrete.
Drillings can be collected in a clean container pressed against the concretesurface below the drill hole, with care taken to avoid the loss of fine material. It ismost important that all the drill dust is carefully collected and is not allowed toblow away under windy weather conditions. Where chlorides are present in thesample, the fine dust will often contain a significantly higher level of chloridethan the coarse dust. A variety of funnels and collection tube devices has beendeveloped (317) to assist sample collection. Vacuum drilling techniques are alsoavailable, which prevent loss of fine particles from the sample.
Figure 9.1 Field collection of drill dust sample.
Copyright 1996 Chapman & Hall

9.7.1.1 Laboratory analysis (Volhard method). This method, which is detailedin BS 1881: Part 124 (302), is relatively simple and reliable but does requirespecialized laboratory facilities and experience. A weighed portion of a groundor powdered sample which is expected to contain about 2 g cement is treatedwith hot nitric acid and then diluted, filtered and cooled. Silver nitrate andnonylalcohol are added with ferric alum indicator and titrated with ammoniumthiocyanate. It is usual to express the results as % chloride ion by weight ofconcrete or cement.
9.7.1.2 Instrumental methods. X-ray fluorescence spectrometry (section 9.13 )may be used to determine both chloride and cement content of compressedsamples. The wavelength and intensity of fluorescent radiation generated bybombardment with high-energy X-rays is compared with the characteristics ofstandard samples of known composition. The method requires specialized samplepreparation and test equipment, but analysis is quick, and chloride and cementcontent are obtained from the same sample, which is available for a repeat analysisif that should be necessary. More rapid methods such as ion chromatography anduse of ion-selective electrodes are growing in popularity and a rapid site versionof the latter approach is available (13).
9.7.1.3 ‘Hach’ simplified method. This makes use of a commercially available kit(318) for a drop count titration with silver nitrate solution in the presence ofpotassium chromate indicator. The kit includes a bottle of silver nitrate soutionwith a drop dispenser, capsules of indicator, a plastic measuring tube and a glassbottle for the titration. A powdered 5 g sample is weighed and dissolved in 50 mlof 1 N nitric acid and 5 g sodium bicarbonate is dissolved in this solution which isdecanted and filtered. A 5.75 ml sample of filtrate is measured and placed in thetitration bottle with the contents of an indicator capsule, and the silver nitratesolution is added drop by drop until there is a colour change from bright yellow toa faint reddish brown (Figure 9.2) (see reference 315 for a detailed procedure).
For a test on one 5.75 ml measure of filtrate, the percentage chloride ionby weight of concrete is given directly by the number of drops×0.03, whilstif less than four drops are required two additional measures of filtrate willbe added and the total number of drops required by the three measuresrecorded. In this case the required result is given by total number ofdrops×0.01. This method is straightforward and quick, and although aworking location is required, should be suitable for site use by staff withoutspecialist experience.
9.7.1.4 ‘Quantab’ simplified method. This method uses a commercially available‘Quantab’ test strip (319) to measure the chloride concentration of a solution. Thesolution, containing 5g powdered concrete, is obtained as described in section
Copyright 1996 Chapman & Hall
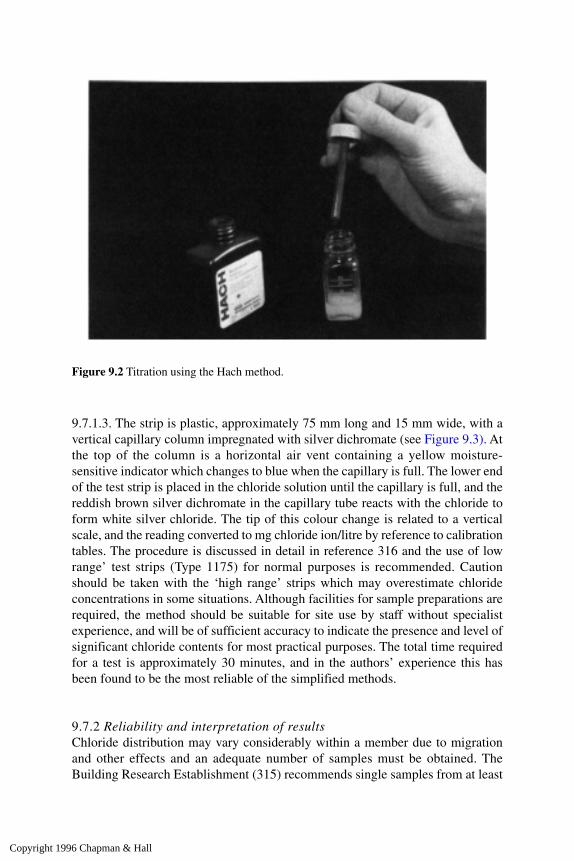
9.7.1.3. The strip is plastic, approximately 75 mm long and 15 mm wide, with avertical capillary column impregnated with silver dichromate (see Figure 9.3). Atthe top of the column is a horizontal air vent containing a yellow moisture-sensitive indicator which changes to blue when the capillary is full. The lower endof the test strip is placed in the chloride solution until the capillary is full, and thereddish brown silver dichromate in the capillary tube reacts with the chloride toform white silver chloride. The tip of this colour change is related to a verticalscale, and the reading converted to mg chloride ion/litre by reference to calibrationtables. The procedure is discussed in detail in reference 316 and the use of lowrange’ test strips (Type 1175) for normal purposes is recommended. Cautionshould be taken with the ‘high range’ strips which may overestimate chlorideconcentrations in some situations. Although facilities for sample preparations arerequired, the method should be suitable for site use by staff without specialistexperience, and will be of sufficient accuracy to indicate the presence and level ofsignificant chloride contents for most practical purposes. The total time requiredfor a test is approximately 30 minutes, and in the authors’ experience this hasbeen found to be the most reliable of the simplified methods.
9.7.2 Reliability and interpretation of resultsChloride distribution may vary considerably within a member due to migrationand other effects and an adequate number of samples must be obtained. TheBuilding Research Establishment (315) recommends single samples from at least
Figure 9.2 Titration using the Hach method.
Copyright 1996 Chapman & Hall
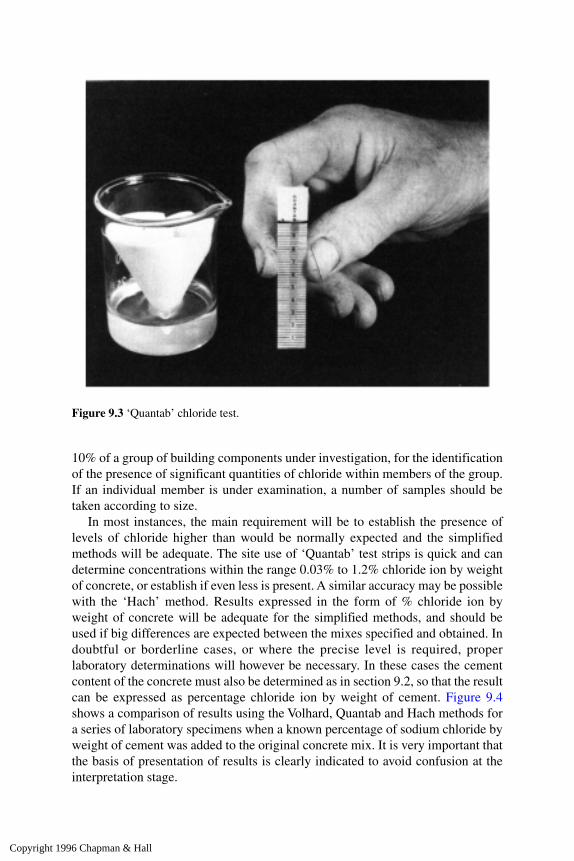
10% of a group of building components under investigation, for the identificationof the presence of significant quantities of chloride within members of the group.If an individual member is under examination, a number of samples should betaken according to size.
In most instances, the main requirement will be to establish the presence oflevels of chloride higher than would be normally expected and the simplifiedmethods will be adequate. The site use of ‘Quantab’ test strips is quick and candetermine concentrations within the range 0.03% to 1.2% chloride ion by weightof concrete, or establish if even less is present. A similar accuracy may be possiblewith the ‘Hach’ method. Results expressed in the form of % chloride ion byweight of concrete will be adequate for the simplified methods, and should beused if big differences are expected between the mixes specified and obtained. Indoubtful or borderline cases, or where the precise level is required, properlaboratory determinations will however be necessary. In these cases the cementcontent of the concrete must also be determined as in section 9.2, so that the resultcan be expressed as percentage chloride ion by weight of cement. Figure 9.4shows a comparison of results using the Volhard, Quantab and Hach methods fora series of laboratory specimens when a known percentage of sodium chloride byweight of cement was added to the original concrete mix. It is very important thatthe basis of presentation of results is clearly indicated to avoid confusion at theinterpretation stage.
Figure 9.3 ‘Quantab’ chloride test.
Copyright 1996 Chapman & Hall

If the cement content is unknown, a typical value of 14% may be assumed, andhence the percentage chloride content by weight of concrete is multiplied by afactor of seven to estimate the relationship to cement (316). Even if the cementcontent ranges between 11%–20%, the accuracy should be within ±0.2% usingthis assumption for chloride contents which are less than 0.10% by weight ofconcrete. A precise chloride determination will normally be necessary as thereferee method in disputes, but considerable savings of cost and effort may bemade by first using the simplified methods which do not require expensiveequipment or experience. Whichever method of analysis is used, when obtainingsamples by drilling, large aggregate particles should be avoided, since these maylead to an underestimate of the true percentage of chloride in the concrete. It isdifficult to improve on an overall accuracy of ±0.05% chloride ion/cement at a 95% confidence level, whatever method is used, due largely to sampling errors.
BS 8110 (320) suggests that the maximum acceptable percentage of chloride
Figure 9.4 Comparison of chloride analysis results.
Copyright 1996 Chapman & Hall

ion by weight of cement is 0.1% for prestressed concrete, or upper 95% confidencelimit of 0.4% for reinforced concrete. Deterioration caused by chlorides isdiscussed in detail by Kay et al. (321) who also suggest that a value of 0.4%chloride ion by weight of cement may be sufficient to promote corrosion ofreinforcement, although it is now generally accepted that only 0.25% chloride ionby weight of cement ingressing into hardened concrete is required to depassify thesteel reinforcemeent. Whilst these values are generalized, they may assist theinterpretation of results on chemical analysis.
9.8 Alkali reactivity tests
With the increased concern in the UK about the risks of alkali-silica reaction(ASR) causing damage to concrete (see section 7.4), tests for alkali content andalkali induced expansion have been developed.
9.8.1 Alkali contentAn analysis method for hardened concrete has been incorporated into BS1881: Part 124 (302) which involves the use of a calibrated flame photometerto assess the sodium oxide and potassium oxide contents of a treated powderedsample. A number of uncertainties exist with this method, including thepossible contribution of sodium and potassium compounds contained inaggregates but which are not readily available for reaction in concretes. It iscommon practice to remove as much as possible of the coarse aggregate andto analyse a fines-rich fraction to minimize this problem. Migration orleaching of alkalis within test specimens during sampling or storage is afurther cause of uncertainty. Precision and accuracy data for this approach arenot currently available.
9.8.2 Alkali immersion testThis is intended to give a rapid indication of the presence in a concrete sample ofsome potentially alkali-silica reactive particles, but does not prove the past orfuture occurrence of damaging ASR in the concrete. The test procedure isdescribed in detail by Palmer et al. (23). A diamond-cut surface is lapped flat, andthe sample fully immersed in a 1N concentrated alkali solution taking appropriatesafety precautions. Precautions are also necessary to prevent evaporation duringthe test period, which is usually up to 28 days at 20°C, although this may beaccelerated by higher temperatures.
Small gel growths on the prepared surface may be monitored visually, and anyreactive particles identified. Comparative photography before and after testing isessential to confirm and record results.
Copyright 1996 Chapman & Hall

9.9 Admixtures
Admixtures are frequently organic and are not easy to identify without the aid ofsophisticated equipment such as infrared absorption spectrophotometers or highpressure liquid chromatographs. Experience in the application of these to concretetechnology is limited, and assessment of the dosage used (which is frequently theprime object of the test) is dependent upon a precise knowledge of the admixture.
9.10 Carbonation
Carbonation of concrete by attack from atmospheric carbon dioxide will resultin a reduction in alkalinity of the concrete, and increase the risk ofreinforcement corrosion. This will normally be restricted to a surface layer ofonly a few millimetres thickness, in good quality concrete (322) but can bemuch deeper in poor quality concrete, with results as high as 30 mm being notuncommon. The extent of Carbonation can be easily assessed by treating withphenolphthalein indicator the freshly exposed surfaces of a piece of concretewhich has been broken from a member to give surfaces roughly perpendicularto the external face. Alternatively, incrementally drilled powdered samplesmay be sprayed or allowed to fall on indicator-impregnated filter paper.Drilled cores may also be split and sprayed with indicator to show theCarbonation front. A purple-red coloration will be obtained where the highlyalkaline concrete has been unaffected by carbonation, but no coloration willappear in carbonated zones.
The colour change of phenolphthalein corresponds to a pH of about 9whilst reinforcement corrosion may possibly commence at a pore solution pHof about 11. Thus the carbonation front indicated must be recorded asapproximate in relation to steel corrosion. The width of carbonation frontbetween these values is of the order of 2–3 mm (323), but an overall accuracyof ±5 mm is sometimes quoted for a single test using this approach. Accuracycan be improved by taking the mean of several readings, for example fivereadings can give an accuracy of ±2 mm at the 95% confidence level.Multicoloured ‘Rainbow’ indicators are also available (13) which may provideslightly more detailed information.
A number of practical difficulties may sometimes arise as discussed byTheophilus (323). These include:
(i) Freshly broken concrete giving an initially clearly defined colour changeboundary may all become coloured within about 1 minute, making theboundary indistinguishable.
(ii) White concrete may immediately register entirely uncarbonated, despitemicroscopic studies showing a significant carbonated depth. (This is lesscommon.)
Copyright 1996 Chapman & Hall

(iii) Freshly broken concrete initially registers entirely carbonated, but onsubsequent standing the pink coloration appears.
Doubtful results may often be clarified by spraying the surface with deionizedwater immediately prior to spraying with phenolphthalein, and excessivequantities of indicator should be avoided. Only the finest mist spray is required.
Direct chemical tests may be used to determine the carbonation front withgreater precision and may be justified in critical situations. These include themeasurement of evolved carbon dioxide from slices of cores, about 5 mm thick(not for calcareous aggregates), using a range of specialized techniques such asthermogravimetry.
Microscopy is probably the most precise method of measuring carbonation,including localized effects of surface cracks (192, 324). Thin sections are viewedin cross-polarized light to reveal calcium carbonate crystals, but calcareous finesmay hinder identification of carbonation.
The progression of carbonation with time is often estimated by the expression
where D is the depth in mm at age t years and K is a constant for the concrete andconditions prevailing (324). The use of this expression to predict the time for thecarbonation front to reach a specified depth will magnify the effects of theaccuracy range to which the measured carbonation value has been obtained.Watkins and Pitt Jones (325) have suggested that this above expression is asimplification and that a more reliable relationship is
D=Ktx
where x lies between 0.5 and 1.0. Good agreement has been shown for extensivesite data from Hong Kong with K and x varying according to strength level.Carbonation rates are usually higher in dry or sheltered external concrete than inthat exposed to rain; thus differing faces of a structure or element are likely toshow different carbonation depths. These factors have been discussed more fullyby Somerville (2), whilst assessment of resulting corrosion risk is summarized bySims (324).
9.11 Microscopic methods
These fall into two basic categories: namely, methods involving examination of aprepared concrete surface by reflected light and those requiring a ‘thin section’ tobe obtained. These, and other petrographic methods, are considered in detail bythe Concrete Society (304) and by French (311).
Copyright 1996 Chapman & Hall

9.11.1 Surface examination by reflected lightMajor internal crack patterns caused by alkali-silica reactions can be examinedby viewing under ultra-violet light a polished cut concrete surface which hasbeen sprayed or impregnated with a fluorescent dye. A portable fieldinspection kit is also available for use on a treated in-situ surface (326), butcare is needed to allow for weak fluorescence which may be caused bycarbonated concrete (327).
Specialized laboratory techniques can also be used to determine cement,aggregate, and air content of samples taken from in-situ concrete.
9.11.1.1 Theory. A varnished sawn face of a dried concrete specimen can beexamined by stereomicroscope to give the volumetric proportions of a hardenedconcrete. Polivka (328) has described a ‘point count’ method based on theprinciple that the frequency with which each constituent occurs at equallyspaced points along a random line on the surface will reflect the relative volumesof the constituents in the solid. This is because the relative volumes of theconstituents of a heterogeneous solid are directly proportional to the relativeareas on a plane section, and also to the intercepts of these areas along a randomline on the section. An alternative approach is the linear traverse technique, inwhich the intercepts of the constituents are measured along a series of closelyspaced regular transverse lines. In either case the aggregate and voids can beidentified, and the remainder is assumed to be hydrated cement. The totalvolume of this can be computed and converted to a volume of unhydratedcement if the specific gravity of the dry cement and non-evaporable watercontent of the hydrated cement are known.
9.11.1.2 Procedure. The cut surface must be carefully prepared so that theconstituents are readily distinguishable. This is best achieved by grinding,polishing, and impregnation with a suitable dye before varnishing. The preparedsample will normally be examined by a stereomicroscope with a travellingspecimen stage, which may be manually or motor driven. Counting will bemanually controlled but may conveniently be linked to a microcomputer which iscoupled to the moving stage to record its location automatically. A magnificationof 50×is generally used.
ASTM C457 (228) concerns the measurement of entrained air using either thelinear traverse or modified point count techniques. In the linear traverse method,records are kept of the total number of sections of air voids, the total distanceacross air voids, and the total distance across the remainder. The modified pointcount method involves the recording of the frequency of each componentcoinciding with a regular system of points, coupled with the frequency ofintersection of each component by regularly spaced lines.
Both methods permit calculation of the number, size and spacing of the airvoids to be determined. The size is usually expressed in terms of the specificsurface, whilst the commony used ‘spacing factor’ represents the maximum
Copyright 1996 Chapman & Hall
distance from any point in the paste to the periphery of an air void. Markestad(329) has recently described the application of this approach to measurement ofair voids in hardened concrete from offshore platforms, and also gives details ofthe use of an automatic image-analysing microscope for this work. This has theadvantage of being much quicker than the tedious standard microscopictechniques. The optical image of a point on the ground surface is projected ontothe photosensitive surface of a TV camera tube and converted to an electricalsignal. The position and strength of each signal can be classified and stored forprocessing, and a data printout gives the area or volume percentage, and specificsurface, of air voids together with details of scanning of a particular area. Specialsurface preparation is necessary to fill the pores with white gypsum whilst theremainder of the surface is blackened.
9.11.1.3 Reliability and applications. It is claimed that this method can measurethe cement content to ±10%, and the total aggregate content and coarse/fineaggregate ratio can be assessed similarly. However, the total water content cannotbe assessed, since water and air voids cannot be distinguished, except for entrainedair voids which will be identifiable by their spherical nature and uniformity ofsize. In situations where cement content cannot be determined chemically thisapproach may be valuable. Details of precision experiments are given by theConcrete Society (304).
This method has also become accepted for measurement of air entrainment.The choice between point count or linear traverse techniques will depend oncircumstances, but Markestad (329) has indicated problems of componentidentification leading to uncertainties with the point count approach. Whichevermethod is used, the procedures are tedious and require specialized equipment andskill both in sample preparation and measurement. Modern electronic aids haveeased the burden of data collation, and automatic image analysing microscopeswill probably be more widely used.
9.11.2 Thin-section methodsApplications of microscopic examination of thin sections have been outlined inearlier sections of this chapter, and include identification of mix components(304), carbonation, and causes of deterioration. Considerable growth in usage ofthis approach has been experienced in connection with alkali-silica reaction wherethe method is invaluable in confirming that reaction has occurred, examining thesize and extent of cracks, and identifying reactive aggregate particles (192) asillustrated in Figure 9.5.
Sample preparation involves cutting a slice of concrete from a core by diamondsaw (preceded if necessary by vacuum resin impregnation), drying andimpregnation by low viscosity epoxy resin. This will then be cut and ground usingstandard petrographic procedures to a 30 µm thickness using oil lubrication to
Copyright 1996 Chapman & Hall

avoid the dissolution of water-soluble materials. Detailed procedures have beendescribed by Poulsen (330), and are summarized by Palmer (23).
Samples will typically be examined with a petrographic microscope underordinary and polarized light. Micrographs may be produced for record purposesand to illustrate interpretation, which is highy specialized.
9.12 Thermoluminescence testing
It has been proposed by Placido (331) that the thermoluminescence of sandextracted from concrete can form the basis of a test for fire-damaged concretewhich is a measure of the actual thermal exposure experienced by the concrete.
9.12.1 TheoryThermoluminescence is the visible light emission which occurs on heating ofcertain minerals, including quartz and feldspars, and it is known that the curve oflight output vs. temperature for a given sample depends upon its thermal andradiation history. This forms the basis of established techniques of mineralidentification, radiation dosimetry and pottery dating. In naturally occurringquartz sand, this light emission occurs within the temperature range of 300°C–500°C, but if samples are reheated there is no emission of light up to the
Figure 9.5 Photomicrograph of alkali-silica reaction (photograph by courtesy of Professor E.Poulsen). Note: An opaline chert particle is seriously affected by ASR, with cracks radiating intothe surrounding paste. The air void in the lower right hand corner is also partially filled with gel.
Copyright 1996 Chapman & Hall

temperature of the preceding heating. The subsequent pattern of light emission hasalso been shown to depend on the period of exposure to the particular temperature(Figure 9.6).
9.12.2 Equipment and procedureThe equipment required is somewhat complex, including a servo-controlled glowoven to heat the sample, of only a few mg, in an oxygen-free nitrogen atmosphere.Radiation is detected by a photomultiplier and fed into a photon-counter whichdrives the Y axis of an X-Y recorder whilst the X axis is driven by a thermocouplemonitoring the heating plate temperature. The small sample required should bedrilled by slow drilling with a small battery-powered masonry drill in order toreduce drill bit temperatures, and the sample should be washed in concentratedacid solutions to remove minerals which may give spurious outputs. Theremaining quartz sand may then be tested, although if there is none present it maybe possible to utilize quartz from coarse aggregate, or to modify procedures touse other minerals which may be present in the aggregates.
9.12.3 Reliability, limitations and applicationsThe practical value of this test for concrete assessment hinges upon the fact thatthe emission temperature range of 300°C–500°C is critical in the deterioration
Figure 9.6 Typical thermoluminescence trace (based on ref. 331).
Copyright 1996 Chapman & Hall

experienced by concrete subjected to fire, and it is also believed that loss ofstrength is influenced by thermal exposure as well as maximum temperature.Whilst little data relating thermoluminescence results to concrete strength areavailable, Chew (332) has shown that correlations between these properties doexist. Sampling is very quick and cheap and the test may be particularly valuablein checking where high temperatures are suspected but there is no visible damage.The depth of heat penetration into a member can also be conveniently monitoredby taking samples at prescribed depths. The method is still at the developmentstage but does appear to offer considerable potential for the detailed investigationof the extent and severity of fire damage.
9.13 Specialized instrumental methods
A number of highly specialized laboratory techniques are available to the cementchemist. These require expensive equipment and considerable experience, but maybe used to identify various characteristics of the hardened concrete. Some of thosewhich are more commonly used are outlined below.
9.13.1 X-ray fluorescence spectroscopyA sample of concrete is bombarded by high energy X-rays and the fluorescentemission spectrum so caused is collimated into a parallel beam, directed on tothe analysing crystal within a spectrometer and reflected into a detector. Thewavelengths and densities of the fluorescent emission are measured and theconstituent elements, together with their properties, can be calculated fromthese data.
The sample of concrete must be in the form of a pellet of suitable density,formed by compressing a dried, finely-ground sample together with a binder undervery high pressure. The preparation of such a sample (40 mm in diameter) bycompaction of 10 g concrete for 10 seconds by a load of 20 tonnes is described inreference 315, for use in the determination of cement content and chloride content.Actual analysis time is very short, and samples may be reused as required. Themethod is comparative—the emission results are compared with samples ofknown properties in terms of the component under investigation.
9.13.2 Differential thermal methodsDifferential thermal analysis (DTA) is the best known of these methods, becauseof its important role in the assessment of HAC concrete. This method involvesheating a small sample of powdered concrete in a furnace together with a similarsample of inert material. The rate of temperature rise of the inert sample iscontrolled to be as nearly uniform as possible, and is measured by thermocouple.The test sample is similarly monitored to provide a trace of the temperaturedifference between the two specimens, and this trace will have a series of peaks at
Copyright 1996 Chapman & Hall

particular temperatures which are characteristic for the minerals in the sample.These correspond to the loss of water of crystallization of the various mineralforms, and in general form will identify the presence of particular minerals. Themethod may also be made quantitative by calibrating the apparatus against suitablepure minerals to relate peak height to mass.
DTA, together with the similar methods of differential scanning calorimetry(DSC) and derivative thermogravimetry (DTG) has been described by Midgley(333) and used for following the hydration processes of high alumina concretes.Midgley and Midgley have also described their application to measuring thedegree of conversion of HAC concrete (334). Both DTA and DSC have becomeestablished techniques for this purpose. A typical DTA trace is shown in Figure9.7. As the relative proportions of the hydration products change with time due toconversion, so do the heights of the corresponding endotherms, enabling thecomposition of the matrix and degree of conversion to be determined. Althoughprimarily used to establish degree of conversion, the method will also indicate thepresence of sulphate attack or other cement type. Particular care is required insampling to avoid heating of the sample and resulting moisture loss from thecontained materials, which will reduce the reliability of results. Further problemscan occur if clay minerals or mica are present in the aggregate. A powdered samplewill normally be obtained by drilling the in-situ concrete using a rotary percussion
Figure 9.7 Typical differential thermal analysis trace (based on ref. 334).
Copyright 1996 Chapman & Hall

drill, although a larger sample, such as a core, may also be ground and used. Inexperienced hands the method is reliable, and an accuracy of ±5% is possible forHAC percentage conversion measurements. Whilst HAC applications have madethis method known to many engineers, other applications are also possible,although they are likely to be primarily of a research nature.
9.13.3 Thermogravimetry, X-ray diffraction, infrared and atomic absorptionspectrometry and scanning electron microscopyThese are all highly specialized techniques which may be used for analysis of theconstituents of hardened concrete. Although involving high capital expenditure,they are likely to permit more rapid throughput than chemical approaches and tobe able to deal with more complex problems. Many testing organizations havedeveloped their own expertise and procedures with specific methods, and use isgrowing steadily, often in conjunction with classical techniques. Descriptions ofthe techniques and applications to the testing of cement and concrete have beengiven by Ramachandran (335). If, however, precise details of the testingprocedures are required, reference should be made to texts such as that by Willardet al. (336).
Copyright 1996 Chapman & Hall

Appendix A: Typical cases of test planning andinterpretation of results
The engineer has complete and absolute authority as to whether concrete iscondemned or accepted. The problem of testing, and interpretation of the results,will however be approached in a variety of ways—specifications, which will beused as the basis for decisions, vary widely and in some cases may legallyempower the engineer to condemn concrete if the cubes fail, irrespective of thecondition or quality of the in-situ concrete.
Many factors can however vitiate cube results including variations due to failure toobserve the required standardized procedures for sampling, manufacture and curingof the cubes. Further errors may also be introduced by the testing operative orinaccuracies in the testing machine, although these should be checked by regularcomparative reference testing. Whilst testing of the in-situ concrete eliminates most ofthese sources of error, specifications rarely mention in-situ strength and Codes ofPractice do not define the in-situ strength required. BS 8110 (320), however, impliesthat an in-place strength of f
cu/1.5 is expected for in-situ work by the adoption of a
partial factor of safety of 1.5 when calculating the design concrete strength to use incalculations. If a design is based on some other Code of Practice this value may vary,but the basic principle that in-situ strength is recognized as being lower than standardcube specimen strength remains. It is to be hoped that engineers facing the problem offailed cubes will consider these aspects, as well as the in-situ requirements of theconcrete and possible errors in the cube results, before taking decisions.
The following examples are included to assist the planning of tests andinterpretation of results for this and other commonly occurring situations.
A1 28-day cubes fail (cube results suspect)
(i) Problem28-day cubes from concrete used for in-situ beam construction are of low strength.Visual examination of the cubes suggests that they were poorly made.
(ii) Aims of testingThe principal aim will be confirmation of specification compliance of the in-situconcrete, followed by determination of structural adequacy if non-compliance isindicated.
Copyright 1996 Chapman & Hall

(iii) ProposalsSchmidt hammer and/or ultrasonic pulse velocity testing of the beams issuggested, either by way of comparison with similar members of knownacceptable standard cube strength, or to yield an absolute in-situ strengthprediction based on a specifically prepared calibration for the particular mix.Visual comparison may also prove valuable. Tests should be located at mid-depthor spread evenly to provide a representative average value of in-situ strength forcomparison with the specified value after application of safety factors. If doubtstill exists then cores can be used, located to give representative values from thesuspect concrete.
(iv) InterpretationIf similar members are available for comparison with those that are suspect, thecombined raw non-destructive test results should be plotted in histogram formand the overall coefficient of variation calculated to indicate the uniformity ofconcrete between members. The mean values for each group should also becalculated for comparison, bearing in mind possible minor variations due to agedifferences. If non-uniformity is indicated, relative strengths may be estimatedfrom the mean non-destructive results for each group.
If similar satisfactory members are not available, or comparative non-destructive testing suggests borderline values, strength calibration charts for theparticular mix may be used. If these are not available, or cannot be obtained, thencores cut to examine representative concrete of the suspect members should beused to estimate the equivalent ‘standard’ cube strength (or potential cubestrength).
(v) Numerical exampleSpecified 28-day characteristic cube strength=30 N/mm2. Schmidt hammer andUPV comparisons with similar beams cast one week earlier show only one peakin histogram form, and have the following values.
Schmidt hammer: mean rebound no. = 32coefficient of variation = 6%
UPV: mean velocity = 4.15 km/seccoefficient of variation = 4%.
Mean standard 28-day cube strengths for comparison beams=34N/mm2,henceEstimated mean standard 28-day cube strength for suspect beams
= 32 N/mm2 based on Schmidt hammer results= 35 N/mm2 based on ultrasonic pulse velocities
(using calibration curves of standard form).
Whilst NDT results suggest only one supply and reasonable construction quality,
Copyright 1996 Chapman & Hall

the estimated mean equivalent standard 28-day cube strength for the suspectconcrete is low in relation to the expected value of 30+1.64s
where s=5 N/mm2 (corresponding to ‘normal’ standards—Table 1.8)
giving 38 N/mm2 in-situ strength.
The effects of age difference on these values can be assumed to lead to a smallunderestimate of true strength, but this cannot be relied upon. It appears thereforethat whilst the mean value of strength for the suspect batches is above theminimum specified, the proportion of concrete likely to be below this value maybe greater than normally permitted.
If further evidence is required cores should be used. These should be takennear mid-depth of a typical beam and at least four should be used to provide anestimate of potential strength as described in Appendix C. This estimate, whichwill have at best an accuracy of ±15%, can then be compared with the absoluteminimum specified (0.85×30=25.5 N/mm2 for BS 8110).
Core results
estimated potential strength =27293235
Mean =31 N/mm2 ±4.5 N/mm2.
Since the mean is above the characteristic specified value, and all results exceedthe minimum acceptable value, it cannot be proved conclusively that the concretedoes not meet the specification. Such results could well form part of an acceptablespread of values within a characteristic strength of 30 N/mm2 and the concreteshould not be rejected.
A2 28-day cubes fail (cube results genuine)
(i) ProblemA suspended floor slab has been cast from several batches and the 28-day cubestrengths (6 cubes) are below the characteristic value required. There is no reasonto suspect the validity of the cube results.
(ii) Aims of testingThe initial aim will be to establish whether the low cubes are representative orrelate to isolated substandard batches. The subsequent aim will then be to assessstructural adequacy.
Copyright 1996 Chapman & Hall

(iii) ProposalsVisual inspection may indicate uniformity or otherwise of the slab in the firstinstance. This can be followed by Schmidt hammer tests on the soffit to confirmuniformity. Direct ultrasonic tests may prove difficult, and with indirect readingson the soffit being unreliable cores should be taken from typical zones. In cases ofdoubt, in-situ load testing may be necessary.
(iv) InterpretationSchmidt hammer readings should be taken on a regular grid, and plotted on a‘contour’ plan to indicate the degree of uniformity. A histogram plot may also beworth while to provide confirmation of this. The results from cores can be used toestimate an average actual in-situ strength which can then be related to therequired design strength with an allowance for the likely standard deviation of in-situ results.
(v) Numerical exampleSpecified characteristic 28-day cube strength=(f
cu)=40 N/mm2
Mean ‘standard’ 28-day cube strength=38 N/mm2 ±2 N/mm2
Mix design mean strength=46 N/mm2.
Visual inspection and non-destructive test results suggest uniform constructionacross the slab.
Average estimated in-situ cube strength from six cores=30 ±1.5 N/mm2.
Estimated characteristic in-situ strength range=
Adopt estimated in-situ standard deviation (s’)=4.5 N/mm2
based on scatter of Schmidt hammer results and past site cube records whichshows ‘good’ control (see Table 1.8).
Henceestimated characteristic in-situ strength=
If the design is to BS 8110 (320), the partial factor of safety on concrete strengthis 1.5, hence minimum acceptable design strength=40/1.5=26 N/mm2. Since theestimated range of characteristic in-situ strength lies below the minimum designstrength, the concrete must be considered unacceptable. If the slab is to bepermanently dry, the estimated in-situ values may be increased by 10%, but thisfactor will not be sufficient to accept the concrete unless the slab is not criticallystressed. It is recommended that an in-situ load test be undertaken to establishdirectly the serviceability behaviour of the slab. Likely durability performancemust also be considered based on exposure conditions.
Copyright 1996 Chapman & Hall
A3 Cubes non-existent for new structure
(i) ProblemA large number of columns have been cast, and the cubes lost.
(ii) Aims of testingThe principal aim will generally be confirmation of acceptability of the in-situconcrete from the point of view of strength and durability.
(iii) ProposalsA comprehensive comparative survey, using surface hardness and/or ultrasonicpulse velocity. Visual inspection may also indicate lack of uniformity. Plot rawresults to indicate patterns and then follow up with a limited number of cores atpoints of apparently lowest and highest strength, unless reliable calibrations forthe mix are available or can be obtained. If similar members are available ofconcrete which is known to be acceptable it may be adequate to rely on non-destructive comparisons with these, using cores only in cases of extreme doubt.Reserve crushed cores for chemical analysis to determine the cement content ifstrengths indicate durability doubts.
(iv) InterpretationIt is important that the non-destructive results to be used comparatively are takenat comparable points in relation to the members tested. This is because of thelikely within-member strength variations, and measurements should preferablybe taken at points of expected lower strength (i.e. near the top of the columns).Sufficient readings should be taken to encompass the various batches of concretethat may have been used.
Results should be plotted in histogram form to detect the weakest areas;coefficients of variation may also provide valuable confirmation of constructionuniformity. The cores should provide values for minimum strength to be comparedwith a calculated minimum acceptable value from the design, as well as a roughcalibration for the non-destructive tests. If attempts are to be made to relate resultsto specifications, the likely within-member variations and in-situ/standardspecimen strength must not be overlooked. Under normal circumstances aminimum in-situ strength of characteristic/1.5 would be acceptable for design toBS 8110 (320), whilst an even lower value may be adequate for low stress areas,subject to adequate durability as indicated by cement content.
(v) Numerical exampleSpecified characteristic cube strength (f
cu)=30N/mm2.
For design to BS 8110 (320) assume
minimum acceptable in-situ strength= =20 N/mm2.
Copyright 1996 Chapman & Hall

For four cores taken to correspond with lowest pulse velocities and reboundnumbers:
estimated in-situ cube strengths 20.5 N/mm2
25.0 N/mm2
22.5 N/mm2
21.0 N/mm2
Mean 22.0 N/mm2.
∴ Estimated minimum in-situ strength=22 N/mm2±1.5 N/mm2.
Hence the mean and all results are above minimum acceptable value, and theconcrete will be considered adequate. It will follow that the remainder of theconcrete is also acceptable since these results relate to the worst locations.
Note (1): If either individual results or the mean estimated in-situ strength arebelow the minimum acceptable as calculated above (based on BS 8110) detailedconsideration should be given to design stress levels, and service moistureconditions.
Note (2): If the concrete strength is critical to the design, or if calibrations havebeen used with surface hardness or UPV results to estimate strength without cores,it may be appropriate to include a factor of safety to account for this, e.g.maximum acceptable design stress=22/1.2=18 N/mm2 based on the factor ofsafety of 1.2 recommended by BS 6089 (12).
A4 Cubes damaged for new structure
(i) ProblemA series of elements have been cast but the cubes damaged. The scope for in-situtesting is very limited due to access difficulties.
(ii) Aims of testingThe principal aim is to estimate the in-situ characteristic strength.
(iii) ProposalsUse statistical procedures to establish the likely in-situ characteristic strengthbased on tests at six accessible locations.
(iv) InterpretationFor the six results obtained, the mean estimated in-situ strength is 36 N/mm2 andthe coefficient of variation of these results is 12%.
Using the ‘normal’ distribution relationship illustrated in Figure 1.10, it can be
Copyright 1996 Chapman & Hall
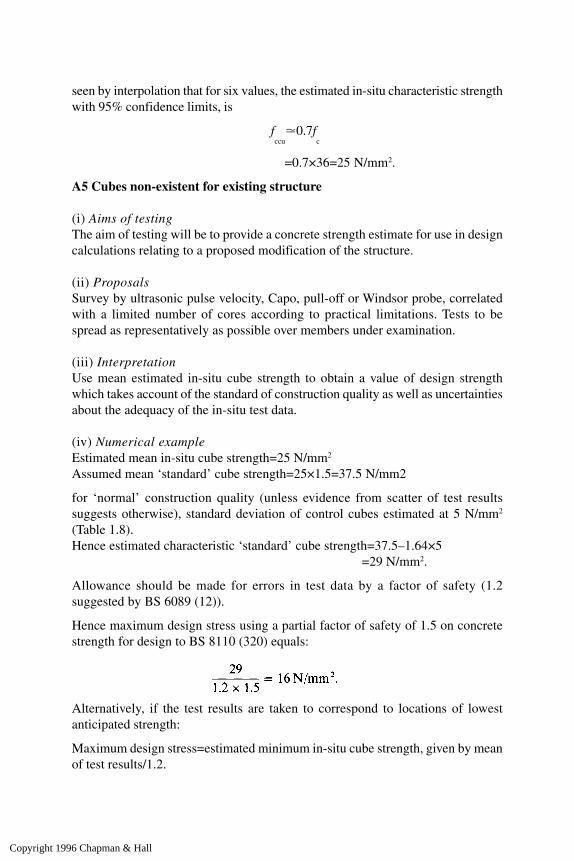
seen by interpolation that for six values, the estimated in-situ characteristic strengthwith 95% confidence limits, is
fccu
�0.7fc
=0.7×36=25 N/mm2.
A5 Cubes non-existent for existing structure
(i) Aims of testingThe aim of testing will be to provide a concrete strength estimate for use in designcalculations relating to a proposed modification of the structure.
(ii) ProposalsSurvey by ultrasonic pulse velocity, Capo, pull-off or Windsor probe, correlatedwith a limited number of cores according to practical limitations. Tests to bespread as representatively as possible over members under examination.
(iii) InterpretationUse mean estimated in-situ cube strength to obtain a value of design strengthwhich takes account of the standard of construction quality as well as uncertaintiesabout the adequacy of the in-situ test data.
(iv) Numerical exampleEstimated mean in-situ cube strength=25 N/mm2
Assumed mean ‘standard’ cube strength=25×1.5=37.5 N/mm2
for ‘normal’ construction quality (unless evidence from scatter of test resultssuggests otherwise), standard deviation of control cubes estimated at 5 N/mm2
(Table 1.8).Hence estimated characteristic ‘standard’ cube strength=37.5–1.64×5
=29 N/mm2.
Allowance should be made for errors in test data by a factor of safety (1.2suggested by BS 6089 (12)).
Hence maximum design stress using a partial factor of safety of 1.5 on concretestrength for design to BS 8110 (320) equals:
Alternatively, if the test results are taken to correspond to locations of lowestanticipated strength:
Maximum design stress=estimated minimum in-situ cube strength, given by meanof test results/1.2.
Copyright 1996 Chapman & Hall

A6 Surface cracking
(i) ProblemThe wing wall to a highway bridge abutment shows random surface cracks andspalling several years after construction.
(ii) Aims of testingThe principal aim will be identification of the cause of deterioration followed byan assessment of present and future serviceability. Appointment of blame mayfollow.
(iii) ProposalsVisual inspection of crack patterns, and their development with time, may permitpreliminary classification of cause as (a) structural actions, (b) shrinkage, or (c)material deterioration. This may be followed by strength assessment as in A2 ifstructural actions are suspected, or chemical/petrographic testing if materialdeterioration is likely. Cores may conveniently be used to provide suitable samplesand should be taken from the areas most seriously affected. Chemical testing todetect chlorides or sulphates will be selected according to the crack pattern whilstmicroscopic examination can check for frost action, alkali/aggregate reaction andentrained air content.
Serviceability will be determined on the basis of the extent of deteriorationand the ability to prevent worsening of the situation.
(iv) InterpretationReference to Table 1.2 will assist preliminary identification. Shrinkage cracks arelikely to occur at an early age and follow a recognizable pattern, as do cracks dueto structural actions. Material deterioration is therefore indicated in this case, andmay be due to chemical attack from internal or external sources or due to frostaction. Chloride attack is unlikely since the cracks do not follow the pattern ofreinforcement, thus initially test for sulphate and cement content. If the results ofthese tests indicate acceptable levels, petrographic examination will be necessaryto attempt to identify aggregate/ alkali attack or frost action. If frost action isindicated, micrometric examination will yield an estimate of the entrained aircontent for comparison with the specified value. Expansion and alkali-immersiontests on cores may be required if alkali/aggregate reaction is found.
If future deterioration can be prevented by protection of the concrete from thesource of attack, this should be implemented after such cutting out and makinggood as may be necessary. If the source of deterioration is internal and not of alocalized nature it may prove necessary to replace the member once it reaches acondition of being unfit for use.
Copyright 1996 Chapman & Hall

A7 Reinforcement corrosion
(i) ProblemA major modern in-situ concrete structure is showing numerous ruststainedcracks, and in some cases pieces of concrete have spalled exposing seriouslycorroded reinforcement. Repairs are obviously necessary to prevent continueddeterioration and to restore the appearance of the structure.
(ii) Aims of testingThe principal aim will be to establish the reason for the corrosion as well as its(present and likely future) extent (which may not be visible) to permit the designof repair proposals. Litigation may follow. Structural adequacy must also bechecked.
(iii) ProposalsA comprehensive covermeter survey coupled with phenolphthaleincarbonation depth measurements should be undertaken. If access costs arehigh, this may be limited initially to about 25% of the areas involved althougha full survey will be necessary prior to repair. A limited number of chloridetests at the level of the steel using simple methods (Hach or Quantab) shouldindicate acceptable or excessive chloride levels. A limited number of coresshould also be taken for compressive strength testing. If carbonation is foundto be excessive these should also be tested for absorption and cement content.Further cores or more detailed chemical analysis may be required (chloride,cement content and possibly water/cement ratio) depending upon results forlitigation purposes.
A comparative half-cell potential survey may be useful in determining thecorrosion risk in apparently undamaged regions unless this can be establishedfrom the covermeter and carbonation survey. ISAT measurements may alsoindicate the extent of highly absorptive concrete if that is found to be present.
(iv) InterpretationThe most likely causes of the problem are the existence of inadequate cover and/or excessive carbonation. These will be immediately apparent from the covermeterand phenolphthalein survey. The reasons for excessive carbonation may bededucible from the tests on cores, and may include mix deficiencies indicated bylow (or variable) strength or low cement content, and inadequate curing possiblyindicated by high water absorption. Core strength results coupled with carefulinspection of corroded steel should enable structural adequacy to be checked, andthe need for additional steel or strengthening to be determined. If chloride contentis found to be high, more extensive testing to provide surface zone gradients mayhelp to identify likely sources. A half-cell potential survey may be useful in thissituation to help plan the repair strategy.
Copyright 1996 Chapman & Hall

The information provided by these tests may be adequate to permit the designof repairs, but deterioration is often the result of a combination of several factorsand it is important that all reasonable possibilities are considered beforeconclusions are reached.
Copyright 1996 Chapman & Hall

Appendix B: Examples of pulse velocity correctionsfor reinforcement
See section 3.3.2.5 for full details of notation and procedures.
Example B1
The beam contains 16mm diameter main bars with 10mm links as shown in FigureB1. The measured pulse velocity across the top of the beam away from links is4.2 km/s. Determine the anticipated measured apparent velocity when readingsare made directly in line with a link.
As main bar will have no practical influence on measured values, Vc=4.2 km/s.
Hence from Figure 3.15 for Vc=4.2 km/s and 10 mm bar,
γ = 0.88
thus allowing for 25 mm cover at each end of link
thus
k=1-0.75(1-0.88)=0.91
∴anticipated V
m=
Figure B1
Copyright 1996 Chapman & Hall
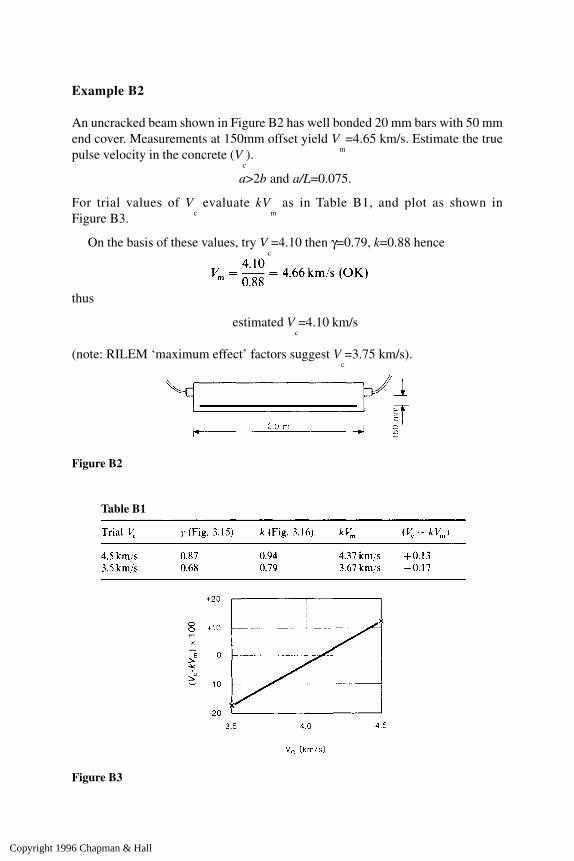
Example B2
An uncracked beam shown in Figure B2 has well bonded 20 mm bars with 50 mmend cover. Measurements at 150mm offset yield V
m=4.65 km/s. Estimate the true
pulse velocity in the concrete (Vc).
a>2b and a/L=0.075.
For trial values of Vc evaluate kV
m as in Table B1, and plot as shown in
Figure B3.
On the basis of these values, try Vc=4.10 then γ=0.79, k=0.88 hence
thus
estimated Vc=4.10 km/s
(note: RILEM ‘maximum effect’ factors suggest V
c=3.75 km/s).
Figure B2
Table B1
Figure B3
Copyright 1996 Chapman & Hall

Example B3
Measurements across a 300 mm wide beam containing three No. 32mm bars givea value of V
m=4.4 km/s. Estimate V
c.
Then For trial values of V
c, evaluate kV
m as in Table B2 and plot Figure B4.
Thus try Vc=4.25 km/s, then γ=0.89 and k=0.965 hence
thus estimated Vc=4.25 km/s (note RILEM ‘maximum effect’ factors suggest
Vc�3.9 km/s).
Table B2
Figure B4
Copyright 1996 Chapman & Hall

Appendix C: Example of evaluation of core results
A 100 mm diameter core drilled horizontally from a wall of concrete with 20 mmmaximum aggregate size contains one no. 20 mm reinforcing bar normal to thecore axis and located at 35 mm from one end.Measured water-soaked concrete density=2320 kg/m3 after correction for includedreinforcement (section 5.1.3.4).Measured crushing force=160 kN (following BS 1881 (114) procedure).Failure mode—normal.Measured core length after capping=120mm.
(i) BS 1881 (114) in-situ cube strength
Measured core strength=
Core length/diameter ratio=120/100=1.2.
Estimated in-situ cube strength = ×20.5 for a horizontal core
=22N/mm2.
Reinforcement correction factor=1+1.5
=1.09.
Corrected in-situ cube strength=22×1.09 N/mm2±12% for an individual result.
=24.0± 3 N/mm2.
(ii) Concrete Society (25) potential cube strengthMeasured core strength=20.5 N/mm2.
Core length/diameter ratio=1.2.
Estimated potential cube strength=× 20.5 for a horizontal core
=28.5 N/mm2.
Copyright 1996 Chapman & Hall

Reinforcement correction factor=1.09.Potential density of concrete=2350 kg/m3 (mean value from cubes).
Excess voidage= ×100%
=1.6%.Strength multiplying factor=1.14 (Figure 5.4).Corrected potential cube strength=28.5×1.09×1.14
=35.5N/mm2.
(Note: Accuracy cannot be realistically quoted for a single result but the meanestimated potential cube strength from a group of at least four cores may be quotedto between ±15% and ±30% subject to a procedure described by Technical ReportNo. 11 (25) to eliminate abnormally low results. In this instance because of theuse of reinforcement and excess voidage correction factors, the estimated accuracyfor a group of four is unlikely to be as high as ±15%.)
(iii) Procedure to eliminate abnormal results (Reference 25)This requires that for n cores (where n is at least 4) the lowest value is separatedand the value t calculated from
The value t is then compared with Table C1, and if greater than the value incolumn A, corresponding to the total number of cores n, the lowest core result isdiscarded if there is any evidence of abnormality in relation to the others.
This may be in terms of location, reinforcement, compaction, cracks or drillingdamage. If the value of t is greater than that in column B, the lowest result is
Table C1
Copyright 1996 Chapman & Hall

discarded irrespective of other considerations. The mean value obtained from theremaining (n-1) cores is then taken as the estimated potential strength.
If an abnormally high result is obtained, although this is less likely, the sameprocedure can be adopted but substituting the highest value for the lowest.Applying this procedure to the results used in section A1 (p. 256), i.e. four coreswith potential strengths 27, 29, 32, 35 N/mm2,
=2.26.
This is less than the value 2.9 from column A, Table C1, and the quoted mean andaccuracy may be considered valid.
Copyright 1996 Chapman & Hall

References
(1) Petersen, C.G. and Poulsen, E. Pull-out testing by Lok-test and Capo-test. Dansk Betoninstitut
A/S, 1992.(2) Somerville, G. The design life of concrete structures. Structural Engineer, 64A, No. 2, Feb.
1986, 60–71.(3) Clifton, J.R. Predicting the service life of concrete. ACI Materials Journal, 90, No. 6,
Nov./Dec. 1993, 611–617.(4) Inspection and Maintenance of Reinforced and Prestressed Concrete Structures. Federation
Internationale de Pre-contrainte (FIP), Thomas Telford Ltd, London, 1986.(5) Appraisal of existing structures. Institution of Structural Engineers, London, 1980.(6) RILEM. Draft recommendation for damage classification of concrete structures. Materials and
Structures, 27, 1994, 362–369.(7) ACI Committee 364. Guide for evaluation of concrete structures prior to rehabilitation. ACI
Materials Journal, 90, No. 5, Sept./Oct. 1993, 479–498.(8) Currie, R.J. and Crammond, N.J. Assessment of existing high alumina cement construction in
the UK. Proc. ICE, Structs & Bldgs, 104, Feb. 1994, 83–92.(9) Assessment and repair of fire-damaged concrete structures. Tech. Rept. 33, Concrete Society,
London, 1990.(10) Fleischer, C.C. and Chapman-Andrews, J.F. Survey and analysis of bomb damaged reinforced
concrete structures. Proc. Struct. Faults and Repairs 93, Eng. Technics Press, Edinburgh,2, 1993, 111–118.
(11) BS 1881: Part 201 Guide to the use of non-destructive methods of test for hardened concrete.British Standards Institution, London.
(12) BS 6089 Guide to assessment of concrete strength in existing structures. British StandardsInstitution, London.
(13) Bungey, J.H. Testing concrete in structures—a guide to equipment for testing concrete instructures. TN 143, CIRIA, 1992, 87p.
(14) Shickert, G. NDT in civil engineering in Germany. Insight, 36, No. 7, July 1994, 489–495.(15) Carino, N.J. Nondestructive testing of concrete: History and challenges. Spec. Publ.
SP 144–30, American Concrete Institute, Detroit, 1994, 623–678.(16) DeBreto, J., Branco, F.A. and Ibanez, M. A knowledge based concrete bridge inspection system.
Concrete International, 16, No. 2, Feb. 1994, 59–63.(17) Bungey, J.H. The most effective use of NDT of concrete. Proc. 4th European Conf. on NDT,
Vol. 2. Pergamon, Oxford, 1988, pp. 963–970.(18) Smith, J.R. Assessment of concrete buildings. Concrete International, 13, No. 12, Dec.. 1991,
48–49.(19) Pollock, D.J., Kay, E.A. and Fookes, P.G. Crack mapping for investigation of Middle East
concrete. Concrete, 15, No. 5, May 1981, 12–18.(20) Non-structural cracks in concrete. Tech. Rept. 22, Concrete Society, London, 1992.(21) Higgins, D.D. Diagnosing the causes of defects or deterioration in concrete structures. Current
Practice Sheet 69, Concrete, 15, No. 10, Oct. 1981, 33–34.(22) Fewtrell, A. Special access techniques for inspection works. Proc. Struct. Faults and Repairs
93, Eng. Technics Press, Edinburgh, 2, 1993, pp. 119–124.(23) Palmer, D. The diagnosis of alkali-silica reaction. Report of Working Party, British Cement
Association, Slough, 1988.(24) Bungey, J.H. and Madandoust, R. Evaluation of non-destructive strength testing of lightweight
concrete. Proc. ICE, Structs & Bldgs, 104, Aug. 1994, 275–283.
Copyright 1996 Chapman & Hall
(25) Concrete core testing for strength. Tech. Rept. 11, Concrete Society, London, 1987.(26) Bungey, J.H. Concrete strength variations and in-place testing. Proc. 2nd Australian Conf. on
Engineering Materials, University of New South Wales, Sydney, 1981, 85–96.(27) Bungey, J.H. and Madandoust, R. Strength variations in lightweight concrete beams. Cement
and Concrete Composites, 16, 1994, 49–55.(28) Maynard, D.P. and Davis, S.G. The strength of in-situ concrete. Structural Engineer, 52, No.
10, Oct. 1974, 369–374.(29) Davies, S.G. Further investigations into the strength of concrete in structures. Tech. Kept.
42.514, Cement and Concrete Association, Slough, 1976.(30) Miao, B. et al. Influence of concrete strength on in-situ properties of large columns. ACI
Materials Journal, 90, No. 3, May/June 1993, 214–219.(31) Murray, A.McC. and Long, A.E. A study of the in-situ variability of concrete using the pull-off
method, Proc. ICE, Part 2, 83, Dec. 1987, 731–745.(32) Tomsett, H.N. The development of a nondestructive test analysis. Proc. Nondestructive Testing
in Civil Engineering, Brit Inst NDT, 2, 1993, 435–450.(33) Tomsett, H.N. Ultrasonic pulse velocity measurements in the assessment of concrete quality.
Magazine of Concrete Research, 32, No. 110, March 1980, 7–16.(34) Leshchinsky, A.M., Leshchinsky, M.Yu. and Goncharova, A.S. Within-test variability of some
non-destructive methods for concrete strength determination. Magazine of Concrete Research,42, No. 153, Dec.. 1990, 245–248.
(35) Hindo, K.R. and Bergstrom, W.R. Statistical evaluation of the in-place strength of concrete.Concrete International, 7, No. 2, Feb. 1985, 44–48.
(36) Stone, W.C., Carino, N.J. and Reeve, C.P. Statistical methods for in-place strength predictionsby the pull-out test. ACI Journal, 83, No. 5, Sept./Oct. 1986, 745–756.
(37) ACI Committee 228. In-place methods for determination of strength of concrete. ACI 228, IR-89. American Concrete Institute, Detroit, 1989.
(38) Carino, N.J. Statistical methods to evaluate in-place test results. Proc. Int. Workshop on testingduring Concrete Construction (RILEM), ed. Reinhardt, H.W., Chapman & Hall, 1992, pp.432–448.
(39) Leshchinsky, A.M. Non-destructive testing of concrete strength: statistical control. Materialsand Structures, 25, No. 146, March 1992, 70–78.
(40) Bartlett, F.M. and MacGregor, J.G. Equivalent specified concrete strength from core test data.Concrete International, 17, No. 3, March 1995, 52–58.
(41) Reynolds, W.N. Measuring concrete quality non-destructively. British Journal of NDT, 26, No.1, Jan. 1984, 11–14.
(42) Samarin, A. Combined Methods. Handbook on Non-destructive Testing of Concrete, ed.Malhotra, V.M. and Carino, N., CRC Press, Ch. 8, 1991, pp. 189–201.
(43) RILEM. Draft recommendation for in-situ concrete strength determination by combinednon-destructive methods. Materials and Structures, 26, 1993, 43–49.
(44) Galan, A. Estimate of concrete strength by ultrasonic pulse velocity and damping constant. ACIJournal, 64, No. 10, Oct. 1967, 678–684.
(45) BS 1881: Part 202 Recommendations for surface hardness testing by rebound hammer. BritishStandards Institution, London.
(46) ASTM C805 Rebound number of hardened concrete. American Society for Testing andMaterials, Philadelphia.
(47) Akashi, T. and Amasaki, S. Study of the stress waves in the plunger of a rebound hammer at thetime of impact. Spec. Publ. SP 82–2, American Concrete Institute, Detroit, 1984, 17–34.
(48) Kolek, J. Non-destructive testing of concrete by hardness methods. In Non-destructive Testingof Concrete and Timber. Institution of Civil Engineers, London, 1970, 19–22.
(49) Willetts, C.H. Investigation of the Schmidt concrete test hammer. Misc. Papers, S-627, USArmy Engineer Waterways Experiment Station, Vicksburg, Miss., June 1958.
(50) Malhotra, V.M. Testing hardened concrete: non-destructive methods. Monograph 9, AmericanConcrete Institute, Detroit, 1976.
(51) BS 1881: Part 116 Method for determination of compressive strength of concrete cubes. BritishStandards Institution, London.
(52) Chaplin, R.G. Abrasion resistant concrete floors. In Advances in Concrete Slab Technology,Pergamon, Oxford, 1980, pp. 532–543.
Copyright 1996 Chapman & Hall

(53) Andrews, D.R. Future prospects for ultrasonic inspection of concrete. Proc. ICE Structs &Bldgs, 99, Feb. 1993, 71–73.
(54) Bungey, J.H. Ultrasonic testing to identify alkali-silica reaction in concrete. Brit. J. NDT, 33,No. 5, 1991, 227–231.
(55) Hillger, W. Imaging of defects in concrete by ultrasonic pulse-echo technique. Proc. Struct.Faults and Repairs 93, Eng. Technics Press, Edinburgh, 3, 1993, pp. 59–65.
(56) Kroggel, O. Ultrasonic examination of crack structures in concrete slabs. Proc. Struct. Faultsand Repairs 93, Eng. Technics Press, Edinburgh, 3, 1993, pp. 67–70.
(57) Sack, D.A. and Olson, L.D. Advanced NDT methods for evaluating concrete bridges and otherstructures. Proc. Struct. Faults and Repairs 93, Eng. Technics Press, Edinburgh, 1, 1993, pp.65–76.
(58) BS 1881: Part 203 Recommendations for measurement of velocity of ultrasonic pulses inconcrete. British Standards Institution, London.
(59) ASTM C597 Standard test method for pulse velocity through concrete. American Society forTesting and Materials. Philadelphia.
(60) Instruction manual for model C-4899 V-meter. James Electronics Inc., Chicago, Illinois.(61) PUNDIT, CNS Electronics Ltd, 61–63 Holmes Rd, London.(62) Jones, R. Non-destructive Testing of Concrete. Cambridge University Press, London, 1962.(63) Ikpong, A.A. The relationship between the strength and non-destructive parameters of rice husk
ash concrete. Cement and Concrete Research, 23, 1993, 387–398.(64) Jones, R. and Facaoaru, I. Recommendations for testing concrete by the ultrasonic pulse
method. Materials and Structures, 2, No. 10, 1969, 275–284.(65) Bungey, J.H. The validity of ultrasonic pulse velocity testing of in-place concrete for strength.
NDT International, IPC Press, Dec. 1980, pp. 296–300.(66) Swamy, R.N. and Al-Hamed, A.H. The use of pulse velocity measurements to estimate strength
of air dried cubes and hence in-situ strength of concrete. Spec. Publ. SP 82–13, AmericanConcrete Institute, Detroit, 1984, 247–276.
(67) Testing of concrete by the ultrasonic pulse method. NDT 1, RILEM, Paris, Dec. 1972.(68) Bungey, J.H. The influence of reinforcement on pulse velocity testing. Spec. Publ. SP 82–12,
American Concrete Institute, Detroit, 1984, 229–246.(69) Tomsett, H.N. Non-destructive testing of floor slabs. Concrete, 8, No. 3, March 1974, 41–42.(70) Amon, J.A. and Snell, L.M. The use of pulse velocity techniques to monitor and evaluate epoxy
grout repairs to concrete. Concrete International, 1, No. 12, Dec. 1979, 41–44.(71) Matti, M.A. Frozen concrete. Concrete International, 8, No. 4, April 1986, 34–41.(72) Bungey, J.H. Ultrasonic pulse testing of high alumina cement concrete on site. Concrete, 8, No.
9, Sept. 1974, 39–41.(73) Swamy, R.N. and Laiw, J.C. Evaluation of concrete deterioration due to alkali-silica reactivity
through nondestructive tests. Proc. Nondestructive Testing in Civil Engineering, Brit Inst NDT,1, 1993, 315–328.
(74) Hillger, W. A testing equipment for automatic quality control of precast concrete components.Proc. Struct. Faults and Repairs 87, Eng. Technics Press, Edinburgh, 1987, pp. 91–100.
(75) BS 1881: Part 207 Recommendations for the assessment of concrete strength by near-to-surfacetests. British Standards Institution, London.
(76) Windsor Probe Test System. Technical Data Manual, Sinco Products Inc., PO Box 361, HogHill Road, East Hampton, Connecticut CT 06424, USA.
(77) ASTM C803 Penetration resistance of hardened concrete. American Society for Testing andMaterials, Philadelphia.
(78) Nasser, K.W. and Al-Manaseer, A.A. New non-destructive test. Concrete International, 9, No.1, Jan. 1987, 41–44.
(79) BS 4078: Part 1 Powder actuated fixing systems—Code of practice for safe use. BritishStandards Institution, London.
(80) Bungey, J.H. Testing by penetration resistance. Concrete, 15, No. 1, Jan. 1981, 30–32.(81) Nasser, K.W. and Al-Manaseer, A.A. Comparison of non-destructive testers of hardened
concrete. Materials Journal, American Concrete Institute, Detroit, Sept./Oct. 1987, 374–380.(82) Swamy, R.N. and Al-Hamed, A.H. Evaluation of the Windsor probe test to assess in-situ
concrete strength. Proc. ICE, Pt 1, 77, June 1984, 167–194.(83) Shoya et al. Estimating the compressive strength of concrete from pin-penetration test method.
Proc. Nondestructie Testing in Civil Engineering, Brit Inst NDT, 1, 1993, 379–390.
Copyright 1996 Chapman & Hall
(84) Carino, N.J. Pull-out test. Handbook on Non-destructive Testing of Concrete. CRC Press,Boston, USA, Chap. 3, 1991, pp. 39–82.
(85) Germann Aps. Lok-test method for determination of the compressive strength of concrete inplace. Lok-test Aps., Emdrupvej 102, DK 2400, Copenhagen.
(86) Petersen, C.G. Lok-test and Capo-test development and their applications. Proc. ICE, Pt 1, 76,May 1984, 539–549.
(87) Bungey, J.H. An appraisal of pull-out methods of testing concrete. Proc. NDT 83, EngineeringTechnics Press, Edinburgh, 1983, pp. 12–21.
(88) Ottosen, N.S. Nonlinear finite element analysis of pull-out test. Journal of Struct. DivisionASCE, 107, No. ST4, April 1981, 591–603.
(89) Yener, M. Overview and progressive finite element analysis of pullout tests, ACI StructuralJournal, 91, No. 1, Jan./Feb. 1994, 49–58.
(90) Stone, W.C. and Carino, N.J. Deformation and failure in large scale pull-out tests. ACI Journal,Nov./Dec. 1983, 501–513.
(91) Stone, W.C. and Giza, B.J. The effect of geometry and aggregate on the reliability of the pull-out test. Concrete International, 7, No. 2, Feb 1985, 27–36.
(92) Bickley, J.A. The evaluation and acceptance of concrete quality by in-place testing. Spec. Publ.SP 82–6, American Concrete Institute, Detroit, 1984, 95–109.
(93) ASTM C900 Pull-out strength of hardened concrete. American Society for Testing andMaterials, Philadelphia.
(94) Richards, O. Pull-out strength of concrete. Spec. Tech. Publ. STP 626, American Society forTesting and Materials, Philadelphia, 1977, 32–40.
(95) Chabowski, A.J. and Bryden-Smith, D.W. A simple pull-out test to assess the strength of in-situ concrete. Current Paper CP 25/77, Building Research Establishment, Garston, June 1977.
(96) Chabowski, A.J. and Bryden-Smith, D.W. Assessing the strength of in-situ Portland cementconcrete by internal fracture tests. Magazine of Concrete Research, 32, No. 11, Sept. 1980,164–172.
(97) Bungey, J.H. Concrete strength determination by pull-out tests on wedge-anchor bolts. Proc.ICE, Pt. 2, 71, June 1981, 379–394.
(98) Mailhot, G., Bisaillon, A., Carette, G.G. and Malhotra, V.M. In-place concrete strength—newpull-out methods. ACI Journal, Dec. 1979, 1267–1282.
(99) Domone, P.L. and Castro, P.F. An expanding sleeve test for in-situ concrete and mortar strengthevaluation. Proc. Struct. Faults and Repairs 87, Engineering Technics Press, Edinburgh, 1987,pp. 149–156.
(100) Keiller, A.K. Assessing the strength of in-situ concrete. Concrete International, 7, No. 2, Feb.1985, 15–21.
(101) Long, A.E. and Murray, A.McC. The pull-off partially destructive test for concrete. Spec. Publ.SP 82–17, American Concrete Institute, Detroit, 1984, 327–350.
(102) Jaegermann, C. A simple pull-out test for in-situ determination of early strength of concrete.Magazine of Concrete Research, 41, No. 149, Dec. 1989, 235–242.
(103) Cleland, D.J. In-situ methods for assessing the quality of concrete repairs. Proc. ICE, Structs& Bldgs, 99, Feb. 1993, 68–70.
(104) McLeish, A. Standard tests for repair materials and coatings-Part 1. Pull-Off Testing. CIRIA,TN 139, 1992, 41 p.
(105) Bungey, J.H. and Madandoust, R. Factors influencing pull-off tests on concrete. Magazine ofConcrete Research, 44, No. 158, March 1992, 21–30.
(106) Long, A.E., Montgomery, F.R. and Cleland, D. Assessment of concrete strength and durabilityon site. Proc. Struct. Faults and Repair 87, Engineering Technics Press, Edinburgh, 1987, pp.61–73.
(107) CUR. Determination of the bond strength of mortars on concrete. Centre for Civil EngineeringResearch and Codes, Gouda, Recommendation 20, 1990.
(108) Johansen, R. In-situ strength evaluation of concrete—the break-off method. ConcreteInternational, 1, No. 9, Sept. 1979, 45–51.
(109) Christiansen, V.T., Thorpe, J.D. and Yener, M. In-situ testing of concrete using break-offmethod. Proc. Struct. Faults and Repair 87, Engineering Technics Press, Edinburgh, 1987, pp.101–112.
(110) Dahl-Jorgensen, E. and Johansen, R. General and specialized use of the break-off concrete
Copyright 1996 Chapman & Hall

strength testing method. Spec. Publ. SP 82–15, American Concrete Institute, Detroit, 1984,293–308.
(111) Carlsson, M., Eeg, I.R. and Jahren, P. Field experience in the use of the break-off tester. Spec.Publ. SP 82–14, American Concrete Institute, Detroit, 1984, 277–292.
(112) Naik, T. The Break-off test method. Handbook on Non-destructive Testing of Concrete, ed.Malhotra, V.M. and Carino, N., CRC Press, Chap. 8, 1991, pp. 83–101.
(113) Stoll, U.W. Compressive strength measurement with the Stoll tork test. Concrete International,7, No. 12, Dec. 1985, 42–47.
(114) BS 1881: Part 120 Method for determination of the compressive strength of concrete cores.British Standards Institution, London.
(115) ASTM C42 Standard method of obtaining and testing drilled cores and sawn beams ofconcrete. American Society for Testing and Materials, Philadelphia.
(116) ACI 318 Building code requirements for reinforced concrete. American Concrete Institute,Detroit.
(117) Monday, J.G.L. and Dhir, R.K. Assessment of in-situ concrete quality by core testing. Spec.Publ. SP 82–20, American Concrete Institute, Detroit, 1984, 393–410.
(118) Robins, P.J. The point-load strength tests for cores. Magazine of Concrete Research, 32, No.111, June 1980, 101–111.
(119) Robins, P.J. The point-load test for tensile strength estimation of plain and fibrous concrete.Spec. Publ. SP 82–16, American Concrete Institute, Detroit, 1984, 309–325.
(120) Robins, P.J. and Austin, S.A. Core point-load test for steel fibre reinforced concrete. Magazineof Concrete Research, 37, No. 133, Dec. 1985, 238–242.
(121) Clayton, N. Fluid pressure testing of concrete cylinders. Magazine of Concrete Research, 30,No. 102, March 1978, 26–30.
(122) Chrisp, T.M., Walron, P. and Wood, J.G.M. Development of a non-destructive test to quantifydamage in deteriorated concrete. Magazine of Concrete Research, 45, No. 165, Dec. 1993,247–253.
(123) Bartlett, F.M. and MacGregor, J.G. Effect of moisture condition on concrete core strengths.ACI Materials Journal, 91, No. 3, May/June 1994, 227–236.
(124) Bartlett, F.M. and MacGregor, J.G. Effect of core length to diameter ratio on concrete corestrengths. ACI Materials Journal, 91, No. 4, July/Aug. 1994, 339–348.
(125) Jones, A.E.K., Clark, L.A. and Amasaki, S. The suitability of cores in predicting the behaviourof structural members suffering from ASR. Magazine of Concrete Research, 46, No. 167, June1994, 145–150.
(126) Yip, W.K. Estimating the potential strength of concrete with prior load history. Magazine ofConcrete Research, 45, No. 165, Dec. 1993, 301–308.
(127) Bungey, J.H. Determining concrete strength by using small diameter cores. Magazine ofConcrete Research, 31, No. 107, June 1979, 91–98.
(128) Bowman, S.A.W. Discussion on ref. 127, Magazine of Concrete Research, 32, No. 111, June1980, 124.
(129) Swamy, R.N. and Al-Hamed, A.H. Evaluation of small diameter core tests to determine in-situstrength of concrete. Spec. Publ. SP 82–21, American Concrete Institute, Detroit, 1984,411–440.
(130) Schupack, M. Durability study of a 35 year old post-tensioned bridge. Concrete International,16, No. 2, Feb. 1994, 54–58.
(131) Azizinamini, A. et al. Old concrete slab bridges: can they carry modern traffic loads? ConcreteInternational, 16, No. 2, Feb. 1994, 64–69.
(132) Ladner, M. In-situ load testing of concrete bridges in Switzerland. Spec. Publ. SP 88–4,American Concrete Institute, Detroit, 1985, 59–80.
(133) Ladner, M. Unusual methods for deflection measurements. Spec. Publ. SP 88–8, AmericanConcrete Institute, Detroit, 1985, 165–180.
(134) Moss, R.M. and Currie, R.J. Static load testing of building structures. Information Paper IP9/89, Building Research Establishment, Garston, 1989.
(135) Jones, D.S. and Oliver, C.W. The practical aspects of load testing. Structural Engineer, 56A,No. 12, Dec. 1978, 353–356.
(136) Garas, F.K., Clarke, J.L. and Armer, G.S.T. Structural Assessment. Butterworths, London,1987.
Copyright 1996 Chapman & Hall

(137) Menzies, J.R., Sandberg, A.C.E. and Somerville, G. Instrumentation of structures. StructuralEngineer, 62A, No. 3, March 1984, 83–86.
(138) Report of working party on high alumina cement, Institution of Structural Engineers.Structural Engineer, 54, No. 9, Sept. 1976, 352–361.
(139) Moss, R.M. Load testing of beam and block concrete floors. Proc. ICE Structs & Bldgs, 99,May 1993, 211–223.
(140) BS 8110: Part 2 Structural use of concrete—code of practice for special circumstances. BritishStandards Institution, London.
(141) Lee, C.R., Load testing of concrete structures, with particular reference to CP11O andexperience in the HAC Investigations. Building Research Establishment, Garston, Doc.B507/77, 1977.
(142) Guedelhoefer, O.C. Instrumentation and techniques of full scale testing of structures.Experimental Methods in Concrete Structures for Practitioners, American Concrete Institute,Detroit, 1979.
(143) Miao, B. et al. On-site early-age monitoring of high-performance concrete columns. ACIMaterials Journal, 90, No. 5, Sept./Oct. 1993, 415–420.
(144) Moss, R.M. and Matthews, S.L. In-service structural monitoring—a state of the art review.The Structural Engineer, 73, No. 2, 1995, 23–31.
(145) Olaszek, P. The photogrammetric method for dynamic bridge investigations, Proc. Struct.Faults and Repairs 93, Eng. Technics Press, Edinburgh, 1, 1993, pp. 89–93.
(146) Dill, M.J. and Curtis, I.L. Monitoring concrete structures using optical fibre sensors. Concrete,27, No. 5, Sept./Oct. 1993, 31–35.
(147) BS 1881: Part 206 Recommendations for determination of strain in concrete. British StandardsInstitution, London.
(148) Salah el Din, A.S. and Lovegrove, J.M. A gauge for measuring long-term cyclic strain onconcrete surfaces. Magazine of Concrete Research, 33, No. 115, June 1981, 123–127.
(149) Corless, R.C. and Morice, P.B. The kinematics of structural testing. Structural Engineer, 64B,No. 4, Dec. 1986, 100–102.
(150) Repair of concrete damaged by reinforcement corrosion. Tech. Rept. 26, Concrete Society,London, 1984.
(151) Vassie, P.R. Reinforcement corrosion and durability of concrete bridges. Proc. ICE, Pt. 1, 76,Aug. 1984, 713–723.
(152) BS 1881: Part 204 Recomendations on the use of electromagnetic covermeters. BritishStandards Institution, London.
(153) Alldred, J.C. An improved method for measuring reinforcing bars of unknown diameter inconcrete using a cover meter. Proc. Non-Destructive Testing in Civil Engineering, Brit. Inst.NDT, 2, 1993, 767–788.
(154) Neumann, R. and Dobmann, G. Neue magnetische Gerätetechnik bei der Beton deckungsmessung. Deutsh Gesellshaft für Zerstörungsfreie e.V., Symposium Zerstörimgsfreie Prüfungim Bauwesen, Berlin, 1991, 400–472 (in English).
(155) Carino, N.J. Characterisation of electromagnetic covermeters. Proc. Non-Destructive Testingin Civil Engineering, Brit. Inst. NDT, 2, 1993, 753–765.
(156) Snell, L.M., Wallace, N. and Rutledge, R.B. Locating reinforcement in concrete. ConcreteInternational, 8, No. 4, April 1986, 19–23.
(157) Alldred, J.C. Quantifying the losses in covermeter accuracy due to congestion ofreinforcement. Proc. Struct. Faults and Repairs 93, Eng. Technics Press, Edinburgh, 2, 1993,125–130.
(158) ASTM C876 Half-cell potentials of uncoated reinforcing steel in concrete. American Societyfor Testing and Materials, Philadelphia.
(159) Figg, J.W. and Marsden, A.F. Development of inspection techniques-a state of the art surveyof electrical potential and resistivity measurements for use above water level. OffshoreTechnology Report, OTH 84 205, HMSO, London, 1983.
(160) Vassie, P.R. The Half-cell Potential Method of Locating Corroding Reinforcement in ConcreteStructures. TRRL Application Guide 9, 1991, 30pp.
(161) McLaughlin, K. The detection of corroding reinforcement in concrete structures. Brit. Jnl.NDT, 31, No. 12, Dec. 1989, 683.
(162) Langford, P. and Broomfield, J. Monitoring the corrosion of reinforcing steel. ConstructionRepair, 1, No. 2, Palladian Pubs., May 1987, 32–36.
Copyright 1996 Chapman & Hall

(163) Stratfull, R.F. Half cell potentials and the corrosion of steel in concrete. Highway ResearchRecord, 1973, 433, 12–21.
(164) Raherinaivo, A. Contrôle de la corrosion des armatures dans les structures en béton armé.Bulletin De liason des Laboratories des Ponts et Chaussés, 158, Nov./Dec. 1988, 29–38 (inFrench).
(165) Naish, C.C. and Carney, R.F.A. Variability of potentials measured on reinforced concretestructures. Materials Performance, April 1988, 45–48.
(166) Arup, H. Electrochemical monitoring of the corrosion state of steel in concrete. 1st Int. Conf.Deterioration and Repair of Reinforced Concrete in the Arabian Gulf, CIRIA/BSE, 1985,485–493.
(167) Baker, A.F. Potential mapping techniques. Proc. Seminar on Corrosion in Concrete. LondonPress Centre, Global Corrosion Consultants, Telford, May 1986, 3.1–3.21.
(168) Millard, S.G. Durability performance of slender reinforced coastal defence units. Spec. Publ.SP 109–15, American Concrete Institute, Detroit, 1988, 339–366.
(169) Ewins, A.J. Resistivity measurements in concrete. Brit. Jnl NDT, 32, No. 3, March 1990,120–126.
(170) Millard, S.G., Harrison, J.A. and Gowers, K.R. Practical Measurement of concrete resistivity,Brit. Jnl NDT, 33, No. 2, Feb. 1991, 59–63.
(171) McCarter, W.J., Forde, M.C. and Whittington, H.W. Resistivity characteristics of concrete.Proc. ICE, Pt. 2, 71, March 1981, 107–117.
(172) Wilkins, N.J.M. Resistivity of concrete. Report AERE-M3232, UK Atomic Energy Authority,Harwell, Jan. 1982.
(173) Gowers, K.R. and Millard, S.G. The effect of steel reinforcing bars on the measurement ofconcrete resistivity. Brit. Jnl NDT, 33, No. 11, Nov. 1991, 551–556.
(174) Millard, S.G. and Gowers, K.R. Resistivity assessment of in-situ concrete: the influence ofconductive and resistive surface layers. Proc. ICE, Structs. & Bldgs, 94, Nov. 1992, 389–396.
(175) Millard, S.G. Reinforced concrete resistivity measurement techniques. Proc. ICE, Pt. 2, March1991, 71–88.
(176) Gowers, K.R, Millard, S.G. and Bungey, J.H. The influence of environmental conditions uponthe measurement of concrete resistivity for the assessment of corrosion durability. Proc. Non-Destructive Testing in Civil Engineering, Brit. Inst. NDT, 2, 1993, 633–657.
(177) Naish, C.C., Harker, A. and Carney, R.F.A. Concrete inspection: Interpretation of potentialand resistivity measurements. Proc. Corrosion of Reinforcement in Concrete, Elsevier AppliedScience, 1990, pp. 314–332.
(178) Lawrence, C.D. The mechanism of corrosion of reinforcement steel in concrete structures.British Cement Association, Nov. 1990, 50 p.
(179) Moore, R.W. Earth resistivity tests applied as a rapid non-destructive procedure for determiningthickness of concrete pavements. Highway Research Record. Highway Research Board,Washington DC, No. 218, 1968, 49–55.
(180) John, G., Hladky, K. and Dawson, J. Recent developments in electrochemical inspectiontechniques for corrosion damaged structures. Industrial Corrosion, 11, No. 2, Feb./Mar. 1993,12–13.
(181) Filiu, S., Gonzalez, J.A. and Andrade, C. Electrochemical methods for on-site determinationof corrosion rates of rebar. ASTM, STP 1276, 1995.
(182) Sehagal, A., Kho, Y.T., Osseo-Asare, K. and Pickering, H.W. Comparison of corrosion ratemeasuring devices for determining corrosion rate of steel-in-concrete systems. Corrosion, 48,No. 10, 871–880.
(183) Elsener, B., Müller, S., Suter, M. and Böhni, H. Corrosion monitoring of steel in concrete:theory and practice. Proc. Corrosion of Reinforcement in Concrete, Elsevier Applied Science,1990, pp. 348–357.
(184) Elsener, B., Wojtas, H. and Böhni, H. Inspection and monitoring of reinforced concretestructures—electrochemical techniques to detect corrosion. Insight, 36, No. 7, July 1994,502–506.
(185) Millard, S.G. Corrosion rate measurement of in-situ reinforced concrete structures. Proc. ICE,Structs. & Bldgs, 99, Feb. 1993, 84–88.
(186) Dawson, J.L., John, D.G., Jafar, M.I., Hladky, K. and Sherwood, L. Electrochemical methodsfor inspection and monitoring of corrosion of reinforcing steel in concrete. Proc. Corrosion ofReinforcement in Concrete, Elsevier Applied Science, 1990, pp. 358–371.
Copyright 1996 Chapman & Hall
(187) Broomfield, J.P., Rodriguez, J., Ortega, L.M. and Garcia, A.M. Field measurement of thecorrosion rate of steel in concrete using a microprocessor controlled unit with a monitoredguard ring for signal confinement. Proc. Techniques to Assess the Corrosion Activity of Steel-reinforced Concrete Structures, ASTM, STP 1276, Philadelphia, 1995.
(188) Millard, S.G., Gowers, K.R. and Bungey, J.H. Galvanostatic pulse techniques: A rapid methodof assessing corrosion rates of steel in concrete structures. NACE Corrosion ’95, Paper No.525, Orlando, USA, 16 pp.
(189) Page, C.C. and Lambert, P. Analytical and electrochemical investigations of reinforcementcorrosion. TRRL Contractor Report 30, 1986.
(190) Schiessel, P. and Raupach, M. Monitoring systems for the corrosion risk of steel in concretestructures. Concrete International, 14, No. 7, 1992, 52–55.
(191) Parrott, L.J. Moisture profiles in drying concrete. Advances in Cement Research, 1, No. 3, July1988, 164–170.
(192) Petersen, C.G. and Poulsen, E. In-situ NOT methods for concrete with particular reference tostrength, permeability, chloride content, and disintegration. Proc. 1st Int. Conf. onDeterioration and Repair of Reinforced Concrete in the Arabian Gulf, CIRIA, 1, 1985, 495–508.
(193) Hammond, E. and Robson, T.D. Comparison of electrical properties of various cements andconcretes. The Engineer, 199, Jan. 1955, 78–80, 114–115.
(194) Bell, J.R., Leonards, G.A. and Dolch, W.L. Determination of moisture content of hardenedconcrete and its dielectric properties. Proc. ASTM 63, 1963, 996–1007.
(195) Jones, R. A review of the non-destructive testing of concrete. Proc. Symp. on NDT of Concreteand Timber, ICE, London, 1969, 1–7.
(196) Barfoot, J. Major step forward in diagnostic equipment. Concrete, 25, No. 5, May 1988,27–28.
(197) Parrott, L.J. Moisture conditioning and transport properties of concrete test specimens.Materials and Structures, 27, 1994, 460–468.
(198) Parrott, L.J. A review of methods to determine the moisture conditions in concrete. BritishCement Assoc., Rep. C/7, 1990.
(199) Newman, A.J. Improvement of the drilling method for the determination of moisture contentof building materials. BRE, CP 22/75, 1975.
(200) Browne, J.D.I. Non-destructive testing of concrete—a survey. Non-destructive Testing, Feb.1968, 159–164.
(201) Boot, A.R. and Watson, A. Applications of centimetric radio waves in non-destructive testing.In Applications of Advanced and Nuclear Physics to Testing Materials. Spec. Tech. Publ. STP373, American Society for Testing and Materials Standards, Philadelphia, 1965, 3–24.
(202) Maser, K.R. Bridge deck condition survey using radar. Transport Research Board, Paper91–0530, 1991, 19pp.
(203) Morey, R. and Kovacs, A. Detection of moisture in construction materials. US Army ColdRegions Res. & Eng. Lab., Rept. N.77, CRREL, 1977, 9pp.
(204) Figg, J.W. Determining the water content of concrete panels. Magazine of Concrete Research,24, No. 79, June 1972, 94–96.
(205) Permeability of concrete—a review of testing and experience. Tech. Rept. 31, Concrete Society,London, 1988.
(206) Basheer, P.A.M. A brief review of methods for measuring the permeation properties of concretein situ. Proc. ICE, Structs & Bldgs, 99, Feb. 1993, 74–83.
(207) BS 1881: Part 5 Methods of testing hardened concrete for other than strength. British StandardsInstitution, London.
(208) BS 1881: Part 122 Method for determination of water absorption. British Standards Institution,London.
(209) Kreijger, P.C. The skin of concrete: composition and properties. Materiaux et Constructions,July/Aug. 1984, 275–283.
(210) Levitt, M. Non-destructive testing of concrete by the initial surface absorption method. Proc.Symp. on NDT of Concrete and Timber, ICE, London, 1969, 23–36.
(211) Dhir, R.K., Shaaban, I.H., Claisse, P.A. and Byars, E.A. Preconditioning in situ concrete forpermeation testing—Part 1: Initial surface absorption. Magazine of Concrete Research, 45,No. 163, June 1993, 113–118.
(212) Price, W.F. and Bamforth, P.B. Initial surface absorption of concrete: examination of modified
Copyright 1996 Chapman & Hall

test apparatus for obtaining uniaxial absorption. Magazine of Concrete Research, 45, No. 162,March 1993, 17–24.
(213) Dhir, R.K., Hewlett, P.C. and Chan, Y.N. Near-surface characteristics of concrete: assessmentand development of in-situ test methods. Magazine of Concrete Research, 39, No. 141, Dec.1987, 183–195.
(214) Dhir, R.K., Hewlett, P.C., Byars, E.A. and Bai, J.P. Estimating the durability of concrete instructures. Concrete, Nov./Dec. 1994, 25–30.
(215) Figg, J.W. Methods of measuring air and water permeability of concrete. Magazine of ConcreteResearch, 25, No. 85, Dec. 1973, 213–219.
(216) Gather, R., Figg, J.W., Marsden, A.F. and O’Brien, T.P. Improvements to the Figg method fordetermining the air permeability of concrete. Magazine of Concrete Research, 36, No. 129,Dec. 1984, 241–245.
(217) Figg, J. Testing time for porous concrete. Construction News, 54, 26 April, 1990.(218) Figg, J. Concrete surface permeability: Measurement and meaning. Chemistry & Industry,
Nov. 1989, 714–719.(219) Hansen, A.J., Ottosen, N.S. and Petersen, C.G. Gas permeability of concrete in-situ: theory
and practice. Spec. Publ. SP 82–17, American Concrete Institute, Detroit, 1984, 543–556.(220) Basheer, P.A.M. Clam permeability tests for assessing the durability of concrete. PhD thesis,
Queen’s University, Belfast, 1991.(221) Basheer, P.A.M., Long, A.E. and Montgomery, F.R. The ‘Autoclam permeability system’ for
measuring in-situ permeation properties of concrete. Proc. Non-Destructive Testing in CivilEngineering, Brit. Inst. NDT, 1, 1993, 235–260.
(222) Van der Meulen, G.J.R. and Van Dijk, J. A permeability-testing apparatus for concrete.Magazine of Concrete Research, 21, No. 67, June 1969, 121–123.
(223) DIN 1048 Test methods of concrete—impermeability to water: Part 2. Deutscher Institut fürNormung, Germany.
(224) Scales, R. Permeabiity tests on concrete and their relations to durability. Proc. 1st Int. Conf.on Deterioration and Repair of Reinforced Concrete in the Arabian Gulf, 1, CIRIA, 1985,509–527.
(225) Kelham, S. A water absorption test for concrete. Magazine of Concrete Research, 40, No. 143,June 1988, 106–110.
(226) Guidelines for the appraisal of structural components in high alumina cement concrete.Institution of Structural Engineers, London, 1975.
(227) Schupack, M. and Schupack, D. Non-destructive field test for concrete leak tightness. ConcreteInternational, 14, No. 3, 1992, 50–54.
(228) ASTM C457 Air void content in hardened concrete. American Society for Testing andMaterials, Philadelphia.
(229) Sadegzadeh, M., Page, C.L. and Kettle, R.J. Surface microstructure and abrasion resistance ofconcrete. Cement and Concrete Research, 17, 1987, 581–590.
(230) Kettle, R.J. and Sadegzadeh, M. Field Investigations of abrasion resistance. Materials andStructures, 20, 1987, 96–102.
(231) Sadegzadeh, M. and Kettle, R.J. Indirect and non-destructive methods for assessing abrasionresistance of concrete. Magazine of Concrete Research, 38, No. 137, Dec. 1986, 183–190.
(232) Manning, D.G. and Holt, F.B. Detecting delamination in concrete bridge decks. ConcreteInternational, 2, No. 11, Nov. 1980, 34–41.
(233) Holt, F.B. and Eales, J.W. Non-destructive evaluation of pavements. Concrete International,9, No. 6, June 1987, 41–45.
(234) ASTM D4788 Detecting delaminations in bridge decks using infrared thermography.(235) Godfrey, J.R. New tools help find flaws. Civil Engineering, 54, No. 9, 1984, 34–41.(236) Hillemeier, B. and Muller-Run, V. Bewehrungssuche mit der thermographie. Beton und
Stahlbeton, 75, 1980, 83–85.(237) Agema Infrared Systems AB, Box 3, S-182 DANDERYD, Sweden.(238) Stanley, C. and Balendran, R.V. Non-destructive testing of the external surfaces of concrete
buildings and structures in Hong Kong using infrared thermography. Concrete, May/June 1994,35–37.
(239) Ward, I.C. The use of a thermal imaging system in building and air-conditioning applications.Insight, 36, No. 7, July 1994, 511–513.
Copyright 1996 Chapman & Hall

(240) Cantor, T.R. Review of penetrating radar as applied to the non-destructive testing of concrete.Spec. Publ. SP 82–29, American Concrete Institute, Detroit, 1984, 581–602.
(241) Bungey, J.H. and Millard, S.G. Radar inspection of structures. Proc. ICE, Structs & Bldgs, 99,May 1993, 173–186.
(242) Olver, A.D. and Cuthbert, L.G. FMCW radar for hidden object detection. Proc. Instn Elect.Engnrs, 135, Part F, No. 4, Aug. 1988, 354–361.
(243) Cariou, J. Perspectives sur les applications des techniques radar aux bétons. Bulletin de Liaisondes Laboratories des Ponts et Chaussées, Paris, No. 163, Sept./Oct. 1989, 25–29.
(244) Bungey, J.H., Shaw, M.R., Millard, S.G. and Thomas, C. Radar testing of structural concrete.Proc. 5th Int. Conf. Ground Penetrating Radar, GPR ’94, 1, 305–318.
(245) Hobbs, C.P. et al. Radar inspection of civil engineering structures. Proc. Non-DestructiveTesting in Civil Engineering, Brit. Inst. NDT, 1, 1993, 79–96.
(246) Carter, C.R., Chung, T., Holt, F.B. and Manning, D.G. An automated signal processing systemfor the signature analysis of radar wave forms from bridge decks. Can. Elect. Eng., 11, No. 3,1986, 128–137.
(247) ASTM D4748 Determining the thickness of bound pavement layers using short pulse radar.(248) British Gas Plc. Ground probing radar. Publicity material, British Gas Plc, London.(249) ERA Technology Ltd, Surface penetrating radar. Publicity material, Leatherhead, Surrey.(250) GSSI Inc. Subsurface interface radar. Publicity material, N.Salem, New Hampshire, publicity
literature.(251) Sensors & Software Inc., Mississauga, Ontario, Canada.(252) Concrete International, Products & Practice, 17, No. 2, Feb. 1995, 60.(253) Bungey, J.H. and Millard, S.G. Radar inspection of concrete structures. 3rd Int. Kerensky Conf.,
Global Trends in Structural Engineering, Singapore, 1994, 8 pp.(254) Cheshire, K. Police search for human remains in Gloucestershire using surface penetrating
radar. Insight, 36, No. 5, May 1994.(255) Bungey, J.H., Millard, S.G. and Shaw, M.R. The influence of reinforcing steel on radar surveys
of concrete structures. Construction & Building Materials, 8, No. 2, 1994, 119–126.(256) Molyneaux, T.C.K., Millard, S.G., Bungey, J.H. and Zhou, J.Q. Radar assessment of structural
concrete using neural networks. NDT and Evaluation International (in press).(257) ASTM D4580 Measuring delaminations in concrete bridge decks by sounding.(258) Acoustic Pile Integrity Testing Automatic Logger. Instruction Manual, CNS Electronics Ltd,
61–63 Holmes Rd, London.(259) Byles, R. Dutch strike a blow for integrity testing. New Civil Engineer, 11 June 1981, 26.(260) Sansalone, M. Detecting delaminations in concrete bridge decks with and without asphalt
overlays using an automated impact echo field system. Proc. Non-Destructive Testing in CivilEngineering, Brit. Inst. NDT, 2, 1993, 807–827.
(261) Cheng, C. and Sansalone, M. Effect on impact-echo signals caused by steel reinforcing barsand voids around bars. ACI Materials Jnl, 90, No. 5, Sept/Oct 1993, 421–434.
(262) Germann Instruments AS Publicity material. Emdrupvej 102, 2400 NV, Copenhagen,Denmark.
(263) A new tool for Non-Destructive measurement of pavement thickness. SHRP Focus, July 1994,1–4.
(264) Casas, J.R. An experimental study on the use of dynamic tests for surveillance of concretestructures, RILEM. Materials & Structures, 1994, 27, 588–595.
(265) Carino, N.J. and Sansalone, M. Detection of voids in grouted ducts using the impact-echomethod. ACI Materials Jnl., 89, No. 3, May/June 1992, 296–303.
(266) Pratt, D. and Sansalone, M. Impact-echo signal interpretation using artificial intelligence. ACIMaterials Jnl., 89, No. 2, Mar/Apr 1992, 178–187.
(267) Olson, L.D. and Wright, C.C. Non-destructive testing for repair and rehabilitation. ConcreteInternational, 12, No. 3, Mar. 1990, 58–64.
(268) Nazarian, S. and Desai, M.R. Automated surface wave method: Field testing. ASCE JnlGeotech. Eng., 119, No. 7, July 1993, 1094–1111.
(269) Maguire, J.R. and Severn, R.T. Assessing the dynamic properties of prototype structures byhammer testing. Proc. ICE, Pt. 2, 83, Dec. 1987, 769–784.
(270) Williams, C. Vibration testing of large structures to determine structural characteristics. Proc.Struct. Faults and Repair 87, Engineering Technics Press, Edinburgh, 31–35.
(271) Stain, R.T. Integrity testing. Civil Engineering, April 1982, 54–59 and May 1982, 71–73.
Copyright 1996 Chapman & Hall

(272) BS 1881: Part 205 Recommendations for radiography of concrete. British StandardsInstitution, London.
(273) Forrester, J.A. Gamma radiography of concrete. Proc. Symp. on NDT of Concrete and Timber,ICE London, 1969, 9–13.
(274) Pullen, D. and Clayton, R. The Radiography of Swathling bridge. Atom, No. 301, Nov. 1981,283–288.
(275) Parker, D. X-rated video. New Civil Engineer, 21st April, 1994, 8–9.(276) Carter, P. Problems with post-tensioned bridges. QT News, 53, Mar. 1995, Harwell A-EA
Technology, p. 4.(277) Kear, P and Leeming, M. Radiographic inspection of post-tensioned concrete bridges. Insight,
36, No. 7, July 1994, 507–510.(278) Smith, E.E. and Whiffin, A.C. Density measurement of concrete slabs using gamma radiation.
The Engineer, 194, Aug. 1952, London, 278–281.(279) de Hass, E. Radio-isotope techniques in concrete research. ACI Journal, Proceedings, 50, No.
10, June 1954, 890–891.(280) Simpson, J.W. A non-destructive method of measuring concrete density using backscattered
gamma radiation. Building Science, 3, No. 1, Aug. 1968, Pergamon, Oxford, 21–29.(281) Honig, A. Radiometric determination of the density of fresh shielding concrete in-situ. Spec.
Publ. SP 82–30, American Concrete Institute, Detroit, 1984, 603–618.(282) Martz, H.E, Schneberk, D.J., Robertson, G.P. and Monteiro, P.J.M Computerised tomography
analysis of reinforced concrete. ACI Materials Jnl, 90, No. 3, May/June 1993, 259–264.(283) Hawkins, N.M., Kobayashi, A.S. and Fourney, M.E. Use of holographic and acoustic emission
techniques to detect structural damage in concrete members. Experimental Methods inConcrete Structures for Practitioners, American Concrete Institute, Detroit, 1979.
(284) Nielsen, J. and Griffin, D.F. Acoustic emission of plain concrete. Journal of Testing andEvaluation (JTEVA) USA, 5, No. 6, Nov. ’77, 476–483.
(285) Lim, M.K. and Koo, T.K. Acoustic emission from reinforced concrete beams. Magazine ofConcrete Research, 41, No. 149, Dec. 1989, 229–234.
(286) Dunegan/ENDEVCO 3000 Series Acoustic Emission Instrumentation System. ENDEVCO (UKDivision), Mebourn, Royston, Herts.
(287) Mindess, S. Acoustic emission and ultrasonic pulse velocity of concrete. Int. Journal of CementComposites and Lightweight Concrete, 4, No. 3, Construction Press, Aug. 1982, pp. 173–179.
(288) Titus, R.N.K., Reddy, D.V., Dunn, S.E. and Hartt, W.H. Acoustic emission crack monitoringand prediction of remaining life of corroding reinforced concrete beams. Proc. 4th EuropeanConf. on NDT, Vol. 2, Pergamon, Oxford, 1988, pp. 1031–1040.
(289) Rossi, P., Godart, N., Robert, J.L., Gervais, J.P. and Bruhat, D. Investigations of the basiccreep of concrete by acoustic emission. Materials and Structures, 27, 1994, 510–514.
(290) Jenkins, D.R. and Steputat, C.C. Acoustic emission monitoring of damage initiation anddevelopment in structurally reinforced concrete beams. Proc. Struct. Faults & Repairs 93,Eng. Technics Press, Edinburgh, 3, 1993, 79–87.
(291) Redner, A.S. Use of photoelastic and Moiré fringe techniques. Experimental Methods inConcrete Structures for Practitioners, American Concrete Institute, Detroit, 1979.
(292) ASTM C1074 Estimating concrete strength by the maturity method. American Society forTesting and Materials, Philadelphia.
(293) Pearson, R.I. Maturity meter speeds post-tensioning of structural concrete frame. ConcreteInternational, 9, No. 4, April 1987, 63–64.
(294) Carino, N.J. The maturity method. CRC Handbook on Non-Destructive Testing of Concrete.CRC Press, ed. Malhotra, V.M. and Carino, N.J, Chapt. 5, 1991, pp. 101–146.
(295) BS DD92 Method of temperature matched curing of concrete specimens. British StandardsInstitution, London.
(296) Harrison, T.A. Temperature matched curing. Proc. Symp. on Developments in Testing Concretefor Durability, Concrete Society, London, Sept. 1985, 25–34.
(297) Cannon, R.P. Temperature matched curing: its development, application and future role inconcrete practice and research. Concrete, 20, No. 7, July 1986, 27–30; 20, No. 10, Oct. 1986,28–32; and 21, No. 2, Feb. 1987, 33–34.
(298) Pye, P.W. and Warlow, W.J. A method of assessing the soundness of some dense floor screeds.Current Paper CP72/78, Building Research Establishment, Garston, 1978.
Copyright 1996 Chapman & Hall

(299) Pye, P.W. BRE Screed tester: classification of screeds, sampling and acceptance limits.Information Paper IP11/84, Building Research Establishment, Garston, 1984.
(300) Chung, H.W. and Law, K.S. Assessing fire damage of concrete by the ultrasonic pulsetechnique. Cement, Concrete, and Aggregates, CCAGDP, 7, No. 2, American Society forTesting and Materials, Philadelphia, Winter 1985, 84–88.
(301) Evaluation and repair of fire damage to concrete. Spec. Publ. SP-92, American ConcreteInstitute, Detroit, 1986.
(302) BS 1881: Part 124 Methods of testing concrete: analysis of hardened concrete. BritishStandards Institution, London.
(303) Figg, J.W. and Bowden, S.R. The Analysis of Concrete, HMSO, London, 1971.(304) Concrete Society Analysis of hardened concrete, Technical Report, 32, 1989.(305) ASTM C85 Cement content of hardened Portland cement concrete. American Society for
Testing and Materials, Philadelphia.(306) Grantham, M.C. Determination of slag and pulverised fuel ash in hardened concrete—the
method of last resort revisited. STP 1253, Amer. Soc. for Testing and Materials, 1995 (inpress).
(307) Brown, A.W. A tentative method for the determination of the original water/cement ratio ofhardened concrete. Journal of Applied Chemistry, 7 Oct. 1957, 565–572.
(308) Mayfield, B. The quantitative evaluation of the water/cement ratio using fluorescencemicroscopy. Magazine of Concrete Research, 42, No. 150, March 1990, 45–49.
(309) Neville, A.M. Properties of Concrete. Pitman, 1981, 512.(310) Power, T.O. and Hammersley, G.P. Practical concrete petrography. Concrete, 12, No. 8, Aug.
1978, 27–30.(311) French, W.J. Concrete petrography: a review. Quarterly Jnl of Eng. Geology, Geological Soc.,
24, 1991, 17–48.(312) Roberts, H.M. and Jaffrey, S.A.M.T. Rapid chemical test for the detection of high alumina
cement concrete. Information Sheet IS 15/74, Building Research Establishment, Garston, 1974.(313) ASTM 856 The petrographic examination of hardened concrete. American Society for Testing
and Materials, Philadephia.(314) BS 812: Part I Methods for sampling and testing of mineral aggregates, sands and fillers.
British Standards Institution, London.(315) Determination of chloride and cement content in hardened Portand cement concrete.
Information Sheet IS 13/77, Building Research Establishment, Garston, 1977.(316) Simpified method for the detection and determination of chloride in hardened concrete.
Information Sheet IS 12/77, Building Research Establishment, Garston, 1977.(317) Figg, J.W. Methods to determine chloride concentrations in in-situ concrete. TRRL Contractor
Report 32, 1986.(318) ‘Hach’ Chloride test kit, Camlab Ltd., Nuffield Rd., Cambridge.(319) ‘Quantab’ Chloride filtrators, Miles Laboratories Ltd., Stoke Court, Stoke Poges, Slough,
Bucks.(320) BS 8110: Part 1 Structural use of concrete: code of practice for design and construction. British
Standards Institution, London.(321) Kay, E.A., Fookes, P.G. and Pollock, D.J. Deterioration related to chloride ingress. Concrete,
15, No. 11, Nov. 1981, 22–28.(322) Roberts, M.H. Carbonation of concrete made with dense natural aggregates IP6/81, Building
Research Establishment, Garston, 1981.(323) Theophilus, J. Uncertainties in assessing the durability of concrete. Civil Engineering, Aug.
1986, 10–13.(324) Sims, I. The assessment of concrete for carbonation. Concrete, 28, No. 6, Nov./Dec. 1994,
33–38.(325) Watkins, R.A.M. and Pitt-Jones, A.A. Carbonation: a durability model related to site data.
Proc. ICE, Structs. and Bldgs, 99, May 1993, 155–166.(326) Spectronics Corporation. Detector keeps bridges from vanishing. Concrete International, 16,
No. 7, July 1994, 78.(327) Natesaiyer, K., Stark, D. and Hover, K.C. Gel fluorescence reveals reaction product traces.
Concrete International, 13, No. 1, Jan. 1991, 25–28.(328) Polivka, M., Kelly, J.W. and Best, C.H. A physical method for determining the composition of
Copyright 1996 Chapman & Hall
hardened concrete. Spec. Tech. Publ. STP 205, 1958, American Society for Testing andMaterials, Philadelphia, 135–152.
(329) Markestad, A. Changing over from standard microscopic technique to an image analysingmicroscope for measuring quality parameters of concrete. Proc. Int. Conf. on ConcreteStructures, Trondheim, Tapir, 1978, pp. 57–67.
(330) Poulsen, E. Preparation of samples for microscopic investigation. Progress Report M1,Committee on alkali reactions in concrete, Danish National Institute of Building Research andAcademy of Technical Sciences, Copenhagen, 1958.
(331) Placido, F. Thermoluminescence test for fire damaged concrete. Magazine of ConcreteResearch, 32, No. 111, June 1980, 112–116.
(332) Chew, M.Y.L. Effect of heat exposure duration on the thermoluminescence of concrete. ACIMaterials Journal, 90, July/Aug. 1994, 319–322.
(333) Midgley, H.G. The mineralogy of set high alumina cement. Transactions of the British CeramicSociety, 66, No. 4, June 1967, 161–187, Current Paper CP19/68, Building ResearchEstablishment, Garston.
(334) Midgley, H.G. and Midgley, A. The conversion of high alumina cement. Magazine of ConcreteResearch, 27, No. 91, June 1975, 59–77; Current Paper CP 72/75, Builing ResearchEstablishment, Garston.
(335) Ramachandran, V.S. Calcium Chloride in Concrete, Applied Science (London), 1976,pp. 22–38.
(336) Willard, H.H., Merritt, L.L. and Dean, J.A. Instrumental Methods of Anaysis, 5th edn., VanNostrand, London, 1974.
Copyright 1996 Chapman & Hall