Testing and modelling the fatigue behaviour of GFRP ...
10
Full Length Article Testing and modelling the fatigue behaviour of GFRP composites – Effect of stress level, stress concentration and frequency Wahid Ferdous a,⇑ , Allan Manalo a , Joshua Peauril a , Choman Salih a , Kakarla Raghava Reddy a , Peng Yu a , Peter Schubel a , Tom Heyer b a University of Southern Queensland, Centre for Future Materials (CFM), Toowoomba, QLD 4350, Australia b Austrak Pty. Ltd., Brisbane, QLD 4001, Australia article info Article history: Received 23 September 2019 Revised 22 December 2019 Accepted 7 January 2020 Available online 28 January 2020 Keywords: Glass fibres Stress concentration Failure theory Analytical model abstract The effects of stress level, stress concentration and frequency on the fatigue life of glass fibre reinforced polymer (GFRP) composites have been investigated under tension-tension fatigue at a stress ratio of 0.1. Vinyl ester-based GFRP laminates were tested at a stress level of 80%, 70%, 60%, 50%, 40% and 25% of the ultimate tensile strength until the failure or up to 8 million cycles whichever comes first in order to deter- mine fatigue life and identify failure modes. The results showed that the composites failed in pure tension at high applied stress while the failure was dominated by stress concentration at low stress level. Moreover, stress concentration was found to reduce the fatigue life of the laminated composites and the test frequency of up to 8 Hz did not induce excessive self-heating. The mean stress failure criteria was found appropriate for numerical modelling of GFRP composites subjected to low level of stress while Goodman failure criteria is suitable at high stress condition. The analytical model considering the effect of stress ratio, applied maximum stress, frequency and material properties is able to predict reliably the fatigue life of GFRP composites in tension. Ó 2020 Karabuk University. Publishing services by Elsevier B.V. This is an open access article under the CC BY-NC-ND license (http://creativecommons.org/licenses/by-nc-nd/4.0/). 1. Introduction The acceptance and application of fibre reinforced polymer (FRP) composite materials are increasing due to their high strength-to-weight ratio, excellent durability, good environmental resistance and design flexibility [1–3]. Recently, the application of FRP particularly, glass fibre reinforced polymer (GFRP) has been extended to civil construction such as bridge girders [4], bridge decks [5], space frame [6], retaining walls [7], railway sleepers [8–10] and other novel applications [11,12]. Those structures are often subjected to repetitive loading that causes degradation due to fibre fracturing, matrix cracking and fibre/matrix debonding [13]. Manalo et al. [14] further highlighted that the response of composite structures for a prolonged loading in time is critical as the design of FRP for civil infrastructure is normally governed by serviceability rather than strength. Thus, an in-depth understand- ing of the effect of repetitive loading on the structural performance of composites is needed to ensure they are safe for the targeted design life. The behaviour of GFRP is linear and generally failed in brittle manner, which is fundamentally different from metals where fail- ure initiates from a single crack and propagates until failure. Since the failure of GFRP is sudden without any warning, an understand- ing of their fatigue life with respect to the critical design parame- ters is important. The properties of the constituent materials, fibre orientations, applied stress level, stress concentration and fre- quency are the key parameters that can influence the fatigue life of GFRP materials [15]. The tension–tension fatigue behaviour of flax/epoxy composites having fibres in longitudinal, transverse and diagonal directions has exhibited a fatigue modulus loss of 10–55%, depending on the fibre orientations and loading level [16]. The study on fatigue damage growth behaviour of carbon fibre reinforced polymer composites indicated that the initiation and growth of the fatigue cracks are highly dependent on applied stress level and they observed the delamination and transverse crack propagation as the primary failure modes [17]. Gao’s [18] study found that the high-strength material has great sensitivity to the notch effect (stress concentration) under fatigue loading. Researchers [16,19,20] claimed that the composite laminates gen- erate heat at high frequency that affects the fatigue life of the material and therefore, they restricted the test frequency up to 4 Hz to avoid specimen self-heating. To predict the fatigue life, https://doi.org/10.1016/j.jestch.2020.01.001 2215-0986/Ó 2020 Karabuk University. Publishing services by Elsevier B.V. This is an open access article under the CC BY-NC-ND license (http://creativecommons.org/licenses/by-nc-nd/4.0/). ⇑ Corresponding author. E-mail address: [email protected] (W. Ferdous). Peer review under responsibility of Karabuk University. Engineering Science and Technology, an International Journal 23 (2020) 1223–1232 Contents lists available at ScienceDirect Engineering Science and Technology, an International Journal journal homepage: www.elsevier.com/locate/jestch
Transcript of Testing and modelling the fatigue behaviour of GFRP ...

Engineering Science and Technology, an International Journal 23 (2020) 1223–1232
Contents lists available at ScienceDirect
Engineering Science and Technology,an International Journal
journal homepage: www.elsevier .com/ locate / jestch
Full Length Article
Testing and modelling the fatigue behaviour of GFRP composites – Effectof stress level, stress concentration and frequency
https://doi.org/10.1016/j.jestch.2020.01.0012215-0986/� 2020 Karabuk University. Publishing services by Elsevier B.V.This is an open access article under the CC BY-NC-ND license (http://creativecommons.org/licenses/by-nc-nd/4.0/).
⇑ Corresponding author.E-mail address: [email protected] (W. Ferdous).
Peer review under responsibility of Karabuk University.
Wahid Ferdous a,⇑, Allan Manalo a, Joshua Peauril a, Choman Salih a, Kakarla Raghava Reddy a, Peng Yu a,Peter Schubel a, Tom Heyer b
aUniversity of Southern Queensland, Centre for Future Materials (CFM), Toowoomba, QLD 4350, AustraliabAustrak Pty. Ltd., Brisbane, QLD 4001, Australia
a r t i c l e i n f o
Article history:Received 23 September 2019Revised 22 December 2019Accepted 7 January 2020Available online 28 January 2020
Keywords:Glass fibresStress concentrationFailure theoryAnalytical model
a b s t r a c t
The effects of stress level, stress concentration and frequency on the fatigue life of glass fibre reinforcedpolymer (GFRP) composites have been investigated under tension-tension fatigue at a stress ratio of 0.1.Vinyl ester-based GFRP laminates were tested at a stress level of 80%, 70%, 60%, 50%, 40% and 25% of theultimate tensile strength until the failure or up to 8 million cycles whichever comes first in order to deter-mine fatigue life and identify failure modes. The results showed that the composites failed in pure tensionat high applied stress while the failure was dominated by stress concentration at low stress level.Moreover, stress concentration was found to reduce the fatigue life of the laminated composites andthe test frequency of up to 8 Hz did not induce excessive self-heating. The mean stress failure criteriawas found appropriate for numerical modelling of GFRP composites subjected to low level of stress whileGoodman failure criteria is suitable at high stress condition. The analytical model considering the effect ofstress ratio, applied maximum stress, frequency and material properties is able to predict reliably thefatigue life of GFRP composites in tension.� 2020 Karabuk University. Publishing services by Elsevier B.V. This is an open access article under the CC
BY-NC-ND license (http://creativecommons.org/licenses/by-nc-nd/4.0/).
1. Introduction
The acceptance and application of fibre reinforced polymer(FRP) composite materials are increasing due to their highstrength-to-weight ratio, excellent durability, good environmentalresistance and design flexibility [1–3]. Recently, the application ofFRP particularly, glass fibre reinforced polymer (GFRP) has beenextended to civil construction such as bridge girders [4], bridgedecks [5], space frame [6], retaining walls [7], railway sleepers[8–10] and other novel applications [11,12]. Those structures areoften subjected to repetitive loading that causes degradation dueto fibre fracturing, matrix cracking and fibre/matrix debonding[13]. Manalo et al. [14] further highlighted that the response ofcomposite structures for a prolonged loading in time is critical asthe design of FRP for civil infrastructure is normally governed byserviceability rather than strength. Thus, an in-depth understand-ing of the effect of repetitive loading on the structural performanceof composites is needed to ensure they are safe for the targeteddesign life.
The behaviour of GFRP is linear and generally failed in brittlemanner, which is fundamentally different from metals where fail-ure initiates from a single crack and propagates until failure. Sincethe failure of GFRP is sudden without any warning, an understand-ing of their fatigue life with respect to the critical design parame-ters is important. The properties of the constituent materials, fibreorientations, applied stress level, stress concentration and fre-quency are the key parameters that can influence the fatigue lifeof GFRP materials [15]. The tension–tension fatigue behaviour offlax/epoxy composites having fibres in longitudinal, transverseand diagonal directions has exhibited a fatigue modulus loss of10–55%, depending on the fibre orientations and loading level[16]. The study on fatigue damage growth behaviour of carbonfibre reinforced polymer composites indicated that the initiationand growth of the fatigue cracks are highly dependent on appliedstress level and they observed the delamination and transversecrack propagation as the primary failure modes [17]. Gao’s [18]study found that the high-strength material has great sensitivityto the notch effect (stress concentration) under fatigue loading.Researchers [16,19,20] claimed that the composite laminates gen-erate heat at high frequency that affects the fatigue life of thematerial and therefore, they restricted the test frequency up to4 Hz to avoid specimen self-heating. To predict the fatigue life,
1224 W. Ferdous et al. / Engineering Science and Technology, an International Journal 23 (2020) 1223–1232
residual stiffness and strength, and failure mechanism, Shokriehand Lessard [21,22] proposed a generalized residual material prop-erty degradation model. This model was able to explain the state ofdamage and predicted number of cycles to failure, but it requiredmany experimental data for full material characterisation. Quares-imin et al. [13] considered the multiaxial fatigue criteria in predict-ing the fatigue life of composite laminates. They found a fairaccuracy and largely unsafe predictions that emphasising the needof a deeper understanding of failure behaviour and establish a reli-able predictive model. Understanding the effect of stress concen-tration and selecting a suitable fatigue failure criterion isimportant for predicting fatigue life.
The aforementioned review of literature has suggested thatthere is a knowledge gap in fatigue failure mechanism, their designconsiderations, reliable prediction of fatigue life and appropriatefailure theory for GFRP laminates. More specifically, it is stillremain questions (a) how the stress level dominated the failuremode, (b) how the loss of stiffness can be minimised when lami-nates are subjected to fatigue, (c) how important to avoid stressconcentration in fatigue design, (d) is it possible to test the GFRPlaminates at higher frequency (to reduce the testing time) thanthe traditional concept of testing at 4 Hz, (e) which failure criteriais the most appropriate to understand the failure behaviour ofGFRP laminates and (f) how to improve the existing fatigue modelfor reliable prediction of fatigue life? The novelty of this study is toaddress these questions that contributed to the scientific knowl-edge for further understanding of the fatigue behaviour of compos-ite structures. To achieve this goal, this study comprehensively(experimentally, analytically and numerically) investigated theeffect of stress level, stress concentration, frequency and failuretheory. The GFRP composite samples were tested at different stresslevels (low to high) and frequencies (beyond the traditional con-cept) to understand the fatigue behaviour. Finite element analysishas been conducted to understand the effect of stress concentra-tion on fatigue behaviour. Moreover, an analytical model has beensuggested to predict the fatigue life of GFRP composites at differentstress levels, frequencies and stress ratios. The outcome of thisstudy is critical to understand the property retention and failurebehaviour performance of composite materials under fatigue load-ing for simulating and designing structures subjected to movingloads, wind pressure and suction, and hydraulic forces.
Pmax
T = 0.5sLoad
2. Materials and method
2.1. GFRP composite laminates
The GFRP composite laminates used in this study were manu-factured with stringent and consistent quality control using handlayup technique. The matrix used was a vinyl ester system andthe bonded fibres improve surface quality and minimising the for-mation of resin-rich pockets by strictly controlling fibre alignmentsthat provided stronger, stiffer and lightweight laminates. The burn-out test in accordance with ASTM D2584 [23] revealed that the 10equally thick fibre plies oriented in longitudinal (60%) and diagonal(40%) directions with a fibre volume ratio of 55%. The symmetricpattern of fabric created an orthogonal fibre composite.Rectangular-shaped specimens were cut from the composite platesusing a water cooled diamond saw with a nominal dimensions of300 mm � 25 mm � 5 mm including 50 mm tabs glued at bothends, leaving the specimens’ gauge length of 200 mm.
Pmin
TimeStatic loading Stabilization Fatigue loading (2 Hz)
Fig. 1. Loading configuration for fatigue test.
2.2. Test setup
Static tensile tests were performed in accordance with ASTM-D3039 [24] in order to determine the ultimate tensile strength
(UTS) and stiffness of the specimen. Five replicate samples weretested using servo-hydraulic MTS with a capacity of 100 kN at acrosshead speed of 1 mm/min. The specimen were carefullyclamped onto the wedge jaws, which remain fixed in position onthe test sample to prevent slipping at the gripping area and prema-ture fracture. All the tests were conducted in normal room temper-ature (23 �C) and humidity (22%).
Fatigue tests were performed in tension–tension using the samecomputer-controlled servo-hydraulic MTS machine at differentload amplitudes and frequencies in accordance with ISO 13,003[25]. The chosen ranges of the loading level and loading frequencywere from 0.25 to 0.80 UTS and 2 to 8 Hz, respectively [26]. Toreduce the test time, higher frequency was used for high cycle fati-gue tests. The ratio of minimum-to-maximum applied stresses in acycle called as stress ratio (R) were constant to + 0.10 in order toapply tensile-tensile cyclic loads to the specimens. The load, dis-placement and time data were recorded at specified regular inter-vals during the fatigue tests. Tests have been stopped at specimens’failure or at eight million (8 � 106) cycles whichever comes first.For higher accuracy, two replicate samples were tested at eachstress level in low cycle fatigue test as the initial trial shows thevariation of results within 10%. The significant amount of timerequired to implement fatigue tests especially at higher cyclesand the consistency of the previous results as well as the experi-ences of previous researcher [27] provided justification to testone sample at high cycles. The low applied stress for high cycle testis expected to distribute the stress more uniformly that lead tomake the result consistent. All tests were carried out in the loadcontrol mode with a sinusoidal waveform of constant amplitude.The load scheme for fatigue test is shown in Fig. 1. Initially, thespecimen was loaded gradually up to the middle of the minimumand maximum load levels and then cyclic load started with vari-able amplitude followed by constant amplitude after a fewmoments of stabilisation.
2.3. Finite element modelling
Three-dimensional finite element (FE) model was created usingcommercial ANSYS workbench software [28] in order to under-stand the fundamental fatigue behaviour of GFRP laminates. Thereliability and accuracy of the analysis depends on material mod-els, the size and type of the mesh, boundary conditions and edgepreparation. The specimens were meshed using face meshing (usu-ally more uniform, has less distorted elements, no triangles, andusually has less nodes) tool to obtain reliable results as thisapproach is suitable to avoid random meshing. Two different typesof sample called as (a) sharp-edge and (b) round-edge were used inFE analysis. The shape, dimensions and meshing of the solid modelare shown in Fig. 2.
Considering a good balance between solution time and theaccuracy of results, a maximum element size of 2 mmwas adoptedin the model and the variation of properties in longitudinal andtransverse directions were considered by modelling orthotropicmaterial behaviour. The density and ultimate tensile strength of

50 200 mm 50
(a)
5 mm
(b)
50 200 mm 50
5 mm
(c) (d)
Fig. 2. Tensile specimens (a) sharp-edge specimen, (b) round-edge specimen, (c) meshing of sharp-edge specimen, and (d) meshing of round-edge specimen.
W. Ferdous et al. / Engineering Science and Technology, an International Journal 23 (2020) 1223–1232 1225
GFRP laminates were 2000 kg/m3 and 500 MPa, respectively whilethe elastic modulus in longitudinal direction was 18 GPa. Thetransverse modulus, poisson’s ratio and shear modulus were 9GPa, 0.25 and 6 GPa, respectively as calculated based on the previ-ously established relations between longitudinal and transverseproperties [7,29]. Fixed support was considered in one end whilethe load was applied in other end of the specimen. Firstly, themodel was verified with the static test results. The maximumstress criterion was considered to determine the static failureloads. Reference specimens were tested statically up to failure inlongitudinal tensile direction, the results of which are reported inFig. 3. This was used as the indication of the stress limits set inANSYS for both static and fatigue investigation. The ultimate fail-ure was noted when a significant part of the specimen exceededthe corresponding maximum stress limit. This criterion specifiesthe stress limit in different directions, providing a direct indicationof critical stress component and potential failure mode. This failurecriterion was preferred over other criterion (e.g., Tsai-Hill) becauseof the satisfactory description and the insightful indication of thefailure modes. Once verified the model, a linear analysis wasimplemented for fatigue investigation. Eq. (10) was used to extractthe wide range of stress versus cycle data (10% to 100% stress level)of the material required for fatigue analysis.
3. Results
3.1. Static test and verification of FE model
Before starting fatigue test, the tensile properties of the speci-men was evaluated to determine the load corresponding to a
0
100
200
300
400
500
600
0 0.01 0.02 0.03 0.04
Tens
ile s
tress
(MPa
)
Axial strain
Exp. without cyclic loadFEA without cyclic loadExp. after 8M cycles
(a)
At 61 k
Fig. 3. Static test results (a) stress–strain plot, (b) failure of the specimen, (c) stress concen
particular stress level under cyclic loading. The representative ten-sile behaviour of the GFRP laminates is shown in Fig. 3(a) that indi-cates a linear elastic nature with brittle (sudden drop of load)mode of failure (Fig. 3b). The specimens were failed at an averageload of 61 kN (CoV 6%) and 5.7 mm (CoV 3.7%) displacement thatcorresponds to an ultimate tensile strength of 500 MPa and strainof 0.028 with a tensile elastic modulus of 18 GPa. The FE model wasverified by the experimental results. It can be seen that the FEmodel can capture the actual behaviour of the GFRP laminates inan acceptable manner (Fig. 3a). However, a high level of stress con-centration (few elements reach up to 1229 MPa) was noticed at thetab for sharp-edge specimen (Fig. 3c) while the stresses were dis-tributed quite uniformly (few elements reach up to a maximumof 529 MPa) for round-edge specimen (Fig. 3d). After verifyingthe FE model, it was then used for fatigue analysis.
3.2. Tension-tension fatigue test
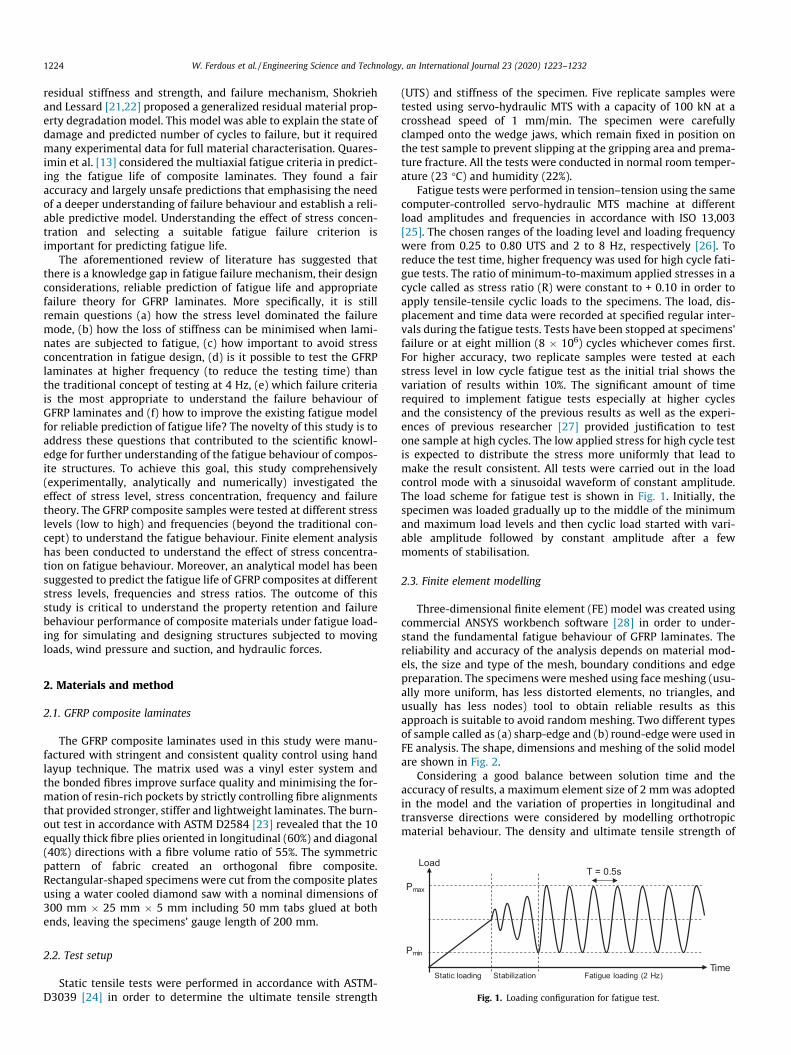
The failure modes of the specimens are shown in Fig. 4(a). It canbe seen that the specimens at 80% and 70% of the ultimate loadwere failed in tensile fracture of the fibres at the mid-height. How-ever, when the specimens were subjected to 60%, 50% and 40% ofthe ultimate load, the failure occurred at the tab without scattereddamage of the fibres (Fig. 4a). On the other hand, the specimenssubjected to 25% of the ultimate load did not fail up to 8 millioncycles and thereafter it was decided to stop the test. Therefore, itcan be said that the stress concentration is another mode of fatiguefailure and this type of failure is more likely occurred if there is arapid change of cross sectional area or material properties and sub-jected to high number of fatigue cycles. The GFRP composite
(d)(b)
At 61 kN
(c)
At 61 kN
N
tration in sharp-edge specimen, and (d) stress distribution in round-edge specimen.
(a)80% 70% 60% 50% 40%
(b)
Fig. 4. Failure modes under cyclic loading (a) for 40% to 80% stress level, and (b) test stopped at 8 million cycles for 25% stress level.
1226 W. Ferdous et al. / Engineering Science and Technology, an International Journal 23 (2020) 1223–1232
laminates used in this study is designed for an internal reinforce-ment of composite railway sleepers where only 3 million cyclesare considered as a standard number for fatigue test [30]. However,the objective of this study is to understand the fatigue behaviour ofthe laminates for designing reinforcement of composite railwaysleepers, therefore a fatigue test up to a very high number of cycles(i.e., 8 million) has been conducted. The slope of the load–displace-ment curve was decreased gradually indicating the loss of stiffness.The applied stresses, test frequency, average fatigue life (with stan-dard deviation, SD), loss of stiffness and failure modes are providedin Table 1.
3.3. Damage
The surface of the GFRP specimen was examined using opticalmicroscope at different stages of the fatigue test. Fig. 5 (a) showsthe initial surface condition while the formation of micro-cracksafter 3-million and 8-million cycles are illustrated in Fig. 5(b)and 5(c), respectively. It is obvious that the surface of the specimenwas affected in scattered manner. This is because the GFRP com-posite laminate is inhomogeneous and anisotropic in nature andthus, the damage is generated at any location of the specimenaccording to the local stress distribution albeit in a random way,different from what generally happens along the crack propagationof metals [31–34]. Harris [35] indicated that the damage in fibrecomposite material may occur due to either independently or com-bined action of matrix cracking, fibre breakage, debonding anddelamination. The outermost layer of the specimen was composedof longitudinal fibres and due to its greater elongation, the matrixattracted more stresses than fibres that generated cracks in thesurface. This is further supported by the close observation of sur-face roughness that was captured by optical microscope and lateranalysed using image processing software as provided in Fig. 5(d), 5(e) and 5(f). It can be seen that the surface of the specimenwas sharp and flat at the beginning (Fig. 5d) whereas the sharpnessand flatness decreased at 3-million cycles (Fig. 5e) and furtherdeteriorated at 8-million cycles (Fig. 5f). As cycling continues, theviscoelastic deformations in the resin, but also growing of themicro-cracks, favour stress redistributions that causes cracks to
Table 1Fatigue test results.
Stress level (% UTS) No. of samples Frequency (Hz) Average
80 2 2 360 (SD70 2 2 984 (SD60 2 2 1879 (SD50 2 2, 3, 4 29,174 (40 1 2 187,29225 1 8 8,000,00
propagate in transverse direction to some critical level when thestress reaches to the capacity, and ultimate failure of the specimenoccur.
4. Modelling
The residual strength after constant amplitude of fatigue cyclesis correlated to the initial static strength of the material [36]. Thestrength degradation of GFRP laminates is modelled based on thehypothesis that the material strength undergoes a continuousdecay under cyclic loading and can be expressed by Eq. (1) usingpower law [37]. Under a constant frequency loading the strengthdegradation grows with the increase of fatigue cycles or time inother words. Therefore, Eq. (1) can be rewrite as a function of timedomain and presented in Eq. (2).
drdn
¼ �C1n�m1 ð1Þ
drdt
¼ �C2t�m2 ð2Þ
In Eqs. (1) and (2), ris the residual strength after n cycles; tisthe time; C1, C2, m1and m2are the material constants. Here, Eq.(2) is based on the assumption that the temperature of the speci-men will remain constant or close to constant during the test.
The material constant C2 is the function of stress ratio ðRÞ, ulti-mate tensile strength ðruÞ and maximum applied stress ðrmaxÞ thatcan be expressed by Eq. (3) where the constant A depends on themoisture content, temperature of the sample, material propertiesand loading type.
C2 ¼ A:FðR;ru;rmaxÞ ð3Þ
Sendeckyj [36] and Hertzberg and Manson [38] formulated theeffect of R, ru and rmax on the fatigue life of GFRP composites undertension–tension and fully reversed loading conditions as presentedin Eq. (4).
F R;ru;rmaxð Þ ¼ r1�cu rc
maxð1� wÞc ð4Þ
fatigue life (Cycles) Stiffness loss (%) Failure mode
= 13) 3.74 Pure tension= 45) 5.77 Pure tension= 92) 6.04 Stress concentration
SD = 1503) 6.84 Stress concentration7.45 Stress concentration
0 4.74 Did not fail (test stopped)

1 mm
1 mm
(a)
(b)
(d)
(e)
1 mm
(c) (f)
No surface damage
Surface damage started
Surface damage propagated
Fig. 5. Surface condition at (a) 0 cycle (beginning), (b) 3 million cycles (surface damage started) and (c) 8 million cycles (surface damage propagated); and surface roughnessat (d) 0 cycle (beginning), (e) 3 million cycles and (f) 8 million cycles.
W. Ferdous et al. / Engineering Science and Technology, an International Journal 23 (2020) 1223–1232 1227
Hertzberg and Manson [38] experimentally determined themagnitude of constant c in the range of 0:6 < c < 7:6 for fatiguedamage propagation in composites. However, it can be calculatedfrom the smallest angle ðhÞ between fibre direction and loadingdirection as given in Eq. (5).
c ¼ 1:6� wsinh ð5ÞIn Eqs. (4) and (5), w is defined asw ¼ R for �1 < R < 1 (tension–tension and reverse loading)w ¼ 1=R for 1 < R < 1 (compression-compression loading).Fatigue failure will occur when the ultimate tensile strength
ðruÞ decreases to be equal to the maximum applied stressðrmaxÞ.The number of cycles required to degrade the strength of the mate-rial from ru tormax is the fatigue life. The fatigue life can be deter-mined by integrating Eq. (2) from the beginning to the failure i.e.,t ¼ t0 to t ¼ T as expressed in Eq. (6). The time ðtÞ can be defined bythe number of cycles nð Þ and frequency ðf Þ as given in Eq. (7).
½r�rmaxru
¼ � C2
�m2 þ 1½t�m2þ1�t¼T;n¼N
t¼t0 ;n¼1 ð6Þ
t ¼ nf
ð7Þ
Substituting Eq. (3), Eq. (4) and Eq. (7) in Eq. (6), the followingrelationship can be obtained
rmax � ruð Þ ¼ �A:r1�cu rc
max 1� Rð Þc�m2 þ 1
1
f�m2þ1 N�m2þ1 � 1� �
ð8Þ
Taking, a ¼ A�m2þ1 and b ¼ �m2 þ 1, the Eq. (8) can be rearranged
as
ru
rmax� 1
� �ru
rmax
� �c�1 11� Rð Þc ¼ aðNb � 1Þf�b ð9Þ
Further rearranging Eq. (9), the fatigue life can be determinedusing Eq. (10).
N ¼ 1þ f b
aru
rmax� 1
� �ru
rmax
� �c�1 11� Rð Þc
" #1b
ð10Þ
The model presented in Eq. (9) has two parameters a and b thatcan be determined from few sets of experimental data. Only threestraightforward fatigue test results at a particular stress ratio butdifferent stress level are enough to determine the parameters aand b. Eq. (9) representing a straight line equation passing through

1228 W. Ferdous et al. / Engineering Science and Technology, an International Journal 23 (2020) 1223–1232
origin when plotting the left hand side of Eq. (9) against the quan-
tity ðNb � 1Þf�b. The best fit straight line can be obtained after sev-eral trials of b value (0.2589 for this study) where the slope of thestraight line passing through origin is the value of a (0.1611 for thiscase).
The fatigue model presented in Eq. (10) considered the effect ofstress ratio, applied maximum stress, frequency and material prop-erties. The effect of frequency has not been considered in manyexisting fatigue models. For example, the model proposed byCaprino and D’Amore [37] did not consider the effect of frequencywhich is an important parameter that influence the fatigue life.Therefore, the model provided in this study has a clear advantagethan the existing models [39,40]. The model presented in thisstudy is not only restricted to the GFRP laminates but also suitableto predict fatigue life for any materials after adjusting the materialconstant parameters a and b.
5. Discussion
5.1. Effect of stress level
The effect of applied stress level on the fatigue life (cycles) isplotted in Fig. 6. The analytical model captured well the experi-mental behaviour and predicted fatigue life at very low stress level(i.e., at 20%). This figure shows that the fatigue life is increasingwith the decrease of applied stress level, however, the responseis slightly nonlinear even in semi-log plot. Previous researchersobserved (comparison was made in normalised S-N curve) a linearvariation of fatigue life in semi-log plot for carbon/epoxy, glass/epoxy, basalt/epoxy, carbon nanotube/epoxy and flax/epoxy fibrereinforced plastics [16,17,20,41]. The findings of this study indi-cates that the fatigue life of glass/vinyl ester increasing signifi-cantly for a small decrease of stress level, or in other words, therate of increase of fatigue life for vinyl ester based composites ismore than epoxy-based composites. Fig. 4(a) shows the failure ofthe specimen at different stress levels. It was observed that thespecimens were failed in pure tension due to the rupture of fibresat 80% and 70% load. However, the failure occurred at the tab dueto stress concentration when the specimens were subjected to astress level of 60% or less. The stress concentrates slowly to a loca-tion where there is a change in sectional dimension or variation ofmaterial properties. The specimen fails in short period of time andat low number of cycles for a high level of applied stress (80% and70%) that forced them to fail in pure tension. The variation in fail-ure modes under cyclic load depends on fibre types and orienta-
y = -0.053ln(x) + 1.0593R² = 0.9444
y = -0.05ln(x) + 1.0259R² = 0.9938
0%
10%
20%
30%
40%
50%
60%
70%
80%
90%
100%
1.E+0 1.E+2 1.E+4 1.E+6 1.E+8
App
lied
stre
ss
Cycles, N
ExperimentalTheoretical
*Test stopped at 8 million cycles
*
Fig. 6. Effect of stress level on fatigue life (S-N curve).
tions, and agrees with the findings of Wu et al. [20] wherein theyobserved longitudinal and transverse cracking of fibres at failure.
Fig. 7 plotted the initial and final hysteretic cycles of load–dis-placement curve for all levels of applied stress. Two major changesbetween first and last cycles are identified: (a) decrease of slopeand (b) slight increase of area in the hysteretic cycle. The decreaseof slope in load–displacement curve indicates the loss of stiffnessof the specimen with the increase of fatigue cycles. The increaseof fatigue cycle gradually transform the matrix softer and makethe bond between resin and fibre weaker. The slight increase ofarea in last hysteretic cycle compare to the first indicates the dis-sipation of energy. The cumulative irreversible process of fatiguedegradation occurs due to the internal friction and micro-fractures that reflects in different forms of dissipation mechanismssuch as heat and mechanical hysteresis [42]. The potential energyconverted into heat that rises the temperature of the specimenwith the increase of fatigue cycles. It can be seen that the dissi-pated energy decreased as the applied load decreased, or in otherwords, the loss of energy per cycle increases with the increase ofapplied stress level. The narrow hysteresis loops gradually becomestraight lines as the applied load decreases.
Fig. 8 shows the residual stiffness at failure for different stresslevels. It can be seen that the specimen lost their stiffness by3.74%, 5.77%, 6.04%, 6.84% and 7.45% for 80%, 70%, 60%, 50% and40% of the stress level, respectively. The specimen at 25% stresslevel did not fail up to 8 million cycles and the static test of theunbroken sample exhibited the strength up to 88% of its originalas shown in Fig. 3(a). The tensile properties of composites are gov-erned mainly by the fibres thus exhibited high strength and stiff-ness retention. In a similar GFRP composite, Vieira et al. [19],Manjunatha et al. [43] and Bourchak et al. [44] observed the lossof stiffness up to 20% at 40% stress level. Harris [35] indicated thatthe degradation of mechanical properties under cyclic loading lar-gely depends on the lay-up of the composite and the mode of test-ing. The investigated laminates in the previous study [19,43,44]were composed of both longitudinal (0⁰) and transverse (90⁰)fibres while the laminates in the present study were fabricatedwithout transverse fibres but having fibres in ± 45� directionswhich can retain better stiffness than transverse directional fibres.Therefore, it can be said that the loss of mechanical properties oflaminated composites under cyclic loading can be minimised byavoiding fibres in transverse direction.
5.2. Effect of stress concentration
In reality, the structural components are often loaded withstress concentrating features such as tapers, notches, holes, flanges,grooves, embossments etc. that serves an essential purpose andcannot be eliminated. The abrupt change in section creates stressconcentration and affects the overall performance of the structure.Using finite element modelling, Fig. 9 compares the fatigue perfor-mance of sharp-edge (high stress concentration) and round-edge(low stress concentration) specimens. It can be seen that the fati-gue life (i.e., the number of cycles at failure) that is obtained forthe same material is 40–80 times higher for round-edge specimenthan sharp-edge at a particular stress level. Maragoni et al. [45]found that the fatigue damage initiation, evolution and stiffnessdrop are deeply affected by the stress concentrating features suchas voids. Moreover, the effect of stress concentration on the fatiguelife is more for higher than lower number of cycles. Therefore, astress concentration factor need to be introduced to correlate thefatigue strength between sharp and round edge specimens. Thesimplified relationship is given in Eq. (11) while the stress concen-tration factor for the particular specimen in this study is proposedin Eq. (12). In Eq. (11), Sn is the adjusted fatigue strength for

0
10
20
30
40
50
0 2 4 6
Load
, P (k
N)
Displacement, δ (mm)
First cycle (N=1)Last cycle (N=375)
0
10
20
30
40
50
0 2 4 6
Load
, P (k
N)
Displacement, δ (mm)
First cycle (N=1)Last cycle (N=1067)
0
10
20
30
40
50
0 2 4 6
Load
, P (k
N)
Displacement, δ (mm)
First cycle (N=1)Last cycle (N=2243)
0
10
20
30
40
50
0 2 4 6
Load
, P (k
N)
Displacement, δ (mm)
First cycle (N=1)Last cycle (N=37571)
0
10
20
30
40
50
0 2 4 6
Load
, P (k
N)
Displacement, δ (mm)
First cycle (N=1)Last cycle (N=187291)
)b()a(
0
10
20
30
40
50
0 2 4 6
Load
, P (k
N)
Displacement, δ (mm)
First cycle (N=1)Last cycle (N=8 million)
)d()c(
)f()e(Fig. 7. Load-displacement behaviour at (a) 80%, (b) 70%, (c) 60%, (d) 50%, (e) 40% and (f) 25% of the ultimate load.
86
88
90
92
94
96
98
100
80% 70% 60% 50% 40% 25%
% R
esid
ual s
tiffn
ess
afte
r fat
igue
% Stress
Fig. 8. Effect of stress level on stiffness (Note: the specimen did not fail at 25%).
0%10%20%30%40%50%60%70%80%90%
100%
1.E+0 1.E+2 1.E+4 1.E+6 1.E+8 1.E+10
Appl
ied
stre
ss
Cycles, N
Sharp edgeRound edge
Fig. 9. Effect of edge preparation on fatigue life.
W. Ferdous et al. / Engineering Science and Technology, an International Journal 23 (2020) 1223–1232 1229

0
2
4
6
8
10
0 10000 20000 30000
Incr
ease
of t
empe
ratu
re,
(0C
)
Cycles, N
2 Hz3 Hz4 Hz8 Hz
Fig. 10. Effect of frequency on surface temperature of the specimen.
1230 W. Ferdous et al. / Engineering Science and Technology, an International Journal 23 (2020) 1223–1232
sharp-edge specimen while S0n is the calculated fatigue strength for
round-edge specimen assuming no stress concentration. The stressconcentration factor (Kt) is dependent on the level of applied stressand can be determined using Eq. (12). An example, the S-N curve ofGFRP material without stress concentration is given to the designengineer for determining maximum allowable stress for 1 millioncycles of fatigue life where the structure need to be designed withsharp-edge specimen (i.e., components with stress concentration).Fig. 9 shows that the fatigue life of specimen without stress con-centration (i.e., round-edge) is one million cycles when 53% ofthe ultimate load is applied. The stress concentration factor at thislevel of stress is 1.40, indicating that the maximum allowablestress need to be reduced to 38% for sharp-edge specimen toachieve one million cycles of fatigue life.
Sn ¼ 1Kt
S0n ð11Þ
Kt ¼ffiffiffiffiffiffiffiffiffiffiru
rmax
rð12Þ
This study found that the stress concentration factor for sharpedge GFRP specimen can vary between 1 and 3, depending onthe level of applied stress. This outcome supported the findingsof Keller et al. [46] where they observed the tapered shape speci-men (low stress concentration) performed better than the tabbedspecimen (high stress concentration) under cyclic loading. Sincethe stress is much higher at the location of stress concentration,the fatigue failure generally initiate from this region. Therefore,when designing a structural component for cyclic loading, it is bestto minimise stress concentration to prevent premature fatigue fail-ure. This can be achieved by avoiding stress concentrating featuresfrom the design or by replacing sharp corners with the rounded fil-lets having radius as large as practically possible. In some caseswhere sharp corners are unavoidable, the stress concentrationcan be minimised by keeping this part away from the areas of peakstress under load.
5.3. Effect of frequency on heat generation
In fatigue test, it has been claimed that the specimen generatesheat at high frequency and to avoid specimen self-heating, the testfrequency is restricted up to 4 Hz [16,19,20]. This is more criticalfor fibre composites especially for resin/matrix interface as it cansoften matrix with high temperature. Testing at low frequencyhowever is time consuming for the high cycle fatigue test. Theeffect of loading frequency on heat generation has been investi-gated by measuring the surface temperature at the central heightof the sample during fatigue experiment using laser temperaturegun (non-contact infrared digital thermometer). The test was con-ducted under room temperature at a frequency of 2, 3, 4 and 8 Hz.
Fig. 10 plotted the variation of surface temperature with theincrease of cycles at different frequencies. It can be seen that thesurface temperature rises at the early stage of the fatigue testand stabilises after approximately 10,000 cycles. This is due tothe surface smoothness of the specimen after 10,000 cycles asshown in Fig. 5 and the generation of micro-cracking that minimisefriction between particles, resulting in a constant heat generation.The maximum increase of temperature recorded for 2, 3, 4 and8 Hz frequencies are 6.8, 7.1, 6.2 and 7.9⁰C, respectively, whichindicates that the temperature can rise with the increase of fre-quency but its variation is not significant (1 ⁰C) from 2 Hz to8 Hz. According to ISO 13003 standard [25], the frequency shouldbe selected in such a way that ensure a self-heating of the speci-men remain below 10 ⁰C during the test. The rise of temperaturewas obtained below 10 ⁰C for all frequencies that indicates the
GFRP sample can be tested at a frequency of 8 Hz without havinginfluence of dynamic amplification because of internal friction.This finding can reduce the testing time by 50% compare to the tra-ditional concept of testing at 4 Hz. The dissipation of energy duringfatigue cycles produced heat that raised the temperature in thespecimen and made the matrix soften that affecting the fibre–ma-trix interface and providing a slight decrease in the stiffness. It isworth noting that the findings are based on GFRP sample havinglow thermal conductivity, which is different from the metal wherethe heat can transfer quickly from one particle to another.
5.4. Failure theory
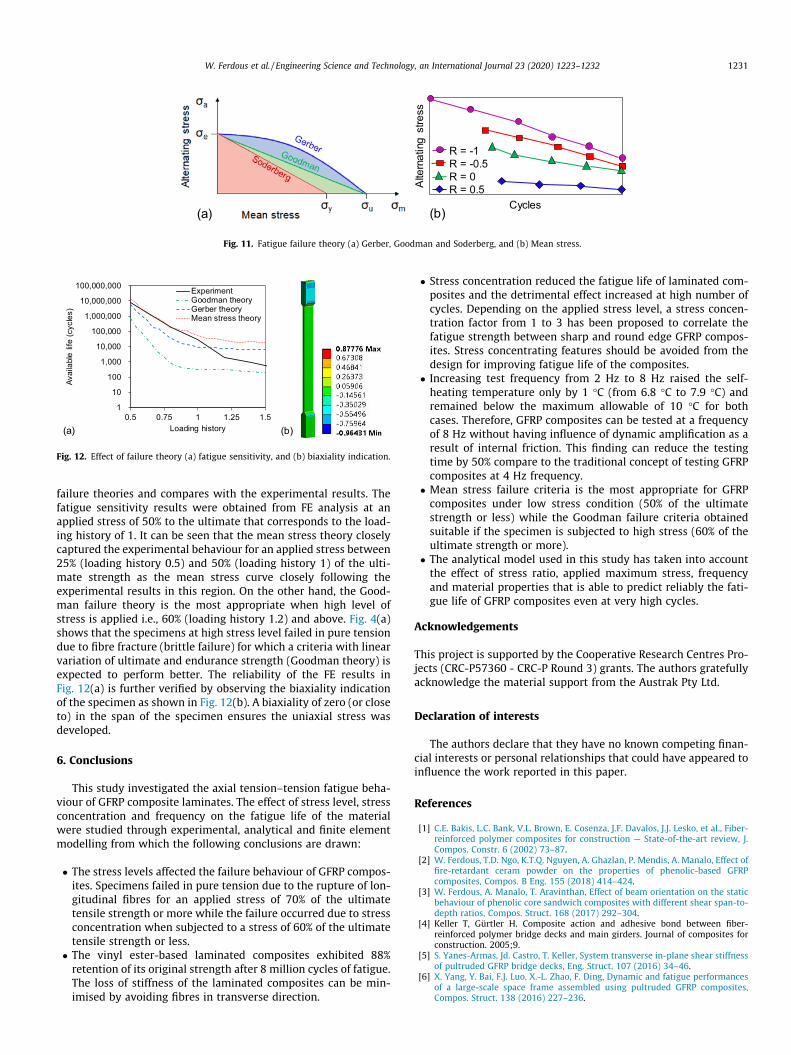
Failure theory is used to predict whether the stress at a criticalpoint in an element of the specimen would result in failure. Thecommon fatigue failure theories are Soderberg (Eq. (13)), Goodman(Eq. (14)), Gerber (Eq. (15)) and mean stress [18]. According toGoodman theory (Fig. 11a), a material is considered safe as longas the stress falls below the straight line that extends from theendurance limit (re) on alternating stress (ra) axis to the ultimatetensile strength (ru) on mean stress (rm) axis. The Gerber theory(Fig. 11a) differs from the Goodman theory in that the failure lineis parabolic that passes through the endurance limit and the ulti-mate tensile stress, hence less conservative (Fig. 11a). The Soder-berg theory (Fig. 11a) is based on the yield strength (ry) of thematerial and more conservative than the previous two theories.The mean stress failure line is illustrated in Fig. 11(b) for differentloading types. Mean stress theory is particularly important whenstress-cycle (S-N) curve is defined with different stress ratios(i.e., R-values). The finite element software accounts for the meanstress by linear interpolation between the curves for a different R-value. The question now arises which failure theory is the mostappropriate for GFRP material?
SoderbergEq:ra
reþ rm
ry¼ 1 ð13Þ
GoodmanEq:ra
reþ rm
ru¼ 1 ð14Þ
GerberEq:ra
reþ rm
ru
� �2
¼ 1 ð15Þ
As mentioned, the Soderberg failure criteria is based on theyield strength of the material, hence, this theory is not appropriatefor a material like GFRP where there is no yield point. To under-stand the most appropriate failure theory for GFRP material,Fig. 12(a) plotted the fatigue sensitivity response using different
(a)
Alte
rnat
ing
stre
ss
Cycles
R = -1R = -0.5R = 0R = 0.5
(b)
Fig. 11. Fatigue failure theory (a) Gerber, Goodman and Soderberg, and (b) Mean stress.
(b)
1
10
100
1,000
10,000
100,000
1,000,000
10,000,000
100,000,000
0.5 0.75 1 1.25 1.5
Avai
labl
e lif
e (c
ycle
s)
Loading history
ExperimentGoodman theoryGerber theoryMean stress theory
(a)
Fig. 12. Effect of failure theory (a) fatigue sensitivity, and (b) biaxiality indication.
W. Ferdous et al. / Engineering Science and Technology, an International Journal 23 (2020) 1223–1232 1231
failure theories and compares with the experimental results. Thefatigue sensitivity results were obtained from FE analysis at anapplied stress of 50% to the ultimate that corresponds to the load-ing history of 1. It can be seen that the mean stress theory closelycaptured the experimental behaviour for an applied stress between25% (loading history 0.5) and 50% (loading history 1) of the ulti-mate strength as the mean stress curve closely following theexperimental results in this region. On the other hand, the Good-man failure theory is the most appropriate when high level ofstress is applied i.e., 60% (loading history 1.2) and above. Fig. 4(a)shows that the specimens at high stress level failed in pure tensiondue to fibre fracture (brittle failure) for which a criteria with linearvariation of ultimate and endurance strength (Goodman theory) isexpected to perform better. The reliability of the FE results inFig. 12(a) is further verified by observing the biaxiality indicationof the specimen as shown in Fig. 12(b). A biaxiality of zero (or closeto) in the span of the specimen ensures the uniaxial stress wasdeveloped.
6. Conclusions
This study investigated the axial tension–tension fatigue beha-viour of GFRP composite laminates. The effect of stress level, stressconcentration and frequency on the fatigue life of the materialwere studied through experimental, analytical and finite elementmodelling from which the following conclusions are drawn:
� The stress levels affected the failure behaviour of GFRP compos-ites. Specimens failed in pure tension due to the rupture of lon-gitudinal fibres for an applied stress of 70% of the ultimatetensile strength or more while the failure occurred due to stressconcentration when subjected to a stress of 60% of the ultimatetensile strength or less.
� The vinyl ester-based laminated composites exhibited 88%retention of its original strength after 8 million cycles of fatigue.The loss of stiffness of the laminated composites can be min-imised by avoiding fibres in transverse direction.
� Stress concentration reduced the fatigue life of laminated com-posites and the detrimental effect increased at high number ofcycles. Depending on the applied stress level, a stress concen-tration factor from 1 to 3 has been proposed to correlate thefatigue strength between sharp and round edge GFRP compos-ites. Stress concentrating features should be avoided from thedesign for improving fatigue life of the composites.
� Increasing test frequency from 2 Hz to 8 Hz raised the self-heating temperature only by 1 �C (from 6.8 �C to 7.9 �C) andremained below the maximum allowable of 10 �C for bothcases. Therefore, GFRP composites can be tested at a frequencyof 8 Hz without having influence of dynamic amplification as aresult of internal friction. This finding can reduce the testingtime by 50% compare to the traditional concept of testing GFRPcomposites at 4 Hz frequency.
� Mean stress failure criteria is the most appropriate for GFRPcomposites under low stress condition (50% of the ultimatestrength or less) while the Goodman failure criteria obtainedsuitable if the specimen is subjected to high stress (60% of theultimate strength or more).
� The analytical model used in this study has taken into accountthe effect of stress ratio, applied maximum stress, frequencyand material properties that is able to predict reliably the fati-gue life of GFRP composites even at very high cycles.
Acknowledgements
This project is supported by the Cooperative Research Centres Pro-jects (CRC-P57360 - CRC-P Round 3) grants. The authors gratefullyacknowledge the material support from the Austrak Pty Ltd.
Declaration of interests
The authors declare that they have no known competing finan-cial interests or personal relationships that could have appeared toinfluence the work reported in this paper.
References
[1] C.E. Bakis, L.C. Bank, V.L. Brown, E. Cosenza, J.F. Davalos, J.J. Lesko, et al., Fiber-reinforced polymer composites for construction — State-of-the-art review, J.Compos. Constr. 6 (2002) 73–87.
[2] W. Ferdous, T.D. Ngo, K.T.Q. Nguyen, A. Ghazlan, P. Mendis, A. Manalo, Effect offire-retardant ceram powder on the properties of phenolic-based GFRPcomposites, Compos. B Eng. 155 (2018) 414–424.
[3] W. Ferdous, A. Manalo, T. Aravinthan, Effect of beam orientation on the staticbehaviour of phenolic core sandwich composites with different shear span-to-depth ratios, Compos. Struct. 168 (2017) 292–304.
[4] Keller T, Gürtler H. Composite action and adhesive bond between fiber-reinforced polymer bridge decks and main girders. Journal of composites forconstruction. 2005;9.
[5] S. Yanes-Armas, Jd. Castro, T. Keller, System transverse in-plane shear stiffnessof pultruded GFRP bridge decks, Eng. Struct. 107 (2016) 34–46.
[6] X. Yang, Y. Bai, F.J. Luo, X.-L. Zhao, F. Ding, Dynamic and fatigue performancesof a large-scale space frame assembled using pultruded GFRP composites,Compos. Struct. 138 (2016) 227–236.

1232 W. Ferdous et al. / Engineering Science and Technology, an International Journal 23 (2020) 1223–1232
[7] W. Ferdous, Y. Bai, A.D. Almutairi, S. Satasivam, J. Jeske, Modular assembly ofwater-retaining walls using GFRP hollow profiles: Components and connectionperformance, Compos. Struct. 194 (2018) 1–11.
[8] W. Ferdous, A. Manalo, G. Van Erp, T. Aravinthan, K. Ghabraie, Evaluation of aninnovative composite railway sleeper for a narrow-gauge track under staticload, J. Compos. Constr. 22 (2018) 1–13.
[9] G. Koller, FFU synthetic sleeper – Projects in Europe, Constr. Build. Mater. 92(2015) 43–50.
[10] W. Ferdous, A. Manalo, T. Aravinthan, A. Fam, Flexural and shear behaviour oflayered sandwich beams, Constr. Build. Mater. 173 (2018) 429–442.
[11] H. Fang, Y. Bai, W. Liu, Y. Qi, J. Wang, Connections and structural applicationsof fibre reinforced polymer composites for civil infrastructure in aggressiveenvironments, Compos. B Eng. 164 (2019) 129–143.
[12] W. Ferdous, Effect of beam-column joint stiffness on the design of beams, in: S.T. Smith (Ed.), 23rd Australasian Conference on the Mechanics of Structuresand Materials (ACMSM23), Southern Cross University, Byron Bay, Australia,2014, pp. 701–706.
[13] M. Quaresimin, L. Susmel, R. Talreja, Fatigue behaviour and life assessment ofcomposite laminates under multiaxial loadings, Int. J. Fatigue 32 (2010) 2–16.
[14] A. Manalo, T. Aravinthan, A. Fam, B. Benmokrane, State-of-the-art review onFRP sandwich systems for lightweight civil infrastructure, J. Compos. Constr.21 (2016) 1–16.
[15] T. Tanimoto, S. Amijima, Progressive nature of fatigue damage of glass fiberreinforced plastics, J. Compos. Mater. 9 (1975) 380–390.
[16] S. Liang, P.-B. Gning, L. Guillaumat, Properties evolution of flax/epoxycomposites under fatigue loading, Int. J. Fatigue 63 (2014) 36–45.
[17] A. Hosoi, N. Sato, Y. Kusumoto, K. Fujiwara, H. Kawada, High-cycle fatiguecharacteristics of quasi-isotropic CFRP laminates over 10^8 cycles (Initiationand propagation of delamination considering interaction with transversecracks), Int. J. Fatigue 32 (2010) 29–36.
[18] Y. Gao, Fatigue stress concentration sensitivity and stress ratio effect of a40CrNi2Si2MoVA steel, Mater. Lett. 186 (2017) 235–238.
[19] P.R. Vieira, E.M.L. Carvalho, J.D. Vieira, R.D. Filho, Experimental fatiguebehavior of pultruded glass fibre reinforced polymer composite materials,Compos. B Eng. 146 (2018) 69–75.
[20] Z. Wu, X. Wang, K. Iwashita, T. Sasaki, Y. Hamaguchi, Tensile fatigue behaviourof FRP and hybrid FRP sheets, Compos. B Eng. 41 (2010) 396–402.
[21] M.M. Shokrieh, L.B. Lessard, Progressive fatigue damage modeling ofcomposite materials, Part I: Modeling, J. Compos. Mater. 34 (2000) 1056–1080.
[22] M.M. Shokrieh, L.B. Lessard, Progressive fatigue damage modeling ofcomposite materials, Part II: Material characterization and modelverification, J. Compos. Mater. 34 (2000) 1081–1116.
[23] ASTM-D2584. Standard test method for ignition loss of cured reinforced resins.West Conshohocken, PA: ASTM International; 2018.
[24] ASTM-D3039. Standard test method for tensile properties of polymer matrixcomposite materials. USA: ASTM International; 2017.
[25] ISO-13003. Fibre-reinforced plastics - Determination of fatigue properties undercyclic loading conditions. International Organization for Standardization; 2003.
[26] Wu C, Feng P, Bai Y. Comparative study on static and fatigue performances ofpultruded GFRP joints using ordinary and blind bolts. Journal of composites forconstruction. 2015;19.
[27] Y. Ochi, K. Masaki, T. Matsumura, T. Sekino, Effect of shot-peening treatment onhigh cycle fatigue property of ductile cast iron, Int. J. Fatigue 23 (2001) 441–448.
[28] ANSYS. Introduction to ANSYS Workbench. www.ansys.com; 2017. p. 1-11.[29] W. Ferdous, A.D. Almutairi, Y. Huang, Y. Bai, Short-term flexural behaviour of
concrete filled pultruded GFRP cellular and tubular sections with pin-eyeconnections for modular retaining wall construction, Compos. Struct. 206(2018) 1–10.
[30] W. Ferdous, A. Manalo, G. Van Erp, T. Aravinthan, S. Kaewunruen, A.Remennikov, Composite railway sleepers – Recent developments, challengesand future prospects, Compos. Struct. 134 (2015) 158–168.
[31] B. Denkena, C. Schmidt, K. Völtzer, T. Hocke, Thermographic online monitoringsystem for Automated Fiber Placement processes, Compos. B Eng. 97 (2016)239–243.
[32] T. Lisle, C. Bouvet, M.L. Pastor, P. Margueres, R.P. Corral, Damage analysis andfracture toughness evaluation in a thin woven composite laminate under statictension using infrared thermography, Compos. A Appl. Sci. Manuf. 53 (2013)75–87.
[33] W. Harizi, S. Chaki, G. Bourse, M. Ourak, Mechanical damage assessment ofGlass Fiber-Reinforced Polymer composites using passive infraredthermography, Compos. B Eng. 59 (2014) 74–79.
[34] D. Palumbo, R.D. Finis, P.G. Demelio, U. Galietti, A new rapid thermographicmethod to assess the fatigue limit in GFRP composites, Compos. B Eng. 103(2016) 60–67.
[35] B. Harris, A historical review of the fatigue behaviour of fibre-reinforcedplastics. Fatigue in Composites: Science and Technology of the FatigueResponse of Fibre-Reinforced Plastics, Woodhead Publishing, 2003.
[36] Sendeckyj GP. Chapter 10 - Life Prediction for Resin-Matrix CompositeMaterials. Composite Materials Series1991. p. 431-83.
[37] G. Caprino, A. D’Amore, Flexural fatigue behaviour of random continuous-fibre-reinforced thermoplastic composites, Compos. Sci. Technol. 58 (1998)957–965.
[38] R.W. Hertzberg, J.A. Manson, Fatigue of engineering plastics, Academic Press,1980.
[39] J. Huang, M.L. Pastor, C. Garnier, X.J. Gong, A new model for fatigue lifeprediction based on infrared thermography and degradation process for CFRPcomposite laminates, Int. J. Fatigue 120 (2019) 87–95.
[40] J. Degrieck, W.V. Paepegem, Fatigue damage modeling of fibre-reinforcedcomposite materials: Review, Appl. Mech. Rev. 54 (2001) 279–300.
[41] Y.-M. Jen, Y.-C. Wang, Stress concentration effect on the fatigue propertiesof carbon nanotube/epoxy composites, Compos. B Eng. 43 (2012) 1687–1694.
[42] A. Kahirdeh, M.M. Khonsari, Energy dissipation in the course of the fatiguedegradation: Mathematical derivation and experimental quantification, Int. J.Solids Struct. 77 (2015) 74–85.
[43] C.M. Manjunatha, A.C. Taylor, A.J. Kinloch, S. Sprenger, The tensile fatiguebehavior of a GFRP composite with rubber particle modified epoxy matrix, J.Reinf. Plast. Compos. 29 (2010) 2170–2183.
[44] M. Bourchak, A. Algarni, A. Khan, U. Khashaba, Effect of SWCNTs and grapheneon the fatigue behavior of antisymmetric GFRP laminate, Compos. Sci. Technol.167 (2018) 164–173.
[45] L. Maragoni, P.A. Carraro, M. Peron, M. Quaresimin, Fatigue behaviour of glass/epoxy laminates in the presence of voids, Int. J. Fatigue 95 (2017) 18–28.
[46] T. Keller, T. Tirelli, A. Zhou, Tensile fatigue performance of pultruded glass fiberreinforced polymer profiles, Compos. Struct. 68 (2005) 235–245.