Behaviour of beam to column GFRP bolted connections Behaviour of beam-to-column GFRP bolted...
13
1 Behaviour of beam-to-column GFRP bolted connections: Experimental and numerical investigations Miguel Enrech Casaleiro Mascarenhas Proença Civil Engineering Department, Instituto Superior Técnico, Universidade Técnica de Lisboa, Portugal Abstract: This paper presents an experimental and numerical study about the behaviour of beam-to-column bolted connections between glass fibre reinforced polymer (GFRP) tubular profiles. Small-scale coupon tests were first performed in order to determine the mechanical properties of the GFRP material. The study of the connections comprised full-scale tests on connection specimens with the following typologies: W1 – one bolt per web; F2 – two bolts per flange; F2S – two bolts per flange with increased edge-distance; and F4 – four bolts per flange. Three monotonic tests were performed per connection typology in order to determine their stiffness, strength and damage progression properties. Three cyclic tests were performed per connection type in order to assess the dynamic behaviour of the joints, in what respects to their stiffness, strength and energy absorption properties. These cyclic tests provided a better understanding of the damage progression trough the cycles, and the way it influences both strength and stiffness properties of the joint. Numerical modelling of the connections was performed to simulate the monotonic tests. The numerical models provided a good agreement with the experimental data in terms of initial stiffness, initial non-linear behaviour and maximum strength. No significant differences in strength were found between connections F2 and F4. Despite having more bolts, this result is explained by the smaller edge distance of the bolts in F4 typology and the fact that the first row of bolts withstands higher forces than the second. Connection type F2S afforded the best performance, being able to endure large deformations whilst maintaining structural integrity and resisting to higher loads. As expected, connection type W1 revealed the worst performance. Keywords: Beam-to-column connections; GFRP pultruded profiles; Moment rotation characteristics; Damage progression; Numerical modelling. 1. Introduction Fibre Reinforced Polymer (FRP) composites are materials made of oriented fibres embedded in a polymeric matrix. Since there is an unlimited number of fibre-matrix combinations, FRPs may present a wide range of mechanical properties (Hollaway 2010). FRPs are known for their orthotropic behaviour, presenting higher resistance and stiffness in the fibre alignment direction. Glass fibre reinforced polymers (GFRP) are the most widely used FRP materials due to the reduced cost of the glass fibres. GFRPs have been recently used as a structural material in civil engineering due to: (i) high resistance-to- weight ratio; (ii) high resistance to environmental aggressions (chemical or physical); and (iii) reduced life- cycle cost, owing to their excellent durability in the most varied environments. The brittle nature of GFRP, owing to the behaviour of the glass fibres, is a relevant factor to take into account when structural applications are considered. Pultruded profiles are the most frequent shape of structural elements used in GFRP structures. Pultrusion manufacturing process allows delivering high-quality constant-cross-section FRP profiles with high resistance properties on the pultrusion direction, while presenting reduced production costs (Bank 2006). One of the main disadvantages of these profiles lies in the lower resistance along the transverse directions (to the pultrusion one). Therefore, there are a number of failure modes typical of these materials, such as: (i) shear-out failure; and (ii) shear failure of the web-flange junction. For structures made of GFRP composite materials, unlike other materials, deformability is usually the main conditioning factor for design. As such, a very important design aspect for a structure built with GFRP profiles lies in the behaviour of the connections, especially of beam-to- column connections (Hizam 2013). Initially, due to the lack of studies about the behaviour and performance of bolted connections between GFRP members, they were assumed to be nominally pinned (Mottram 1996). Therefore, the only design factor addressed was the shear resistance of the connections. However, considering connections as pinned sometimes proved to be very penalizing to the deformations of the beams, leading to very inefficient and uncompetitive
-
Upload
trinhthuan -
Category
Documents
-
view
229 -
download
1
Transcript of Behaviour of beam to column GFRP bolted connections Behaviour of beam-to-column GFRP bolted...

1
Behaviour of beam-to-column GFRP bolted connections:
Experimental and numerical investigations
Miguel Enrech Casaleiro Mascarenhas Proença
Civil Engineering Department, Instituto Superior Técnico, Universidade Técnica de Lisboa, Portugal
Abstract: This paper presents an experimental and numerical study about the behaviour of beam-to-column bolted
connections between glass fibre reinforced polymer (GFRP) tubular profiles. Small-scale coupon tests were first performed in
order to determine the mechanical properties of the GFRP material. The study of the connections comprised full-scale tests on
connection specimens with the following typologies: W1 – one bolt per web; F2 – two bolts per flange; F2S – two bolts per
flange with increased edge-distance; and F4 – four bolts per flange. Three monotonic tests were performed per connection
typology in order to determine their stiffness, strength and damage progression properties. Three cyclic tests were performed
per connection type in order to assess the dynamic behaviour of the joints, in what respects to their stiffness, strength and
energy absorption properties. These cyclic tests provided a better understanding of the damage progression trough the cycles,
and the way it influences both strength and stiffness properties of the joint. Numerical modelling of the connections was
performed to simulate the monotonic tests. The numerical models provided a good agreement with the experimental data in
terms of initial stiffness, initial non-linear behaviour and maximum strength. No significant differences in strength were found
between connections F2 and F4. Despite having more bolts, this result is explained by the smaller edge distance of the bolts in
F4 typology and the fact that the first row of bolts withstands higher forces than the second. Connection type F2S afforded the
best performance, being able to endure large deformations whilst maintaining structural integrity and resisting to higher
loads. As expected, connection type W1 revealed the worst performance.
Keywords: Beam-to-column connections; GFRP pultruded profiles; Moment rotation characteristics; Damage progression;
Numerical modelling.
1. Introduction
Fibre Reinforced Polymer (FRP) composites are
materials made of oriented fibres embedded in a
polymeric matrix. Since there is an unlimited number of
fibre-matrix combinations, FRPs may present a wide range
of mechanical properties (Hollaway 2010). FRPs are
known for their orthotropic behaviour, presenting higher
resistance and stiffness in the fibre alignment direction.
Glass fibre reinforced polymers (GFRP) are the most
widely used FRP materials due to the reduced cost of the
glass fibres. GFRPs have been recently used as a structural
material in civil engineering due to: (i) high resistance-to-
weight ratio; (ii) high resistance to environmental
aggressions (chemical or physical); and (iii) reduced life-
cycle cost, owing to their excellent durability in the most
varied environments. The brittle nature of GFRP, owing to
the behaviour of the glass fibres, is a relevant factor to take
into account when structural applications are considered.
Pultruded profiles are the most frequent shape of
structural elements used in GFRP structures. Pultrusion
manufacturing process allows delivering high-quality
constant-cross-section FRP profiles with high resistance
properties on the pultrusion direction, while presenting
reduced production costs (Bank 2006). One of the main
disadvantages of these profiles lies in the lower resistance
along the transverse directions (to the pultrusion one).
Therefore, there are a number of failure modes typical of
these materials, such as: (i) shear-out failure; and
(ii) shear failure of the web-flange junction.
For structures made of GFRP composite materials,
unlike other materials, deformability is usually the main
conditioning factor for design. As such, a very important
design aspect for a structure built with GFRP profiles lies
in the behaviour of the connections, especially of beam-to-
column connections (Hizam 2013).
Initially, due to the lack of studies about the behaviour
and performance of bolted connections between GFRP
members, they were assumed to be nominally pinned
(Mottram 1996). Therefore, the only design factor
addressed was the shear resistance of the connections.
However, considering connections as pinned sometimes
proved to be very penalizing to the deformations of the
beams, leading to very inefficient and uncompetitive

2
designs (Bank and Mosallam 1990). Indeed, larger cross-
sections frequently had to be selected in order to meet the
deflection limits imposed by Service Limit States (SLS)
requirements, which proved to be the most limitative
factor at the design stage. The former drawback led to the
need to develop connections considered as semi-rigid to
reduce deformations on the structures, and ultimately to
reduce cross-section’s dimensions. Studies were
developed in order to create stiffer and stronger
connectors.
The present study was motivated by the need to
develop and understand the behaviour of a number of
beam-to-column connections between GFRP pultruded
profiles with tubular cross-section. Prior understanding of
the material behaviour was crucial to ensure a good design
approach. Small-scale tests were performed on the GFRP
material, in order to evaluate its mechanical properties
when subjected to different load conditions. These studies
were also important to simulate the material behaviour
with the numerical model tests.
The behaviour of four different types of bolted
connections was analysed through experimental tests and
numerical modelling. Real scale models of the connections
were subjected to two different types of tests:
(i) monotonic tests; and (ii) cyclic tests. The connections
were analysed regarding their stiffness, strength and
absorbed energy, in order to determine the connection
type with the best performance, to be included as the
beam-to-column connection in the CLICKHOUSE project.
This project, which aims at designing a modular house for
emergency scenarios, was performed by ALTO Perfis
Pultrudidos, Lda in partnership with Instituto Superior
Técnico (IST) and Universidade do Minho (UM).
2. Previous studies (experimental &
numerical)
Regarding joint design technology, initial studies
(Rosner and Rizkalla 1995; Hassan et al. 1997a,b; Abd-al-
Naby and Hollaway, 1993a,b; Erki 1995; Turvey and Wang
2003) were conducted in simple in-plane connections
(single-lap or double-lap), subjected to tension only. These
studies, reviewed by Mottram and Turvey (2003), were
performed in order to determine the influence of the
geometrical properties of the connections such as:
(i) number of bolts; (ii) arrangement of the bolts; (iii) plate
thickness-to-hole diameter ratio; (iv) bolt edge distance or
pitch distance; (v) fibre orientation; and (vi) lateral
constraint.
Bank (2006) presented a compilation of the
recommended geometric parameters for lap joint
connections. These studies enabled the identification of a
number of different failure modes typical of this material
and the way they are related to the geometrical
parameters. The failure modes identified, presented in
Figure 1, were: (i) net section failure; (ii) cleavage failure;
(iii) bearing failure; and (iv) shear-out failure.
Figure 1 – GFRP bolted connection failure modes (Bank 2006)
This extensive study allowed the determination of the
most preferable failure mode, which was the bearing one.
This failure mode had been studied extensively by Xiao
and Ishikawa (2005a,b). This was the only mode
presenting some sort of ductility, with damage
accumulation, since all other failure modes were fragile.
The study of the behaviour of GFRP bolted connections
started in 1990s. The connections used were based on a
database of connection types typical of steel structures.
Bank and colleagues (Bank and Mosallam 1990; Bank
et al. 1994; Bank et al. 1996) developed and studied
different connection types, deemed to achieve higher
stiffness and resistance levels. These connections were
made of parts of increasing complexity and resistance.
Some of these parts were excessively complex to be
manufactured at an industrial level, therefore discarding
their use in real life applications. Higher resistances were
achieved by minor connection redesign, provided that the
conditioning failure modes and load paths were fully
understood.
Later on, Smith et al. (1998) studied connections of
closed cross-sections such as the RHS profile studied
herein, and these were compared to I-shape profile
connections. Closed cross-sections generally present an
improved mechanical behaviour when compared to
I-shape profiles in terms of local buckling characteristics,
torsional rigidity and weak axis strength and stiffness. The
same authors came to the conclusion that the use of closed
cross-sections and the corresponding connections ensured
an improved structural system when compared to open

3
flange profiles and connections. In an attempt to analyse
stiffer and stronger connections, different types of
connections were studied, ranging from simple web-
cleated or flange cleated connections (using thicker cleats
or seats), to joints attempting to achieve a monolithic
behaviour (boxed connections), with the connection parts
being applied to the outside of the profiles (e.g., gusset
plates). In this case, using a boxed section with simple
connection detailing increased stiffness by 25% and
strength by 280%, when compared to regular I-shape
profiles beam-to-column connections.
The former observations were used to compile a list of
design features to serve as guidelines for structural
designers (Smith et al. 1999). The recommendations,
adopted in the development of the connections studied
herein, are the following: (i) avoid bolts in tension trough
the thickness of the section, that might lead to a failure by
punching of the bolt through the FRP material;
(ii) mobilize the entire cross-section of the column, easily
achieved when using bolts crossing the entire section;
(iii) provide reinforcement for both load path and bolt
restraint; and (iv) approximate the design of the joint to a
monolithic connection element, thus reducing the number
of parts, the complexity, and above all, reducing stress
concentrations.
Mottram and co-workers (Mottram and Zheng 1999a,b;
Qureshi and Mottram 2012, 2013, 2014, 2015) focused on
the existent connections, portrayed in manuals from
pultrusion manufacturing companies, and extensively
studied their behaviour. These connections were designed
as pinned. Mottram determined that using regular web-
cleated connections revealed damage on the parts for
service situations, which is deemed unacceptable in
structural terms. Their solution was to use different
materials for the web-cleats (Qureshi and Mottram 2013,
2014), namely steel cleats, or GFRP cleats with a fibre-
architecture designed for the path loads sustained.
The motivation for the present study is the lack of
knowledge on the behaviour of connections of GFRP
tubular profiles, namely those with connection parts inside
the profiles. There was a need to develop the connection
inside the profile due to architectural and panel fitting
reasons.
3. Experimental study
3.1 Experimental program
Coupon tests were performed in order to determine the
mechanical properties of the GFRP material used. The
small-scale specimens were extracted from a RHS
120×120×10,0 profile, identical to the one used in the real-
scale connection testing. The coupon tests comprised:
(i) compressive tests, on both longitudinal and transverse
directions (relative to pultrusion axis); (ii) tensile tests,
only on the longitudinal direction; (iii) flexural tests;
(iv) interlaminar shear tests; and (v) in-plane shear tests,
off-axis tensile tests and Iosipescu shear tests. These tests
aimed at determining the resistance properties of the
material, as well as of the corresponding elastic constants.
Monotonic and cyclic tests were further performed to
evaluate the performance of different connection
typologies. Three monotonic tests were performed per
type of connection, aiming to determine the maximum
resistance of the connections, as well as the corresponding
stiffness. Three cyclic tests were performed per connection
type, in order to characterize their stiffness, resistance,
and energy absorbed per cycle.
3.2 Material characterization tests
Small-scale coupon tests were performed in order to
determine the mechanical properties of the material used.
The results of the performed tests are presented in
Table 1, where the subscripts c, t, f, ci, xy, 10°, u, T and L
stand for compressive tests, tensile tests, flexural tests,
interlaminar shear tests, in-plane shear tests, off-axis
tensile tests, ultimate value, on the transverse or
longitudinal directions, respectively. The material
presented orthotropic behaviour, presenting higher
stiffness and strength in the longitudinal axis of the profile.
On the other hand, the shear resistance values measured
were higher in the transverse direction. For that direction,
the rupture failure plane crosses glass fibres, thus
increasing shear resistance.
Three different methods were used to determine the
shear resistance of the material, and all these methods
retrieved different values for that variable, most likely due
to different test setups and stress state in the material.
It is worth mentioning that the values obtained by
Iosipescu shear tests were considered abnormally high. On
the other hand, the values obtained from the off-axis
tensile test method were considered an underestimate of
the shear resistance of the material, as the latter values
were abnormally low. The interlaminar shear test led to a
more common value of shear resistance for this type of
material. The elasticity modulus derived from the coupon
compressive tests was considered as an underestimate of
the actual modulus, with the tensile tests providing more
reliable results.
The test specimens after testing are presented in

4
Figure 2. The material characterization tests comprised
a total of 60 specimens tested to determine the properties
of the GFRP material used in the profiles studied. Some
(limited) specimens’ tests were not considered due to
invalid failure modes or loss of data during the test.
Table 1 – Average mechanical properties of the material tested
Test Method Property Average Unit
ASTM - D695
σcu,L 435.06 [MPa]
Ec,L 21.20 [GPa]
σcu,T 88.94 [MPa]
Ec,T 4.84 [GPa]
EN ISO 527
σtu,L 293.83 [MPa]
Et,L 32.70 [GPa]
ν 0.324 (-)
EN ISO 14125 σfu,L 415.09 [MPa]
Ef,L 24.93 [GPa]
ASTM - D2344 Fci 30.56 [MPa]
ASTM -D5379 τxy,L 41.37 [MPa]
τxy,T 58.71 [MPa]
Hodgekinson / EN ISO 527
τ10° 19.56 [MPa]
Gxy 7.33 [GPa]
Figure 2 – Material characterization test specimens
3.3 Specimen properties, setup, instrumentation and
procedure of the connection tests
The monotonic and cyclic tests were performed in the
laboratory Laboratório de Estruturas e Resistência de
Materiais (LERM) of IST. The test setup, which comprised a
closed steel frame, is presented in Figure 3.
The load was applied to the GFRP beam at 600 mm
from the column’s facing flange by a pinned loading fixture
connected to a hydraulic jack with maximum load
capacities of 600 kN and 250 kN in compression and
tension, respectively, with a stroke of 250 mm. The load
cell (capacity 300 kN) was also attached to that loading
system, in series with the hydraulic jack and the set of
pins. The boundary conditions of the column (fixed
rotations and translations) were ensured by a set of steel
blocks. The out-of-plane displacements of the beam free
end was restricted by two aluminium bars.
Ten displacement transducers and two rotation
transducers were used in the full-scale experimental tests
in order to determine: (i) the vertical displacements of the
beam; (ii) the rotation of the beam; and (iii) the rotation of
the column. Both rotations were measured by a set of
displacement transducers and a rotation transducer. The
results presented in this study in terms of rotations were
computed based on the values of the rotation transducer
and the results presented in force vs. displacement curves
were retrieved from the load cell and the displacement in
the load application point. Data was recorded at a rate of
5 Hz using HBM, model QuantumX data logger.
Monotonic tests were performed until the collapse of
the connection or the end of the hydraulic jack’s stroke
(± 125 mm), whichever occurred first. Cyclic tests were
conducted based on a history of displacements,
determined from the monotonic tests.
Figure 3 – Test Setup
Figure 4 to Figure 8 present the geometrical details of
the steel plate connection parts (column connection
element and beam connection element). Both steel
connection elements were introduced inside the closed
cross-section of the profile. Connection type W1 was
expected to behave as a pinned joint, with one bolt per
web of the beam and minimal moment transfer.
Connections type F2, F2S, F4 had bolts on the flanges of
the beam, exhibiting a stiffer behaviour and a larger
moment transfer capacity. These three types of
connections were designed to evaluate the influence of
bolt number and location on the connection behaviour.

5
Figure 4 – Details for column steel plate connection part (mm)
Figure 5 – Details for beam steel plate connection part (Type W1, mm)
Figure 6 – Details for beam steel plate connection part (Type F2, mm)
Figure 7 – Details for beam steel plate connection part (Type F2S, mm)
Figure 8 – Details for beam steel plate connection part (Type F2, mm)
3.4 Monotonic tests
The monotonic tests aimed at determining the strength
and elastic properties of the connections, as well as the
associated failure modes and how these influenced the
connection behaviour.
Figure 9 presents four representative load vs.
displacement (measured under the applied load) curves
from the connection typologies tested (one specimen per
connection type). All connections seemed to exhibit an
initial linear behaviour, following minor initial
adjustments, for vertical displacements ranging from 10 to
30 mm, until the occurrence of first damage. First damage
was identified by the occurrence of loud audible crack
noises, or by the appearance of visual damage to any of the
elements. After first damage all connections presented a
gradual reduction of stiffness.
Table 2 presents the average values of the relevant
computed properties of the connections (rigidity and
resistance). Connection W1 presented the lowest stiffness
and resistance average values; connection F2S achieved
the highest average resistance; and connection F4
exhibited the highest stiffness. The values of stiffness and
resistance varied slightly for the connections with bolts on
the flanges of the beams, whereas connection W1
exhibited much lower values.
Figure 9 – Comparison of representative force vs. displacement curves for the different connection types
Table 2 – Average and standard deviation values for the stiffness and strength properties for each connection type
Connection type
Kδ Fu
[kN/m] [kN]
W1 139.1±19.84 4.08±0.88 F2 202.8±50.36 6.46±0.18 F2S 182.6±20.01 8.73±0.75 F4 245.3±40.34 7.03±0.87
0
1
2
3
4
5
6
7
8
9
10
0 30 60 90 120 150
Lo
ad
(k
N)
Displacement (mm)
F2-M2F4-M4F2S-M3W1-M5

6
Connection type W1 revealed the worst performance,
having the lowest initial stiffness and the lowest load
capacity. The first failure in this connection occurred in the
lower web-flange junction of the beam (shear), causing a
reduction in stiffness followed by the shear-out failure of
the bolts of the beam. Once the shear-out failure took
place, the specimen lost its ability to sustain subsequent
loads, leading to collapse. The fact of not having any bolts
on the flanges prevented the connection from transferring
significant amounts of bending moments, thus behaving
similarly to a nominally pinned joint. Figure 10 illustrates
the failure mode for connection type W1.
Connection types F2 and F4 exhibited very similar
maximum resistant loads, close to twice the value for
connection W1. The increase in the number of bolts did
not improve the connection strength. The main cause for
this inefficiency lies in the smaller edge distance of the
first row of bolts (F4) and the fact that that same row of
bolts endured a larger force than the others, due to
non-uniform load distribution for connections with more
than one row of bolts. The main failure mode for these
connections, which led to collapse, was the shear-out
failure, as illustrated in Figure 11. On the other hand, the
web-flange junction shear failure, identified prior to shear-
out, seemed to affect only the stiffness of the connections
and did not impair the resistance capacity.
Figure 10 – Collapse of connection type W1
Figure 11 – Shear-out of the bolts (connection F4)
Connection type F2S, derived from F2, but with a
larger bolt edge distance, revealed the best performance.
Not only did it sustain higher loads for larger
deformations, but, in some of the tested specimens, it did
not actually achieve maximum resistance load for the
imposed maximum displacement of 125 mm (stroke of the
jack). This performance was achieved by delaying the
occurrence of the shear-out phenomenon (which did not
happen in F2S specimens for monotonic tests) with a
larger edge distance of the bolts. This led to the occurrence
of additional failure modes such as: (i) bearing of the GFRP
near the bolts; (ii) vertical cracking of the column; and
(iii) weld failure of the steel plate connection part of the
beam. The higher load sustained by this type of connection
shifted the damage from the beam to the column. The
presented case of multiple failures for high level loads
reveals that all connection elements endured maximum
stress prior to failure and were taken to their maximum
capacity. This led to consider F2S to be the most efficient
connection design.
3.5 Cyclic tests
Cyclic tests were performed in accordance with ECCS’
cyclic load test recommendations (ECCS 1986). The same
displacement history was considered for all connections so
that the results could be more easily compared. ECCS’s
displacement history is based in the yielding displacement,
in this case considered as the average value of the yielding
displacements for all the tested connections specimens.
The yielding displacement (ey) used was equal to 19 mm
and the displacement history is presented in Table 3. ECCS
recommends analysing the yielding point on both loading
directions (downwards and upwards). Since the
connections were symmetrical, this was not considered.
For the cycles of displacements larger than the yielding
displacement, the ECCS recommendations propose three
repetitions, whereas in this study only two repetitions
were performed.
Table 3 – Displacements history
Cycle Applied displacements
[-] [mm]
1st [-ey/4; +ey/4] [-4.75; +4.75]
2nd [-ey/2; +ey/2] [-9.5; +9.5]
3rd [-3ey/4; +3ey/4] [-14.25; +14.25]
4th [-ey; +ey] [-19; +19]
5th [-2ey; +2ey] [-38; +38]
6th [-2ey; +2ey] [-38; +38]
7th [-4ey; +4ey] [-76; +76]
8th [-4ey; +4ey] [-76; +76]
9th [-6ey; +6ey] [-114; +114]
10th [-6ey; +6ey] [-114; +114]
The parameters considered in the cyclic tests set forth
by ECCS and used in this study were: (i) rigidity ratio;

7
(ii) strength ratio; and (iii) absorbed energy. All these
parameters are described in ECCS standard [14] and are
computed from the moment vs. rotation curves. The
rigidity ratio relates the unloading stiffness of one cycle
with the initial linear stiffness. The strength ratio relates
the strength of the yielding point to the ultimate strength
of the cycle. The absorbed energy of the cycle is computed
through the product of the moment by the rotation and is
evaluated in kN.m.rad, measuring the area under the
moment-rotation curve.
Figure 12 presents, as an example, the moment (M) vs.
rotation (θ) curve for the test of connection specimen F2S-
C1, the test type chosen to be used in the Clickhouse
project. In addition, a representative curve of the
monotonic test behaviour of the same joint type is also
plotted (specimen F2S-M3). It can be seen that the
hysteretic curves of the connection presented similar
behaviour in both loading directions (downwards and
upwards), as expected from their symmetrical geometry.
The maximum load points presented in Figure 12 were
achieved at very similar load level and rotation, therefore
confirming the symmetrical behaviour. The monotonic test
results generally feature the envelope of the cyclic test
results.
Figure 12 –Moment vs. rotation curve for connection type F2S
Table 4 presents the maximum moment values and the
corresponding rotations for all specimens tested; the
average values and the corresponding standard deviations
are also presented.
Connection W1 was the one that exhibited the most
asymmetrical behaviour in terms of the loading direction
(downwards, as positive values, and upwards, as negative
values). The first damage, experienced in the downwards
loading phase, impaired the connection, rendering the
following phase to present lesser resistance. This
phenomenon was only observed in W1 type connections.
The maximum moment experienced in cyclic testing is in
agreement with the resistances presented in the
monotonic tests, for all connections tested.
Table 4 – Maximum load points for the cyclic tests
Type Specimen/ value
Mmax Mmin θmax θmin
(kN.m) (kN.m) (rad) (rad)
W1
W1-C1 2.9 -1.4 0.061 -0.076
W1-C2 2.4 -2.3 0.064 -0.013
W1-C3 3.6 -2.9 0.065 -0.067
Average 3.0 -2.2 0.063 -0.092
StDev 0.6 0.7 0.002 0.035
F2
F2-C1 4.0 -4.6 0.118 -0.101 F2-C2 4.2 -5.2 0.102 -0.131
F2-C3 5.2 -3.6 0.120 -0.128
Average 4.5 -4.4 0.113 -0.120
StDev 0.6 0.8 0.010 0.017
F2S
F2S-C1 5.4 -6.3 0.118 -0.101
F2S-C2 6.4 -6.5 0.102 -0.131
F2S-C3 5.2 -6.7 0.120 -0.128
Average 5.7 -6.5 0.113 -0.12
StDev 0.7 0.2 0.010 0.017
F4
F4-C1 4.8 -4.3 0.101 -0.063
F4-C2 5.4 -6.4 0.121 -0.119
F4-C3 4 -4.8 0.077 -0.12
Average 4.7 -5.2 0.099 -0.101
StDev 0.7 1.1 0.022 0.033
Figure 13 presents the rigidity ratios for all
connections tested. The results of one representative
specimen per connection type are illustrated. The rigidity
ratios exhibit an overall downward trend with the increase
of the cycles, for all connection types. For cycles of
displacement smaller than the yield displacement, the
connections display a rigidity ratio above the unity, due to
the overcoming of the initial friction forces.
Figure 13 – Rigidity ratio
Figure 14 presents the resistance ratios for one
specimen per connection type. The resistance ratio
displays an initial increasing tendency until the yielding
displacement cycle. Subsequently, the cycles for the same
displacements show a decrease in resistance ratio with the
repetition of the cycles.

8
Figure 14 – Resistance ratio
Figure 15 presents the absorbed energy ratio of one
specimen per connection type. The absorbed energy ratio
is only calculated for cycles of displacement larger than the
yielding displacement. For the repetition of cycles of the
same displacement, the absorbed energy ratio shows a
significant decrease in value. The tendency presented in
this ratio is similar to all types of connections.
Figure 15 – Absorbed energy ratio
Figure 16 presents the total absorbed energies for the
different connections tested; one specimen per connection
type was chosen to best represent the behaviour of that
typology.
Connection type F2S shows a higher absorbed energy
per cycle than the others, leading to a total absorbed
energy for specimen F2S-C1 of over 3 000 kN.m.rad,
representing an almost 50% increase compared to both
connection types F2 and F4. Type W1 was shown to
present the lowest absorbed energy, with only half of the
values of connection types F2 and F4. Despite the increase
in the number of bolts, connection type F4 presents a very
similar behaviour to connection F2, due to the uneven
force distribution per bolt and to the smaller edge distance
of the first row of bolts in connection type F4
Figure 16 – Total absorbed energy per cycle
The failure modes presented in cyclic testing were very
similar to the ones presented in the monotonic testing,
with the exception of connection type F2S that displayed
an additional failure mode on the cyclic tests of shear-out
on the region of the bolts.
In agreement with the results of the monotonic tests,
connection type F2S revealed the best performance. As
mentioned, this connection was later included in the
Clickhouse project. Connection W1 presented the worst
performance; connections F2 and F4 displayed very
similar behaviour, despite the difference in the number of
bolts.
4. Numerical analysis
4.1 Model description
The numerical analysis presented herein was
developed using the finite element software Abaqus V6.13
(Simulia 2013).
4.1.1 Geometrical properties, mesh and
discretization
Due to the existing symmetry and to reduce
computation time, the numerical models only considered
half of the connection.
Table 5 presents the finite element mesh specifications
for the model of connection F2S, which possessed a total of
9 467 elements, 11 721 nodes and 48 429 degrees of
freedom.

9
Table 5 – Properties of the finite element mesh (model F2S)
Part Element
Type Number of elements
Number of Nodes
Beam (GFRP) frame B311 10 11
shell SC8R2 608 1328
Column (GFRP)
frame B311 6 8
shell SC8R2 1153 2474
Connection Part (S235)
(beam) C3D8R3 1069 2268
(column) C3D8R3 1564 3330
Bolts
M8_10 C3D104 413 796
M10_10 C3D45 510 167
M10_20 C3D45 582 184 1 B31 – 2 node frame element; 2 SC8R – Continuum Shell with 8 nodes (5 integration points in thickness); 3 C3D8R – 8 node cubic solid element with reduced integration (1 integration point); 4 C3D10 – 10 node solid element (solid) 10-node tetrahedral (4 integration points); 5 C3D4 – solid element (solid) 4-node tetrahedral (1 integration point);
The GFRP parts (beam and column) were modelled
with two types of finite elements: (i) continuum shell with
8 nodes and reduced integration (SC8R), for the stress
concentration zones, near the connection; and (ii) frame
elements (B31) for the remaining zones. The steel
elements (plates and bolts) were modelled with tri-
dimensional solid elements of various types.
The bolt holes were modelled with no clearance (tight
fit) in order to represent the initial contact between
elements, and reduce convergence problems.
The finite element mesh, illustrated in Figure 17, was
generated to evaluate phenomena such as bearing of the
material, shear-out failure on the region of the bolts and
shear failure at the web-flange junction. Smaller elements
were considered in stress concentration zones. The
maximum dimension of the elements was 10 mm, equal to
the GFRP profile wall thickness.
Figure 17 – Finite elements mesh (F2S)
4.1.2 Mechanical properties (stiffness, resistance
and damage progression)
The steel materials were modelled with elasto-plastic
behaviour with linear hardening and an elasticity modulus
of 210 GPa and a Poisson coefficient of 0.3. The orthotropc
properties of GFRP are presented in Table 6.
Table 6 – Elastic constants for GFRP
E11 [GPa] E22 [GPa] υ12 [-] G12 [GPa]
32.7 4.8 0.3 3.2
The Hashin failure criteria was considered, comprising
a total of six failure modes: (i) matrix tension; (ii) matrix
compression; (ii) fibre tension; (iv) fibre compression; (v)
longitudinal shear; and (vi) transverse shear. The
considered strengths of the above mentioned failure
modes are presented in Table 7.
Table 7 – Material failure mode strengths
f1,T [MPa] f1,C [MPa] f2,T = f2,C [MPa] f1,S [MPa] f2,S [MPa]
326 435 89 41 59
The degradation model applied defines damage
progression through a set of fracture energies associated
with four different types of damage: (i) matrix tensile
damage; (ii) matrix compressive damage; (iii) fibre tensile
damage; and (iv) fibre compressive damage.
The fracture energies presented in Table 8 were based
on the work of Nunes et al. (2015), referring to a similar
type of GFRP material. The fracture energies were
estimated by curve fitting procedures based on the area of
the force-displacement curves for the four simple types of
failure.
Table 8 – Fracture energies for the different types of damage
Gf,Ft [MPa] Gf,Fc [MPa] Gf,Mt [MPa] Gf,Mc [MPa]
2.38 5.28 0.65 1.08
4.1.3 Loading and support conditions
Figure 18 presents the considered loading and support
conditions. The loading was applied by imposing a
displacement in the load application point, at a distance of
60 cm from the column facing flange.
The displacements and rotations were restrained at the
column’s extremities, to simulate the restraint induced by
the steel supports. Symmetrical boundary conditions were
also considered.
10
Figure 18 – Loading and boundary conditions
4.1.4 Contact and friction formulation
A frictionless hard contact was considered in all steel-to-
GFRP contact surfaces. A surface-to-surface, small-sliding
discretization method was chosen. A tie restraint was
applied to all steel-to-steel contact screw areas since the
tangential component of the contact force was significant.
4.1.5 Analysis type
A both physically and geometrically non-linear analysis
with damage progression was performed. As mentioned,
the Hashin failure criterion was used in conjunction with a
continuous degradation model based on fracture energies
of the GFRP material, for the different failure modes. To
analyse damage progression, the parameters DAMAGESHR
(damage occurring by shear, used to identify the shear-out
phenomena) and DAMAGEFT (damage occurring by fibre
tension, to identify the transverse tensile failure of web-
flange junction) were considered in ABAQUS software.
4.2 Results
Figure 19 to Figure 22, present the comparison between
the experimental and numerical results regarding the
monotonic tests on the different connection typologies.
Figure 19 – Force vs. displacement curves, experimental and numerical comparison - connection W1
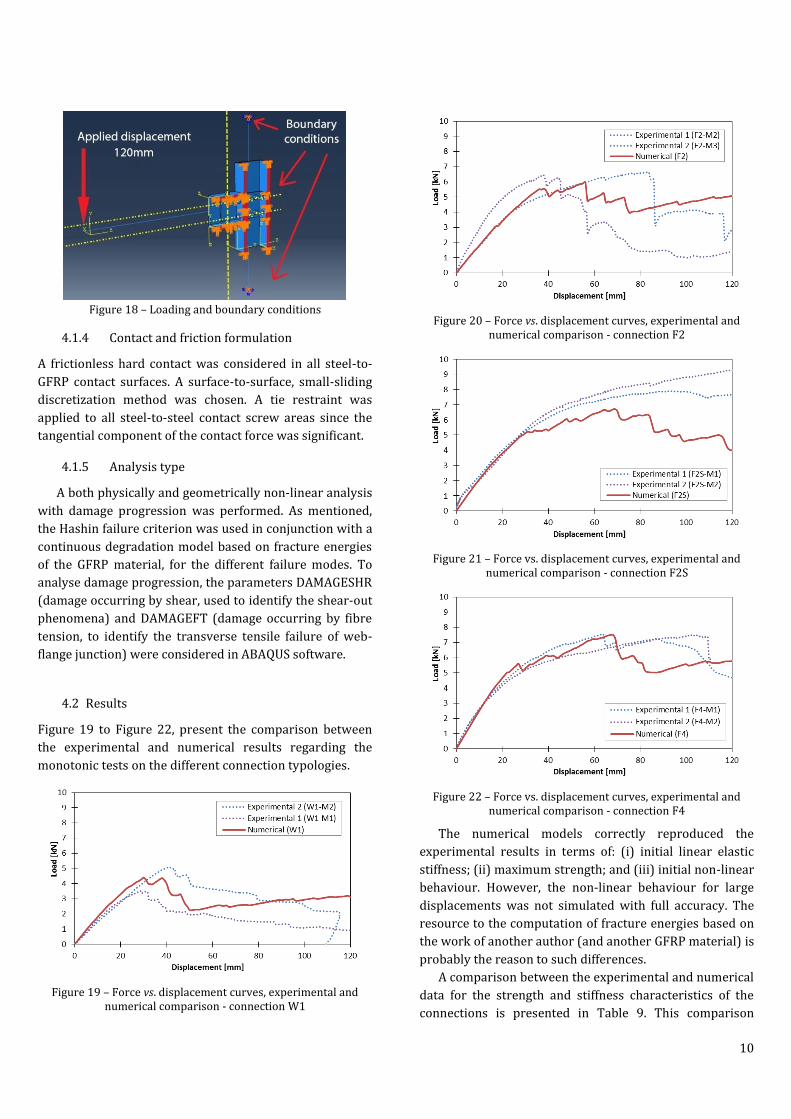
Figure 20 – Force vs. displacement curves, experimental and numerical comparison - connection F2
Figure 21 – Force vs. displacement curves, experimental and numerical comparison - connection F2S
Figure 22 – Force vs. displacement curves, experimental and numerical comparison - connection F4
The numerical models correctly reproduced the
experimental results in terms of: (i) initial linear elastic
stiffness; (ii) maximum strength; and (iii) initial non-linear
behaviour. However, the non-linear behaviour for large
displacements was not simulated with full accuracy. The
resource to the computation of fracture energies based on
the work of another author (and another GFRP material) is
probably the reason to such differences.
A comparison between the experimental and numerical
data for the strength and stiffness characteristics of the
connections is presented in Table 9. This comparison

11
Table 9 – Experimental vs. numerical comparison of stiffness and resistance properties
Connection type
Experimental Numerical
Kδ Fu Kδ Δ Fu Δ
[kN/m] [kN] [kN/m] [%] [kN] [%]
W1 139.12 4.08 179 28.70% 4.4 7.80%
F2 202.82 6.46 210.7 3.90% 6.34 -1.90%
F2S 182.57 8.73 206 12.80% 6.71 -23.10%
F4 245.27 7.03 249.6 -1.80% 7.51 6.80%
comprises the relative difference between the values
obtained from the experimental tests and the
corresponding numerical results. The relative difference of
the above-mentioned parameters ranges from as low as
1,80%, for F4 strength, to as high as 28,70%, for the
stiffness of connection W1.
In light of such good overall agreement with the
experimental data, the use of numerical models such as
those developed in this study is recommended as an
alternative to relatively expensive and long lasting full-
scale experimental campaigns.
5. Conclusions and future developments
5.1 Conclusions
Among the various connection types investigated in the
present experimental and numerical study, connection F2S
was shown to offer the best performance, being able to
resist to higher levels of load for large deformations.
Hence, this connection type was chosen to integrate the
Clickhouse project for the beam-to-column connections of
the modular house. The main drawback of this connection
type is the fact it did not present the highest stiffness. In
the case of GFRP pultruded structures, deformability is
usually the main conditioning factor for their design.
Therefore, maximizing the stiffness connection is
considered of the upmost importance in order to reduce
deformations, and achieve higher efficiency of the overall
structural system.
The experimental study allowed drawing the following
conclusions on the geometrical parameters of the joint:
(i) The edge distance of the bolt is a very
conditioning parameter in terms of joint
resistance, being related with the shear-out failure
phenomenon that can lead to premature failure of
the joint. Hence, an improvement in resistance
from connection F2 to connection F2S was
observed with the increase of the edge distance of
the bolts (from 40 mm to 55 mm).
(ii) The increase in the number of bolts, from
connection F2 to F4, did not provide any
improvement in terms of strength, due to uneven
force distribution between bolt rows (indeed, the
first row, closer to the joint, carries a larger
fraction of the load) and a smaller edge distance of
the first row. On the other hand, the connection F4
presented the highest stiffness due to a more
efficient restraint (more bolts) of the flanges of
the beam in the connection zone.
(iii) As expected, connection type W1 revealed the
worst performance, with the smallest stiffness,
resistance and absorbed energy values. This
connection presented minor initial free rotations,
rendering it impractical for real life applications.
Despite the fact that GFRP material generally presents
brittle failure, with respect to the design of the joint, it is
possible to achieve pseudo-ductility. Connection types F2,
F2S and F4 were able to resist to relatively high levels of
load, at large deformations, attesting that assumption. The
failure mode of the web-flange junction is not considered
brittle, since specimens were able to resist further loading
after the occurrence of this failure mode. The failure of the
web-flange junction only affected the stiffness of the
connection, presenting a gradual decrease in value. On the
other hand, the shear-out failure is considered to be of
brittle nature, since the specimen experienced an
instantaneous load reduction when this failure occurred
As previously stated, in light of the very good
agreement between the numerical and experimental
results, the use of finite element numerical models to
study different connections types between GFRP
pultruded members seems to be viable, as an alternative to
more expensive and time consuming experimental
campaigns.
5.2 Future developments
The extensive study presented herein justify suggesting
the following developments:

12
(i) Further study of the behaviour of the joints in the
plane transverse to the loading plane. This study
is fundamental to describe the connection
behaviour when subjected to horizontal flexure.
This will allow to integrate/consider the
connection in a 3D model.
(ii) Further study of the behaviour of the joints tested
when exhibiting continuity of the joint. The
influence of the continuity and that of the
transversal beams was not addressed in this
campaign, and can be of great influence to the
joint behaviour.
(iii) Parametric studies about the influence of the edge
distance parameters in joints of one row of two
bolts (like the joints studied herein, F2 and F2S) to
determine the optimum value in terms of
connection resistance.
(iv) Full scale frame dynamic tests to determine the
damping coefficient of this types of structures.
Only then, it is possible to model correctly a 3D
structure and evaluate its behaviour to a dynamic
load, such as a seismic load.
(v) Further studies on the fracture energy of the GFRP
material in order to better develop the finite
elements models of the joints. A more accurate
determination of the fracture energies could lead
to models in closer agreement with the
experimental data in the non-linear phase of the
connections’ response.
6. References
[1] Abd-El-Naby, S. F. M., & Hollaway, L. (1993). The
experimental behaviour of bolted joints in pultruded
glass/polyester material. Part 1: Single-bolt joints.
Composites, 24(7), 531-538.
[2] Abd-El-Naby, S. F. M., & Hollaway, L. (1993). The
experimental behaviour of bolted joints in pultruded
glass/polyester material. Part 2: Two-bolt joints.
Composites, 24(7), 539-546.
[3] ASTM D 695-02 (2006). Standard Test Method for
Compressive Properties of Rigid Plastics, West
Conshohocken, PA.
[4] ASTM D 2344/D 2344M-00 (2006). Standard Test for Short-
Beam Strength of polymer Matrix Composite Materials and
their Laminates, West Conshohocken, PA.
[5] Bank, L. C. (2006). Composites for construction: structural
design with FRP materials. John Wiley & Sons.
[6] Bank, L. C., Mossallam, A. S. and H. E. Gonsior. 1990. “Beam-
to-Column Connections for Pultruded FRP Structures,” in
Serviceability and Durability of Construction Materials, B.
Suprenant, ed., Proceedings of the ASCE First Materials
Engineering Congress, Denver, CO, August 13-15, pp. 804-
813.
[7] Bank, L. C., Mosallam, A. S., & McCoy, G. T. (1994). Design
and performance of connections for pultruded frame
structures. Journal of Reinforced Plastics and Composites,
13(3), 199-212.
[8] Bank, L. C., Yin, J., Moore, L., Evans, D. J., & Allison, R. W.
(1996). Experimental and numerical evaluation of beam-to-
column connections for pultruded structures. Journal of
Reinforced Plastics and Composites , 15(10), 1052-1067.
[9] CEN, EN ISO 14125 (1998). Fibre-reinforced plastic
composites – Determination of flexural properties, Brussels.
[10] CEN, ISO 527-1 (1997). Determination of tensile properties
– Part 1: General principles, Brussels.
[11] CEN, ISO 527-4 (1997). Determination of tensile properties
– Part 4: Test conditions for isotropic and orthotropic fibre-
reinforced plastic composites, Brussels.
[12] CEN, ISO 527-5 (1997). Determination of tensile properties
– Part 5: Test conditions for unidirectional fibre reinforced
plastic composites, Brussels.
[13] Hodkinsson, D. M. (2000). Mechanical Testing of Advanced
Fibre Composites, CRC Press, Boca Raton.
[14] ECCS (1986). Recommended Testing Procedures for
Assessing the Behaviour of Structural Steel Elements under
Cyclic Loads. European Convention for Constructional
Steelwork.
[15] Erki, M. A. (1995). Bolted glass-fibre-reinforced plastic
joints. Canadian journal of civil engineering, 22(4), 736-744.
[16] Hassan, N. K., Mohamedien, M. A., & Rizkalla, S. H. (1997).
Rational model for multibolted connections for GFRP
members. Journal of Composites for Construction, 1(2), 71-
78.
[17] Hassan, N. K., Mohamedien, M. A., & Rizkalla, S. H. (1997).
Multibolted joints for GFRP structural members. Journal of
Composites for Construction, 1(1), 3-9.
[18] Hashin, Z. (1980). Failure criteria for unidirectional fiber
composites. Journal of Applied Mechanics, 47(2), 329-334.
[19] Hizam, R. M., Manalo, A. C., & Karunasena, W. (2013, June). A
review of FRP composite truss systems and its connections.
In Proceedings of the 22nd Australasian Conference on the
Mechanics of Structures and Materials (ACMSM 22) (pp. 85-
90). Taylor & Francis (CRC Press).
[20] Hollaway, L. C. (2010). A review of the present and future
utilisation of FRP composites in the civil infrastructure with
reference to their important in-service properties.
Construction and Building Materials, 24(12), 2419-2445.
[21] Mottram, J. T., & Turvey, G. J. (2003). Physical test data for
the appraisal of design procedures for bolted joints in
pultruded FRP structural shapes and systems. Progress in
Structural Engineering and Materials, 5(4), 195-222.
[22] Mottram, J. T., & Zheng, Y. (1996). State-of-the-art review on
the design of beam-to-column connections for pultruded
frames. Composite Structures, 35(4), 387-401.
[23] Mottram, J. T., & Zheng, Y. (1999). Further tests on beam-to-
column connections for pultruded frames: Web-cleated.
Journal of Composites for Construction, 3(1), 3-11.

13
[24] Mottram, J. T., & Zheng, Y. (1999). Further tests of beam-to-
column connections for pultruded frames: flange-cleated.
Journal of Composites for Construction, 3(3), 108-116.
[25] Nunes, F., Silvestre, N., & Correia, J. R. (2015). Structural
behaviour of hybrid FRP pultruded columns. part 2:
numerical study. Composite Structures, in preparation.
[26] Rosner, C. N., & Rizkalla, S. H. (1995). Bolted connections for
fiber-reinforced composite structural members:
experimental program. Journal of Materials in Civil
Engineering, 7(4), 223-231.
[27] Rosner, C. N., & Rizkalla, S. H. (1995). Bolted connections for
fiber-reinforced composite structural members: Analytical
model and design recommendations. Journal of Materials in
Civil Engineering, 7(4), 232-238.
[28] Simulia (2013). Abaqus 6.13 User’s Manuals.
[29] Smith, S. J., Parsons, I. D., & Hjelmstad, K. D. (1998). An
experimental study of the behavior of connections for
pultruded GFRP I-beams and rectangular tubes. Composite
Structures, 42(3), 281-290.
[30] Smith, S. J., Parsons, I. D., & Hjelmstad, K. D. (1999).
Experimental comparisons of connections for GFRP
pultruded frames. Journal of Composites for Construction,
3(1), 20-26.
[31] Turvey, G. J., & Wang, P. (2003). Open-hole tension strength
of pultruded GRP plate. Proceedings of the ICE-Structures
and Buildings, 156(1), 93-101.


![First Evaluation on Structural Behavior of All FRP Bolted ... · PDF filebeam-column connection [4]. ... “Further tests on beam -to column connections for pultruded frames: Web –](https://static.fdocuments.in/doc/165x107/5ab0a74f7f8b9a00728b5326/first-evaluation-on-structural-behavior-of-all-frp-bolted-connection-4-.jpg)