Test standards and procedures Seismic piezocone standards and procedures Seismic piezocone June 2006...
12
Av Érico Veríssimo, 901 / 302, 22621 ‐ 180 Rio de Janeiro, Brasil P +55 ‐ 21 ‐ 2486 3386, F +55 ‐ 21 ‐ 2491 8974 www.terratek.com.br , [email protected] Piezocone tests Test standards and procedures Seismic piezocone June 2006
Transcript of Test standards and procedures Seismic piezocone standards and procedures Seismic piezocone June 2006...
Av Ér i co Ver íss imo , 901 / 302, 22621 ‐180 Rio de Janei ro , Bras i l P +55 ‐21 ‐2486 3386, F +55 ‐21 ‐2491 8974
www.ter ratek .com.br , ter ratek@terratek .com.br
Piezocone tests
Test standards and procedures
Seismic piezocone
June 2006
2
SCOPE
This document describes equipment and procedures for carrying out site investigation through CPTU and seismic CPT. It also discusses de advantages of seismic CPT in relation to cross-hole tests.
CPT STANDARDS
Terratek carries out piezocone tests according to the following standards:
1. ASTM D5778 (2000) Standard method for performing electronic friction cone and piezocone penetration testing of soils
2. ISSMFE Report TC 16 - International reference test procedures for cone penetration tests
3. ABNT NBR 12069 - Solo - ensaio de penetração de cone in situ (CPT);
EQUIPMENT AND PROCEDURES
Piezocone (CPTU)
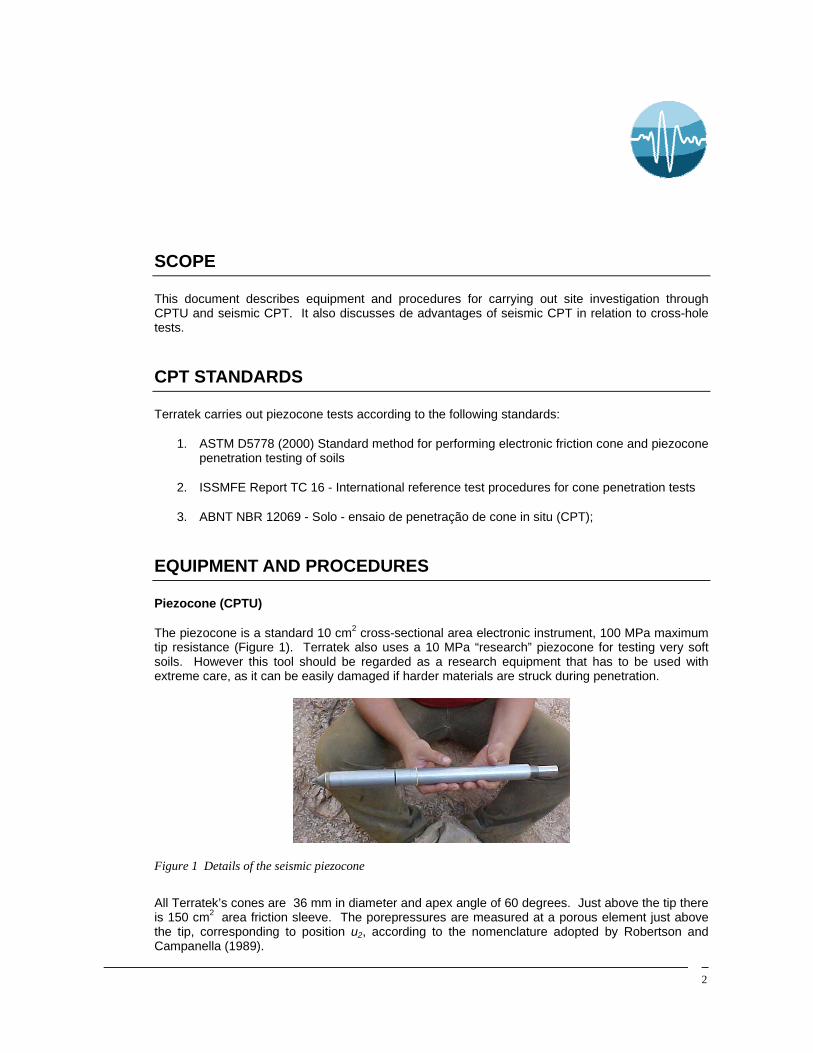
The piezocone is a standard 10 cm2 cross-sectional area electronic instrument, 100 MPa maximum tip resistance (Figure 1). Terratek also uses a 10 MPa “research” piezocone for testing very soft soils. However this tool should be regarded as a research equipment that has to be used with extreme care, as it can be easily damaged if harder materials are struck during penetration.
Figure 1 Details of the seismic piezocone
All Terratek’s cones are 36 mm in diameter and apex angle of 60 degrees. Just above the tip there is 150 cm2 area friction sleeve. The porepressures are measured at a porous element just above the tip, corresponding to position u2, according to the nomenclature adopted by Robertson and Campanella (1989).

3
Above the cone there is a geophone, capable of sensing seismic waves generated at the ground surface.
An electronic package carried by the cone conditions and amplifies all electrical signals and sends them through an electrical cable to the data acquisition system at the surface.
The tests are carried out from a site investigation truck (Figure 2) capable of applying 200 kN force on the steel rods.
Figure 2 Site investigation truck
The test is stopped if one of the following conditions is reached:
� Tip resistance limit of 100 MPa;
� Load capacity of the hydraulic system;
� Excessive inclination of the cone, which would lead to damaging the cone or rods.
Cone penetration is measured from the ground surface through a depth encoder driven by rod penetration.
The data acquisition system (Figure 3) is a PC based equipment with a 16 bit resolution. The software records, displays on the screen and saves in the hard disk the following measurements:
� Depth (m);
� Tip resistance (qc);
� Local unit friction (fs);
� Porepressure above the cone (u2);
� Cone inclination in degrees.
4
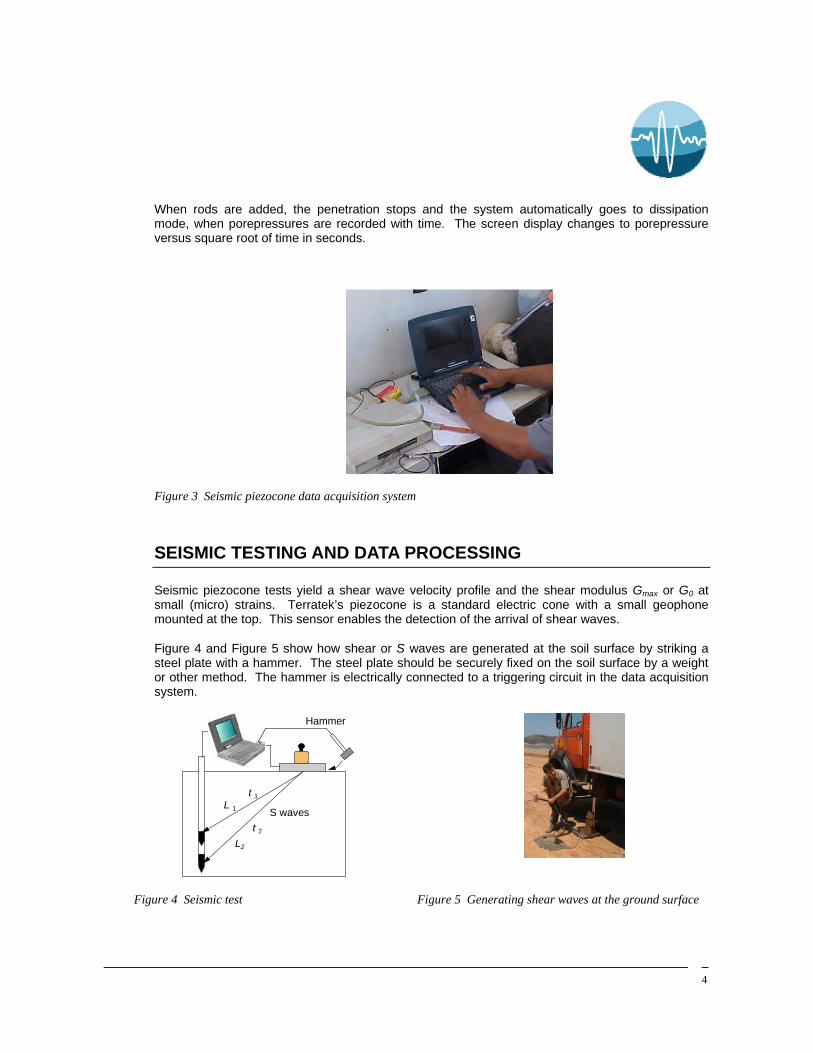
When rods are added, the penetration stops and the system automatically goes to dissipation mode, when porepressures are recorded with time. The screen display changes to porepressure versus square root of time in seconds.
Figure 3 Seismic piezocone data acquisition system
SEISMIC TESTING AND DATA PROCESSING
Seismic piezocone tests yield a shear wave velocity profile and the shear modulus Gmax or G0 at small (micro) strains. Terratek’s piezocone is a standard electric cone with a small geophone mounted at the top. This sensor enables the detection of the arrival of shear waves.
Figure 4 and Figure 5 show how shear or S waves are generated at the soil surface by striking a steel plate with a hammer. The steel plate should be securely fixed on the soil surface by a weight or other method. The hammer is electrically connected to a triggering circuit in the data acquisition system.
Hammer
L 1
t 1
L2
t 2
S waves
Figure 4 Seismic test Figure 5 Generating shear waves at the ground surface

5
The seismic test is normally carried out during cone penetration pauses to add new rod lengths. As the cone is at depth zi, the strike plate is hit by the hammer (Figure 5) and the triggering circuit starts the data acquisition. A signal versus time is obtained at each test depth zi and corresponds to the arrival time ti of the shear wave.
Terratek’s procedure is to acquire at least data from three strikes at each level to obtain a mean shear wave velocity profile (Vs).
The shear modulus Gmax
is then computed by:
2smax V
gG ⋅=
γ
where γ is the soil unit weight and g is the acceleration of gravity.
Small strain Gmax values can be corrected to the macro-strain domain, which corresponds to most geotechnical engineering applications by the use of a single laboratory test or theoretical degradation curves.
Terratek processes seismic data through its proprietary PC program Spas (Signal processing and analysis software) using digital signal analysis techniques in the frequency domain. Bucher et al (1999) describe the cross-correlation analysis employed in Spas.
Dissipation tests When penetration stops the system enters automatically in dissipation mode in which porepressures (u) are observed with elapsed time (t). The porepressures are plotted as a function of t . The graphical technique suggested by Robertson and Campanella (1989), yields a value for t50, which corresponds to the time for 50% consolidation.
The value of the coefficient of consolidation in the radial or horizontal direction ch was then calculated by Houlsby and Teh’s (1988) theory using the following equation:
50
5.02
tITr
c rh =
where:
T = time factor given by Houlsby and Teh’s (1988) theory;
r = piezocone radius;
Ir = stiffness index, equal to G divided by the undrained strength of clay (cu). This index was taken as 100.
6
t50 = time corresponding to 50% consolidation
A value of permeability was, then, estimated from ch taking into account soil modulus M from seismic tests.
CPT DATA ANALYSIS
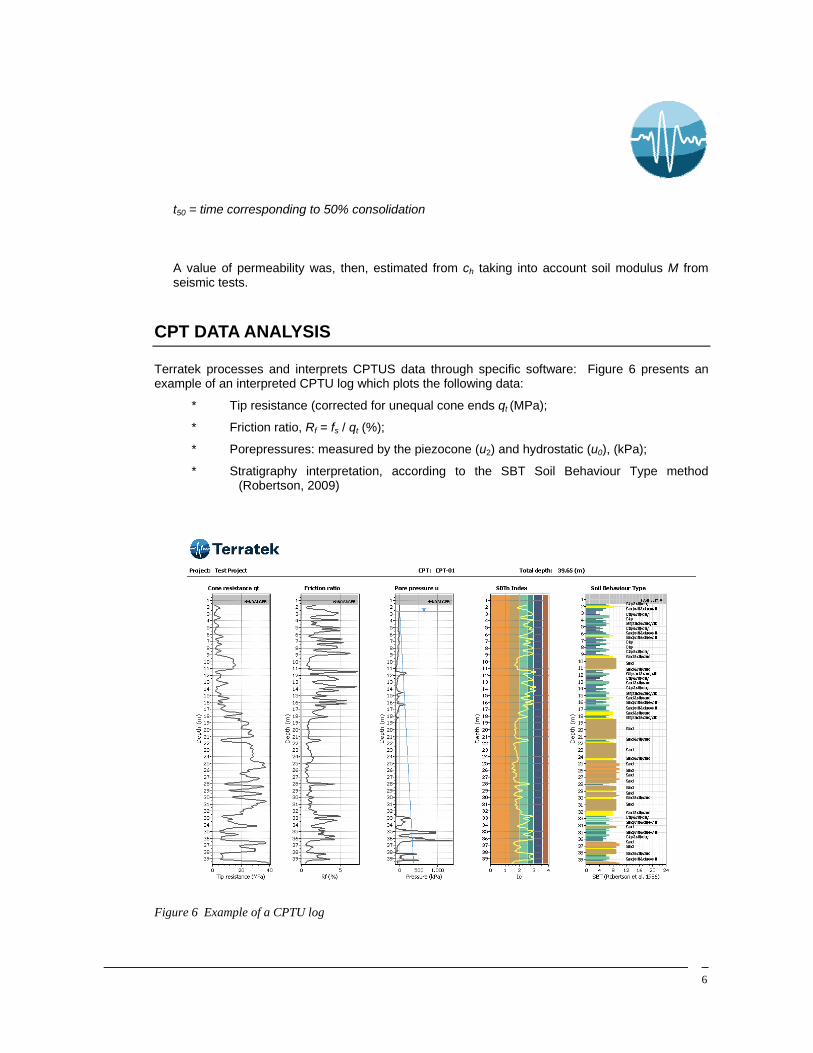
Terratek processes and interprets CPTUS data through specific software: Figure 6 presents an example of an interpreted CPTU log which plots the following data:
* Tip resistance (corrected for unequal cone ends qt (MPa);
* Friction ratio, Rf = fs / qt (%);
* Porepressures: measured by the piezocone (u2) and hydrostatic (u0), (kPa);
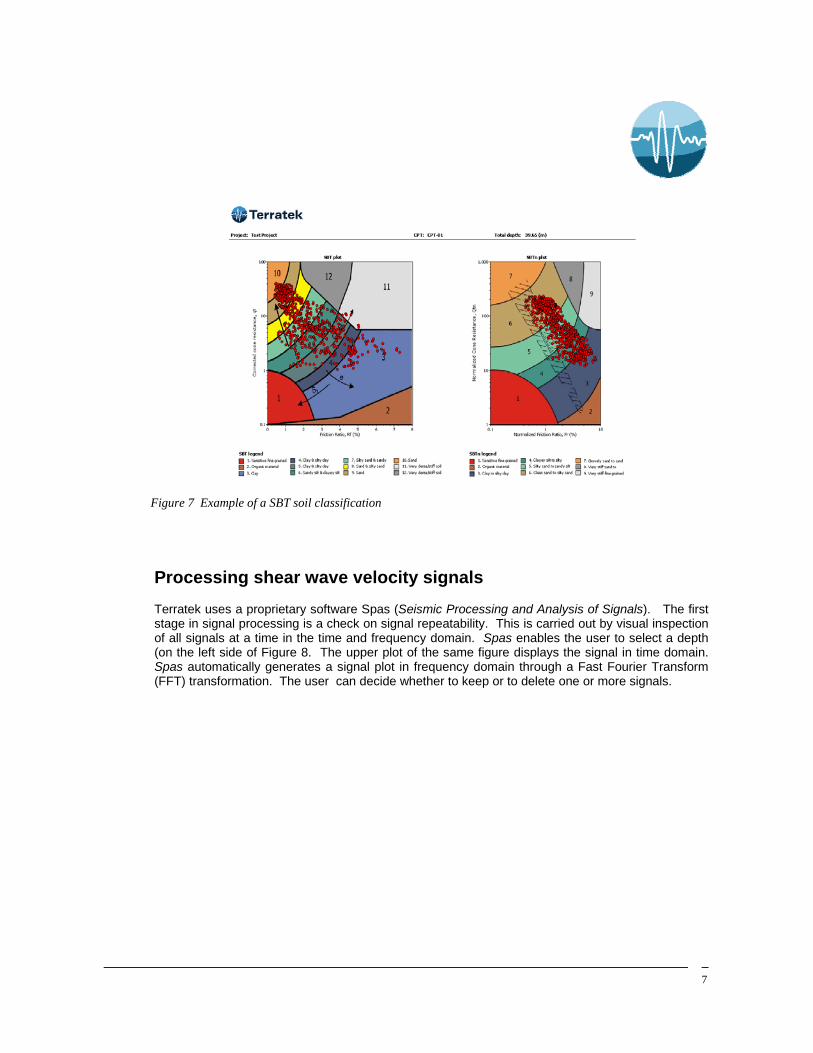
* Stratigraphy interpretation, according to the SBT Soil Behaviour Type method (Robertson, 2009)
Figure 6 Example of a CPTU log
7
Figure 7 Example of a SBT soil classification
Processing shear wave velocity signals Terratek uses a proprietary software Spas (Seismic Processing and Analysis of Signals). The first stage in signal processing is a check on signal repeatability. This is carried out by visual inspection of all signals at a time in the time and frequency domain. Spas enables the user to select a depth (on the left side of Figure 8. The upper plot of the same figure displays the signal in time domain. Spas automatically generates a signal plot in frequency domain through a Fast Fourier Transform (FFT) transformation. The user can decide whether to keep or to delete one or more signals.

8
Figure 8 Visual inspection of one single signal
Figure 9 Transit time analysis
9
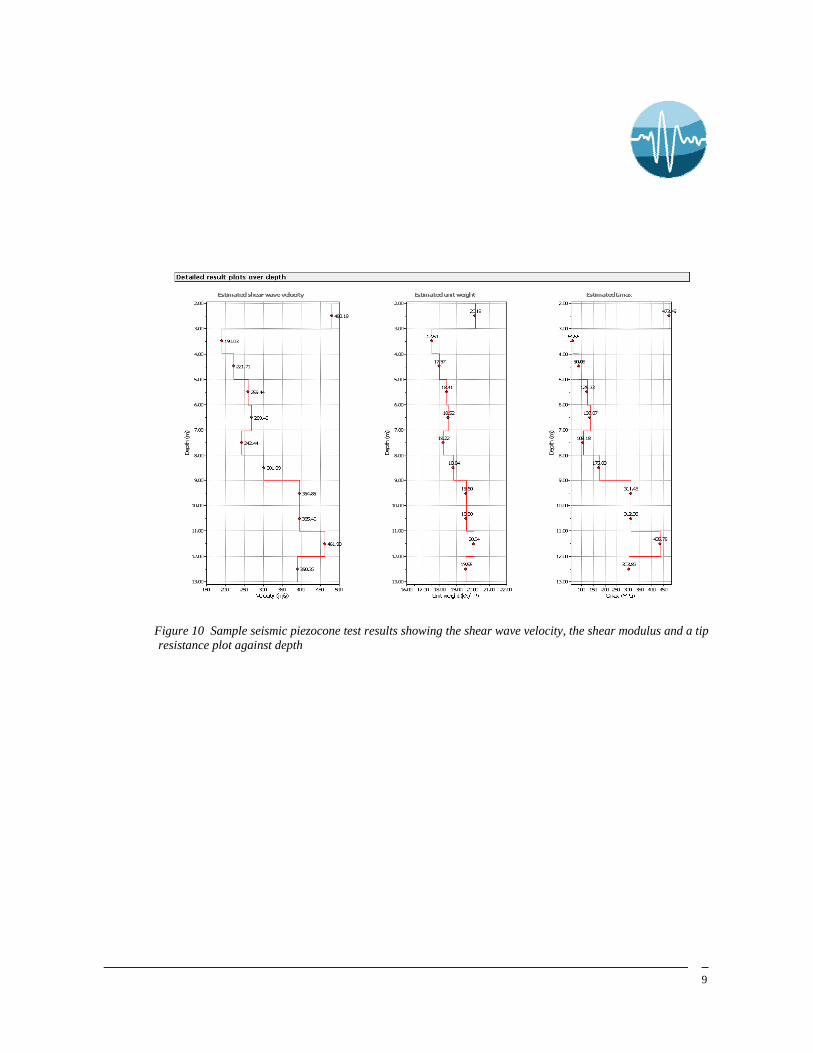
Figure 10 Sample seismic piezocone test results showing the shear wave velocity, the shear modulus and a tip resistance plot against depth
10
PIEZOCONE CALIBRATION
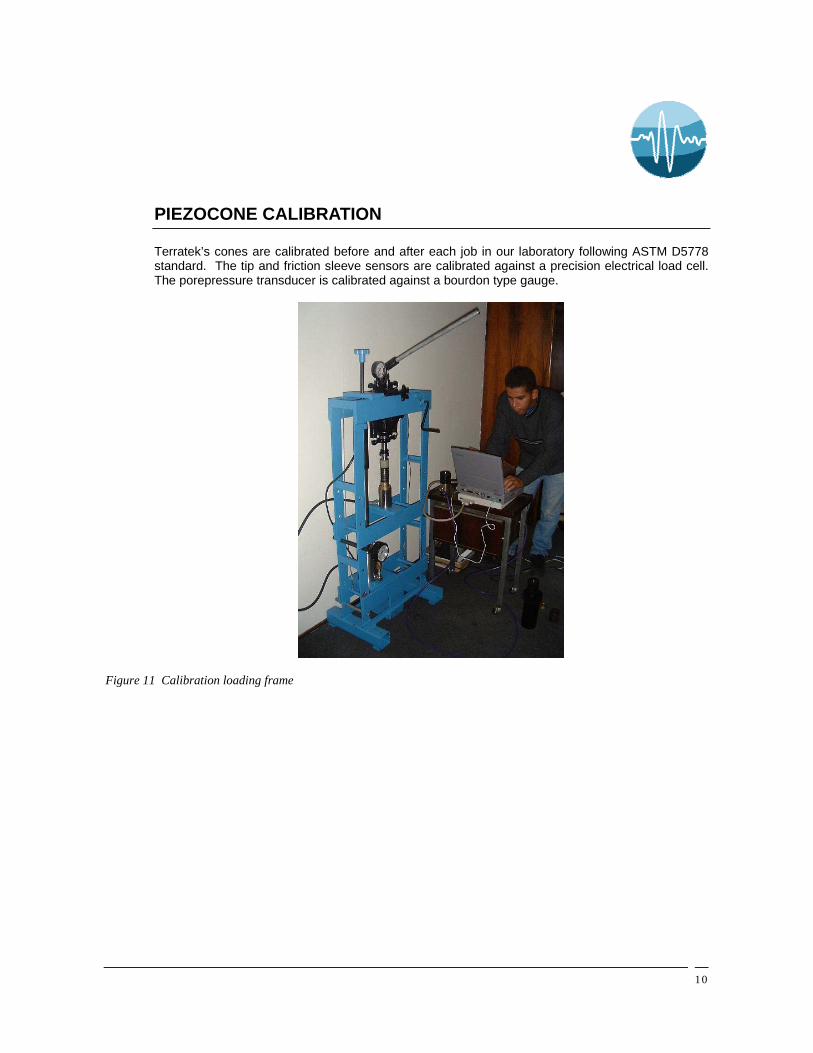
Terratek’s cones are calibrated before and after each job in our laboratory following ASTM D5778 standard. The tip and friction sleeve sensors are calibrated against a precision electrical load cell. The porepressure transducer is calibrated against a bourdon type gauge.
Figure 11 Calibration loading frame
11
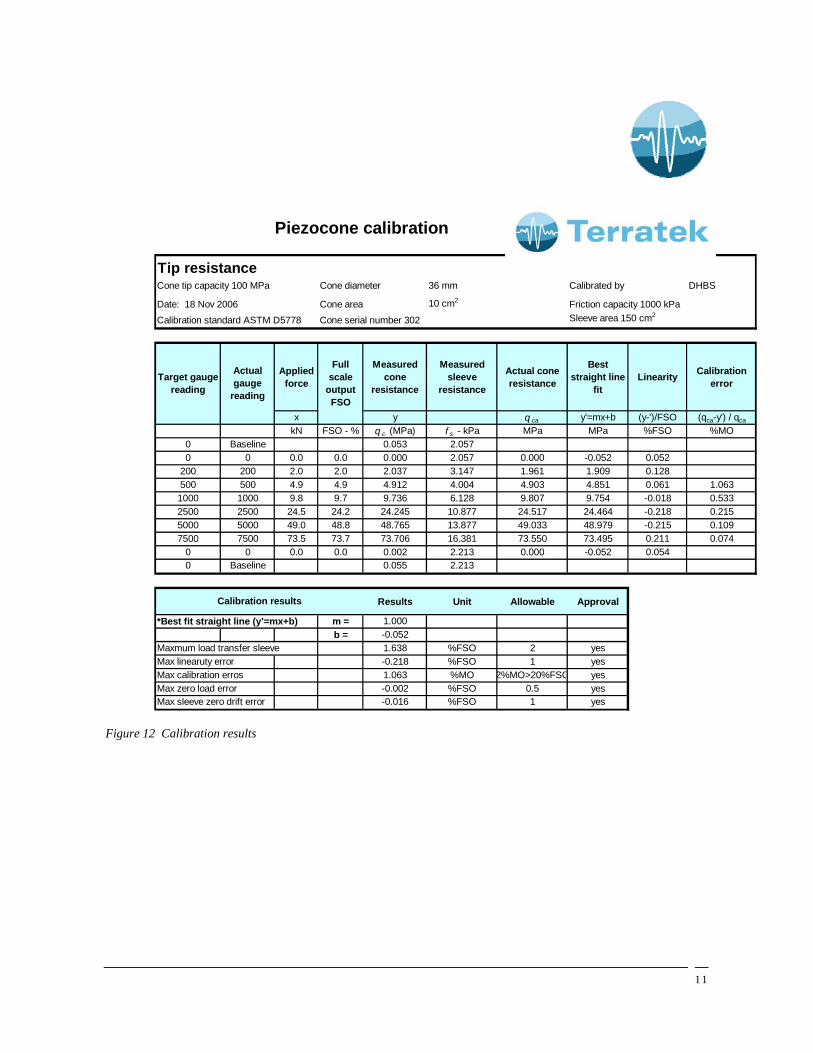
Tip resistanceCone tip capacity 100 MPa Cone diameter 36 mm Calibrated by DHBS
Date: 18 Nov 2006 Cone area 10 cm2 Friction capacity 1000 kPaCalibration standard ASTM D5778 Cone serial number 302 Sleeve area 150 cm2
Applied force
Measured cone
resistance
Measured sleeve
resistance
Actual cone resistance
Best straight line
fitLinearity Calibration
error
x y q ca y'=mx+b (y-')/FSO (qca-y') / qca
kN FSO - % q c (MPa) f s - kPa MPa MPa %FSO %MO0 Baseline 0.053 2.0570 0 0.0 0.0 0.000 2.057 0.000 -0.052 0.052
200 200 2.0 2.0 2.037 3.147 1.961 1.909 0.128500 500 4.9 4.9 4.912 4.004 4.903 4.851 0.061 1.0631000 1000 9.8 9.7 9.736 6.128 9.807 9.754 -0.018 0.5332500 2500 24.5 24.2 24.245 10.877 24.517 24.464 -0.218 0.2155000 5000 49.0 48.8 48.765 13.877 49.033 48.979 -0.215 0.1097500 7500 73.5 73.7 73.706 16.381 73.550 73.495 0.211 0.074
0 0 0.0 0.0 0.002 2.213 0.000 -0.052 0.0540 Baseline 0.055 2.213
Results Unit Allowable Approval
m = 1.000b = -0.052
Maxmum load transfer sleeve 1.638 %FSO 2 yesMax linearuty error -0.218 %FSO 1 yesMax calibration erros 1.063 %MO 2%MO>20%FSO yesMax zero load error -0.002 %FSO 0.5 yesMax sleeve zero drift error -0.016 %FSO 1 yes
*Best fit straight line (y'=mx+b)
Calibration results
Piezocone calibration
Target gauge reading
Actual gauge
reading
Full scale
output FSO
Figure 12 Calibration results
12
REFERENCES
Bucher H, Ortigao J A R & Sayao A S F J (1999) Automated analysis of seismic piezocone tests, 11th Pan Am Conference, Iguassu Falls, August, 1999, vol 2, pp 763-770
Burns S & Mayne P W (1996) Small magnitude measurements in geotechnical engineering, TRR Transportation Research Record no. 1548, pp 81-88
Burns S and Mayne PW (2002) Interpretation of seismic piezocone results for the estimation of hydraulic conductivity in clays, ASTM Geotechnical testing Journal, vol 25, no 3
Houlsby G T & Teh C I (1988) Analysis of the piezocone tests in clay, In:De Ruiter J (ed.), Penetration Testing, Proc. 1st Isopt, Orlando, Balkema, Rotterdam, vol 2, pp 777-783
Lunne T, Robertson P K & Powell J J M (1997) Cone penetration testing in geotechnical practice, Blackie, 312 p
Ortigao J A R (1995) Soil mechanics in the light of critical state theories, A A Balkema, Rotterdam, 299 p.
Robertson P K (2009) CPT Guide, Gregg Drilling
Robertson, P.K. and Campanella, R.G. (1989) Guidelines for Geotechnical Design using CPT and CPTU, Soil Mechanics Series No. 120, Civil Eng. Dept., Univ. of British Columbia, Vancouver, B.C., V6T 1Z4, Sept 1989.