Test beam studies of the LumiCal prototype - eudet.org · Test beam studies of the LumiCal...
8
EUDET-Memo-2010-09 EUDET Test beam studies of the LumiCal prototype S. Kulis a , J. Aguilar ab , M. Chrzszcz c ,W. Wierba b , L. Zawiejski b , E. Kielar b , O. Novgorodova d , H. Henschel d , W. Lohmann d , S. Schuwalow d ,K. Afanaciev e , A. Ignatenko e I. Levy f ,M. Idzik a , J. Kotula b , A. Moszczyski b , K. Oliwa b , B. Pawlik b , W. Daniluk b a University of Science and Technology, AGH, Cracow, Poland b Institute of Nuclear Physics, PAN, Cracow, Poland c University of Technology, PK, Cracow, Poland d Deutsches Elekronen-Synchrotron,DESY, Zeuthen, Germany e NCPHEP BSU, Minsk, Belarus f Tel-Aviv University, YAU, Tel-Aviv, Israel December 30, 2010 Abstract The first measurements of the LumiCal prototype performed at DESY electron test beam are reported. The obtained results indicate that full chain of signal flow including silicon sensors, fanout and readout front-end ASIC work correctly and in agreement with expectations. To study the behaviour of the signals from electromagnetic shower development, the measurements with different thickness of tungsten absorber in front of sensor plane were performed The obtained data are compared with the predictions of the Monte Carlo simulation. 1
Transcript of Test beam studies of the LumiCal prototype - eudet.org · Test beam studies of the LumiCal...

EUDET-Memo-2010-09
EUDET
Test beam studies of the LumiCal prototype
S. Kulisa, J. Aguilarab, M. Chrzszczc,W. Wierbab, L. Zawiejskib, E. Kielarb,
O. Novgorodovad, H. Henscheld, W. Lohmannd, S. Schuwalowd,K. Afanacieve, A. Ignatenkoe
I. Levyf ,M. Idzika, J. Kotulab, A. Moszczyskib, K. Oliwab, B. Pawlikb, W. Danilukb
a University of Science and Technology, AGH, Cracow, Poland
b Institute of Nuclear Physics, PAN, Cracow, Poland
c University of Technology, PK, Cracow, Poland
d Deutsches Elekronen-Synchrotron,DESY, Zeuthen, Germany
e NCPHEP BSU, Minsk, Belarus
f Tel-Aviv University, YAU, Tel-Aviv, Israel
December 30, 2010
Abstract
The first measurements of the LumiCal prototype performed at DESY electron
test beam are reported. The obtained results indicate that full chain of signal
flow including silicon sensors, fanout and readout front-end ASIC work correctly
and in agreement with expectations. To study the behaviour of the signals from
electromagnetic shower development, the measurements with different thickness
of tungsten absorber in front of sensor plane were performed The obtained data
are compared with the predictions of the Monte Carlo simulation.
1

EUDET-Memo-2010-09
1 Introduction
The International Large Detector [1] is one of the two main detectors which are plannedfor future experiments at International Linear Collider [2]. The precise measurement ofthe luminosity at ILC will be supply by special detector, LumiCal, placed in very forwardregion of ILD. The complete Lumical [3] detector contains two electromagnetic calorime-ters placed on both side of the interaction point at 5 m from it. The single calorimetercontains 30 layers of tungsten absorber interspersed with silicon sensor planes. The sen-sor layers are segmented radially and azimuthally into pads of different sizes. A mostrecent design of the LumiCal internal structure was included in [4]. The readout elec-tronics (FE and ADC ASICs) are placed at the outer radius in the space between thetungsten disks. The concept of front-end electronics for luminosity detector LumiCalwas described in [5] and the recent progress in readout electronics together with someresults of the the first test measurements can be found in [6]. To match the physicsrequirement at ILC the accuracy of luminosity measurement should be not worse than10−3. The mechanical structure with the micrometer precision and special customizedfront-end (FE) electronics will allow to fulfil such requirement. In this report we presentseveral preliminary results of the LumiCal prototype measurements performed at DESYelectron test beam at energy 4.5 GeV. In these measurements the full chain includingsilicon sensors, kapton fanout and front-end electronics was tested. Figure 1 shows thestructure of the LumiCal detector. The yellow colour shows sensors tail which wasproduced by the Hamamatsu Photonics and those used in test beam measurements.
a) b) c)
Figure 1: a) LumiCal calorimeter design b) Half plane, silicon sensor tail marked onyellow c) Silicon sensor tail prototype used during test beam measurementstogether with dedicated front-end electronics.
2
EUDET-Memo-2010-09
2 Test beam setup
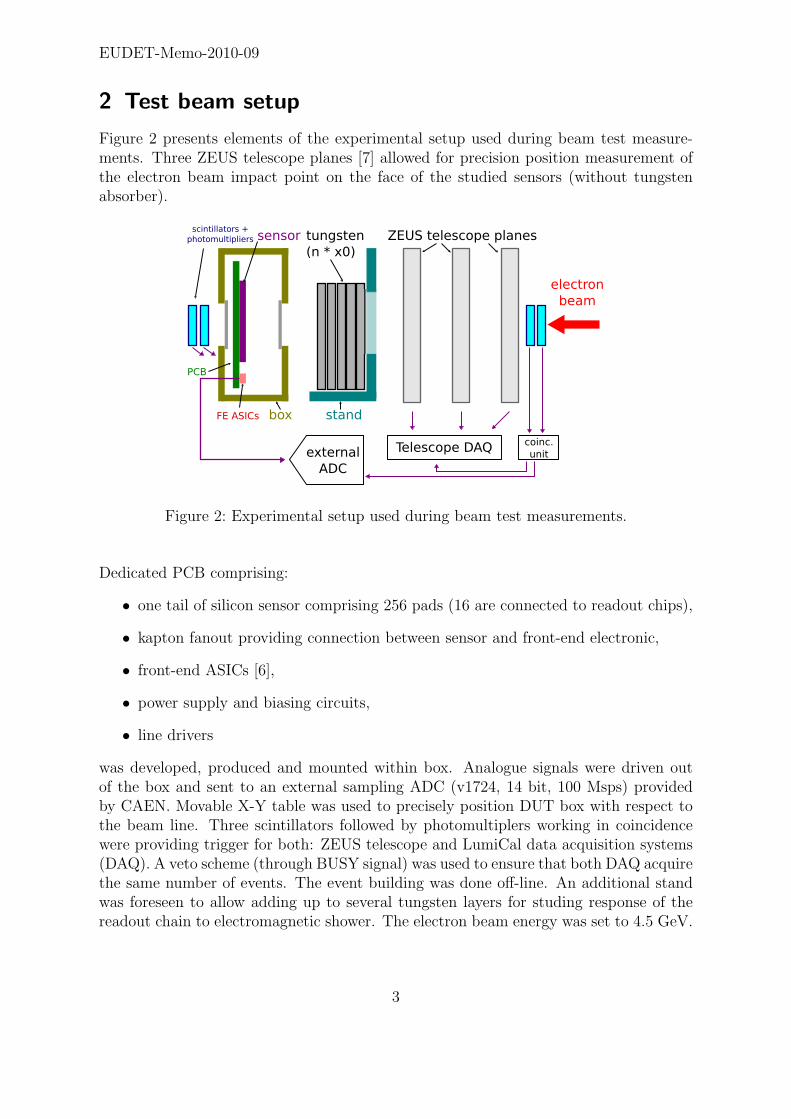
Figure 2 presents elements of the experimental setup used during beam test measure-ments. Three ZEUS telescope planes [7] allowed for precision position measurement ofthe electron beam impact point on the face of the studied sensors (without tungstenabsorber).
box stand
sensor
PCB
tungsten
(n * x0)
ZEUS telescope planesscintillators +
photomultipliers
electron
beam
external
ADC
Telescope DAQcoinc.
unit
FE ASICs
Figure 2: Experimental setup used during beam test measurements.
Dedicated PCB comprising:
• one tail of silicon sensor comprising 256 pads (16 are connected to readout chips),
• kapton fanout providing connection between sensor and front-end electronic,
• front-end ASICs [6],
• power supply and biasing circuits,
• line drivers
was developed, produced and mounted within box. Analogue signals were driven outof the box and sent to an external sampling ADC (v1724, 14 bit, 100 Msps) providedby CAEN. Movable X-Y table was used to precisely position DUT box with respect tothe beam line. Three scintillators followed by photomultiplers working in coincidencewere providing trigger for both: ZEUS telescope and LumiCal data acquisition systems(DAQ). A veto scheme (through BUSY signal) was used to ensure that both DAQ acquirethe same number of events. The event building was done off-line. An additional standwas foreseen to allow adding up to several tungsten layers for studing response of thereadout chain to electromagnetic shower. The electron beam energy was set to 4.5 GeV.
3
EUDET-Memo-2010-09
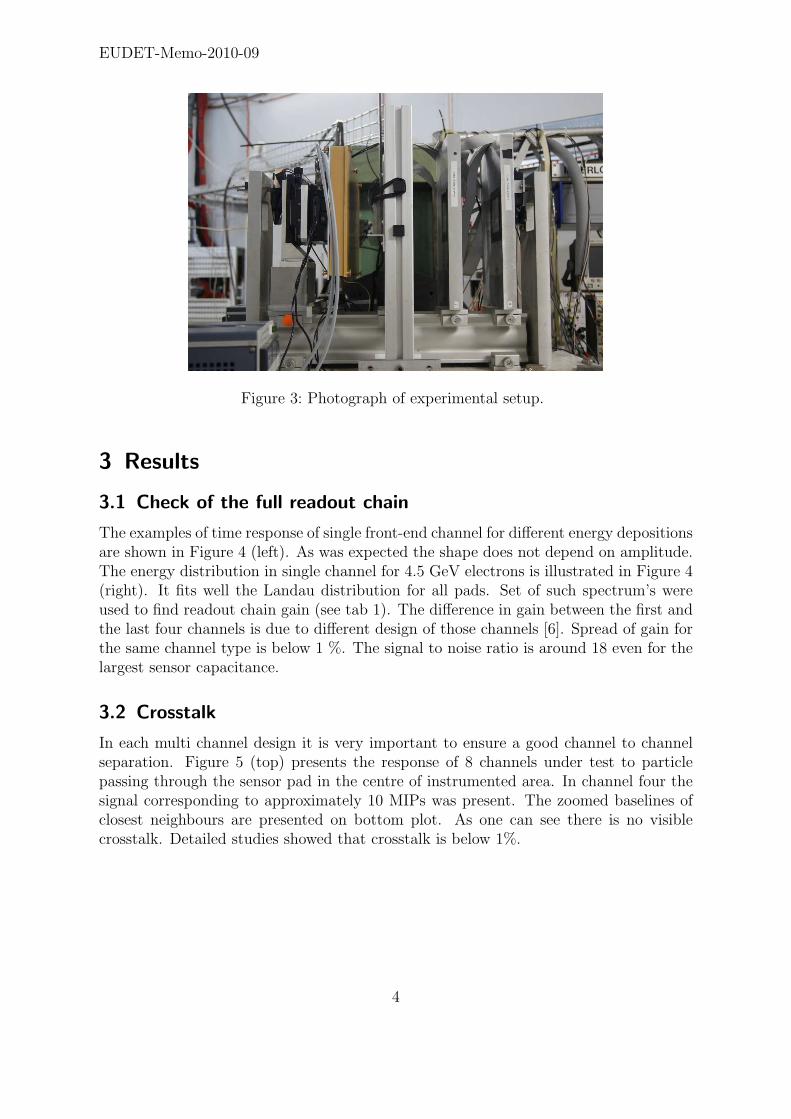
Figure 3: Photograph of experimental setup.
3 Results
3.1 Check of the full readout chain
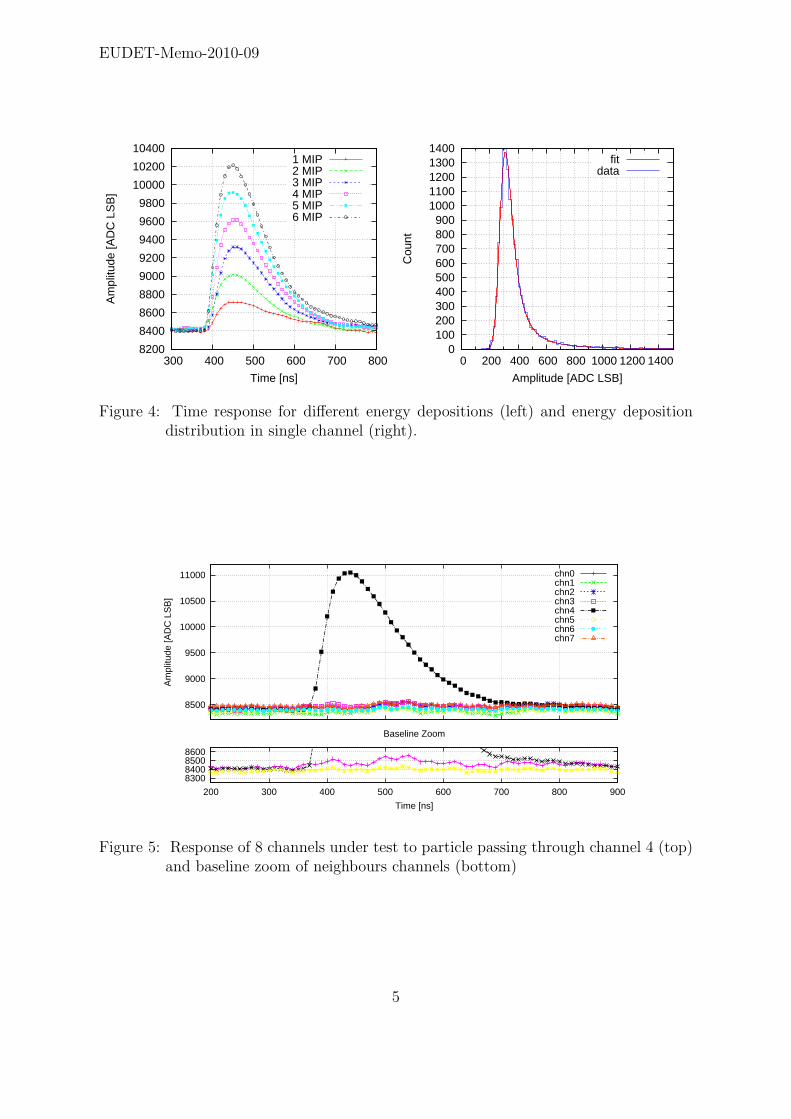
The examples of time response of single front-end channel for different energy depositionsare shown in Figure 4 (left). As was expected the shape does not depend on amplitude.The energy distribution in single channel for 4.5 GeV electrons is illustrated in Figure 4(right). It fits well the Landau distribution for all pads. Set of such spectrum’s wereused to find readout chain gain (see tab 1). The difference in gain between the first andthe last four channels is due to different design of those channels [6]. Spread of gain forthe same channel type is below 1 %. The signal to noise ratio is around 18 even for thelargest sensor capacitance.
3.2 Crosstalk
In each multi channel design it is very important to ensure a good channel to channelseparation. Figure 5 (top) presents the response of 8 channels under test to particlepassing through the sensor pad in the centre of instrumented area. In channel four thesignal corresponding to approximately 10 MIPs was present. The zoomed baselines ofclosest neighbours are presented on bottom plot. As one can see there is no visiblecrosstalk. Detailed studies showed that crosstalk is below 1%.
4
EUDET-Memo-2010-09
8200
8400
8600
8800
9000
9200
9400
9600
9800
10000
10200
10400
300 400 500 600 700 800
Am
plitu
de [A
DC
LS
B]
Time [ns]
1 MIP2 MIP3 MIP4 MIP5 MIP6 MIP
0 100 200 300 400 500 600 700 800 900
1000 1100 1200 1300 1400
0 200 400 600 800 1000 1200 1400
Cou
nt
Amplitude [ADC LSB]
fitdata
Figure 4: Time response for different energy depositions (left) and energy depositiondistribution in single channel (right).
8500
9000
9500
10000
10500
11000
Am
plitu
de [A
DC
LS
B]
chn0chn1chn2chn3chn4chn5chn6chn7
8300 8400 8500 8600
200 300 400 500 600 700 800 900
Time [ns]
Baseline Zoom
Figure 5: Response of 8 channels under test to particle passing through channel 4 (top)and baseline zoom of neighbours channels (bottom)
5
EUDET-Memo-2010-09
Table 1: Gain and SNR for different channels.
pad Gain [ADC LSB / MIP ] SNR0 588.7 17.71 586.9 18.82 588.4 18.73 587.5 18.74 300.5 18.05 303.8 17.86 302.4 17.57 303.6 17.5
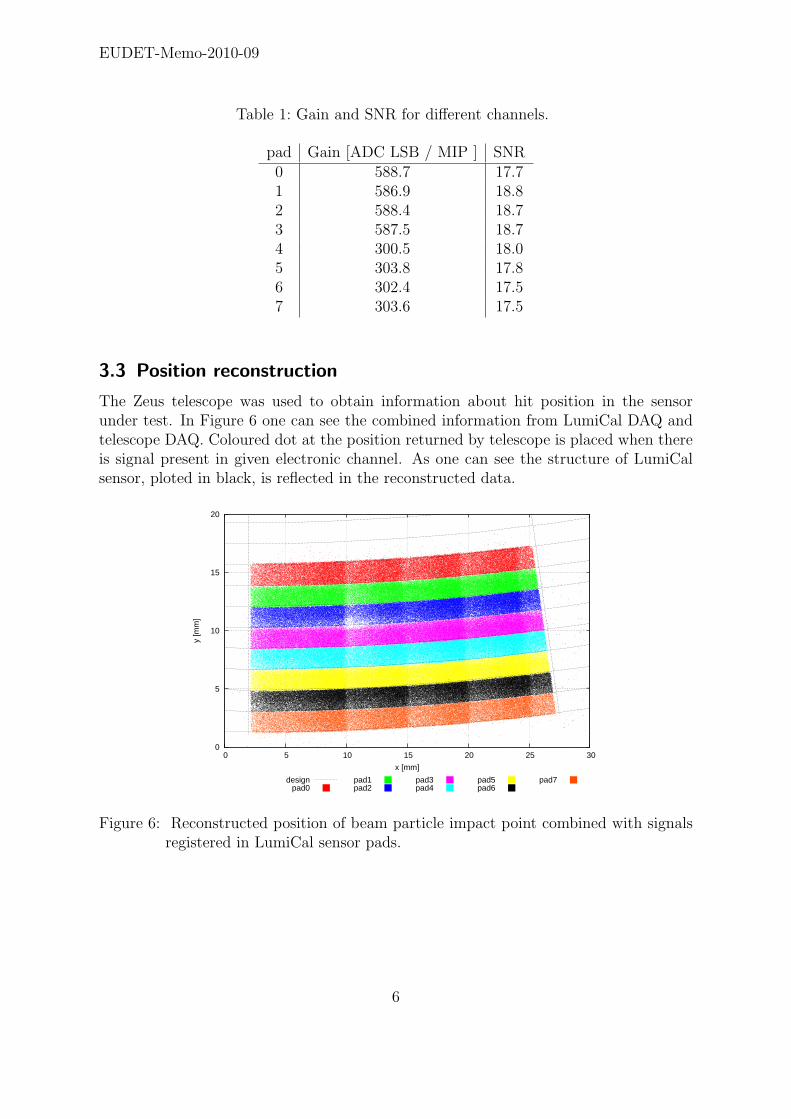
3.3 Position reconstruction
The Zeus telescope was used to obtain information about hit position in the sensorunder test. In Figure 6 one can see the combined information from LumiCal DAQ andtelescope DAQ. Coloured dot at the position returned by telescope is placed when thereis signal present in given electronic channel. As one can see the structure of LumiCalsensor, ploted in black, is reflected in the reconstructed data.
0
5
10
15
20
0 5 10 15 20 25 30
y [m
m]
x [mm]
designpad0
pad1pad2
pad3pad4
pad5pad6
pad7
Figure 6: Reconstructed position of beam particle impact point combined with signalsregistered in LumiCal sensor pads.
6
EUDET-Memo-2010-09
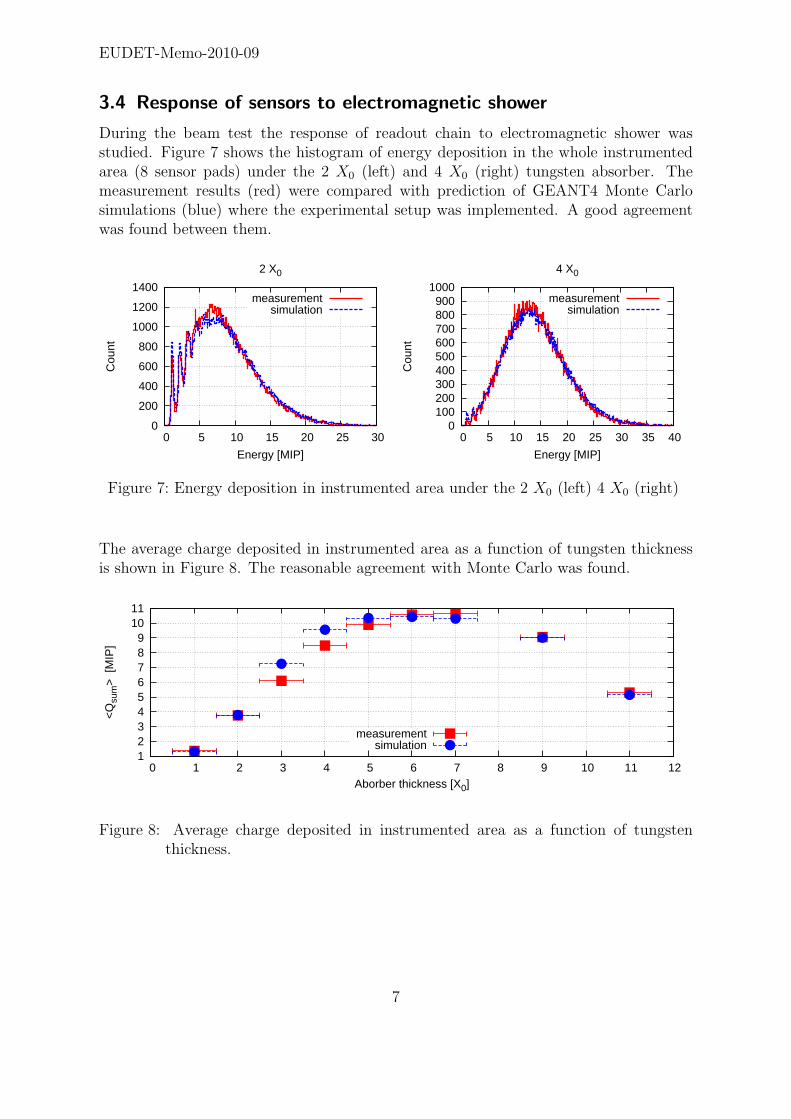
3.4 Response of sensors to electromagnetic shower
During the beam test the response of readout chain to electromagnetic shower wasstudied. Figure 7 shows the histogram of energy deposition in the whole instrumentedarea (8 sensor pads) under the 2 X0 (left) and 4 X0 (right) tungsten absorber. Themeasurement results (red) were compared with prediction of GEANT4 Monte Carlosimulations (blue) where the experimental setup was implemented. A good agreementwas found between them.
0
200
400
600
800
1000
1200
1400
0 5 10 15 20 25 30
Cou
nt
Energy [MIP]
2 X0
measurementsimulation
0 100 200 300 400 500 600 700 800 900
1000
0 5 10 15 20 25 30 35 40
Cou
nt
Energy [MIP]
4 X0
measurementsimulation
Figure 7: Energy deposition in instrumented area under the 2 X0 (left) 4 X0 (right)
The average charge deposited in instrumented area as a function of tungsten thicknessis shown in Figure 8. The reasonable agreement with Monte Carlo was found.
1 2 3 4 5 6 7 8 9
10 11
0 1 2 3 4 5 6 7 8 9 10 11 12
<Q
sum
> [
MIP
]
Aborber thickness [X0]
measurementsimulation
Figure 8: Average charge deposited in instrumented area as a function of tungstenthickness.
7
EUDET-Memo-2010-09
4 Conclusions
The first tests performed at 4.5 GeV electron beam at DESY allowed verification ofthe response of full readout chain to charged particles. The obtained results indicate agood working performance of all components(silicon sensors, kapton fanout and front-end electronics) and match the expectations. Test beam measurements allowed also thestudies of shower development studies using tungsten as an absorber. More beam testswith extended readout system will be done in near feature.
Acknowledgements
This work was partially supported by the Commission of the European Communitiesunder the 6th Framework Programme “Structuring the European Research Area”, con-tract number RII3-026126. It was also supported in part by the Polish Ministry of Sci-ence and Higher Education under contracts nr 372/6.PR UE/2007/7 and nr 141/6.PRUE/2007/7. J. Aguilar and O. Novgorodova were supported by the 7th FrameworkProgramme “Marie Curie ITN”, grant agreement number 214560.
References
[1] The Internatonal Large Detector, Letter of Intent, February 2010, DESY 2009-87,FERMILAB-PUB-09-682-E; KEK Report 2009-6, http://www.ilcild.org.
[2] International Linear Collider: http://www.linearcollider.org/cms.
[3] The FCAL Collaboration: http://www-zeuthen.desy.de/ILC/fcal.
[4] H. Abramowicz et al., Forward instrumentation for ILC detectors, JINST 5 (2010)P12002.
[5] M.Idzik et al., The Concept of LumiCal Readout Electronics, EUDET-Memo-2007-13, http://www.eudet.org/e26/e28.
[6] M. Idzik, S. Kulis and D. Przyborowski , Nucl. Instr. and Meth. A 608 (2009) 169.
[7] I. Gregor, http://www.desy.de/g̃regor/MVD Telescope.
8