TERASEN GAS INC. 2004 – 2007 PERFORMANCE … · 2004 – 2007 PERFORMANCE BASED RATE SETTLEMENT...
96
TGI 2005 Annual Review – Nov. 10/05 TERASEN GAS INC. 2004 – 2007 PERFORMANCE BASED RATE SETTLEMENT AGREEMENT 2005 ANNUAL REVIEW November 10, 2005
Transcript of TERASEN GAS INC. 2004 – 2007 PERFORMANCE … · 2004 – 2007 PERFORMANCE BASED RATE SETTLEMENT...

TGI 2005 Annual Review – Nov. 10/05
TERASEN GAS INC.2004 – 2007 PERFORMANCE BASED RATE
SETTLEMENT AGREEMENT
2005 ANNUAL REVIEW
November 10, 2005

TGI 2005 Annual Review – Nov. 10/05
AGENDA REVIEW
Scott Thomson

November 10, 20052005 TGI Annual Review 3
AGENDA - TGI
Agenda - Scott ThomsonWelcome / Introduction - Philip NakoneshnyTerasen Opening Remarks & Report - Randy Jespersen
2005 Priorities2006 Priorities
2005 Summary Results - Scott ThomsonGas Commodity and Midstream Cost Outlook - David Bennett2006 PBR Cost Drivers
Customers, Volumes and Margin - Hans MertinsFormula Driven Rate Base and Plant Additions - Tom LoskiFormula O&M Expenses - Tom LoskiVehicle Lease - Tom Loski
2006 Revenue Requirements and Rate OutlookRevenue Requirement Results - Tom LoskiOverall Customer Rate Impacts - Tom Loski
November 10, 20052005 TGI Annual Review 4
AGENDA – TGI - page 2
Other Information Pertaining to the TGI 2004-2007 PBR Settlement
Customer Care & SQI’s - Danielle Wensink5 Year Major Capital Plan - Dwain BellCode of Conduct & Transfer Pricing Policy - Doug CruickshankCEO/CFO Certification (M152-109/111) - Doug Cruickshank
Conclusions

TGI 2005 Annual Review – Nov. 10/05
Welcome/Introduction
Philip Nakoneshny

TGI 2005 Annual Review – Nov. 10/05
Terasen Gas Opening Remarks
Randy JespersenPresident

November 10, 20052005 TGI Annual Review 7
Terasen Gas 2005 Priorities
Continued Focus on Operational ExcellenceSafety, Customer Satisfaction, Cost Containment, Environmental Performance
Cost of Capital HearingImproved ROE and increased equity thickness
Increased Market Share of Multi-Family
Improved Employee Engagement
TGVI Settlement Renegotiation
Advance Vancouver Island, Whistler and other Projects

November 10, 20052005 TGI Annual Review 8
Terasen Gas Group 2005 ScorecardSeptember 2005 Results
YE Forecast
YE Forecast
YE Forecast
YE Forecast
YE Forecast
YE Forecast
FINANCIAL
CUSTOMER
CONCEPTTO CASH
EMPLOYEE
0 20 40 60 80 100% 120
140
-YE Forecast
Target +
YE Forecast
Overall YE Forecast
- Challenge +YE Forecast
YE Forecast
1. Inc. Earnings Per Share
2. Gas Segment Earnings Before Interest & Taxes
3. O&M per Customer
4. Base Capital
5. Customer Survey Score
6. Credit & Collections
7. Customer Additions
8. Vehicle Accidents
9. Lost Time Injuries
10. Wellness
11. Public SafetyImportant factor with customer satisfaction and earnings implications. Refer to
Service Quality Indicators.

November 10, 20052005 TGI Annual Review 9
Terasen Gas 2006 Priorities
Continued Focus on Operational ExcellenceSafety, Customer Satisfaction, Cost Containment, Environmental Responsibility
Energy PolicyMulti energy association push for integrated energy policy
Supply and infrastructure developmentSiting approvalsClearer price signals and market choice/responseClarity on Kyoto/efficiency policy implementation
BCH/Fortis coordination (DSM, other)Comparable rate design for gas and electric in B.C.

November 10, 20052005 TGI Annual Review 10
Terasen Gas 2006 Priorities (cont’d)
Successful IBEW Contract Negotiations
Project DevelopmentWhistler Pipeline CPCNDistrict Energy Utilities (Whistler, East False Creek)LNG Storage or ?Other
Increase Market Share of Multi-Family units
Financial Performance
Expedient Integration with KMIPractices and PhilosophiesBest Practice Sharing

TGI 2005 Annual Review – Nov. 10/05
2005 Summary Results
Scott Thomson

November 10, 20052005 TGI Annual Review 12
Regulatory Projects in 2005 & 2006JanJan March May July Sept Nov Jan March May July NovSept
Filing
DecisionReview & Decision ProcessApplication Preparation
Oral Hearing
LEGEND
TGI-TGVI Annual Reviews
Major Recurring Filings
TG Utilities Annual Reports
TGI, TGVI & TGW Resource Plans
2005 2006
Key One-Off Projects
TGI-TGVI 2005 ROE Application
TGI SCP IPC Transaction Recovery
KMI Transaction Approval
TGVI 2006-7 Rev Requirement
TGVI LNG Facility CPCN Application
TGW Pipeline Project
TG Squamish RSF Application
TGI Residential Unbundling
TGW 2006-7 Revenue Requirement
Explore TG Utilities Consolidation

November 10, 20052005 TGI Annual Review 13
2005 Update
2005 Test Yr 2005 Projected
Customer Additions 10,144 12,676
Customers – End of Year 797,072 799,696
Average Customer Count 790,385 791,647
Capital Expenditures $90,611 $77,390
Customer Additions and Capital Expenditures

November 10, 20052005 TGI Annual Review 14
2005 Update
Due to productivity improvements made possible by the integration activities of TGI and TGVI under the PBR settlement,Terasen Gas will distribute $7.3 million to customers in 2006 via a rider.

TGI 2005 Annual Review – Nov. 10/05
Gas Commodity & Midstream Cost Outlook
David Bennett

November 10, 20052005 TGI Annual Review 16
Agenda
Market Overview and Impact on Terasen RatesCommodityMidstream
Gas Supply Activities to Mitigate Cost Pressures

November 10, 20052005 TGI Annual Review 17
Forward Prices (March 3, 2005)
Forward Prices as of M arch 3, 2005 ($Cdn/GJ)
$6.000
$8.000
$10.000
$12.000
$14.000
$16.000
Ap r-05Ju n-0 5Au g-0 5O ct -05D ec-0 5Fe b -06A p r-06Ju n-0 6Au g-0 6O ct -06D ec-0 6Fe b -07A p r-07Ju n-0 7A u g-0 7Oc t -07
Nym ex Aeco
Key factors affecting prices:
1. Anticipation of warmer summer weather and low hydro in PNW
2. Strength in crude oil and its derivative products (i.e. gasoline and heating oil)

November 10, 20052005 TGI Annual Review 18
TGI Lower Mainland Residential Rates(as of March 3)
$1.173
$2.885
$6.020 $6.518 $7.005
$1.15 $0.65$0.65
7.167
1.167
2.823
$0.00
$2.00
$4.00
$6.00
$8.00
$10.00
$12.00
$14.00
$16.00
1-Jan-04 1-Apr-04 1-May-04 1-Jul-04 1-Oct-04 1-Jan-05 1-Apr-05
Cdn
$/G
J
GCRA
MCRA
CCRA
DeliveryCharge
FixedBasic
ElectricEquivalent
Overa l l Rate the Same 4% Burner Tipincrease
0.6% Burner Tipdecrease NO CHANGE

November 10, 20052005 TGI Annual Review 19
Forward Prices on June 2, 2005
Forward Prices as of June 2, 2005 ($Cdn/GJ)
$6.000
$8.000
$10.000
$12.000
$14.000
$16.000
Ju l-0 5Se p-0 5N ov-0 5Ja n-0 6M a r-06M a y-06
Ju l-0 6Se p-0 6N ov-0 6Ja n-0 7M a r-07M a y-07
Ju l-0 7Se p-0 7
Nym ex Aeco Nym ex (Mar3) Aeco (Mar3)
3% increase from Mar.3 to Jun.2 on for 12-month strip
Key factors affecting 2005 prices:
1. Weather
2. Crude oil and its derivative products (i.e. gasoline and heating oil)
Significant changes from Q1:
1. Improved hydro situation although still below average.
2. Crude oil prices extremely volatile in Q2, reaching a new record high on April 1 and softening $10 in May.
3. Natural gas futures followed crude oil, declining over $1.60 US/MMBtu between April and May.

November 10, 20052005 TGI Annual Review 20
TGI Lower Mainland Residential Rates(as of June 2005)
$1.173
$2.885
$6.020 $6.518 $7.005$7.167
$1.167
$2.823
$7.655$7.005
$0.65$0.65 $0.65
$1.15
$0.00
$2.00
$4.00
$6.00
$8.00
$10.00
$12.00
$14.00
$16.00
1-Jan-04 1-Apr-04 1-May-04 1-Jul-04 1-Oct-04 1-Jan-05 1-Apr-05 1-Jul-05
Cdn
$/G
J
Fixed Basic Delivery Charge CCRA MCRA GCRA Electric Equivalent
Overall Rate the Same4% Burner Tip
Increase0.6% Burner Tip
Decrease
5.6% Burner TipIncrease

November 10, 20052005 TGI Annual Review 21
Forward Prices on September 1, 2005
Forward Prices as of September 1, 2005 ($Cdn/GJ)
$6.000
$8.000
$10.000
$12.000
$14.000
$16.000
Oc t -05
N ov-0 5
D ec-0 5
Jan-0
6Fe b -06M a r-0
6A p r-0
6M a y -0
6Ju
n-06
Jul-0
6A u g-0
6S e p-0
6O c t -
06N ov
-0 6D ec
-0 6Ja
n-07
Fe b -07M a r-0
7A p r-0
7M a y -0
7Ju
n-07
Jul-0
7A u g-0
7S e p-0
7O c t -
07Nymex Aeco Nym ex (Mar 3) Aeco (Mar 3)
40% increase from Mar. 3 to Sept. 1 for 12-month strip
Key factors affecting prices:
1. Weather
2. Crude oil and its derivative products (i.e. gasoline and heating oil)
Significant changes from Q2:
1. Hurricane Katrina
2. Erosion of natural gas storage inventories.
3. Unprecedented price volatility in the futures market ($2 daily price fluctuation in Nymex gas prices)

November 10, 20052005 TGI Annual Review 22
Summer 2005Higher Demand / Lower Supply
Toronto Average Daily Temperature (Celcius)
0.005.00
10.00
15.00
20.00
25.00
30.00
Jun-05 Jul-05 Aug-05 Sep-05
Actual Normal
New England Power Loads (GWH)
100001050011000115001200012500130001350014000
Jun05 Jul05 Aug05
Normal Actual
Power Loads 4% higher than Normal
Temperatures 12% higher than NormalOver 80% of Gulf Gas Production Cut
(20% of North American Supply)

November 10, 20052005 TGI Annual Review 23
TGI Lower Mainland Residential Rates(as of September 1, 2005)
$1.173
$2.885
$6.020 $6.518 $7.005
$9.285
$7.167
$1.167
$2.823
$7.655
$0.65$1.15
$0.00
$2.00
$4.00
$6.00
$8.00
$10.00
$12.00
$14.00
$16.00
1-Jan-04 1-Apr-04 1-M ay-04 1-Jul-04 1-Oct-04 1-Jan-05 1-Apr-05 1-Jul-05 1-O ct-05
Cdn
$/G
J
F ixed Basic Delivery Charge CCRA M CRA GCRA Electric Equivalent
Overall Rate the Sam e4% Burner T ip
Increase0.6% Burner T ip
Decrease
5.6% Burner T ipIncrease
13.3% Burner T ipIncrease

November 10, 20052005 TGI Annual Review 24
Prices Rose Again after Rita
Forward Prices as of September 23, 2005 ($Cdn/GJ)
$6.00
$8.00
$10.00
$12.00
$14.00
$16.00
Oct-05
Nov-05
Dec-05
Jan-06
Feb-0
6Mar-0
6Apr-0
6May-0
6Ju
n-06Ju
l-06
Aug-06Sep-06Oct-
06Nov-0
6Dec-0
6Ja
n-07Feb
-07
Mar-07
Apr-07
May-07
Jun-07
Jul-0
7Aug-07Sep-07Oct-
07
Aeco Nymex Nymex (Mar3) Aeco (Mar3)
50% increase from Mar. 3 to Sep.23 for 12-month strip

November 10, 20052005 TGI Annual Review 25
Natural Gas Price Impact on TGI Rates
$4.00
$5.00
$6.00
$7.00
$8.00
$9.00
$10.00
$11.00
$12.00
$13.00
Feb-05
Mar-05
Apr-05
May-05
Jun-0
5Ju
l-05
Aug-05
Sep-05
Oct-05
Nov-05
Dec-05
Jan-0
6Feb
-06Mar-
06Apr-
06May
-06Ju
n-06
Jul-0
6Aug
-06Sep
-06Oct-
06Nov
-06Dec
-06
January '05
June '05
September '05
November '05
TGI Commodity

November 10, 20052005 TGI Annual Review 26
Relationship Between Oil and Gas Prices
Nymex Natural Gas vs Oil 2004-05 Prompt Month Prices
$4.00
$6.00
$8.00
$10.00
$12.00
$14.00
$16.00
1/6/04
2/6/04
3/6/04
4/6/04
5/6/04
6/6/04
7/6/04
8/6/04
9/6/04
10/6/
0411
/6/04
12/6/
041/6
/052/6
/053/6
/054/6
/055/6
/056/6
/057/6
/058/6
/059/6
/0510
/6/05
US$
/MM
Btu
Oil Prices in Blue
Natural Gas Prices in Red
November 10, 20052005 TGI Annual Review 27
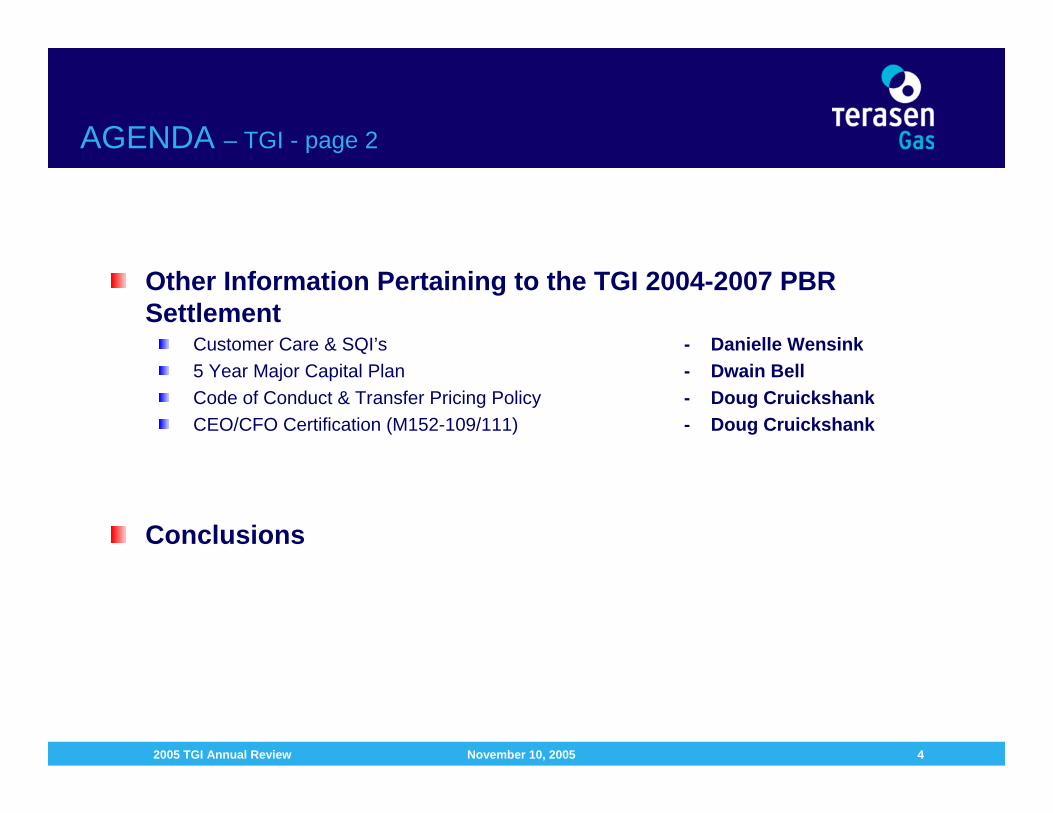
Are we running out of gas?
World proved reserves (inventory) are greater than 60 years of supplyNorth America has 5% of the reserves and 30% of demandDisconnect between reserves and market locationsMarkets move to reserves (industrial migration)Reserves move to market (LNG trade)Ultimate globalization of natural gas markets similar to crude oil
Source: TransCanada Pipeline
November 10, 20052005 TGI Annual Review 28
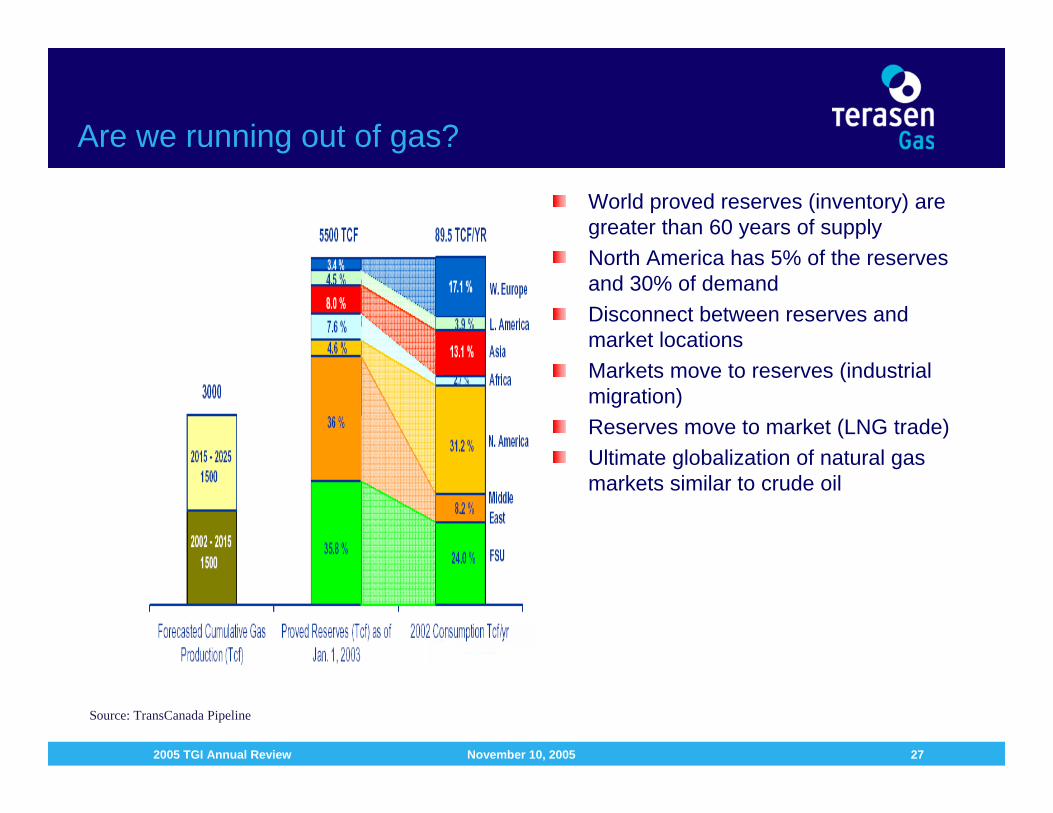
In the Longer Term Prices are Expected to Decline
Forward prices as of November 2, 2005
5-Year Forward Gas Prices ($Cdn/GJ)
$5.00$7.00$9.00
$11.00$13.00$15.00
Jan-0
6Apr-
06Ju
l-06
Oct-06
Jan-0
7Apr-
07Ju
l-07
Oct-07
Jan-0
8Apr-
08Ju
l-08
Oct-08
Jan-0
9Apr-
09Ju
l-09
Oct-09
Jan-1
0Apr-
10Ju
l-10
Oct-10
Aeco Nymex
November 10, 20052005 TGI Annual Review 29
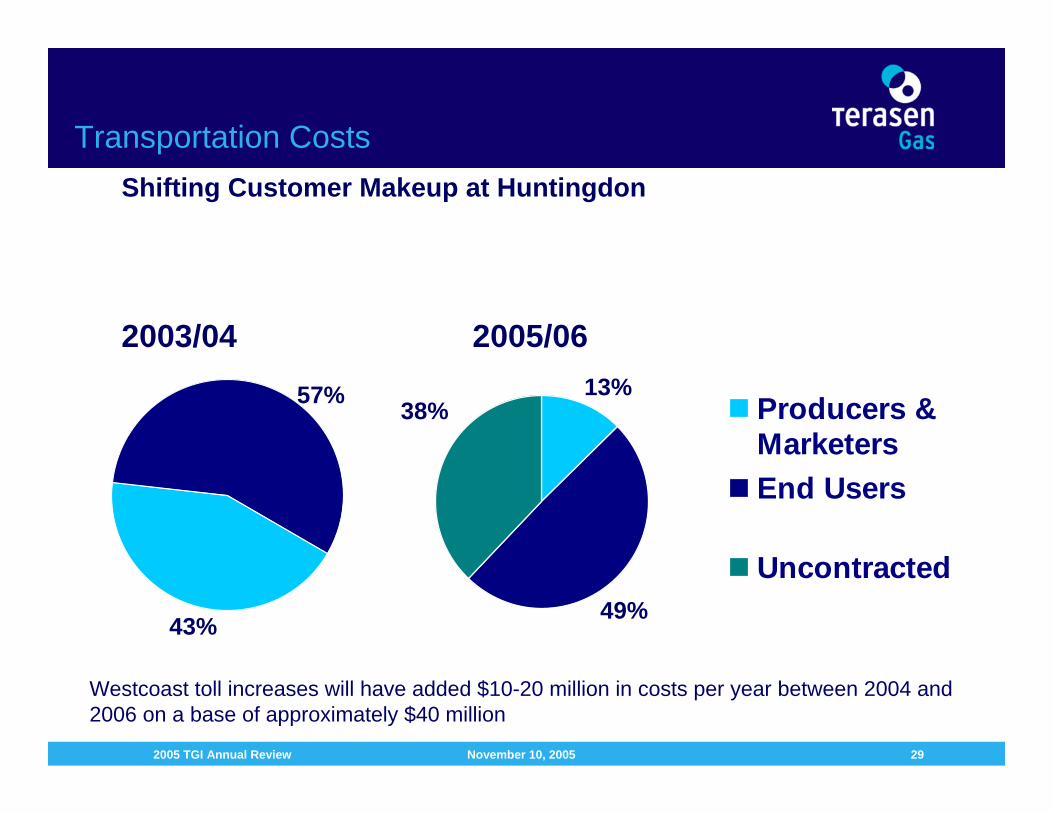
Transportation CostsShifting Customer Makeup at Huntingdon
Producers &MarketersEnd Users
Uncontracted
2003/04 2005/06
43%
57% 38%13%
49%
Westcoast toll increases will have added $10-20 million in costs per year between 2004 and 2006 on a base of approximately $40 million

November 10, 20052005 TGI Annual Review 30
Producers Reducing DownstreamPipeline Commitments
-Supply in BC is still growing and will continue to grow
- Producers are focused on preserving optionality to sell into the best market
- As a result takeaway from Northeastern BC to Alberta has grown. (Total from NE BC now exceeds 4 Bcfd, up from 2.6 Bcfd in 1999).

November 10, 20052005 TGI Annual Review 31
Gas Cost Mitigation Activities
What are we doing to lessen the impact?Contract for Resources
Planning - Annual Contract Plan (ACP)Contracting - Commodity/Transport/Storage
Mitigation of ResourcesOngoing activity to reduce cost to the customersRegulatory activities
Manage Price of CommodityPrice Risk Management Plan (PRM)

November 10, 20052005 TGI Annual Review 32
Gas Supply Market ConsiderationsRegional Market
British
Alberta
Columbia
FortNelson
Carbon
AECO
Jackson
ClayBasin
McMahon
Pine River
Station 2
TCPL
NorthwestPipeline
NOV ATCPL BC
Huntingdon/Sumas
NWP
PNG
Mist
RockyMountainBasin
Western CanadaSedimentary Basin
British
Alberta
Columbia
FortNelson
AitkenCreek
AECO
Prairie
ClayBasin
McMahon
Pine River
Station 2
NorthwestPipeline
NOV A
TCPL G
TNKingsgate
Huntingdon/Sumas
NWP
PNG
Mist
RockyMountainBasin
Western CanadaSedimentary Basin
TerasenNorthern Border
Duke
TGVI
Stanfield
WA
OR
Alliance
November 10, 20052005 TGI Annual Review 33
Price Risk Management (PRM)
Focus price risk management activities on capping rates to remain competitive with electric rates
Manage impacts on customer rates due to commodity price volatility
Risk management activities have meant that commodity price increase is less than half of market

November 10, 20052005 TGI Annual Review 34
Summary
In 2005 gas prices and volatility have been pushed by a confluence of circumstances
Supply is sufficient in the long term
Terasen is managing the supply portfolio to retain competitiveness to other energy sources and lower rate volatility
Price risk management activities to date mean lower rate increases than market

TGI 2005 Annual Review – Nov. 10/05
2006 PBR Cost Drivers
Customers, Volumes and Margin
Hans Mertins
November 10, 20052005 TGI Annual Review 36
Outline
The Economic FundamentalsBC EconomyNew Housing Outlook
Customer AdditionsKey Drivers2005 Projection & 2006 Forecast
Use RatesResidential & Commercial
Industrial Volumes & MarginForecast Risks

November 10, 20052005 TGI Annual Review 37
The BC Economy – the fundamentals
Five year conventional mortgage rate
0.0%
1.0%
2.0%
3.0%
4.0%
5.0%
6.0%
7.0%
8.0%
9.0%
1997 1998 1999 2000 2001 2002 2003 2004 2005 Fcst 2006 Fcst 2007 Fcst
Unemployment rate
0.0%
1.0%
2.0%
3.0%
4.0%
5.0%
6.0%
7.0%
8.0%
9.0%
10.0%
1997 1998 1999 2000 2001 2002 2003 2004 2005 Fcst 2006 Fcst 2007 Fcst
Housing starts
-
5,000
10,000
15,000
20,000
25,000
30,000
35,000
40,000
1997 1998 1999 2000 2001 2002 2003 2004 2005 Fcst 2006 Fcst 2007 Fcst
Gross domestic product
$100,000
$110,000
$120,000
$130,000
$140,000
$150,000
$160,000
1997 1998 1999 2000 2001 2002 2003 2004 2005 Fcst 2006 Fcst 2007 Fcst0.00%
1.00%
2.00%
3.00%
4.00%
5.00%
6.00%
GDP (1997 millions) GDP (1997 millions) - annual growth rate
~ 3% per year

November 10, 20052005 TGI Annual Review 38
2006 CMHC Housing Starts – by region (Fall 2005 Outlook)
17,500 Starts – Vancouver55%
1000 Starts – Abbotsford3%
2,255 StartsVictoria
7%
2,400 StartsKelowna
8%
8,445 StartsAll Other Areas
27%
TOTAL 31,600
6% decrease

November 10, 20052005 TGI Annual Review 39
BC Housing Starts- mix of dwellings
Forecast
-
5,000
10,000
15,000
20,000
25,000
1998 1999 2000 2001 2002 2003 2004 2005 Fcst 2006 Fcst
# of
Hou
sing
Sta
rts in
BC
Single Family Dwelling Multi Family Dwelling
What are the trends?Reduced startsMore MFDsIncreased commercial activityLonger construction lead timesGas commodity prices relatively high
2005 MFDs = 59% - 2006 MFDs = 60%
November 10, 20052005 TGI Annual Review 40
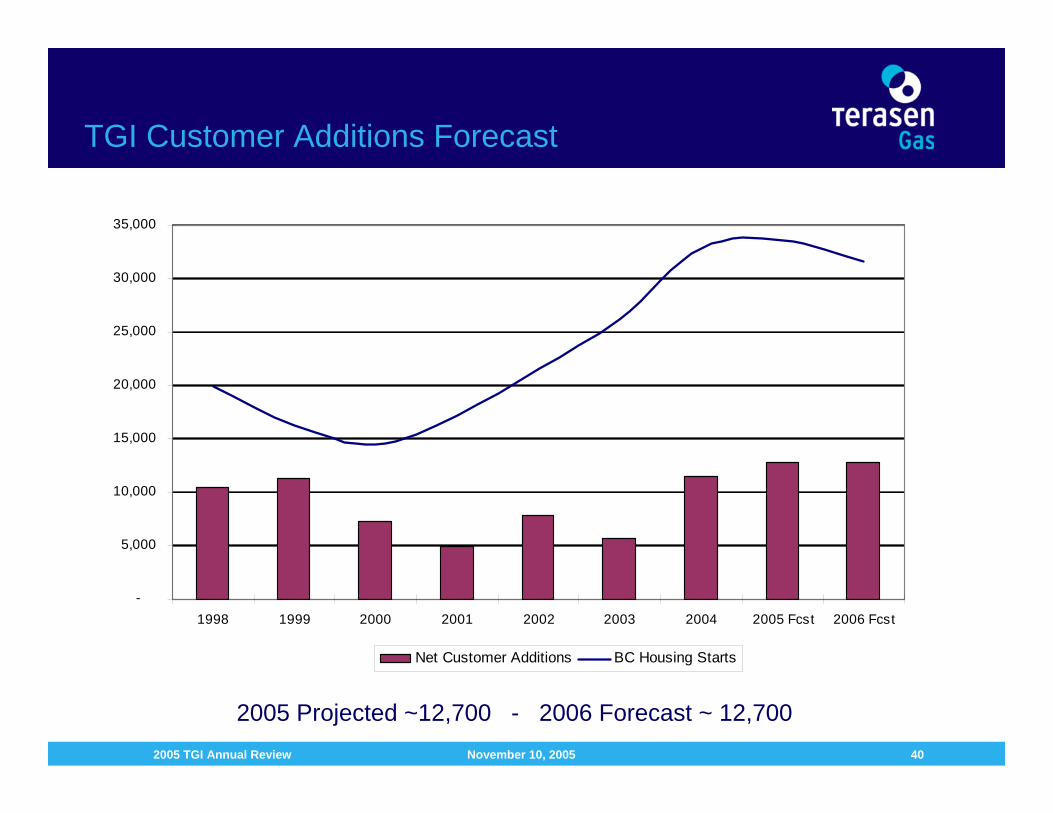
TGI Customer Additions Forecast
Forecast
-
5,000
10,000
15,000
20,000
25,000
30,000
35,000
1998 1999 2000 2001 2002 2003 2004 2005 Fcst 2006 Fcst
Net Customer Additions BC Housing Starts
2005 Projected ~12,700 - 2006 Forecast ~ 12,700

November 10, 20052005 TGI Annual Review 41
Residential Use Rates
Modeling suggests that 2006 use rates should fall to low end of forecast range
Why the decline?Improved appliance efficiencyImproved home insulationMore MFDs & smaller sizeEnergy conservationAppliance replacementElectric space heater use
TGI Residential Normalized Use Rate
90
95
100
105
110
115
120
1999 2000 2001 2002 2003 2004 2005p 2006f
Ann
ual G
Js
November 10, 20052005 TGI Annual Review 42
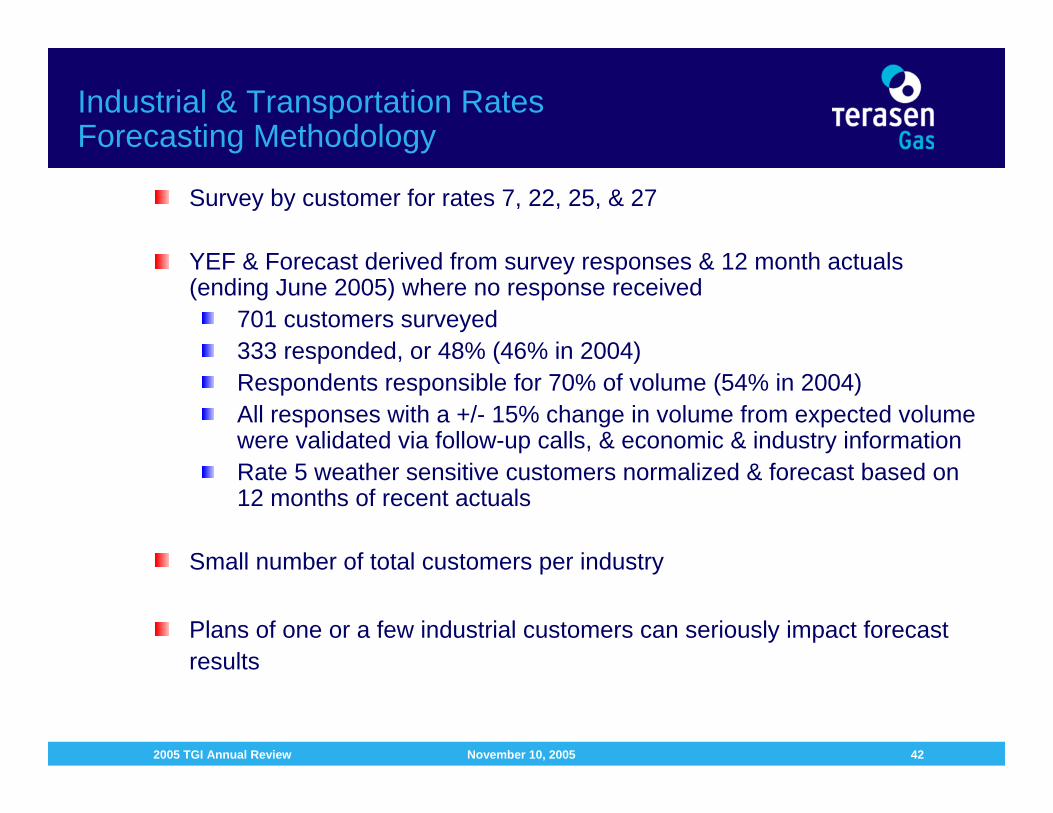
Industrial & Transportation Rates Forecasting Methodology
Survey by customer for rates 7, 22, 25, & 27
YEF & Forecast derived from survey responses & 12 month actuals (ending June 2005) where no response received
701 customers surveyed333 responded, or 48% (46% in 2004)Respondents responsible for 70% of volume (54% in 2004)All responses with a +/- 15% change in volume from expected volume were validated via follow-up calls, & economic & industry informationRate 5 weather sensitive customers normalized & forecast based on 12 months of recent actuals
Small number of total customers per industry
Plans of one or a few industrial customers can seriously impact forecast results

November 10, 20052005 TGI Annual Review 43
Industrial Volume
2006 volumes forecast to decline by ~ 2% from 2005 Projected
Comparison of TGI Forecast to Actual Volumes Industrial Rate Classes (rates 5, 7, 22, 25 & 27)
50,000
55,000
60,000
65,000
70,000
75,000
2001 2002 2003 2004 2005 2006 2007
Forecast Actual
TJs
Why the decline?Relatively high commodity priceStrong Canadian dollarFuel switchingProduction efficiency improvements
November 10, 20052005 TGI Annual Review 44
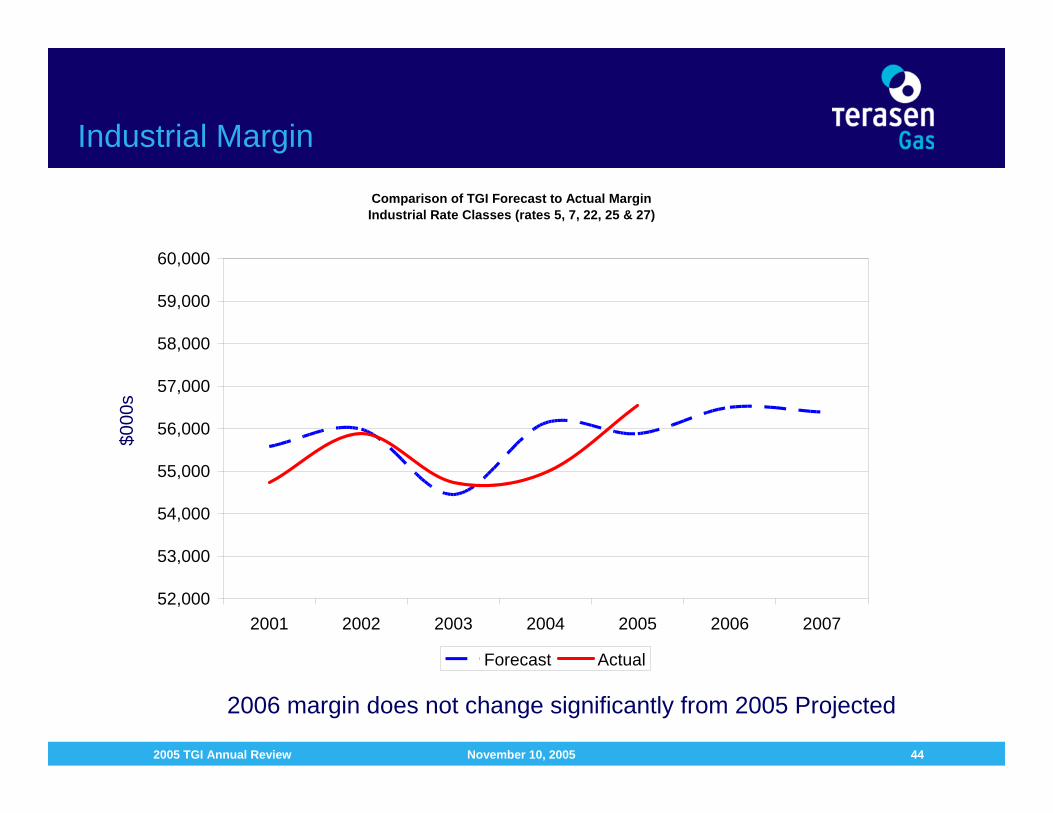
Industrial Margin
2006 margin does not change significantly from 2005 Projected
Comparison of TGI Forecast to Actual Margin Industrial Rate Classes (rates 5, 7, 22, 25 & 27)
52,000
53,000
54,000
55,000
56,000
57,000
58,000
59,000
60,000
2001 2002 2003 2004 2005 2006 2007
Forecast Actual
$000
s

November 10, 20052005 TGI Annual Review 45
Forecast Risks
Increase in interest rates, slow down in new constructionReal estate market correction?Rising construction costs, shortage of skilled trades workersStronger Canadian dollar & decreased competitiveness in export market – i.e. forest industryEffects of sustained high natural gas & energy prices & on the economyRecent commodity price increases have impacted the competitive position of natural gas

TGI 2005 Annual Review – Nov. 10/05
2006 PBR Cost Drivers
Tom Loski
November 10, 20052005 TGI Annual Review 47
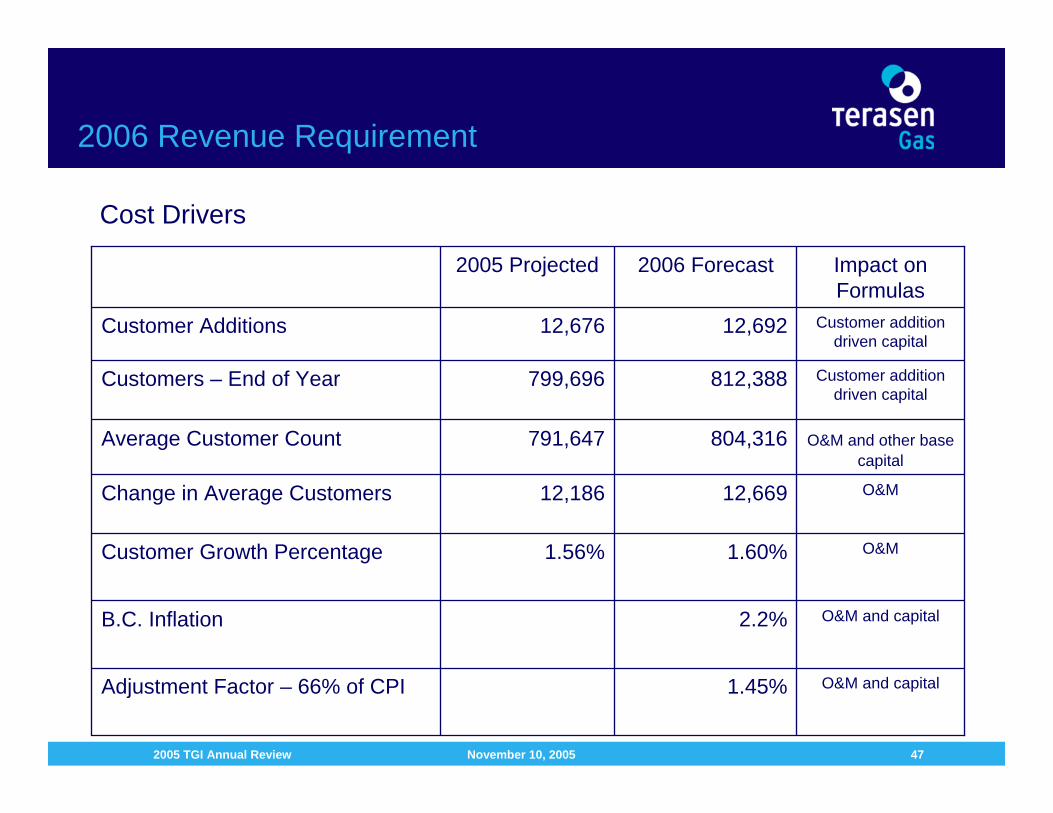
2006 Revenue Requirement
Adjustment Factor – 66% of CPI
B.C. Inflation
Customer Growth Percentage
Change in Average Customers
Average Customer Count
Customers – End of Year
Customer Additions
O&M and capital2.2%
O&M1.60%1.56%
O&M and capital1.45%
O&M12,66912,186
O&M and other basecapital
804,316791,647
Customer addition driven capital
812,388799,696
Customer addition driven capital
12,69212,676
Impact on Formulas
2006 Forecast2005 Projected
Cost Drivers
November 10, 20052005 TGI Annual Review 48
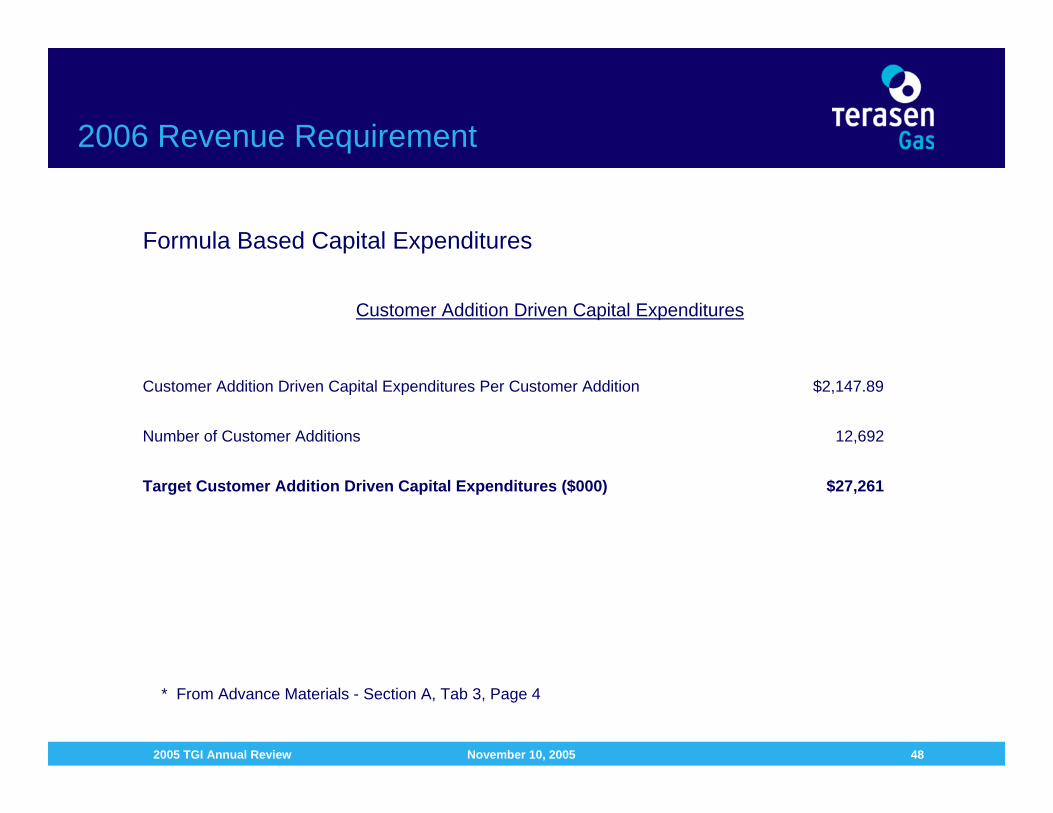
2006 Revenue Requirement
Formula Based Capital Expenditures
Customer Addition Driven Capital Expenditures
Customer Addition Driven Capital Expenditures Per Customer Addition $2,147.89
Number of Customer Additions 12,692
Target Customer Addition Driven Capital Expenditures ($000) $27,261
* From Advance Materials - Section A, Tab 3, Page 4

November 10, 20052005 TGI Annual Review 49
2006 Revenue Requirement
Formula Based Capital Expenditures
Other Base Capital Expenditures
Other Base Capital Expenditures Per Customer $87.93
Average Number of Customers 804,316
Target Other Base Capital Expenditures ($000) $70,724
* From Advance Materials - Section A, Tab 3, Page 4

November 10, 20052005 TGI Annual Review 50
2006 Revenue Requirement
Formula Based Capital Expenditures
Summary Capital Expenditures
Target Customer Addition Driven Capital Expenditures $27,261
Target Other Base Capital Expenditures 70,724
Total Base Capital Additions excluding Forecast CPCN Additions ($000) $97,985
* From Advance Materials - Section A, Tab 3, Page 4

November 10, 20052005 TGI Annual Review 51
2006 Revenue Requirement
Total Plant Additions (in 000’s)2005 2006
Update Forecast
Base Capital Expenditure $96,119 $97,985Add: WIP Changes (394) (264)
Add: AFUDC 938 960Add: Overhead Capitalized 26,335 27,243
Total Base Capital Additions To Gas Plant in Service 122,998 125,924
CPCN Completed in Previous Year & Added to Opening GPIS 51,691 4,564
Total Plant Additions $174,689 $130,488

November 10, 20052005 TGI Annual Review 52
2006 Revenue Requirement
The 13-month average of Gas in Storage increased significantly as a result of higher gas costs.
Utility Rate Base
2005 Approved 2006 Forecast
Net Plant in Service, Mid-Year $2,280,774 $2,318,274Gas in Storage 111,555 182,935Other Rate Base Items 3,422 4,717Utility Rate Base $2,395,751 $2,505,926

November 10, 20052005 TGI Annual Review 53
2006 Revenue Requirement
O&M Expenses
2006 O&M Formula :
[2005 Adjusted O&M X (1+customer growth) X (1+ CPI – adjustment factor)] + Pension & Insurance Adjustment
Gross 2006 O&M = [$190,888 X (1+1.60%) X (1+2.2% -1.45%)]+ $1,525 =$196,919
Gross 2006 O&M $196,919Capitalized Overhead ( 27,243)Fort Nelson O&M and Vehicle Lease ( 2,585)Net 2006 O&M $167,091
* From Advance Materials - Section A, Tab 5, Pages 1 to 3

November 10, 20052005 TGI Annual Review 54
2006 Revenue Requirement
Formula Calculation of O&M
Line Approved Adjusted Base ForecastNo. Description 2005 2005 Change 2006
(1) (2) (3) (4) (5)
1 Average Number of Customers - Forecast 790,385 12,669 804,3162 Percentage Growth in Average Customers 1.60%34 Average Number of Customers - True up (Actual/Projection) 791,6475 Percentage Growth in Average Customers67 Annual Inflation Rate - CPI 2.00% 2.00% 2.20%8 Adjustment Factor 1.00% 1.00% 1.45%9
10 Total Gross O & M Expense before TPIP11 TPIP12 Total Gross O & M Expense 190,575 $190,888 $4,506 195,39413 Pension & Insurance Variance 11 11 1,514 1,52514 Adjusted Total Gross O&M Expense 190,586 190,899 196,9191516 Total Items Not Subject to Overheads (20,239) (20,272) (20,752)17 Less: TPIP Not Subject to Overhead (5,751) (5,761) (5,897)18 Total O&M Subject to Capitalized Overhead 164,596 164,865 5,405 170,2701920 Capitalized Overhead at 16% 26,335 26,335 27,24321 Gross O&M Less Capitalized Overhead 164,251 164,564 5,112 169,67622 023 Less: Fort Nelson O&M & Vehicle Lease (2,522) (2,526) (59) (2,585)24 Total Utility O&M $161,729 $162,038 $5,053 $167,091

November 10, 20052005 TGI Annual Review 55
2006 Revenue Requirement
Property Taxes – reforecast yearly, deferral of variances2006 forecast of $41.4 million ($1.8M over 2005 approved)
Depreciation and AmortizationDetermined based on approved depreciation rates and amortization period
Other Operating RevenuesReforecast of all items, except Late Payment Revenues (formula-based)
Income TaxesLCT rate is reduced from 0.175% to 0.125% based on the announced phase-out scheduleBC Provincial income tax rate reduction of 1.5% effective July 1, 2005
Debt & Interest RatesUnfunded debt rate is set at 4% based on current outlook for short-term rates$100 million long-term issue (Series 21) on June 30, 2006 at 5.05% coupon rate
Return on Equity (ROE) & Capital Structure9.03% is used in Annual Review advance materials33% equity component
Other 2006 Cost of Service Items
November 10, 20052005 TGI Annual Review 56
Vehicle Lease
BC Hydro has provided vehicle lease and maintenance services to BC Gas (predecessor company to Terasen Gas) since 1988.
BC Hydro advised Terasen Gas of their intent to terminate the current vehicle lease arrangement with Terasen Gas by the end of 2005.
Lease vs. buy economic analysis conducted => lease option determined to be most cost effective for customers.
PHH Arval (PHH) selected to assume the vehicle services that BC Hydro had previously provided.

November 10, 20052005 TGI Annual Review 57
Vehicle Lease
Benefits of going with PHH:
Expertise - PHH is the second largest commercial fleet management company in North America;
Extensive supplier network throughout BC - PHH has over 200 clients in Western Canada with clients in similar service territory as Terasen Gas; and
Expected 2006 operating lease cost under PHH is $111,000 lower than that charged by BC Hydro in 2005. This savings has been fully credited to customers in 2006.

November 10, 20052005 TGI Annual Review 58
Vehicle Lease
BC Hydro’s net book value before tax $8.6 millionPHH’s market value assessment before tax 7.2 millionShortfall before 7% provincial tax $1.4 millionShortfall after 7% provincial tax $1.5 million
Terasen Gas is contractually responsible to pay BC Hydro the $1.4 million plus tax shortfall per Section 7 of the Vehicle Service Agreement dated April 1, 1993 between BC Hydro and Terasen Gas.

November 10, 20052005 TGI Annual Review 59
Vehicle Lease
Differential of $1.4 million plus 7% provincial tax needs to be recovered from Terasen Gas customers as customers have benefited until now by paying lower lease costs.
Deferral treatment proposed for differential with a 3-year amortization period, which represents the remaining useful life of the vehicles.
This recovery proposal is fair since the continuation of the arrangement with BC Hydro would have required Terasen customers to pay for this $1.4 million plus tax.
BCUC Decision dated August 5, 1992 directed Terasen Gas to treat vehicle leases as an operating lease rather than a capital lease. The proposed arrangement preserves the PBR settlement terms whereby operating lease costs are recovered from customers with no mark up similar to gas cost recovery.
Increase in amortization expense is mitigated by the effect of a lower depreciation base that PHH is calculating future depreciation on. This translates into an operating lease cost savings of $111,000 per year.
TGI 2005 Annual Review – Nov. 10/05
2006 Revenue Requirements & Rate Outlook
Tom Loski

November 10, 20052005 TGI Annual Review 61
2006 Revenue Requirement
Summary of 2006 Rate Increase(ROE = 9.03%)
($ Millions)Reasons for Increase
Lower weighted average use rates for Rates 1/2/3/23 $10.2
Higher O&M per formula 3.9
Change in Pension and Insurance forecast 1.5
Higher Property Taxes 1.8
Higher Depreciation and amortization 4.2
Higher Rate Base due primarily to Gas In storage 7.8
Offsetting Decreases
Customer Growth and Industrial Revenue Changes (7.2)
Other Items (4.2)
Sub-total 18.0Earnings Sharing (7.3)
Net Revenue Increase at ROE of 9.03% $10.7

November 10, 20052005 TGI Annual Review 62
2006 Revenue Requirement
$ MillionsRSAM balance at January 1, 2005 $38.95
2005 Projected RSAM Activity:New RSAM additions $10.16RSAM Rider recovery (10.59)RSAM balance decrease (After Tax) ($0.43)
RSAM balance at December 31, 2005 (After Tax) $38.52
For the 9 months ended September 30, 2005, weather in the Terasen Gas service territory has been 4% warmer than normal. 2005 RSAM rider of $0.143 is projected to increase by $0.023/GJ (pre-tax) to $0.166/GJ in 2006, based on 3-year amortization for a pre-tax 2006 total rider of $19.4 million.
RSAM Update

November 10, 20052005 TGI Annual Review 63
Customer Bill Impact (Lower Mainland)
% Bill IncreaseDelivery RSAM ESM Net Bill Increase of Previous
Customers Margin Rider Rider Increase per Annum Annual Bill
Residential $0.151 $0.023 ($0.067) $0.107 $11.49 0.76%
Small Commercial $0.104 $0.023 ($0.052) $0.075 $46.17 0.58%
Large Commercial $0.092 $0.023 ($0.040) $0.075 $251.28 0.61%
General Firm $0.091 n/a ($0.029) $0.062 $624.34 0.52%
P r o p o s e R a t e Change p e r G J

TGI 2005 Annual Review – Nov. 10/05
OTHER INFORMATION PERTAINING TO THE
2004 – 2007 PBR SETTLEMENT

TGI 2005 Annual Review – Nov. 10/05
Customer Care & SQI’s
Danielle Wensink

November 10, 20052005 TGI Annual Review 66
Service Quality IndicatorsSeptember 2005
2004 2005 YTD 2005Performance Indicators Actuals Actuals Target
1 Emergency Response Time - Time Dispatched to Site - Emergency - Blowing Gas
21:36minutes
21:54minutes
<21:06 minutes
2 Speed of Answer – Emergency (% of calls answered within 30 sec.) 97.9% 99.1% >95%
3 Speed of Answer – Non-Emergency (% of calls answered within 30 sec.) 77.5% 77.2% >75%
4 Transmission Reportable Incidents 3 3 <2
5(a) Index of Customer Bills Produced Not Meeting Criteria 1.93 1.87 <5
5(b) Percent of Transportation/Industrial Customer Bills Accurate 96.6% 99.9% >99.5%
6 Meter Exchange Appointment Activity 93.5% 94.6% >92.2%
7 Transportation Meter Measurement First Report < 10% 98.0% 99.6% >90.0%
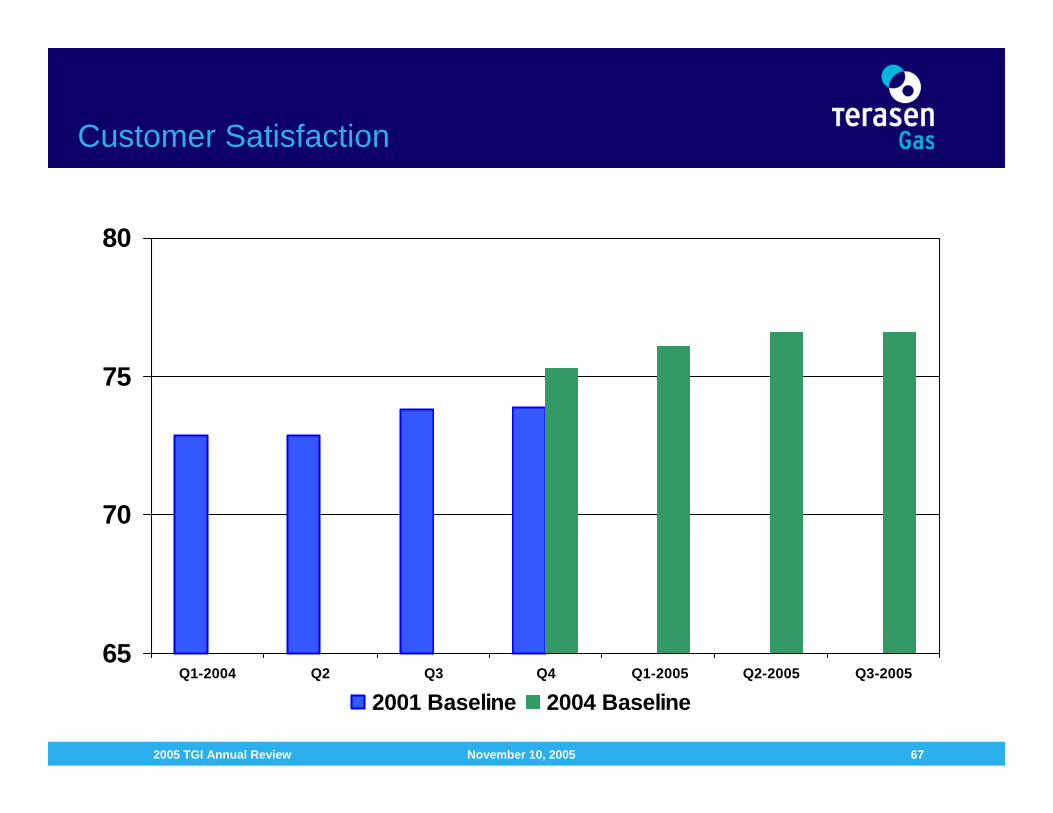
8 Residential & Commercial Customer Satisfaction (Independent Customer Satisfaction Survey) 75.3% 76.6% Compared to
historic trends
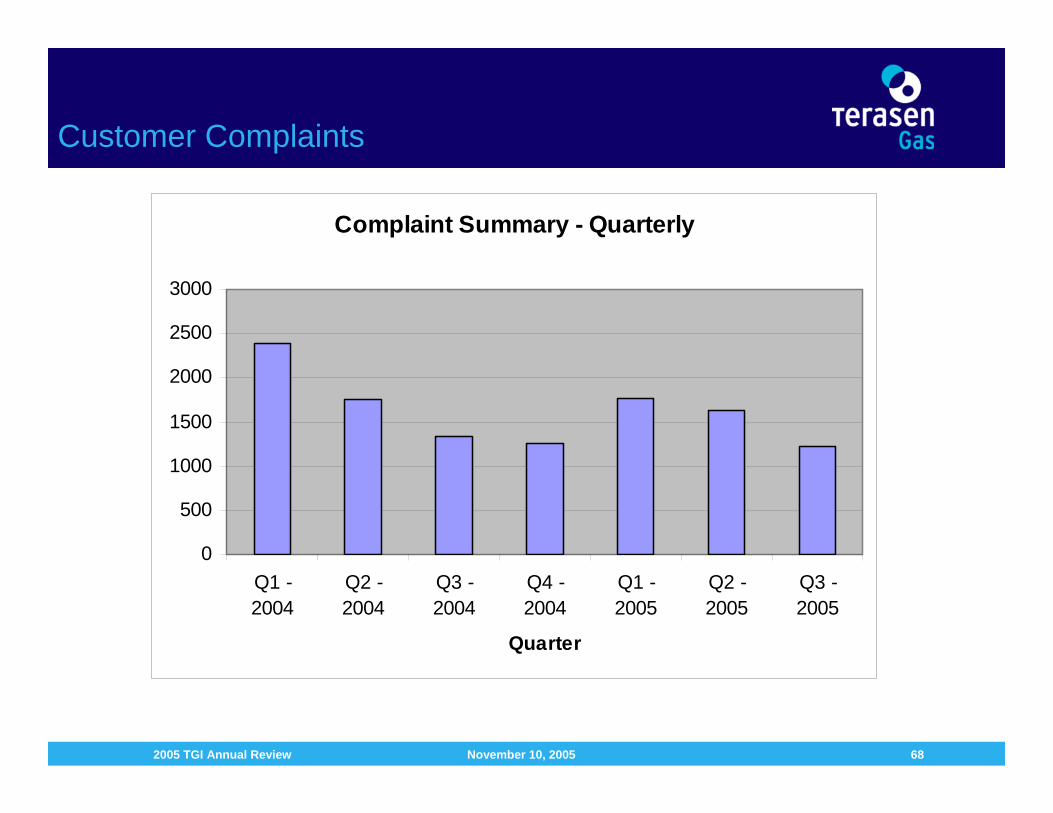
9 Number of Customer Complaints to BCUC 191 94 Compared to historic trends
10 Number of Prior Period Adjustments 18 12 Compared to historic trends
Directional Indicators
1 Leaks per Kilometre of Distribution Mains 0.0045 (150 leaks)
0.0028 (97 leaks)
2 Number of Third Party Distribution System Incidents 1,492 1,118
November 10, 20052005 TGI Annual Review 67
Customer Satisfaction
65
70
75
80
Q1-2004 Q2 Q3 Q4 Q1-2005 Q2-2005 Q3-2005
2001 Baseline 2004 Baseline
November 10, 20052005 TGI Annual Review 68
Customer Complaints
Complaint Summary - Quarterly
0
500
1000
1500
2000
2500
3000
Q1 -2004
Q2 -2004
Q3 -2004
Q4 -2004
Q1 -2005
Q2 -2005
Q3 -2005
Quarter
November 10, 20052005 TGI Annual Review 69
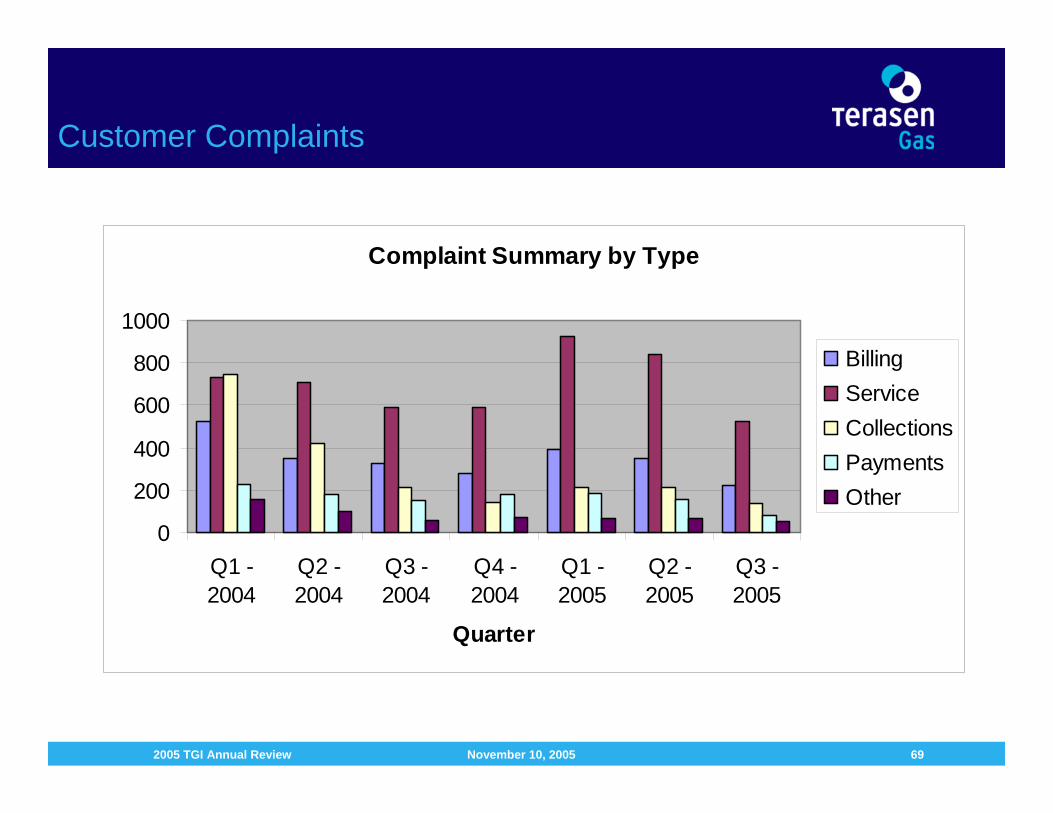
Customer Complaints
Complaint Summary by Type
0
200
400
600
800
1000
Q1 -2004
Q2 -2004
Q3 -2004
Q4 -2004
Q1 -2005
Q2 -2005
Q3 -2005
Quarter
BillingServiceCollectionsPaymentsOther

November 10, 20052005 TGI Annual Review 70
Bad Debt Experience Trend
Improvements in credit & collections processes helped to improve the experience rate in the Interior & manage the transition from BC Hydro in the Lower Mainland since 2002Trend shows improving experience rates to 2005Higher experience rates anticipated in 2006 due to recent commodity increasesCurrent bad debt as a percentage of sales revenue is 0.33%
TGI Net Bad Debt Experience Rates
0.00%
0.10%
0.20%
0.30%
0.40%
0.50%
0.60%
0.70%
0.80%
0.90%
1.00%
1.10%
2001a 2002a 2003a 2004a 2005f 2006f
InteriorCombinedLower Mainland
November 10, 20052005 TGI Annual Review 71
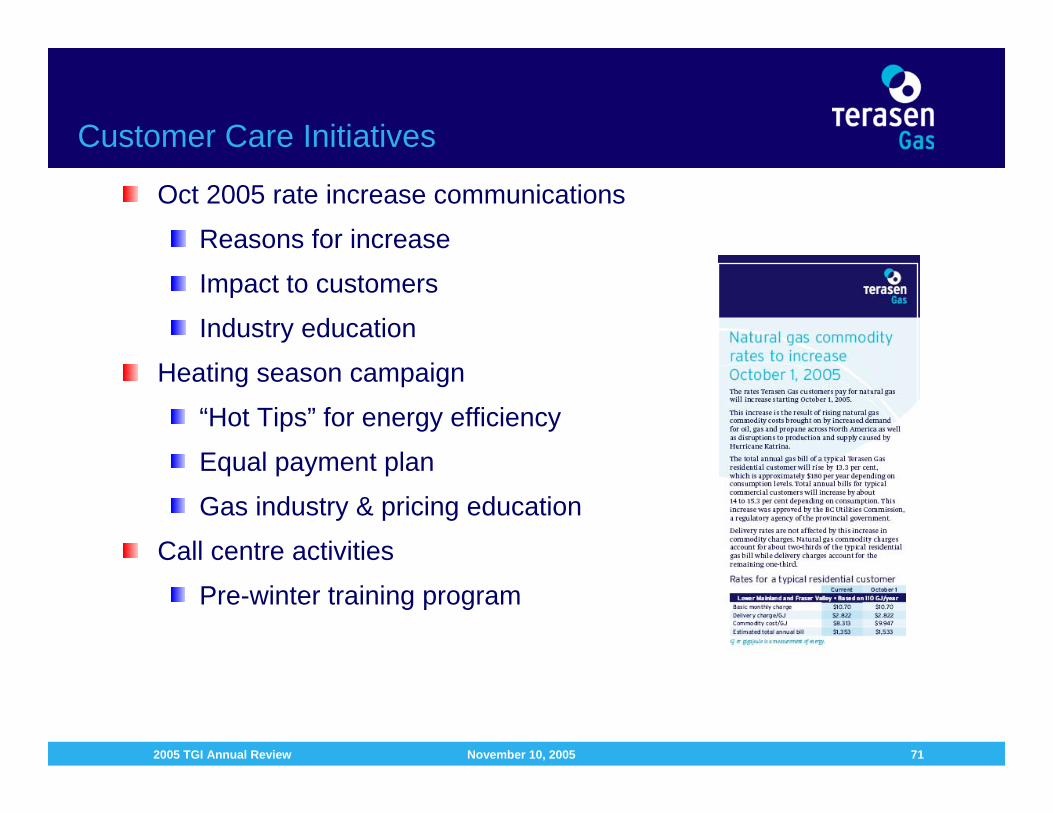
Customer Care Initiatives
Oct 2005 rate increase communications
Reasons for increase
Impact to customers
Industry education
Heating season campaign
“Hot Tips” for energy efficiency
Equal payment plan
Gas industry & pricing education
Call centre activities
Pre-winter training program

TGI 2005 Annual Review – Nov. 10/05
5 Year Major Capital Plan
Dwain Bell

November 10, 20052005 TGI Annual Review 73
Customer Driven Capital 2005 - 2010
Customer Driven CapitalDollars ($millions)
14,40313,57512,90312,27612,69212,676Customer Additions
28.226.524.422.622.623.0Total
4.94.64.23.93.93.8Meters –Customer Additions
15.114.213.112.112.112.8Services
8.27.77.16.66.66.4Mains
2010Forecast
2009Forecast
2008Forecast
2007Forecast
2006Forecast
2005Projected

November 10, 20052005 TGI Annual Review 74
Historical Customer Additions Unit Costs
$0
$200
$400
$600
$800
$1,000
$1,200
$1,400
1997
Actuals
1998
Actuals
1999
Actuals
2000
Actuals
2001
Actuals
2002
Actuals
2003
Actuals
2004
Actuals
2005
YEF
New Services per Service
New Mains per Meter
Meters - New andExchange per Meter

November 10, 20052005 TGI Annual Review 75
Other Regular Capital 2005 – 2010- Cost Projections
83.580.078.675.880.477.3Total Customer Driven and Other Regular Capital
55.353.654.253.257.854.3Other Regular Capital
5.14.85.15.96.46.8Transmission Plant
System Integrity and Reliability:
17.716.816.012.912.313.2Meters – Replacements
11.911.711.413.510.510.0Information Technology (IT)
12.712.412.211.911.711.3Non – IT
Other Capital:
7.97.89.59.016.913.0Distribution Plant
2010Forecast
2009Forecast
2008Forecast
2007Forecast
2006Forecast
2005Projection
Other Regular Capital($millions)

November 10, 20052005 TGI Annual Review 76
Major Capital Projects 2006-2010Scheduling & Cost Projections
2.85.12.4Totals
--1.8--E.6th Ave & Quebec St, Vancouver
--1.0--34B Avenue to 57th Street, Delta
---1.2-Goudy Road and 36th Avenue, Delta
---1.8-72nd Street to 36th Avenue, Delta
---1.1-Riverside Road, Abbotsford
----2.4Secondary Containment
---1.0-Prince George #2 Lateral Loop (TP)
2010Forecast
2009Forecast
2008Forecast
2007Forecast
2006Forecast
Other Regular CapitalTransmission and Distribution Plant
($millions)

November 10, 20052005 TGI Annual Review 77
Major Capital Projects 2006-2010Scheduling & Cost Projections
1.8--4.84.2Totals
---1.6-SCADA System Upgrade
---1.2-IT Infrastructure Network Evergreening
---2.0-SAP Core Application Upgrade
1.8---1.1Desktop and Laptop Refresh
----2.0MobileUP Replacement
----1.1Order Fulfillment Enhancements
2010Forecast
2009Forecast
2008Forecast
2007Forecast
2006Forecast
Other Regular CapitalNon IT and Information Technology (IT)
($millions)

November 10, 20052005 TGI Annual Review 78
Major Capital Projects Subject to CPCN – Cost Projections
15.85.45.321.219.7Totals
15.8Nichol to Port Mann Loop
5.45.35.24.9Vancouver LP System Replacement
16.09.0Residential Unbundling
5.8Mission Bridge IP
2010Forecast
2009Forecast
2008Forecast
2007Forecast
2006Forecast
CPCN Applications(Certificate of Public Convenience
and Necessity)($millions)

November 10, 20052005 TGI Annual Review 79
Low Pressure System Upgrade – Mature Vancouver Neighbourhoods

November 10, 20052005 TGI Annual Review 80
Low Pressure System in Vancouver (in red) (95 km)

TGI 2005 Annual Review – Nov. 10/05
Code of Conduct & Transfer Pricing Policy
Doug Cruickshank

November 10, 20052005 TGI Annual Review 82
Code of Conduct
Governs the relationships between TGI and NRBs for the provision of Utility resources.
Application of Commission PrinciplesShare Services & PersonnelTransfer of Assets or ServicesProvision of InformationPreferential Treatment Equitable Access to ServiceCompliance and ComplaintsFinancing and Other RisksUse of Utility NameDistribution System Access
November 10, 20052005 TGI Annual Review 83
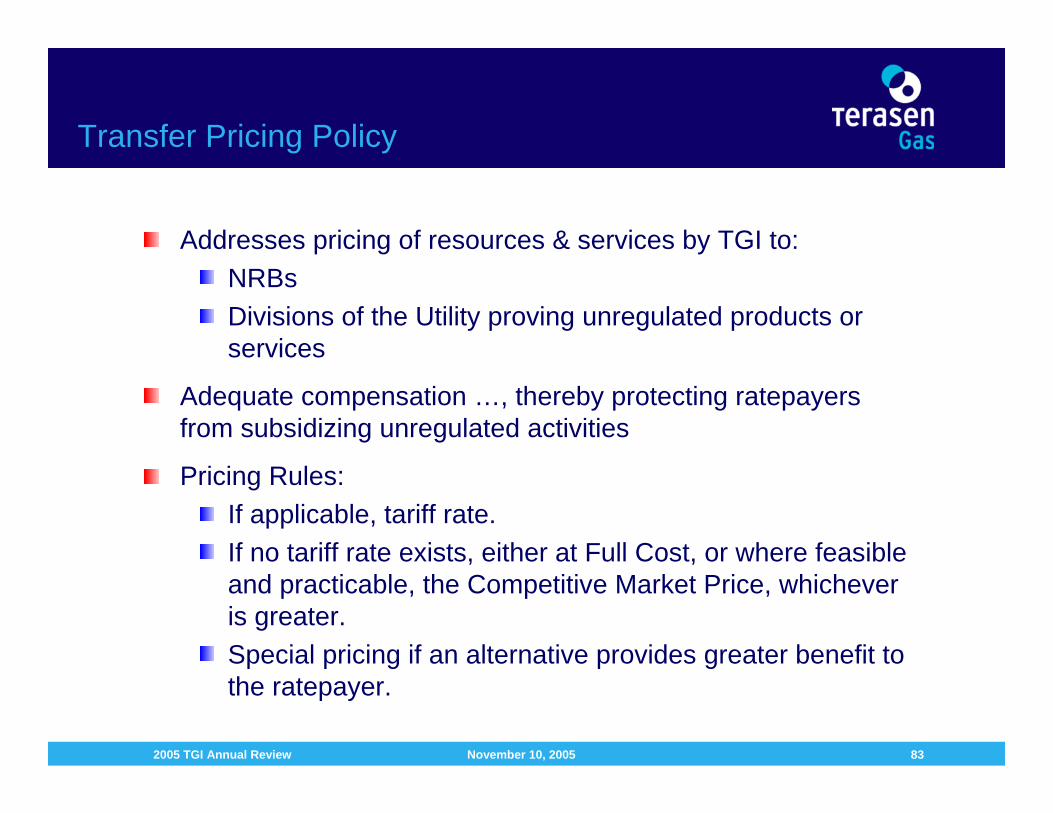
Transfer Pricing Policy
Addresses pricing of resources & services by TGI to:NRBsDivisions of the Utility proving unregulated products or services
Adequate compensation …, thereby protecting ratepayers from subsidizing unregulated activities
Pricing Rules:If applicable, tariff rate.If no tariff rate exists, either at Full Cost, or where feasibleand practicable, the Competitive Market Price, whichever is greater.Special pricing if an alternative provides greater benefit to the ratepayer.
November 10, 20052005 TGI Annual Review 84
Two compliance reviews are conducted in accordance with the Negotiated Settlement:
Internal Audit ServicesExternal Auditors, KPMG LLP
Objectives of IAS Review:To provide assurance that requirements of the Code of Conduct and Transfer Pricing Policies approved by the BCUC are being met.To ensure business processes and internal controls are in place to facilitate and support compliance with these Policies.
Compliance Reviews
November 10, 20052005 TGI Annual Review 85
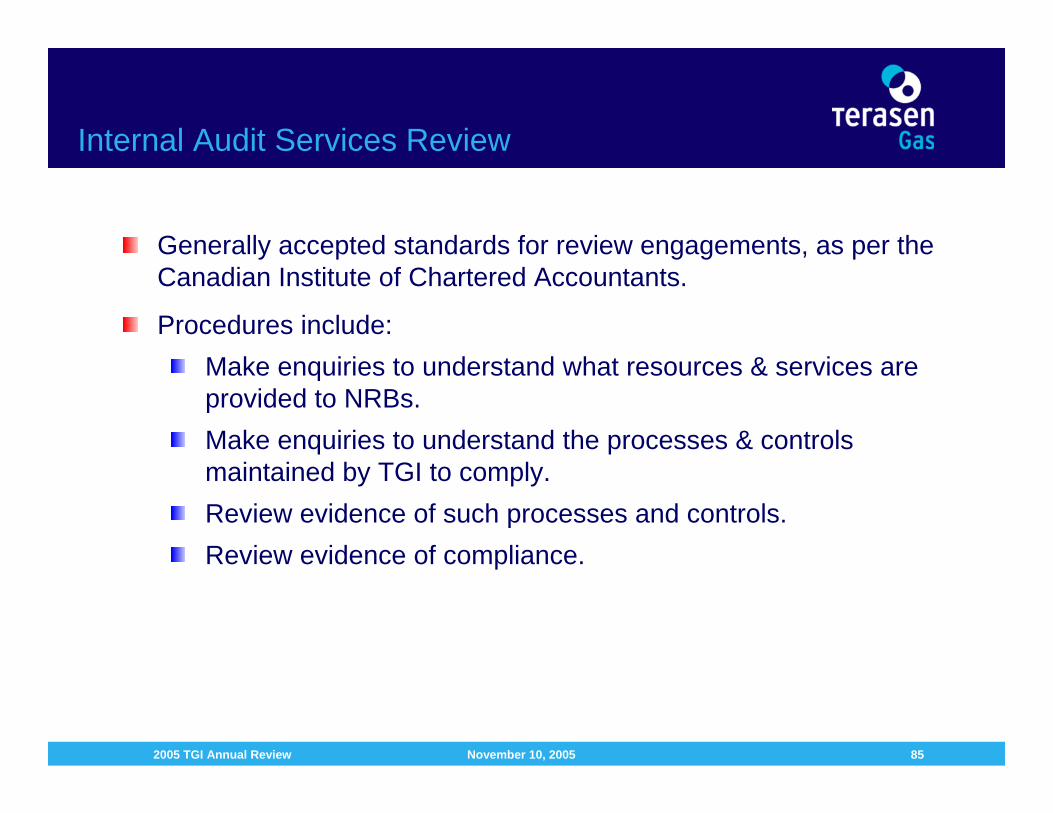
Generally accepted standards for review engagements, as per the Canadian Institute of Chartered Accountants.
Procedures include:Make enquiries to understand what resources & services are provided to NRBs.Make enquiries to understand the processes & controls maintained by TGI to comply.Review evidence of such processes and controls.Review evidence of compliance.
Internal Audit Services Review

November 10, 20052005 TGI Annual Review 86
“Based on my review, nothing has come to my attention that causes me to believe that Terasen Gas Inc. is not in compliance with the Code of Conduct and Transfer Pricing Policy for the period January 1, 2005 to August 31, 2005.”
Signed:Doug Cruickshank, Chartered AccountantSeptember 30, 2005
IAS Report

November 10, 20052005 TGI Annual Review 87
Reviewed TGI’s compliance … for the eight month period ended from January 1, 2005 to August 31, 2005, in accordance with Canadian generally accepted standards for review engagements.
Procedures included a review of the Internal Audit Service report and the work they performed in connection with their report.
External Auditor Report, KPMG LLP
“Based on our review, nothing has come to our attention that causes us to believe that the Company is not in compliance with the Transfer Pricing Policy and Code of Conduct …”
Signed:KPMG LLP, Chartered Accountants
October 7, 2005

TGI 2005 Annual Review – Nov. 10/05
CEO/CFO Certification(MI52-109/111)
Doug Cruickshank
November 10, 20052005 TGI Annual Review 89
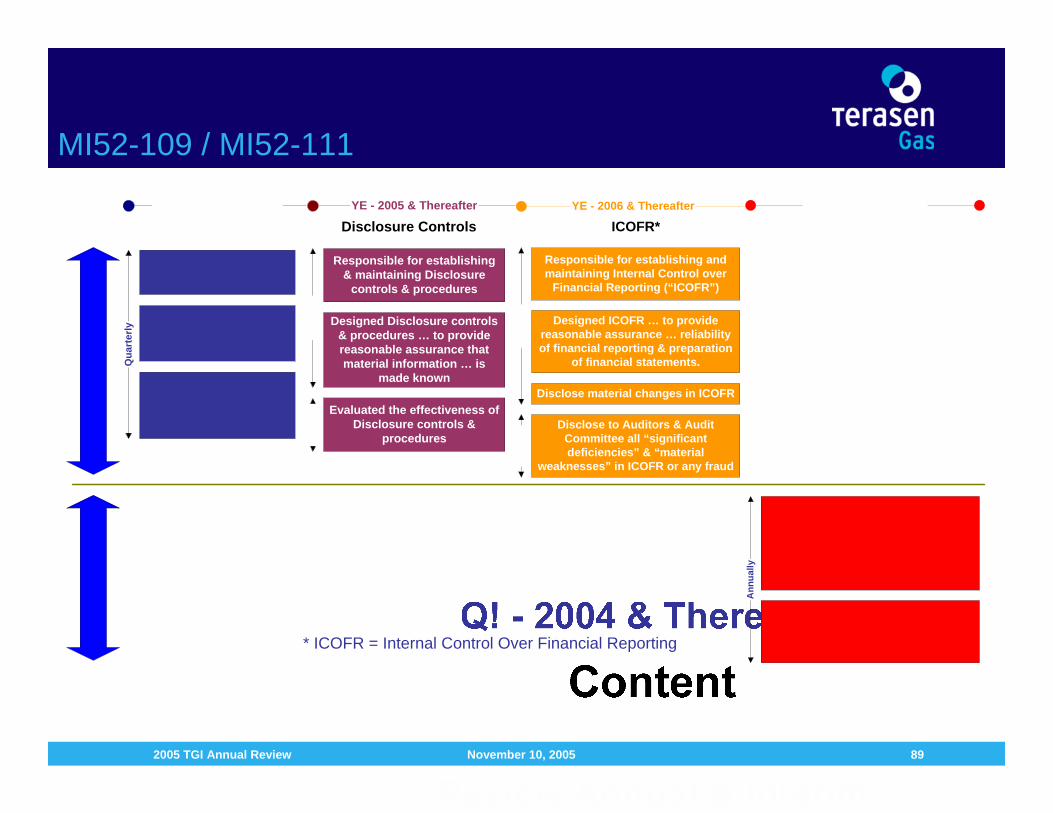
MI52-109 / MI52-111Q
uart
erly
YE - 2005 & Thereafter
Responsible for establishing& maintaining Disclosure
controls & procedures
Designed Disclosure controls& procedures … to providereasonable assurance thatmaterial information … is
made known
Evaluated the effectiveness ofDisclosure controls &
procedures
Disclosure Controls
Ann
ually
* ICOFR = Internal Control Over Financial Reporting
YE - 2006 & Thereafter
Responsible for establishing andmaintaining Internal Control over
Financial Reporting (“ICOFR”)
Designed ICOFR … to providereasonable assurance … reliabilityof financial reporting & preparation
of financial statements.
Disclose material changes in ICOFR
Disclose to Auditors & AuditCommittee all “significantdeficiencies” & “material
weaknesses” in ICOFR or any fraud
ICOFR*
TGI 2005 Annual Review – Nov. 10/05
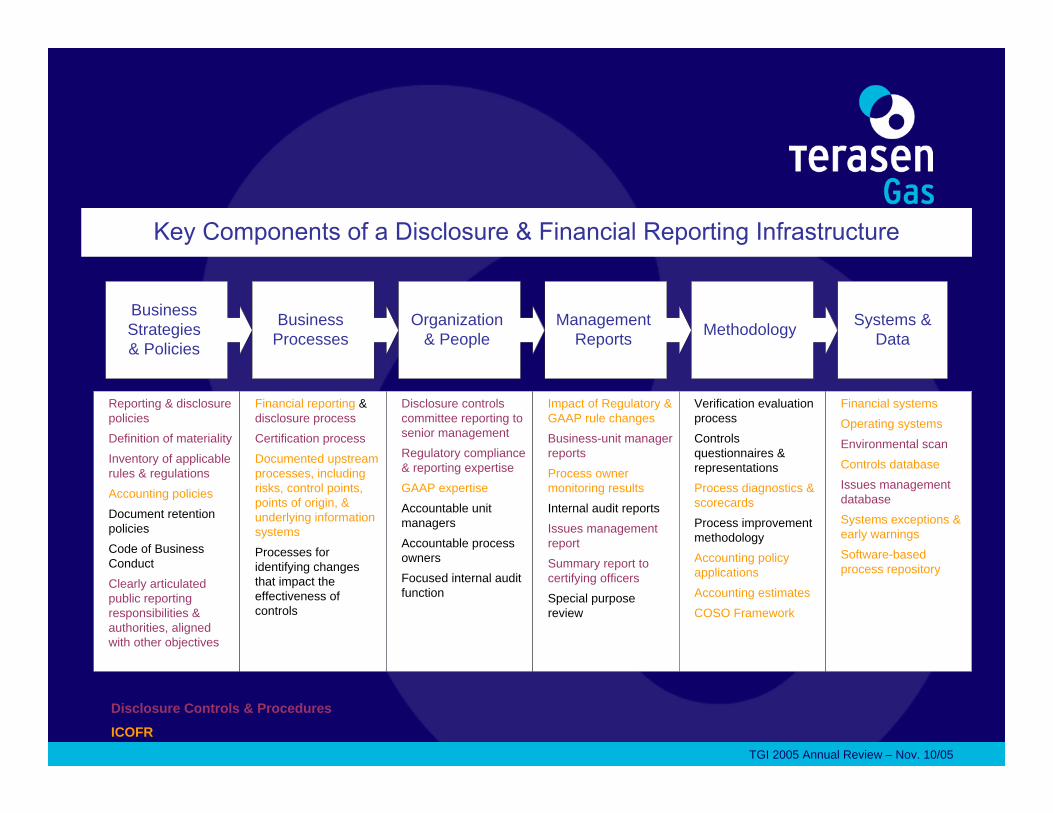
Business Strategies & Policies
Business Processes
Organization & People
Management Reports Methodology
Reporting & disclosure policiesDefinition of materialityInventory of applicable rules & regulationsAccounting policiesDocument retention policiesCode of Business ConductClearly articulated public reporting responsibilities & authorities, aligned with other objectives
Financial reporting & disclosure processCertification processDocumented upstream processes, including risks, control points, points of origin, & underlying information systemsProcesses for identifying changes that impact the effectiveness of controls
Disclosure controls committee reporting to senior managementRegulatory compliance & reporting expertiseGAAP expertiseAccountable unit managersAccountable process ownersFocused internal audit function
Impact of Regulatory & GAAP rule changesBusiness-unit manager reportsProcess owner monitoring resultsInternal audit reportsIssues management reportSummary report to certifying officersSpecial purpose review
Verification evaluation processControls questionnaires & representationsProcess diagnostics & scorecardsProcess improvement methodologyAccounting policy applicationsAccounting estimatesCOSO Framework
Financial systemsOperating systems
Environmental scanControls databaseIssues management databaseSystems exceptions & early warningsSoftware-based process repository
Systems & Data
Disclosure Controls & Procedures
ICOFR

November 10, 20052005 TGI Annual Review 91
ICOFR
ICOFR covers:
Initiating, authorization, recording, processing & reportingsignificant accounts & disclosures and related financial statement assertions
Non-routine and non-systematic transactions
Selection & application of appropriate accounting policies
Anti-fraud programs and controls
Controls, including IT general controls, on which other controls are dependent
Period-end processes
Controls that have a pervasive impact (tone-at-the-top)
November 10, 20052005 TGI Annual Review 92
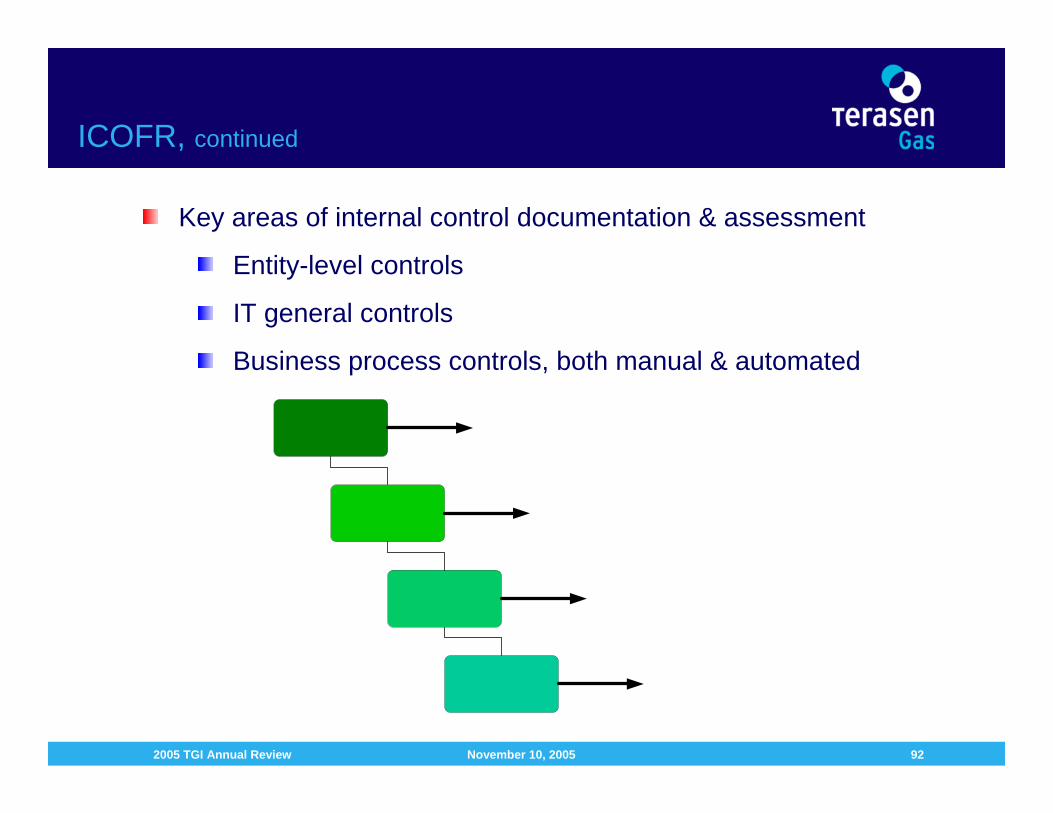
ICOFR, continued
Key areas of internal control documentation & assessment
Entity-level controls
IT general controls
Business process controls, both manual & automated

November 10, 20052005 TGI Annual Review 93
Timeline Summary
Com
plia
nce
Cer
tific
atio
n

November 10, 20052005 TGI Annual Review 94
Compliance Costs
Forecast2004 2005 2006
External Fees - DeloitteInitial Bare Certification 36,000$ -$ -$ Scoping, Planning, Disclosure Processes 119,565 - - Financial Reporting Processes 128,565 157,320 - Admin Fee (5%) 14,600 8,280 -
External Fees - KPMGProject Steering Committee 11,250 11,250 -
Incremental Internal CostsResourcing 44,166 190,800 253,125 Other** 35,400 11,250 72,000
SAS70 Style Control Reports - - 112,500
Attestation - External Audit - - 90,000
Budgeted Total 389,546$ 378,900$ 527,625$
Actual Total*** 200,888$ 413,325$
* Adjusted to be for Terasen Gas Inc. only** Sustainment Tool Implementation / Licencing / Maintenance / Support, Travel, Admin, Contingency
*** 2005 Projected Actual Total
2004 Annual Review*
November 10, 20052005 TGI Annual Review 95
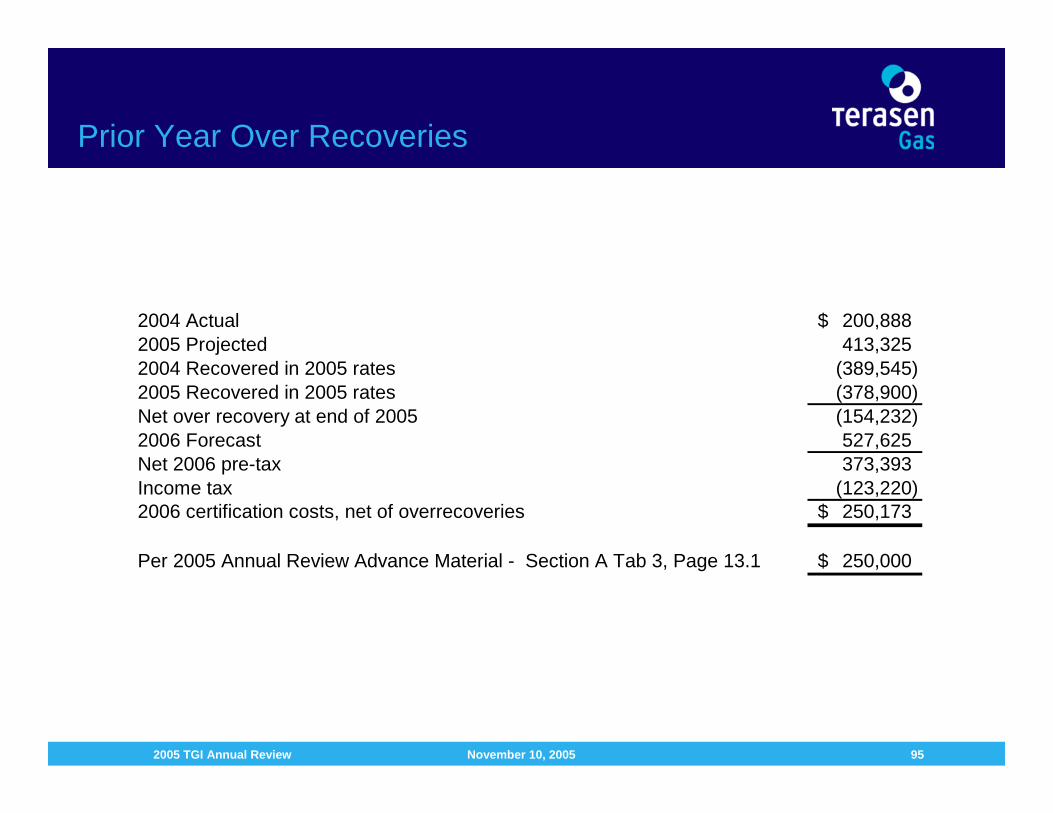
Prior Year Over Recoveries
2004 Actual 200,888$ 2005 Projected 413,325 2004 Recovered in 2005 rates (389,545) 2005 Recovered in 2005 rates (378,900) Net over recovery at end of 2005 (154,232) 2006 Forecast 527,625 Net 2006 pre-tax 373,393 Income tax (123,220) 2006 certification costs, net of overrecoveries 250,173$
Per 2005 Annual Review Advance Material - Section A Tab 3, Page 13.1 250,000$

TGI 2005 Annual Review – Nov. 10/05
Wrap Up