Tension Varition During Splicing
28
To Reduce Tension variation during splicing BILT GRAPHIC PAPER PRODUCT LIMITED Unit: Bhigwan SIX SIGMA project presented by VIKAS KUMA
-
Upload
pragyandxb -
Category
Documents
-
view
227 -
download
0
description
ten
Transcript of Tension Varition During Splicing

To Reduce Tension variation during splicing
BILT GRAPHIC PAPER PRODUCT LIMITEDUnit: Bhigwan
SIX SIGMA project presented by VIKAS KUMAR

TO REDUCE Tension Varition DURING SPLICING-
BLACK BELT – Name: Vikas Kumar Dept :Coating plant Location : BHIGWAN PUNE Brief Job description : during splicing
process web is moving , up 2.5cm movement paper not breaks but when ites cross more than 2.5cm paper breaks at rewind station its chance to break the paper.(As we are trimming the edges at rewind )
Champion: Dilip Wadodkar , Raghavendra Hebbar
Team Members: Ajit Dubey, Sanjay Bhoite, Rama Krishana, Hemant Kale, Nitin Patil, Karson, DSN , Nagbhusan.
Project description: To reduce tension drop during splicing in omc.
Project scope: To reduce tension drop during splicing in omc.
Business Case: 6 breaks per month and 4hrs loss in omc.
Project start / Estimated end: JAN 2011- July 2011.
PROJECT STATUS-
Project detail-
Define
Measure
Analysis
Improve.
Control
Close
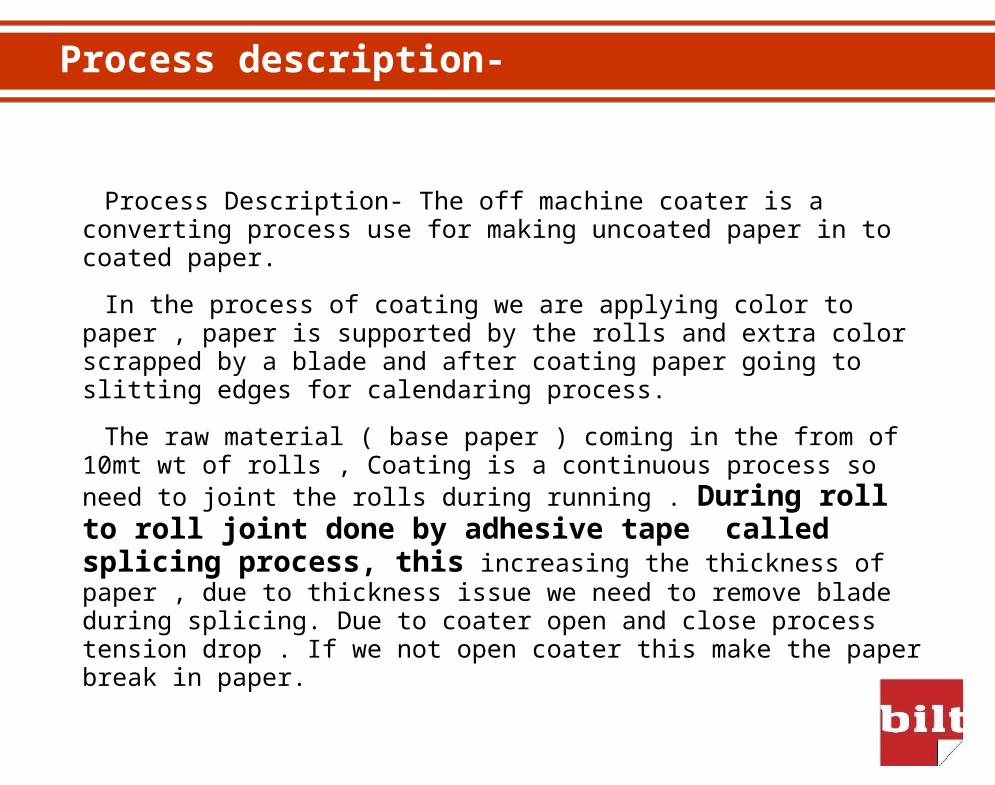
Process description-
Process Description- The off machine coater is a converting process use for making uncoated paper in to coated paper.
In the process of coating we are applying color to paper , paper is supported by the rolls and extra color scrapped by a blade and after coating paper going to slitting edges for calendaring process.
The raw material ( base paper ) coming in the from of 10mt wt of rolls , Coating is a continuous process so need to joint the rolls during running . During roll to roll joint done by adhesive tape called splicing process, this increasing the thickness of paper , due to thickness issue we need to remove blade during splicing. Due to coater open and close process tension drop . If we not open coater this make the paper break in paper.

Backing roll
Applicator roll
Coater pan
Coater blade
Paper
Paper Coating process-
color

Project Charter
The purpose of this six sigma project to reduce the WEB MOVEMENT problem in coating machine pm1. We are facing web movement problem in coating machine from last 13years, causing web breaks in coating machine , deckle marking in filled rolls , deckle marking in papers .Web breaks contributes loss of energy, paper , machine equipment and quality .
We had carried load cell calibration from ABB even though this problem still persist with our machine.During commissioning of PM2 we have also called VOITH expert to solve this problem but they could not address web movement problem.
As the web breaks frequency of web movement is experienced intermittently hence we were unable to conclude the reason of the problem.Our aim to taking six sigma project under guidance of ISI to under stand the contributing factors for web movement factors.
We have taken this cross functional project under guidance and support of Mr I.N.Guha (Unit Head), Mr Dilip Wadodkar (GM ENGG) & Mr Raghavendra Hebbar (PROCESS HEAD).

ROLE AND RESPONSIBILITY-BLACK Belt(VIKAS KUMAR)
Review purpose of project.Draft the charter.Finalize team member.
Manage schedule.Lead meeting.Keep records.Lead team work.
See the doc .Update the lessons captured.Monitor the implementation. .Monitor the results.Use the improve methods.
Team member-Ajit Dubey, Sanjay Bhoite, Hemant Jain(ELECT) ,Hemant Kale , Sujeet Mhetre(MECH), Nitin Patil, DSN, Nagbhusan, Karson Kulkarni.(Process dept)
Participate in meeting.Carry out assignments.Assist in piloting.Contribute knowledge and expertise.Learn necessary skills and methods.
Use of improve methods.

NO OF BREAKS DUE TO WEB MOVEMENT TREND-
SIX SIGMA PROJECT START FROM JAN11

SIPOC
Color Kithen
PAPER MACHINE
COATER PROCESS MAINTANCE
COATING COLOR
BASE PAPER
COATER cylinder
COATER BLADE
COATING
PROCESS
COATED PAPER FINISHING HOUSE
MANAGEMENT
BASE PAPER
COATER CONSUM
ABLE
COATING COLOR
COATING APPLICATI
ON
COATED PAPER

Identification of CTQ:
.Need of customer
CTQ Measurement Defect definition
Less rework Tension difference during splicing.
Through load cell. Tension drop more than 120N in coater.
As we can measure only tension , the web movement we can only observed we don’t have man power to record this but the web movement directly proportional to tension drop so we consider this measurable unit as a CTQ. Up to 120N tension drop max web movement is 2.5cm .
If tension drop more than 120 N then this web movement crosses more than 2.5 cm web movement converting to passable breaks.

Fish bone diagram-
Tension drop/Variation
Gsm of paper. Speed of machine.
LOAD CELL. Dryer load.
Dryer mech condition.Blade thickness.
Blade setting.
Base smoothness.Cobb of paper. Hydraulics pressure.
Screen tension.
Applicator & backing roll gap.
SPEED DIFFBacking roll load
Screen tension

Priority Matrix: OUT PUT VARIABLES(WEB MOVEMENT)
S.N INPUT VARIABLES(X) 1 2 3 4 5 TOTAL
1 Speed of machine. 5 4 6 4 4 23
2 LOAD CELL. 2 4 6 4 3 19
3 Dryer load. 8 8 9 7 8 40
4 Dryer mech condition. 7 6 7 8 8 36
5 Blade thickness. 5 6 5 6 7 29
6 Blade setting. 7 7 6 5 4 29
7 Base smoothness. 4 4 5 6 6 25
8 Cobb of paper. 4 5 4 5 5 23
9 Gsm of paper. 4 5 4 5 5 23
10 Hydraulics pressure. 6 6 4 5 5 26
11 Screen tension. 6 7 8 4 5 30
12 Applicator & backing roll gap.
5 6 6 6 629
13 TENSION VALUE 5 5 4 6 3 23
14 SPEED DIFF 5 6 6 7 6 30
15 Backing roll load 8 6 4 8 4 30
By the basis of team
view(numbering from 1 to 10
scale)

Data collection plan-
After priority matrix we decide to collect data on shift wise basis , in every shift process operator and shift in charge collection data in once every 8hrs , in the mid time of the shift , tension drop data and speed difference data collected by electrical dept .
Six sigma team decide to collect data up to 45 day .

date cylinder load backing roll load hydrulic blade pentration gap angle speed gsm base
smoothness cobb sk Tension dropDiff between
backing roll and cylinder group.
01-01-2011a 2 11 130 2d 3.3 0.9 27.5 950 130 6.7 38 7 90 -1.2
01-01-2011b 1 12 128 2d 3.3 0.9 28.5 950 130 6.7 34 7 90 -1.2
01-01-2011c 14 12 130 2d 3.3 0.9 27 950 130 6.7 34 7 110 -1.2
02-01-2011a 2 20 130 2d 4 0.9 26 830 170 6.8 32 7 230 -1
02-01-2011b 8 20 130 2d 4 0.9 26 830 170 6.8 45 7 180 -0.5
02-01-2011c 1 20 130 2d 4 0.9 26 830 210 6.8 227 7 170 -2
03-01-2011a 2 20 128 2d 4 0.9 26 830 210 7.1 227 7 180 -1
03-01-2011b 4 21 130 2d 4.2 0.9 25.5 830 210 6.9 224 7 250 -2
03-01-2011c 4 19 130 2d 4.4 0.9 26 583 300 6.7 220 7.5 330 1.8
04-01-2011a 4 9 130 2d 3.4 0.9 26 570 300 6.7 227 7.5 120 -2.5
04-01-2011b 2 12 130 2d 3.5 0.9 26 570 300 6.8 224 7.5 110 -0.9
04-01-2011c 8 21 128 2d 4.4 0.9 26 583 300 6.8 227 7.5 270 -1.5
05-01-2011a 12 20 130 2d 4 0.9 26 583 300 6.8 230 7.5 290 -1
05-01-2011b 8 18 130 2d 4 0.9 26 548 300 7.1 227 7.5 174 -2.5
05-01-2011c 8 21 128 2d 4 0.9 26 548 300 6.9 227 7.5 270 -2.1
06-01-2011a 6 14 128 2d 3.5 0.9 26 548 300 6.7 227 7.5 310 3.9
06-01-2011b 18 18 128 2d 4 0.9 26 533 300 6.8 227 7.5 230 2
06-01-2011c 3 10 130 2d 3.3 0.9 26 480 300 6.8 227 7.5 80 -0.7
07-01-2011a 3 11 130 2d 3.3 1.2 30 520 300 6.8 227 5.2 80 -0.7
07-01-2011b 3 11 128 2d 3.3 1.2 28.77 729 250 7.1 227 4.5 90 -1
07-01-2011c 4 12 128 2d 3.3 1.2 27 728 250 6.9 227 6.2 80 -1
08-01-2011a 44 18 128 2d 4 1.2 27 727 250 6.7 227 7.2 288 0.5
08-01-2011b 3 11 128 2d 3.3 1.2 28.9 735 250 6.7 232 7 110 -0.8
08-01-2011c 7 18 130 2d 4 1.2 28.9 735 250 6.8 230 6 180 -0.4
Data collection - (shift wise)

Analysis of data-
Process is stable-

Distribution ID Plot for Tension dropDescriptive Statistics
N N* Mean StDev Median Minimum Maximum Skewness Kurtosis
117 0 178.607 84.4106 160 60 370 0.533067 -1.00791
Goodess of Fit Test
Distribution AD P LRT P
Normal 3.490 <0.005
Lognormal 2.006 <0.005
3-Parameter Lognormal 1.849 * 0.097
Exponential 15.282 <0.003
2-Parameter Exponential 3.438 <0.010 0.000
Weibull 2.490 <0.010
3-Parameter Weibull 1.519 <0.005 0.000
Smallest Extreme Value 4.803 <0.010
Largest Extreme Value 2.564 <0.010
Gamma 2.257 <0.005
3-Parameter Gamma 1.487 * 0.001
Logistic 3.272 <0.005
Loglogistic 2.110 <0.005
3-Parameter Loglogistic 1.932 * 0.023
As all the p value is less than 0.05 we conclude it doesn’t fit any theoretical distribution.
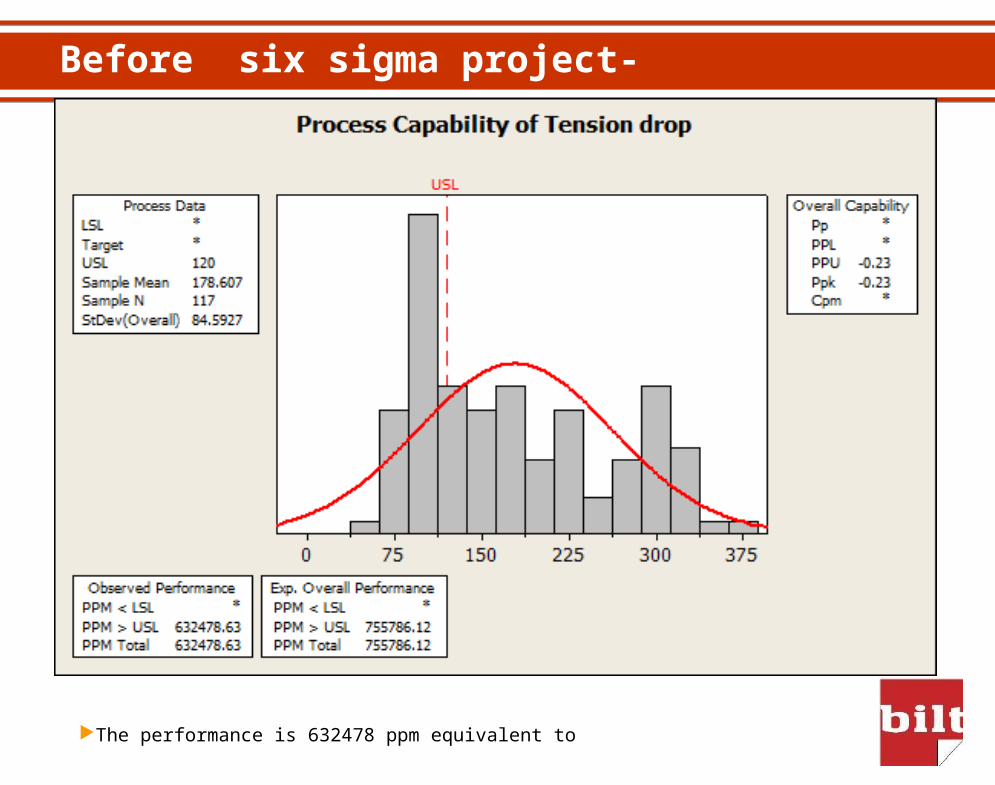
Before six sigma project-
The performance is 632478 ppm equivalent to

Analysis of data- Regression Analysis: Tension drop versus Diff between, cylinder loa, ...
The regression equation is
Tension drop = 65 + 11.7 Diff between backing roll and c + 0.509 cylinder load + 1.16 backing roll load - 1.82 hydrulic + 120 pentration - 24.7 gap - 0.141 speed - 0.015 gsm + 3.2 base smoothness - 0.228 cobb + 5.39 sk
Predictor Coef SE Coef T P VIFConstant 65.0 457.6 0.14 0.887
Diff between backing roll and c 11.695 3.349 3.49 0.001 1.0
Cylinder load 0.5092 0.7071 0.72 0.473 1.2
Backing roll load 1.156 2.229 0.52 0.605 7.0
Hydrulic -1.823 3.070 -0.59 0.554 1.1
Pentration 120.32 24.34 4.94 0.000 7.7
Gap -24.70 41.50 0.60 0.553 1.5
Speed -0.14050 0.08668 -1.62 0.108 15.1
Gsm -0.0153 0.2449 -0.06 0.950 17.9
Base smoothness 3.22 18.76 0.17 0.864 1.8Cobb -0.22820 0.09428 -2.42 0.017 4.3
Sk 5.387 7.136 0.75 0.452 3.9
S = 43.2262 R-Sq = 76.3% R-Sq(adj) = 73.8% The vif greater than 5 in 4 cases i.e., multicolinertiy exist.
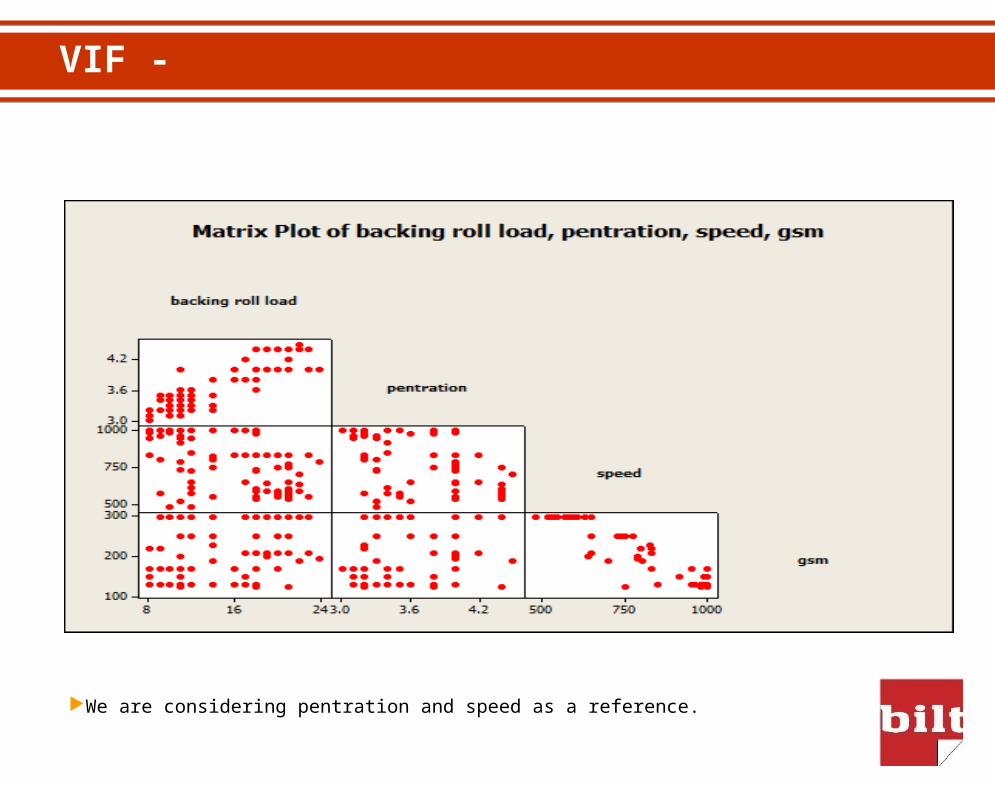
VIF -
We are considering pentration and speed as a reference.
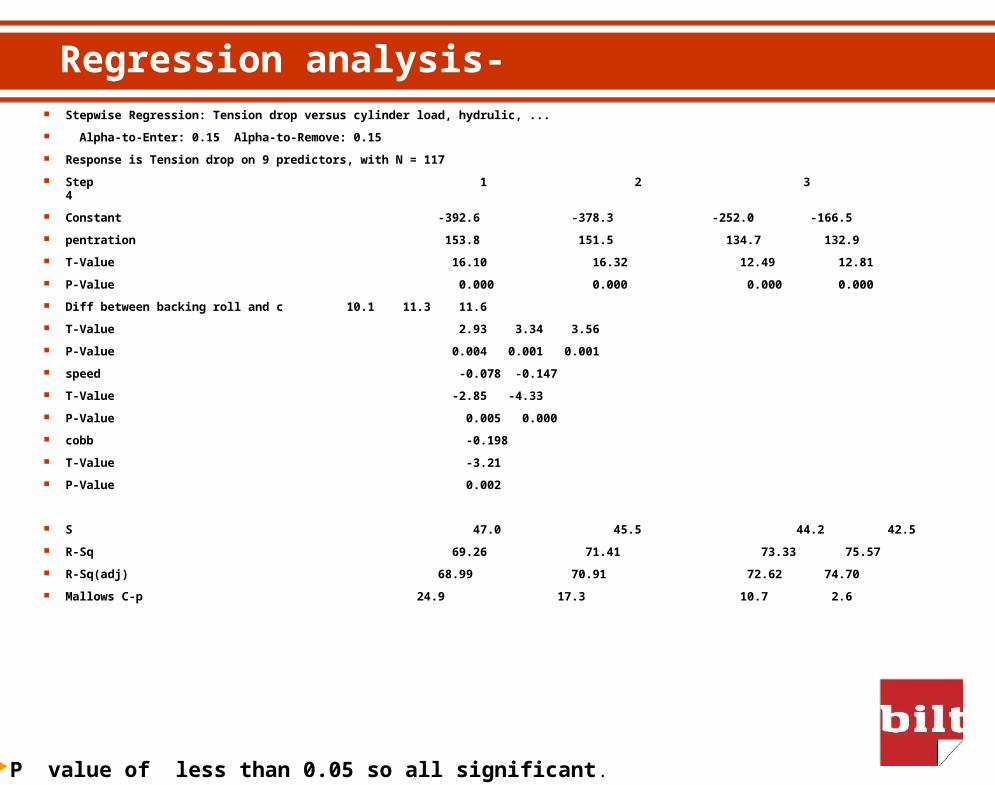
Regression analysis- Stepwise Regression: Tension drop versus cylinder load, hydrulic, ... Alpha-to-Enter: 0.15 Alpha-to-Remove: 0.15 Response is Tension drop on 9 predictors, with N = 117 Step 1 2 3 4 Constant -392.6 -378.3 -252.0 -166.5 pentration 153.8 151.5 134.7 132.9 T-Value 16.10 16.32 12.49 12.81 P-Value 0.000 0.000 0.000 0.000 Diff between backing roll and c 10.1 11.3 11.6 T-Value 2.93 3.34 3.56 P-Value 0.004 0.001 0.001 speed -0.078 -0.147 T-Value -2.85 -4.33 P-Value 0.005 0.000 cobb -0.198 T-Value -3.21 P-Value 0.002
S 47.0 45.5 44.2 42.5 R-Sq 69.26 71.41 73.33 75.57 R-Sq(adj) 68.99 70.91 72.62 74.70 Mallows C-p 24.9 17.3 10.7 2.6
P value of less than 0.05 so all significant.

Regression analysis-
Regression Analysis: Tension drop versus pentration, Diff between, ... The regression equation is
Tension drop = - 166 + 133 pentration + 11.6 Diff between backing roll and c - 0.147 speed - 0.198 cobbPredictor Coef SE Coef T PConstant -166.49 59.89 -2.78 0.006pentration 132.89 10.38 12.81 0.000Diff between backing roll and c 11.608 3.256 3.56 0.001
Speed -0.14667 0.03389 -4.33 0.000cobb -0.19797 0.06177 -3.21 0.002
S = 42.4597 R-Sq = 75.6% R-Sq(adj) = 74.7%
Analysis of Variance
Source DF SS MS F PRegression 4 624602 156150 86.61 0.000Residual Error 112 201916 1803Total 116 826518
AS P- VALUE 0F ALL FOUR LESS THAN 0.05 SO ALL ARE SIGNIFICANT TO TENSION VARIATION.
As cobb value can not be reduce because of cost factor ,And speed of the machine can not increase because of machine design problem .

Tension drop before six sigma project-
Data shows normal.

DATA ANALYSIS AND VARIFICATION PLAN-
DURING BRAINSTROMING WE DECIDED TO CHECK DRYER CYLINDER CONDENSATE REMOVAL SYSTEM , AFTER CHECKING WE FOUND THAT CONDENSATE REMOVAL SYSTEM HAVE PROBLEM AND SERVICING REQUIRED.
SPEED DIFF ATTENDED BY ELECT DEPT WHEN REQUIRED.
PENTRATION on higher side this will crate tension drop problem in coater head so we decide to maintane it near to 3 to 3.5 value.
NOW WE DECIDED TO MONITER THIS PROBLEM IN ALL COATER SECTIONS.

Action plan-
Problem REASON ACTION TAKEN Responsible dept1. SPEED DIFFERENCE.
AOS PROBLEM CHANGE THE SCALING.
Electrical.
2. LOAD DIFFANCE.
SYPHEN PROBLEM.
SYPHEN TO BE MAKE ALRIGHT DURING SHUT.
Mechanical.
STEAM PRESSURE PROBLEM.
CHECK STEAM PRESSURE.
Power plant.
3.PENTRATION. HIGH LOAD ON BACKING ROLL.
1. USE LOW THICKNESS BLADE.
2. REDUCE PENETRATION.(keep less than 3.5 max)
OMC dept.

After six sigma project-

Difference after and before six sigma project-
Before the six sigma project STDEV of the process was 87 , after six sigma project 13.5 .
After the project we are not observed any nonconformity.

Web break during splicing after six sigma project-
All above data showing month wise breaks .

Are the customer satisfied.
After SIX SIGMA project trend shows reduction of WEB MOVEMENT.
TOTAL NO OF BREAK SAVED- 4NOS PER MONTH.TOTAL SAVING PER BREAKS – 20000INR PER BREAKS. AFTER SIX SIGMA PROJECT – 80000INR PER MONTH.YEARLY SAVING- 960000INR PEY YEAR.

Thanks