Temporary Assistance for Needy Families (TANF): …/67531/metadc795456/m1/1/high... · Temporary...
47
Temporary Assistance for Needy Families (TANF): Financing Issues Gene Falk Specialist in Social Policy September 8, 2015 Congressional Research Service 7-5700 www.crs.gov R44188
Transcript of Temporary Assistance for Needy Families (TANF): …/67531/metadc795456/m1/1/high... · Temporary...

Temporary Assistance for Needy Families
(TANF): Financing Issues
Gene Falk
Specialist in Social Policy
September 8, 2015
Congressional Research Service
7-5700
www.crs.gov
R44188

Temporary Assistance for Needy Families (TANF): Financing Issues
Congressional Research Service
Summary The Temporary Assistance for Needy Families (TANF) block grant provides grants to states,
Indian tribes, and territories to help them fund a wide range of benefits and services for needy
families with children. It was created in the 1996 welfare reform law, which rewrote the rules for
cash assistance programs for these families. The 1996 law also created TANF as a broad-purpose
block grant with state flexibility to design programs to address both the effects of and root causes
of childhood economic disadvantage.
TANF funding is based on the amount of federal and state expenditures in its predecessor
programs (Aid to Families with Dependent Children (AFDC), and related programs) in the early
to mid-1990s. The bulk of federal TANF funds is in a basic block grant. Both the national total of
the basic block grant, $16.5 billion per year, and each state’s grant are based on federal funding in
the predecessor programs during this period. States must also expend a minimum amount of their
own funds on TANF or TANF-related programs under the maintenance of effort (MOE)
requirement. That minimum totals $10.4 billion per year. The MOE is based on state expenditures
in the predecessor programs in FY1994. Over time, states have received some extra TANF
funding: welfare-to-work grants, contingency funds, supplemental grants, and bonus funds.
However, these grants were small relative to the basic block grant and MOE funding.
The cash assistance caseload declined substantially in the late 1990s from its 1994 peak, resulting
in a decline in spending on TANF basic assistance. In FY1995, under TANF’s predecessor
programs, AFDC cash assistance represented 70% of total expenditures in the programs
consolidated into TANF. By FY2000 cash assistance had declined to 40% of total TANF and
MOE funds; in FY2014 cash assistance represented 26% of all TANF and MOE funds. TANF
also provides funds for state-subsidized child care programs ($5.1 billion or 16% of total FY2014
TANF and MOE funds) as well as a wide range of services, including those addressing child
abuse and neglect and pre-kindergarten programs.
Most of TANF’s financing issues relate to its fixed level of funding, based on programs and
conditions that existed in the early and mid-1990s. Neither the national total funding level nor
each state’s level of funding has been adjusted for changes since then, such as inflation, the size
of the cash assistance caseload, or changes in the poverty population. From FY1997 through
FY2014, the TANF block grant lost 32% of its value due to inflation alone. The TANF allocation
“locked in” historical differences among the states that resulted in a wide range of funding levels
relative to the number of poor children. Further, TANF potentially lacks a source of sufficient
additional funding in case of a future economic downturn. Should Congress seek to address these
issues, it would do so in the context of budget rules that apply to TANF as a mandatory program
with fixed funding. Current budget rules would require legislation to increase TANF funding to
contain corresponding offsets by reducing other mandatory funds and/or increasing revenues.

Temporary Assistance for Needy Families (TANF): Financing Issues
Congressional Research Service
Contents
Introduction ..................................................................................................................................... 1
TANF Funding and History ............................................................................................................. 1
Financing the Pre-TANF Programs ........................................................................................... 1 The 1996 Law: “Freezing” Historical Funding Levels in the Basic TANF Block Grant .......... 3 Additional Federal Funds .......................................................................................................... 6 The State Maintenance of Effort (MOE) Requirement ............................................................. 9
How States May Use TANF Funds ................................................................................................. 9
Federal Funds Expended Under TANF ..................................................................................... 9 Transfers of Federal Funds ...................................................................................................... 10 Reservation of Unused Funds ................................................................................................. 10 Expenditures Countable Toward the Maintenance of Effort (MOE) Requirement ................. 10
How States Have Used TANF Funds ............................................................................................. 11
Selected TANF Financing Issues ................................................................................................... 12
The Budget Baseline and TANF ............................................................................................. 12 The Impact of Inflation on the Block Grant ............................................................................ 13 Funding Based on the TANF-Relevant Population ................................................................. 14 The Allocation of Federal TANF Funds among the States ...................................................... 16 Recessions and the TANF Block Grant ................................................................................... 17
TANF Reserve Funds ........................................................................................................ 17 The TANF Contingency Fund ........................................................................................... 18
Uses of TANF Funds ............................................................................................................... 20
Conclusion ..................................................................................................................................... 20
Figures
Figure 1. AFDC Maximum Benefits for a Family of Three in January 1995 and Federal
Funding Per Poor Child in FY1995 .............................................................................................. 3
Figure 2. AFDC and Related Program Funding Per Poor Child, FY1995 ...................................... 5
Figure 3. Basic TANF Block Grant Per Poor Child, 2013 .............................................................. 6
Figure 4. TANF Grants to States, FY1997-FY2015 ........................................................................ 8
Figure 5. Uses of TANF, MOE, and Predecessor Program Funds, FY1995, FY2000, and
FY2014 ....................................................................................................................................... 12
Figure 6. Federal Funding for the Basic TANF Block Grant: FY1997 through FY2025 .............. 13
Figure 7. Basic TANF Funding Compared to Number of Families Receiving Assistance,
Number of Families Eligible for Assistance, and Number of Poor Families with
Children, Selected Years ............................................................................................................. 15
Figure 8. Percentage Change in TANF Basic Funding from Current State Family
Assistance Grant to a Grant Based on Equal Grants Per Poor Child ......................................... 17
Figure 9. Unspent TANF Funds, FY1997 through FY2014 .......................................................... 18
Figure 10. TANF Contingency Fund Grants and the Unemployment Rate,
FY1997 to FY2014 ..................................................................................................................... 19

Temporary Assistance for Needy Families (TANF): Financing Issues
Congressional Research Service
Tables
Table A-1. TANF Basic Block Grant Formula Factors and Allocation ......................................... 21
Table A-2. TANF Basic Block Grant and MOE Funding Levels .................................................. 23
Table A-3. Federal TANF Grants to States: FY1997-FY2015 ...................................................... 25
Table B-1. Federal and State Expenditures and Transfers from TANF and Predecessor
Programs, FY1987-FY2014 ....................................................................................................... 27
Table B-2. Federal and State Expenditures and Transfers by Spending Category, Selected
Years FY1995-FY2014 .............................................................................................................. 29
Table B-3. TANF and Predecessor Program Expenditures for Cash Assistance, FY1987-
FY2014 ....................................................................................................................................... 29
Table B-4. Federal and State Expenditures and Transfers to Child Care Under TANF,
FY1997-FY2014 ........................................................................................................................ 31
Table B-5. Federal TANF and State MOE Funds by Category, FY2014 ...................................... 33
Table B-6. Federal TANF and State MOE Funds by Category, as a Percentage of Total
Federal TANF and State MOE Funds Used, FY2014 ............................................................... 35
Table C-1. Current Law TANF Basic Block Grant Versus A Basic Block Grant Based on
Equal Grants Per Poor Child, Official Poverty Definition ......................................................... 38
Table D-1. Unspent TANF Funds, End of FY1997-FY2014 ......................................................... 40
Table D-2. Unspent TANF Funds by State, End of FY2014 ......................................................... 41
Appendixes
Appendix A. History of the TANF Block Grant Funding.............................................................. 21
Appendix B. Federal and State Expenditures Under TANF and its Predecessor Programs .......... 27
Appendix C. Table Showing Allocations Based on Poor Children Compared with the
Current TANF Basic Block Grant .............................................................................................. 38
Appendix D. Unspent TANF Funds .............................................................................................. 40
Contacts
Author Contact Information .......................................................................................................... 43
Acknowledgments ......................................................................................................................... 43

Temporary Assistance for Needy Families (TANF): Financing Issues
Congressional Research Service 1
Introduction The Temporary Assistance for Needy Families (TANF) block grant provides grants to states,
territories, and Indian tribes for benefits and services to help ameliorate, or address the root
causes of, childhood economic disadvantage. It was created in the 1996 welfare reform law (the
Personal Responsibility and Work Opportunity Reconciliation Act of 1996, PRWORA, P.L. 104-
193), which ended the pre-welfare reform program of cash assistance, rewrote the federal rules
for cash assistance for needy families, and gave states broad flexibility to meet TANF’s statutory
goals.
This report discusses the financing of the TANF block grant. It
describes the national funding level, the distribution of funds among the states,
and the basis for these funding levels;
describes how states may use TANF funds;
describes how states have actually used TANF funding; and
discusses selected policy issues regarding TANF funding.1
TANF Funding and History The 1996 welfare reform law that created TANF based the bulk of its funding on historical
expenditures in its predecessor programs. Therefore, the amount of funding a state receives in
TANF today depends on the size of its pre-TANF programs before the enactment of that law.
Financing the Pre-TANF Programs
Before the 1996 welfare reform law, federal grants helped states fund the Aid to Families with
Dependent Children (AFDC) programs of cash assistance for needy families with children;
Emergency Assistance (EA) for families with children; and the Job Opportunity and Basic Skills
(JOBS) training program, which provided employment services and education to AFDC
recipients. These three programs provided matching grants to states, reimbursing them for a share
of the expenditures in their programs. Thus, the federal government and the states shared in the
costs of these programs. The system of matching grants for cash assistance for needy families
dated back to the Social Security Act of 1935 (P.L. 74-271).
Under the pre-TANF cash welfare program of AFDC, federal funding was generally provided at
the Medicaid matching rate.2 Under that rate, states with lower per-capita incomes received a
higher match, with a statutory minimum matching rate of 50% (for higher income states) and a
maximum matching rate of 83% (for the lowest income states). Federal grants for AFDC benefits,
AFDC administration (matched at a 50% rate), and EA (matched at a 50% rate) were not subject
to caps; federal funds reimbursed states in full for a share of expenditures in their programs.
Federal grants for JOBS were subject to annual caps, with matching funds provided up to the cap.
1 See also Congressional Budget Office, Temporary Assistance for Needy Families: Spending and Policy Options,
January 2015. 2 The AFDC statute itself had a matching grant formula that provided for matching of a fraction of expenditures up to
dollar caps per recipient. However, Section 1118 of the Social Security Act provided that if a state had an approved
Medicaid program in place, it could receive matching funds under the Medicaid matching formula. By 1996 all states
had approved Medicaid programs and received their matching funds based on the Medicaid matching rate.
Temporary Assistance for Needy Families (TANF): Financing Issues
Congressional Research Service 2
The matching rate for JOBS was the Medicaid matching rate, though the statutory minimum
matching rate for JOBS was 60% instead of 50%.
The amount of federal funding in the predecessor programs for a state depended on the
expenditures in the state. While there were some federal rules for these predecessor programs,
states had a great deal of discretion in determining which families were financially “needy,” and
hence eligible for benefits, and the amount of benefits received in the state. Under AFDC, there
was a great deal of state variation in both income eligibility thresholds and benefits paid in the
states,3 creating variation in state grants relative to their cash assistance caseloads or population
related to the program (e.g., number of poor children). This variation is depicted in Figure 1,
which shows the relationship between the AFDC maximum benefit for a family of three in
January 1995 and the amount of federal funding per poor child under AFDC and related programs
in 1995. As shown, there is a clear relationship between the size of the AFDC benefit provided by
a state and federal funding provided per poor child: states with higher maximum benefits also
received more federal funding per poor child. 4 For example, in January 1995 Mississippi paid a
maximum benefit for a family of three of $120 per month; its grant per poor child in FY1995 was
$343. On the other hand, in that month Alaska paid a maximum benefit of $923 per month for a
family of three; its FY1995 grant per poor child was $2,403.
3 For AFDC benefit amounts prior to the enactment of the 1996 welfare reform law, see CRS Report R43634,
Temporary Assistance for Needy Families (TANF): Eligibility and Benefit Amounts in State TANF Cash Assistance
Programs, by Gene Falk. 4 A statistic that measures the strength of the linear relationship between AFDC maximum benefits and funding per
poor child is the simple correlation coefficient statistic. This statistic has values between 0 and 1, with 0 representing
no linear relationship and 1 representing a perfect linear relationship. The correlation coefficient for AFDC maximum
benefits and funding per poor child in 1995 was 0.88.

Temporary Assistance for Needy Families (TANF): Financing Issues
Congressional Research Service 3
Figure 1. AFDC Maximum Benefits for a Family of Three in January 1995 and
Federal Funding Per Poor Child in FY1995
Source: Congressional Research Service (CRS). AFDC maximum benefits for a family of three are from a CRS survey of the states. AFDC and related funding data are from the U.S. Department of Health and Human
Services (HHS). Poverty data represent the Small Area Income and Poverty estimates (SAIPE) and are from the
U.S. Census Bureau.
The 1996 Law: “Freezing” Historical Funding Levels in the Basic
TANF Block Grant
The 1996 welfare reform law substantially rewrote the rules for state cash assistance programs,
imposing time limits on benefit receipt and revamping work requirements for adult recipients of
aid. Along with these policy changes was a change in the financing of state cash assistance
programs and other activities from matching grants to a block grant.
The 1996 law consolidated into TANF the three predecessor programs—AFDC, EA, and JOBS—
creating a single funding stream. 5 The bulk of the funding is provided in a basic block grant. That
block grant reflects peak spending for each state during the FY1992 to FY1995 period in TANF’s
5 Federal funding for AFDC-related child care programs was consolidated into a mandatory funding stream for the
Child Care and Development Fund. However, as discussed in “The State Maintenance of Effort (MOE) Requirement,”
state expenditures for the AFDC-related child care programs were included in the computation of the TANF MOE
requirements.
AL
AK
AZ
AR
CA
CO
CT
DE
DC
FLGA
HI
ID
IL
IN
IA
KS
KY
LA
ME
MD
MA
MI
MN
MS
MO
MT
NE
NV
NH
NJ
NM
NY
NC
ND
OH
OK
OR
PA
RI
SCSD
TN
TX
UT
VT
VA
WA
WV
WI
WY
$0
$500
$1,000
$1,500
$2,000
$2,500
$3,000
$100 $200 $300 $400 $500 $600 $700 $800 $900 $1,000
AFD
C a
nd
Re
late
d P
rogr
am G
ran
ts P
er
Po
or
Ch
ild
AFDC Maximum Benefit for a Family of 3, January 1995

Temporary Assistance for Needy Families (TANF): Financing Issues
Congressional Research Service 4
predecessor programs. (For the formula used in the computation and TANF basic block grant per
state, see Table A-1.) The total of the basic block grant distributed to the 50 states and the District
of Columbia is $16.5 billion per year.6 This is also known as the State Family Assistance Grant. It
is not adjusted for changes in conditions either nationally or in each state, such as changes in
prices (inflation), the cash assistance caseload, or the population (e.g., poor children). According
to the House Committee report accompanying the legislation that became the 1996 welfare
reform law, states were given fixed funding to provide them “with an incentive to help recipients
leave welfare because, unlike current law, States do not get more money for having more
recipients on the welfare rolls.”7
Though the 1996 welfare reform law contemplated no increases in the basic TANF block grant
for future years, it also provided that a state could receive no less under the block grant than it
historically did under the old system of matching grants to the states. That is, it was “held
harmless” for the change in financing. However, having the TANF block grant based on historical
expenditures had a number of additional implications. One of these is that it also “froze” the
differences among the states in federal funding relative to their populations. Figure 1 shows how
these differences were related to state decisions about their AFDC program; Figure 2 shows a
sharp regional pattern in these differences, portraying FY1995 federal funding in TANF’s
predecessor programs per poor child. Grants per poor child for FY1995 varied from $2,403 in
Alaska to $263 in Arkansas. Generally, grants per poor child in states in the South were less than
grants per poor child in states in the Northeast and Midwest, along the Pacific Coast, and Alaska
and Hawaii.
6 Tribal TANF programs within a state are funded from the state’s basic TANF block grant. Thus, the amount of funds
a state has for its state TANF program is reduced by the amount of funding for tribal programs within the state. The
$16.5 billion and all basic block grant funding amounts discussed in this report represent the total going to the state for
state and tribal programs. 7 U.S. Congress, House Committee on the Budget, Welfare and Medicaid Reform Act of 1996, Report to Accompany
H.R. 3734, 104th Cong., 2nd sess., June 27, 1996, H.Rept. 104-651, p. 1334.

Temporary Assistance for Needy Families (TANF): Financing Issues
Congressional Research Service 5
Figure 2. AFDC and Related Program Funding Per Poor Child, FY1995
Source: Congressional Research Service (CRS). AFDC and related program funding data are from the U.S.
Department of Health and Human Services (HHS). Poverty data represent the Small Area Income and Poverty
estimates (SAIPE) and are from the U.S. Census Bureau.
These state differences have been continued over time as each state’s basic block grant has
remained “frozen” since FY1997.8 Figure 3 shows the basic TANF block grant (State Family
Assistance Grant) per poor child in FY2013. The regional pattern of historical funding differences
per poor child from the pre-TANF programs remained in place during that year. In general,
funding per poor child was lower in FY2013 than in FY1995 (there were more poor children in
2013 than in 1995), but states in the South continue to have lower grants per poor child than those
in the Northeast and Midwest, and along the Pacific Coast. Note that these dollars per poor
children are in nominal dollars, not adjusted for inflation. The impact of inflation is discussed in
the “Selected TANF Financing Issues” section of this report.
8 This report uses FY1997 as the first year of TANF. Under the transition rules of the 1996 welfare reform law, states
had until July 1, 1997 (the beginning of the last quarter of FY1997) to convert their programs from AFDC to TANF.
However, for FY1997 total funding was constrained to the amount of the TANF basic block grant.

Temporary Assistance for Needy Families (TANF): Financing Issues
Congressional Research Service 6
Figure 3. Basic TANF Block Grant Per Poor Child, 2013
Source: Congressional Research Service (CRS), based on data from the U.S. Department of Health and Human
Services (HHS) and the U.S. Census Bureau.
Though funding became more limited, states were given increased flexibility in how funds could
be spent. Under TANF, states have the authority to spend their block grants on activities to
address both the effects of economic disadvantage (e.g., cash assistance) and what were viewed as
some of the root causes of childhood disadvantage (e.g., preventing out-of-wedlock pregnancies
and promoting the formation and maintenance of two-parent families).
Additional Federal Funds
The $16.5 billion basic block grant has constituted the bulk of federal funding each year since the
enactment of TANF. However, this basic funding has been supplemented in most years by some
additional grants to states funded in the TANF law. The additional funding streams are listed
below:
Supplemental grants. During consideration of legislation that led to the 1996
law, funding frozen at levels based on historical expenditures was thought to
disadvantage two groups of states: (1) those that had relatively high population
growth and (2) those that had historically low welfare grants relative to poverty
in the state. One of the purposes of supplemental grants was to address the
differences in state funding per assistance family or per poor person shown in
Figure 2. The other purpose was to provide additional funding to states with high
rates of population growth. In total, 17 states qualified for supplemental grants:

Temporary Assistance for Needy Families (TANF): Financing Issues
Congressional Research Service 7
Alabama, Alaska, Arizona, Arkansas, Colorado, Florida, Georgia, Idaho,
Louisiana, Mississippi, Montana, Nevada, New Mexico, North Carolina,
Tennessee, Texas, and Utah. Funding for TANF supplemental grants was
discontinued after June 30, 2011.
Welfare-to-Work Grants. In 1997, President Clinton proposed additional
funding for “welfare-to-work” grants on the presumption that the basic TANF
block grant provided insufficient funding for the increased emphasis on moving
cash assistance recipients to work. Congress accepted the proposal in the
Balanced Budget Act of 1997 (P.L. 105-33), providing $3 billion over two years
(FY1998 to FY1999) to augment TANF funds with special “welfare-to-work”
grants. These grants were administered through the Department of Labor (DOL)
rather than the Department of Health and Human Services (HHS), where TANF
is administered, and at the state and local level through the workforce system.
Additionally, funding was split between formula grants to states (and then
passed-through to local workforce boards) and competitive grants. No new
welfare-to-work funding was provided after FY1999.
Contingency Fund. The fixed basic grant under TANF also led to concerns that
funding might be inadequate during economic downturns. The 1996 welfare
reform law established a $2 billion “regular” TANF contingency fund. To draw
upon contingency funds, a state must both (1) meet a test of economic “need”
and (2) spend from its own funds more than what the state spent in FY1994 on
cash, emergency assistance, and job training in TANF’s predecessor programs.
The original $2 billion in the contingency fund was depleted in early FY2010;
annual appropriations have provided new contingency fund monies for FY2011
through FY2015.
Emergency Contingency Fund. The American Recovery and Reinvestment Act
(ARRA, P.L. 111-5) provided an additional $5 billion for FY2009 and FY2010.
This was partially in response to the anticipated depletion of the regular
contingency fund and partially to address that the contingency fund had not
always responded to changes in economic circumstances (see Figure 9). Unlike
regular contingency funds, which could be used for any TANF activity, the
ARRA “Emergency Contingency Fund” (ECF) financed only increased spending
on basic (cash) assistance, short-term emergency aid, and subsidized
employment. No ECF funding was provided after FY2010.
Bonus Funds. The 1996 welfare reform law, while giving states flexibility, had a
number of provisions to hold a state accountable for its performance in meeting
TANF’s statutory goals. These accountability provisions included two “bonus
funds”—one for states with reduced out-of-wedlock pregnancy rates and a
second that provided bonuses for states with “high” levels of performance in
meeting TANF’s statutory goals. The bonus for reduced out-of-wedlock
pregnancies was funded at up to $100 million per year and up to five states could
receive funds; the “high-performance bonus” provided an average of $200
million per year to states that qualified for it. FY2005 was the last year for which
states received bonus funds.
Temporary Assistance for Needy Families (TANF): Financing Issues
Congressional Research Service 8
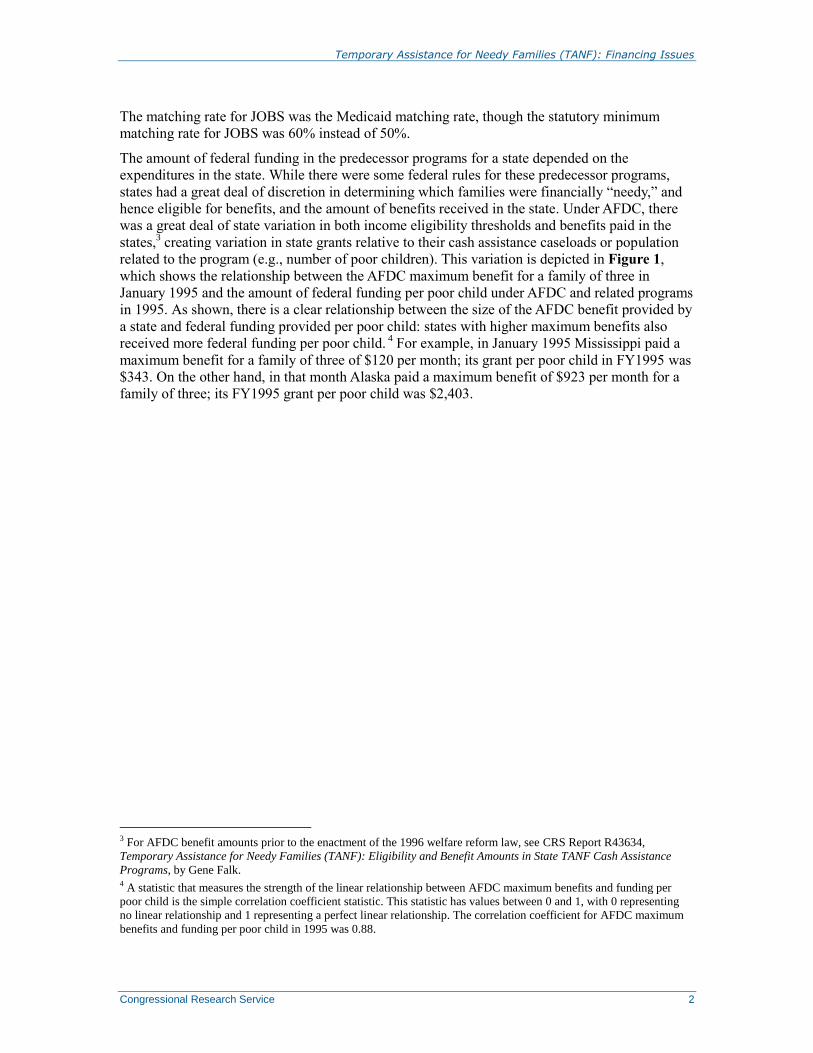
Figure 4 shows total TANF state grant funding for FY1997 through FY2015.9 As shown, funding
has remained at approximately the same level with slight annual variations since FY1998, with
the exception of a spike in funding from the “Emergency Contingency Fund” during FY2009 and
FY2010. (The funding level discussed here is without adjustment for inflation. The impact of
inflation on grants is discussed in the “Issues” section of this report.) However, there were no
additional “Emergency Contingency Funds” after FY2010, and supplemental grants were ended
after FY2011.
Figure 4. TANF Grants to States, FY1997-FY2015
Source: Congressional Research Service (CRS), based on data from the U.S. Department of Health and Human
Services (HHS).
Notes: Welfare-to-work grants represent those that went to states based on a formula in law, though most of
these funds were passed through to local workforce entities. They do not include competitively awarded
welfare-to-work grants. For a tabular display of these data, see Table A-3.
Though the overall level of federal TANF grants to states in FY2015 is about the same as in
earlier years, the composition of the grants differs. In the earlier years, funding in addition to the
basic block grant came from welfare-to-work grants, supplemental grants, and bonus funds. For
FY2012 through FY2015, the only funds in addition to the basic block grant for states were from
the contingency fund. While overall funding levels in FY2015 were similar to overall levels in the
early 2000s, the group of states that received contingency funds in that year differed from the
group of states that received supplemental grants and bonus funds in earlier years. Also, as
discussed in “Recessions and the TANF Block Grant,” the level of funding provided by the
contingency fund has not been responsive to improvements in the economy over the FY2011
through FY2015 period.
9 The figure excludes funding for healthy marriage and responsible fatherhood grants that is provided in TANF. These
grants generally are made to community-based organizations, rather than states. The figure also excludes funding for
welfare-to-work competitive grants, which also went mostly to entities other than states.
$0
$2
$4
$6
$8
$10
$12
$14
$16
$18
$20
$22
FY9
7
FY9
8
FY9
9
FY0
0
FY0
1
FY0
2
FY0
3
FY0
4
FY0
5
FY0
6
FY0
7
FY0
8
FY0
9
FY1
0
FY1
1
FY1
2
FY1
3
FY1
4
FY1
5
Bonus for Reduced Out-of-Wedlock Births
High Performance Bonus
Emergency Cont. Fund
Welfare-to-work
Contingency Fund
Supplemental Grant
Basic Block Grant
$Billions

Temporary Assistance for Needy Families (TANF): Financing Issues
Congressional Research Service 9
The State Maintenance of Effort (MOE) Requirement
TANF consolidated and replaced programs that provided matching grants to the states. This
meant that there were considerable state dollars contributing to the pre-TANF programs. It also
meant that the federal and state shares in financing these programs varied by state, as the
Medicaid matching rate is higher in states with lower per-capita incomes than in those with
higher per-capita incomes.
TANF requires states to maintain spending from their own funds on TANF or TANF-related
activities. States are required in the aggregate to maintain at least $10.4 billion in spending on
specified activities for needy families with children.10
The $10.4 billion, called the maintenance-
of-effort level, represents 75% of what was spent from state funds in FY1994 in TANF’s
predecessor programs of cash, emergency assistance, job training, and welfare-related child care
spending.11
States are required to maintain their own spending of at least that level, and the MOE
requirement increases to 80% of FY1994 spending for states that fail to meet TANF work
participation requirements (discussed below). State expenditures under this requirement are often
referred to as state MOE funds. (MOE levels by state are shown in Table A-2.)
It should be noted that the MOE sets a minimum amount for required state spending. There are
incentives in TANF law for states to spend more than this minimum amount. First, more state
spending than the minimum is required to access the TANF contingency fund. Second, states may
receive a “credit” (reduction) in their TANF work participation standards if they expend more
than the minimum required under the MOE.
How States May Use TANF Funds TANF is a broad-purpose block grant that gives states the flexibility to use its funds to address
both the effects of, and the root causes of, childhood economic disadvantage. There are two sets
of rules: those that relate to the use of federal TANF grants, and those for which state
expenditures count toward meeting the TANF MOE state spending requirement.
Federal Funds Expended Under TANF
States have broad discretion on how they expend federal TANF grants. States may use TANF
funds “in any manner that is reasonably calculated”12
to accomplish the block grant’s statutory
purpose. That purpose is to increase the flexibility of states in operating a program designed to
1. provide assistance to needy families so that children may be cared for in their
own homes or in the homes of relatives;
10 A state’s MOE is reduced based on the amount of federal TANF block grant funds that are spent on tribal TANF
programs. The $10.4 billion and all MOE amounts shown in this report represent MOE amounts before reductions for
tribal TANF programs. 11 Some TANF MOE expenditures can also be counted toward meeting a separate child care MOE as part of the state
spending requirements for the Child Care and Development Block Grant (CCDBG) matching grants. The maximum
amount of funds that may be “double-counted” toward both the TANF and child care MOE requirements is $888
million, equal to the greater of FY1994 or FY1995 state expenditures in the pre-1996 child care programs. Analysis of
combined federal and state funding or expenditures under the TANF and child care block grants must recognize that
some state spending can be double-counted or it will overstate the amount of funding available or the amount of
spending from the two block grants. The minimum amount of TANF MOE funds that cannot be double-counted toward
CCDBG matching requirements is $9.5 billion. 12 Section 404(a)(1) of the Social Security Act.

Temporary Assistance for Needy Families (TANF): Financing Issues
Congressional Research Service 10
2. end the dependence of needy parents on government benefits by promoting job
preparation, work, and marriage;
3. prevent and reduce the incidence of out-of-wedlock pregnancies and establish
annual numerical goals for preventing and reducing the incidence of these
pregnancies; and
4. encourage the formation and maintenance of two-parent families.
In addition, states may also expend federal TANF grants on any activity financed by pre-TANF
programs. These are known as “grandfathered” activities.” Examples of activities that do not
meet a TANF goal but may be financed by TANF grants include foster care payments and funding
for juvenile justice activities, if they were financed in the pre-TANF programs.
Transfers of Federal Funds
In addition to expending federal funds on allowable TANF activities, federal law permits a
limited amount of the federal TANF basic block grant to be used for other programs. A maximum
of 30% of the TANF block grant may be used for the following combined transfers or
expenditures:
Transfers to the Child Care and Development Block Grant;
Transfers to the Social Services Block Grant (SSBG), with a maximum transfer
to the SSBG set at 10% of the basic block grant;
As a state match for “reverse commuter grants,” providing public transportation
from inner cities to the suburbs.
Reservation of Unused Funds
States may reserve unused federal TANF funds for use in later fiscal years. Funds may be
reserved without fiscal year limit. This permits states to “save” any federal funds not needed in
one fiscal year for use in other years—for example, to save for a recession or any other event
(e.g., natural disaster) that might cause an increase in the demand for TANF funds.
Expenditures Countable Toward the Maintenance of Effort (MOE)
Requirement
The range of expenditures on activities that states may count toward the maintenance of effort
requirement is—like the authority to spend federal funds—quite broad. The expenditures need
not be in the “TANF program” itself, but in any program that provides benefits and services to
TANF-eligible families in cash assistance, child care assistance, education and job training,
administrative costs, or any other activity designed to meet TANF’s statutory goals. States may
count expenditures made by local governments toward the MOE requirement. Additionally, there
is a general rule of federal grants management that permits states to count as a state expenditure
“third-party” (e.g., nongovernmental) in-kind donations, as long as they meet the requirements of
providing benefits or services to TANF-eligible families and meet the requirements of the types
of activities that states may count toward the MOE requirement.

Temporary Assistance for Needy Families (TANF): Financing Issues
Congressional Research Service 11
How States Have Used TANF Funds TANF allows states to spend their funds on a wider range of activities than did the pre-1996
programs. AFDC was a cash assistance program; Emergency Assistance provided grants to states
for a range of activities that provided short-term assistance; and JOBS was an employment
services and education and training program for AFDC adult recipients.
The number of families receiving cash assistance reached its historical peak in March 1994, at 5.1
million families. In the mid- and late 1990s, the cash assistance caseload shrank rapidly, with a
64% decline in the number of families with children receiving cash assistance from FY1995 to
FY2000. (See CRS Report R43187, Temporary Assistance for Needy Families (TANF): Size and
Characteristics of the Cash Assistance Caseload, by Gene Falk.) Spending on cash assistance
declined correspondingly.13
Figure 5 shows both the level and composition of spending in FY1995 under the pre-TANF
programs and in FY2000 and FY2014 under TANF. While the overall funding levels in FY1995
and FY2014 were similar, the composition of spending was different. The figure shows that in
FY1995, AFDC cash assistance accounted for 70% of all spending under TANF’s predecessor
programs. In FY2014, cash assistance accounted for 26% of all TANF and MOE dollars. Child
care expenditures represented 3% of total pre-TANF expenditures in FY1995, a share that grew to
16% of all spending in FY2014. On the other hand, work, education, and training expenditures
grew only from 5% to 7% of total spending from FY1995 to FY2014.
“Other work supports” represents spending for state refundable tax credits (such as state versions
of the earned income tax credit) and transportation aid. Other work supports represented $4.5
billion in FY2014, or 14.3% of total TANF and MOE dollars.
The figure shows that the largest increase in expenditures (particularly during the FY2000 to
FY2014 period) was in “other spending.” Under TANF, this category represents a wide range of
benefits and social services related to families with children. It includes funding for services
related to child abuse and neglect, pre-kindergarten and other early childhood programs, short-
term emergency aid, state responsible-fatherhood and marriage programs, and programs for
adolescents. The expenditure reporting system in place for FY2014 did not have enough
information to categorize much of this spending properly. However, the Department of Health
and Human Services (HHS) implemented a new reporting system for FY2015 and later years that
will permit a better characterization of spending in the “other” category.14
13 See Table B-3. 14 Department of Health and Human Services (HHS), Administration for Children and Families, Office of Family
Assistance, OMB approved Form ACF-196R State TANF Financial Report Form, TANF-ACF-PI-2014-02, July 31,
2014, http://www.acf.hhs.gov/programs/ofa/resource/tanf-acf-pi-2014-02.

Temporary Assistance for Needy Families (TANF): Financing Issues
Congressional Research Service 12
Figure 5. Uses of TANF, MOE, and Predecessor Program Funds, FY1995, FY2000, and
FY2014
Source: Congressional Research Service (CRS), based on data from the U.S. Department of Health and Human Services (HHS).
Notes: FY1995 funds represent federal funding for AFDC, EA, and JOBS, state funding for those programs, and
state funding for AFDC-related child care programs. For a tabular presentation of those data, see Table B-5.
Selected TANF Financing Issues The TANF funding level, both nationally and for each state, is rooted in what states spent in the
early to mid-1990s in the pre-TANF programs that were focused on cash assistance for needy
families with children. The 1996 welfare reform law contemplated no adjustments for changes
that have been made to those funding levels since the enactment of TANF. The law also
authorized and provided TANF funding through FY2002. However, extensions of TANF funding
since FY2002 have maintained basic block grant funding at the $16.5 billion level with no
change—neither increases or decreases—extending the “freeze” in funding for now close to 20
years.
The Budget Baseline and TANF
Addressing any of TANF’s financing issues would be done in the context of the current federal
budget environment and rules that govern the congressional budget process. Though TANF law
says that its benefits and services are not entitlements to individuals, the amount of block grant
funding is set in authorizing law (the Social Security Act) and thus represents an entitlement to
the states. Thus, in the federal budget process, TANF is considered “mandatory” spending.
Mandatory spending is subject to “pay-as-you-go” rules. These rules would require legislation to
increase spending for TANF to be offset by corresponding decreases in other mandatory spending
programs or through increases in revenue.
In congressional budgeting, spending increases or decreases are measured relative to a current
law budget baseline that is computed under the rules of the Budget Act. For the basic TANF block
grant, this represents the $16.5 billion funding amount because that amount is statutorily
determined. Like the block grant itself, the baseline for future years contemplates no changes to
this funding amount due to changes in circumstances (e.g., inflation or population change).
$0
$7
$14
$21
$28
$35
FY1995 FY2000 FY2014
$Billions
Other
Other Work Supports
Child Care
Work Program
Basic Assistance
Administration
Temporary Assistance for Needy Families (TANF): Financing Issues
Congressional Research Service 13
The rules for computing the TANF baseline are the same as for other mandatory spending
programs with statutorily set grant amounts, such as the Social Services Block Grant (SSBG) or
mandatory funding for the Child Care and Development fund. However, these rules differ from
those of mandatory programs that provide direct benefits for individuals. The baselines for those
programs are based on estimates of their caseloads (families, individuals served) and benefit
amounts. In addition, the TANF baseline differs from those computed for discretionary grant
programs in that they generally are provided an annual adjustment for inflation. Under current
budget rules, total discretionary programs are subject to a statutory cap and the baseline for
discretionary spending is limited to the cap.
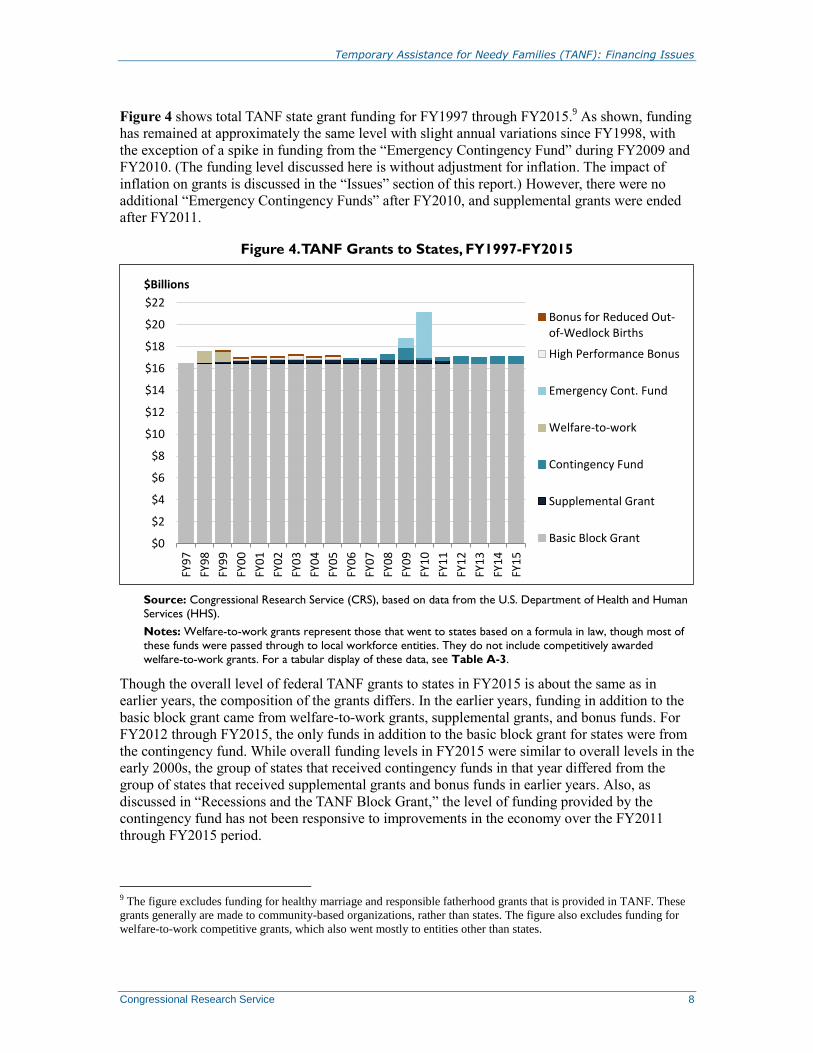
The Impact of Inflation on the Block Grant
Over time, price inflation reduces the purchasing power of a dollar. Hence, the frozen $16.5
billion per year basic TANF block grant can “buy” less in FY2015 than it did in FY1997. Figure
6 shows the gradual reduction in “real” funding from the TANF basic block for FY1997 through
FY2014, and as projected under the Congressional Budget Office (CBO) August 2015 economic
forecast for FY2015 through FY2025. In FY2013, the TANF basic block grant could “buy” 31%
less in goods and services than it could in FY1997. In FY2015, the block grant is estimated to
purchase 33% less than it did in FY1997. If the basic block grant remains at the current funding
level and prices increase over the FY2015 through FY2025 period as forecast by CBO, the block
grant’s purchasing power would in FY2025 be close to half of what it was in FY1997 (a 46%
reduction).
Figure 6. Federal Funding for the Basic TANF Block Grant: FY1997 through FY2025
(In billions of dollars)
Source: Congressional Research Service (CRS), based on data from the Department of Health and Human Services (HHS), U.S. Bureau of Labor Statistics (BLS), and the Congressional Budget Office (CBO).
Notes: Constant FY2013 dollars were computed using the Consumer Price Index for All Urban Consumers
(CPI-U).
As discussed in “The Budget Baseline and TANF,” adjusting the basic block grant for inflation
would be viewed as increased spending under the current congressional budget rules. If Congress
sought to increase TANF funding to keep pace with inflation, CBO estimates it would increase
$0
$5
$10
$15
$20
$25
$30
FY9
7
FY9
9
FY0
1
FY0
3
FY0
5
FY0
7
FY0
9
FY1
1
FY1
3
FY1
5
FY1
7
FY1
9
FY2
1
FY2
3
FY2
5
ACTUAL ESTIMATED
Current Dollars
Constant (Inflation-Adjusted) FY2013 Dollars

Temporary Assistance for Needy Families (TANF): Financing Issues
Congressional Research Service 14
cumulative spending by $22 billion over the next 10 years.15
Under current budget rules, this cost
would have to be offset by a corresponding decrease in other mandatory spending and/or increase
in revenues.
Funding Based on the TANF-Relevant Population
In addition to not being adjusted for inflation, the basic TANF block grant is also not adjusted for
changes in the relevant population for TANF. However, with TANF there is no clear-cut answer
about a relevant population to which TANF funding should be compared. The relevant population
depends on opinions about whether TANF should be focused on providing benefits and services
to the cash assistance population; whether the current size of the cash assistance caseload is
indicative of meeting the needs of the population eligible for TANF cash assistance; or whether
TANF should be viewed as a block grant to address child poverty more broadly.
This report examines inflation-adjusted TANF funding relative to the following three populations:
The number of families receiving TANF cash assistance. As discussed in the
“How States Have Used TANF Funds” section of this report, a large share of
actual TANF expenditures were made on activities that were not related to
traditional cash assistance programs (cash aid, administration, or work activities),
and hence were made on populations other than families receiving cash
assistance. Thus, showing TANF funding relative to the cash assistance
population is an illustrative measure showing the amount of federal dollars that
would be available if TANF funds were focused on those families receiving cash
assistance.
The estimated number of families eligible for TANF-funded cash assistance.
This reflects the number of families estimated as eligible under state TANF
program rules regarding family types and income and asset rules. Not all families
who are eligible for TANF cash assistance actually receive benefits. Some
families who are eligible do not apply or do not receive benefits for other
reasons. It is estimated that a large share of the decline in the TANF cash
assistance caseload resulted from a decline in the share of families eligible for
cash assistance who actually received assistance.16
In 1997, an estimated 73% of
families eligible for assistance received TANF-funded cash aid. By 2012, this
percentage had declined to 30%. This is an illustrative measure showing the
amount of federal dollars that would be available per family for all families
eligible for cash aid.
The estimated number of poor families with children. This is an illustrative
measure to show TANF funding relative to the broader population targeted by all
15 Congressional Budget Office, January 2015. 16 The estimated number of families eligible for TANF-funded cash assistance comes from the TRIM3 micro-
simulation model, which uses information from the Census Bureau’s household survey, the Annual Social and
Economic Supplement to the Current Population Survey (CPS), to estimate families eligible for cash assistance. The
TRIM3 micro-simulation model is funded by the U.S. Department of Health and Human Services (HHS) and
maintained at the Urban Institute. For a discussion of the decline in the percentage of eligible families actually
receiving TANF-funded cash assistance, see U.S. Government Accountability Office, Temporary Assistance for Needy
Families. Fewer Eligible Families Have Received Cash Assistance Since the 1990s, and the Recession’s Impact on
Caseload Varies by State, GAO-10-164, February 2010. Information on the percentage of families eligible for TANF
cash assistance in 2012 comes from the Urban Institute.

Temporary Assistance for Needy Families (TANF): Financing Issues
Congressional Research Service 15
TANF benefits and services to address both the effects of and the root causes of
child poverty.
Figure 7 shows TANF basic funding per family receiving cash assistance, eligible for cash
assistance, and with children and in poverty for 1997, 2000, and 2013.
The figure shows that by any of these three measures, TANF basic funding per family increased
from FY1997 to FY2000. In the late 1990s, the cash assistance caseload, the number of families
eligible for cash assistance, and the number of poor families with children all declined
sufficiently to more than offset the effects of inflation. That is, even adjusted for inflation, states
had more resources per family in 2000 than in 1997 under any of the three measures.
However, the circumstances in the post-2000 period differed substantially from those in TANF’s
early years. Child poverty increased during the 2000s, with some of the increase occurring even
before the deep 2007-2009 recession. The number of families estimated as eligible for TANF cash
assistance rose together with child poverty. Yet the TANF cash assistance caseload continued to
decline, albeit at a slower pace than it did in the late 1990s.
The figure shows that by any of these three measures, basic TANF funding per cash assistance
family declined from 2000 to 2013. However, in 2013 basic TANF funding per family receiving
cash assistance remained above that of 1997. For the other two measures, TANF funding per
family had declined sufficiently by 2013 so that its inflation-adjusted value was below that of
1997. In 2013, TANF basic funding per family eligible for cash assistance was 35% below its
1997 level when considering the effects of inflation. That year, TANF basic funding per poor
family with children was 37% below its 1997 level when considering the effects of inflation.
Figure 7. Basic TANF Funding Compared to Number of Families Receiving
Assistance, Number of Families Eligible for Assistance, and Number of Poor Families
with Children, Selected Years
(In constant 2013 dollars)
Source: Congressional Research Service (CRS), based on data from the U.S. Department of Health and Human
Services (HHS), U.S. Census Bureau, and estimates of families eligible for cash assistance from the TRIM3 micro-
simulation model, funded by HHS and maintained at the Urban Institute.
Notes: Constant dollars were computed using the Consumer Price Index for all Urban Consumers (CPI-U).
Basic funding per family eligible for cash assistance in 2013 was projected, based on the percentage of families
eligible for TANF actually receiving benefits in 2012 and the actual TANF cash assistance family in 2013.
Temporary Assistance for Needy Families (TANF): Financing Issues
Congressional Research Service 16
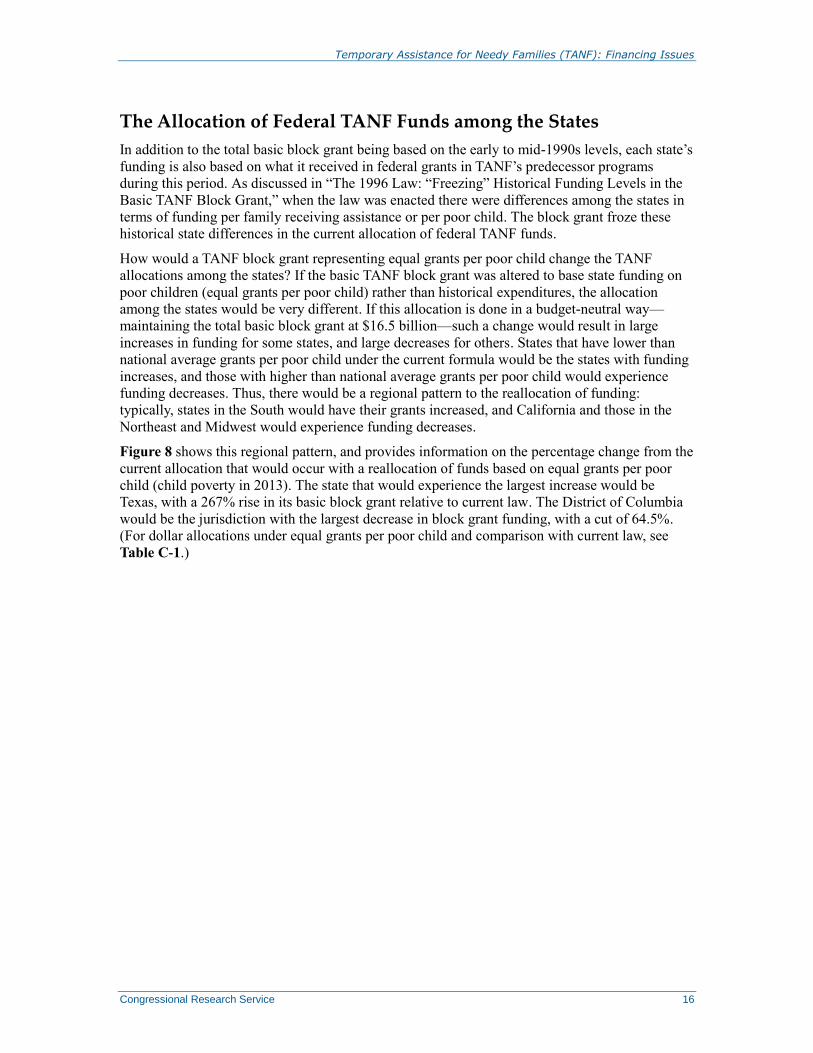
The Allocation of Federal TANF Funds among the States
In addition to the total basic block grant being based on the early to mid-1990s levels, each state’s
funding is also based on what it received in federal grants in TANF’s predecessor programs
during this period. As discussed in “The 1996 Law: “Freezing” Historical Funding Levels in the
Basic TANF Block Grant,” when the law was enacted there were differences among the states in
terms of funding per family receiving assistance or per poor child. The block grant froze these
historical state differences in the current allocation of federal TANF funds.
How would a TANF block grant representing equal grants per poor child change the TANF
allocations among the states? If the basic TANF block grant was altered to base state funding on
poor children (equal grants per poor child) rather than historical expenditures, the allocation
among the states would be very different. If this allocation is done in a budget-neutral way—
maintaining the total basic block grant at $16.5 billion—such a change would result in large
increases in funding for some states, and large decreases for others. States that have lower than
national average grants per poor child under the current formula would be the states with funding
increases, and those with higher than national average grants per poor child would experience
funding decreases. Thus, there would be a regional pattern to the reallocation of funding:
typically, states in the South would have their grants increased, and California and those in the
Northeast and Midwest would experience funding decreases.
Figure 8 shows this regional pattern, and provides information on the percentage change from the
current allocation that would occur with a reallocation of funds based on equal grants per poor
child (child poverty in 2013). The state that would experience the largest increase would be
Texas, with a 267% rise in its basic block grant relative to current law. The District of Columbia
would be the jurisdiction with the largest decrease in block grant funding, with a cut of 64.5%.
(For dollar allocations under equal grants per poor child and comparison with current law, see
Table C-1.)

Temporary Assistance for Needy Families (TANF): Financing Issues
Congressional Research Service 17
Figure 8. Percentage Change in TANF Basic Funding from Current State Family
Assistance Grant to a Grant Based on Equal Grants Per Poor Child
(Assumes $16.5 billion basic block grant is maintained)
Source: Estimates by the Congressional Research Service (CRS).
Notes: Poverty allocations based on poverty counts under the “official” definition of poverty. A tabular display
of this information, as well as dollar allocations, can be found in Table C-1.
Recessions and the TANF Block Grant
During the consideration of the 1996 welfare reform law, the fixed basic grant under TANF led to
concerns that funding might be inadequate during economic downturns. TANF law includes two
provisions to address such concerns: reserve funds and a “contingency fund.”
TANF Reserve Funds
TANF law permits states to “reserve” unused basic block grant funds; for example, saving funds
during periods of economic growth to have extra funding available during recessions. However,
at the end of FY2013, unspent funds were at their lowest (inflation-adjusted) level in the history
of the block grant. There was a slight increase in unspent TANF funds from the end of FY2013 to
the end of FY2014.
Figure 9 shows the amount of unspent TANF funds in inflation-adjusted (constant 2014) dollars
for FY1997 through FY2014. As shown in the figure, states accumulated unspent funds in the
early years of the block grant. However, the value of unspent funds declined after FY2000. At the

Temporary Assistance for Needy Families (TANF): Financing Issues
Congressional Research Service 18
end of FY2014, the constant dollar value of unspent funds was 66% lower than it was at the end
of FY2000.
Figure 9. Unspent TANF Funds, FY1997 through FY2014
(In billions of inflation-adjusted, constant FY2014 dollars)
Source: Congressional Research Service (CRS), based on data from the U.S. Department of Health and Human
Services (HHS) and the U.S. Bureau of Labor Statistics (BLS).
Notes: Constant FY2014 dollars were computed using the Consumer Price Index for all Urban Consumers
(CPI-U).
The TANF Contingency Fund
The 1996 welfare reform law created a separate $2 billion fund to provide extra TANF funding
during periods of economic hardship through a contingency fund. States would need to meet
criteria of economic need in order to access the fund. The criteria of economic need are (1) a
three-month average state unemployment rate of at least 6.5% and at least 10% higher than in the
corresponding three months of either of the prior two years; or (2) the state’s Supplemental
Nutrition Assistance Programs (SNAP) caseload is at least 10% higher than it was in FY1994 or
FY1995. Additionally, in order to access the TANF contingency fund states also have to spend
more from their own funds than they spent in FY1994 on TANF-related programs.
Figure 10 shows TANF contingency fund grants and their relationship to the unemployment rate
for FY1998 through FY2014. As shown in the figure, the contingency fund often has not behaved
as a countercyclical source of extra TANF funds. The fund was little used before FY2008. Grants
did not increase together with the unemployment rate during the 2001 recession. States generally
did not sufficiently increase their own spending, criteria required to access this fund, during that
recession.
$0.0
$2.0
$4.0
$6.0
$8.0
$10.0
FY9
7
FY9
8
FY9
9
FY0
0
FY0
1
FY0
2
FY0
3
FY0
4
FY0
5
FY0
6
FY0
7
FY0
8
FY0
9
FY1
0
FY1
1
FY1
2
FY1
3
FY1
4
$Billions
Obligated but not Spent
Obligated

Temporary Assistance for Needy Families (TANF): Financing Issues
Congressional Research Service 19
Figure 10. TANF Contingency Fund Grants and the Unemployment Rate,
FY1997 to FY2014
Source: Congressional Research Service (CRS), based on data from the U.S. Department of Health and Human
Services (HHS) and the U.S. Bureau of Labor Statistics.
Beginning in 2008, grants did increase with the more severe recession of 2007-2009. With the
increase in access, it was projected that the $2 billion contingency fund would be exhausted. In
fact, the fund was exhausted in early FY2010. Figure 10 also shows grants from the ARRA ECF.
It was the ECF—and not the regular contingency fund—that provided the bulk of extra TANF
funding in response to the recent severe recession. The ECF expired at the end of FY2010.
Following the exhaustion of the original $2 billion for the TANF contingency fund, Congress
provided it with annual appropriations in subsequent years. Over all years from FY2010 to
FY2014, all states except Wyoming (which became ineligible during FY2014) were considered
economically needy because they had higher SNAP caseloads than prior to welfare reform
(FY1994 or FY1995). SNAP caseloads are projected to remain above those levels for the
indefinite future. Therefore, the TANF contingency fund may continue to spend most of its
annual appropriations into the future despite the economic recovery.
There are some implications of the potential lack of a counter-cyclical funding source for TANF.
During the past recession, state government budgets were stressed, with many states cutting back
on spending to meet balanced budget requirements. However, for the period when the ECF
provided states with extra funds, states generally maintained their TANF benefit amounts. When
the ECF expired at the end of FY2010, a number of states reduced their benefits and tightened
eligibility for cash assistance.
Congress could opt to redesign the TANF contingency fund so that it would be more responsive
to changes in economic conditions than the current contingency fund. That is, it could create a
fund that would spend less than is currently projected during good economic times, and would
provide a higher level of funding in case the economy falls into recession. Though a fund to
provide extra grants during recessions might help TANF respond to future economic downturns,
there are a number of difficulties in developing such a fund. Each recession is different—and
there is no guarantee that a program that would have been responsive in past recessions will be
responsive in future recessions.

Temporary Assistance for Needy Families (TANF): Financing Issues
Congressional Research Service 20
Uses of TANF Funds
The uses of TANF grants by states to fund a wide range of benefits and services—some well
outside the scope of benefits and services related to families receiving cash assistance—have
raised some fundamental questions about the TANF block grant.
Is its primary purpose to fund cash assistance and services for families receiving
cash assistance, particularly those services that could move families from
assistance to work? or
Is TANF truly a broad-purpose block grant giving states the financial flexibility
to provide a wide range of benefits and services to address childhood economic
disadvantage?
State organizations, in general, have argued in favor of retaining the flexibility of the TANF block
grant.17
There have been calls to rein in spending on certain activities to focus more dollars on
cash assistance families.18
There has also been interest in tightening certain rules related to what
expenditures can be counted toward the TANF MOE, restricting the ability of states to count
“third-party” donated services as part of their MOE.
Conclusion The bulk of TANF funding is based on what states spent in the pre-TANF programs in the early to
mid-1990s. A freeze in the bulk of TANF funding that was originally authorized for 5 years
(FY1997-FY2002) has now extended to close to 20 years. However, a number of considerations
are raised by any potential changes in TANF funding, including the following:
Under current budget rules any increase in TANF funding would have to be
offset by spending reductions or revenue increases elsewhere in the budget.
Addressing certain issues in a budget-neutral manner—such as disparities in
funding among the states—could result in a large redistribution of funding from
some states to others.
There are different perspectives with which to evaluate the adequacies of TANF
funding.
These different perspectives lead policymakers to fundamental questions about TANF and its
goals in conjunction with addressing its financing issues.
17 See National Governors Association Policy Position HHS-01, Temporary Assistance for Needy Families, February
23, 2015. 18 For example, see discussion in Liz Schott, LaDonna Pavetti, and Ife Finch, How States Have Spent Federal and State
Funds Under the TANF Block Grant, Center on Budget and Policy Priorities, August 2012.

Temporary Assistance for Needy Families (TANF): Financing Issues
Congressional Research Service 21
Appendix A. History of the TANF Block Grant
Funding Table A-1 shows how the TANF basic block grant was derived. The TANF basic block grant
(state family assistance grant) provides each state a grant based on its peak funding during the
early to-mid 1990s. The data underlying the formula were the federal share of expenditures in
TANF predecessor programs for FY1992 through FY1995. The formula provided that each state
receive the greatest of
the average federal share of expenditures in these programs for FY1992 through
FY1994 (column A);
the federal share of expenditures for these programs in FY1994, adjusted for
states that amended their EA programs in FY1994 or FY199519
(column D); or
4/3 times20
the federal share of expenditures for these programs in the first three
quarters of FY1995 (column E).
Table A-2 provides the amount of federal funding through the TANF basic block grant by state as
well as state MOE levels at 75% and 80% rates of FY1994 predecessor program state
expenditures. The MOE is 75% of FY1994 predecessor program state expenditures, but if a state
fails to meet TANF work participation standards, the MOE rises to 80% of FY1994 expenditures.
Table A-3 shows the total TANF grants to states for FY1997 through FY2015.
Table A-1. TANF Basic Block Grant Formula Factors and Allocation
(In thousands of dollars)
Col (A)
Average:
92-94
Col (B)
94
Col (C)
Emergency
Assistance
Add-On
Col (D,
Col B+
Col C)
Total 94
Col (E)
95a
Col (F)
Maximum:
Family
Assistance
Grant
Allocation
Col (G)
TANF
Block
Grant is
Based
Upon...
Alabama $85,816 $90,794 $2,521 $93,315 $86,750 $93,315 94
Alaska 59,859 63,609 0 63,609 61,550 63,609 94
Arizona 200,741 214,756 4,628 219,384 222,420 222,420 95
Arkansas 56,733 56,033 0 56,033 53,819 56,733 Average
California 3,385,408 3,616,076 43,908 3,659,984 3,733,818 3,733,818 95
Colorado 114,706 120,906 15,150 136,057 135,553 136,057 94
Connecticut 218,728 233,129 33,660 266,788 258,392 266,788 94
Delaware 25,029 26,037 6,114 32,152 32,291 32,291 95
19 The FY1994 adjustment for EA program amendments is the amount by which the federal share of EA expenditures
in FY1995 exceeded that of FY1994. 20 The published conference report (H.Rept. 104-725) contains a typographical error, stating that the FY1995 formula
factor was “3/4” rather than “4/3” of the first three quarters of expenditures for that fiscal year. The enrolled bill and the
public law contain the correct formula factor, which is “4/3” of the first three quarters of expenditures for FY1995.

Temporary Assistance for Needy Families (TANF): Financing Issues
Congressional Research Service 22
Col (A)
Average:
92-94
Col (B)
94
Col (C)
Emergency
Assistance
Add-On
Col (D,
Col B+
Col C)
Total 94
Col (E)
95a
Col (F)
Maximum:
Family
Assistance
Grant
Allocation
Col (G)
TANF
Block
Grant is
Based
Upon...
District of
Columbia
83,822 92,610 0 92,610 85,217 92,610 94
Florida 515,818 545,942 16,398 562,340 558,436 562,340 94
Georgia 314,278 324,338 0 324,338 330,742 330,742 95
Hawaii 82,936 91,830 262 92,092 98,905 98,905 95
Idaho 27,468 30,828 1,110 31,938 31,851 31,938 94
Illinois 520,169 549,190 17,709 566,899 585,057 585,057 95
Indiana 181,711 206,799 0 206,799 178,859 206,799 94
Iowa 122,331 127,350 4,174 131,525 127,238 131,525 94
Kansas 93,381 101,931 0 101,931 94,592 101,931 94
Kentucky 181,288 172,345 884 173,230 162,545 181,288 Average
Louisiana 158,009 153,356 10,616 163,972 141,434 163,972 94
Maine 78,121 73,757 1,443 75,200 71,943 78,121 Average
Maryland 215,046 223,901 2,231 226,132 229,098 229,098 95
Massachusetts 451,843 450,182 9,189 459,371 406,019 459,371 94
Michigan 775,353 765,745 312 766,057 761,144 775,353 Average
Minnesota 261,850 265,203 2,781 267,985 249,349 267,985 94
Mississippi 86,768 82,965 0 82,965 78,726 86,768 Average
Missouri 199,581 211,588 5,464 217,052 210,593 217,052 94
Montana 41,220 42,336 937 43,273 45,534 45,534 95
Nebraska 50,158 49,046 4,187 53,233 58,029 58,029 95
Nevada 29,876 33,605 3,464 37,068 43,977 43,977 95
New Hampshire 34,788 38,263 258 38,521 37,809 38,521 94
New Jersey 394,725 394,955 9,080 404,035 391,768 404,035 94
New Mexico 101,731 121,136 438 121,574 126,103 126,103 95
New York 2,091,109 2,258,196 0 2,258,196 2,442,931 2,442,931 95
North Carolina 279,550 287,205 12,081 299,286 302,240 302,240 95
North Dakota 23,707 23,472 2,928 26,400 24,684 26,400 94
Ohio 709,556 717,863 10,105 727,968 637,440 727,968 94
Oklahoma 148,014 144,631 339 144,969 137,773 148,014 Average
Oregon 160,581 164,748 2,733 167,480 167,925 167,925 95
Pennsylvania 601,879 613,068 106,432 719,499 689,651 719,499 94
Rhode Island 81,325 87,923 6,138 94,061 95,022 95,022 95
South Carolina 99,968 98,325 0 98,325 96,842 99,968 Average

Temporary Assistance for Needy Families (TANF): Financing Issues
Congressional Research Service 23
Col (A)
Average:
92-94
Col (B)
94
Col (C)
Emergency
Assistance
Add-On
Col (D,
Col B+
Col C)
Total 94
Col (E)
95a
Col (F)
Maximum:
Family
Assistance
Grant
Allocation
Col (G)
TANF
Block
Grant is
Based
Upon...
South Dakota 21,227 21,352 542 21,894 20,715 21,894 94
Tennessee 173,001 175,315 16,209 191,524 183,236 191,524 94
Texas 423,921 452,989 7,497 460,486 486,257 486,257 95
Utah 71,026 71,255 5,574 76,829 74,952 76,829 94
Vermont 45,828 45,217 1,252 46,469 47,353 47,353 95
Virginia 147,946 158,285 0 158,285 134,781 158,285 94
Washington 390,117 395,868 8,463 404,332 388,007 404,332 94
West Virginia 107,675 110,176 0 110,176 90,196 110,176 94
Wisconsin 318,188 316,812 186 316,998 296,644 318,188 Average
Wyoming 21,781 20,460 0 20,460 19,157 21,781 Average
Totals 15,065,689 15,733,704 377,396 16,111,100 16,025,367 16,488,667
Source: Congressional Research Service (CRS) calculations based on data from the U.S. Department of Health
and Human Services (HHS).
a. Annualized federal share of expenditures in predecessor programs in the first three quarters of FY1995.
Table A-2. TANF Basic Block Grant and MOE Funding Levels
(In millions of dollars)
State Maintenance of Effort
(MOE) Funds
State
Federal Basic
Block Grant 75% Ratea 80% Rateb
Total Federal
and State
Funds at the
75% MOE
Rate
Federal
Funding as a
Share of Total
Federal and
State Funding
at the 75%
MOE Rate
Alabama $93.3 $39.2 $41.8 $132.5 70.4%
Alaska 63.6 48.9 52.2 112.6 56.5
Arizona 222.4 95.0 101.4 317.4 70.1
Arkansas 56.7 20.8 22.2 77.6 73.1
California 3,733.8 2,726.9 2,908.7 6,460.7 57.8
Colorado 136.1 82.9 88.4 218.9 62.1
Connecticut 266.8 183.4 195.6 450.2 59.3
Delaware 32.3 21.8 23.2 54.1 59.7
District of
Columbia
92.6 70.4 75.1 163.1 56.8
Florida 562.3 370.9 395.6 933.3 60.3

Temporary Assistance for Needy Families (TANF): Financing Issues
Congressional Research Service 24
State Maintenance of Effort
(MOE) Funds
State
Federal Basic
Block Grant 75% Ratea 80% Rateb
Total Federal
and State
Funds at the
75% MOE
Rate
Federal Funding as a
Share of Total
Federal and
State Funding
at the 75%
MOE Rate
Georgia 330.7 173.4 184.9 504.1 65.6
Hawaii 98.9 73.0 77.8 171.9 57.5
Idaho 31.9 13.7 14.6 45.6 70.0
Illinois 585.1 430.1 458.8 1,015.1 57.6
Indiana 206.8 113.5 121.1 320.3 64.6
Iowa 131.5 62.0 66.1 193.5 68.0
Kansas 101.9 61.7 65.9 163.7 62.3
Kentucky 181.3 67.4 71.9 248.7 72.9
Louisiana 164.0 55.4 59.1 219.4 74.7
Maine 78.1 37.5 40.0 115.6 67.6
Maryland 229.1 177.0 188.8 406.1 56.4
Massachusetts 459.4 358.9 382.9 818.3 56.1
Michigan 775.4 468.5 499.8 1,243.9 62.3
Minnesota 268.0 179.7 191.7 447.7 59.9
Mississippi 86.8 21.7 23.2 108.5 80.0
Missouri 217.1 120.1 128.1 337.2 64.4
Montana 45.5 15.7 16.8 61.2 74.3
Nebraska 58.0 28.6 30.5 86.7 67.0
Nevada 44.0 25.5 27.2 69.5 63.3
New Hampshire 38.5 32.1 34.3 70.6 54.5
New Jersey 404.0 300.2 320.2 704.2 57.4
New Mexico 126.1 37.3 39.8 163.4 77.2
New York 2,442.9 1,718.7 1,833.2 4,161.6 58.7
North Carolina 302.2 154.2 164.5 456.4 66.2
North Dakota 26.4 9.1 9.7 35.5 74.4
Ohio 728.0 390.8 416.9 1,118.8 65.1
Oklahoma 148.0 61.3 65.3 209.3 70.7
Oregon 167.9 92.3 98.4 260.2 64.5
Pennsylvania 719.5 407.1 434.3 1,126.6 63.9
Rhode Island 95.0 60.4 64.4 155.4 61.2
South Carolina 100.0 35.9 38.3 135.9 73.6

Temporary Assistance for Needy Families (TANF): Financing Issues
Congressional Research Service 25
State Maintenance of Effort
(MOE) Funds
State
Federal Basic
Block Grant 75% Ratea 80% Rateb
Total Federal
and State
Funds at the
75% MOE
Rate
Federal Funding as a
Share of Total
Federal and
State Funding
at the 75%
MOE Rate
South Dakota 21.9 8.8 9.4 30.7 71.4
Tennessee 191.5 82.8 88.3 274.3 69.8
Texas 486.3 236.7 251.4 723.0 67.3
Utah 76.8 25.3 27.0 102.1 75.2
Vermont 47.4 25.5 27.3 72.9 65.0
Virginia 158.3 128.2 136.7 286.5 55.3
Washington 404.3 272.1 290.2 676.4 59.8
West Virginia 110.2 32.3 34.4 142.5 77.3
Wisconsin 318.2 169.2 180.5 487.4 65.3
Wyoming 21.8 10.7 11.4 32.4 67.1
Total 50 States
and District of
Columbia
16,488.7 10,434.8 11,129.3 26,923.5 61.2
Source: Congressional Research Service (CRS), based on data from the U.S. Department of Health and Human
Services (HHS).
a. States are required in the aggregate to maintain at least $10.4 billion in spending on specified activities for
needy families with children. The $10.4 billion, called the maintenance-of-effort level, represents 75% of
what was spent from state funds in FY1994 in TANF’s predecessor programs of cash, emergency assistance,
job training, and welfare-related child care spending.
b. States that fail to meet their work participation standards are required to spend at least 80% of what they
spent from state funds in FY1994 in TANF’s predecessor programs of cash, emergency assistance, job training, and welfare-related child care spending.
Table A-3. Federal TANF Grants to States: FY1997-FY2015
(In millions of dollars)
Fiscal Year
TANF
Basic
Block
Grant
Supple-
mental
Grants
Welfare-
to-Work
Grants
High
Perfor-
mance
Bonus
Bonus
for
Reduced
Out of
Wedlock
Births
Contin-
gency
Funds
Emer-
gency
Contin-
gency
Funds Totals
1997 $16,489 $0 $0 $0 $0 $0 $0 16,489
1998 16,489 79 999 0 0 2 0 17,569
1999 16,489 160 912 0 100 0 0 17,661

Temporary Assistance for Needy Families (TANF): Financing Issues
Congressional Research Service 26
Fiscal Year
TANF
Basic
Block
Grant
Supple-
mental
Grants
Welfare-
to-Work
Grants
High
Perfor-
mance
Bonus
Bonus
for
Reduced
Out of
Wedlock
Births
Contin-
gency
Funds
Emer-
gency
Contin-
gency
Funds Totals
2000 16,489 239 0 200 100 0 0 17,027
2001 16,489 319 0 200 75 0 0 17,083
2002 16,489 319 0 200 100 0 0 17,108
2003 16,489 319 0 400 100 0 0 17,308
2004 16,489 319 0 200 100 0 0 17,108
2005 16,489 319 0 200 75 58 0 17,141
2006 16,489 319 0 0 0 93 0 16,901
2007 16,489 319 0 0 0 59 0 16,867
2008 16,489 319 0 0 0 428 0 17,236
2009 16,489 319 0 0 0 1,107 829 18,744
2010 16,489 319 0 0 0 212 4,125 21,145
2011 16,489 211 0 0 0 332 0 17,032
2012 16,489 0 0 0 0 599 0 17,088
2013 16,489 0 0 0 0 529 0 17,018
2014 16,489 0 0 0 0 610 0 17,099
2015 16,489 0 0 0 0 583 0 17,072
Source: Congressional Research Service (CRS), based on data from the U.S. Department of Health and Human
Services (HHS).
Notes: FY1997 was a transition year with states given time to convert from TANF’s predecessor programs to
TANF until July 1, 1997. However, total funding for the combination of TANF and its predecessor programs was
capped at the basic TANF block grant level, $16.5 billion.

Temporary Assistance for Needy Families (TANF): Financing Issues
Congressional Research Service 27
Appendix B. Federal and State Expenditures Under
TANF and its Predecessor Programs
Table B-1. Federal and State Expenditures and Transfers from TANF and
Predecessor Programs, FY1987-FY2014
(In billions of dollars)
Fiscal Year
Federal
Expenditures
Transfers to
the Child
Care and
Development
Fund
Transfers to
the Social
Services
Block Grant
State
Expenditures Totals
1987 $9.996 $8.537 $18.533
1988 10.399 8.765 19.164
1989 10.816 9.118 19.934
1990 11.953 10.179 22.132
1991 13.169 11.306 24.475
1992 14.567 12.654 27.222
1993 14.790 12.909 27.699
1994 15.686 13.966 29.652
1995 16.173 14.868 31.041
1996 15.067 14.120 29.187
1997 12.620 $0.235 $0.358 11.320 24.533
1998 11.353 0.787 1.118 10.683 23.942
1999 12.338 2.575 1.318 10.777 27.008
2000 13.384 2.413 1.096 11.397 28.290
2001 14.960 1.899 0.934 10.707 28.500
2002 14.588 1.926 1.031 10.827 28.372
2003 16.254 1.790 0.927 10.086 29.057
2004 14.393 1.856 0.765 11.429 28.442
2005 14.164 1.937 0.922 11.416 28.440
2006 13.570 1.878 0.974 12.024 28.446
2007 13.637 2.028 1.170 13.285 30.121
2008 14.474 1.679 1.181 13.656 30.990
2009 15.179 1.727 1.212 15.399 33.517
2010 18.065 1.373 1.220 15.191 35.848
2011 15.183 1.565 1.135 15.441 33.324
2012 14.120 1.358 1.133 14.748 31.358
2013 14.152 1.367 1.135 14.995 31.649
2014 14.027 1.382 1.156 15.324 31.889

Temporary Assistance for Needy Families (TANF): Financing Issues
Congressional Research Service 28
Fiscal Year
Federal
Expenditures
Transfers to
the Child
Care and
Development
Fund
Transfers to
the Social
Services
Block Grant
State
Expenditures Totals
In Billions of Constant FY2014 Dollars
1987 20.991 17.929 38.920
1988 20.974 17.678 38.652
1989 20.824 17.555 38.379
1990 21.919 18.666 40.585
1991 22.989 19.737 42.726
1992 24.687 21.445 46.131
1993 24.326 21.232 45.558
1994 25.140 22.383 47.523
1995 25.213 23.178 48.391
1996 22.850 21.413 44.263
1997 18.641 0.348 0.528 16.722 36.239
1998 16.501 1.144 1.625 15.527 34.798
1999 17.594 3.672 1.879 15.368 38.514
2000 18.498 3.335 1.515 15.752 39.100
2001 20.031 2.542 1.250 14.337 38.161
2002 19.244 2.541 1.361 14.283 37.429
2003 20.950 2.307 1.195 13.001 37.453
2004 18.131 2.338 0.964 14.397 35.829
2005 17.274 2.363 1.125 13.924 34.686
2006 15.963 2.209 1.146 14.144 33.461
2007 15.674 2.331 1.345 15.270 34.620
2008 15.928 1.848 1.300 15.028 34.103
2009 16.758 1.906 1.338 17.001 37.004
2010 19.614 1.490 1.325 16.493 38.922
2011 16.059 1.655 1.201 16.331 35.247
2012 14.582 1.403 1.170 15.230 32.385
2013 14.381 1.389 1.153 15.238 32.162
2014 14.027 1.382 1.156 15.324 31.889
Source: Congressional Research Service (CRS), based on data from the U.S. Department of Health and Human
Services (HHS).
Notes: Constant dollars were computed using the Consumer Price Index for all Urban Consumers (CPI-U).

Temporary Assistance for Needy Families (TANF): Financing Issues
Congressional Research Service 29
Table B-2. Federal and State Expenditures and Transfers by Spending Category,
Selected Years FY1995-FY2014
FY1995 Expenditures Under TANF’s Predecessor Programs
FY1995 FY2000 FY2014
In Billions of Dollars
Basic Assistance $21.9 $11.2 $8.4
Administration 3.4 2.6 2.3
Work Program 1.6 2.5 2.2
Child Care 0.9 5.9 5.1
Other Work Supports 0.0 1.4 3.0
Other 3.2 4.7 10.9
Totals 31.0 28.3 31.9
As a Percent of Total Federal and State Dollars
Basic Assistance 70.7% 39.5% 26.5%
Administration 10.9 9.2 7.1
Work Program 5.1 8.8 6.8
Child Care 3.1 21.0 16.1
Other Work Supports 0.0 4.8 9.5
Other 10.3 16.7 34.1
Totals 100.0 100.0 100.0
Source: Congressional Research Service (CRS) based on data from the U.S. Department of Health and Human
Services (HHS).
Table B-3. TANF and Predecessor Program Expenditures for Cash Assistance,
FY1987-FY2014
(In billions of dollars)
Fiscal Year
Federal
Expenditures
State
Expenditures
Total
Expenditures
1987 $8.805 $7.445 $16.250
1988 9.001 7.590 16.591
1989 9.290 7.873 17.163
1990 10.091 8.373 18.464
1991 11.100 9.171 20.270
1992 12.193 9.971 22.164
1993 12.203 9.994 22.197
1994 12.445 10.263 22.708
1995 11.954 9.991 21.945
1996 11.003 9.326 20.329

Temporary Assistance for Needy Families (TANF): Financing Issues
Congressional Research Service 30
Fiscal Year
Federal Expenditures
State Expenditures
Total Expenditures
1997 9.724 7.878 17.603
1998 7.253 6.674 13.928
1999 6.988 6.178 13.166
2000 5.444 5.736 11.180
2001 4.860 5.283 10.143
2002 4.554 4.854 9.408
2003 5.820 4.398 10.219
2004 4.717 5.652 10.368
2005 5.193 5.546 10.739
2006 4.926 4.980 9.906
2007 4.532 4.583 9.115
2008 4.755 3.894 8.649
2009 4.504 4.820 9.324
2010 6.889 3.810 10.699
2011 5.255 4.350 9.604
2012 5.003 3.979 8.982
2013 4.485 4.253 8.738
2014 4.486 3.957 8.443
In Billions of Constant FY2014 Dollars
1987 18.492 15.634 34.126
1988 18.154 15.308 33.462
1989 17.887 15.158 33.045
1990 18.505 15.354 33.859
1991 19.377 16.010 35.387
1992 20.663 16.897 37.560
1993 20.070 16.438 36.508
1994 19.945 16.448 36.394
1995 18.635 15.576 34.211
1996 16.686 14.143 30.829
1997 14.364 11.637 26.002
1998 10.542 9.700 20.243
1999 9.965 8.809 18.775
2000 7.524 7.928 15.453
2001 6.508 7.074 13.582
2002 6.008 6.403 12.412
2003 7.502 5.669 13.171

Temporary Assistance for Needy Families (TANF): Financing Issues
Congressional Research Service 31
Fiscal Year
Federal Expenditures
State Expenditures
Total Expenditures
2004 5.942 7.120 13.061
2005 6.334 6.764 13.098
2006 5.794 5.858 11.653
2007 5.209 5.267 10.477
2008 5.233 4.285 9.518
2009 4.972 5.321 10.294
2010 7.480 4.137 11.617
2011 5.558 4.600 10.158
2012 5.167 4.109 9.276
2013 4.558 4.322 8.879
2014 4.486 3.957 8.443
Source: Congressional Research Service (CRS), based on data from the U.S. Department of Health and Human
Services (HHS).
Note: Constant dollars were computed using the Consumer Price Index for all Urban Consumers (CPI-U).
Table B-4. Federal and State Expenditures and Transfers to Child Care Under TANF,
FY1997-FY2014
(In billions of dollars)
Fiscal
Year
Transfers to
CCDF
Federal TANF
Child Care
Expenditures
TANF MOE
Child Care
Expenditures
Total TANF
Child Care
Transfers and
Expenditures
1997 $0.235 $0.013 $0.801 $1.050
1998 0.787 0.371 1.059 2.217
1999 2.575 0.602 1.501 4.679
2000 2.413 1.553 1.966 5.932
2001 1.899 1.643 1.809 5.350
2002 1.926 1.572 1.932 5.431
2003 1.790 1.698 1.770 5.259
2004 1.856 1.427 1.924 5.206
2005 1.937 1.279 1.918 5.134
2006 1.878 1.238 2.304 5.420
2007 2.028 1.168 2.549 5.745
2008 1.679 1.622 2.614 5.915
2009 1.727 1.787 2.347 5.861

Temporary Assistance for Needy Families (TANF): Financing Issues
Congressional Research Service 32
Fiscal
Year
Transfers to
CCDF
Federal TANF
Child Care
Expenditures
TANF MOE
Child Care
Expenditures
Total TANF
Child Care
Transfers and
Expenditures
2010 1.373 1.426 2.644 5.442
2011 1.565 1.352 2.606 5.523
2012 1.358 1.233 2.431 5.022
2013 1.367 1.110 2.529 5.006
2014 1.382 1.232 2.512 5.127
In Billions of Constant FY2014 Dollars
1997 0.348 0.020 1.184 1.551
1998 1.144 0.540 1.538 3.222
1999 3.672 0.859 2.141 6.672
2000 3.335 2.146 2.717 8.198
2001 2.542 2.199 2.422 7.164
2002 2.541 2.074 2.549 7.164
2003 2.307 2.189 2.282 6.778
2004 2.338 1.797 2.423 6.558
2005 2.363 1.560 2.339 6.262
2006 2.209 1.457 2.710 6.376
2007 2.331 1.342 2.930 6.603
2008 1.848 1.785 2.877 6.509
2009 1.906 1.973 2.591 6.470
2010 1.490 1.548 2.871 5.909
2011 1.655 1.430 2.756 5.841
2012 1.403 1.274 2.511 5.187
2013 1.389 1.128 2.570 5.088
2014 1.382 1.232 2.512 5.127
Source: Congressional Research Service (CRS), based on data from the U.S. Department of Health and Human
Services (HHS).
Notes: Constant dollars were computed using the Consumer Price Index for all Urban Consumers (CPI-U).
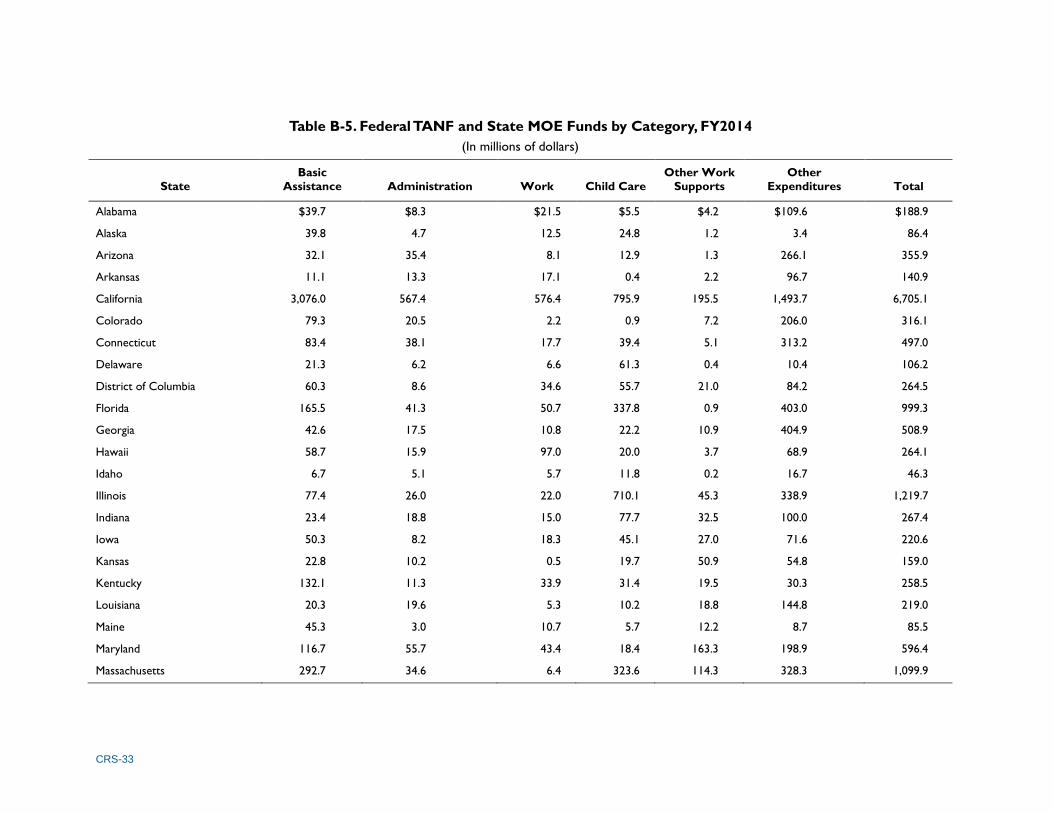
CRS-33
Table B-5. Federal TANF and State MOE Funds by Category, FY2014
(In millions of dollars)
State
Basic
Assistance Administration Work Child Care
Other Work
Supports
Other
Expenditures Total
Alabama $39.7 $8.3 $21.5 $5.5 $4.2 $109.6 $188.9
Alaska 39.8 4.7 12.5 24.8 1.2 3.4 86.4
Arizona 32.1 35.4 8.1 12.9 1.3 266.1 355.9
Arkansas 11.1 13.3 17.1 0.4 2.2 96.7 140.9
California 3,076.0 567.4 576.4 795.9 195.5 1,493.7 6,705.1
Colorado 79.3 20.5 2.2 0.9 7.2 206.0 316.1
Connecticut 83.4 38.1 17.7 39.4 5.1 313.2 497.0
Delaware 21.3 6.2 6.6 61.3 0.4 10.4 106.2
District of Columbia 60.3 8.6 34.6 55.7 21.0 84.2 264.5
Florida 165.5 41.3 50.7 337.8 0.9 403.0 999.3
Georgia 42.6 17.5 10.8 22.2 10.9 404.9 508.9
Hawaii 58.7 15.9 97.0 20.0 3.7 68.9 264.1
Idaho 6.7 5.1 5.7 11.8 0.2 16.7 46.3
Illinois 77.4 26.0 22.0 710.1 45.3 338.9 1,219.7
Indiana 23.4 18.8 15.0 77.7 32.5 100.0 267.4
Iowa 50.3 8.2 18.3 45.1 27.0 71.6 220.6
Kansas 22.8 10.2 0.5 19.7 50.9 54.8 159.0
Kentucky 132.1 11.3 33.9 31.4 19.5 30.3 258.5
Louisiana 20.3 19.6 5.3 10.2 18.8 144.8 219.0
Maine 45.3 3.0 10.7 5.7 12.2 8.7 85.5
Maryland 116.7 55.7 43.4 18.4 163.3 198.9 596.4
Massachusetts 292.7 34.6 6.4 323.6 114.3 328.3 1,099.9

CRS-34
State
Basic
Assistance Administration Work Child Care
Other Work
Supports
Other
Expenditures Total
Michigan 167.2 159.9 62.9 30.9 56.4 918.4 1,395.7
Minnesota 86.0 46.5 66.2 144.1 162.0 46.6 551.4
Mississippi 14.4 3.6 32.5 19.1 13.0 16.6 99.2
Missouri 83.8 4.7 23.6 41.0 0.0 242.0 395.2
Montana 15.8 6.2 11.0 10.5 0.0 9.2 52.7
Nebraska 23.4 3.8 18.1 23.5 37.4 10.1 116.3
Nevada 50.0 11.1 1.3 0.0 1.3 34.5 98.3
New Hampshire 21.6 11.6 6.6 8.0 1.2 12.6 61.6
New Jersey 218.5 67.2 96.5 114.0 202.4 594.7 1,293.4
New Mexico 47.2 7.6 13.0 36.2 47.6 63.2 214.8
New York 1,747.5 338.2 168.2 438.8 1,494.9 1,541.8 5,729.4
North Carolina 54.3 49.5 34.3 175.1 55.1 244.2 612.4
North Dakota 4.6 4.0 3.9 1.0 1.3 22.3 37.2
Ohio 282.6 161.0 73.8 399.4 11.6 196.8 1,125.3
Oklahoma 18.3 25.5 0.0 63.2 26.9 63.1 196.9
Oregon 140.2 47.4 18.6 13.7 2.1 119.3 341.2
Pennsylvania 256.2 72.5 85.8 411.4 9.2 223.8 1,058.8
Rhode Island 23.3 10.9 10.3 24.0 13.1 94.5 176.1
South Carolina 21.8 18.4 15.0 4.1 2.1 209.8 271.2
South Dakota 15.5 2.7 4.1 -3.5 0.1 6.4 25.4
Tennessee 81.3 32.5 38.4 44.3 0.0 70.2 266.7
Texas 64.4 56.2 89.3 26.7 4.6 646.9 888.1
Utah 24.6 5.7 28.0 13.5 0.0 22.1 93.9
Vermont 18.5 8.0 0.1 27.8 26.4 11.8 92.5

CRS-35
State
Basic
Assistance Administration Work Child Care
Other Work
Supports
Other
Expenditures Total
Virginia 99.4 21.4 52.1 39.1 8.1 69.0 289.1
Washington 180.9 65.7 164.1 158.2 3.7 401.0 973.7
West Virginia 30.6 28.7 1.6 11.9 31.4 36.8 141.0
Wisconsin 150.7 27.7 29.7 219.3 65.9 163.9 657.3
Wyoming 3.2 7.4 2.7 0.5 0.0 15.5 29.2
Totals 8,443.4 2,275.2 2,168.3 5,126.6 3,015.4 10,860.3 31,889.3
Source: Congressional Research Service (CRS), based on data from the U.S. Department of Health and Human Services (HHS).
Note: Negative numbers denote adjustments to prior years’ expenditures.
Table B-6. Federal TANF and State MOE Funds by Category, as a Percentage of Total Federal TANF
and State MOE Funds Used, FY2014
Basic
Assistance Administration Work Child Care
Other Work
Supports
Other
Expenditures Total
Alabama 21.0% 4.4% 11.4% 2.9% 2.2% 58.0% 100.0%
Alaska 46.0 5.5 14.5 28.7 1.4 3.9 100.0
Arizona 9.0 9.9 2.3 3.6 0.4 74.8 100.0
Arkansas 7.9 9.5 12.1 0.3 1.6 68.7 100.0
California 45.9 8.5 8.6 11.9 2.9 22.3 100.0
Colorado 25.1 6.5 0.7 0.3 2.3 65.2 100.0
Connecticut 16.8 7.7 3.6 7.9 1.0 63.0 100.0
Delaware 20.1 5.9 6.2 57.7 0.4 9.8 100.0
District of Columbia 22.8 3.2 13.1 21.1 7.9 31.8 100.0
Florida 16.6 4.1 5.1 33.8 0.1 40.3 100.0
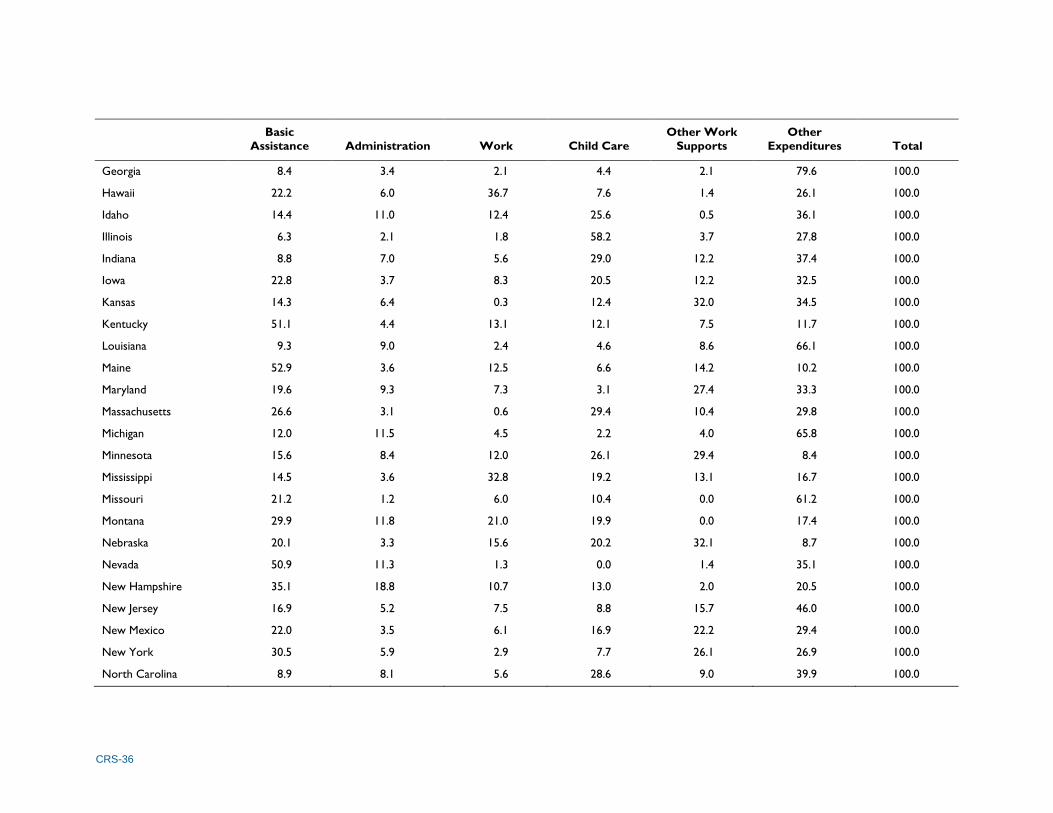
CRS-36
Basic
Assistance Administration Work Child Care
Other Work
Supports
Other
Expenditures Total
Georgia 8.4 3.4 2.1 4.4 2.1 79.6 100.0
Hawaii 22.2 6.0 36.7 7.6 1.4 26.1 100.0
Idaho 14.4 11.0 12.4 25.6 0.5 36.1 100.0
Illinois 6.3 2.1 1.8 58.2 3.7 27.8 100.0
Indiana 8.8 7.0 5.6 29.0 12.2 37.4 100.0
Iowa 22.8 3.7 8.3 20.5 12.2 32.5 100.0
Kansas 14.3 6.4 0.3 12.4 32.0 34.5 100.0
Kentucky 51.1 4.4 13.1 12.1 7.5 11.7 100.0
Louisiana 9.3 9.0 2.4 4.6 8.6 66.1 100.0
Maine 52.9 3.6 12.5 6.6 14.2 10.2 100.0
Maryland 19.6 9.3 7.3 3.1 27.4 33.3 100.0
Massachusetts 26.6 3.1 0.6 29.4 10.4 29.8 100.0
Michigan 12.0 11.5 4.5 2.2 4.0 65.8 100.0
Minnesota 15.6 8.4 12.0 26.1 29.4 8.4 100.0
Mississippi 14.5 3.6 32.8 19.2 13.1 16.7 100.0
Missouri 21.2 1.2 6.0 10.4 0.0 61.2 100.0
Montana 29.9 11.8 21.0 19.9 0.0 17.4 100.0
Nebraska 20.1 3.3 15.6 20.2 32.1 8.7 100.0
Nevada 50.9 11.3 1.3 0.0 1.4 35.1 100.0
New Hampshire 35.1 18.8 10.7 13.0 2.0 20.5 100.0
New Jersey 16.9 5.2 7.5 8.8 15.7 46.0 100.0
New Mexico 22.0 3.5 6.1 16.9 22.2 29.4 100.0
New York 30.5 5.9 2.9 7.7 26.1 26.9 100.0
North Carolina 8.9 8.1 5.6 28.6 9.0 39.9 100.0

CRS-37
Basic
Assistance Administration Work Child Care
Other Work
Supports
Other
Expenditures Total
North Dakota 12.5 10.7 10.5 2.7 3.6 60.1 100.0
Ohio 25.1 14.3 6.6 35.5 1.0 17.5 100.0
Oklahoma 9.3 12.9 0.0 32.1 13.7 32.0 100.0
Oregon 41.1 13.9 5.4 4.0 0.6 35.0 100.0
Pennsylvania 24.2 6.8 8.1 38.9 0.9 21.1 100.0
Rhode Island 13.2 6.2 5.8 13.6 7.4 53.7 100.0
South Carolina 8.1 6.8 5.5 1.5 0.8 77.4 100.0
South Dakota 61.2 10.7 16.2 -13.6 0.4 25.1 100.0
Tennessee 30.5 12.2 14.4 16.6 0.0 26.3 100.0
Texas 7.2 6.3 10.1 3.0 0.5 72.8 100.0
Utah 26.2 6.1 29.8 14.4 0.0 23.6 100.0
Vermont 20.0 8.6 0.1 30.0 28.5 12.8 100.0
Virginia 34.4 7.4 18.0 13.5 2.8 23.9 100.0
Washington 18.6 6.7 16.9 16.2 0.4 41.2 100.0
West Virginia 21.7 20.4 1.1 8.4 22.3 26.1 100.0
Wisconsin 22.9 4.2 4.5 33.4 10.0 24.9 100.0
Wyoming 10.8 25.2 9.2 1.8 0.0 53.0 100.0
Totals 26.5 7.1 6.8 16.1 9.5 34.1 100.0
Source: Congressional Research Service (CRS), based on data from the U.S. Department of Health and Human Services (HHS).
Note: Negative numbers denote adjustments to prior years’ expenditures.

Temporary Assistance for Needy Families (TANF): Financing Issues
Congressional Research Service 38
Appendix C. Table Showing Allocations Based on
Poor Children Compared with the Current TANF
Basic Block Grant
Table C-1. Current Law TANF Basic Block Grant Versus A Basic Block Grant Based
on Equal Grants Per Poor Child, Official Poverty Definition
(Budget-neutral scenario, in billions of dollars)
Change from Current Law
State
Current
Law
Equal Grants
Per Poor
Child $ Percentage
Alabama $93 $308 $215 $230.2
Alaska 64 26 -38 -59.7
Arizona 222 433 211 94.7
Arkansas 57 202 145 256.1
California 3,734 2,172 -1,562 -41.8
Colorado 136 210 74 54.3
Connecticut 267 115 -152 -56.9
Delaware 32 39 7 21.4
District of Columbia 93 33 -60 -64.5
Florida 562 1,007 444 79.0
Georgia 331 672 341 103.0
Hawaii 99 45 -54 -54.8
Idaho 32 83 51 161.2
Illinois 585 629 43 7.4
Indiana 207 348 141 68.4
Iowa 132 117 -14 -10.9
Kansas 102 135 33 32.0
Kentucky 181 260 78 43.3
Louisiana 164 319 155 94.4
Maine 78 48 -30 -38.8
Maryland 229 189 -40 -17.6
Massachusetts 459 228 -231 -50.3
Michigan 775 535 -240 -30.9
Minnesota 268 181 -87 -32.6
Mississippi 87 253 166 191.1
Missouri 217 312 94 43.5

Temporary Assistance for Needy Families (TANF): Financing Issues
Congressional Research Service 39
Change from Current Law
State
Current Law
Equal Grants Per Poor
Child $ Percentage
Montana 46 47 1 2.6
Nebraska 58 80 22 37.5
Nevada 44 151 107 244.1
New Hampshire 39 30 -9 -22.7
New Jersey 404 337 -67 -16.5
New Mexico 126 155 29 22.8
New York 2,443 980 -1,463 -59.9
North Carolina 302 578 275 91.1
North Dakota 26 20 -6 -22.5
Ohio 728 605 -123 -16.9
Oklahoma 148 227 79 53.1
Oregon 168 186 18 10.6
Pennsylvania 719 526 -194 -26.9
Rhode Island 95 47 -48 -50.2
South Carolina 100 298 198 197.7
South Dakota 22 39 17 76.2
Tennessee 192 398 206 107.7
Texas 486 1,783 1,296 266.6
Utah 77 132 56 72.4
Vermont 47 19 -28 -60.1
Virginia 158 296 138 87.2
Washington 404 299 -105 -26.0
West Virginia 110 100 -11 -9.6
Wisconsin 318 242 -76 -23.9
Wyoming 22 19 -3 -13.7
Totals 16,489 16,489 0 0.0
Source: Congressional Research Service (CRS), based on data from the U.S. Department of Health and Human Services (HHS) and U.S. Census Bureau.

Temporary Assistance for Needy Families (TANF): Financing Issues
Congressional Research Service 40
Appendix D. Unspent TANF Funds
Table D-1. Unspent TANF Funds, End of FY1997-FY2014
(In billions of dollars)
Obligated but not Spent Unobligated
Total Unspent Funds
1997 $1.537 $1.175 $2.712
1998 2.756 3.347 6.103
1999 4.173 2.655 6.829
2000 4.349 2.777 7.126
2001 3.820 2.547 6.367
2002 3.133 2.678 5.811
2003 1.580 2.306 3.886
2004 1.863 1.887 3.750
2005 1.843 2.104 3.947
2006 1.896 2.151 4.047
2007 2.087 1.886 3.974
2008 1.343 1.871 3.214
2009 1.586 2.065 3.651
2010 1.873 2.066 3.939
2011 1.075 1.855 2.930
2012 1.409 1.684 3.093
2013 1.519 1.525 3.044
2014 1.730 1.622 3.352
In Billions of Constant FY2014 Dollars
1997 2.270 1.736 4.006
1998 4.006 4.865 8.871
1999 5.951 3.787 9.738
2000 6.010 3.838 9.849
2001 5.115 3.410 8.526
2002 4.133 3.533 7.667
2003 2.037 2.972 5.009
2004 2.347 2.377 4.724
2005 2.248 2.566 4.814
2006 2.230 2.530 4.760
2007 2.399 2.168 4.567
2008 1.477 2.059 3.537

Temporary Assistance for Needy Families (TANF): Financing Issues
Congressional Research Service 41
Obligated but not
Spent Unobligated
Total Unspent
Funds
2009 1.751 2.280 4.031
2010 2.034 2.243 4.277
2011 1.137 1.962 3.099
2012 1.455 1.739 3.195
2013 1.543 1.550 3.093
2014 1.730 1.622 3.352
Source: Congressional Research Service (CRS), based on data from the U.S. Department of Health and Human
Services (HHS).
Notes: Constant dollars were computed using the Consumer Price Index for all Urban Consumers (CPI-U).
Table D-2. Unspent TANF Funds by State, End of FY2014
(In billions of dollars)
State
Obligated but not Spent Unobligated
Total Unspent Funds
Alabama $2.9 $30.7 $33.6
Alaska 0.0 63.4 63.4
Arizona 0.4 0.0 0.4
Arkansas 0.0 49.5 49.5
California 89.4 0.0 89.4
Colorado 14.0 7.7 21.7
Connecticut 0.2 6.3 6.4
Delaware 0.8 7.7 8.5
District of Columbia 2.0 80.7 82.7
Florida 34.3 0.0 34.3
Georgia 34.9 42.5 77.4
Hawaii 3.8 86.7 90.5
Idaho 30.3 0.0 30.3
Illinois 0.0 14.4 14.4
Indiana 301.1 2.6 303.7
Iowa 16.2 11.6 27.7
Kansas 10.7 42.1 52.8
Kentucky 0.0 4.4 4.4
Louisiana 0.0 0.0 0.0
Maine 0.0 58.8 58.8
Maryland 0.0 0.0 0.0
Massachusetts 0.0 0.0 0.0
Michigan 0.0 38.9 38.9

Temporary Assistance for Needy Families (TANF): Financing Issues
Congressional Research Service 42
State
Obligated but
not Spent Unobligated
Total Unspent
Funds
Minnesota 60.5 69.6 130.2
Mississippi 0.0 21.2 21.2
Missouri 9.7 0.0 9.7
Montana 41.8 0.0 41.8
Nebraska 0.2 56.1 56.3
Nevada 6.5 0.0 6.5
New Hampshire 0.0 29.3 29.3
New Jersey 29.5 13.9 43.5
New Mexico 75.2 0.0 75.2
New York 171.6 20.9 192.5
North Carolina 201.1 3.5 204.6
North Dakota 0.0 14.1 14.1
Ohio 197.6 79.6 277.2
Oklahoma 61.8 0.0 61.8
Oregon 0.0 0.0 0.0
Pennsylvania 65.6 355.4 421.0
Rhode Island 12.1 0.0 12.1
South Carolina 0.0 35.5 35.5
South Dakota 0.0 19.4 19.4
Tennessee 0.0 153.1 153.1
Texas 188.7 0.0 188.7
Utah 0.0 116.0 116.0
Vermont 0.0 0.0 0.0
Virginia 0.7 53.6 54.3
Washington 65.0 0.0 65.0
West Virginia 0.0 3.7 3.7
Wisconsin 0.0 5.0 5.0
Wyoming 1.9 23.9 25.7
Total 1,730.1 1,622.0 3,352.1
Source: Congressional Research Service (CRS), based on data from the U.S. Department of Health and Human
Services (HHS).

Temporary Assistance for Needy Families (TANF): Financing Issues
Congressional Research Service 43
Author Contact Information
Gene Falk
Specialist in Social Policy
[email protected], 7-7344
Acknowledgments
Austin Frerick, formerly of the Domestic Social Policy Division, provided research assistance for this
report. CRS Graphics Specialist Amber Wilhelm produced the figures. CRS GIS Analyst Jim Uzel
produced the maps.