SECTION 7-TEMPORARY ASSISTANCE FOR NEEDY FAMILIES (TANF ... · PDF fileSECTION 7-TEMPORARY...
98
7-1 SECTION 7-TEMPORARY ASSISTANCE FOR NEEDY FAMILIES (TANF) CONTENTS Brief Summary and History Outline of Program Purpose Allowed Uses of Block Grant Major Conditions Attached to TANF Grants Benefits Child Care Interaction with Other Major Benefit Programs Privatization/Charitable Choice Enforcement of Penalties Against States State TANF Programs State Plan Requirements Funding of TANF Basic Family Assistance Grants State Spending Requirement (MOE) Supplemental Grants to States with High Population Growth and/or Low AFDC-Related Federal Spending Per Poor Person Welfare-to-Work Grants Contingency Fund Loan Fund Bonus Funds TANF for Indians AFDC/TANF Data Highlights Caseloads Benefits Phase-out Levels How States Use TANF Funds Time Limits Expenditures Work Activities and Participation AFDC/TANF Earnings Sanctions TANF Exits and Returns Characteristics of AFDC/TANF Families Composition of Families, 1969-2001 Marital Status of Parents Race and Ethnicity of AFDC/TANF Adults Educational Attainment of TANF Adults
-
Upload
hoangthien -
Category
Documents
-
view
221 -
download
0
Transcript of SECTION 7-TEMPORARY ASSISTANCE FOR NEEDY FAMILIES (TANF ... · PDF fileSECTION 7-TEMPORARY...
7-1
SECTION 7-TEMPORARY ASSISTANCE FOR NEEDY FAMILIES (TANF)
CONTENTS
Brief Summary and History Outline of Program
Purpose Allowed Uses of Block Grant Major Conditions Attached to TANF Grants Benefits Child Care Interaction with Other Major Benefit Programs Privatization/Charitable Choice Enforcement of Penalties Against States
State TANF Programs State Plan Requirements
Funding of TANF Basic Family Assistance Grants State Spending Requirement (MOE) Supplemental Grants to States with High Population Growth and/or
Low AFDC-Related Federal Spending Per Poor Person Welfare-to-Work Grants Contingency Fund Loan Fund Bonus Funds
TANF for Indians AFDC/TANF Data
Highlights Caseloads Benefits Phase-out Levels How States Use TANF Funds Time Limits Expenditures Work Activities and Participation AFDC/TANF Earnings Sanctions TANF Exits and Returns
Characteristics of AFDC/TANF Families Composition of Families, 1969-2001 Marital Status of Parents Race and Ethnicity of AFDC/TANF Adults Educational Attainment of TANF Adults
7-2 Living Arrangements of TANF Children
Welfare-to-Work (WTW) Grant Program Legislative History References
BRIEF SUMMARY AND HISTORY
(Note: This section describes the block grant program of Temporary
Assistance for Needy Families as it operated under temporary spending authority in 2003. At the time, House-passed legislation to reauthorize TANF on new terms (H.R. 4) and other bills were pending in the Senate.)
Enacted in August 1996 after three years of debate, the Personal Responsibility and Work Opportunity Reconciliation Act (PRWORA) (P.L. 104-193) repealed the 61-year old program of Aid to Families with Dependent Children (AFDC) and created the block grant program of Temporary Assistance for Needy Families (TANF) in its place. The law entitles States to fixed block grants ($16.5 billion annually) through fiscal year 2002, to operate programs of their own design, but imposes work-trigger time limits, lifetime benefit-cutoff time limits, and minimum work participation rates. Within limits, it allows States to reduce their own spending on behalf of needy children. The 1996 law also sharply expands funding for childcare.
Frustration with the character, size, and cost of AFDC rolls contributed to the dramatic decision by Congress to “end welfare as we know it.” Enrollment had soared to an all-time peak in 1994, covering 5 million families and more than one-eighth of U.S. children. More than half of AFDC children were born outside marriage, and three-fourths had an able-bodied parent who lived away from home. Almost half of the families had received benefits for more than 5 years, counting repeat spells. Benefit costs peaked in fiscal year 1994 at $22.8 billion ($12.5 billion in Federal funds, $10.3 billion in State/local funds). Some policymakers urged that Congress put a cap on AFDC funds to control costs. Some maintained that offering permanent help for needy children in single-parent families had encouraged family breakup, enabled non-marital births, and fostered long-term dependency.
Repeated efforts by Congress dating back to the 1960s to reduce welfare use and promote self-sufficiency generally had been discouraging. Reform measures had included “rehabilitative” services; work requirements, work rewards; education and training; support services including child care; child support enforcement; and provisions to establish paternity of non-marital children. In 1988, Congress enacted the Family Support Act, which stressed the mutual obligation of government and welfare recipient to promote self-sufficiency of AFDC families. In the early 1990s many States received permission, through waivers from one or more AFDC Federal rules, to test their own reform ideas-special behavioral rules, rewards, penalties, welfare-to-work strategies. By early 1995, many governors pressed for a cash welfare block grant to free them from AFDC rules. The concept of a fixed block grant that States could use for temporary and work-conditioned programs of
7-3 their own design was included in 1995 reform bills passed by Congress but vetoed, and again in the successful 1996 measure, PRWORA. By the time of TANF’s passage, AFDC enrollment had decreased to 4.4 million families. The mandatory start date for TANF was July 1, 1997, but most States made the transition from AFDC earlier. TANF combined into a single block grant peak-year Federal funding levels for AFDC benefits and administration and two related programs - Emergency Assistance to Needy families (EA) and Job Opportunities and Basic Skills Training program (JOBS). It entitles each State to an annual family assistance grant equal to peak funding paid by the Federal government to the State for AFDC benefits and administration, EA, and JOBS during the period, fiscal years1992-1995. (The law also entitles States to separate child care funds.) From their own funds, States are required to spend on needy families at least 75 percent of their “historic” level, defined as fiscal year 1994 spending on programs replaced by TANF, including AFDC-related child care. This is known as the maintenance of effort (MOE) rule. (If a State fails to achieve a required work participation rate, its MOE rises to 80 percent.)
The 1996 welfare law also appropriated supplemental grants for some States with below-average fiscal year 1994 Federal welfare spending per poor person and/or above average population growth, bonus funds for reducing non-marital birth rates while also reducing abortion rates, bonus funds for high performance, and a contingency fund. In 1997, Congress added to TANF a special Welfare-to-Work (WTW) program of matching formula grants and some competitive grants, with funding for fiscal years 1998 and 1999.
The TANF law makes family assistance grants available to the outlying areas of Guam, Puerto Rico, and the Virgin Islands, all of which participated in AFDC. (American Samoa was eligible for AFDC but did not operate the program; it could participate in TANF under special rules that provide a 75 percent Federal match.) The law permits Indian tribes (defined to include Alaska Native Organizations) to conduct their own tribal family assistance programs, with funds deducted from their State’s TANF grant. Indian tribes were excluded from operating AFDC (but some participated in JOBS), and some special provisions apply to TANF for Indian tribes.
The 1996 law spells out required work hours and creditable activities, puts a time limit on the use of Federal funds for basic assistance to a family, and makes some persons ineligible. Otherwise, it permits States to design their own programs. As under AFDC, States decide how needy families must be to receive help, and States decide maximum benefit levels. For major differences between AFDC and TANF, see Committee, 2000, p. 353-354.
The size and character of the welfare rolls have changed under TANF. This is illustrated by comparing FY1996 AFDC data with FY2001 TANF data:
Caseload size in terms of families dropped 53 percent, from 4.5 million to 2.1 million (see Table 7-7).
The number of child-only cases dropped from 978,000 to 787,000, but their share of all cases climbed from 21.5 percent to 37.2 percent (see Table 7-29).
7-4 The share of adults with paid jobs more than doubled, from 11.3 percent
to 25.8 percent (see Chart 7-5). The share of non-Hispanic white adult recipients declined from
39.7 percent to 32.2 percent (see Table 7-30). The number of teen parents who receive welfare declined 50 percent,
from 242,913 to 122,265, but their share of all recipients rose from 1.9 percent to 2.3 percent (see Table 7-29).
The share of AFDC/TANF dollars spent on cash welfare declined from about 73 percent to 44 percent. (Chart 7-3 shows 2001 spending breakdown.) The caseload now includes many families who receive services, including work support, rather than cash.
OUTLINE OF PROGRAM
PURPOSE
Section 401(a) of the Social Security Act says that the purpose of TANF is to
increase flexibility of States in operating a program designed to: 1. Provide assistance to needy families so that children may be cared for in
their own homes or in the homes of relatives; 2. End the dependence of needy parents on government benefits by
promoting job preparation, work, and marriage; 3. Prevent and reduce the incidence of out-of-wedlock pregnancies and
establish annual numerical goals for preventing and reducing the incidence of these pregnancies; and
4. Encourage the formation and maintenance of two-parent families.
ALLOWED USES OF BLOCK GRANT
The law provides that States may use their family assistance grant “in any manner reasonably calculated” to promote any of the four goals above. Expenditures for the first two goals must be made on behalf of needy families, but spending aimed at the latter two goals-reduction of non-marital pregnancies and promotion of two-parent families-may be made for non-needy families.
States also may use TANF funds to continue other activities (not related to the four program objectives) that they were authorized to undertake in individual State plans under the predecessor AFDC, Emergency Assistance (EA), or Job Opportunities and Basic Skills (JOBS) programs. They may make limited transfers of TANF funds (totaling 30 percent) to the Child Care and Development Block Grant (CCDBG) and the Social Service Block Grant (SSBG), with the SSBG transfer no greater than 10 percent. They may use TANF funds (within overall transfer limits) as matching funds for job access grants.1 The law also explicitly
1 Authorized by P.L. 105-277, job access grants are matching grants to local governments and nonprofit organization for transportation services, including reverse commuter projects for welfare recipients and other low-income persons (U.S. General Accounting Office, 2002).
7-5 permits States to use TANF funds to “carry out” a program to fund individual development accounts established by persons eligible for TANF assistance. Clearly, TANF is a funding stream for a variety of allowed purposes, not just a program of cash welfare aid.
TANF funds may be carried over from fiscal year to fiscal year without limit. However, carried over funds may be spent only for “assistance.” The law does not define assistance, but regulations adopted by the Department of Health and Human Services (DHHS) restrict “assistance” to benefits designed to meet a family’s “ongoing basic needs” (that is, for food, clothing, shelter, utilities, household goods, personal care items, and general incidental expenses) plus supportive services such as transportation and child care for families who are not employed. Funds used for “nonassistance” (including nonrecurrent, short-term benefits, work subsidies, and supportive services to employed families) must be obligated by the end of the fiscal year for which they are awarded, and expended by the end of the next year.
TANF funds cannot be used to: fund activities required under the State plans of child support enforcement or foster care and adoption assistance; finance the construction or purchase of buildings; finance a funding deficiency in another Federal program; provide medical services other than prepregnancy family planning services; or assist a family that includes a person who, as an adult or minor household head, has received 60 months of assistance. Administrative costs may not exceed 15 percent except in the case of expenditures for information technology and computerization needed for tracking or monitoring.
MAJOR CONDITIONS ATTACHED TO TANF GRANTS
TANF sets some eligibility/ineligibility conditions; it imposes work rules and sets a 5-year time limit for Federally funded benefits; it requires States to spend certain sums of their own funds on needy families, under “maintenance of effort” (MOE) rules; it allows waiver from its rules under restricted conditions; and it requires States to report certain expenditure data and some data on recipient families.
Eligibility/ineligibility
A State may give TANF assistance to a family only if it includes a minor child or pregnant person. To be eligible, families must assign child/spousal support rights to the State. Ineligible are unwed mothers under 18 and their children unless they live in an adult-supervised arrangement (the State may waive this rule for good cause) and (if a high-school dropout) attend school once their youngest child is 12 weeks old. Ineligible for 5 years are noncitizens who enter the U.S. after PRWOR’s August 22, 1996 enactment. Also ineligible are fugitive felons and violators of probation/parole and, unless the State opts out by State law, persons convicted of a drug-related felony for conduct occurring after the law’s 1996 enactment (as of June 2002, 8 States had opted out of the ban and some 18 States had modified it by State law.) States that use their own funds to help
7-6 legal immigrants, minor parents not living in an adult-supervised setting, or persons who have received 60 months of Federal benefits may count this spending toward their required MOE. Work rules
TANF law sets work trigger time limits (see below), requires States to achieve minimum rates of work participation, requires States to penalize work infractions by recipients, and sets fiscal penalties for States that fail to achieve participation rates. The Labor Department in May 1999 ruled that the Fair Labor Standards Act (which governs hours and wages) applies to most “workfare” programs, in which TANF recipients participate in exchange for their benefit. Work trigger rule (State definition of work)--In their TANF plans, States must outline how they intend to require parents and (other) caretaker relatives who receive TANF assistance to engage in work, as defined by the State, after a maximum of 24 months of benefits, or earlier, if ready for work then. More than half of the States have adopted the Federal maximum of 24 months as their work trigger time limit. More than a dozen say they require immediate work activity, such as job search. In many States the TANF recipient who takes a paid job remains eligible for a reduced TANF benefit until reaching the State’s absolute benefit cutoff; this is especially likely if the work is part time and the wage rate is relatively low.
TANF law also sets a two-month community service trigger, with tasks and required hours to be decided by States, for recipients not engaged in work or exempt from work, but allows States to opt out by notification of the Governor to DHHS. Only four States (Michigan, New Mexico, South Dakota, and Wisconsin) use this two-month workfare trigger; the others have opted out. However, some other States specify that after a longer period, unemployed TANF recipients will receive aid only if they perform community service or other work in exchange for their benefits. For instance, California allows aid beyond 18 months for those not otherwise working only if the county determines that a job is unavailable and the recipient participates in community services. Delaware and Pennsylvania have similar requirements. Minimum work participation rates (Federal definition of work)--States must achieve minimum rates of participation by adult recipients (or teen parent recipients) of TANF assistance in one or more of 12 activities listed in the statute. The statutory rates, which began in fiscal year 1997 at 25 percent for all families and 75 percent for two-parent families, rose by stages to 40 percent and 90 percent, respectively, in fiscal year 2000. Thereafter, the all-family rate climbed to 45 percent in fiscal year 2001 and to a final peak of 50 percent in fiscal year 2002. The law requires DHHS to reduce a State’s required participation rates if average monthly caseloads are below those of fiscal year 1995. For each percentage point drop in the caseload (not attributed to State policy changes), the required work rate is lowered by one percentage point. A State’s monthly participation rate, expressed as a percentage, equals: (1) the number of families receiving “assistance” that include an adult or minor head of household who is engaged in creditable work for
7-7 the month, divided by (2) the number of all families receiving assistance that include an adult or minor household head recipient (but excluding families subject that month to a penalty for refusal to work, provided they have not been penalized for more than 3 months, whether or not consecutive, in the preceding 12; and excluding families with children under 1, if the State exempts them from work). The same method is used to calculate participation rates of two-parent families. TANF regulations permit States that offer TANF to non-custodial parents to choose whether or not to include them in calculating work participation rates of two-parent families. National participation rates in fiscal year 2001 averaged 34.4 percent for all families and 51.1 percent for two-parent families. Both rates fell short of statutory targets (45 percent and 90 percent, respectively). However, after providing States credit for caseload reductions since FY1995, the all-family target rates in 28 States were reduced to zero--effectively wiped out--and in all jurisdictions except Guam and the Virgin Islands, targets were met. Arkansas, the District of Columbia, Guam, Minnesota, and Mississippi failed their higher two-parent work targets, even after adjustment (Table 7-23). Creditable work activities--The creditable work activities can be grouped by “priority.” In the first priority group are nine activities: unsubsidized employment, subsidized private employment, subsidized public sector employment, work experience, on-the-job training, job search and job readiness assistance (6 weeks maximum of job search creditable per fiscal year, with 12 weeks under certain unemployment conditions), community service programs, vocational educational training (12 months lifetime maximum), and providing child care for a community service participant. In the second priority group are three activities: job skills training directly related to employment, education directly related to employment (high school dropout only), and satisfactory attendance at secondary school or in an equivalent course of study (high school dropout only). Not more than 30 percent of all families and of two-parent families may be credited with work activity by reason of vocational education training or (if teens without a high school diploma) by reason of secondary school attendance or education directly related to employment. Required weekly hours of work participation--To be counted as a work participant, adult TANF recipients generally must be engaged in one of the above creditable activities for at least 30 hours per week, on average, in fiscal years 2000-2002 (fewer hours were required in earlier years), and at least 20 of those hours must be in one of the 9 first priority activities. The law provides two exceptions to this rule: (1) if an adult TANF recipient is the only parent or caretaker relative of a child under age 6, she need work only 20 weekly hours, and (2) if a TANF recipient is a single teen-aged household head or a married teen without a high diploma, she may receive work credit by maintaining satisfactory high school attendance, or, for an average of at least 20 hours weekly, by engaging in schooling directly related to work. Special rules apply to two-parent families. They must work at least 35 hours weekly, with at least 30 hours in first priority activities (the two parents may share the work hours). If the family receives Federally-funded child care and an adult in the family is not disabled or caring for a severely disabled
7-8 child, the shared work requirement rises to 55 hours, of which 50 hours must be in first priority activities. If the second parent in a two-parent family is disabled, the State must treat it as a single-parent family. Penalties to enforce work rules--TANF law prescribes penalties against States that fail to meet work participation rates, and it requires States to penalize recipients for refusal to work. If a State falls short of the required participation rate for a fiscal year, its family assistance grant for the next year is to be reduced by 5 percent (for the first failure to meet the standard). For subsequent years of failure, annual penalties rise by 2 percentage points (thus, 7 percent in second year, 9 percent in third, etc.) with a maximum penalty of 21 percent in any one year. However, the law says that grant reductions shall be based “on the degree of noncompliance,” and the Secretary may reduce the penalty if noncompliance was due to a high rate of unemployment or to “extraordinary circumstances, such as a natural disaster or regional recession.” Before assessing a penalty the Secretary must notify the State of its violation and allow it to enter into a corrective compliance plan. DHHS has indicated that most States that failed fiscal year 1997 and/or fiscal year 1998 two-parent work participation rates have filed corrective action plans.
If an adult recipient of assistance refuses in engage in required work, the law requires the State to reduce aid to the family “pro rata” (or more, at State option) with respect to the period of work refusal, or to discontinue aid, subject to good cause and other exceptions that the State may establish. However, a State may not penalize a single parent caring for a child under age 6 for refusal to work if the parent has a demonstrated inability to obtain needed child care for a reason listed in the law. The law does not define “pro rata” reduction, and the regulations do not prescribe a method. States have adopted various penalties for failing to comply with work requirements: about one-third end the family’s benefit for a first violation; most make a partial benefit cut (removing the adult from the grant). Penalties are increased in size or duration for repeat violations. Ultimately, under some circumstances, 38 States end family benefits (seven for life).
TANF law also explicitly permits a State to reduce a family’s benefit, by an amount the State considers “appropriate,” if a family member fails with good cause to comply with an individual responsibility plan (IRP) that she has signed. Most State TANF plans include use of IRPs that establish an employment goal, set forth obligations of the recipient, and describe services to be provided by the State.
Nondisplacement--A TANF recipient may fill a vacant position, but may not be assigned to a position from which a worker has been laid off. Lifetime federally funded benefit time limit
A State may not use any part of its family assistance grant to provide assistance to a family that includes a person, who as an adult (or minor household head) has already received 60 months of assistance. However, States may exempt 20 percent of TANF families from the Federal time limit for “hardship” reasons or because the family includes a person who has been “battered or subjected to extreme cruelty” (The share of adult cases that can receive a hardship exemption
7-9 exceeds 20 percent because some families have no adult recipient). If a State uses its own funds for families that have reached the Federal time limit, it may count the expenditures toward its MOE requirement.
States may establish their own time limits (within 60 months) for use of Federal funds and (without limit) for use of their own funds. More than 20 States have adopted limits shorter than 60 months, including many with intermittent limits (after which aid may resume). According to State TANF plans, some permit hardship extensions; some provide exemptions (months of State-funded aid that do not count toward the Federal time limit), and some use State funds to continue aid. Michigan, New York, and Vermont use State funds to continue full family benefits indefinitely; Arizona, California, Indiana, Maryland, Nebraska, and Rhode Island pay reduced benefits, omitting the adult share. (For more details, see Fifth Annual TANF report, U.S. DHHS, 2003. Table 12:10.) Family violence waivers
The 1996 law allows States to certify in their TANF plans that they have adopted standards to screen and identify TANF recipients with a history of domestic violence, refer them to services, and waive program requirements (including time limits and work rules) in some cases. DHHS regulations allow a State that has adopted the Family Violence Option (FVO) to receive “reasonable cause” exceptions to penalties for failing work and time limit rules if the State had granted domestic violence waivers meeting certain standards. Forty-four of the 54 jurisdictions with TANF programs have adopted the FVO; the remaining 10 States said in their TANF plans that they make special provisions for victims of domestic violence. Data reporting
Regulations covering data reporting rules of the 1996 welfare law took effect October 1, 1999. Before then an Emergency TANF Data report was used. The 1996 law requires States to collect on a monthly basis, and report on a quarterly basis, certain case-by-case information about families2 receiving assistance (defined by regulation as benefits for ongoing basic needs plus support services for non-employed families) under the State program funded by TANF. Reports must provide data for all families or for a scientifically chosen sample of families. Required data include: amount of assistance and type, type of family for purposes of reporting work participation, cash resources, and child support received (family data); race/ethnicity, educational status, and citizenship status (for each family member); and marital status, employment status and earnings, and disability status (for each adult). Under DHHS regulations, if a State wishes to receive a high performance bonus or qualify for a caseload reduction credit (to lower its required work participation rate) it must also file a similar quarterly 2 TANF low does not define “family.” Instructions to regulations say that for reporting purposes family means all persons who receive assistance as part of the family under the State TANF program or the separate State program plus (if not included in the foregoing recipient group) parent(s), caretaker relative(s), and minor siblings of any child recipient, and anyone whose income or resources would be counted in determining the family’s eligibility for or amount of aid.
7-10 case-by-case report on families receiving assistance under separate State programs, financed with MOE funds. Disaggregated (case-by-case) data also must be reported about families no longer receiving assistance. Reports about closed cases are to show data for the last month of assistance; States are not expected to track ex-recipient families for these reports.
Also required are quarterly reports providing aggregated numerical totals about families applying for, receiving, and no longer receiving assistance under the State TANF program. In addition, if the State wants to qualify for a high performance bonus or a caseload reduction credit, it must submit quarterly reports on the State MOE program.
Other required reports from States include: an annual report on State TANF and separate State MOE programs; a quarterly report on expenditures; a quarterly report on measures of job-entry and success in the work force (for States competing for an annual high performance bonus), and data on abortion rates (for States notified by DHHS that they are potentially eligible for an illegitimacy bonus on the basis of birth data from the National Center for Health Statistics).
BENEFITS
Almost one-half of the States have continued pre-TANF maximum benefit
schedules, freezing them at July 1996 levels. Most of the rest have increased benefits, but only in six States has the increase been sufficient to raise the real (inflation-adjusted) value of benefits (Alabama, Louisiana, Maryland, Mississippi, West Virginia, and Wisconsin). Detailed data on State benefit levels are provided later in this chapter (see Tables 7-10 through 7-13).
Two States have adopted bonuses: Oregon for cooperation with its work program and West Virginia for marriage. Wisconsin and Idaho have ceased adjusting benefits for family size. Twenty States impose a family cap on benefits, paying reduced or zero benefits for a new baby born to a TANF mother. Most States have increased asset limits and work incentives (the portion of earnings disregarded in calculating benefits).
Under TANF, formal policies to divert applicants from enrollment operate in 30 States (in some cases, at county option). They pay welfare diversion or welfare avoidance grants to help families meet temporary emergencies. They generally are lump-sum payments, usually with a maximum equal to several months’ TANF benefits.
CHILD CARE
Unlike AFDC, which required States to “guarantee” child care for recipients
who needed it to work or study, TANF has no child care requirement. However, the 1996 welfare law (PRWORA) created a mandatory block grant for child care to low-income families. Appropriated for this new block grant was $13.9 billion over 6 years, more than $4 billion above spending levels estimated by CBO for the repealed AFDC-related child care programs. The law required States to integrate
7-11 these mandatory funds with Child Care and Development Block Grant (CCDBG) discretionary funds and authorized $7 billion over 6 years for CCDBG. DHHS has designated the combined mandatory/discretionary child care grants as the Child Care and Development Fund (CCDF). For more, see the chapter on child care.
INTERACTION WITH OTHER MAJOR BENEFIT PROGRAMS Medicaid
Although PRWORA repealed AFDC, which provided automatic Medicaid coverage to AFDC families, it preserved AFDC eligibility limits for Medicaid use. The law requires States to provide Medicaid coverage and benefits to children and family members who would be eligible for AFDC cash aid (under terms of July 16, 1996) if that program still existed. For this purpose, States may lower AFDC income and resource standards to those in effect on May 1, 1988 (continuing a provision of old law) and may increase them by the percentage rise since July 16, 1996 in the consumer price index for all urban consumers (CPI-U); they also may adopt more liberal methods of determining income and resources (for example, more generous disregard of earnings). In general, if a State’s TANF eligibility limits are the same as or more restrictive than those of AFDC on July 16, 1996, all TANF children and adults must receive Medicaid. If the parent in a TANF family refuses TANF work requirements, the law permits States to end Medicaid for the parent, but requires continued Medicaid coverage for the children. The law also requires 12 months of transitional medical assistance (TMA) to children and adults who lose TANF eligibility because of earnings that lift counted income above the July 16, 1996 AFDC eligibility limit. The TMA requirement, which was scheduled to expire on September 30, 2002, was extended by Congress through March 31, 2004. (A permanent provision of law requires 4 months of continued Medicaid for those who lose eligibility because of increased income from earnings or child support).
AFDC-related rules now are the chief route to Medicaid for low-income parents, but these rules have lost significance for children. This is because an older law, which extended Medicaid year-by-year to older poor children (all born since September 30, 1983) now covers all children with family income below the Federal poverty guideline. Also, States have options to extend Medicaid to some categories of children with higher income.
Analysis of program administrative data show that between 1995 and 1998, when AFDC/TANF rolls declined by 4.9 million persons (36 percent), the number of able-bodied adults and children on Medicaid via cash-related groups fell by 36 and 32 percent, respectively. National survey data for 1999 and 2000 show stable enrollment in Medicaid and other State coverage combined (including the State Children’s Health Insurance Program) for children in poor families. The survey data also show significant gains in coverage among children in families with income between 100 percent and 199 percent of poverty. In fiscal year 2001, DHHS reports that 98.9 percent of TANF “families” received medical assistance; the report does not indicate whether coverage was restricted to children or extended
7-12 to some parents (and, if so, to what percentage).
Effective in performance year 2001, factors used to determine high performance TANF bonuses include the coverage of former TANF families by Medicaid and SCHIP and the participation of low-income working families in the food stamp program (see bonuses). Food assistance
TANF recipients not living with others automatically are eligible for food stamps. In fiscal year 2001, 81 percent of TANF families also received food stamps ($228 per month, on average). TANF recipients disqualified for violating TANF rules also may be disqualified for food stamps. If a TANF household’s cash benefits are reduced for noncompliance with TANF rules, the State also may reduce its food stamp allotment by 25 percent, and may not increase food stamp benefits to offset the cash loss. Federal food stamp rules (as changed by law in 2002) permit States to give up to 5 months of “transitional” food stamp benefits to households leaving TANF. In most cases, these food stamp benefits are equal to the amount received before leaving TANF, adjusted only (1) for the loss of TANF income and (2) at State option, for information about household circumstances received from another program in which the household participates (such as the Medicaid program). A similar State option (for a 3-month transitional benefit, using different benefit calculation rules) was available under pre-2002 law. However, as of June 2003, only 7 States had taken advantage of either option.
A study funded by the U.S. Department of Agriculture (USDA) reports that food stamp participation rates for eligible persons in single-parent households (including welfare leavers) fell from 96.3 percent in 1996 (before implementation of TANF) to 81.4 percent in 1999, and then turned upward, reaching 90.7 percent in 2000 (Cunnyngham, 2002. Table B.2). Several factors may have contributed to the post-AFDC decline in food stamp participation by eligible families with children, including greater perceived stigma. It also is thought that “welfare reform’s work-first message may discourage poor, nonworking families from admitting need” (Zedlewski, 2002). TANF children automatically are eligible for free school meals and other child nutrition programs. Women, infants, and children enrolled in TANF automatically are income-eligible for the Special Supplemental Nutrition Program for Women, Infants and Children (WIC). Earned income credit (EIC)
States have authority to decide whether or not to count EIC payments received by TANF recipients as income (the 1996 welfare law is silent on this issue). However, P.L.105-34 prohibits making EIC payments to a TANF recipient that are based on earnings derived from work experience or community service. Most State TANF programs disregard EIC payments as income for two months after receipt, but count them as a resource thereafter. However, some States disregard EIC refunds completely, and some never disregard them.
7-13 PRIVATIZATION/CHARITABLE CHOICE
The 1996 welfare law authorizes States to administer and provide
TANF services (and those under Supplemental Security Income) through contracts with charitable, religious, or private organizations, a provision which often is called “charitable choice.” It authorizes States to pay recipients by means of certificates, vouchers, or other disbursement forms redeemable with these organizations. Any religious organization with a contract to provide welfare services must retain independence from all units of government and may not discriminate against applicants on the basis of religion. Furthermore, States must provide an alternative provider for a beneficiary who objects to the religious character of the designated organization. The charitable choice/privatization provision of 1996 welfare law also covers food stamps and Medicaid, but it has not been implemented because food stamp and Medicaid law effectively require eligibility to be determined by a public official. In December 2002, DHHS issued proposed regulations to implement the law’s charitable choice TANF provisions (Federal Register, December 17, 2002). In the same month President Bush issued an Executive Order (EO 13279--Equal protection of the laws for faith-based and community organizations) directing agencies that administer Federally-funded social service programs to apply charitable choice principles to the extent permitted by law. For background and discussion of selected legal issues raised by charitable choice, see Ackerman (2003).
ENFORCEMENT OF PENALTIES AGAINST STATES
Penalties for any quarter cannot exceed 25 percent of the basic grant;
unrecovered penalties are to be carried forward. Penalty amounts are withheld from Federal block grant payments to the States. States must replace Federal funds with their own. Penalties against States for failing to achieve work participation rates are shown above. Below is an overview of the other major penalties specified in the 1996 law:
Failure to maintain a certain level of historic State spending. If a State fails to maintain State spending equal to at least 75 percent of its 1994 level (80 percent if the State fails its work participation requirement), the Secretary must reduce the following year’s TANF grant by the shortfall in MOE spending. In addition, if the State received WTW grant funds for the year, the Secretary must reduce the following year’s TANF grant by the amount of those WTW funds;
Failure to timely repay a loan from the Federal loan fund for State welfare programs. The Secretary must reduce the TANF grant for the next fiscal year quarter by the outstanding loan amount, plus the interest owed;
Failure to comply substantially with child support enforcement requirements. The Secretary must reduce the TANF grant for each quarter of non-compliance as follows: first finding of non-compliance, by 1-2 percent; second consecutive finding, 2-3 percent; and third and later
7-14 findings, 5 percent;
Failure to replace Federal penalty funds (TANF grant reductions) with State funds. The Secretary may reduce the next year’s TANF grant by the sum of 2 percent of the grant and the amount of State funds equal to the earlier grant reduction; and
Failure to maintain 100 percent of historic State spending under the State TANF program during a year in which State received contingency funds. The Secretary shall reduce the next year’s TANF grant by the total amount of contingency funds paid to the State.
In the case of some violations, the Secretary may allow States to enter into corrective compliance plans and/or may allow a penalty exemption on grounds of reasonable cause for the violation. Here are the violations that permit corrective compliance or exemption:
Failure to comply with the 5-year TANF benefit limit (5 percent maximum);
Failure to enforce penalties required by the child support agency against TANF recipients who fail to cooperate with the Child Support Program (5 percent maximum);
Failure to submit a required report (4 percent; rescinded if the State submits the report before the end of the next fiscal quarter);
Failure to participate in the income and eligibility verification system (2 percent maximum);
Use of TANF funds in violation of the law (reduction of the next year’s TANF grant by the amount of funds wrongfully used; if the violation is found to be intentional, an additional 5 percent);
Misuse of competitive WTW grants (an amount equal to the misused funds);
Failure to maintain aid for a single parent who cannot obtain care (for specified reasons) for a child under 6 (5 percent maximum); and
Failure to reduce TANF aid for recipients who refuse without good cause to work (not less than 1 percent or more than 5 percent).
STATE TANF PROGRAMS
STATE PLAN REQUIREMENTS
To be eligible for a family assistance grant, States must submit a TANF plan that contains required elements. Plans of most States are effective for 3 fiscal years. The plan must outline how the State intends to: (1) conduct a program that provides cash assistance to needy families and that provides parents with work and support services; (2) require a parent or caretaker recipient to engage in work, as defined by the State, after a maximum of 24 months; (3) comply with the requirement for participation in creditable work activities by certain percentages of adult recipients; (4) take steps to restrict the use and disclosure of information about TANF recipients; (5) establish goals and take action to prevent and reduce the
7-15 incidence of non-marital pregnancies; (6) conduct a program providing education and training on the problem of statutory rape. Also, the document must indicate whether the State intends to treat incoming families differently from residents, whether it intends to provide aid to noncitizens, and if so, provide an overview of the aid. The plan must contain certain certifications, including that it will operate a Child Support Enforcement Program and a Foster Care and Adoption Program, that it will provide equitable access to TANF for Indians who are not eligible for aid under a tribal plan, and that it has established and is enforcing standards and procedures again program fraud and abuse. The plan may certify that the State has established and is enforcing standards and procedures to screen and identify recipients with a history of domestic violence and to refer them to services and waive some program requirements for them in certain cases.
The law does not require the plan to provide eligibility rules for aid, benefit levels paid, the content of work programs, or numerous other details. However, regulations that took effect October 1, 1999 stipulate that in order for State expenditures to count toward the MOE requirement, the families aided must be financially eligible according to the appropriate income and resource (when applicable) standards established by the State and contained in its TANF plan. The preamble to the regulations States that in order for a plan to be deemed complete, it must contain the financial eligibility criteria for eligible families in the State’s TANF program and all State or local MOE programs and a brief description of the corresponding benefit provided under the TANF program with MOE funds. The Workforce Investment Act of 1998 (P.L. 105-220) allows a State to submit a “unified” plan to the “appropriate Secretaries” covering one or more WIA activities or vocational education activities plus one or more work activities authorized under TANF, food stamps, or numerous other programs. The Secretary with jurisdiction over a program is authorized to approve the portion of the State unified plan dealing with that program (applying its plan requirements). A State with an approved unified plan cannot be required to submit a separate plan for the covered activity. For specific provisions of State TANF programs, see the fifth annual TANF report to Congress [http://www.acf.dhhs.gov/programs/ofa/indexar.htm] and the State Policy Documentation Project [http://www.spdp.org/].
FUNDING OF TANF
BASIC FAMILY ASSISTANCE GRANTS
TANF’s basic block grant is the State family assistance grant, which entitles
the 50 States and the District of Columbia to a total of $16.5 billion annually through fiscal year 2002 (plus family assistance grants for the territories). The 1996 law pre-appropriated these funds. Congress extended basic TANF grants, at fiscal year 2002 levels, through March 31, 2004, by a series of laws. Distribution of TANF basic grants among the States is based on record high Federal payments made in immediately preceding years for AFDC, EA, and JOBS. The law entitles States to the largest of required Federal payments to States for these three programs
7-16 for:
Fiscal years 1992-1994, annual average; Fiscal year 1994, plus 85 percent of the amount by which EA payments for fiscal year 1995 exceeded those for fiscal year 1994 if the State amended its EA plan in fiscal year 1994; or
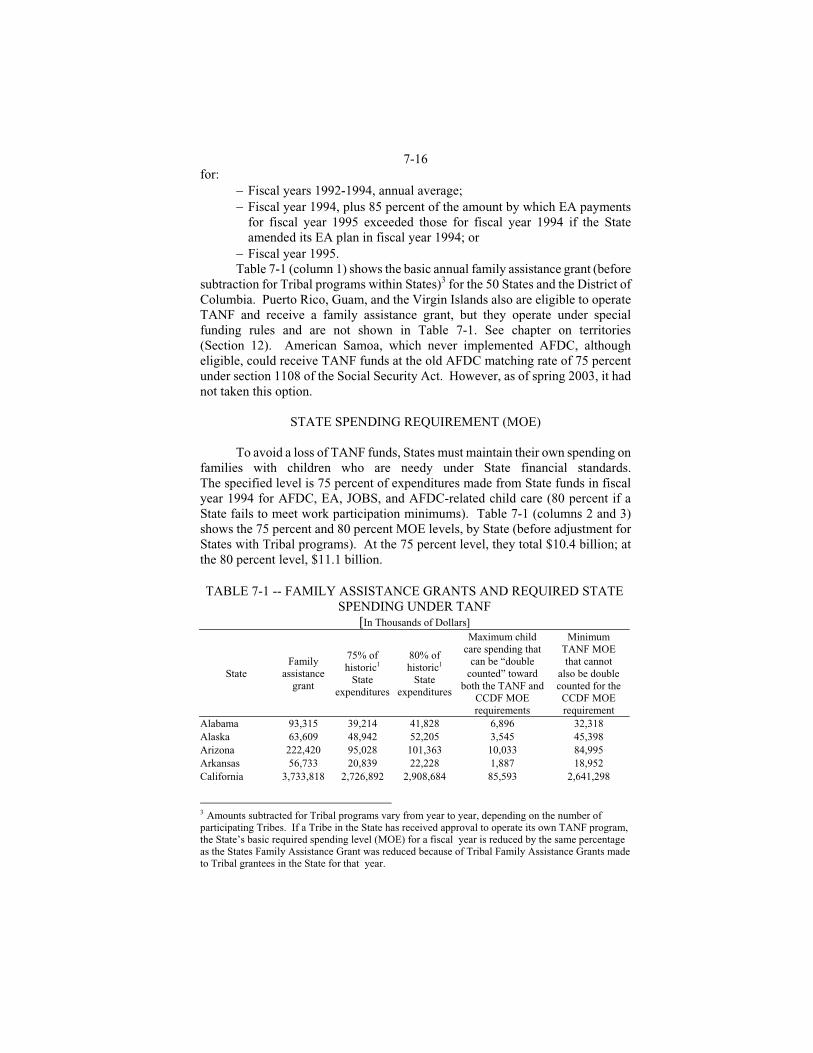
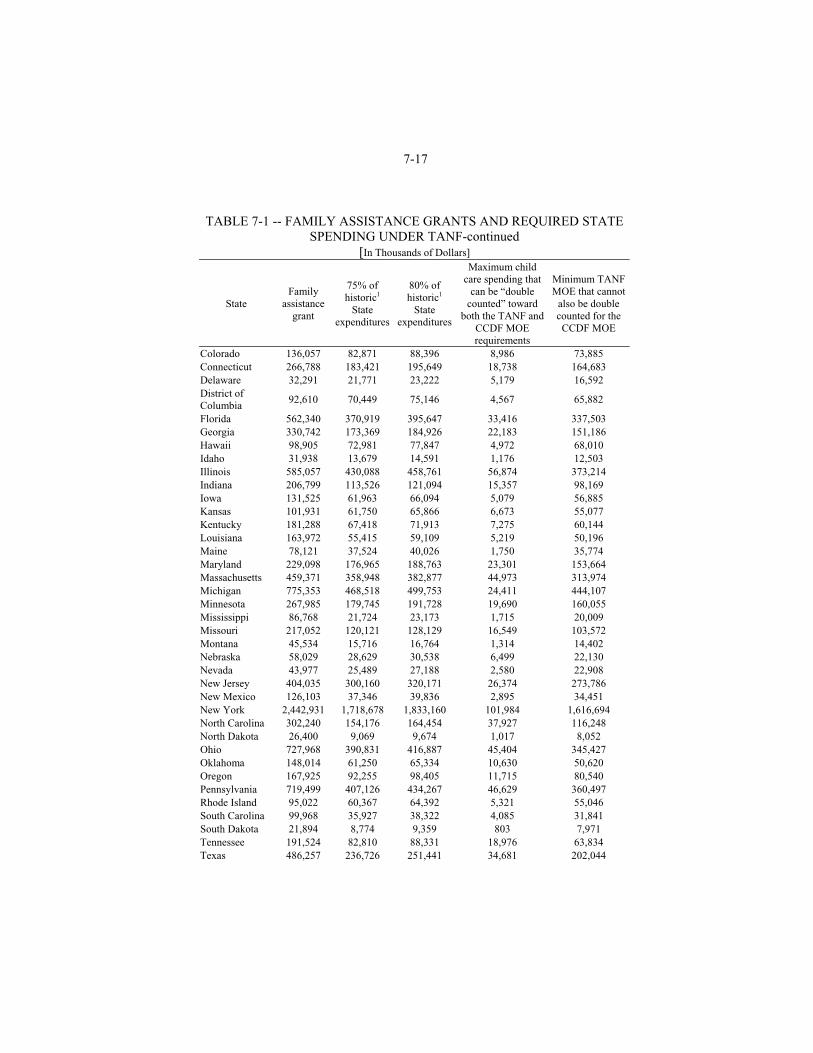
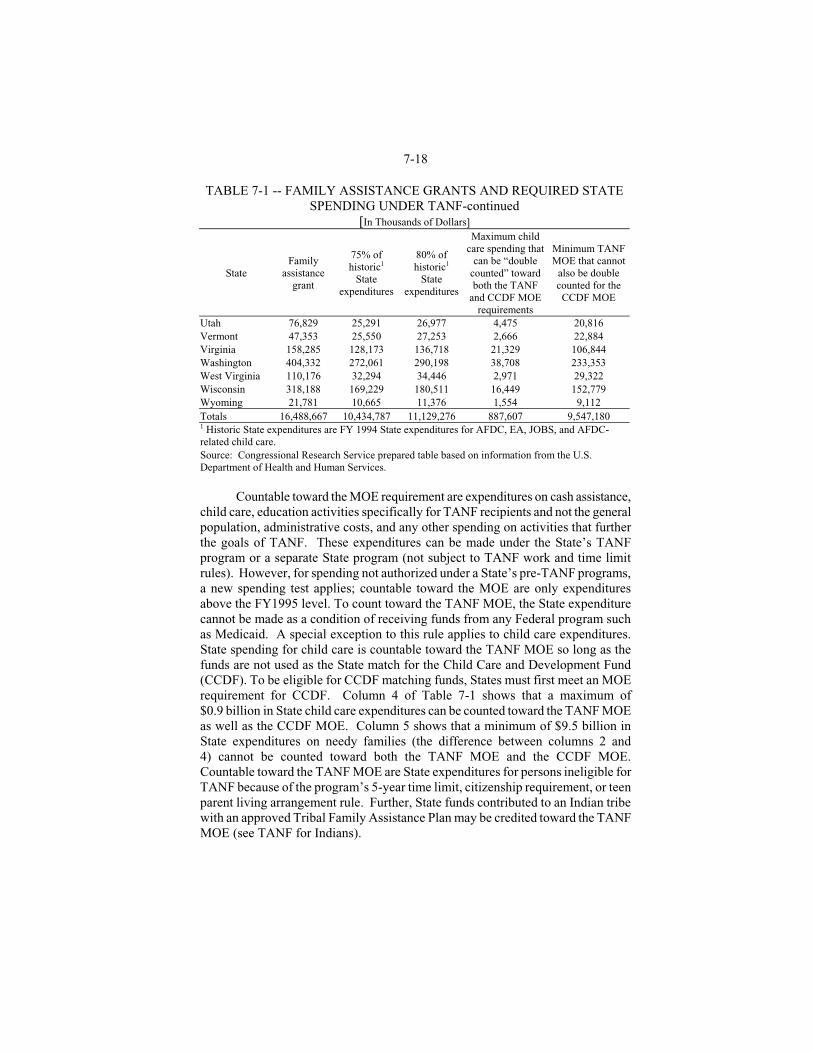
Fiscal year 1995. Table 7-1 (column 1) shows the basic annual family assistance grant (before
subtraction for Tribal programs within States)3 for the 50 States and the District of Columbia. Puerto Rico, Guam, and the Virgin Islands also are eligible to operate TANF and receive a family assistance grant, but they operate under special funding rules and are not shown in Table 7-1. See chapter on territories (Section 12). American Samoa, which never implemented AFDC, although eligible, could receive TANF funds at the old AFDC matching rate of 75 percent under section 1108 of the Social Security Act. However, as of spring 2003, it had not taken this option.
STATE SPENDING REQUIREMENT (MOE)
To avoid a loss of TANF funds, States must maintain their own spending on
families with children who are needy under State financial standards. The specified level is 75 percent of expenditures made from State funds in fiscal year 1994 for AFDC, EA, JOBS, and AFDC-related child care (80 percent if a State fails to meet work participation minimums). Table 7-1 (columns 2 and 3) shows the 75 percent and 80 percent MOE levels, by State (before adjustment for States with Tribal programs). At the 75 percent level, they total $10.4 billion; at the 80 percent level, $11.1 billion.
TABLE 7-1 -- FAMILY ASSISTANCE GRANTS AND REQUIRED STATE
SPENDING UNDER TANF [In Thousands of Dollars]
State Family
assistance grant
75% of historic1
State expenditures
80% of historic1
State expenditures
Maximum child care spending that
can be “double counted” toward
both the TANF and CCDF MOE requirements
Minimum TANF MOE that cannot
also be double counted for the CCDF MOE requirement
Alabama 93,315 39,214 41,828 6,896 32,318 Alaska 63,609 48,942 52,205 3,545 45,398 Arizona 222,420 95,028 101,363 10,033 84,995 Arkansas 56,733 20,839 22,228 1,887 18,952 California 3,733,818 2,726,892 2,908,684 85,593 2,641,298
3 Amounts subtracted for Tribal programs vary from year to year, depending on the number of participating Tribes. If a Tribe in the State has received approval to operate its own TANF program, the State’s basic required spending level (MOE) for a fiscal year is reduced by the same percentage as the States Family Assistance Grant was reduced because of Tribal Family Assistance Grants made to Tribal grantees in the State for that year.
7-17 TABLE 7-1 -- FAMILY ASSISTANCE GRANTS AND REQUIRED STATE
SPENDING UNDER TANF-continued [In Thousands of Dollars]
State Family
assistance grant
75% of historic1
State expenditures
80% of historic1
State expenditures
Maximum child care spending that
can be “double counted” toward
both the TANF and CCDF MOE requirements
Minimum TANF MOE that cannot
also be double counted for the CCDF MOE
Colorado 136,057 82,871 88,396 8,986 73,885 Connecticut 266,788 183,421 195,649 18,738 164,683 Delaware 32,291 21,771 23,222 5,179 16,592 District of Columbia
92,610 70,449 75,146 4,567 65,882
Florida 562,340 370,919 395,647 33,416 337,503 Georgia 330,742 173,369 184,926 22,183 151,186 Hawaii 98,905 72,981 77,847 4,972 68,010 Idaho 31,938 13,679 14,591 1,176 12,503 Illinois 585,057 430,088 458,761 56,874 373,214 Indiana 206,799 113,526 121,094 15,357 98,169 Iowa 131,525 61,963 66,094 5,079 56,885 Kansas 101,931 61,750 65,866 6,673 55,077 Kentucky 181,288 67,418 71,913 7,275 60,144 Louisiana 163,972 55,415 59,109 5,219 50,196 Maine 78,121 37,524 40,026 1,750 35,774 Maryland 229,098 176,965 188,763 23,301 153,664 Massachusetts 459,371 358,948 382,877 44,973 313,974 Michigan 775,353 468,518 499,753 24,411 444,107 Minnesota 267,985 179,745 191,728 19,690 160,055 Mississippi 86,768 21,724 23,173 1,715 20,009 Missouri 217,052 120,121 128,129 16,549 103,572 Montana 45,534 15,716 16,764 1,314 14,402 Nebraska 58,029 28,629 30,538 6,499 22,130 Nevada 43,977 25,489 27,188 2,580 22,908 New Jersey 404,035 300,160 320,171 26,374 273,786 New Mexico 126,103 37,346 39,836 2,895 34,451 New York 2,442,931 1,718,678 1,833,160 101,984 1,616,694 North Carolina 302,240 154,176 164,454 37,927 116,248 North Dakota 26,400 9,069 9,674 1,017 8,052 Ohio 727,968 390,831 416,887 45,404 345,427 Oklahoma 148,014 61,250 65,334 10,630 50,620 Oregon 167,925 92,255 98,405 11,715 80,540 Pennsylvania 719,499 407,126 434,267 46,629 360,497 Rhode Island 95,022 60,367 64,392 5,321 55,046 South Carolina 99,968 35,927 38,322 4,085 31,841 South Dakota 21,894 8,774 9,359 803 7,971 Tennessee 191,524 82,810 88,331 18,976 63,834 Texas 486,257 236,726 251,441 34,681 202,044
7-18 TABLE 7-1 -- FAMILY ASSISTANCE GRANTS AND REQUIRED STATE
SPENDING UNDER TANF-continued [In Thousands of Dollars]
State Family
assistance grant
75% of historic1
State expenditures
80% of historic1
State expenditures
Maximum child care spending that
can be “double counted” toward both the TANF
and CCDF MOE requirements
Minimum TANF MOE that cannot
also be double counted for the CCDF MOE
Utah 76,829 25,291 26,977 4,475 20,816 Vermont 47,353 25,550 27,253 2,666 22,884 Virginia 158,285 128,173 136,718 21,329 106,844 Washington 404,332 272,061 290,198 38,708 233,353 West Virginia 110,176 32,294 34,446 2,971 29,322 Wisconsin 318,188 169,229 180,511 16,449 152,779 Wyoming 21,781 10,665 11,376 1,554 9,112 Totals 16,488,667 10,434,787 11,129,276 887,607 9,547,180 1 Historic State expenditures are FY 1994 State expenditures for AFDC, EA, JOBS, and AFDC-related child care. Source: Congressional Research Service prepared table based on information from the U.S. Department of Health and Human Services.
Countable toward the MOE requirement are expenditures on cash assistance,
child care, education activities specifically for TANF recipients and not the general population, administrative costs, and any other spending on activities that further the goals of TANF. These expenditures can be made under the State’s TANF program or a separate State program (not subject to TANF work and time limit rules). However, for spending not authorized under a State’s pre-TANF programs, a new spending test applies; countable toward the MOE are only expenditures above the FY1995 level. To count toward the TANF MOE, the State expenditure cannot be made as a condition of receiving funds from any Federal program such as Medicaid. A special exception to this rule applies to child care expenditures. State spending for child care is countable toward the TANF MOE so long as the funds are not used as the State match for the Child Care and Development Fund (CCDF). To be eligible for CCDF matching funds, States must first meet an MOE requirement for CCDF. Column 4 of Table 7-1 shows that a maximum of $0.9 billion in State child care expenditures can be counted toward the TANF MOE as well as the CCDF MOE. Column 5 shows that a minimum of $9.5 billion in State expenditures on needy families (the difference between columns 2 and 4) cannot be counted toward both the TANF MOE and the CCDF MOE. Countable toward the TANF MOE are State expenditures for persons ineligible for TANF because of the program’s 5-year time limit, citizenship requirement, or teen parent living arrangement rule. Further, State funds contributed to an Indian tribe with an approved Tribal Family Assistance Plan may be credited toward the TANF MOE (see TANF for Indians).
7-19 SUPPLEMENTAL GRANTS TO STATES WITH HIGH POPULATION GROWTH AND/OR LOW AFDC-RELATED FEDERAL SPENDING
PER POOR PERSON
For fiscal years 1998 through 2001, the TANF law appropriated a total of $800 million for supplemental grants to States with high population growth and/or low fiscal year 1994 Federal spending per poor person on programs replaced by TANF. Congress in March 2002 extended supplemental grants, at fiscal year 2001 levels, through fiscal year 2002, and, subsequently, in a series of laws, through March 31, 2004.
For fiscal year 1998, the supplemental grant was computed as 2.5 percent of the amount required to be paid to the State under AFDC, EA, JOBS, and AFDC-related child care in fiscal year 1994. For fiscal years 1999-2001, it was computed as the prior year’s supplemental grant plus 2.5 percent of the sum of fiscal year 1994 base expenditures and the prior year’s supplemental grant. Since FY2001, supplemental grant levels have been frozen. Automatic qualification
The law qualifies certain States automatically for supplemental funds for each year from fiscal year 1998 to fiscal year 2001 on the basis of historical data. They are States that meet at least one of two conditions: (1) fiscal year 1994 Federal expenditures on AFDC, EA, JOBS, and AFDC-related child care per poor person (poverty count based on the 1990 census) were no more than 35 percent of the corresponding national sum, or (2) the State’s population grew more than 10 percent from April 1, 1990 to July 1, 1994. DHHS has determined that 11 States automatically qualify for supplemental funds for each year: Alabama, Arkansas, Louisiana, Mississippi, and Texas (because Federal pre-TANF spending per poor person was at least 65 percent below average), Alaska, Arizona, Colorado, Idaho, Nevada, and Utah (because of high population growth). Annual qualification
Other States may qualify only by meeting each of two recent conditions: (1) Federal welfare expenditures per poor State resident (poverty count based on the 1990 census) in the current year on programs replaced by TANF are below fiscal year 1994 national average comparable expenditures per poor person, and (2) during the most recent year with available data, the State’s population grew at a rate above the national average. Further, to qualify for supplemental funds on these grounds, States must have met the qualification criteria in fiscal year 1998. DHHS has determined that six additional States qualified on these grounds: Florida, Georgia, Montana, New Mexico, North Carolina, and Tennessee. If a State does not meet these annual criteria after fiscal year 1998, it will continue to receive its prior year supplemental grant, but that grant will not increase. In fiscal years 2000 and 2001, Montana and New Mexico did not qualify for an increase in supplemental funds because their 1997 to 1998 population growth rate failed to exceed the national population growth rate.
Table 7-2 shows annual supplemental grants by State, fiscal years
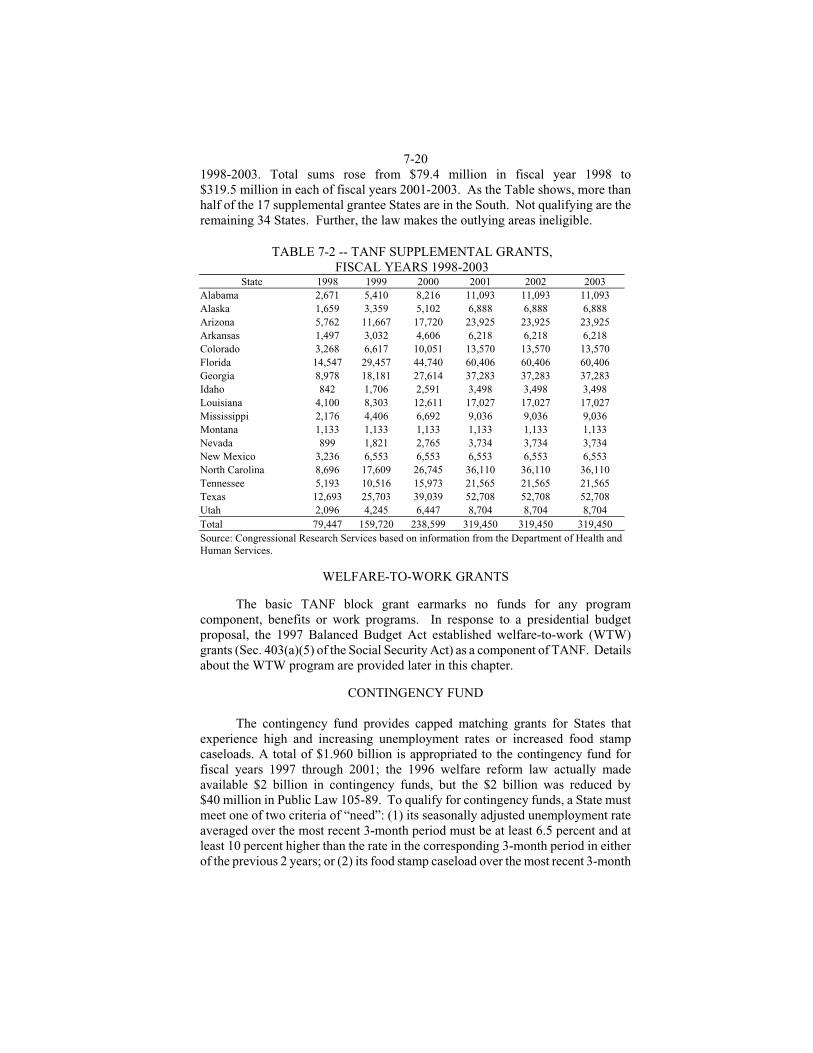
7-20 1998-2003. Total sums rose from $79.4 million in fiscal year 1998 to $319.5 million in each of fiscal years 2001-2003. As the Table shows, more than half of the 17 supplemental grantee States are in the South. Not qualifying are the remaining 34 States. Further, the law makes the outlying areas ineligible.
TABLE 7-2 -- TANF SUPPLEMENTAL GRANTS,
FISCAL YEARS 1998-2003 State 1998 1999 2000 2001 2002 2003
Alabama 2,671 5,410 8,216 11,093 11,093 11,093 Alaska 1,659 3,359 5,102 6,888 6,888 6,888 Arizona 5,762 11,667 17,720 23,925 23,925 23,925 Arkansas 1,497 3,032 4,606 6,218 6,218 6,218 Colorado 3,268 6,617 10,051 13,570 13,570 13,570 Florida 14,547 29,457 44,740 60,406 60,406 60,406 Georgia 8,978 18,181 27,614 37,283 37,283 37,283 Idaho 842 1,706 2,591 3,498 3,498 3,498 Louisiana 4,100 8,303 12,611 17,027 17,027 17,027 Mississippi 2,176 4,406 6,692 9,036 9,036 9,036 Montana 1,133 1,133 1,133 1,133 1,133 1,133 Nevada 899 1,821 2,765 3,734 3,734 3,734 New Mexico 3,236 6,553 6,553 6,553 6,553 6,553 North Carolina 8,696 17,609 26,745 36,110 36,110 36,110 Tennessee 5,193 10,516 15,973 21,565 21,565 21,565 Texas 12,693 25,703 39,039 52,708 52,708 52,708 Utah 2,096 4,245 6,447 8,704 8,704 8,704 Total 79,447 159,720 238,599 319,450 319,450 319,450 Source: Congressional Research Services based on information from the Department of Health and Human Services.
WELFARE-TO-WORK GRANTS
The basic TANF block grant earmarks no funds for any program
component, benefits or work programs. In response to a presidential budget proposal, the 1997 Balanced Budget Act established welfare-to-work (WTW) grants (Sec. 403(a)(5) of the Social Security Act) as a component of TANF. Details about the WTW program are provided later in this chapter.
CONTINGENCY FUND
The contingency fund provides capped matching grants for States that experience high and increasing unemployment rates or increased food stamp caseloads. A total of $1.960 billion is appropriated to the contingency fund for fiscal years 1997 through 2001; the 1996 welfare reform law actually made available $2 billion in contingency funds, but the $2 billion was reduced by $40 million in Public Law 105-89. To qualify for contingency funds, a State must meet one of two criteria of “need”: (1) its seasonally adjusted unemployment rate averaged over the most recent 3-month period must be at least 6.5 percent and at least 10 percent higher than the rate in the corresponding 3-month period in either of the previous 2 years; or (2) its food stamp caseload over the most recent 3-month
7-21 period must be at least 10 percent higher than the adjusted food stamp caseload was in the corresponding 3-month period in fiscal year 1994 or 1995 (when caseloads were at record-high levels). For this purpose, fiscal year 1994 and 1995 food stamp caseloads are adjusted by subtracting noncitizens that would have been ineligible for benefits had the Personal Responsibility and Work Opportunity Reconciliation Act’s ban on food stamp eligibility for noncitizens been in effect in those years.
To qualify for the contingency fund, a State must meet a special high MOE requirement. The required State spending level is higher (100 percent of fiscal year 1994 spending on AFDC, EA, and JOBS) than for the regular TANF MOE, and the categories of countable spending are more restrictive. For the contingency fund MOE, State spending on separate State programs is not countable; spending must be on the TANF program. Further, TANF expenditures on TANF child care are excluded from contingency fund countable spending (and from the historic spending level base). If a State fails to maintain 100 percent of historic State expenditures under its TANF program during a year in which it receives contingency funds, DHHS must reduce its next year’s family assistance grant by the amount of contingency funds. The contingency fund was used only in the first year of TANF. DHHS reports that New Mexico received $21 million for 10 months of fiscal year 1997, and North Carolina received $15.1 million for 3 months.
The maximum sum available to a State from the contingency fund is 20 percent of its State family assistance grant, and in each month that it qualifies, a State may receive up to one-twelfth of its maximum contingency grant. The State’s full year entitlement is calculated by (1) multiplying its countable expenditures above the 100 percent MOE level by the Medicaid matching rate and then (2) multiplying the result by the proportion of the year (for example, one-twelfth for one month; one-half for 6 months) that the State met the “needy State criteria.”
A State’s full year entitlement to contingency funds can be determined only after the close of the fiscal year. It is based on its countable expenditures, including those financed from contingency fund advance payments, the number of months it qualified, and its matching rate during the fiscal year. If a State received more in advances than its full year entitlement, it must remit to the Treasury any overpayments it received from the fund. Remittance of overpayments of contingency funds must be made within 1 year after the State has not met the needy State criteria for 3 consecutive months. The Adoption and Safe Families Act of 1997 (P.L. 105-89) reduced the contingency fund appropriation by $40 million and increased required remittances for fiscal years 1998 through 2001, but this provision had no effect because no State received contingency funds in this period.
LOAN FUND
TANF also makes available a $1.7 billion revolving loan fund. States may receive loans of maturities of up to 3 years, which must be repaid with interest. The interest rate for the loans is the current average market yield on outstanding
7-22 marketable obligations of the Federal Government. A State is ineligible for a loan if it is subject to a penalty for misspending TANF funds.
BONUS FUNDS
Nonmarital birth rate reduction
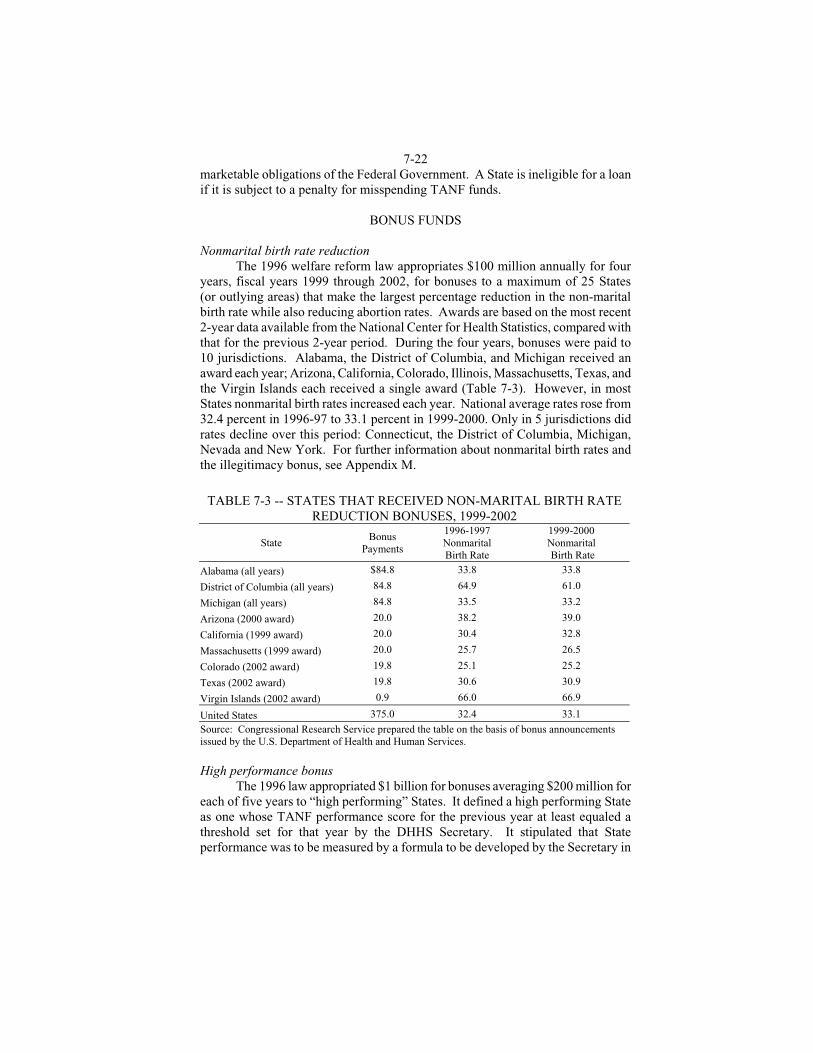
The 1996 welfare reform law appropriates $100 million annually for four years, fiscal years 1999 through 2002, for bonuses to a maximum of 25 States (or outlying areas) that make the largest percentage reduction in the non-marital birth rate while also reducing abortion rates. Awards are based on the most recent 2-year data available from the National Center for Health Statistics, compared with that for the previous 2-year period. During the four years, bonuses were paid to 10 jurisdictions. Alabama, the District of Columbia, and Michigan received an award each year; Arizona, California, Colorado, Illinois, Massachusetts, Texas, and the Virgin Islands each received a single award (Table 7-3). However, in most States nonmarital birth rates increased each year. National average rates rose from 32.4 percent in 1996-97 to 33.1 percent in 1999-2000. Only in 5 jurisdictions did rates decline over this period: Connecticut, the District of Columbia, Michigan, Nevada and New York. For further information about nonmarital birth rates and the illegitimacy bonus, see Appendix M.
TABLE 7-3 -- STATES THAT RECEIVED NON-MARITAL BIRTH RATE REDUCTION BONUSES, 1999-2002
State Bonus
Payments
1996-1997 Nonmarital Birth Rate
1999-2000 Nonmarital Birth Rate
Alabama (all years) $84.8 33.8 33.8
District of Columbia (all years) 84.8 64.9 61.0
Michigan (all years) 84.8 33.5 33.2
Arizona (2000 award) 20.0 38.2 39.0
California (1999 award) 20.0 30.4 32.8
Massachusetts (1999 award) 20.0 25.7 26.5
Colorado (2002 award) 19.8 25.1 25.2
Texas (2002 award) 19.8 30.6 30.9
Virgin Islands (2002 award) 0.9 66.0 66.9
United States 375.0 32.4 33.1
Source: Congressional Research Service prepared the table on the basis of bonus announcements issued by the U.S. Department of Health and Human Services. High performance bonus
The 1996 law appropriated $1 billion for bonuses averaging $200 million for each of five years to “high performing” States. It defined a high performing State as one whose TANF performance score for the previous year at least equaled a threshold set for that year by the DHHS Secretary. It stipulated that State performance was to be measured by a formula to be developed by the Secretary in
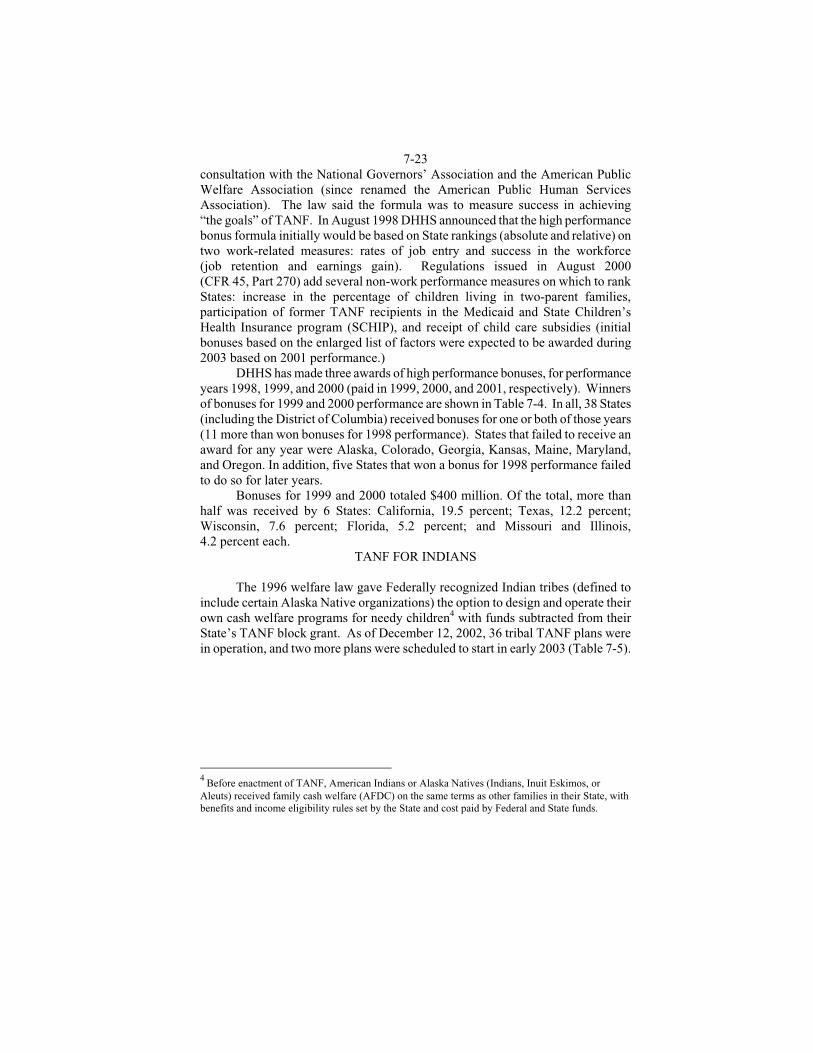
7-23 consultation with the National Governors’ Association and the American Public Welfare Association (since renamed the American Public Human Services Association). The law said the formula was to measure success in achieving “the goals” of TANF. In August 1998 DHHS announced that the high performance bonus formula initially would be based on State rankings (absolute and relative) on two work-related measures: rates of job entry and success in the workforce (job retention and earnings gain). Regulations issued in August 2000 (CFR 45, Part 270) add several non-work performance measures on which to rank States: increase in the percentage of children living in two-parent families, participation of former TANF recipients in the Medicaid and State Children’s Health Insurance program (SCHIP), and receipt of child care subsidies (initial bonuses based on the enlarged list of factors were expected to be awarded during 2003 based on 2001 performance.)
DHHS has made three awards of high performance bonuses, for performance years 1998, 1999, and 2000 (paid in 1999, 2000, and 2001, respectively). Winners of bonuses for 1999 and 2000 performance are shown in Table 7-4. In all, 38 States (including the District of Columbia) received bonuses for one or both of those years (11 more than won bonuses for 1998 performance). States that failed to receive an award for any year were Alaska, Colorado, Georgia, Kansas, Maine, Maryland, and Oregon. In addition, five States that won a bonus for 1998 performance failed to do so for later years.
Bonuses for 1999 and 2000 totaled $400 million. Of the total, more than half was received by 6 States: California, 19.5 percent; Texas, 12.2 percent; Wisconsin, 7.6 percent; Florida, 5.2 percent; and Missouri and Illinois, 4.2 percent each.
TANF FOR INDIANS
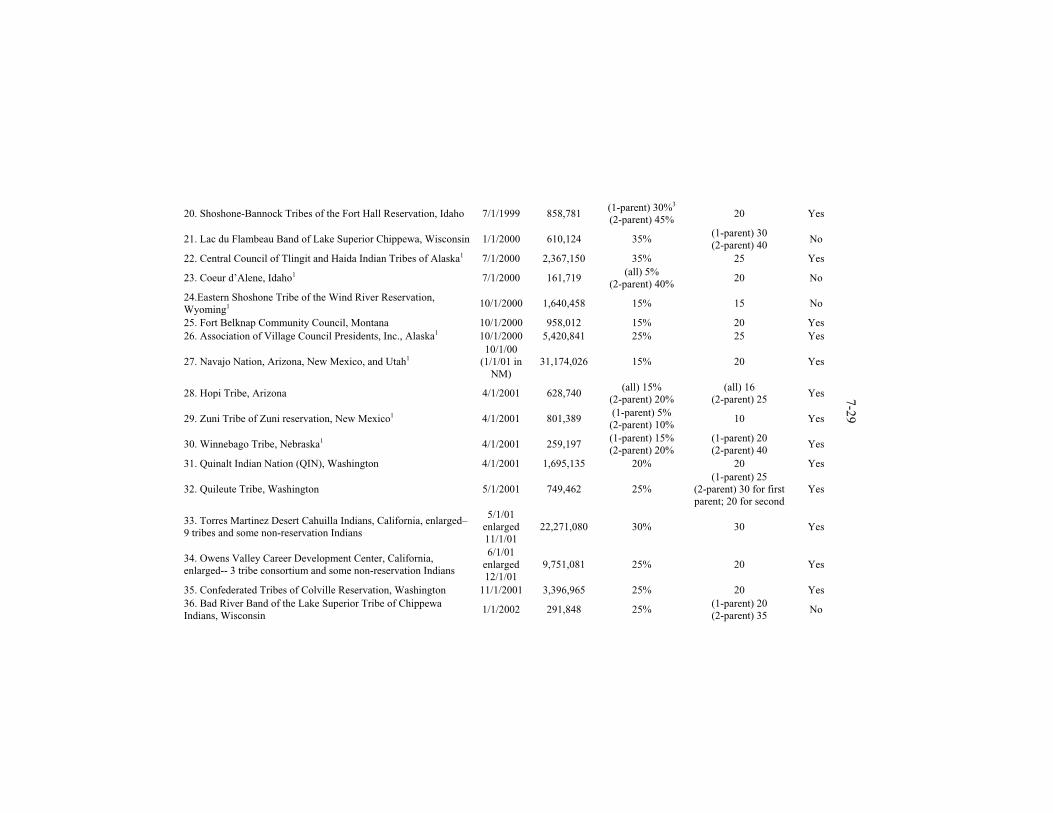
The 1996 welfare law gave Federally recognized Indian tribes (defined to include certain Alaska Native organizations) the option to design and operate their own cash welfare programs for needy children4 with funds subtracted from their State’s TANF block grant. As of December 12, 2002, 36 tribal TANF plans were in operation, and two more plans were scheduled to start in early 2003 (Table 7-5).
4 Before enactment of TANF, American Indians or Alaska Natives (Indians, Inuit Eskimos, or Aleuts) received family cash welfare (AFDC) on the same terms as other families in their State, with benefits and income eligibility rules set by the State and cost paid by Federal and State funds.
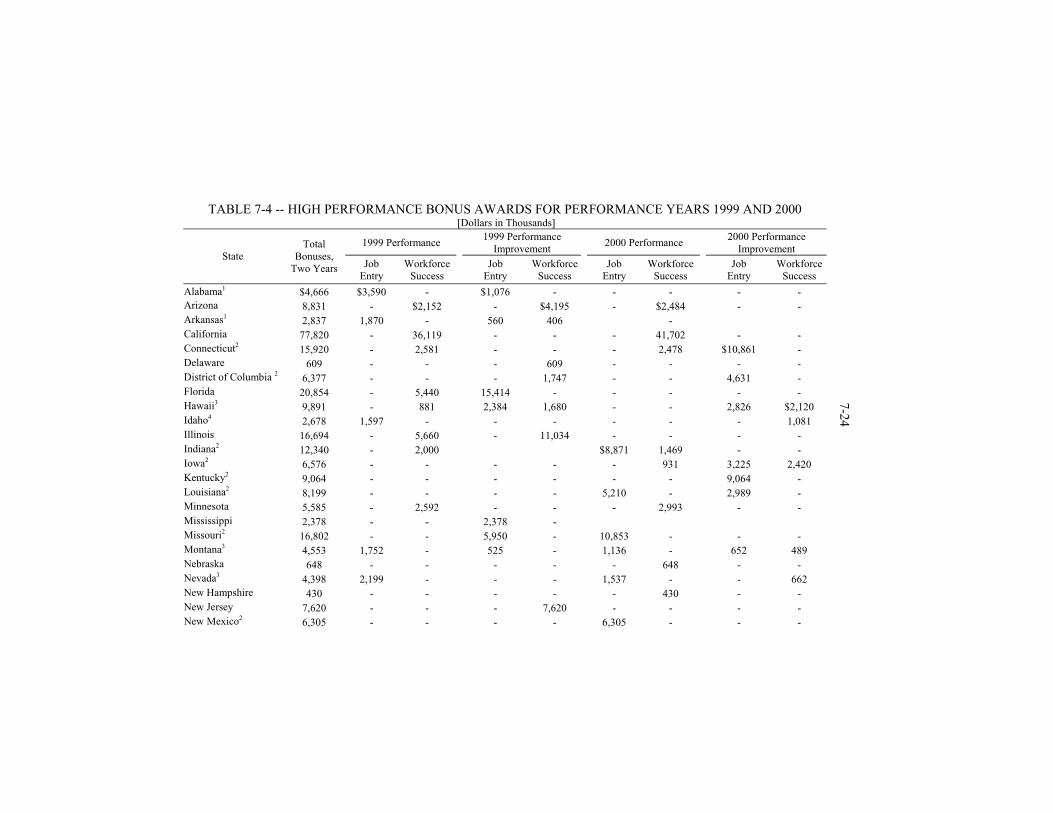
TABLE 7-4 -- HIGH PERFORMANCE BONUS AWARDS FOR PERFORMANCE YEARS 1999 AND 2000 [Dollars in Thousands]
1999 Performance 1999 Performance
Improvement 2000 Performance
2000 Performance Improvement
State Total
Bonuses, Two Years Job
Entry Workforce
Success Job
Entry Workforce
Success Job
Entry Workforce
Success Job
Entry Workforce
Success
Alabama1 $4,666 $3,590 - $1,076 - - - - - Arizona 8,831 - $2,152 - $4,195 - $2,484 - - Arkansas1 2,837 1,870 - 560 406 - California 77,820 - 36,119 - - - 41,702 - - Connecticut2 15,920 - 2,581 - - - 2,478 $10,861 - Delaware 609 - - - 609 - - - - District of Columbia 2 6,377 - - - 1,747 - - 4,631 - Florida 20,854 - 5,440 15,414 - - - - - Hawaii3 9,891 - 881 2,384 1,680 - - 2,826 $2,120 Idaho4 2,678 1,597 - - - - - - 1,081 Illinois 16,694 - 5,660 - 11,034 - - - - Indiana2 12,340 - 2,000 $8,871 1,469 - - Iowa2 6,576 - - - - - 931 3,225 2,420 Kentucky2 9,064 - - - - - - 9,064 - Louisiana2 8,199 - - - - 5,210 - 2,989 - Minnesota 5,585 - 2,592 - - - 2,993 - - Mississippi 2,378 - - 2,378 - Missouri2 16,802 - - 5,950 - 10,853 - - - Montana3 4,553 1,752 - 525 - 1,136 - 652 489 Nebraska 648 - - - - - 648 - - Nevada3 4,398 2,199 - - - 1,537 - - 662 New Hampshire 430 - - - - - 430 - - New Jersey 7,620 - - - 7,620 - - - - New Mexico2 6,305 - - - - 6,305 - - -
7-24
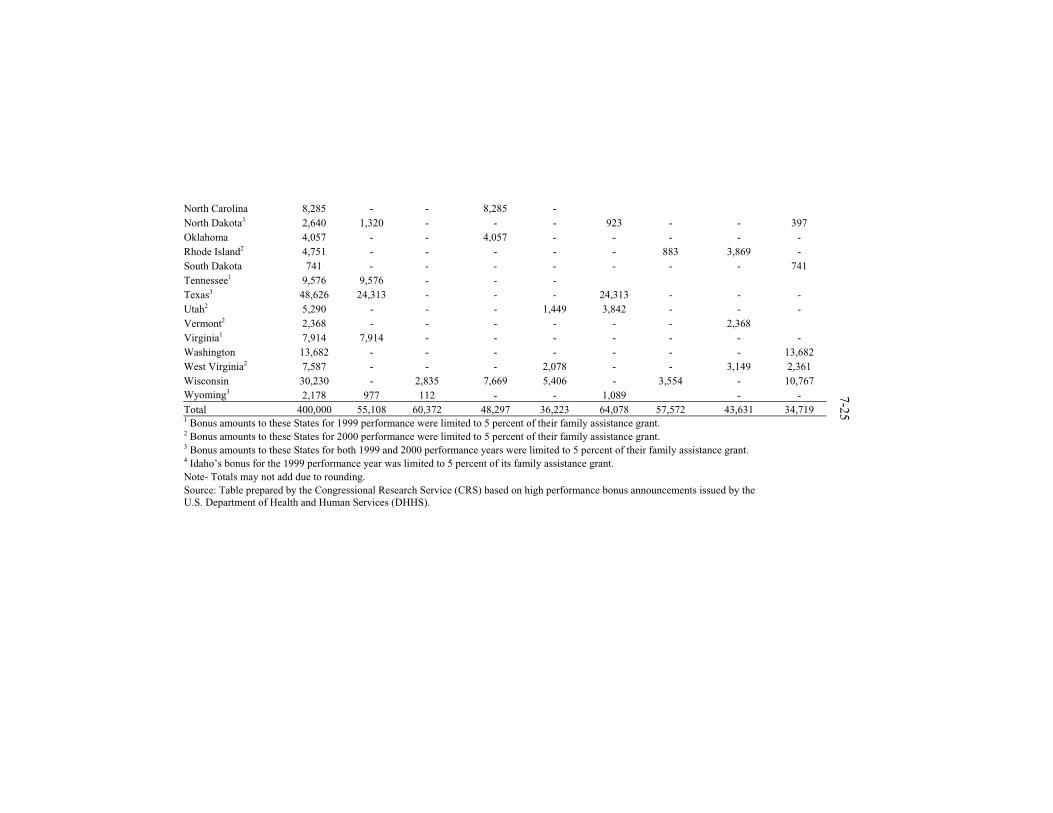
North Carolina 8,285 - - 8,285 - North Dakota3 2,640 1,320 - - - 923 - - 397 Oklahoma 4,057 - - 4,057 - - - - - Rhode Island2 4,751 - - - - - 883 3,869 - South Dakota 741 - - - - - - - 741 Tennessee1 9,576 9,576 - - - Texas3 48,626 24,313 - - - 24,313 - - - Utah2 5,290 - - - 1,449 3,842 - - - Vermont2 2,368 - - - - - - 2,368 Virginia1 7,914 7,914 - - - - - - - Washington 13,682 - - - - - - - 13,682 West Virginia2 7,587 - - - 2,078 - - 3,149 2,361 Wisconsin 30,230 - 2,835 7,669 5,406 - 3,554 - 10,767 Wyoming3 2,178 977 112 - - 1,089 - - Total 400,000 55,108 60,372 48,297 36,223 64,078 57,572 43,631 34,719 1 Bonus amounts to these States for 1999 performance were limited to 5 percent of their family assistance grant. 2 Bonus amounts to these States for 2000 performance were limited to 5 percent of their family assistance grant. 3 Bonus amounts to these States for both 1999 and 2000 performance years were limited to 5 percent of their family assistance grant. 4 Idaho’s bonus for the 1999 performance year was limited to 5 percent of its family assistance grant. Note- Totals may not add due to rounding. Source: Table prepared by the Congressional Research Service (CRS) based on high performance bonus announcements issued by the U.S. Department of Health and Human Services (DHHS).
7-25
7-26
In addition, another eight plans were pending. Tribal TANF programs operate in 15 States: Alaska, Arizona, California, Idaho, Minnesota, Montana, Nebraska, New Mexico, Oklahoma, Oregon, South Dakota, Utah, Washington, Wisconsin, and Wyoming.5 The 1996 welfare law also appropriated $7.6 million annually for 6 years, FY 1997-2002, for work and training activities to tribes in 24 States that operated the repealed JOBS programs (the replacement program is called Native Employment Works or NEW); authorized direct Federal funding to recognized Indian tribes for operation of child support enforcement programs; and set aside a share of child care funds for Indian tribes. Further, the 1997 Balanced Budget Act (P.L. 105-33), which established a two-year program of WTW grants to serve TANF recipients with impediments to work, reserved $30 million of its formula grants for Indian programs.
Tribal TANF programs have several distinctive features, including: Work participation rates and time limit rules are set by the Secretary of DHHS with participation of the tribe. The 1996 law exempts from the 60-month TANF benefit time limit any month of aid during which the recipient lived on a reservation (or in an Alaska native village) of at least 1,000 persons in which at least 50 percent of adults were unemployed; Tribal plans contain many fewer required elements than State plans; DHHS has ruled (policy announcement 97-2) that State funds contributed to an approved tribal plan may be counted toward the TANF MOE level;
The law gives explicit permission for State TANF programs to use money from a new loan fund for aid to Indian families that have moved out of the area served by a tribal plan; and
Tribal TANF regulations permit 35 percent of a tribal grant to be used or administrative costs in the first year, 30 percent in the second year, and 25 percent thereafter. State TANF programs, however, may spend no more than 15 percent of their grants on administration (with the exception of computerization expenses for tracking and monitoring).
Table 7-5 shows that only four tribal plans adopted the statutory work participation rate of 50 percent (all family rate) for fiscal year 2002. The others set lower participation rates, ranging from 5 percent to 35 percent. However, almost all tribal plans adopted the TANF 60-month lifetime benefit limit (three adapted intermittent limits with 60 or 84 months). For characteristics of tribal TANF plans, see http://www.acf.dhhs.gov/programs/dts/ttanchar_1002.htm. DHHS reports that in fiscal year 2001, the Native Employment Works program served 3,371 TANF recipients, of whom 616 entered unsubsidized employment. In addition, 949 non-TANF recipients served by NEW also began unsubsidized jobs.A tribe’s TANF grant, which is subtracted from the State’s family assistance grant, equals Federal payments made to the State for fiscal year 1994 for AFDC, EA, and JOBS that are attributable to Indians in its service area or areas. Fiscal year 2002 allotments (from State family assistance grants) for tribes with approved tribal 5 In addition, a total of about 34,000 American Indian families were served in regular State TANF programs in fiscal year 2000(compared with 40,000 the year before).
7-27 TANF plans totaled $102.8 million; fiscal year 2003 allotments, $110.1 million. A tribe’s grant is smaller than the sum spent on AFDC Indian children in fiscal year 1994 because it lacks the State matching share. Although the existence of a tribal program within a State reduces the State’s potential TANF caseload, States are not required to help fund the tribal plan.
However, except for Wisconsin and Oklahoma, most States contribute funds to at least some of the Tribal programs within their borders; as noted earlier, this spending can be credited toward the State’s TANF MOE. In their fiscal year 2001 annual reports, four States said they had claimed State expenditures on behalf of tribal programs as MOE: Alaska, $8,626,462 (out of total spending of $9,313,162 for tribal programs); Arizona, $5,100,959; California, $5,546,060; and Washington, $5,426,811.
AFDC/TANF DATA
HIGHLIGHTS
Since Congress ended the entitlement of eligible families with children to
cash aid in August 1996, AFDC/TANF rolls have continued to shrink (though at a slower rate since 2001), and work by families on the rolls has doubled. To promote work, State TANF programs employ tough work sanctions, generous work rewards, “work first” policies, and welfare avoidance (diversion) payments.
Data reported by States indicate that the percentage of welfare children cared for by a non-recipient (i.e. child-only cases) has increased, but that otherwise the composition of TANF families resembles that of AFDC families (Table 7-30), and that the share of welfare adults who are nonwhites has increased (Table 7-31). National data are not available about families who have left TANF, but studies indicate that in some States from 50-65 percent of persons who leave TANF have jobs then or a short time later (compared with a general work exit rate of almost 50 percent before TANF), that the jobs generally pay wages slightly above the minimum wage, and that about one-fifth or more of ex-recipients return to the rolls within several months.
CASELOADS
Historical national trends
Enrollment in family welfare, which soared to an all-time peak in fiscal year 1994, has fallen to the lowest level since the early 1970s (Table 7-6), and the average size of welfare families has shrunk from 3.9 persons in 1970 to 2.5 in 2002. The proportion of U.S. children enrolled in AFDC/TANF hovered between 11 percent and 12 percent throughout the l970s and 1980s and then soared above 14 percent in 1993-1994. Since then the share has plunged to 5.3 percent (fiscal year 2002), a decrease of more than one-half. DHHS has estimated that the proportion of eligible families enrolled in AFDC/TANF declined from a peak of 86 percent in 1992 to 52 percent in 2000 (DHHS Indicators of Welfare Dependence, 2003, Table IND 4a).
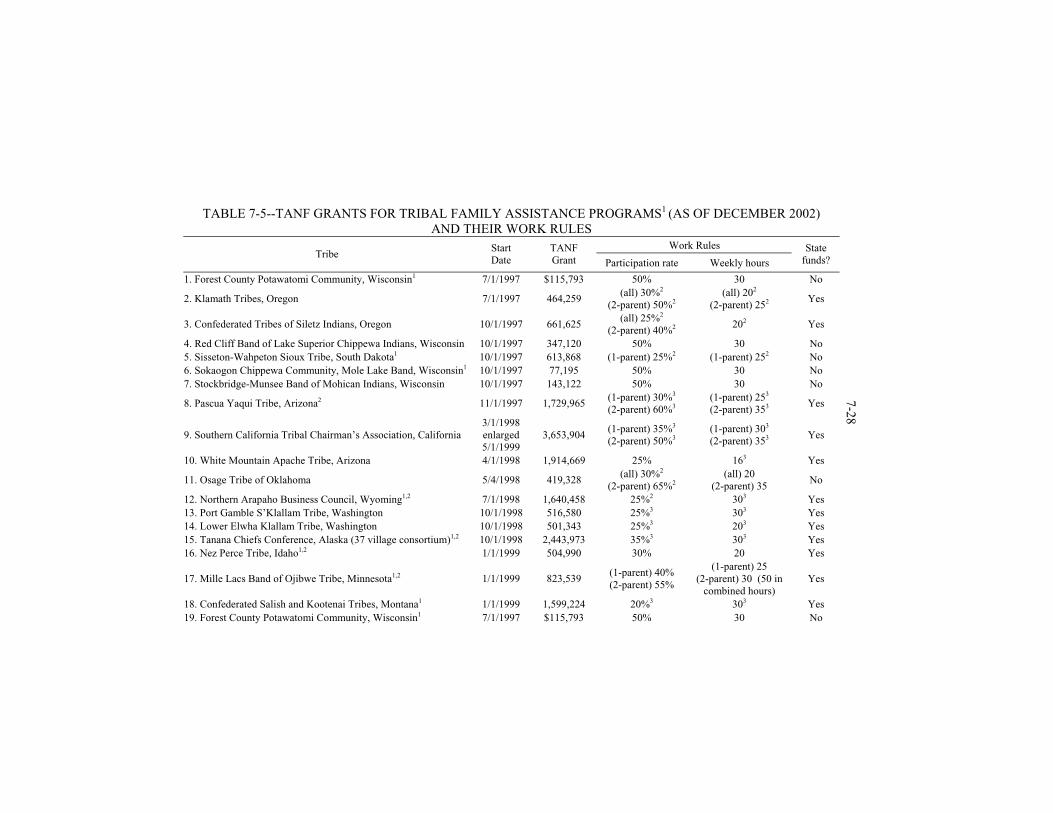
TABLE 7-5--TANF GRANTS FOR TRIBAL FAMILY ASSISTANCE PROGRAMS1 (AS OF DECEMBER 2002) AND THEIR WORK RULES
Work Rules Tribe
Start Date
TANF Grant Participation rate Weekly hours
State funds?
1. Forest County Potawatomi Community, Wisconsin1 7/1/1997 $115,793 50% 30 No
2. Klamath Tribes, Oregon 7/1/1997 464,259 (all) 30%2
(2-parent) 50%2 (all) 202
(2-parent) 252 Yes
3. Confederated Tribes of Siletz Indians, Oregon 10/1/1997 661,625 (all) 25%2
(2-parent) 40%2 202 Yes
4. Red Cliff Band of Lake Superior Chippewa Indians, Wisconsin 10/1/1997 347,120 50% 30 No 5. Sisseton-Wahpeton Sioux Tribe, South Dakota1 10/1/1997 613,868 (1-parent) 25%2 (1-parent) 252 No 6. Sokaogon Chippewa Community, Mole Lake Band, Wisconsin1 10/1/1997 77,195 50% 30 No 7. Stockbridge-Munsee Band of Mohican Indians, Wisconsin 10/1/1997 143,122 50% 30 No
8. Pascua Yaqui Tribe, Arizona2 11/1/1997 1,729,965 (1-parent) 30%3
(2-parent) 60%3 (1-parent) 253
(2-parent) 353 Yes
9. Southern California Tribal Chairman’s Association, California 3/1/1998 enlarged 5/1/1999
3,653,904 (1-parent) 35%3
(2-parent) 50%3 (1-parent) 303
(2-parent) 353 Yes
10. White Mountain Apache Tribe, Arizona 4/1/1998 1,914,669 25% 163 Yes
11. Osage Tribe of Oklahoma 5/4/1998 419,328 (all) 30%2
(2-parent) 65%2 (all) 20
(2-parent) 35 No
12. Northern Arapaho Business Council, Wyoming1,2 7/1/1998 1,640,458 25%2 303 Yes 13. Port Gamble S’Klallam Tribe, Washington 10/1/1998 516,580 25%3 303 Yes 14. Lower Elwha Klallam Tribe, Washington 10/1/1998 501,343 25%3 203 Yes 15. Tanana Chiefs Conference, Alaska (37 village consortium)1,2 10/1/1998 2,443,973 35%3 303 Yes 16. Nez Perce Tribe, Idaho1,2 1/1/1999 504,990 30% 20 Yes
17. Mille Lacs Band of Ojibwe Tribe, Minnesota1,2 1/1/1999 823,539 (1-parent) 40%
(2-parent) 55%
(1-parent) 25
(2-parent) 30 (50 in combined hours)
Yes
18. Confederated Salish and Kootenai Tribes, Montana1 1/1/1999 1,599,224 20%3 303 Yes 19. Forest County Potawatomi Community, Wisconsin1 7/1/1997 $115,793 50% 30 No
7-28
20. Shoshone-Bannock Tribes of the Fort Hall Reservation, Idaho 7/1/1999 858,781 (1-parent) 30%3
(2-parent) 45% 20 Yes
21. Lac du Flambeau Band of Lake Superior Chippewa, Wisconsin 1/1/2000 610,124 35% (1-parent) 30
(2-parent) 40 No
22. Central Council of Tlingit and Haida Indian Tribes of Alaska1 7/1/2000 2,367,150 35% 25 Yes
23. Coeur d’Alene, Idaho1 7/1/2000 161,719 (all) 5%
(2-parent) 40% 20 No
24.Eastern Shoshone Tribe of the Wind River Reservation, Wyoming1
10/1/2000 1,640,458 15% 15 No
25. Fort Belknap Community Council, Montana 10/1/2000 958,012 15% 20 Yes 26. Association of Village Council Presidents, Inc., Alaska1 10/1/2000 5,420,841 25% 25 Yes
27. Navajo Nation, Arizona, New Mexico, and Utah1 10/1/00
(1/1/01 in NM)
31,174,026 15% 20 Yes
28. Hopi Tribe, Arizona 4/1/2001 628,740 (all) 15%
(2-parent) 20% (all) 16
(2-parent) 25 Yes
29. Zuni Tribe of Zuni reservation, New Mexico1 4/1/2001 801,389 (1-parent) 5% (2-parent) 10%
10 Yes
30. Winnebago Tribe, Nebraska1 4/1/2001 259,197 (1-parent) 15% (2-parent) 20%
(1-parent) 20
(2-parent) 40 Yes
31. Quinalt Indian Nation (QIN), Washington 4/1/2001 1,695,135 20% 20 Yes
32. Quileute Tribe, Washington 5/1/2001 749,462 25% (1-parent) 25
(2-parent) 30 for first parent; 20 for second
Yes
33. Torres Martinez Desert Cahuilla Indians, California, enlarged–9 tribes and some non-reservation Indians
5/1/01 enlarged 11/1/01
22,271,080 30% 30 Yes
34. Owens Valley Career Development Center, California, enlarged-- 3 tribe consortium and some non-reservation Indians
6/1/01 enlarged 12/1/01
9,751,081 25% 20 Yes
35. Confederated Tribes of Colville Reservation, Washington 11/1/2001 3,396,965 25% 20 Yes 36. Bad River Band of the Lake Superior Tribe of Chippewa Indians, Wisconsin
1/1/2002 291,848 25% (1-parent) 20 (2-parent) 35
No
7-29
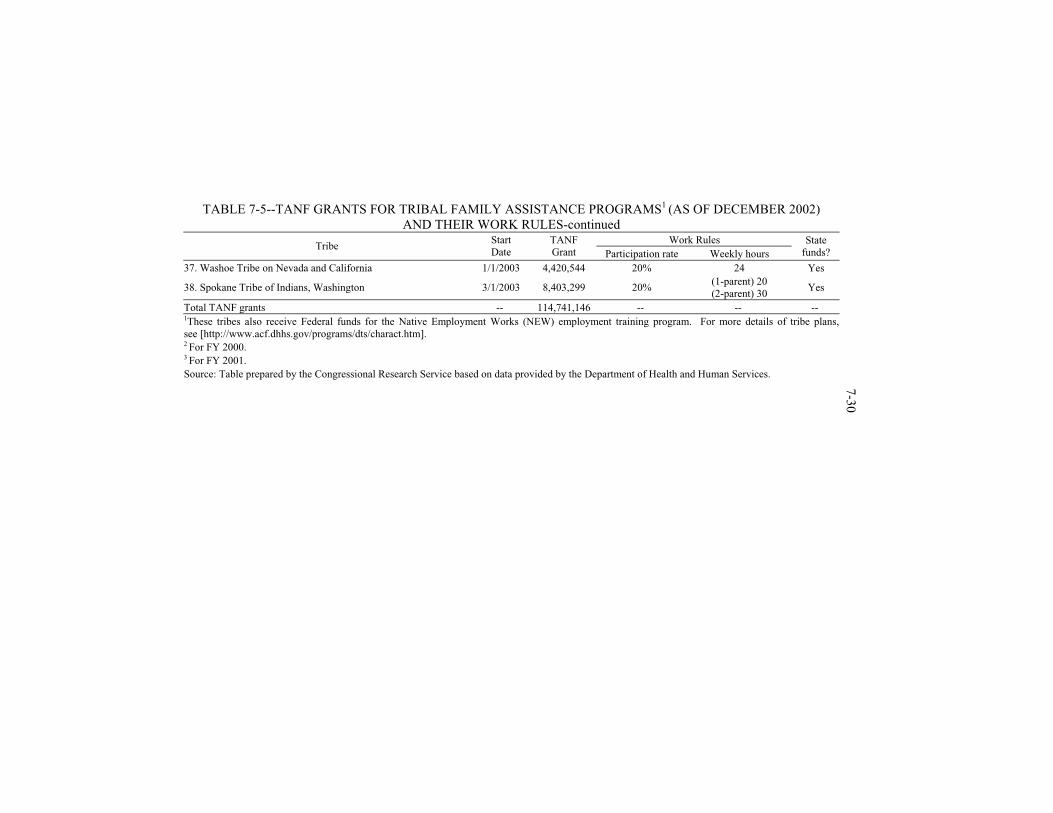
TABLE 7-5--TANF GRANTS FOR TRIBAL FAMILY ASSISTANCE PROGRAMS1 (AS OF DECEMBER 2002) AND THEIR WORK RULES-continued
Work Rules Tribe
Start Date
TANF Grant Participation rate Weekly hours
State funds?
37. Washoe Tribe on Nevada and California 1/1/2003 4,420,544 20% 24 Yes
38. Spokane Tribe of Indians, Washington 3/1/2003 8,403,299 20% (1-parent) 20 (2-parent) 30
Yes
Total TANF grants -- 114,741,146 -- -- -- 1These tribes also receive Federal funds for the Native Employment Works (NEW) employment training program. For more details of tribe plans, see [http://www.acf.dhhs.gov/programs/dts/charact.htm]. 2 For FY 2000. 3 For FY 2001.
Source: Table prepared by the Congressional Research Service based on data provided by the Department of Health and Human Services.
7-30
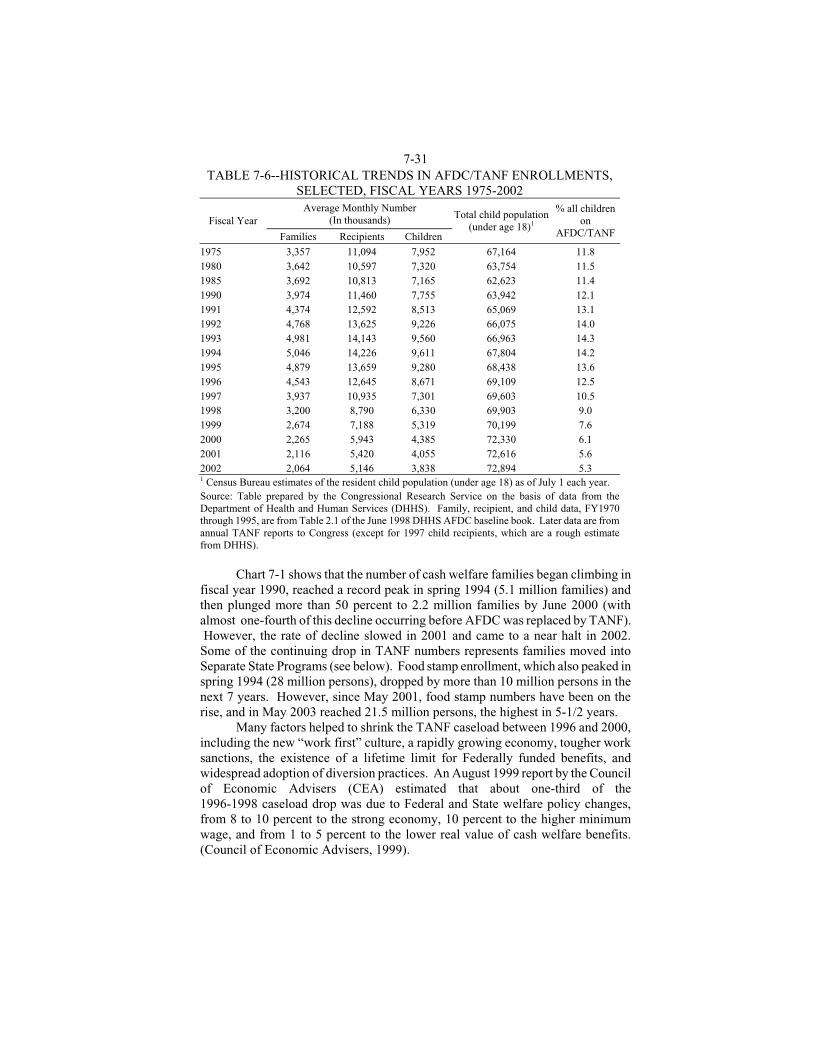
7-31 TABLE 7-6--HISTORICAL TRENDS IN AFDC/TANF ENROLLMENTS,
SELECTED, FISCAL YEARS 1975-2002 Average Monthly Number
(In thousands) Fiscal Year
Families Recipients Children
Total child population(under age 18)1
% all children on
AFDC/TANF
1975 3,357 11,094 7,952 67,164 11.8 1980 3,642 10,597 7,320 63,754 11.5 1985 3,692 10,813 7,165 62,623 11.4 1990 3,974 11,460 7,755 63,942 12.1 1991 4,374 12,592 8,513 65,069 13.1 1992 4,768 13,625 9,226 66,075 14.0 1993 4,981 14,143 9,560 66,963 14.3 1994 5,046 14,226 9,611 67,804 14.2 1995 4,879 13,659 9,280 68,438 13.6 1996 4,543 12,645 8,671 69,109 12.5 1997 3,937 10,935 7,301 69,603 10.5 1998 3,200 8,790 6,330 69,903 9.0 1999 2,674 7,188 5,319 70,199 7.6 2000 2,265 5,943 4,385 72,330 6.1 2001 2,116 5,420 4,055 72,616 5.6 2002 2,064 5,146 3,838 72,894 5.3 1 Census Bureau estimates of the resident child population (under age 18) as of July 1 each year. Source: Table prepared by the Congressional Research Service on the basis of data from the Department of Health and Human Services (DHHS). Family, recipient, and child data, FY1970 through 1995, are from Table 2.1 of the June 1998 DHHS AFDC baseline book. Later data are from annual TANF reports to Congress (except for 1997 child recipients, which are a rough estimate from DHHS).
Chart 7-1 shows that the number of cash welfare families began climbing in
fiscal year 1990, reached a record peak in spring 1994 (5.1 million families) and then plunged more than 50 percent to 2.2 million families by June 2000 (with almost one-fourth of this decline occurring before AFDC was replaced by TANF). However, the rate of decline slowed in 2001 and came to a near halt in 2002. Some of the continuing drop in TANF numbers represents families moved into Separate State Programs (see below). Food stamp enrollment, which also peaked in spring 1994 (28 million persons), dropped by more than 10 million persons in the next 7 years. However, since May 2001, food stamp numbers have been on the rise, and in May 2003 reached 21.5 million persons, the highest in 5-1/2 years.
Many factors helped to shrink the TANF caseload between 1996 and 2000, including the new “work first” culture, a rapidly growing economy, tougher work sanctions, the existence of a lifetime limit for Federally funded benefits, and widespread adoption of diversion practices. An August 1999 report by the Council of Economic Advisers (CEA) estimated that about one-third of the 1996-1998 caseload drop was due to Federal and State welfare policy changes, from 8 to 10 percent to the strong economy, 10 percent to the higher minimum wage, and from 1 to 5 percent to the lower real value of cash welfare benefits. (Council of Economic Advisers, 1999).
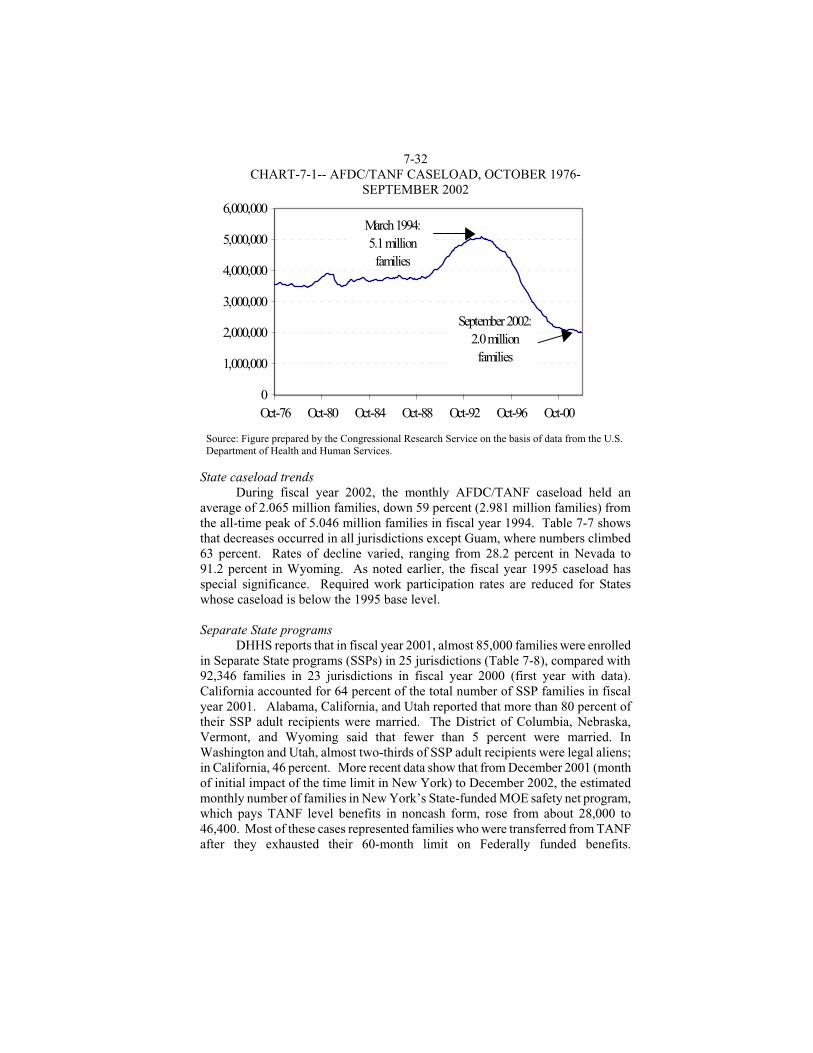
7-32 CHART-7-1-- AFDC/TANF CASELOAD, OCTOBER 1976-
SEPTEMBER 2002
0
1,000,000
2,000,000
3,000,000
4,000,000
5,000,000
6,000,000
Oct-76 Oct-80 Oct-84 Oct-88 Oct-92 Oct-96 Oct-00
March 1994:5.1 million families
September 2002:2.0 million families
Source: Figure prepared by the Congressional Research Service on the basis of data from the U.S. Department of Health and Human Services.
State caseload trends During fiscal year 2002, the monthly AFDC/TANF caseload held an
average of 2.065 million families, down 59 percent (2.981 million families) from the all-time peak of 5.046 million families in fiscal year 1994. Table 7-7 shows that decreases occurred in all jurisdictions except Guam, where numbers climbed 63 percent. Rates of decline varied, ranging from 28.2 percent in Nevada to 91.2 percent in Wyoming. As noted earlier, the fiscal year 1995 caseload has special significance. Required work participation rates are reduced for States whose caseload is below the 1995 base level. Separate State programs
DHHS reports that in fiscal year 2001, almost 85,000 families were enrolled in Separate State programs (SSPs) in 25 jurisdictions (Table 7-8), compared with 92,346 families in 23 jurisdictions in fiscal year 2000 (first year with data). California accounted for 64 percent of the total number of SSP families in fiscal year 2001. Alabama, California, and Utah reported that more than 80 percent of their SSP adult recipients were married. The District of Columbia, Nebraska, Vermont, and Wyoming said that fewer than 5 percent were married. In Washington and Utah, almost two-thirds of SSP adult recipients were legal aliens; in California, 46 percent. More recent data show that from December 2001 (month of initial impact of the time limit in New York) to December 2002, the estimated monthly number of families in New York’s State-funded MOE safety net program, which pays TANF level benefits in noncash form, rose from about 28,000 to 46,400. Most of these cases represented families who were transferred from TANF after they exhausted their 60-month limit on Federally funded benefits.
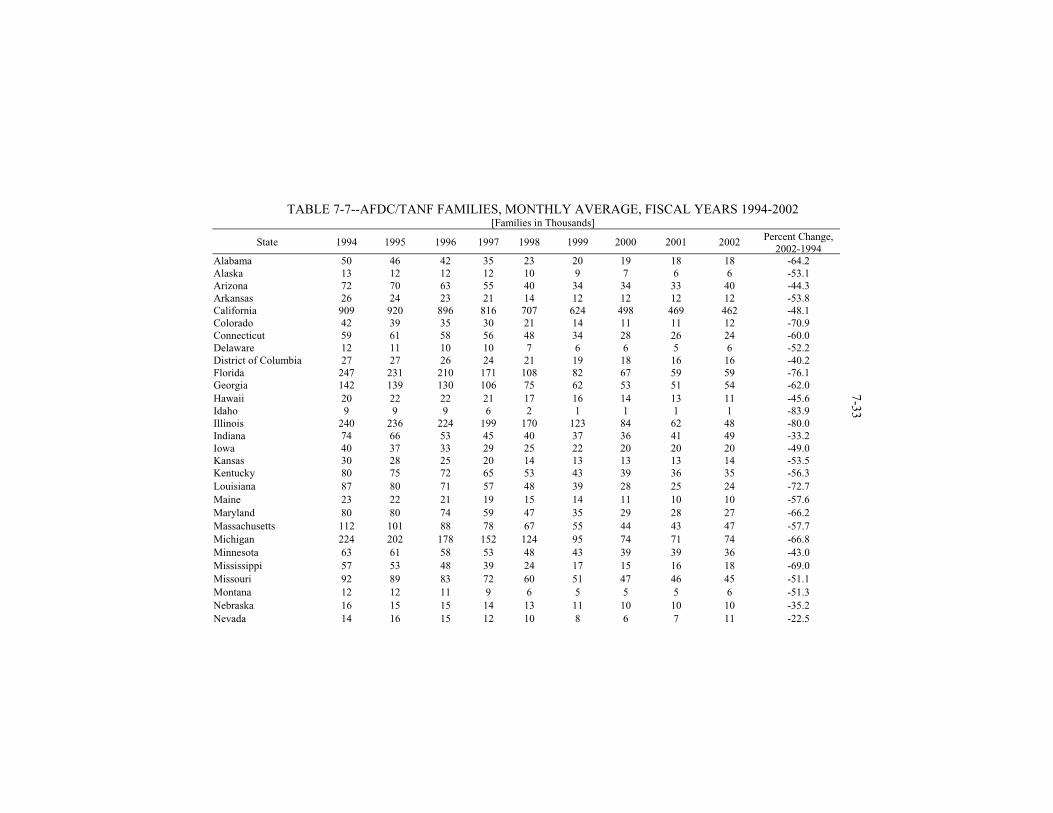
TABLE 7-7--AFDC/TANF FAMILIES, MONTHLY AVERAGE, FISCAL YEARS 1994-2002 [Families in Thousands]
State 1994 1995 1996 1997 1998 1999 2000 2001 2002 Percent Change, 2002-1994
Alabama 50 46 42 35 23 20 19 18 18 -64.2Alaska 13 12 12 12 10 9 7 6 6 -53.1Arizona 72 70 63 55 40 34 34 33 40 -44.3Arkansas 26 24 23 21 14 12 12 12 12 -53.8California 909 920 896 816 707 624 498 469 462 -48.1Colorado 42 39 35 30 21 14 11 11 12 -70.9Connecticut 59 61 58 56 48 34 28 26 24 -60.0Delaware 12 11 10 10 7 6 6 5 6 -52.2District of Columbia 27 27 26 24 21 19 18 16 16 -40.2Florida 247 231 210 171 108 82 67 59 59 -76.1Georgia 142 139 130 106 75 62 53 51 54 -62.0 Hawaii 20 22 22 21 17 16 14 13 11 -45.6Idaho 9 9 9 6 2 1 1 1 1 -83.9Illinois 240 236 224 199 170 123 84 62 48 -80.0Indiana 74 66 53 45 40 37 36 41 49 -33.2Iowa 40 37 33 29 25 22 20 20 20 -49.0Kansas 30 28 25 20 14 13 13 13 14 -53.5Kentucky 80 75 72 65 53 43 39 36 35 -56.3 Louisiana 87 80 71 57 48 39 28 25 24 -72.7 Maine 23 22 21 19 15 14 11 10 10 -57.6 Maryland 80 80 74 59 47 35 29 28 27 -66.2 Massachusetts 112 101 88 78 67 55 44 43 47 -57.7 Michigan 224 202 178 152 124 95 74 71 74 -66.8 Minnesota 63 61 58 53 48 43 39 39 36 -43.0
7-33
Mississippi 57 53 48 39 24 17 15 16 18 -69.0 Missouri 92 89 83 72 60 51 47 46 45 -51.1 Montana 12 12 11 9 6 5 5 5 6 -51.3
Nebraska 16 15 15 14 13 11 10 10 10 -35.2 Nevada 14 16 15 12 10 8 6 7 11 -22.5
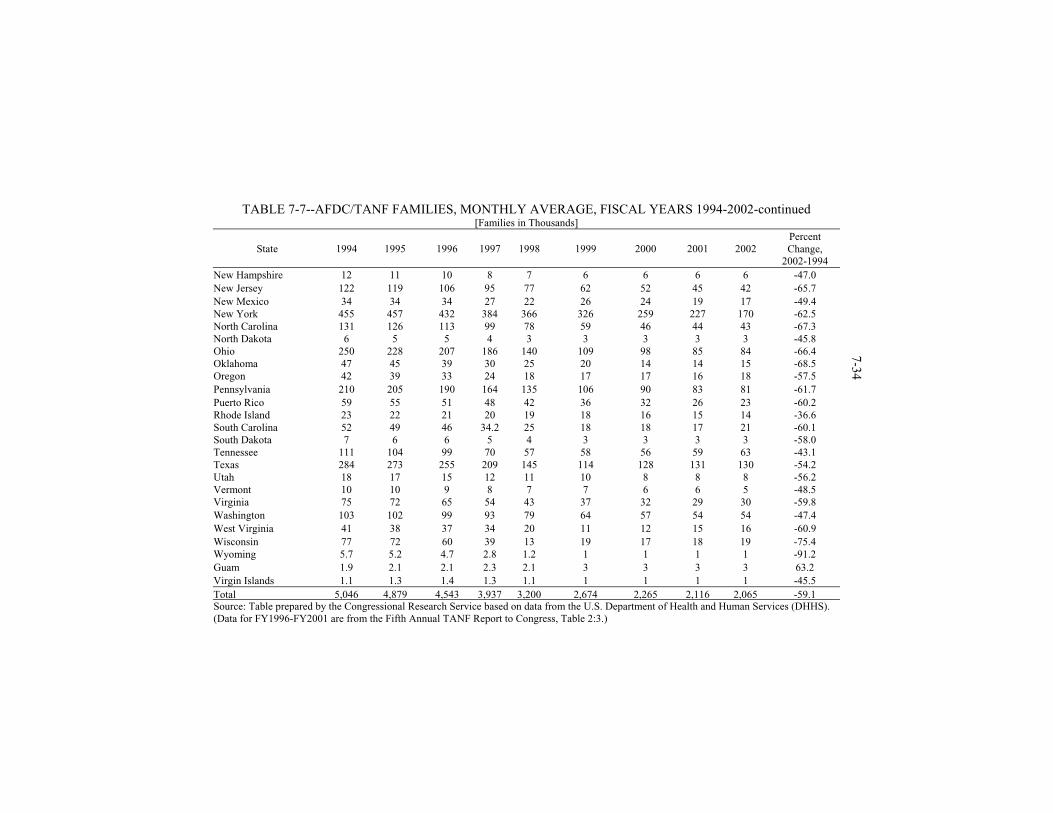
TABLE 7-7--AFDC/TANF FAMILIES, MONTHLY AVERAGE, FISCAL YEARS 1994-2002-continued [Families in Thousands]
State 1994 1995 1996 1997 1998 1999 2000 2001 2002 Percent Change,
2002-1994 New Hampshire 12 11 10 8 7 6 6 6 6 -47.0 New Jersey 122 119 106 95 77 62 52 45 42 -65.7 New Mexico 34 34 34 27 22 26 24 19 17 -49.4New York 455 457 432 384 366 326 259 227 170 -62.5North Carolina 131 126 113 99 78 59 46 44 43 -67.3North Dakota 6 5 5 4 3 3 3 3 3 -45.8Ohio 250 228 207 186 140 109 98 85 84 -66.4Oklahoma 47 45 39 30 25 20 14 14 15 -68.5Oregon 42 39 33 24 18 17 17 16 18 -57.5 Pennsylvania 210 205 190 164 135 106 90 83 81 -61.7 Puerto Rico 59 55 51 48 42 36 32 26 23 -60.2Rhode Island 23 22 21 20 19 18 16 15 14 -36.6South Carolina 52 49 46 34.2 25 18 18 17 21 -60.1South Dakota 7 6 6 5 4 3 3 3 3 -58.0Tennessee 111 104 99 70 57 58 56 59 63 -43.1Texas 284 273 255 209 145 114 128 131 130 -54.2Utah 18 17 15 12 11 10 8 8 8 -56.2Vermont 10 10 9 8 7 7 6 6 5 -48.5Virginia 75 72 65 54 43 37 32 29 30 -59.8 Washington 103 102 99 93 79 64 57 54 54 -47.4 West Virginia 41 38 37 34 20 11 12 15 16 -60.9
7-34
Wisconsin 77 72 60 39 13 19 17 18 19 -75.4Wyoming 5.7 5.2 4.7 2.8 1.2 1 1 1 1 -91.2 Guam 1.9 2.1 2.1 2.3 2.1 3 3 3 3 63.2 Virgin Islands 1.1 1.3 1.4 1.3 1.1 1 1 1 1 -45.5 Total 5,046 4,879 4,543 3,937 3,200 2,674 2,265 2,116 2,065 -59.1Source: Table prepared by the Congressional Research Service based on data from the U.S. Department of Health and Human Services (DHHS). (Data for FY1996-FY2001 are from the Fifth Annual TANF Report to Congress, Table 2:3.)
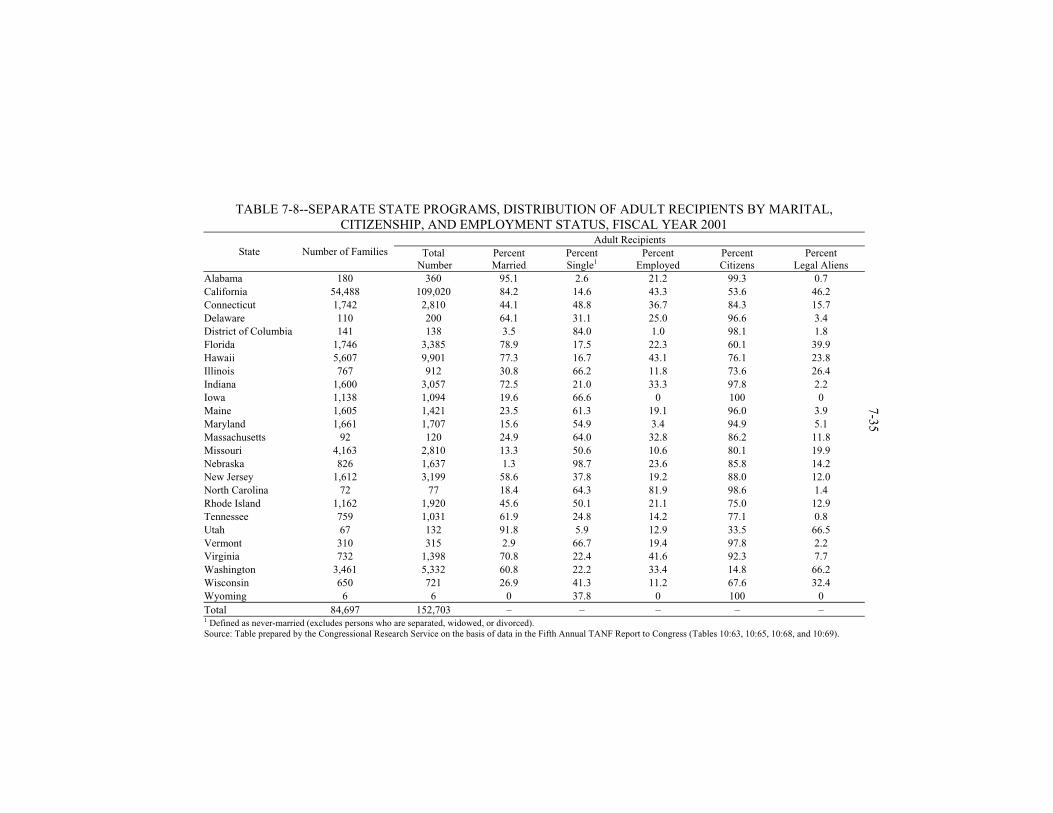
TABLE 7-8--SEPARATE STATE PROGRAMS, DISTRIBUTION OF ADULT RECIPIENTS BY MARITAL, CITIZENSHIP, AND EMPLOYMENT STATUS, FISCAL YEAR 2001
Adult Recipients State Number of Families Total
Number Percent Married
Percent Single1
Percent Employed
Percent Citizens
Percent Legal Aliens
Alabama 180 360 95.1 2.6 21.2 99.3 0.7 California 54,488 109,020 84.2 14.6 43.3 53.6 46.2 Connecticut 1,742 2,810 44.1 48.8 36.7 84.3 15.7 Delaware 110 200 64.1 31.1 25.0 96.6 3.4 District of Columbia 141 138 3.5 84.0 1.0 98.1 1.8 Florida 1,746 3,385 78.9 17.5 22.3 60.1 39.9 Hawaii 5,607 9,901 77.3 16.7 43.1 76.1 23.8 Illinois 767 912 30.8 66.2 11.8 73.6 26.4 Indiana 1,600 3,057 72.5 21.0 33.3 97.8 2.2 Iowa 1,138 1,094 19.6 66.6 0 100 0 Maine 1,605 1,421 23.5 61.3 19.1 96.0 3.9 Maryland 1,661 1,707 15.6 54.9 3.4 94.9 5.1 Massachusetts 92 120 24.9 64.0 32.8 86.2 11.8 Missouri 4,163 2,810 13.3 50.6 10.6 80.1 19.9 Nebraska 826 1,637 1.3 98.7 23.6 85.8 14.2 New Jersey 1,612 3,199 58.6 37.8 19.2 88.0 12.0 North Carolina 72 77 18.4 64.3 81.9 98.6 1.4 Rhode Island 1,162 1,920 45.6 50.1 21.1 75.0 12.9 Tennessee 759 1,031 61.9 24.8 14.2 77.1 0.8 Utah 67 132 91.8 5.9 12.9 33.5 66.5 Vermont 310 315 2.9 66.7 19.4 97.8 2.2 Virginia 732 1,398 70.8 22.4 41.6 92.3 7.7 Washington 3,461 5,332 60.8 22.2 33.4 14.8 66.2 Wisconsin 650 721 26.9 41.3 11.2 67.6 32.4 Wyoming 6 6 0 37.8 0 100 0 Total 84,697 152,703 – – – – – 1 Defined as never-married (excludes persons who are separated, widowed, or divorced). Source: Table prepared by the Congressional Research Service on the basis of data in the Fifth Annual TANF Report to Congress (Tables 10:63, 10:65, 10:68, and 10:69).
7-35
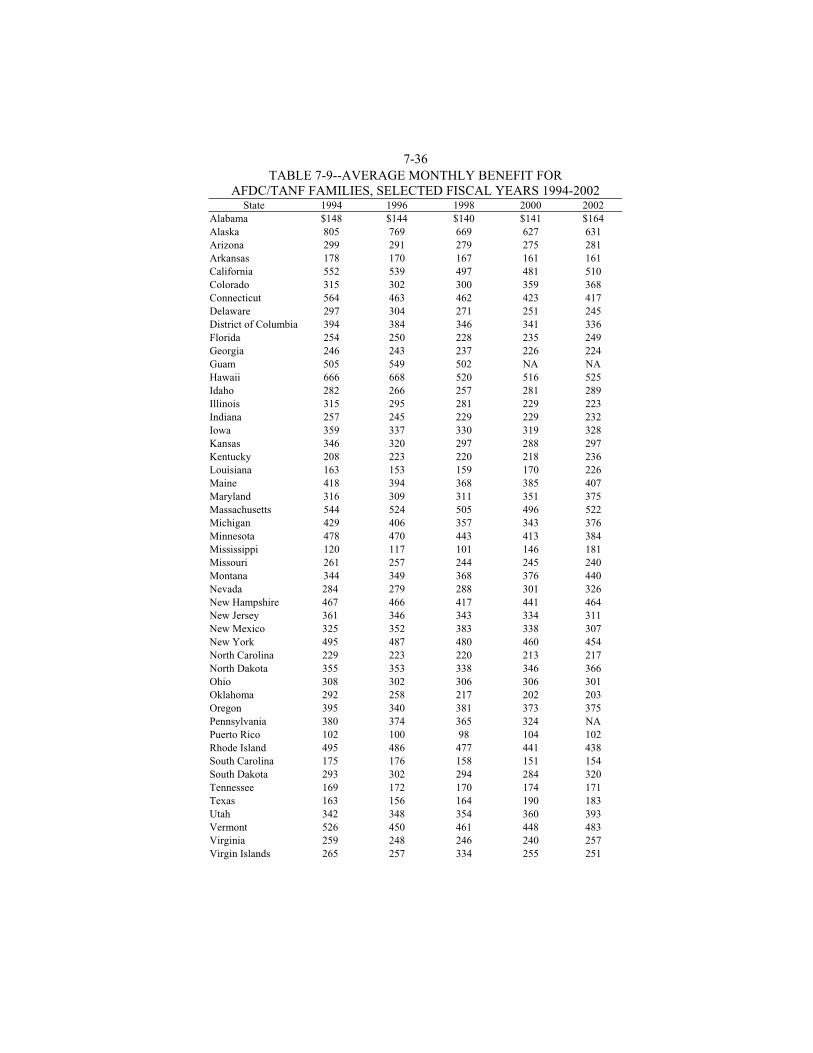
7-36 TABLE 7-9--AVERAGE MONTHLY BENEFIT FOR
AFDC/TANF FAMILIES, SELECTED FISCAL YEARS 1994-2002 State 1994 1996 1998 2000 2002
Alabama $148 $144 $140 $141 $164 Alaska 805 769 669 627 631 Arizona 299 291 279 275 281 Arkansas 178 170 167 161 161 California 552 539 497 481 510 Colorado 315 302 300 359 368 Connecticut 564 463 462 423 417 Delaware 297 304 271 251 245 District of Columbia 394 384 346 341 336 Florida 254 250 228 235 249 Georgia 246 243 237 226 224 Guam 505 549 502 NA NA Hawaii 666 668 520 516 525 Idaho 282 266 257 281 289 Illinois 315 295 281 229 223 Indiana 257 245 229 229 232 Iowa 359 337 330 319 328 Kansas 346 320 297 288 297 Kentucky 208 223 220 218 236 Louisiana 163 153 159 170 226 Maine 418 394 368 385 407 Maryland 316 309 311 351 375 Massachusetts 544 524 505 496 522 Michigan 429 406 357 343 376 Minnesota 478 470 443 413 384 Mississippi 120 117 101 146 181 Missouri 261 257 244 245 240 Montana 344 349 368 376 440 Nevada 284 279 288 301 326 New Hampshire 467 466 417 441 464 New Jersey 361 346 343 334 311 New Mexico 325 352 383 338 307 New York 495 487 480 460 454 North Carolina 229 223 220 213 217 North Dakota 355 353 338 346 366 Ohio 308 302 306 306 301 Oklahoma 292 258 217 202 203 Oregon 395 340 381 373 375 Pennsylvania 380 374 365 324 NA Puerto Rico 102 100 98 104 102 Rhode Island 495 486 477 441 438 South Carolina 175 176 158 151 154 South Dakota 293 302 294 284 320 Tennessee 169 172 170 174 171 Texas 163 156 164 190 183 Utah 342 348 354 360 393 Vermont 526 450 461 448 483 Virginia 259 248 246 240 257 Virgin Islands 265 257 334 255 251
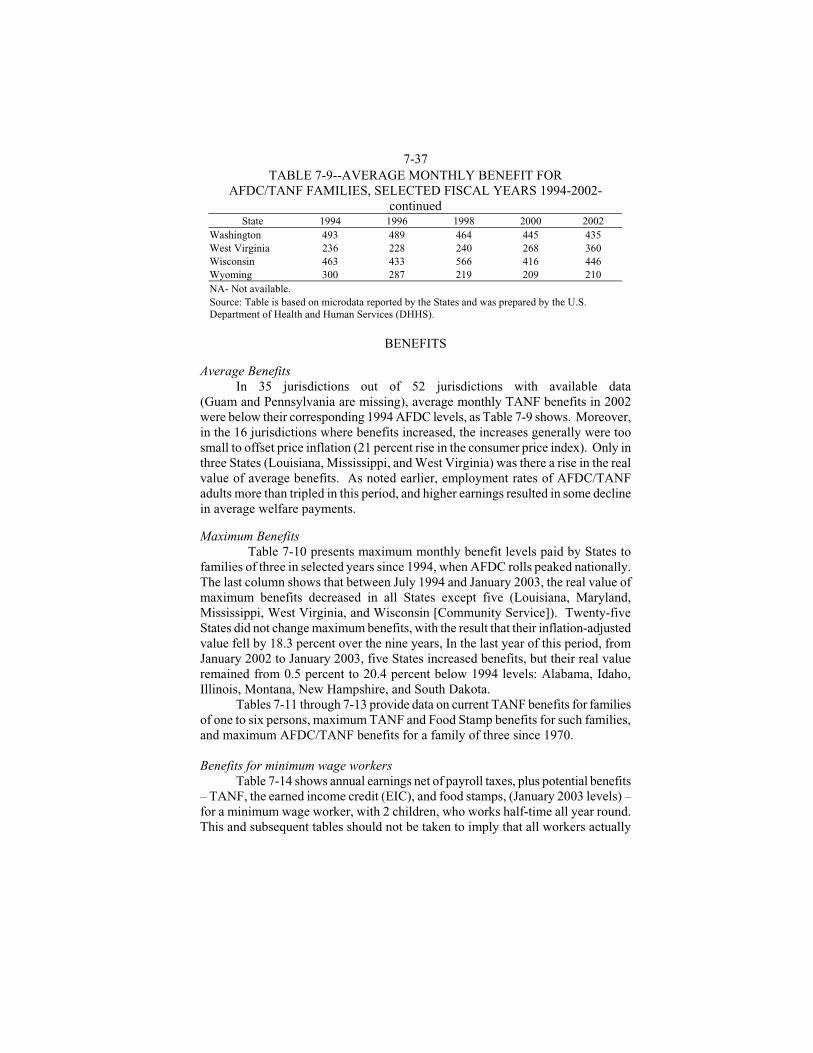
7-37 TABLE 7-9--AVERAGE MONTHLY BENEFIT FOR
AFDC/TANF FAMILIES, SELECTED FISCAL YEARS 1994-2002-continued
State 1994 1996 1998 2000 2002 Washington 493 489 464 445 435 West Virginia 236 228 240 268 360 Wisconsin 463 433 566 416 446 Wyoming 300 287 219 209 210 NA- Not available. Source: Table is based on microdata reported by the States and was prepared by the U.S. Department of Health and Human Services (DHHS).
BENEFITS
Average Benefits
In 35 jurisdictions out of 52 jurisdictions with available data (Guam and Pennsylvania are missing), average monthly TANF benefits in 2002 were below their corresponding 1994 AFDC levels, as Table 7-9 shows. Moreover, in the 16 jurisdictions where benefits increased, the increases generally were too small to offset price inflation (21 percent rise in the consumer price index). Only in three States (Louisiana, Mississippi, and West Virginia) was there a rise in the real value of average benefits. As noted earlier, employment rates of AFDC/TANF adults more than tripled in this period, and higher earnings resulted in some decline in average welfare payments. Maximum Benefits Table 7-10 presents maximum monthly benefit levels paid by States to families of three in selected years since 1994, when AFDC rolls peaked nationally. The last column shows that between July 1994 and January 2003, the real value of maximum benefits decreased in all States except five (Louisiana, Maryland, Mississippi, West Virginia, and Wisconsin [Community Service]). Twenty-five States did not change maximum benefits, with the result that their inflation-adjusted value fell by 18.3 percent over the nine years, In the last year of this period, from January 2002 to January 2003, five States increased benefits, but their real value remained from 0.5 percent to 20.4 percent below 1994 levels: Alabama, Idaho, Illinois, Montana, New Hampshire, and South Dakota. Tables 7-11 through 7-13 provide data on current TANF benefits for families of one to six persons, maximum TANF and Food Stamp benefits for such families, and maximum AFDC/TANF benefits for a family of three since 1970. Benefits for minimum wage workers Table 7-14 shows annual earnings net of payroll taxes, plus potential benefits – TANF, the earned income credit (EIC), and food stamps, (January 2003 levels) – for a minimum wage worker, with 2 children, who works half-time all year round. This and subsequent tables should not be taken to imply that all workers actually
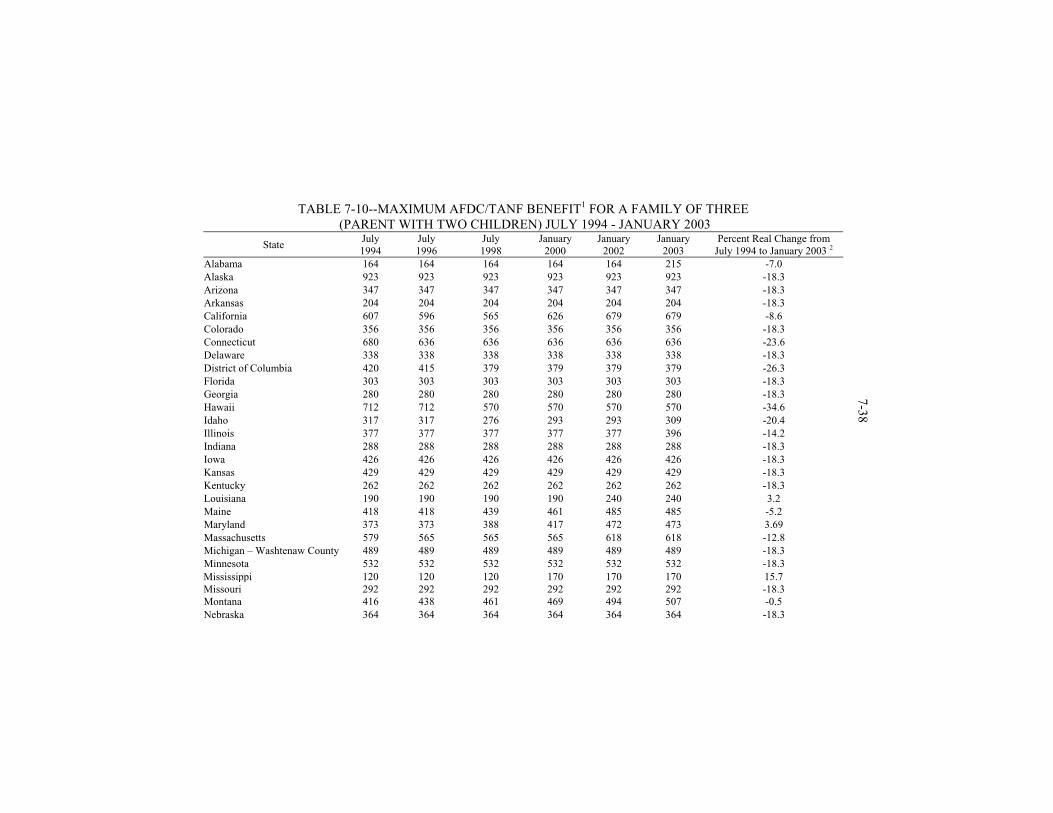
TABLE 7-10--MAXIMUM AFDC/TANF BENEFIT1 FOR A FAMILY OF THREE (PARENT WITH TWO CHILDREN) JULY 1994 - JANUARY 2003
State July 1994
July 1996
July 1998
January 2000
January 2002
January 2003
Percent Real Change from July 1994 to January 2003 2
Alabama 164 164 164 164 164 215 -7.0 Alaska 923 923 923 923 923 923 -18.3 Arizona 347 347 347 347 347 347 -18.3 Arkansas 204 204 204 204 204 204 -18.3 California 607 596 565 626 679 679 -8.6 Colorado 356 356 356 356 356 356 -18.3 Connecticut 680 636 636 636 636 636 -23.6 Delaware 338 338 338 338 338 338 -18.3 District of Columbia 420 415 379 379 379 379 -26.3 Florida 303 303 303 303 303 303 -18.3 Georgia 280 280 280 280 280 280 -18.3 Hawaii 712 712 570 570 570 570 -34.6 Idaho 317 317 276 293 293 309 -20.4 Illinois 377 377 377 377 377 396 -14.2 Indiana 288 288 288 288 288 288 -18.3 Iowa 426 426 426 426 426 426 -18.3 Kansas 429 429 429 429 429 429 -18.3 Kentucky 262 262 262 262 262 262 -18.3 Louisiana 190 190 190 190 240 240 3.2 Maine 418 418 439 461 485 485 -5.2 Maryland 373 373 388 417 472 473 3.69 Massachusetts 579 565 565 565 618 618 -12.8 Michigan – Washtenaw County 489 489 489 489 489 489 -18.3 Minnesota 532 532 532 532 532 532 -18.3 Mississippi 120 120 120 170 170 170 15.7Missouri 292 292 292 292 292 292 -18.3Montana 416 438 461 469 494 507 -0.5 Nebraska 364 364 364 364 364 364 -18.3
7-38
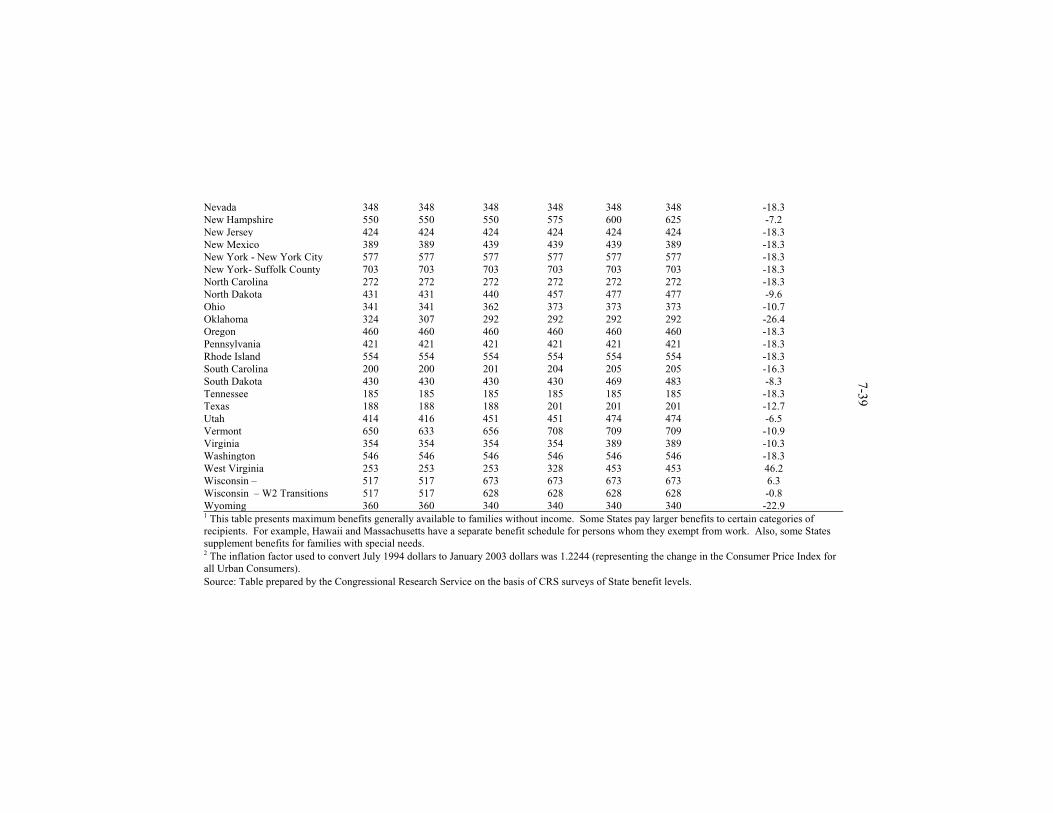
Nevada 348 348 348 348 348 348 -18.3New Hampshire 550 550 550 575 600 625 -7.2New Jersey 424 424 424 424 424 424 -18.3New Mexico 389 389 439 439 439 389 -18.3New York - New York City 577 577 577 577 577 577 -18.3New York- Suffolk County 703 703 703 703 703 703 -18.3North Carolina 272 272 272 272 272 272 -18.3North Dakota 431 431 440 457 477 477 -9.6Ohio 341 341 362 373 373 373 -10.7Oklahoma 324 307 292 292 292 292 -26.4Oregon 460 460 460 460 460 460 -18.3Pennsylvania 421 421 421 421 421 421 -18.3Rhode Island 554 554 554 554 554 554 -18.3South Carolina 200 200 201 204 205 205 -16.3South Dakota 430 430 430 430 469 483 -8.3Tennessee 185 185 185 185 185 185 -18.3Texas 188 188 188 201 201 201 -12.7Utah 414 416 451 451 474 474 -6.5Vermont 650 633 656 708 709 709 -10.9Virginia 354 354 354 354 389 389 -10.3Washington 546 546 546 546 546 546 -18.3West Virginia 253 253 253 328 453 453 46.2Wisconsin – 517 517 673 673 673 673 6.3Wisconsin – W2 Transitions 517 517 628 628 628 628 -0.8Wyoming 360 360 340 340 340 340 -22.91 This table presents maximum benefits generally available to families without income. Some States pay larger benefits to certain categories of recipients. For example, Hawaii and Massachusetts have a separate benefit schedule for persons whom they exempt from work. Also, some States supplement benefits for families with special needs. 2 The inflation factor used to convert July 1994 dollars to January 2003 dollars was 1.2244 (representing the change in the Consumer Price Index for all Urban Consumers). Source: Table prepared by the Congressional Research Service on the basis of CRS surveys of State benefit levels.
7-39
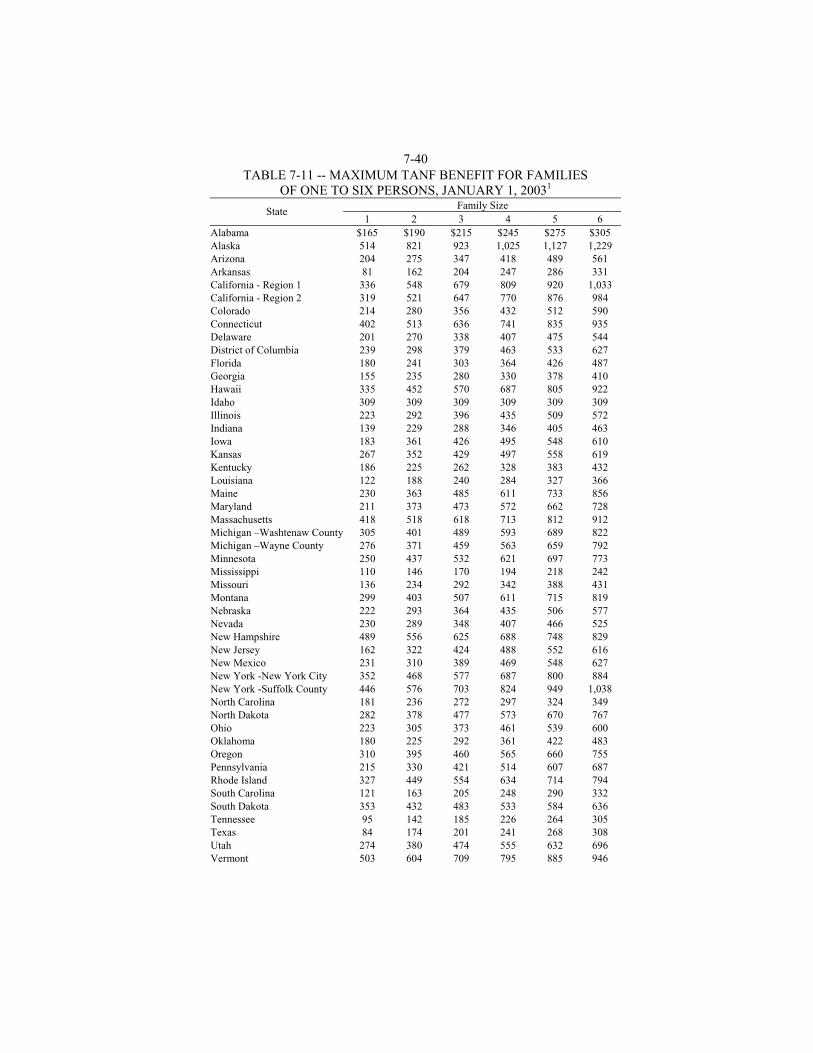
7-40 TABLE 7-11 -- MAXIMUM TANF BENEFIT FOR FAMILIES
OF ONE TO SIX PERSONS, JANUARY 1, 20031 Family Size
State 1 2 3 4 5 6
Alabama $165 $190 $215 $245 $275 $305 Alaska 514 821 923 1,025 1,127 1,229 Arizona 204 275 347 418 489 561 Arkansas 81 162 204 247 286 331 California - Region 1 336 548 679 809 920 1,033 California - Region 2 319 521 647 770 876 984 Colorado 214 280 356 432 512 590 Connecticut 402 513 636 741 835 935 Delaware 201 270 338 407 475 544 District of Columbia 239 298 379 463 533 627 Florida 180 241 303 364 426 487 Georgia 155 235 280 330 378 410 Hawaii 335 452 570 687 805 922 Idaho 309 309 309 309 309 309 Illinois 223 292 396 435 509 572 Indiana 139 229 288 346 405 463 Iowa 183 361 426 495 548 610 Kansas 267 352 429 497 558 619 Kentucky 186 225 262 328 383 432 Louisiana 122 188 240 284 327 366 Maine 230 363 485 611 733 856 Maryland 211 373 473 572 662 728 Massachusetts 418 518 618 713 812 912 Michigan –Washtenaw County 305 401 489 593 689 822 Michigan –Wayne County 276 371 459 563 659 792 Minnesota 250 437 532 621 697 773 Mississippi 110 146 170 194 218 242 Missouri 136 234 292 342 388 431 Montana 299 403 507 611 715 819 Nebraska 222 293 364 435 506 577 Nevada 230 289 348 407 466 525 New Hampshire 489 556 625 688 748 829 New Jersey 162 322 424 488 552 616 New Mexico 231 310 389 469 548 627 New York -New York City 352 468 577 687 800 884 New York -Suffolk County 446 576 703 824 949 1,038 North Carolina 181 236 272 297 324 349 North Dakota 282 378 477 573 670 767 Ohio 223 305 373 461 539 600 Oklahoma 180 225 292 361 422 483 Oregon 310 395 460 565 660 755 Pennsylvania 215 330 421 514 607 687 Rhode Island 327 449 554 634 714 794 South Carolina 121 163 205 248 290 332 South Dakota 353 432 483 533 584 636 Tennessee 95 142 185 226 264 305 Texas 84 174 201 241 268 308 Utah 274 380 474 555 632 696 Vermont 503 604 709 795 885 946
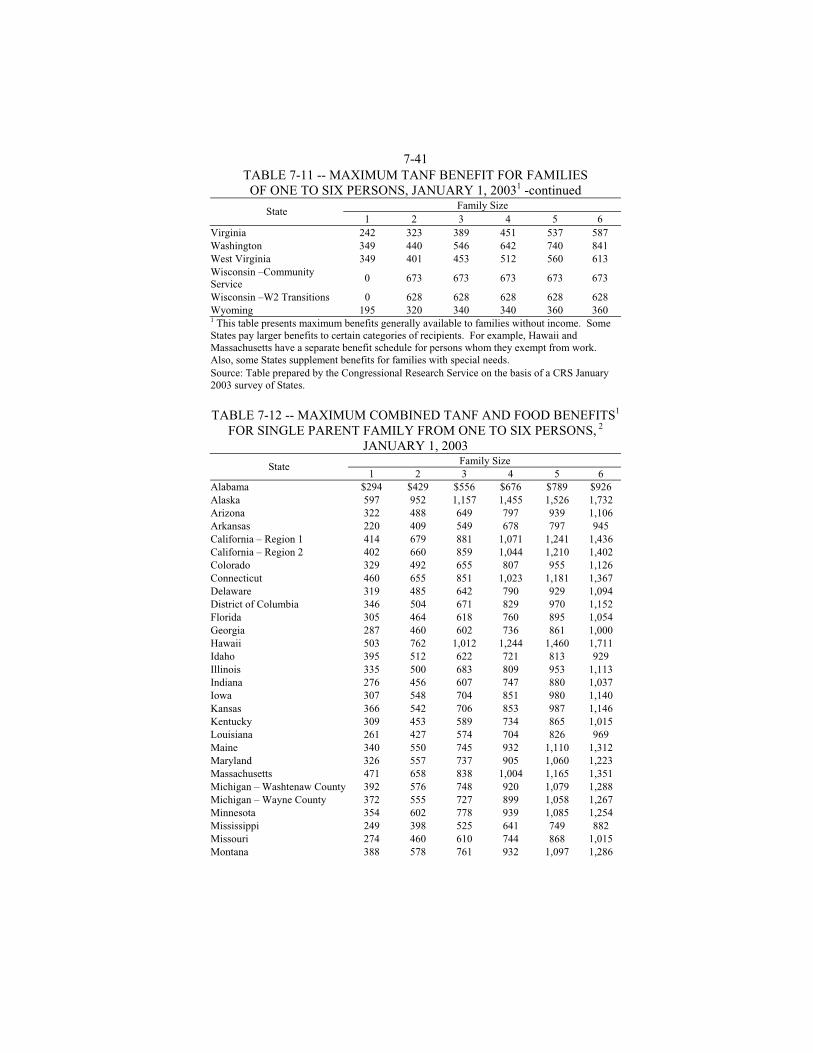
7-41 TABLE 7-11 -- MAXIMUM TANF BENEFIT FOR FAMILIES OF ONE TO SIX PERSONS, JANUARY 1, 20031 -continued
Family Size State
1 2 3 4 5 6 Virginia 242 323 389 451 537 587 Washington 349 440 546 642 740 841 West Virginia 349 401 453 512 560 613 Wisconsin –Community Service
0 673 673 673 673 673
Wisconsin –W2 Transitions 0 628 628 628 628 628 Wyoming 195 320 340 340 360 360 1 This table presents maximum benefits generally available to families without income. Some States pay larger benefits to certain categories of recipients. For example, Hawaii and Massachusetts have a separate benefit schedule for persons whom they exempt from work. Also, some States supplement benefits for families with special needs. Source: Table prepared by the Congressional Research Service on the basis of a CRS January 2003 survey of States.
TABLE 7-12 -- MAXIMUM COMBINED TANF AND FOOD BENEFITS1
FOR SINGLE PARENT FAMILY FROM ONE TO SIX PERSONS, 2
JANUARY 1, 2003 Family Size State
1 2 3 4 5 6 Alabama $294 $429 $556 $676 $789 $926 Alaska 597 952 1,157 1,455 1,526 1,732 Arizona 322 488 649 797 939 1,106 Arkansas 220 409 549 678 797 945 California – Region 1 414 679 881 1,071 1,241 1,436 California – Region 2 402 660 859 1,044 1,210 1,402 Colorado 329 492 655 807 955 1,126 Connecticut 460 655 851 1,023 1,181 1,367 Delaware 319 485 642 790 929 1,094 District of Columbia 346 504 671 829 970 1,152 Florida 305 464 618 760 895 1,054 Georgia 287 460 602 736 861 1,000 Hawaii 503 762 1,012 1,244 1,460 1,711 Idaho 395 512 622 721 813 929 Illinois 335 500 683 809 953 1,113 Indiana 276 456 607 747 880 1,037 Iowa 307 548 704 851 980 1,140 Kansas 366 542 706 853 987 1,146 Kentucky 309 453 589 734 865 1,015 Louisiana 261 427 574 704 826 969 Maine 340 550 745 932 1,110 1,312 Maryland 326 557 737 905 1,060 1,223 Massachusetts 471 658 838 1,004 1,165 1,351 Michigan – Washtenaw County 392 576 748 920 1,079 1,288 Michigan – Wayne County 372 555 727 899 1,058 1,267 Minnesota 354 602 778 939 1,085 1,254 Mississippi 249 398 525 641 749 882 Missouri 274 460 610 744 868 1,015 Montana 388 578 761 932 1,097 1,286
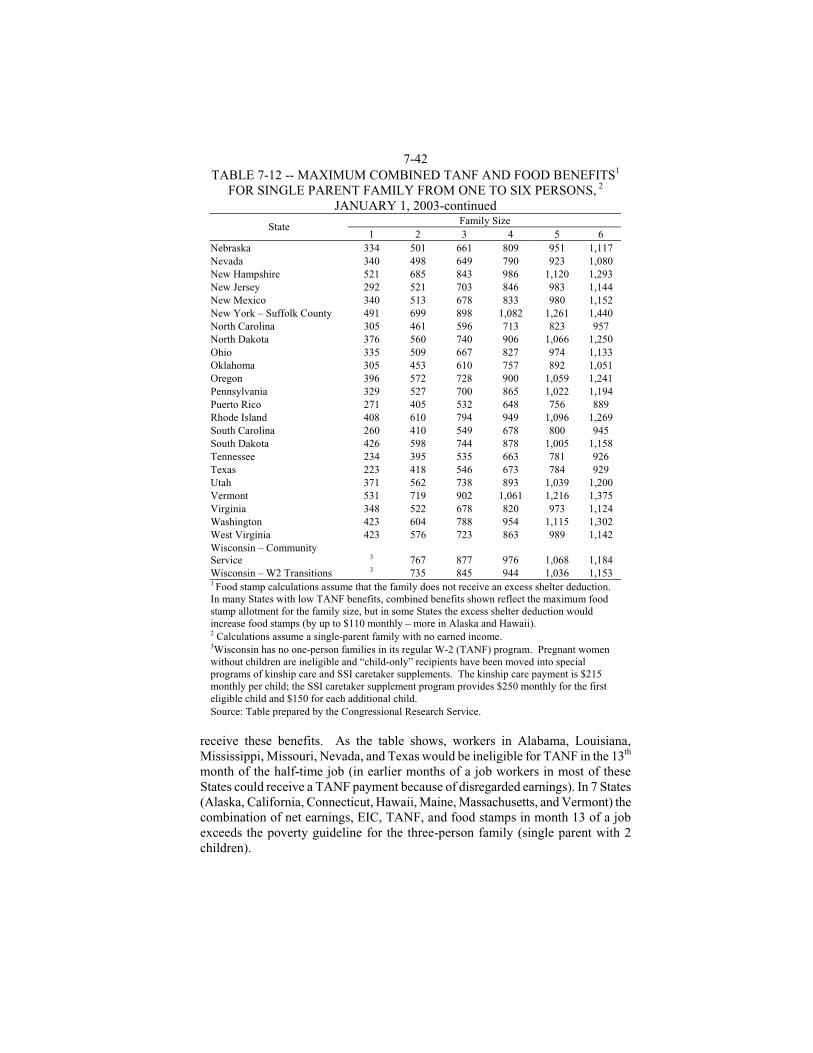
7-42 TABLE 7-12 -- MAXIMUM COMBINED TANF AND FOOD BENEFITS1
FOR SINGLE PARENT FAMILY FROM ONE TO SIX PERSONS, 2
JANUARY 1, 2003-continued Family Size
State 1 2 3 4 5 6
Nebraska 334 501 661 809 951 1,117 Nevada 340 498 649 790 923 1,080 New Hampshire 521 685 843 986 1,120 1,293 New Jersey 292 521 703 846 983 1,144 New Mexico 340 513 678 833 980 1,152 New York – Suffolk County 491 699 898 1,082 1,261 1,440 North Carolina 305 461 596 713 823 957 North Dakota 376 560 740 906 1,066 1,250 Ohio 335 509 667 827 974 1,133 Oklahoma 305 453 610 757 892 1,051 Oregon 396 572 728 900 1,059 1,241 Pennsylvania 329 527 700 865 1,022 1,194 Puerto Rico 271 405 532 648 756 889 Rhode Island 408 610 794 949 1,096 1,269 South Carolina 260 410 549 678 800 945 South Dakota 426 598 744 878 1,005 1,158 Tennessee 234 395 535 663 781 926 Texas 223 418 546 673 784 929 Utah 371 562 738 893 1,039 1,200 Vermont 531 719 902 1,061 1,216 1,375 Virginia 348 522 678 820 973 1,124 Washington 423 604 788 954 1,115 1,302 West Virginia 423 576 723 863 989 1,142 Wisconsin – Community Service 3 767 877 976 1,068 1,184 Wisconsin – W2 Transitions 3 735 845 944 1,036 1,153 1 Food stamp calculations assume that the family does not receive an excess shelter deduction. In many States with low TANF benefits, combined benefits shown reflect the maximum food stamp allotment for the family size, but in some States the excess shelter deduction would increase food stamps (by up to $110 monthly – more in Alaska and Hawaii). 2 Calculations assume a single-parent family with no earned income. 3Wisconsin has no one-person families in its regular W-2 (TANF) program. Pregnant women without children are ineligible and “child-only” recipients have been moved into special programs of kinship care and SSI caretaker supplements. The kinship care payment is $215 monthly per child; the SSI caretaker supplement program provides $250 monthly for the first eligible child and $150 for each additional child. Source: Table prepared by the Congressional Research Service.
receive these benefits. As the table shows, workers in Alabama, Louisiana, Mississippi, Missouri, Nevada, and Texas would be ineligible for TANF in the 13th month of the half-time job (in earlier months of a job workers in most of these States could receive a TANF payment because of disregarded earnings). In 7 States (Alaska, California, Connecticut, Hawaii, Maine, Massachusetts, and Vermont) the combination of net earnings, EIC, TANF, and food stamps in month 13 of a job exceeds the poverty guideline for the three-person family (single parent with 2 children).
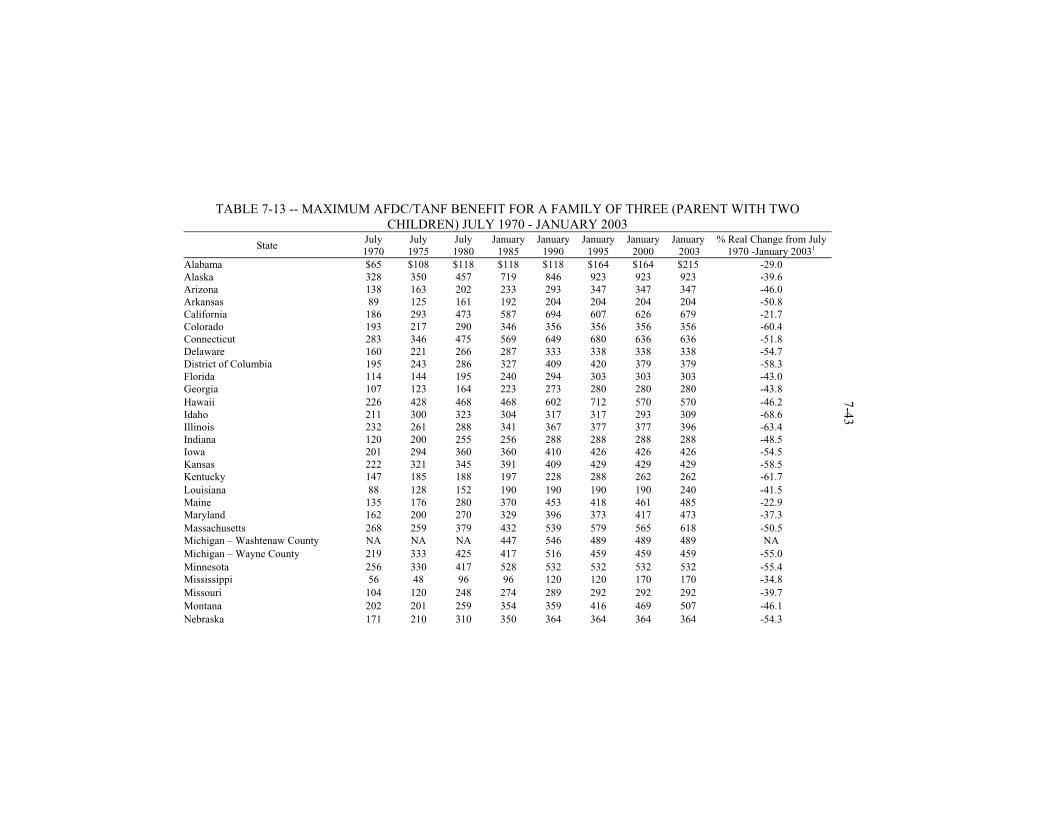
TABLE 7-13 -- MAXIMUM AFDC/TANF BENEFIT FOR A FAMILY OF THREE (PARENT WITH TWO CHILDREN) JULY 1970 - JANUARY 2003
State July 1970
July 1975
July 1980
January 1985
January 1990
January 1995
January 2000
January 2003
% Real Change from July 1970 -January 20031
Alabama $65 $108 $118 $118 $118 $164 $164 $215 -29.0Alaska 328 350 457 719 846 923 923 923 -39.6Arizona 138 163 202 233 293 347 347 347 -46.0Arkansas 89 125 161 192 204 204 204 204 -50.8California 186 293 473 587 694 607 626 679 -21.7Colorado 193 217 290 346 356 356 356 356 -60.4Connecticut 283 346 475 569 649 680 636 636 -51.8Delaware 160 221 266 287 333 338 338 338 -54.7District of Columbia 195 243 286 327 409 420 379 379 -58.3Florida 114 144 195 240 294 303 303 303 -43.0Georgia 107 123 164 223 273 280 280 280 -43.8 Hawaii 226 428 468 468 602 712 570 570 -46.2Idaho 211 300 323 304 317 317 293 309 -68.6Illinois 232 261 288 341 367 377 377 396 -63.4Indiana 120 200 255 256 288 288 288 288 -48.5Iowa 201 294 360 360 410 426 426 426 -54.5Kansas 222 321 345 391 409 429 429 429 -58.5Kentucky 147 185 188 197 228 288 262 262 -61.7 Louisiana 88 128 152 190 190 190 190 240 -41.5Maine 135 176 280 370 453 418 461 485 -22.9Maryland 162 200 270 329 396 373 417 473 -37.3 Massachusetts 268 259 379 432 539 579 565 618 -50.5Michigan – Washtenaw County NA NA NA 447 546 489 489 489 NA Michigan – Wayne County 219 333 425 417 516 459 459 459 -55.0 Minnesota 256 330 417 528 532 532 532 532 -55.4Mississippi 56 48 96 96 120 120 170 170 -34.8 Missouri 104 120 248 274 289 292 292 292 -39.7 Montana 202 201 259 354 359 416 469 507 -46.1 Nebraska 171 210 310 350 364 364 364 364 -54.3
7-43
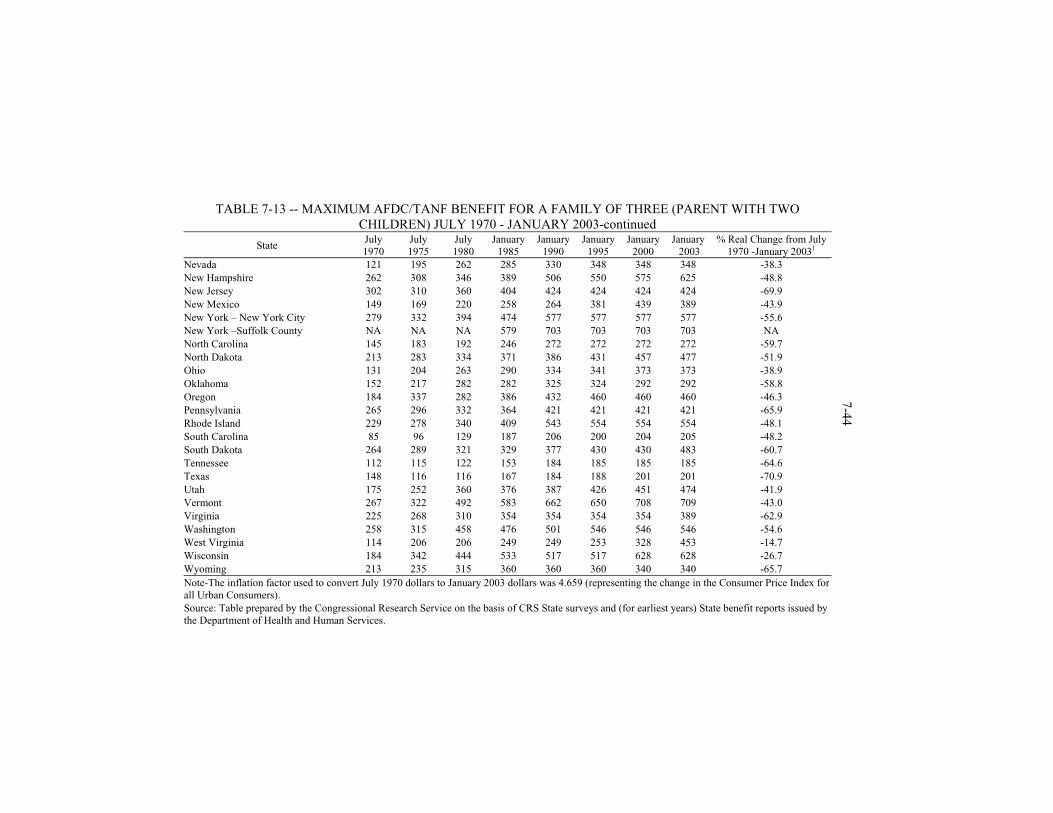
TABLE 7-13 -- MAXIMUM AFDC/TANF BENEFIT FOR A FAMILY OF THREE (PARENT WITH TWO CHILDREN) JULY 1970 - JANUARY 2003-continued
State July 1970
July 1975
July 1980
January 1985
January 1990
January 1995
January 2000
January 2003
% Real Change from July 1970 -January 20031
Nevada 121 195 262 285 330 348 348 348 -38.3 New Hampshire 262 308 346 389 506 550 575 625 -48.8 New Jersey 302 310 360 404 424 424 424 424 -69.9 New Mexico 149 169 220 258 264 381 439 389 -43.9 New York – New York City 279 332 394 474 577 577 577 577 -55.6 New York –Suffolk County NA NA NA 579 703 703 703 703 NA North Carolina 145 183 192 246 272 272 272 272 -59.7 North Dakota 213 283 334 371 386 431 457 477 -51.9 Ohio 131 204 263 290 334 341 373 373 -38.9 Oklahoma 152 217 282 282 325 324 292 292 -58.8 Oregon 184 337 282 386 432 460 460 460 -46.3 Pennsylvania 265 296 332 364 421 421 421 421 -65.9 Rhode Island 229 278 340 409 543 554 554 554 -48.1 South Carolina 85 96 129 187 206 200 204 205 -48.2 South Dakota 264 289 321 329 377 430 430 483 -60.7 Tennessee 112 115 122 153 184 185 185 185 -64.6 Texas 148 116 116 167 184 188 201 201 -70.9 Utah 175 252 360 376 387 426 451 474 -41.9 Vermont 267 322 492 583 662 650 708 709 -43.0 Virginia 225 268 310 354 354 354 354 389 -62.9 Washington 258 315 458 476 501 546 546 546 -54.6 West Virginia 114 206 206 249 249 253 328 453 -14.7 Wisconsin 184 342 444 533 517 517 628 628 -26.7 Wyoming 213 235 315 360 360 360 340 340 -65.7 Note-The inflation factor used to convert July 1970 dollars to January 2003 dollars was 4.659 (representing the change in the Consumer Price Index for all Urban Consumers). Source: Table prepared by the Congressional Research Service on the basis of CRS State surveys and (for earliest years) State benefit reports issued by the Department of Health and Human Services.
7-44
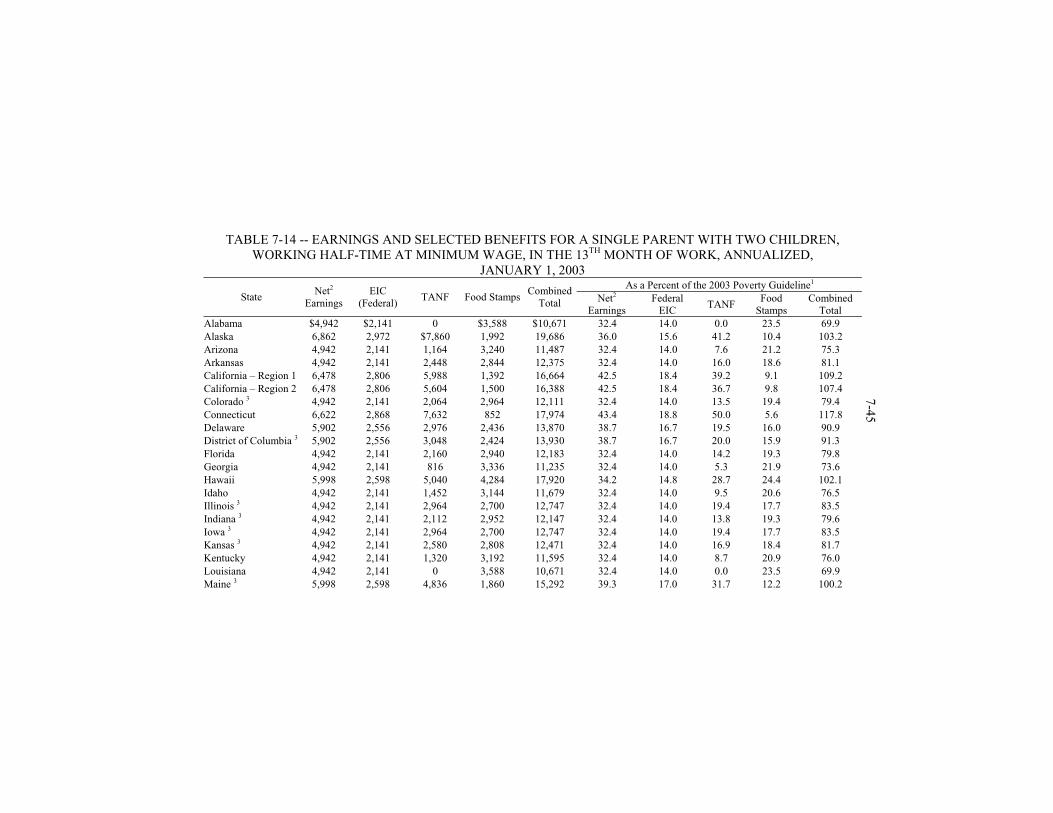
TABLE 7-14 -- EARNINGS AND SELECTED BENEFITS FOR A SINGLE PARENT WITH TWO CHILDREN, WORKING HALF-TIME AT MINIMUM WAGE, IN THE 13TH MONTH OF WORK, ANNUALIZED,
JANUARY 1, 2003 As a Percent of the 2003 Poverty Guideline1
State Net2
Earnings EIC
(Federal) TANF Food Stamps
Combined Total Net2
Earnings Federal
EIC TANF
Food Stamps
Combined Total
Alabama $4,942 $2,141 0 $3,588 $10,671 32.4 14.0 0.0 23.5 69.9 Alaska 6,862 2,972 $7,860 1,992 19,686 36.0 15.6 41.2 10.4 103.2 Arizona 4,942 2,141 1,164 3,240 11,487 32.4 14.0 7.6 21.2 75.3 Arkansas 4,942 2,141 2,448 2,844 12,375 32.4 14.0 16.0 18.6 81.1 California – Region 1 6,478 2,806 5,988 1,392 16,664 42.5 18.4 39.2 9.1 109.2 California – Region 2 6,478 2,806 5,604 1,500 16,388 42.5 18.4 36.7 9.8 107.4 Colorado 3 4,942 2,141 2,064 2,964 12,111 32.4 14.0 13.5 19.4 79.4 Connecticut 6,622 2,868 7,632 852 17,974 43.4 18.8 50.0 5.6 117.8 Delaware 5,902 2,556 2,976 2,436 13,870 38.7 16.7 19.5 16.0 90.9 District of Columbia 3 5,902 2,556 3,048 2,424 13,930 38.7 16.7 20.0 15.9 91.3 Florida 4,942 2,141 2,160 2,940 12,183 32.4 14.0 14.2 19.3 79.8 Georgia 4,942 2,141 816 3,336 11,235 32.4 14.0 5.3 21.9 73.6 Hawaii 5,998 2,598 5,040 4,284 17,920 34.2 14.8 28.7 24.4 102.1 Idaho 4,942 2,141 1,452 3,144 11,679 32.4 14.0 9.5 20.6 76.5 Illinois 3 4,942 2,141 2,964 2,700 12,747 32.4 14.0 19.4 17.7 83.5 Indiana 3 4,942 2,141 2,112 2,952 12,147 32.4 14.0 13.8 19.3 79.6 Iowa 3 4,942 2,141 2,964 2,700 12,747 32.4 14.0 19.4 17.7 83.5 Kansas 3 4,942 2,141 2,580 2,808 12,471 32.4 14.0 16.9 18.4 81.7 Kentucky 4,942 2,141 1,320 3,192 11,595 32.4 14.0 8.7 20.9 76.0 Louisiana 4,942 2,141 0 3,588 10,671 32.4 14.0 0.0 23.5 69.9 Maine 3 5,998 2,598 4,836 1,860 15,292 39.3 17.0 31.7 12.2 100.2
7-45
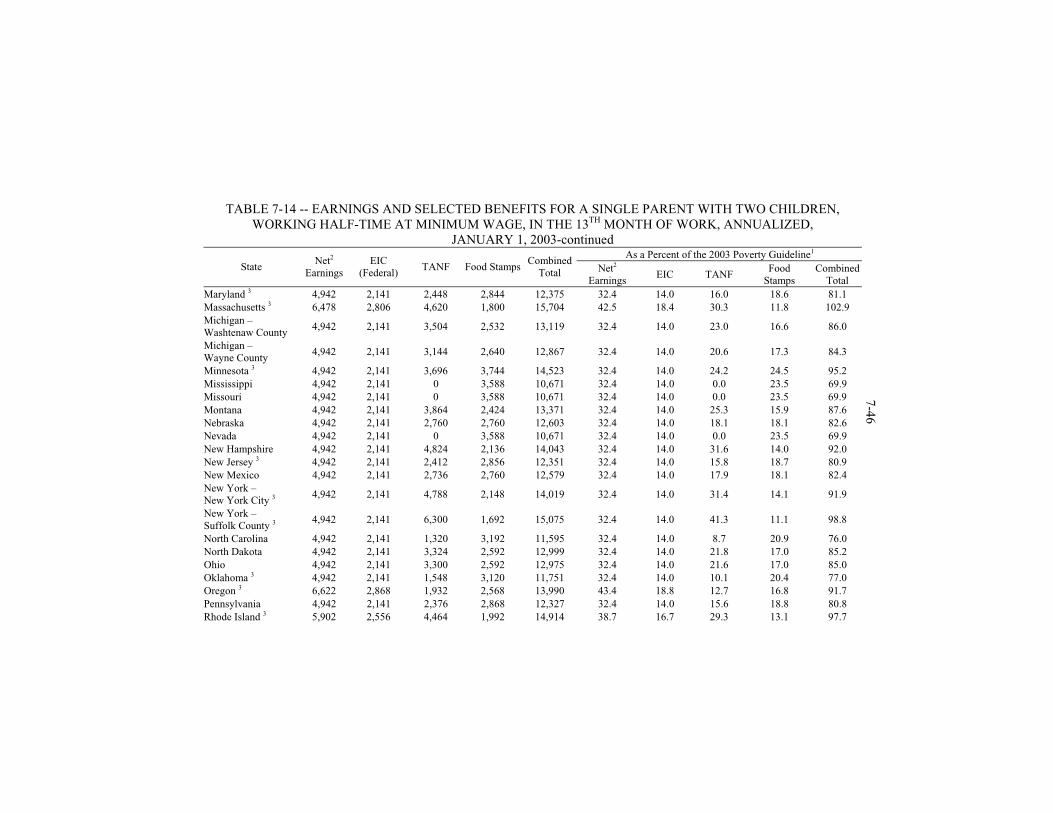
TABLE 7-14 -- EARNINGS AND SELECTED BENEFITS FOR A SINGLE PARENT WITH TWO CHILDREN, WORKING HALF-TIME AT MINIMUM WAGE, IN THE 13TH MONTH OF WORK, ANNUALIZED,
JANUARY 1, 2003-continued As a Percent of the 2003 Poverty Guideline1
State Net2
Earnings EIC
(Federal) TANF Food Stamps
Combined Total Net2
Earnings EIC TANF
Food Stamps
Combined Total
Maryland 3 4,942 2,141 2,448 2,844 12,375 32.4 14.0 16.0 18.6 81.1 Massachusetts 3 6,478 2,806 4,620 1,800 15,704 42.5 18.4 30.3 11.8 102.9 Michigan –Washtenaw County
4,942 2,141 3,504 2,532 13,119 32.4 14.0 23.0 16.6 86.0
Michigan – Wayne County
4,942 2,141 3,144 2,640 12,867 32.4 14.0 20.6 17.3 84.3
Minnesota 3 4,942 2,141 3,696 3,744 14,523 32.4 14.0 24.2 24.5 95.2 Mississippi 4,942 2,141 0 3,588 10,671 32.4 14.0 0.0 23.5 69.9 Missouri 4,942 2,141 0 3,588 10,671 32.4 14.0 0.0 23.5 69.9 Montana 4,942 2,141 3,864 2,424 13,371 32.4 14.0 25.3 15.9 87.6 Nebraska 4,942 2,141 2,760 2,760 12,603 32.4 14.0 18.1 18.1 82.6 Nevada 4,942 2,141 0 3,588 10,671 32.4 14.0 0.0 23.5 69.9 New Hampshire 4,942 2,141 4,824 2,136 14,043 32.4 14.0 31.6 14.0 92.0 New Jersey 3 4,942 2,141 2,412 2,856 12,351 32.4 14.0 15.8 18.7 80.9 New Mexico 4,942 2,141 2,736 2,760 12,579 32.4 14.0 17.9 18.1 82.4 New York – New York City 3
4,942 2,141 4,788 2,148 14,019 32.4 14.0 31.4 14.1 91.9
New York – Suffolk County 3
4,942 2,141 6,300 1,692 15,075 32.4 14.0 41.3 11.1 98.8
North Carolina 4,942 2,141 1,320 3,192 11,595 32.4 14.0 8.7 20.9 76.0 North Dakota 4,942 2,141 3,324 2,592 12,999 32.4 14.0 21.8 17.0 85.2 Ohio 4,942 2,141 3,300 2,592 12,975 32.4 14.0 21.6 17.0 85.0 Oklahoma 3 4,942 2,141 1,548 3,120 11,751 32.4 14.0 10.1 20.4 77.0 Oregon 3 6,622 2,868 1,932 2,568 13,990 43.4 18.8 12.7 16.8 91.7 Pennsylvania 4,942 2,141 2,376 2,868 12,327 32.4 14.0 15.6 18.8 80.8 Rhode Island 3 5,902 2,556 4,464 1,992 14,914 38.7 16.7 29.3 13.1 97.7
7-46
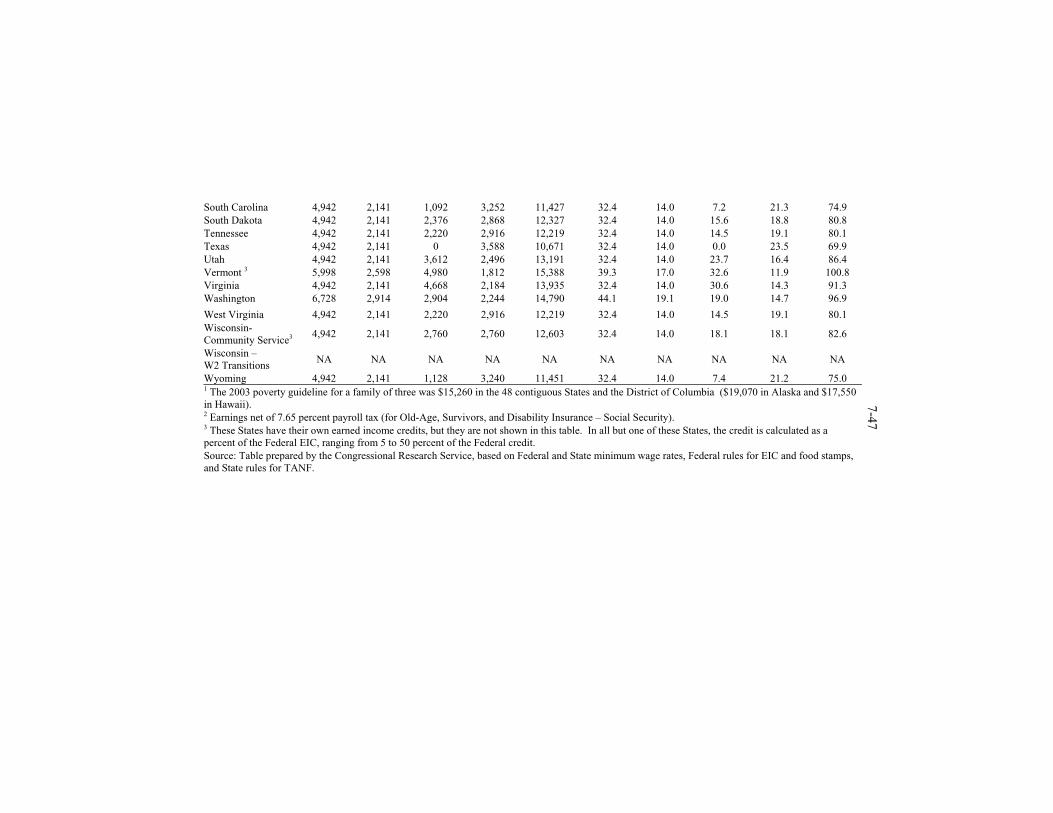
South Carolina 4,942 2,141 1,092 3,252 11,427 32.4 14.0 7.2 21.3 74.9 South Dakota 4,942 2,141 2,376 2,868 12,327 32.4 14.0 15.6 18.8 80.8 Tennessee 4,942 2,141 2,220 2,916 12,219 32.4 14.0 14.5 19.1 80.1 Texas 4,942 2,141 0 3,588 10,671 32.4 14.0 0.0 23.5 69.9 Utah 4,942 2,141 3,612 2,496 13,191 32.4 14.0 23.7 16.4 86.4 Vermont 3 5,998 2,598 4,980 1,812 15,388 39.3 17.0 32.6 11.9 100.8 Virginia 4,942 2,141 4,668 2,184 13,935 32.4 14.0 30.6 14.3 91.3 Washington 6,728 2,914 2,904 2,244 14,790 44.1 19.1 19.0 14.7 96.9
West Virginia 4,942 2,141 2,220 2,916 12,219 32.4 14.0 14.5 19.1 80.1 Wisconsin- Community Service3
4,942 2,141 2,760 2,760 12,603 32.4 14.0 18.1 18.1 82.6
Wisconsin – W2 Transitions
NA NA NA NA NA NA NA NA NA NA
Wyoming 4,942 2,141 1,128 3,240 11,451 32.4 14.0 7.4 21.2 75.0 1 The 2003 poverty guideline for a family of three was $15,260 in the 48 contiguous States and the District of Columbia ($19,070 in Alaska and $17,550 in Hawaii). 2 Earnings net of 7.65 percent payroll tax (for Old-Age, Survivors, and Disability Insurance – Social Security). 3 These States have their own earned income credits, but they are not shown in this table. In all but one of these States, the credit is calculated as a percent of the Federal EIC, ranging from 5 to 50 percent of the Federal credit. Source: Table prepared by the Congressional Research Service, based on Federal and State minimum wage rates, Federal rules for EIC and food stamps, and State rules for TANF.
7-47
7-48 Table 7-15 presents the same data for a full-time year round- minimum wage
worker. As it shows, workers in 34 States would be ineligible for TANF in the 13th month of a full-time minimum wage job. In all States the combination of net earnings plus benefits exceeds the poverty guideline for the full-time minimum wage worker (single parent) with 2 children.
PHASE-OUT LEVELS
The earnings limits for continued TANF eligibility (TANF phase-out points) depend on a State’s payment standard, its treatment of earnings, and duration on a job. Table 7-16 presents January 1, 2003 phase-out points for a family of three during the first 13 months in a job. Alabama, Nevada, and North Carolina ignore all earnings for the first four months of employment. Connecticut ignores all earnings so long as they are below the Federal poverty guideline (and the family has not reached the State’s 21 month benefit cutoff). Some States retain old AFDC policy and count a higher proportion of earnings against the benefit after 4 months on a job, and still more after 1 year of work (Georgia is an example).
HOW STATES USE TANF FUNDS Through fiscal year 2001, States spent $61.7 billion out of $81 billion in
cumulative TANF awards for fiscal years 1997, 1998, 1999, 2000, and 2001 (Table 7-17). They also transferred $12.7 billion to the Child Care and Development Fund (CCDF) and the Social Services Block Grant (SSBG), which may or may not have been expended via those accounts. Finally, unexpended funds remaining in TANF totaled $6.5 billion at the end of FY2001, including $2.6 billion that was unobligated. Over the 5-year period expenditures represented 76.3 percent of total awards; transfers which may not all have been spent, 15.7 percent; unliquidated obligations (that is, obligated balances), 4.9 percent, and unobligated balances, 3.2 percent. The pattern of fund use varied widely among States: 5 States spent less than 60 percent of their fiscal year 1997-2001 TANF funds (Alabama, Louisiana, Mississippi, Oklahoma, and Wyoming); New Hampshire reported no transfer of TANF funds, and 17 States transferred more than 20 percent of funds (Alabama, Alaska, Florida, Idaho, Indiana, Kentucky, Louisiana, Maryland, Massachusetts, Mississippi, New Jersey, Oklahoma Tennessee, Vermont, Virginia, Washington, and Wisconsin).
Compared with the 1997-2001 period, States in fiscal year 2002 spent a smaller share of TANF awards, but obligated and transferred larger shares. DHHS reports that States spent 59 percent of the $17 billion in TANF funds awarded that year, transferred 18 percent (12 percent to CCDF and 6 percent to SSBG), and obligated 17 percent. Expenditures from FY2002 funds totaled $10 billion: $3.3 billion on assistance (chiefly ongoing basic cash aid), and $6.7 billion on “non-assistance” (chiefly work-related activities, supportive services, and administration).
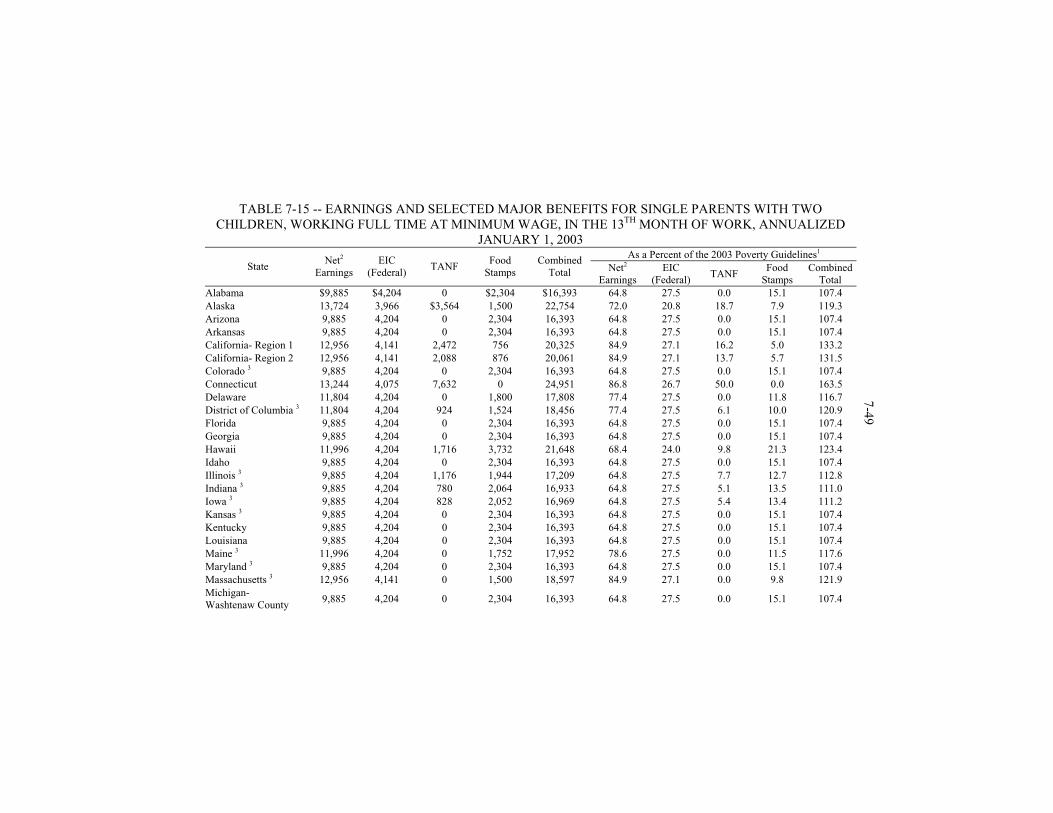
TABLE 7-15 -- EARNINGS AND SELECTED MAJOR BENEFITS FOR SINGLE PARENTS WITH TWO CHILDREN, WORKING FULL TIME AT MINIMUM WAGE, IN THE 13TH MONTH OF WORK, ANNUALIZED
JANUARY 1, 2003 As a Percent of the 2003 Poverty Guidelines1
State Net2
EarningsEIC
(Federal) TANF
Food Stamps
Combined Total Net2
Earnings EIC
(Federal) TANF
Food Stamps
Combined Total
Alabama $9,885 $4,204 0 $2,304 $16,393 64.8 27.5 0.0 15.1 107.4 Alaska 13,724 3,966 $3,564 1,500 22,754 72.0 20.8 18.7 7.9 119.3 Arizona 9,885 4,204 0 2,304 16,393 64.8 27.5 0.0 15.1 107.4 Arkansas 9,885 4,204 0 2,304 16,393 64.8 27.5 0.0 15.1 107.4 California- Region 1 12,956 4,141 2,472 756 20,325 84.9 27.1 16.2 5.0 133.2 California- Region 2 12,956 4,141 2,088 876 20,061 84.9 27.1 13.7 5.7 131.5 Colorado 3 9,885 4,204 0 2,304 16,393 64.8 27.5 0.0 15.1 107.4 Connecticut 13,244 4,075 7,632 0 24,951 86.8 26.7 50.0 0.0 163.5 Delaware 11,804 4,204 0 1,800 17,808 77.4 27.5 0.0 11.8 116.7 District of Columbia 3 11,804 4,204 924 1,524 18,456 77.4 27.5 6.1 10.0 120.9 Florida 9,885 4,204 0 2,304 16,393 64.8 27.5 0.0 15.1 107.4 Georgia 9,885 4,204 0 2,304 16,393 64.8 27.5 0.0 15.1 107.4 Hawaii 11,996 4,204 1,716 3,732 21,648 68.4 24.0 9.8 21.3 123.4 Idaho 9,885 4,204 0 2,304 16,393 64.8 27.5 0.0 15.1 107.4 Illinois 3 9,885 4,204 1,176 1,944 17,209 64.8 27.5 7.7 12.7 112.8 Indiana 3 9,885 4,204 780 2,064 16,933 64.8 27.5 5.1 13.5 111.0 Iowa 3 9,885 4,204 828 2,052 16,969 64.8 27.5 5.4 13.4 111.2 Kansas 3 9,885 4,204 0 2,304 16,393 64.8 27.5 0.0 15.1 107.4 Kentucky 9,885 4,204 0 2,304 16,393 64.8 27.5 0.0 15.1 107.4 Louisiana 9,885 4,204 0 2,304 16,393 64.8 27.5 0.0 15.1 107.4 Maine 3 11,996 4,204 0 1,752 17,952 78.6 27.5 0.0 11.5 117.6 Maryland 3 9,885 4,204 0 2,304 16,393 64.8 27.5 0.0 15.1 107.4 Massachusetts 3 12,956 4,141 0 1,500 18,597 84.9 27.1 0.0 9.8 121.9 Michigan- Washtenaw County
9,885 4,204 0 2,304 16,393 64.8 27.5 0.0 15.1 107.4
7-49
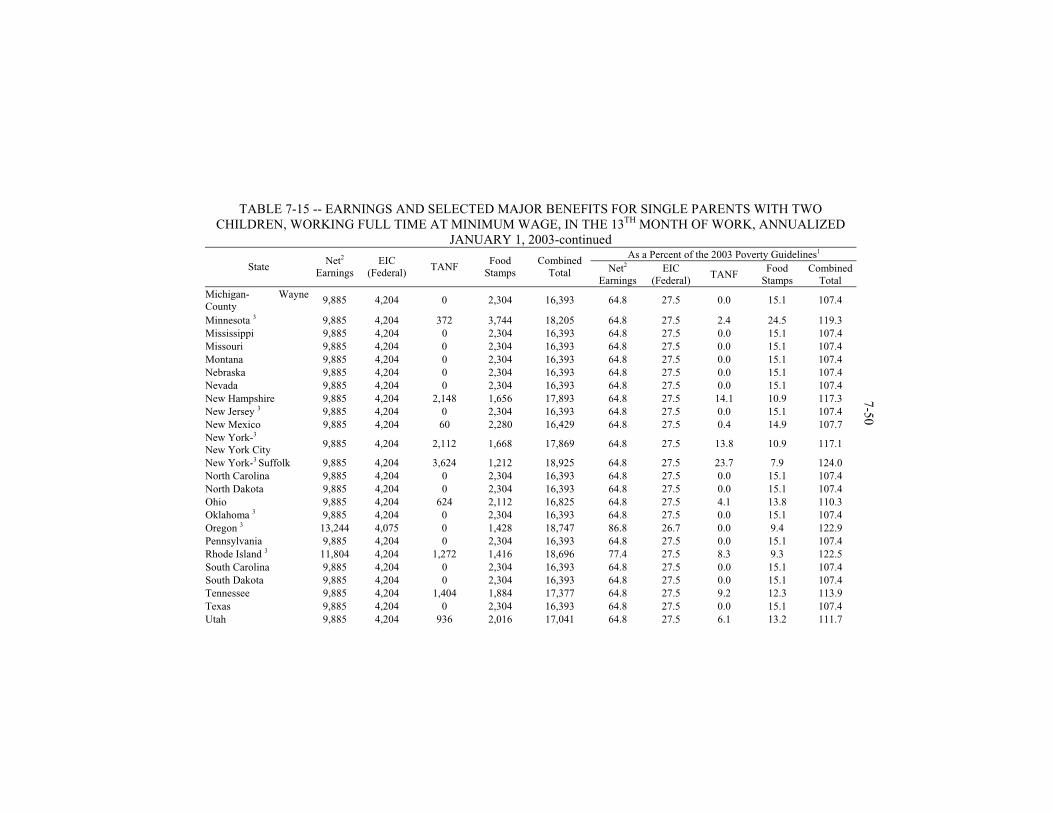
TABLE 7-15 -- EARNINGS AND SELECTED MAJOR BENEFITS FOR SINGLE PARENTS WITH TWO CHILDREN, WORKING FULL TIME AT MINIMUM WAGE, IN THE 13TH MONTH OF WORK, ANNUALIZED
JANUARY 1, 2003-continued As a Percent of the 2003 Poverty Guidelines1
State Net2
EarningsEIC
(Federal) TANF
Food Stamps
Combined Total Net2
Earnings EIC
(Federal) TANF
Food Stamps
Combined Total
Michigan- Wayne County
9,885 4,204 0 2,304 16,393 64.8 27.5 0.0 15.1 107.4
Minnesota 3 9,885 4,204 372 3,744 18,205 64.8 27.5 2.4 24.5 119.3 Mississippi 9,885 4,204 0 2,304 16,393 64.8 27.5 0.0 15.1 107.4 Missouri 9,885 4,204 0 2,304 16,393 64.8 27.5 0.0 15.1 107.4 Montana 9,885 4,204 0 2,304 16,393 64.8 27.5 0.0 15.1 107.4 Nebraska 9,885 4,204 0 2,304 16,393 64.8 27.5 0.0 15.1 107.4 Nevada 9,885 4,204 0 2,304 16,393 64.8 27.5 0.0 15.1 107.4 New Hampshire 9,885 4,204 2,148 1,656 17,893 64.8 27.5 14.1 10.9 117.3 New Jersey 3 9,885 4,204 0 2,304 16,393 64.8 27.5 0.0 15.1 107.4 New Mexico 9,885 4,204 60 2,280 16,429 64.8 27.5 0.4 14.9 107.7 New York-3
New York City 9,885 4,204 2,112 1,668 17,869 64.8 27.5 13.8 10.9 117.1
New York-3 Suffolk 9,885 4,204 3,624 1,212 18,925 64.8 27.5 23.7 7.9 124.0 North Carolina 9,885 4,204 0 2,304 16,393 64.8 27.5 0.0 15.1 107.4 North Dakota 9,885 4,204 0 2,304 16,393 64.8 27.5 0.0 15.1 107.4 Ohio 9,885 4,204 624 2,112 16,825 64.8 27.5 4.1 13.8 110.3 Oklahoma 3 9,885 4,204 0 2,304 16,393 64.8 27.5 0.0 15.1 107.4 Oregon 3 13,244 4,075 0 1,428 18,747 86.8 26.7 0.0 9.4 122.9 Pennsylvania 9,885 4,204 0 2,304 16,393 64.8 27.5 0.0 15.1 107.4 Rhode Island 3 11,804 4,204 1,272 1,416 18,696 77.4 27.5 8.3 9.3 122.5 South Carolina 9,885 4,204 0 2,304 16,393 64.8 27.5 0.0 15.1 107.4 South Dakota 9,885 4,204 0 2,304 16,393 64.8 27.5 0.0 15.1 107.4 Tennessee 9,885 4,204 1,404 1,884 17,377 64.8 27.5 9.2 12.3 113.9 Texas 9,885 4,204 0 2,304 16,393 64.8 27.5 0.0 15.1 107.4 Utah 9,885 4,204 936 2,016 17,041 64.8 27.5 6.1 13.2 111.7
7-50
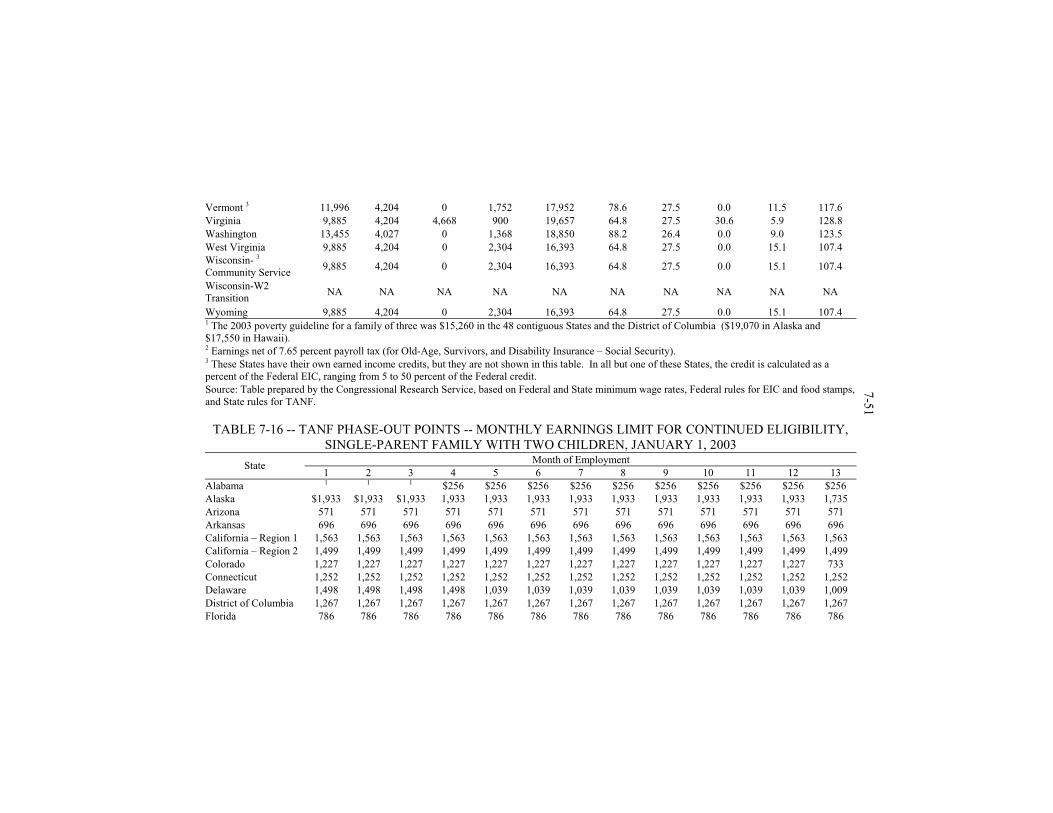
Vermont 3 11,996 4,204 0 1,752 17,952 78.6 27.5 0.0 11.5 117.6 Virginia 9,885 4,204 4,668 900 19,657 64.8 27.5 30.6 5.9 128.8 Washington 13,455 4,027 0 1,368 18,850 88.2 26.4 0.0 9.0 123.5 West Virginia 9,885 4,204 0 2,304 16,393 64.8 27.5 0.0 15.1 107.4
Wisconsin- 3
Community Service 9,885 4,204 0 2,304 16,393 64.8 27.5 0.0 15.1 107.4
Wisconsin-W2 Transition
NA NA NA NA NA NA NA NA NA NA
Wyoming 9,885 4,204 0 2,304 16,393 64.8 27.5 0.0 15.1 107.4 1 The 2003 poverty guideline for a family of three was $15,260 in the 48 contiguous States and the District of Columbia ($19,070 in Alaska and $17,550 in Hawaii). 2 Earnings net of 7.65 percent payroll tax (for Old-Age, Survivors, and Disability Insurance – Social Security). 3 These States have their own earned income credits, but they are not shown in this table. In all but one of these States, the credit is calculated as a percent of the Federal EIC, ranging from 5 to 50 percent of the Federal credit. Source: Table prepared by the Congressional Research Service, based on Federal and State minimum wage rates, Federal rules for EIC and food stamps, and State rules for TANF.
TABLE 7-16 -- TANF PHASE-OUT POINTS -- MONTHLY EARNINGS LIMIT FOR CONTINUED ELIGIBILITY, SINGLE-PARENT FAMILY WITH TWO CHILDREN, JANUARY 1, 2003
Month of Employment State 1 2 3 4 5 6 7 8 9 10 11 12 13
Alabama 1 1 1 $256 $256 $256 $256 $256 $256 $256 $256 $256 $256 Alaska $1,933 $1,933 $1,933 1,933 1,933 1,933 1,933 1,933 1,933 1,933 1,933 1,933 1,735 Arizona 571 571 571 571 571 571 571 571 571 571 571 571 571 Arkansas 696 696 696 696 696 696 696 696 696 696 696 696 696 California – Region 1 1,563 1,563 1,563 1,563 1,563 1,563 1,563 1,563 1,563 1,563 1,563 1,563 1,563 California – Region 2 1,499 1,499 1,499 1,499 1,499 1,499 1,499 1,499 1,499 1,499 1,499 1,499 1,499 Colorado 1,227 1,227 1,227 1,227 1,227 1,227 1,227 1,227 1,227 1,227 1,227 1,227 733 Connecticut 1,252 1,252 1,252 1,252 1,252 1,252 1,252 1,252 1,252 1,252 1,252 1,252 1,252 Delaware 1,498 1,498 1,498 1,498 1,039 1,039 1,039 1,039 1,039 1,039 1,039 1,039 1,009 District of Columbia 1,267 1,267 1,267 1,267 1,267 1,267 1,267 1,267 1,267 1,267 1,267 1,267 1,267 Florida 786 786 786 786 786 786 786 786 786 786 786 786 786
7-51
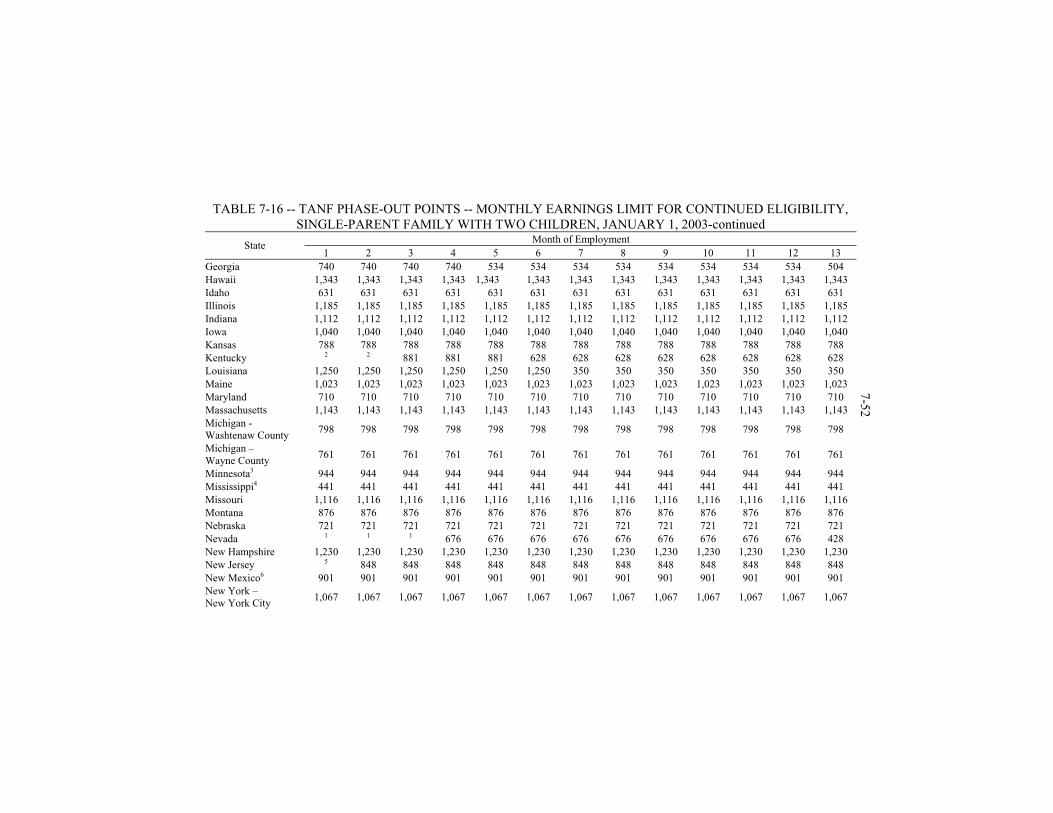
TABLE 7-16 -- TANF PHASE-OUT POINTS -- MONTHLY EARNINGS LIMIT FOR CONTINUED ELIGIBILITY, SINGLE-PARENT FAMILY WITH TWO CHILDREN, JANUARY 1, 2003-continued
Month of Employment State
1 2 3 4 5 6 7 8 9 10 11 12 13 Georgia 740 740 740 740 534 534 534 534 534 534 534 534 504 Hawaii 1,343 1,343 1,343 1,343 1,343 1,343 1,343 1,343 1,343 1,343 1,343 1,343 1,343 Idaho 631 631 631 631 631 631 631 631 631 631 631 631 631 Illinois 1,185 1,185 1,185 1,185 1,185 1,185 1,185 1,185 1,185 1,185 1,185 1,185 1,185 Indiana 1,112 1,112 1,112 1,112 1,112 1,112 1,112 1,112 1,112 1,112 1,112 1,112 1,112 Iowa 1,040 1,040 1,040 1,040 1,040 1,040 1,040 1,040 1,040 1,040 1,040 1,040 1,040 Kansas 788 788 788 788 788 788 788 788 788 788 788 788 788 Kentucky 2 2 881 881 881 628 628 628 628 628 628 628 628 Louisiana 1,250 1,250 1,250 1,250 1,250 1,250 350 350 350 350 350 350 350 Maine 1,023 1,023 1,023 1,023 1,023 1,023 1,023 1,023 1,023 1,023 1,023 1,023 1,023 Maryland 710 710 710 710 710 710 710 710 710 710 710 710 710 Massachusetts 1,143 1,143 1,143 1,143 1,143 1,143 1,143 1,143 1,143 1,143 1,143 1,143 1,143 Michigan - Washtenaw County
798 798 798 798 798 798 798 798 798 798 798 798 798
Michigan – Wayne County
761 761 761 761 761 761 761 761 761 761 761 761 761
Minnesota3 944 944 944 944 944 944 944 944 944 944 944 944 944 Mississippi4 441 441 441 441 441 441 441 441 441 441 441 441 441 Missouri 1,116 1,116 1,116 1,116 1,116 1,116 1,116 1,116 1,116 1,116 1,116 1,116 1,116 Montana 876 876 876 876 876 876 876 876 876 876 876 876 876 Nebraska 721 721 721 721 721 721 721 721 721 721 721 721 721 Nevada 1 1 1 676 676 676 676 676 676 676 676 676 428 New Hampshire 1,230 1,230 1,230 1,230 1,230 1,230 1,230 1,230 1,230 1,230 1,230 1,230 1,230 New Jersey 5 848 848 848 848 848 848 848 848 848 848 848 848 New Mexico6 901 901 901 901 901 901 901 901 901 901 901 901 901 New York – New York City
1,067 1,067 1,067 1,067 1,067 1,067 1,067 1,067 1,067 1,067 1,067 1,067 1,067
7-52
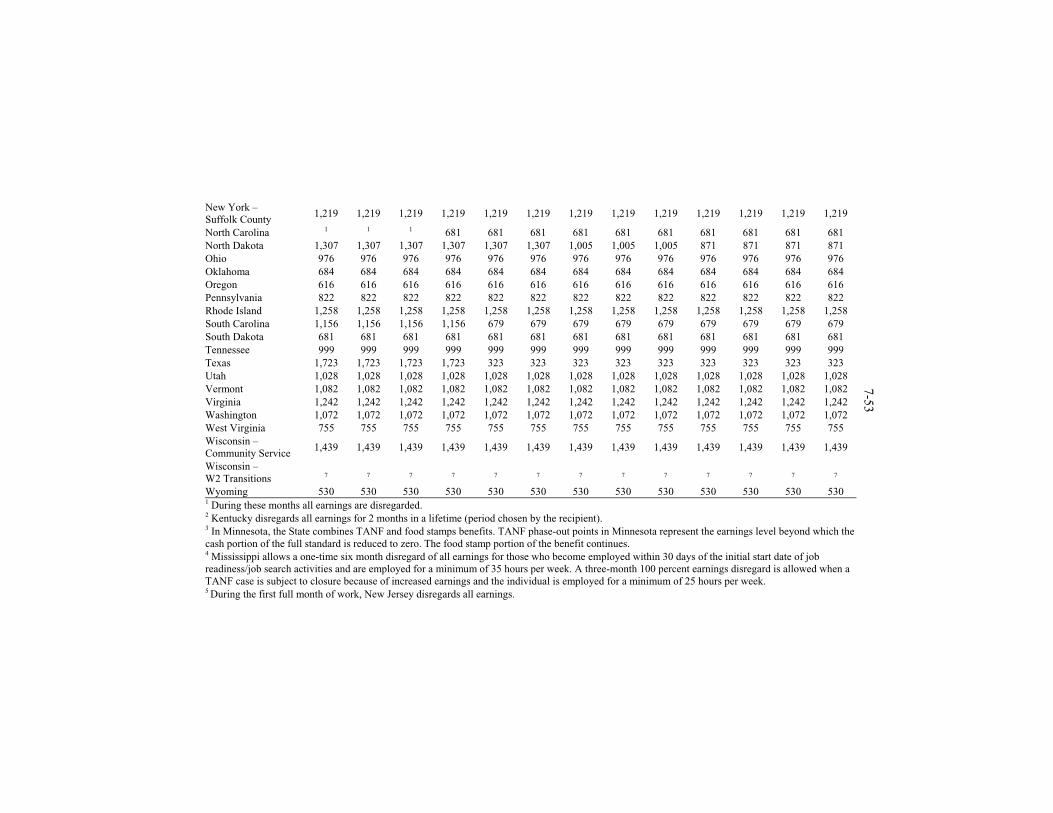
New York – Suffolk County
1,219 1,219 1,219 1,219 1,219 1,219 1,219 1,219 1,219 1,219 1,219 1,219 1,219
North Carolina 1 1 1 681 681 681 681 681 681 681 681 681 681 North Dakota 1,307 1,307 1,307 1,307 1,307 1,307 1,005 1,005 1,005 871 871 871 871 Ohio 976 976 976 976 976 976 976 976 976 976 976 976 976 Oklahoma 684 684 684 684 684 684 684 684 684 684 684 684 684 Oregon 616 616 616 616 616 616 616 616 616 616 616 616 616 Pennsylvania 822 822 822 822 822 822 822 822 822 822 822 822 822 Rhode Island 1,258 1,258 1,258 1,258 1,258 1,258 1,258 1,258 1,258 1,258 1,258 1,258 1,258 South Carolina 1,156 1,156 1,156 1,156 679 679 679 679 679 679 679 679 679 South Dakota 681 681 681 681 681 681 681 681 681 681 681 681 681 Tennessee 999 999 999 999 999 999 999 999 999 999 999 999 999 Texas 1,723 1,723 1,723 1,723 323 323 323 323 323 323 323 323 323 Utah 1,028 1,028 1,028 1,028 1,028 1,028 1,028 1,028 1,028 1,028 1,028 1,028 1,028 Vermont 1,082 1,082 1,082 1,082 1,082 1,082 1,082 1,082 1,082 1,082 1,082 1,082 1,082 Virginia 1,242 1,242 1,242 1,242 1,242 1,242 1,242 1,242 1,242 1,242 1,242 1,242 1,242 Washington 1,072 1,072 1,072 1,072 1,072 1,072 1,072 1,072 1,072 1,072 1,072 1,072 1,072 West Virginia 755 755 755 755 755 755 755 755 755 755 755 755 755 Wisconsin – Community Service
1,439 1,439 1,439 1,439 1,439 1,439 1,439 1,439 1,439 1,439 1,439 1,439 1,439
Wisconsin – W2 Transitions 7 7 7 7 7 7 7 7 7 7 7 7 7 Wyoming 530 530 530 530 530 530 530 530 530 530 530 530 530 1 During these months all earnings are disregarded. 2 Kentucky disregards all earnings for 2 months in a lifetime (period chosen by the recipient). 3 In Minnesota, the State combines TANF and food stamps benefits. TANF phase-out points in Minnesota represent the earnings level beyond which the cash portion of the full standard is reduced to zero. The food stamp portion of the benefit continues. 4 Mississippi allows a one-time six month disregard of all earnings for those who become employed within 30 days of the initial start date of job readiness/job search activities and are employed for a minimum of 35 hours per week. A three-month 100 percent earnings disregard is allowed when a TANF case is subject to closure because of increased earnings and the individual is employed for a minimum of 25 hours per week. 5 During the first full month of work, New Jersey disregards all earnings.
7-53
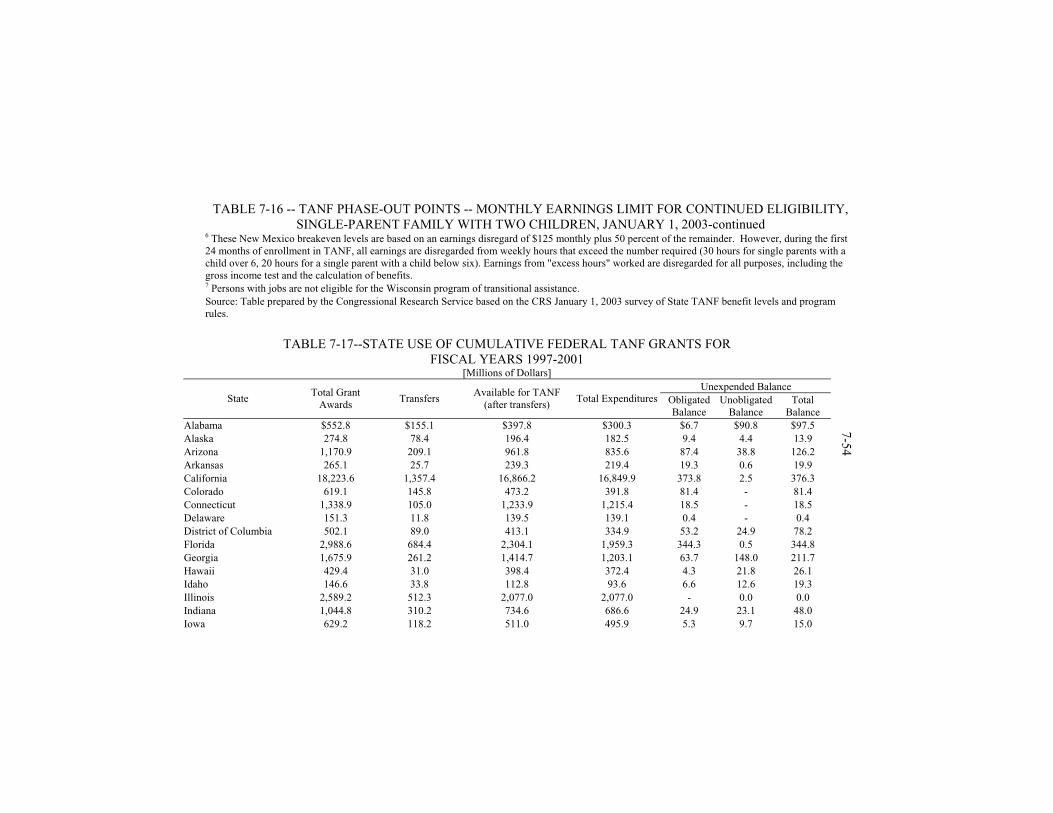
TABLE 7-16 -- TANF PHASE-OUT POINTS -- MONTHLY EARNINGS LIMIT FOR CONTINUED ELIGIBILITY, SINGLE-PARENT FAMILY WITH TWO CHILDREN, JANUARY 1, 2003-continued
6 These New Mexico breakeven levels are based on an earnings disregard of $125 monthly plus 50 percent of the remainder. However, during the first 24 months of enrollment in TANF, all earnings are disregarded from weekly hours that exceed the number required (30 hours for single parents with a child over 6, 20 hours for a single parent with a child below six). Earnings from "excess hours" worked are disregarded for all purposes, including the gross income test and the calculation of benefits. 7 Persons with jobs are not eligible for the Wisconsin program of transitional assistance. Source: Table prepared by the Congressional Research Service based on the CRS January 1, 2003 survey of State TANF benefit levels and program rules.
TABLE 7-17--STATE USE OF CUMULATIVE FEDERAL TANF GRANTS FOR
FISCAL YEARS 1997-2001 [Millions of Dollars]
Unexpended Balance State
Total Grant Awards
Transfers Available for TANF
(after transfers) Total Expenditures Obligated
Balance Unobligated
Balance Total
Balance Alabama $552.8 $155.1 $397.8 $300.3 $6.7 $90.8 $97.5 Alaska 274.8 78.4 196.4 182.5 9.4 4.4 13.9 Arizona 1,170.9 209.1 961.8 835.6 87.4 38.8 126.2 Arkansas 265.1 25.7 239.3 219.4 19.3 0.6 19.9 California 18,223.6 1,357.4 16,866.2 16,849.9 373.8 2.5 376.3 Colorado 619.1 145.8 473.2 391.8 81.4 - 81.4 Connecticut 1,338.9 105.0 1,233.9 1,215.4 18.5 - 18.5 Delaware 151.3 11.8 139.5 139.1 0.4 - 0.4 District of Columbia 502.1 89.0 413.1 334.9 53.2 24.9 78.2 Florida 2,988.6 684.4 2,304.1 1,959.3 344.3 0.5 344.8 Georgia 1,675.9 261.2 1,414.7 1,203.1 63.7 148.0 211.7 Hawaii 429.4 31.0 398.4 372.4 4.3 21.8 26.1 Idaho 146.6 33.8 112.8 93.6 6.6 12.6 19.3 Illinois 2,589.2 512.3 2,077.0 2,077.0 - 0.0 0.0 Indiana 1,044.8 310.2 734.6 686.6 24.9 23.1 48.0 Iowa 629.2 118.2 511.0 495.9 5.3 9.7 15.0
7-54
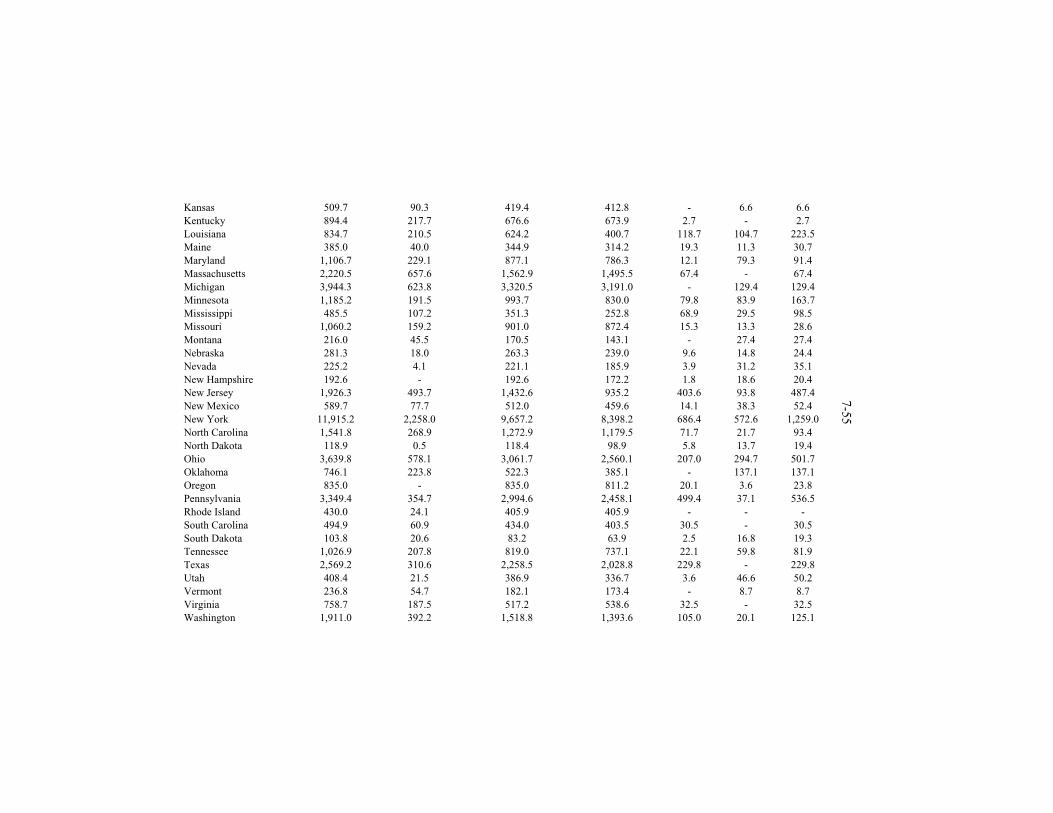
Kansas 509.7 90.3 419.4 412.8 - 6.6 6.6 Kentucky 894.4 217.7 676.6 673.9 2.7 - 2.7 Louisiana 834.7 210.5 624.2 400.7 118.7 104.7 223.5 Maine 385.0 40.0 344.9 314.2 19.3 11.3 30.7 Maryland 1,106.7 229.1 877.1 786.3 12.1 79.3 91.4 Massachusetts 2,220.5 657.6 1,562.9 1,495.5 67.4 - 67.4 Michigan 3,944.3 623.8 3,320.5 3,191.0 - 129.4 129.4 Minnesota 1,185.2 191.5 993.7 830.0 79.8 83.9 163.7 Mississippi 485.5 107.2 351.3 252.8 68.9 29.5 98.5 Missouri 1,060.2 159.2 901.0 872.4 15.3 13.3 28.6 Montana 216.0 45.5 170.5 143.1 - 27.4 27.4 Nebraska 281.3 18.0 263.3 239.0 9.6 14.8 24.4 Nevada 225.2 4.1 221.1 185.9 3.9 31.2 35.1 New Hampshire 192.6 - 192.6 172.2 1.8 18.6 20.4 New Jersey 1,926.3 493.7 1,432.6 935.2 403.6 93.8 487.4 New Mexico 589.7 77.7 512.0 459.6 14.1 38.3 52.4 New York 11,915.2 2,258.0 9,657.2 8,398.2 686.4 572.6 1,259.0 North Carolina 1,541.8 268.9 1,272.9 1,179.5 71.7 21.7 93.4 North Dakota 118.9 0.5 118.4 98.9 5.8 13.7 19.4 Ohio 3,639.8 578.1 3,061.7 2,560.1 207.0 294.7 501.7 Oklahoma 746.1 223.8 522.3 385.1 - 137.1 137.1 Oregon 835.0 - 835.0 811.2 20.1 3.6 23.8 Pennsylvania 3,349.4 354.7 2,994.6 2,458.1 499.4 37.1 536.5 Rhode Island 430.0 24.1 405.9 405.9 - - - South Carolina 494.9 60.9 434.0 403.5 30.5 - 30.5 South Dakota 103.8 20.6 83.2 63.9 2.5 16.8 19.3 Tennessee 1,026.9 207.8 819.0 737.1 22.1 59.8 81.9 Texas 2,569.2 310.6 2,258.5 2,028.8 229.8 - 229.8 Utah 408.4 21.5 386.9 336.7 3.6 46.6 50.2 Vermont 236.8 54.7 182.1 173.4 - 8.7 8.7 Virginia 758.7 187.5 517.2 538.6 32.5 - 32.5 Washington 1,911.0 392.2 1,518.8 1,393.6 105.0 20.1 125.1
7-55
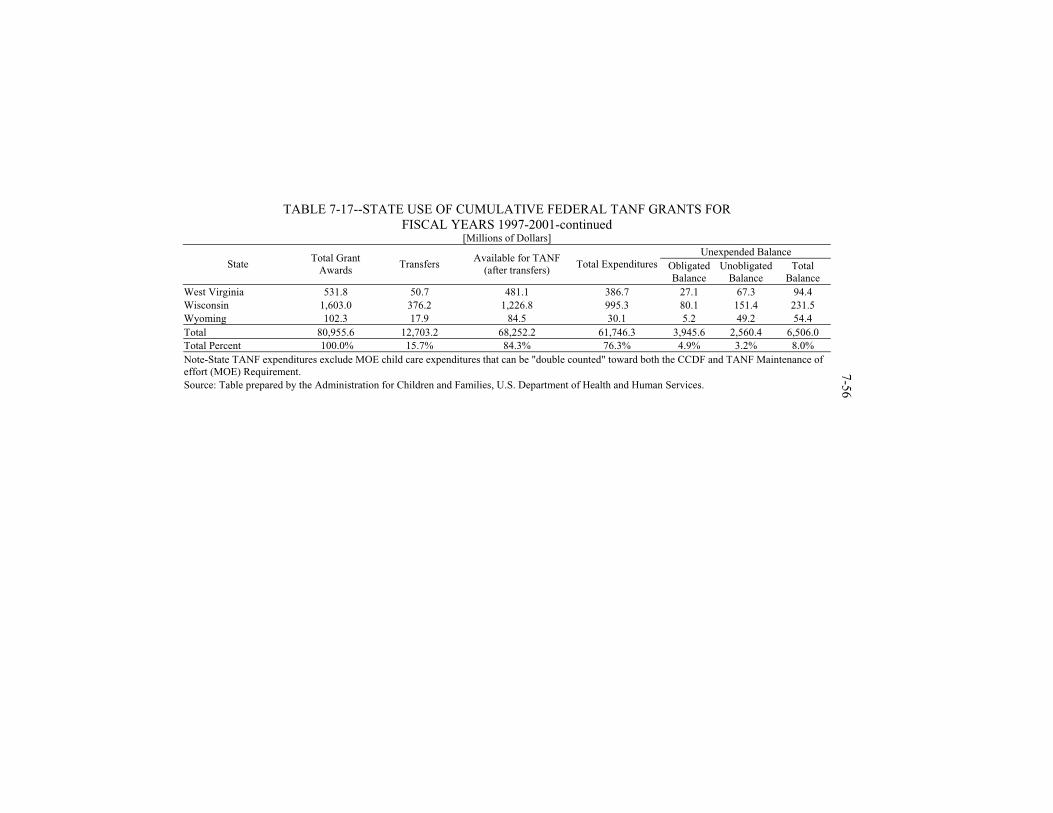
TABLE 7-17--STATE USE OF CUMULATIVE FEDERAL TANF GRANTS FOR FISCAL YEARS 1997-2001-continued
[Millions of Dollars] Unexpended Balance
State Total Grant
Awards Transfers
Available for TANF (after transfers)
Total Expenditures Obligated Balance
Unobligated Balance
Total Balance
West Virginia 531.8 50.7 481.1 386.7 27.1 67.3 94.4 Wisconsin 1,603.0 376.2 1,226.8 995.3 80.1 151.4 231.5 Wyoming 102.3 17.9 84.5 30.1 5.2 49.2 54.4 Total 80,955.6 12,703.2 68,252.2 61,746.3 3,945.6 2,560.4 6,506.0 Total Percent 100.0% 15.7% 84.3% 76.3% 4.9% 3.2% 8.0% Note-State TANF expenditures exclude MOE child care expenditures that can be "double counted" toward both the CCDF and TANF Maintenance of effort (MOE) Requirement. Source: Table prepared by the Administration for Children and Families, U.S. Department of Health and Human Services.
7-56
7-57 TIME LIMITS
The law forbids States to use Federal TANF funds for ongoing basic aid to a family with an adult member who already has received 60 months of Federally funded assistance. The five-year time limit is intended to signal that the program offers temporary aid. However, the law permits States to extend federally funded benefits on hardship grounds to some families who reach the time limit (the number of extensions can equal 20 percent of the average monthly caseload). Moreover, the Federal time limit does not apply to benefits paid by State funds. Nine States accounting for about 40 percent of all TANF families effectively suspend the Federal limit by using their own funds, rather than Federal dollars, to continue benefits for “timed-out” families. In addition, some States “stop” the Federal time clock by using State funds to pay benefits during months of employment or other desired activity. In both cases, this State-funded assistance is credited toward required maintenance-of-effort spending. In fiscal year 2001, approximately 11 percent of adult-headed cases were not subject to the Federal time limit: 1.2 percent were excluded through the 20 percent hardship extension; 4.8 percent through a pre-existing waiver, and 4.5 percent through use of State-only funds (Fagnoni, 2002). As of January 1, 2003, six States had waivers from TANF time limit rules: Hawaii, Nebraska, Oregon, South Carolina, Tennessee, and Virginia.
The Federal time limit does not apply to child-only cases or to families that receive only TANF-funded services and benefits that are not basic aid (examples are child care and transportation subsidies for working families). It does not apply to months of aid received in Indian country where half or more of adults are not employed.
Seventeen jurisdictions have adopted time limits shorter than the Federal 60-month limit, and three others reduce benefits (by deducting the parent’s share of the grant) before 60 months are reached. Twenty-five jurisdictions impose the Federal time limit. Four continue aid (for children only) beyond 60 months, funding benefits with State dollars (California, District of Columbia, Rhode Island, and Washington). Five States continue full family benefits with their own funds (Maine, Maryland, Michigan, New York – generally in noncash form – and Vermont).
State policy choices about work incentives and sanctions can affect the workings of the time limit. Under TANF, most States encourage recipients to combine work with welfare (by disregarding some or all earnings). This enables families to stay on welfare at higher earnings levels and for longer periods than otherwise. However, each month of work plus (Federally paid) welfare counts toward the Federal time clock. Full family sanctions for work refusal, as permitted under TANF for the first time, can result in removing families from welfare before they reach the time limit. TANF’s 5-year anniversary marks the earliest date that a family could accumulate 60 months of Federally paid benefits, and it varies by State, generally ranging from October 1, 2001 to July 1, 2002 (January 1, 2003 in California). December 2001 was the month of initial impact in New York. The State TANF
7-58 agency estimates that 7-8 percent of New York families who reach the 60-month limit receive hardship extensions; the rest are moved into the State-funded MOE safety net program, which pays TANF level benefits in noncash form. From December 2001 to November 2002, the estimated monthly number of safety net ex-TANF cases rose from about 28,000 to 45,600, and it appears that one-fourth of adults receiving aid in New York now are in the State-funded safety net program. In December 2001, adult-headed TANF cases subject to time limits were concentrated in urban counties with large cities, according to a survey of 26 States (Waller and Berube, 2002). A report prepared for DHHS (Bloom, Farrell, and Fink, 2002) found that about 231,000 families had reached a TANF time limit as of December 2001. Of these, 93,000 were dropped from TANF (most were in States with time limits shorter than 60 months); and 38,000 received a benefit cut. 100,000 continued to receive full benefits (either through a hardship extension or use of State funds).
EXPENDITURES Trends Total expenditures for TANF and predecessor programs peaked at $30.1 billion in fiscal year 1995 and then fell 23 percent in the next three years (while caseloads dropped 34 percent). Thereafter, total spending turned upward, but in fiscal year 2001 still was $5.5 billion below the peak level of 1995 (Table 7-18). Reduced State spending accounted for almost $4.2 million of the drop and reduced Federal spending for almost $1.4 billion. The share of total expenditures paid with Federal funds, which generally was about 54-55 percent under AFDC, declined to 52 percent in fiscal years 1998-1999, but since has risen sharply, to 60 percent in fiscal year 2001. Through fiscal year1996, data in the Table represent Aid to Families with Dependent Children (AFDC), Emergency Assistance to Needy Families (EA), and Job Opportunities and Basic Skills (JOBS). Data for the transition year of FY1997 combine expenditures for AFDC, EA, and JOBS with expenditures for TANF. State TANF expenditures represent spending counted toward the State maintenance-of-effort (MOE) level, including State spending on separate State programs (SSP), but exclude child care spending that can be doubled counted toward both the TANF MOE and the Child Care and Development Block Grant MOE.
The bottom half of Table 7-18 shows expenditures in real dollars. Adjusted for price inflation (by the Consumer Price Index for all urban consumers), expenditures fell almost 30 percent between fiscal years 1995 and 2001 ($58.6 billion throughout the 1996-2001 period compared with the 1995 level and $10.5 billion in fiscal year 2001). In real value Federal expenditures declined almost 22 percent and State expenditures almost 40 percent from peak levels of 1995 (lowering State expenditures by a total of $28.3 billion throughout the 1996-2001 period compared with the 1995 level). In the same period average TANF cash caseloads fell 57 percent.
7-59 TABLE 7-18--TOTAL, FEDERAL, AND STATE EXPENDITURES FOR
TANF AND PREDECESSOR PROGRAMS (AFDC, EA, AND JOBS), FISCAL YEARS 1990-2001
Fiscal Year Total Federal State Actual (current) dollars
1990 22,018 11,953 10,066 1991 24,133 13,169 10,964 1992 26,606 14,567 12,039 1993 27,037 14,790 12,247 1994 28,854 15,686 13,168 1995 30,091 16,173 13,918 1996 28,193 15,067 13,126 1997 23,179 12,494 10,686 1998 21,513 11,286 10,227 1999 21,728 11,323 10,405 2000 22,607 12,483 10,124
2001 24,543 14,785 9,757 Percent change:
1995-2001 (change from peak spending)
-18.4 -8.6 -29.9
Constant (inflation-adjusted) 2001 dollars 1990 30,154 16,370 13,785 1991 31,465 17,170 14,295 1992 33,673 18,436 15,237 1993 33,212 18,168 15,044 1994 34,535 18,775 15,761 1995 35,035 18,830 16,205 1996 31,931 17,065 14,867 1997 25,569 13,782 11,788 1998 23,473 12,314 11,159 1999 22,747 11,854 10,893 2000 23,335 12,885 10,450 2001 24,543 14,785 9,757
Percent change: 1995-2001 (change from peak spending
-29.9 -21.5 -39.8
Note: State TANF expenditures exclude child care expenditures that can be “doubled counted” toward maintenance-of-effort requirements of both the CCDF and TANF. Source: U.S. Department of Health and Human Services, table prepared by the Congressional Research Service.
Chart 7-2 shows the national trends in expenditures, 1990 to 2001
(in nominal dollars). As in Table 7-18, State expenditures under TANF exclude child care that could be credited toward the MOE requirements of both TANF and the CCDF. Expenditures by State
Table 7-19 shows TANF and comparable pre-TANF (AFDC/EA/JOBS) expenditures, Federal and State, by State, for fiscal years 1995 and 2001. The Federal share of expenditures, which averaged 53.7 percent in fiscal year 1995, rose
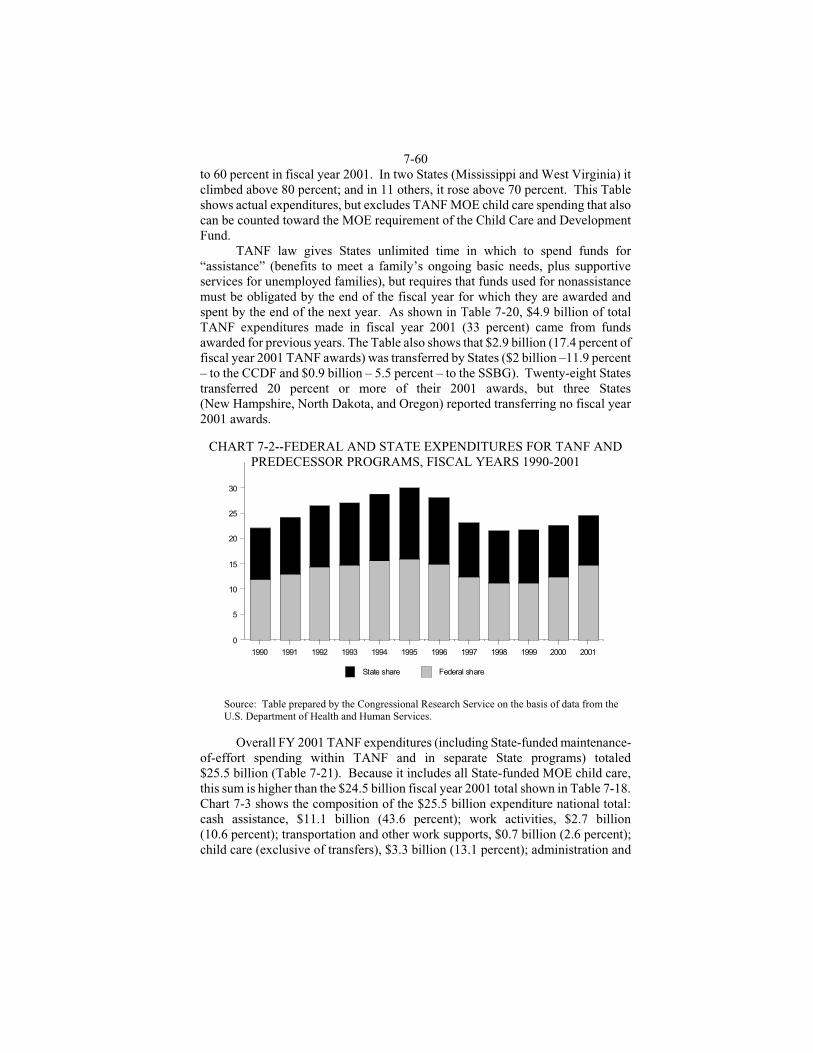
7-60 to 60 percent in fiscal year 2001. In two States (Mississippi and West Virginia) it climbed above 80 percent; and in 11 others, it rose above 70 percent. This Table shows actual expenditures, but excludes TANF MOE child care spending that also can be counted toward the MOE requirement of the Child Care and Development Fund.
TANF law gives States unlimited time in which to spend funds for “assistance” (benefits to meet a family’s ongoing basic needs, plus supportive services for unemployed families), but requires that funds used for nonassistance must be obligated by the end of the fiscal year for which they are awarded and spent by the end of the next year. As shown in Table 7-20, $4.9 billion of total TANF expenditures made in fiscal year 2001 (33 percent) came from funds awarded for previous years. The Table also shows that $2.9 billion (17.4 percent of fiscal year 2001 TANF awards) was transferred by States ($2 billion –11.9 percent – to the CCDF and $0.9 billion – 5.5 percent – to the SSBG). Twenty-eight States transferred 20 percent or more of their 2001 awards, but three States (New Hampshire, North Dakota, and Oregon) reported transferring no fiscal year 2001 awards.
CHART 7-2--FEDERAL AND STATE EXPENDITURES FOR TANF AND PREDECESSOR PROGRAMS, FISCAL YEARS 1990-2001
1990 1991 1992 1993 1994 1995 1996 1997 1998 1999 2000 20010
5
10
15
20
25
30
State share Federal share
Source: Table prepared by the Congressional Research Service on the basis of data from the U.S. Department of Health and Human Services.
Overall FY 2001 TANF expenditures (including State-funded maintenance-
of-effort spending within TANF and in separate State programs) totaled $25.5 billion (Table 7-21). Because it includes all State-funded MOE child care, this sum is higher than the $24.5 billion fiscal year 2001 total shown in Table 7-18. Chart 7-3 shows the composition of the $25.5 billion expenditure national total: cash assistance, $11.1 billion (43.6 percent); work activities, $2.7 billion (10.6 percent); transportation and other work supports, $0.7 billion (2.6 percent); child care (exclusive of transfers), $3.3 billion (13.1 percent); administration and
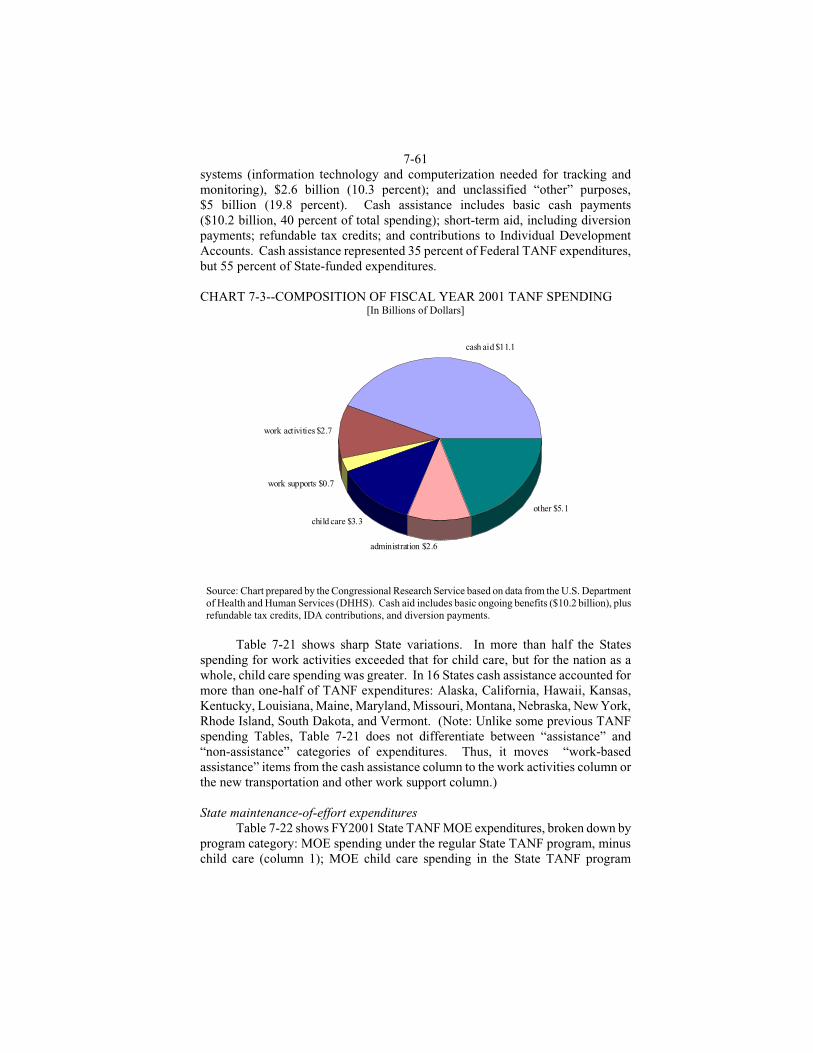
7-61 systems (information technology and computerization needed for tracking and monitoring), $2.6 billion (10.3 percent); and unclassified “other” purposes, $5 billion (19.8 percent). Cash assistance includes basic cash payments ($10.2 billion, 40 percent of total spending); short-term aid, including diversion payments; refundable tax credits; and contributions to Individual Development Accounts. Cash assistance represented 35 percent of Federal TANF expenditures, but 55 percent of State-funded expenditures. CHART 7-3--COMPOSITION OF FISCAL YEAR 2001 TANF SPENDING
[In Billions of Dollars]
cash aid $11.1
work activities $2.7
work supports $0.7
child care $3.3
administration $2.6
other $5.1
Source: Chart prepared by the Congressional Research Service based on data from the U.S. Department of Health and Human Services (DHHS). Cash aid includes basic ongoing benefits ($10.2 billion), plus refundable tax credits, IDA contributions, and diversion payments.
Table 7-21 shows sharp State variations. In more than half the States
spending for work activities exceeded that for child care, but for the nation as a whole, child care spending was greater. In 16 States cash assistance accounted for more than one-half of TANF expenditures: Alaska, California, Hawaii, Kansas, Kentucky, Louisiana, Maine, Maryland, Missouri, Montana, Nebraska, New York, Rhode Island, South Dakota, and Vermont. (Note: Unlike some previous TANF spending Tables, Table 7-21 does not differentiate between “assistance” and “non-assistance” categories of expenditures. Thus, it moves “work-based assistance” items from the cash assistance column to the work activities column or the new transportation and other work support column.) State maintenance-of-effort expenditures Table 7-22 shows FY2001 State TANF MOE expenditures, broken down by program category: MOE spending under the regular State TANF program, minus child care (column 1); MOE child care spending in the State TANF program
7-62 (column 2); MOE total spending in separate State programs, including child care (column 3); and total MOE spending, all programs (column 4). The all-program fiscal year 2001 MOE total of $10.7 billion is greater than that shown in Table 7-16 ($9.8 billion) because it includes $983 million that could be counted twice, to meet MOE requirements of both TANF and CCDF. Nationally, non child-care expenditures under the regular TANF program accounted for 73.3 percent of State MOE spending, child care under TANF for 16.1 percent, and SSP programs for 10.5 percent. California and New York accounted for 75 percent of all Separate State Program MOE spending in fiscal year 2001.
State “social service” spending before and after TANF A survey of 16 States and the District of Columbia found that from 1995 to 1999, spending from Federal and State sources together – including sources outside of TANF and TANF-MOE – decreased for cash assistance, but increased for five other categories of social services. Percentage changes of the median State: cash assistance, down 49.9 percent; other basic needs, up 10.4 percent; child care, up 116.6 percent; work support, up 36.9 percent; child welfare, up 40.3 percent; and other welfare-related services (excluding health), up 28.6 percent (Boyd and Billen, 2003, Table 5). The survey also gathered data on spending after 1999. It found that cash assistance spending declined from 1999 to 2000 in all but two States, Tennessee and Texas; spending for other social service categories continued to rise in most States. A notable exception was New York, which reduced spending for all categories except child care and work support. (Boyd and Billen, 2003, Table 13).
WORK ACTIVITIES AND PARTICIPATION Participation rates, fiscal years
National average work participation rates (for all families) rose from 28.1 percent in FY1997 (first TANF year, last quarter only) to 35.4 percent for FY1998 and 38.3 percent for FY1999, and then declined slightly, to 34 percent for FY2000. In fiscal year 2001, the national rate of TANF work participationaveraged 34.4 percent for all families and 51.1 percent for the two-parent component of the caseload. These compare with the fiscal year 2001 statutory minimums of 45 percent for all families and 90 percent for two-parent families. Participation rates of the 17 States that had continuing waivers were calculated under work rules of the waivers. Some waivers gave work exemptions, some required fewer hours of work than TANF, and some gave work credit for activities not countable under TANF.
In the absence of waivers, national participation rates would have been lower (29.9 percent for all families and 42.8 percent for two- parent families). Among States, the all-family work participation rate in fiscal year 2001 ranged from 6.6 percent in Maryland to 80.7 percent for Kansas (Table 7-23). After adjustment for caseload reduction all jurisdictions except Guam and the Virgin Islands achieved their required all-family work rate. However, four failed the higher two-parent family

7-63 work standard in fiscal year 2001. Six jurisdictions said they had no program for two-parent families (Georgia, North Dakota, Oklahoma, Puerto Rico, South Dakota, Virgin Islands), and 13 have moved two-parent families, as classified for work participation purpose, into Separate State Programs, which are not subject to the Federal standards (Alabama, California, Connecticut, Delaware, Florida, Hawaii, Indiana, Maryland, Nebraska, New Jersey, Tennessee, Utah, and Virginia).
In fiscal year 2001, a monthly average of 2,120,8411 families received TANF assistance. Of these, 52 percent (1,112,577 families) were expected/required to work and were counted in calculating overall work rates. The remaining 48 percent of families were excluded from work rate calculations – 37 percent because they were child-only units and most of the rest because their State exempted families with infants from work requirements. Credited with work for sufficient hours to be counted as participants were 381,853 families, 34.4 percent of those expected to work (see Table 7-25 for their work activities).
States that fail their minimum work participation rates are subject to a penalty (for first year’s failure, loss of 5 percent of the TANF block grant, for second year’s failure, 7 percent of the grant, with the penalty based on “the degree of noncompliance”), and under the law they must spend from State funds an amount equal to their penalties; finally, their required State MOE requirement is increased to 80 percent of its historic level. The law permits States who fail to achieve work rates to submit a corrective action plan or appeal the penalty on grounds of reasonable cause. Over fiscal years 1997-2000, 11 States (Arkansas, Delaware, Iowa, Mississippi, Nebraska, New Jersey, New Mexico, North Carolina, Oklahoma, Virginia, and West Virginia) and the District of Columbia paid penalties totaling $604,656 for failing the two-parent work participation rate; Guam and the Virgin Islands paid penalties totaling $178,094 (the Virgin Islands for failing the all-family rate, Guam for failing both rates). North Carolina paid fines for all four years, but most jurisdictions did so for only one year, usually the first TANF year (1997). Since 1997 the number of States receiving penalty notices has been cut almost in half, chiefly because many States now use SSPs for two-parent families6 (Table 7-24).
Work activities Participants in work activities recognized in TANF law. – As noted earlier, TANF law lists 12 activities that are countable in determining whether a State has achieved the required work participation rate. Table 7- 25 shows the number of persons (adults or teen parents) in all TANF families who were credited with work and their work activities in FY2001. Unsubsidized employment was by far the leading activity. Out of 382,853 families that met the overall work requirement, 248,149 persons (64.8 percent) had unsubsidized jobs. The next most popular work activities were job search, with 51,832 participants (13.5 percent), vocational education, 41,762 persons (10.9 percent), and work experience, 35,875 persons
6 TANF reauthorization legislation pending in late 2003– including H.R. 4 as passed by the House in February and as approved by the Senate Finance Committee in October – would eliminate the separate and higher work participation rate for two-parent families.
7-64 (9.4 percent). (Participation in job search and vocational education may be understated because of time limits imposed on them, Two activities countable only for high school dropouts accounted for 23,522 persons (6.1 percent) – satisfactory school attendance, 14,622 persons, and education directly related to work, 8,900 persons. These percentages add up to more than 100 because some persons participated in more than one activity. Table 7-26 shows that a total of 18,802 two-parent families met the work participation standard in FY2001. Among them were 17,728 persons who had unsubsidized jobs (in some families, both parents worked), 4,373 who performed job search, 4,208 who engaged in community service, 3,102 who engaged in work experience, and 3,502 who undertook various educational activities.
In FY1995, 39.4 percent of JOBS participants were engaged in educational activities (high school, GED, remedial education, English as a second language, or higher education). Another 7.8 percent were engaged in vocational training (Committee, 1998, p. 482). In contrast, under TANF, only 17 percent of all adults or teen parents who were credited with work during FY2001 engaged in one of the three listed educational activities (vocational education, satisfactory school attendance, and education related to employment). A GAO official told a subcommittee of the Committee on Education and the Workforce in September 1999 that under TANF “education and vocational training are largely reserved for those who need it to get or keep a job or to advance on a career ladder” (Fagnoni, 1999). In general, TANF programs stress work first. However, because of the caseload reduction credit, a sizable number of States have been free to liberalize work activity definitions without fear of penalty for failing work participation rates, and many allow “postsecondary education” in their TANF programs, sometimes requiring that students work part time.
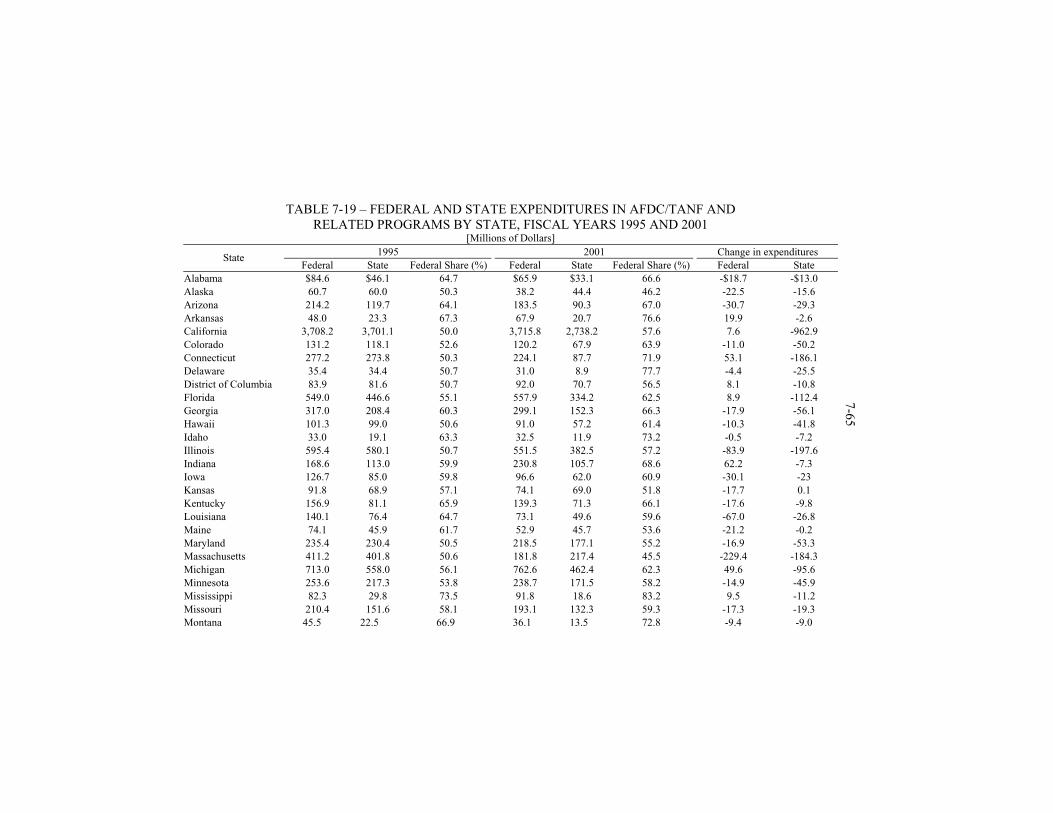
TABLE 7-19 – FEDERAL AND STATE EXPENDITURES IN AFDC/TANF AND RELATED PROGRAMS BY STATE, FISCAL YEARS 1995 AND 2001
[Millions of Dollars] 1995 2001 Change in expenditures State
Federal State Federal Share (%) Federal State Federal Share (%) Federal State Alabama $84.6 $46.1 64.7 $65.9 $33.1 66.6 -$18.7 -$13.0 Alaska 60.7 60.0 50.3 38.2 44.4 46.2 -22.5 -15.6 Arizona 214.2 119.7 64.1 183.5 90.3 67.0 -30.7 -29.3 Arkansas 48.0 23.3 67.3 67.9 20.7 76.6 19.9 -2.6 California 3,708.2 3,701.1 50.0 3,715.8 2,738.2 57.6 7.6 -962.9 Colorado 131.2 118.1 52.6 120.2 67.9 63.9 -11.0 -50.2 Connecticut 277.2 273.8 50.3 224.1 87.7 71.9 53.1 -186.1 Delaware 35.4 34.4 50.7 31.0 8.9 77.7 -4.4 -25.5 District of Columbia 83.9 81.6 50.7 92.0 70.7 56.5 8.1 -10.8 Florida 549.0 446.6 55.1 557.9 334.2 62.5 8.9 -112.4 Georgia 317.0 208.4 60.3 299.1 152.3 66.3 -17.9 -56.1 Hawaii 101.3 99.0 50.6 91.0 57.2 61.4 -10.3 -41.8 Idaho 33.0 19.1 63.3 32.5 11.9 73.2 -0.5 -7.2 Illinois 595.4 580.1 50.7 551.5 382.5 57.2 -83.9 -197.6 Indiana 168.6 113.0 59.9 230.8 105.7 68.6 62.2 -7.3 Iowa 126.7 85.0 59.8 96.6 62.0 60.9 -30.1 -23 Kansas 91.8 68.9 57.1 74.1 69.0 51.8 -17.7 0.1 Kentucky 156.9 81.1 65.9 139.3 71.3 66.1 -17.6 -9.8 Louisiana 140.1 76.4 64.7 73.1 49.6 59.6 -67.0 -26.8 Maine 74.1 45.9 61.7 52.9 45.7 53.6 -21.2 -0.2 Maryland 235.4 230.4 50.5 218.5 177.1 55.2 -16.9 -53.3 Massachusetts 411.2 401.8 50.6 181.8 217.4 45.5 -229.4 -184.3 Michigan 713.0 558.0 56.1 762.6 462.4 62.3 49.6 -95.6 Minnesota 253.6 217.3 53.8 238.7 171.5 58.2 -14.9 -45.9 Mississippi 82.3 29.8 73.5 91.8 18.6 83.2 9.5 -11.2 Missouri 210.4 151.6 58.1 193.1 132.3 59.3 -17.3 -19.3 Montana 45.5 22.5 66.9 36.1 13.5 72.8 -9.4 -9.0
7-65
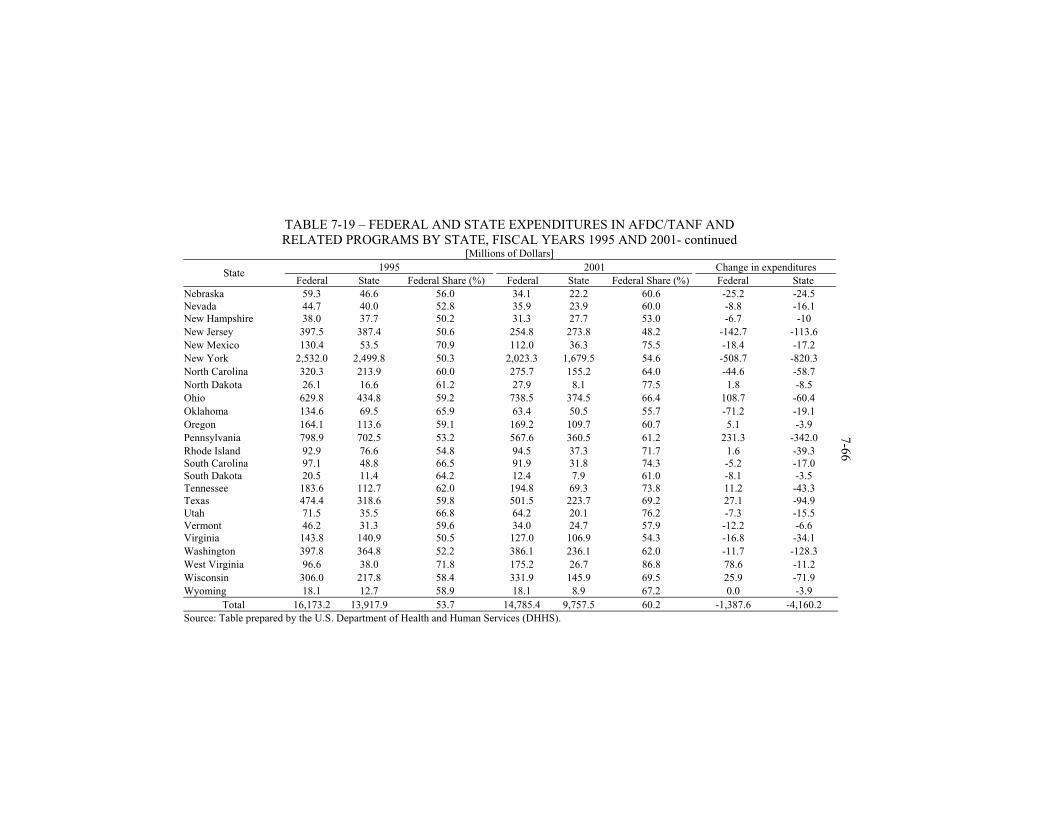
TABLE 7-19 – FEDERAL AND STATE EXPENDITURES IN AFDC/TANF AND RELATED PROGRAMS BY STATE, FISCAL YEARS 1995 AND 2001- continued
[Millions of Dollars] 1995 2001 Change in expenditures State
Federal State Federal Share (%) Federal State Federal Share (%) Federal State Nebraska 59.3 46.6 56.0 34.1 22.2 60.6 -25.2 -24.5Nevada 44.7 40.0 52.8 35.9 23.9 60.0 -8.8 -16.1New Hampshire 38.0 37.7 50.2 31.3 27.7 53.0 -6.7 -10 New Jersey 397.5 387.4 50.6 254.8 273.8 48.2 -142.7 -113.6 New Mexico 130.4 53.5 70.9 112.0 36.3 75.5 -18.4 -17.2 New York 2,532.0 2,499.8 50.3 2,023.3 1,679.5 54.6 -508.7 -820.3 North Carolina 320.3 213.9 60.0 275.7 155.2 64.0 -44.6 -58.7 North Dakota 26.1 16.6 61.2 27.9 8.1 77.5 1.8 -8.5 Ohio 629.8 434.8 59.2 738.5 374.5 66.4 108.7 -60.4 Oklahoma 134.6 69.5 65.9 63.4 50.5 55.7 -71.2 -19.1 Oregon 164.1 113.6 59.1 169.2 109.7 60.7 5.1 -3.9 Pennsylvania 798.9 702.5 53.2 567.6 360.5 61.2 231.3 -342.0 Rhode Island 92.9 76.6 54.8 94.5 37.3 71.7 1.6 -39.3South Carolina 97.1 48.8 66.5 91.9 31.8 74.3 -5.2 -17.0South Dakota 20.5 11.4 64.2 12.4 7.9 61.0 -8.1 -3.5Tennessee 183.6 112.7 62.0 194.8 69.3 73.8 11.2 -43.3Texas 474.4 318.6 59.8 501.5 223.7 69.2 27.1 -94.9Utah 71.5 35.5 66.8 64.2 20.1 76.2 -7.3 -15.5Vermont 46.2 31.3 59.6 34.0 24.7 57.9 -12.2 -6.6Virginia 143.8 140.9 50.5 127.0 106.9 54.3 -16.8 -34.1 Washington 397.8 364.8 52.2 386.1 236.1 62.0 -11.7 -128.3 West Virginia 96.6 38.0 71.8 175.2 26.7 86.8 78.6 -11.2 Wisconsin 306.0 217.8 58.4 331.9 145.9 69.5 25.9 -71.9 Wyoming 18.1 12.7 58.9 18.1 8.9 67.2 0.0 -3.9
Total 16,173.2 13,917.9 53.7 14,785.4 9,757.5 60.2 -1,387.6 -4,160.2
7-66
Source: Table prepared by the U.S. Department of Health and Human Services (DHHS).
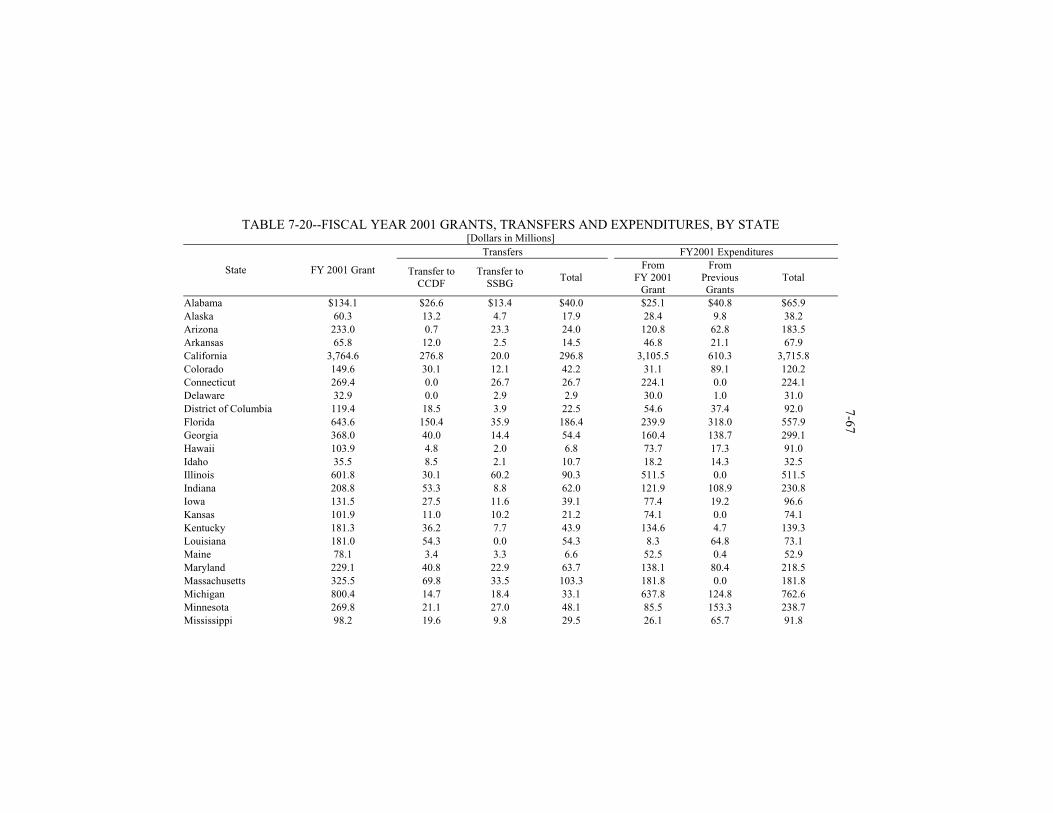
TABLE 7-20--FISCAL YEAR 2001 GRANTS, TRANSFERS AND EXPENDITURES, BY STATE
[Dollars in Millions] Transfers FY2001 Expenditures
State FY 2001 Grant Transfer to CCDF
Transfer to SSBG
Total From
FY 2001 Grant
From Previous Grants
Total
Alabama $134.1 $26.6 $13.4 $40.0 $25.1 $40.8 $65.9 Alaska 60.3 13.2 4.7 17.9 28.4 9.8 38.2 Arizona 233.0 0.7 23.3 24.0 120.8 62.8 183.5 Arkansas 65.8 12.0 2.5 14.5 46.8 21.1 67.9 California 3,764.6 276.8 20.0 296.8 3,105.5 610.3 3,715.8 Colorado 149.6 30.1 12.1 42.2 31.1 89.1 120.2 Connecticut 269.4 0.0 26.7 26.7 224.1 0.0 224.1 Delaware 32.9 0.0 2.9 2.9 30.0 1.0 31.0 District of Columbia 119.4 18.5 3.9 22.5 54.6 37.4 92.0 Florida 643.6 150.4 35.9 186.4 239.9 318.0 557.9 Georgia 368.0 40.0 14.4 54.4 160.4 138.7 299.1 Hawaii 103.9 4.8 2.0 6.8 73.7 17.3 91.0 Idaho 35.5 8.5 2.1 10.7 18.2 14.3 32.5 Illinois 601.8 30.1 60.2 90.3 511.5 0.0 511.5 Indiana 208.8 53.3 8.8 62.0 121.9 108.9 230.8 Iowa 131.5 27.5 11.6 39.1 77.4 19.2 96.6 Kansas 101.9 11.0 10.2 21.2 74.1 0.0 74.1 Kentucky 181.3 36.2 7.7 43.9 134.6 4.7 139.3 Louisiana 181.0 54.3 0.0 54.3 8.3 64.8 73.1 Maine 78.1 3.4 3.3 6.6 52.5 0.4 52.9 Maryland 229.1 40.8 22.9 63.7 138.1 80.4 218.5 Massachusetts 325.5 69.8 33.5 103.3 181.8 0.0 181.8 Michigan 800.4 14.7 18.4 33.1 637.8 124.8 762.6 Minnesota 269.8 21.1 27.0 48.1 85.5 153.3 238.7 Mississippi 98.2 19.6 9.8 29.5 26.1 65.7 91.8
7-67
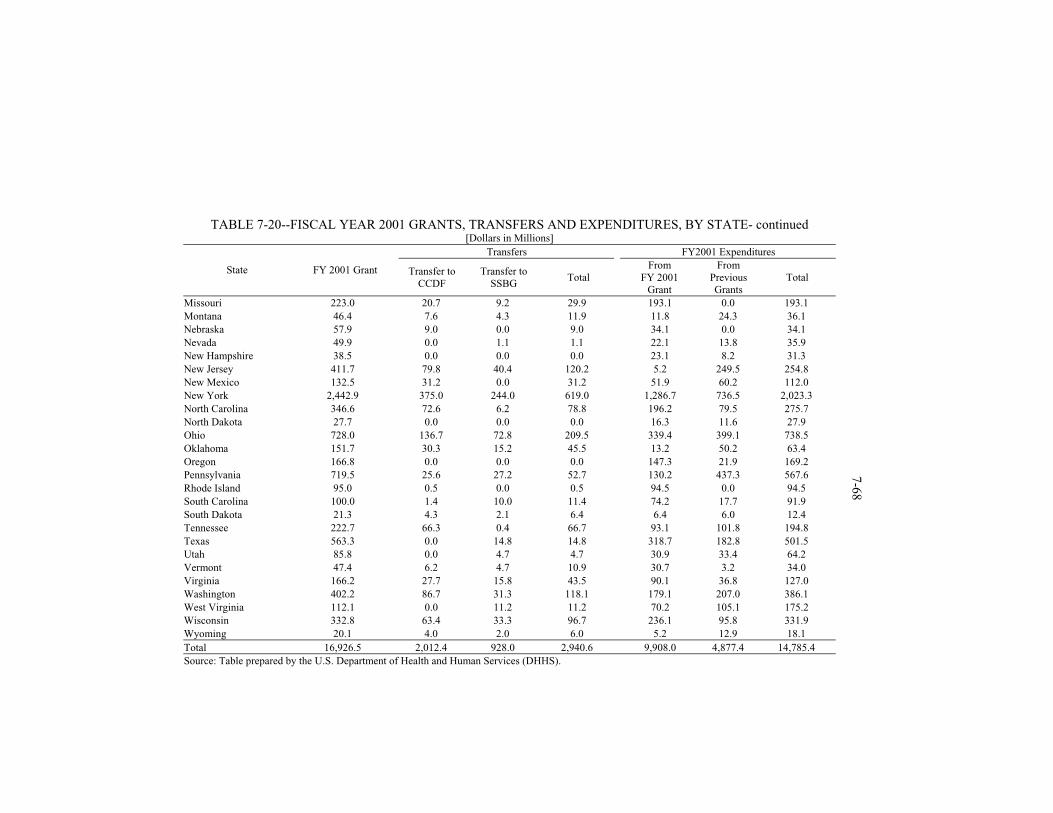
TABLE 7-20--FISCAL YEAR 2001 GRANTS, TRANSFERS AND EXPENDITURES, BY STATE- continued
[Dollars in Millions] Transfers FY2001 Expenditures
State FY 2001 Grant Transfer to CCDF
Transfer to SSBG
Total From
FY 2001 Grant
From Previous Grants
Total
Missouri 223.0 20.7 9.2 29.9 193.1 0.0 193.1 Montana 46.4 7.6 4.3 11.9 11.8 24.3 36.1 Nebraska 57.9 9.0 0.0 9.0 34.1 0.0 34.1 Nevada 49.9 0.0 1.1 1.1 22.1 13.8 35.9 New Hampshire 38.5 0.0 0.0 0.0 23.1 8.2 31.3 New Jersey 411.7 79.8 40.4 120.2 5.2 249.5 254.8 New Mexico 132.5 31.2 0.0 31.2 51.9 60.2 112.0 New York 2,442.9 375.0 244.0 619.0 1,286.7 736.5 2,023.3 North Carolina 346.6 72.6 6.2 78.8 196.2 79.5 275.7 North Dakota 27.7 0.0 0.0 0.0 16.3 11.6 27.9 Ohio 728.0 136.7 72.8 209.5 339.4 399.1 738.5 Oklahoma 151.7 30.3 15.2 45.5 13.2 50.2 63.4 Oregon 166.8 0.0 0.0 0.0 147.3 21.9 169.2 Pennsylvania 719.5 25.6 27.2 52.7 130.2 437.3 567.6 Rhode Island 95.0 0.5 0.0 0.5 94.5 0.0 94.5 South Carolina 100.0 1.4 10.0 11.4 74.2 17.7 91.9 South Dakota 21.3 4.3 2.1 6.4 6.4 6.0 12.4 Tennessee 222.7 66.3 0.4 66.7 93.1 101.8 194.8 Texas 563.3 0.0 14.8 14.8 318.7 182.8 501.5 Utah 85.8 0.0 4.7 4.7 30.9 33.4 64.2 Vermont 47.4 6.2 4.7 10.9 30.7 3.2 34.0 Virginia 166.2 27.7 15.8 43.5 90.1 36.8 127.0 Washington 402.2 86.7 31.3 118.1 179.1 207.0 386.1 West Virginia 112.1 0.0 11.2 11.2 70.2 105.1 175.2 Wisconsin 332.8 63.4 33.3 96.7 236.1 95.8 331.9 Wyoming 20.1 4.0 2.0 6.0 5.2 12.9 18.1 Total 16,926.5 2,012.4 928.0 2,940.6 9,908.0 4,877.4 14,785.4 Source: Table prepared by the U.S. Department of Health and Human Services (DHHS).
7-68

TABLE 7-21--TOTAL TANF AND TANF MOE (STATE-FUNDED)
EXPENDITURES IN FISCAL YEAR 2001 FOR MAJOR CATEGORIES, BY STATE [Millions of Dollars]
State Cash
Assistance1 Work
Activities2 Transportation and
Other Work Supports3Child Care4
Administration and Systems5
Other Total
Expenditures Alabama $31.9 $19.6 $1.7 $6.1 $14.8 $31.1 $105.1Alaska 51.2 9.7 2.1 9.3 8.9 4.4 85.6Arizona 91.3 34.0 13.3 46.8 21.3 67.2 273.9Arkansas 24.6 24.9 10.6 6.8 14.5 9.1 90.5California 3,745.6 511.8 195.8 841.7 589.8 735.6 6,620.3Colorado 55.2 1.0 6.6 4.3 25.2 96.4 188.8Connecticut 157.5 15.9 10.1 95.7 35.4 92.9 407.6Delaware 20.6 - 11.8 16.6 6.8 0.0 55.8District of Columbia 67.4 22.8 - 44.0 17.3 15.9 167.4Florida 251.4 136.1 10.1 229.4 74.9 223.6 925.6Georgia 172.4 63.1 62.7 28.9 41.4 105.5 474.0Hawaii 125.7 4.8 1.9 2.0 15.8 - 150.2Idaho 4.6 7.7 0.2 2.5 2.3 28.3 45.6Illinois 190.6 92.2 7.4 315.9 34.3 310.5 950.9Indiana 119.6 3.9 14.8 64.4 39.6 109.6 351.9Iowa 77.8 22.1 3.8 5.2 20.2 29.5 158.5Kansas 84.8 7.1 1.4 6.7 7.6 42.3 149.8Kentucky 113.0 33.6 9.8 16.9 22.6 14.8 210.6Louisiana 65.9 10.7 3.6 12.1 18.6 17.0 127.9Maine 67.8 0.6 14.1 9.9 5.1 1.1 98.6Maryland 224.2 115.8 18.2 -29.7 43.5 23.5 395.4Massachusetts 143.1 24.5 4.4 132.9 35.3 85.7 425.9Michigan 352.7 140.8 3.7 328.1 170.6 253.5 1,249.4Minnesota 183.7 53.6 5.2 65.8 46.3 75.2 429.9Mississippi 31.0 12.6 33.3 13.0 8.0 14.3 112.1Missouri 208.5 45.0 0.0 63.1 21.3 4.0 341.9Montana 28.3 12.1 0.1 1.3 4.3 4.8 50.9Nebraska 39.3 8.1 - 6.5 8.8 - 62.7 Nevada 28.7 3.0 1.7 1.6 14.9 11.5 61.4New Hampshire 28.2 6.2 0.8 4.6 13.7 10.1 63.6
7-69
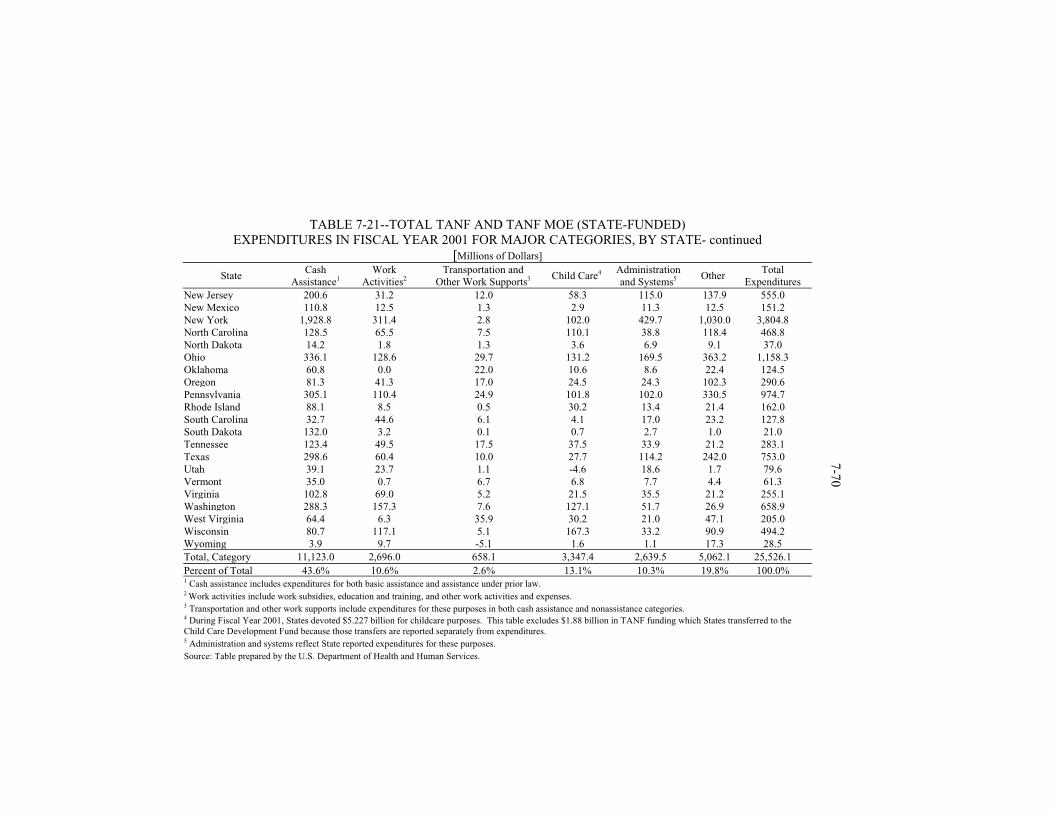
TABLE 7-21--TOTAL TANF AND TANF MOE (STATE-FUNDED)
EXPENDITURES IN FISCAL YEAR 2001 FOR MAJOR CATEGORIES, BY STATE- continued [Millions of Dollars]
State Cash
Assistance1 Work
Activities2 Transportation and
Other Work Supports3 Child Care4 Administration
and Systems5 Other
Total Expenditures
New Jersey 200.6 31.2 12.0 58.3 115.0 137.9 555.0New Mexico 110.8 12.5 1.3 2.9 11.3 12.5 151.2New York 1,928.8 311.4 2.8 102.0 429.7 1,030.0 3,804.8North Carolina 128.5 65.5 7.5 110.1 38.8 118.4 468.8North Dakota 14.2 1.8 1.3 3.6 6.9 9.1 37.0Ohio 336.1 128.6 29.7 131.2 169.5 363.2 1,158.3Oklahoma 60.8 0.0 22.0 10.6 8.6 22.4 124.5Oregon 81.3 41.3 17.0 24.5 24.3 102.3 290.6Pennsylvania 305.1 110.4 24.9 101.8 102.0 330.5 974.7Rhode Island 88.1 8.5 0.5 30.2 13.4 21.4 162.0South Carolina 32.7 44.6 6.1 4.1 17.0 23.2 127.8South Dakota 132.0 3.2 0.1 0.7 2.7 1.0 21.0Tennessee 123.4 49.5 17.5 37.5 33.9 21.2 283.1Texas 298.6 60.4 10.0 27.7 114.2 242.0 753.0Utah 39.1 23.7 1.1 -4.6 18.6 1.7 79.6Vermont 35.0 0.7 6.7 6.8 7.7 4.4 61.3Virginia 102.8 69.0 5.2 21.5 35.5 21.2 255.1Washington 288.3 157.3 7.6 127.1 51.7 26.9 658.9West Virginia 64.4 6.3 35.9 30.2 21.0 47.1 205.0Wisconsin 80.7 117.1 5.1 167.3 33.2 90.9 494.2Wyoming 3.9 9.7 -5.1 1.6 1.1 17.3 28.5Total, Category 11,123.0 2,696.0 658.1 3,347.4 2,639.5 5,062.1 25,526.1 Percent of Total 43.6% 10.6% 2.6% 13.1% 10.3% 19.8% 100.0%1 Cash assistance includes expenditures for both basic assistance and assistance under prior law. 2 Work activities include work subsidies, education and training, and other work activities and expenses. 3 Transportation and other work supports include expenditures for these purposes in both cash assistance and nonassistance categories. 4 During Fiscal Year 2001, States devoted $5.227 billion for childcare purposes. This table excludes $1.88 billion in TANF funding which States transferred to the Child Care Development Fund because those transfers are reported separately from expenditures. 5 Administration and systems reflect State reported expenditures for these purposes. Source: Table prepared by the U.S. Department of Health and Human Services.
7-70
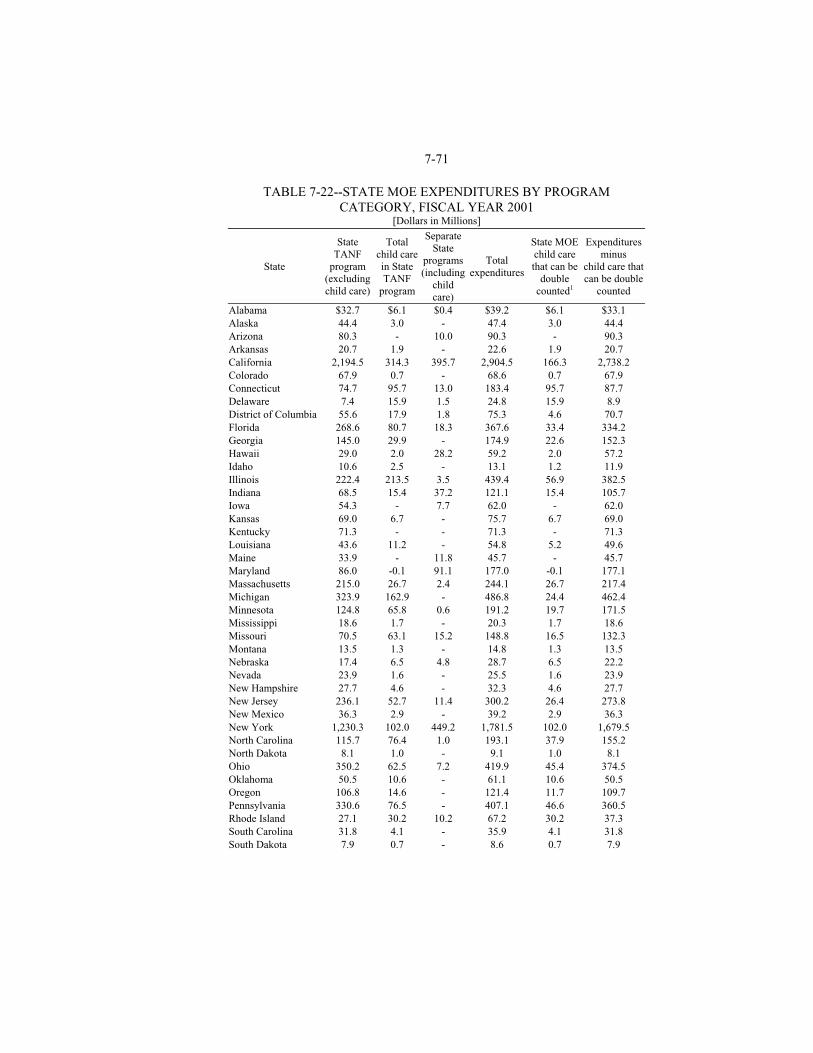
7-71
TABLE 7-22--STATE MOE EXPENDITURES BY PROGRAM CATEGORY, FISCAL YEAR 2001
[Dollars in Millions]
State
State TANF
program (excluding child care)
Total child care in State TANF
program
Separate State
programs (including
child care)
Total expenditures
State MOE child care that can be
double counted1
Expenditures minus
child care that can be double
counted
Alabama $32.7 $6.1 $0.4 $39.2 $6.1 $33.1 Alaska 44.4 3.0 - 47.4 3.0 44.4 Arizona 80.3 - 10.0 90.3 - 90.3 Arkansas 20.7 1.9 - 22.6 1.9 20.7 California 2,194.5 314.3 395.7 2,904.5 166.3 2,738.2 Colorado 67.9 0.7 - 68.6 0.7 67.9 Connecticut 74.7 95.7 13.0 183.4 95.7 87.7 Delaware 7.4 15.9 1.5 24.8 15.9 8.9 District of Columbia 55.6 17.9 1.8 75.3 4.6 70.7 Florida 268.6 80.7 18.3 367.6 33.4 334.2 Georgia 145.0 29.9 - 174.9 22.6 152.3 Hawaii 29.0 2.0 28.2 59.2 2.0 57.2 Idaho 10.6 2.5 - 13.1 1.2 11.9 Illinois 222.4 213.5 3.5 439.4 56.9 382.5 Indiana 68.5 15.4 37.2 121.1 15.4 105.7 Iowa 54.3 - 7.7 62.0 - 62.0 Kansas 69.0 6.7 - 75.7 6.7 69.0 Kentucky 71.3 - - 71.3 - 71.3 Louisiana 43.6 11.2 - 54.8 5.2 49.6 Maine 33.9 - 11.8 45.7 - 45.7 Maryland 86.0 -0.1 91.1 177.0 -0.1 177.1 Massachusetts 215.0 26.7 2.4 244.1 26.7 217.4 Michigan 323.9 162.9 - 486.8 24.4 462.4 Minnesota 124.8 65.8 0.6 191.2 19.7 171.5 Mississippi 18.6 1.7 - 20.3 1.7 18.6 Missouri 70.5 63.1 15.2 148.8 16.5 132.3 Montana 13.5 1.3 - 14.8 1.3 13.5 Nebraska 17.4 6.5 4.8 28.7 6.5 22.2 Nevada 23.9 1.6 - 25.5 1.6 23.9 New Hampshire 27.7 4.6 - 32.3 4.6 27.7 New Jersey 236.1 52.7 11.4 300.2 26.4 273.8 New Mexico 36.3 2.9 - 39.2 2.9 36.3 New York 1,230.3 102.0 449.2 1,781.5 102.0 1,679.5 North Carolina 115.7 76.4 1.0 193.1 37.9 155.2 North Dakota 8.1 1.0 - 9.1 1.0 8.1 Ohio 350.2 62.5 7.2 419.9 45.4 374.5 Oklahoma 50.5 10.6 - 61.1 10.6 50.5 Oregon 106.8 14.6 - 121.4 11.7 109.7 Pennsylvania 330.6 76.5 - 407.1 46.6 360.5 Rhode Island 27.1 30.2 10.2 67.2 30.2 37.3 South Carolina 31.8 4.1 - 35.9 4.1 31.8 South Dakota 7.9 0.7 - 8.6 0.7 7.9
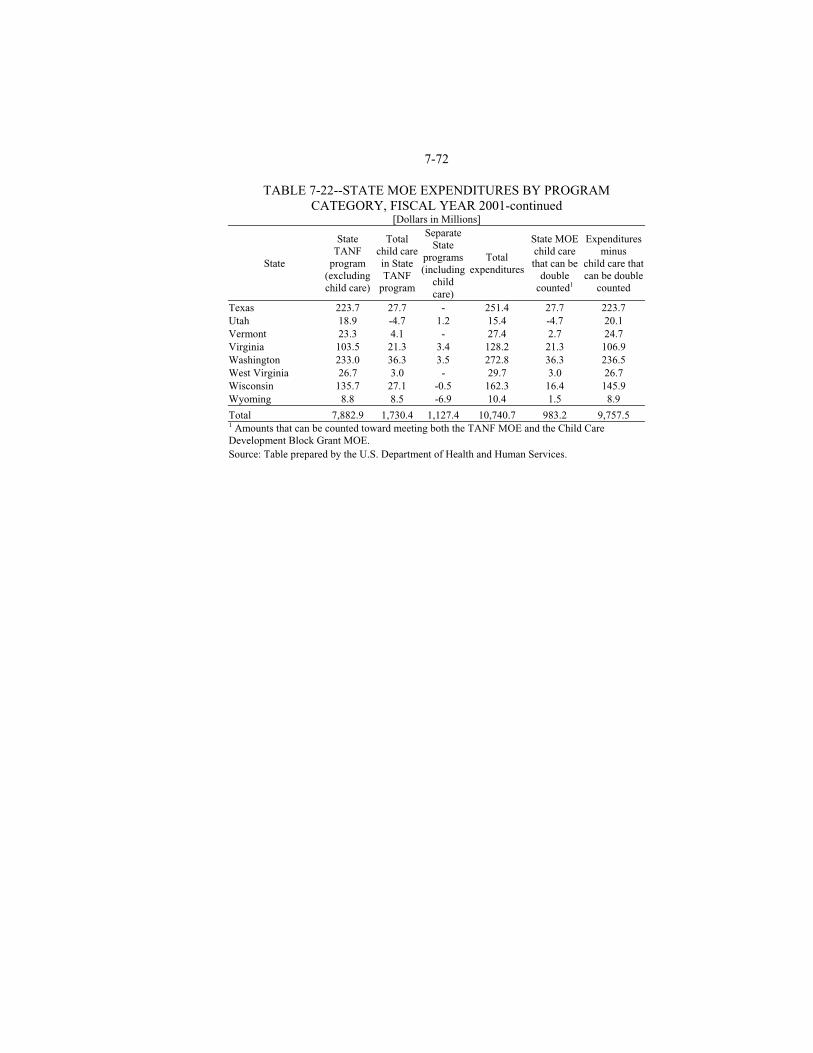
7-72
TABLE 7-22--STATE MOE EXPENDITURES BY PROGRAM CATEGORY, FISCAL YEAR 2001-continued
[Dollars in Millions]
State
State TANF
program (excluding child care)
Total child care in State TANF
program
Separate State
programs (including
child care)
Total expenditures
State MOE child care that can be
double counted1
Expenditures minus
child care that can be double
counted
Texas 223.7 27.7 - 251.4 27.7 223.7 Utah 18.9 -4.7 1.2 15.4 -4.7 20.1 Vermont 23.3 4.1 - 27.4 2.7 24.7 Virginia 103.5 21.3 3.4 128.2 21.3 106.9 Washington 233.0 36.3 3.5 272.8 36.3 236.5 West Virginia 26.7 3.0 - 29.7 3.0 26.7 Wisconsin 135.7 27.1 -0.5 162.3 16.4 145.9 Wyoming 8.8 8.5 -6.9 10.4 1.5 8.9
Total 7,882.9 1,730.4 1,127.4 10,740.7 983.2 9,757.5 1 Amounts that can be counted toward meeting both the TANF MOE and the Child Care Development Block Grant MOE. Source: Table prepared by the U.S. Department of Health and Human Services.
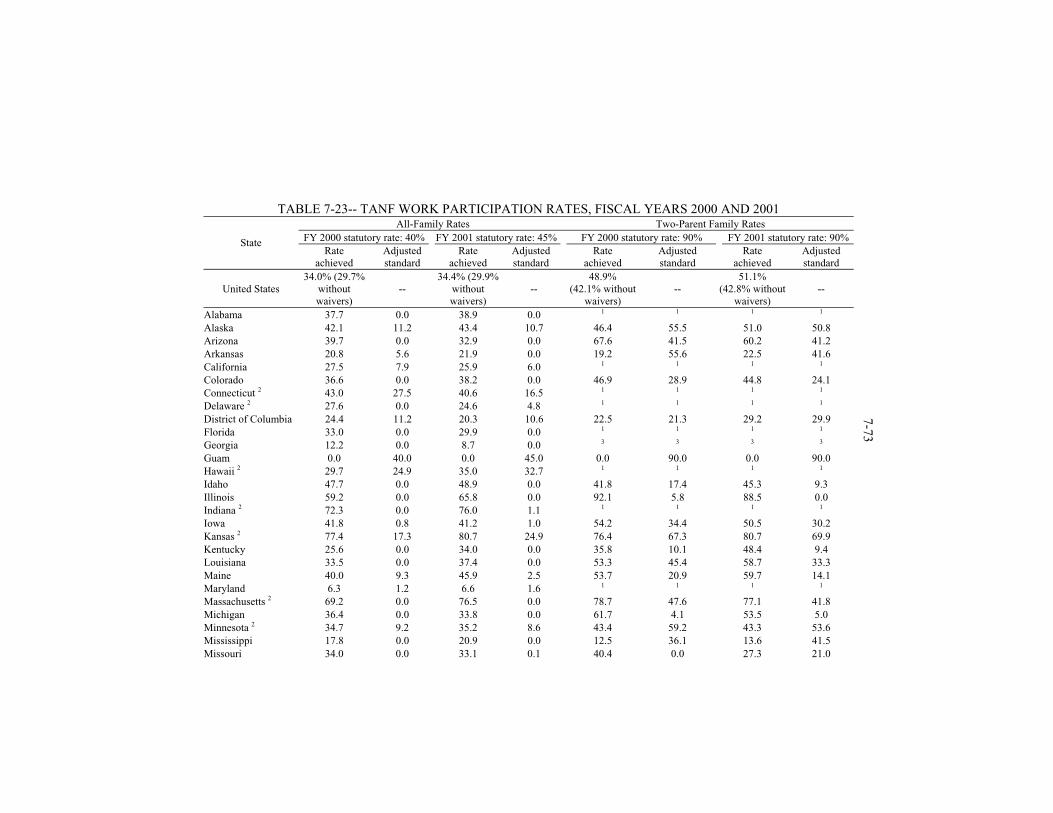
TABLE 7-23-- TANF WORK PARTICIPATION RATES, FISCAL YEARS 2000 AND 2001 All-Family Rates Two-Parent Family Rates
FY 2000 statutory rate: 40% FY 2001 statutory rate: 45% FY 2000 statutory rate: 90% FY 2001 statutory rate: 90%State Rate
achieved Adjusted standard
Rate achieved
Adjusted standard
Rate achieved
Adjusted standard
Rate achieved
Adjusted standard
United States 34.0% (29.7%
without waivers)
-- 34.4% (29.9%
without waivers)
-- 48.9%
(42.1% without waivers)
-- 51.1%
(42.8% without waivers)
--
Alabama 37.7 0.0 38.9 0.0 1 1 1 1 Alaska 42.1 11.2 43.4 10.7 46.4 55.5 51.0 50.8 Arizona 39.7 0.0 32.9 0.0 67.6 41.5 60.2 41.2 Arkansas 20.8 5.6 21.9 0.0 19.2 55.6 22.5 41.6 California 27.5 7.9 25.9 6.0 1 1 1 1 Colorado 36.6 0.0 38.2 0.0 46.9 28.9 44.8 24.1 Connecticut 2 43.0 27.5 40.6 16.5 1 1 1 1 Delaware 2 27.6 0.0 24.6 4.8 1 1 1 1 District of Columbia 24.4 11.2 20.3 10.6 22.5 21.3 29.2 29.9 Florida 33.0 0.0 29.9 0.0 1 1 1 1 Georgia 12.2 0.0 8.7 0.0 3 3 3 3 Guam 0.0 40.0 0.0 45.0 0.0 90.0 0.0 90.0 Hawaii 2 29.7 24.9 35.0 32.7 1 1 1 1 Idaho 47.7 0.0 48.9 0.0 41.8 17.4 45.3 9.3 Illinois 59.2 0.0 65.8 0.0 92.1 5.8 88.5 0.0 Indiana 2 72.3 0.0 76.0 1.1 1 1 1 1 Iowa 41.8 0.8 41.2 1.0 54.2 34.4 50.5 30.2 Kansas 2 77.4 17.3 80.7 24.9 76.4 67.3 80.7 69.9 Kentucky 25.6 0.0 34.0 0.0 35.8 10.1 48.4 9.4 Louisiana 33.5 0.0 37.4 0.0 53.3 45.4 58.7 33.3 Maine 40.0 9.3 45.9 2.5 53.7 20.9 59.7 14.1 Maryland 6.3 1.2 6.6 1.6 1 1 1 1 Massachusetts 2 69.2 0.0 76.5 0.0 78.7 47.6 77.1 41.8 Michigan 36.4 0.0 33.8 0.0 61.7 4.1 53.5 5.0 Minnesota 2 34.7 9.2 35.2 8.6 43.4 59.2 43.3 53.6 Mississippi 17.8 0.0 20.9 0.0 12.5 36.1 13.6 41.5 Missouri 34.0 0.0 33.1 0.1 40.4 0.0 27.3 21.0
7-73
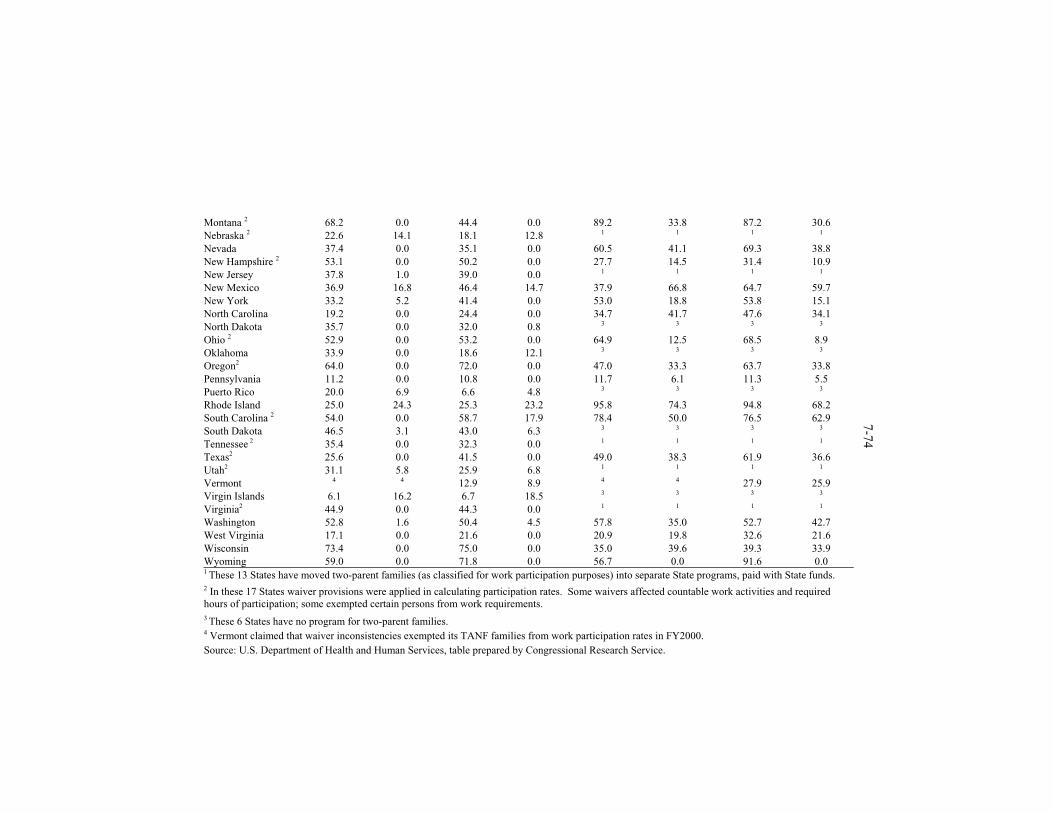
Montana 2 68.2 0.0 44.4 0.0 89.2 33.8 87.2 30.6 Nebraska 2 22.6 14.1 18.1 12.8 1 1 1 1 Nevada 37.4 0.0 35.1 0.0 60.5 41.1 69.3 38.8 New Hampshire 2 53.1 0.0 50.2 0.0 27.7 14.5 31.4 10.9 New Jersey 37.8 1.0 39.0 0.0 1 1 1 1 New Mexico 36.9 16.8 46.4 14.7 37.9 66.8 64.7 59.7 New York 33.2 5.2 41.4 0.0 53.0 18.8 53.8 15.1 North Carolina 19.2 0.0 24.4 0.0 34.7 41.7 47.6 34.1 North Dakota 35.7 0.0 32.0 0.8 3 3 3 3 Ohio 2 52.9 0.0 53.2 0.0 64.9 12.5 68.5 8.9 Oklahoma 33.9 0.0 18.6 12.1 3 3 3 3 Oregon2 64.0 0.0 72.0 0.0 47.0 33.3 63.7 33.8 Pennsylvania 11.2 0.0 10.8 0.0 11.7 6.1 11.3 5.5 Puerto Rico 20.0 6.9 6.6 4.8 3 3 3 3 Rhode Island 25.0 24.3 25.3 23.2 95.8 74.3 94.8 68.2 South Carolina 2 54.0 0.0 58.7 17.9 78.4 50.0 76.5 62.9 South Dakota 46.5 3.1 43.0 6.3 3 3 3 3 Tennessee 2 35.4 0.0 32.3 0.0 1 1 1 1 Texas2 25.6 0.0 41.5 0.0 49.0 38.3 61.9 36.6 Utah2 31.1 5.8 25.9 6.8 1 1 1 1 Vermont 4 4 12.9 8.9 4 4 27.9 25.9 Virgin Islands 6.1 16.2 6.7 18.5 3 3 3 3 Virginia2 44.9 0.0 44.3 0.0 1 1 1 1 Washington 52.8 1.6 50.4 4.5 57.8 35.0 52.7 42.7 West Virginia 17.1 0.0 21.6 0.0 20.9 19.8 32.6 21.6 Wisconsin 73.4 0.0 75.0 0.0 35.0 39.6 39.3 33.9 Wyoming 59.0 0.0 71.8 0.0 56.7 0.0 91.6 0.0 1 These 13 States have moved two-parent families (as classified for work participation purposes) into separate State programs, paid with State funds. 2 In these 17 States waiver provisions were applied in calculating participation rates. Some waivers affected countable work activities and required hours of participation; some exempted certain persons from work requirements. 3 These 6 States have no program for two-parent families. 4 Vermont claimed that waiver inconsistencies exempted its TANF families from work participation rates in FY2000. Source: U.S. Department of Health and Human Services, table prepared by Congressional Research Service.
7-74
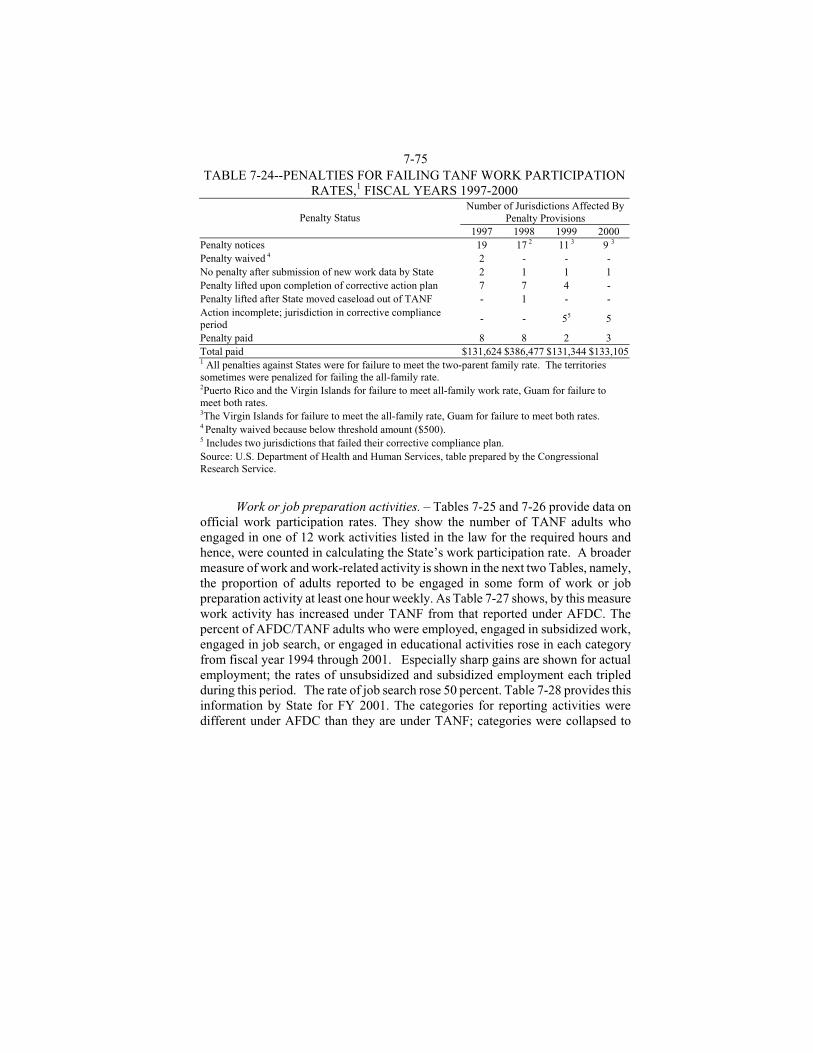
7-75 TABLE 7-24--PENALTIES FOR FAILING TANF WORK PARTICIPATION
RATES,1 FISCAL YEARS 1997-2000 Number of Jurisdictions Affected By
Penalty Provisions Penalty Status 1997 1998 1999 2000
Penalty notices 19 17 2 11 3 9 3 Penalty waived 4 2 - - - No penalty after submission of new work data by State 2 1 1 1 Penalty lifted upon completion of corrective action plan 7 7 4 - Penalty lifted after State moved caseload out of TANF - 1 - - Action incomplete; jurisdiction in corrective compliance period
- - 55 5
Penalty paid 8 8 2 3 Total paid $131,624 $386,477 $131,344 $133,105 1 All penalties against States were for failure to meet the two-parent family rate. The territories sometimes were penalized for failing the all-family rate. 2Puerto Rico and the Virgin Islands for failure to meet all-family work rate, Guam for failure to meet both rates. 3The Virgin Islands for failure to meet the all-family rate, Guam for failure to meet both rates. 4 Penalty waived because below threshold amount ($500). 5 Includes two jurisdictions that failed their corrective compliance plan. Source: U.S. Department of Health and Human Services, table prepared by the Congressional Research Service.
Work or job preparation activities. – Tables 7-25 and 7-26 provide data on
official work participation rates. They show the number of TANF adults who engaged in one of 12 work activities listed in the law for the required hours and hence, were counted in calculating the State’s work participation rate. A broader measure of work and work-related activity is shown in the next two Tables, namely, the proportion of adults reported to be engaged in some form of work or job preparation activity at least one hour weekly. As Table 7-27 shows, by this measure work activity has increased under TANF from that reported under AFDC. The percent of AFDC/TANF adults who were employed, engaged in subsidized work, engaged in job search, or engaged in educational activities rose in each category from fiscal year 1994 through 2001. Especially sharp gains are shown for actual employment; the rates of unsubsidized and subsidized employment each tripled during this period. The rate of job search rose 50 percent. Table 7-28 provides this information by State for FY 2001. The categories for reporting activities were different under AFDC than they are under TANF; categories were collapsed to
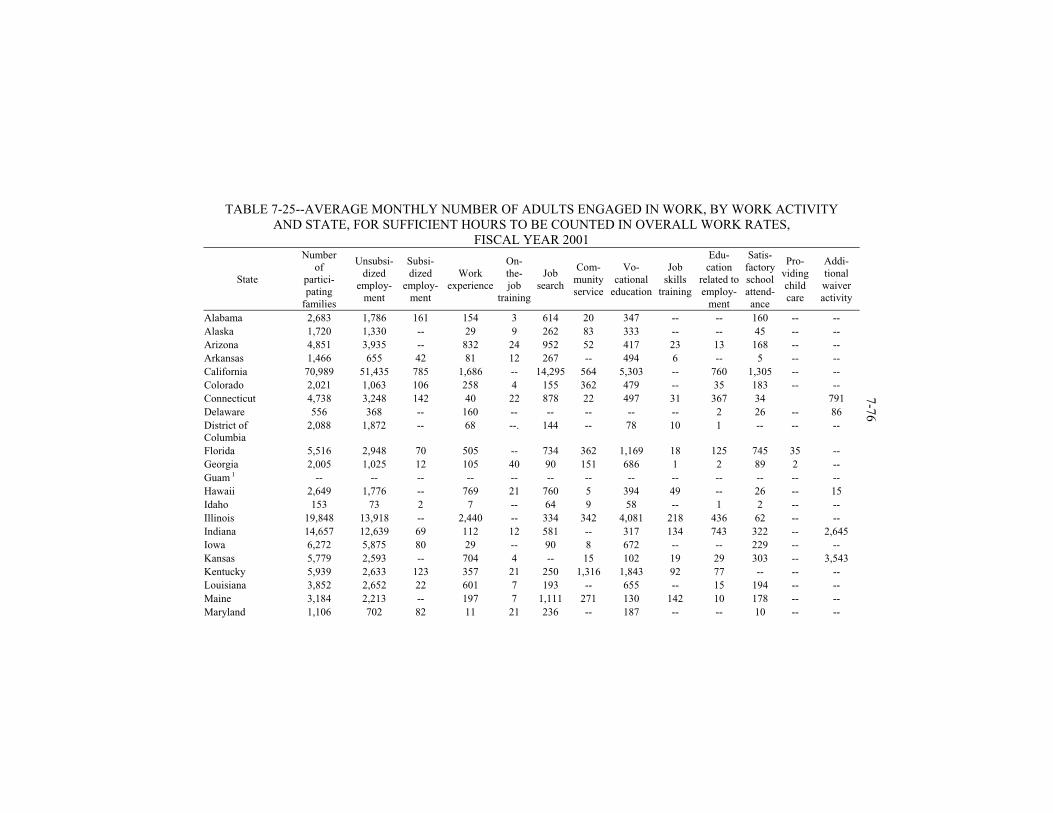
TABLE 7-25--AVERAGE MONTHLY NUMBER OF ADULTS ENGAGED IN WORK, BY WORK ACTIVITY AND STATE, FOR SUFFICIENT HOURS TO BE COUNTED IN OVERALL WORK RATES,
FISCAL YEAR 2001
State
Number of
partici- pating
families
Unsubsi-dized
employ-ment
Subsi- dized
employ-ment
Work experience
On- the- job
training
Job search
Com- munity service
Vo- cational
education
Job skills
training
Edu- cation
related to employ-
ment
Satis- factory school attend-ance
Pro- viding child care
Addi- tional waiver activity
Alabama 2,683 1,786 161 154 3 614 20 347 -- -- 160 -- -- Alaska 1,720 1,330 -- 29 9 262 83 333 -- -- 45 -- -- Arizona 4,851 3,935 -- 832 24 952 52 417 23 13 168 -- -- Arkansas 1,466 655 42 81 12 267 -- 494 6 -- 5 -- -- California 70,989 51,435 785 1,686 -- 14,295 564 5,303 -- 760 1,305 -- -- Colorado 2,021 1,063 106 258 4 155 362 479 -- 35 183 -- -- Connecticut 4,738 3,248 142 40 22 878 22 497 31 367 34 791 Delaware 556 368 -- 160 -- -- -- -- -- 2 26 -- 86 District of Columbia
2,088 1,872 -- 68 --. 144 -- 78 10 1 -- -- --
Florida 5,516 2,948 70 505 -- 734 362 1,169 18 125 745 35 -- Georgia 2,005 1,025 12 105 40 90 151 686 1 2 89 2 -- Guam 1 -- -- -- -- -- -- -- -- -- -- -- -- -- Hawaii 2,649 1,776 -- 769 21 760 5 394 49 -- 26 -- 15 Idaho 153 73 2 7 -- 64 9 58 -- 1 2 -- -- Illinois 19,848 13,918 -- 2,440 -- 334 342 4,081 218 436 62 -- -- Indiana 14,657 12,639 69 112 12 581 -- 317 134 743 322 -- 2,645 Iowa 6,272 5,875 80 29 -- 90 8 672 -- -- 229 -- -- Kansas 5,779 2,593 -- 704 4 -- 15 102 19 29 303 -- 3,543 Kentucky 5,939 2,633 123 357 21 250 1,316 1,843 92 77 -- -- -- Louisiana 3,852 2,652 22 601 7 193 -- 655 -- 15 194 -- -- Maine 3,184 2,213 -- 197 7 1,111 271 130 142 10 178 -- -- Maryland 1,106 702 82 11 21 236 -- 187 -- -- 10 -- --
7-76

TABLE 7-25--AVERAGE MONTHLY NUMBER OF ADULTS ENGAGED IN WORK, BY WORK ACTIVITY
AND STATE, FOR SUFFICIENT HOURS TO BE COUNTED IN OVERALL WORK RATES, FISCAL YEAR 2001- continued
State
Number of
partici- pating
families
Unsubsi- dized
employ- ment
Subsi- dized
employ-ment
Work experience
On- the- job
training
Job search
Com- munity service
Vo- cational
education
Job skills
training
Edu- cation
related to employ-
ment
Satis- factory school attend-ance
Pro- viding child care
Addi- tional waiver
activity
Massachusetts 4,767 2,778 167 -- -- 495 157 149 561 78 693 6 -- Michigan 12,820 11,881 1 3 8 1,200 1 164 13 15 354 -- -- Minnesota 8,403 5,026 -- 9 -- 2,361 24 658 10 326 1,760 1 1,001 Mississippi 1,174 792 -- 129 -- 123 102 117 -- 6 36 -- -- Missouri 9,338 5,862 -- 291 17 528 -- 2,644 -- 599 208 -- -- Montana 1,641 276 -- 1,361 -- 172 -- 39 -- -- 9 -- 1,035 Nebraska 920 341 -- 6 3 159 -- 145 -- -- 225 -- 114 Nevada 1,180 957 -- -- -- 298 49 139 13 -- 20 -- -- New Hampshire 1,039 567 -- 35 3 471 -- 62 147 -- 124 -- 169 New Jersey 10,037 4,359 -- 4,194 17 1,313 19 2,459 421 1,508 173 5 -- New Mexico 5,870 4,613 81 235 61 345 461 702 190 221 52 40 11 New York 56,678 40,194 271 4,856 -- 1,515 9,000 3,310 120 -- 116 -- -- North Carolina 4,131 2,898 81 216 -- 608 16 957 17 53 162 -- -- North Dakota 493 288 -- 71 -- 70 4 118 1 23 20 -- -- Ohio 23,163 10,758 6 9,408 -- 1,584 -- 5,338 206 22 1,782 -- -- Oklahoma 1,337 780 4 27 32 351 -- 143 33 109 68 -- -- Oregon 6,481 944 185 490 9 2,442 64 -- 501 456 223 -- 6,114 Pennsylvania. 5,368 4,910 -- 709 1 382 26 36 210 107 -- -- -- Puerto. Rico 1,507 216 234 93 19 360 342 278 11 -- 12 7 -- Rhode Island 2,763 2,082 36 111 2 143 -- 382 -- 182 114 -- -- South Carolina 2,852 1,881 -- 45 10 274 -- 447 36 -- 247 -- 500 South Dakota 413 120 -- -- 20 37 231 45 -- 31 15 6 --
7-77
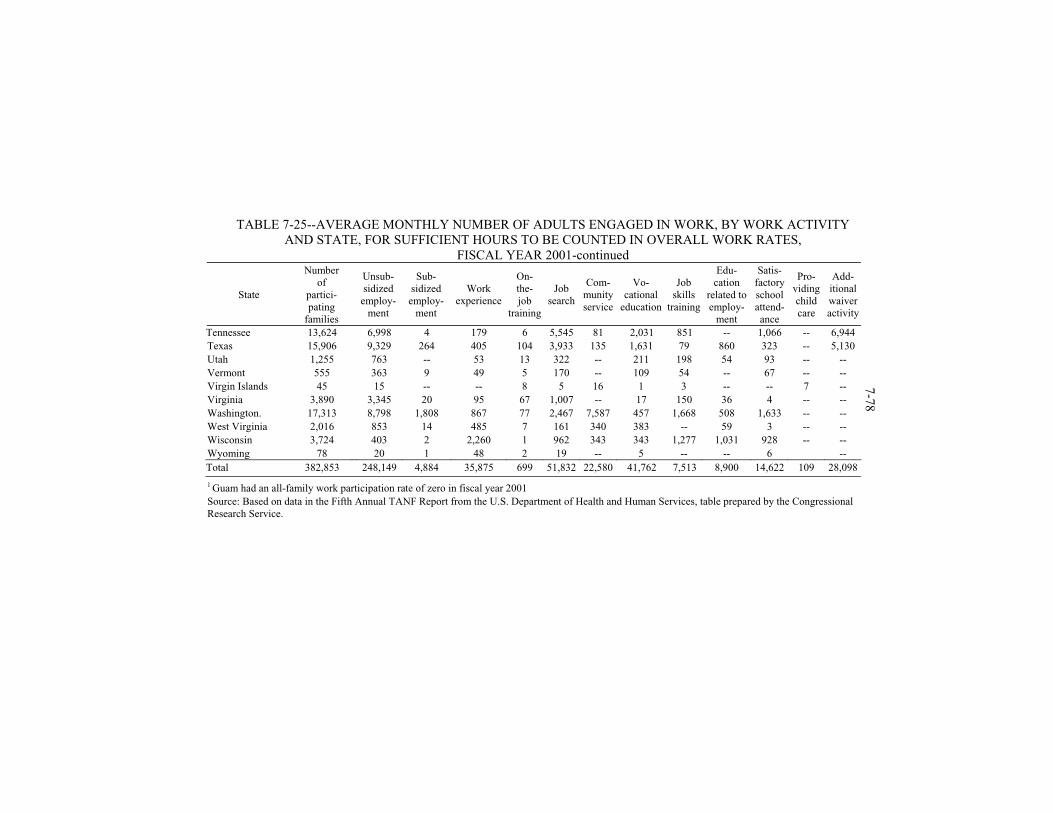
TABLE 7-25--AVERAGE MONTHLY NUMBER OF ADULTS ENGAGED IN WORK, BY WORK ACTIVITY
AND STATE, FOR SUFFICIENT HOURS TO BE COUNTED IN OVERALL WORK RATES, FISCAL YEAR 2001-continued
State
Number of
partici- pating
families
Unsub- sidized employ-
ment
Sub- sidized employ-
ment
Work experience
On- the- job
training
Job search
Com- munity service
Vo- cational
education
Job skills
training
Edu- cation
related to employ-
ment
Satis- factory school attend-ance
Pro- viding child care
Add- itional waiveractivity
Tennessee 13,624 6,998 4 179 6 5,545 81 2,031 851 -- 1,066 -- 6,944
Texas 15,906 9,329 264 405 104 3,933 135 1,631 79 860 323 -- 5,130 Utah 1,255 763 -- 53 13 322 -- 211 198 54 93 -- -- Vermont 555 363 9 49 5 170 -- 109 54 -- 67 -- -- Virgin Islands 45 15 -- -- 8 5 16 1 3 -- -- 7 -- Virginia 3,890 3,345 20 95 67 1,007 -- 17 150 36 4 -- -- Washington. 17,313 8,798 1,808 867 77 2,467 7,587 457 1,668 508 1,633 -- -- West Virginia 2,016 853 14 485 7 161 340 383 -- 59 3 -- -- Wisconsin 3,724 403 2 2,260 1 962 343 343 1,277 1,031 928 -- -- Wyoming 78 20 1 48 2 19 -- 5 -- -- 6 --
7-78
Total 382,853 248,149 4,884 35,875 699 51,832 22,580 41,762 7,513 8,900 14,622 109 28,098
1 Guam had an all-family work participation rate of zero in fiscal year 2001 Source: Based on data in the Fifth Annual TANF Report from the U.S. Department of Health and Human Services, table prepared by the Congressional Research Service.
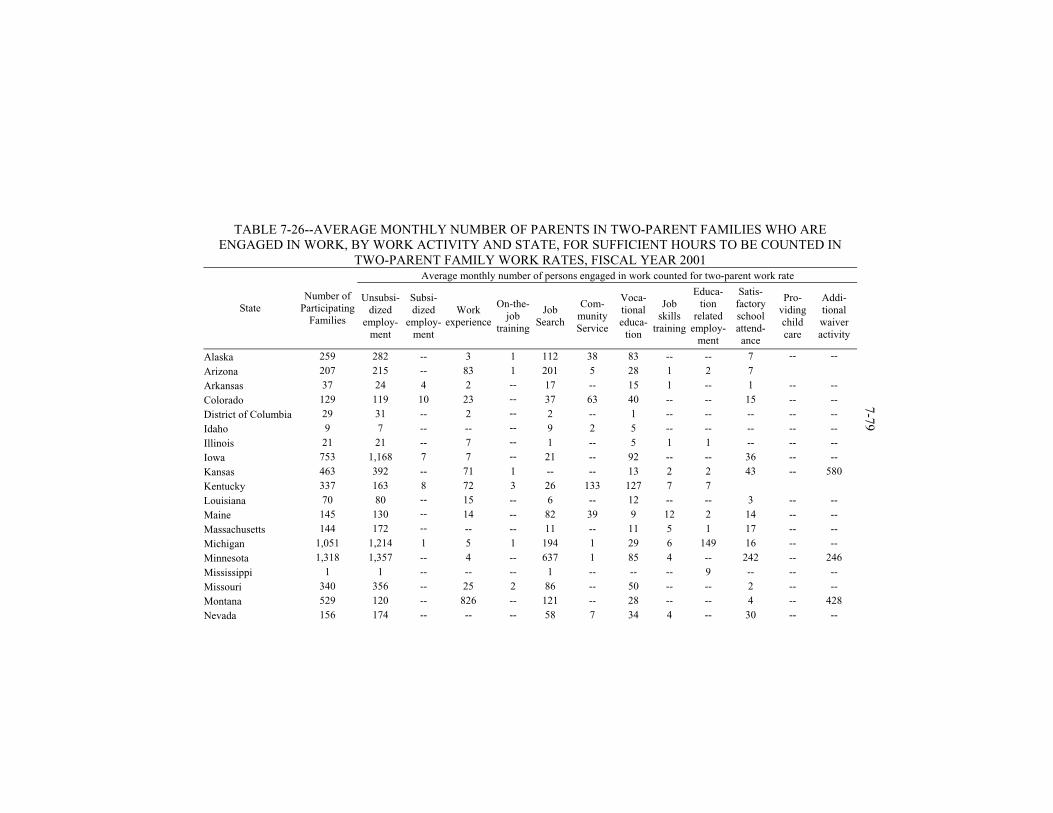
TABLE 7-26--AVERAGE MONTHLY NUMBER OF PARENTS IN TWO-PARENT FAMILIES WHO ARE ENGAGED IN WORK, BY WORK ACTIVITY AND STATE, FOR SUFFICIENT HOURS TO BE COUNTED IN
TWO-PARENT FAMILY WORK RATES, FISCAL YEAR 2001 Average monthly number of persons engaged in work counted for two-parent work rate
State Number of
Participating Families
Unsubsi-dized
employ-ment
Subsi-dized
employ-ment
Work experience
On-the-job
training
Job Search
Com-munity Service
Voca-tional educa-
tion
Job skills
training
Educa-tion
related employ-
ment
Satis-factory school attend-ance
Pro-viding child care
Addi-tional waiver activity
Alaska 259 282 -- 3 1 112 38 83 -- -- 7 -- --
Arizona 207 215 -- 83 1 201 5 28 1 2 7
Arkansas 37 24 4 2 -- 17 -- 15 1 -- 1 -- --
Colorado 129 119 10 23 -- 37 63 40 -- -- 15 -- --
District of Columbia 29 31 -- 2 -- 2 -- 1 -- -- -- -- --
Idaho 9 7 -- -- -- 9 2 5 -- -- -- -- --
Illinois 21 21 -- 7 -- 1 -- 5 1 1 -- -- --
Iowa 753 1,168 7 7 -- 21 -- 92 -- -- 36 -- --
Kansas 463 392 -- 71 1 -- -- 13 2 2 43 -- 580
Kentucky 337 163 8 72 3 26 133 127 7 7
Louisiana 70 80 -- 15 -- 6 -- 12 -- -- 3 -- --
Maine 145 130 -- 14 -- 82 39 9 12 2 14 -- --
Massachusetts 144 172 -- -- -- 11 -- 11 5 1 17 -- --
Michigan 1,051 1,214 1 5 1 194 1 29 6 149 16 -- --
Minnesota 1,318 1,357 -- 4 -- 637 1 85 4 -- 242 -- 246
Mississippi 1 1 -- -- -- 1 -- -- -- 9 -- -- --
Missouri 340 356 -- 25 2 86 -- 50 -- -- 2 -- --
Montana 529 120 -- 826 -- 121 -- 28 -- -- 4 -- 428
Nevada 156 174 -- -- -- 58 7 34 4 -- 30 -- --
7-79
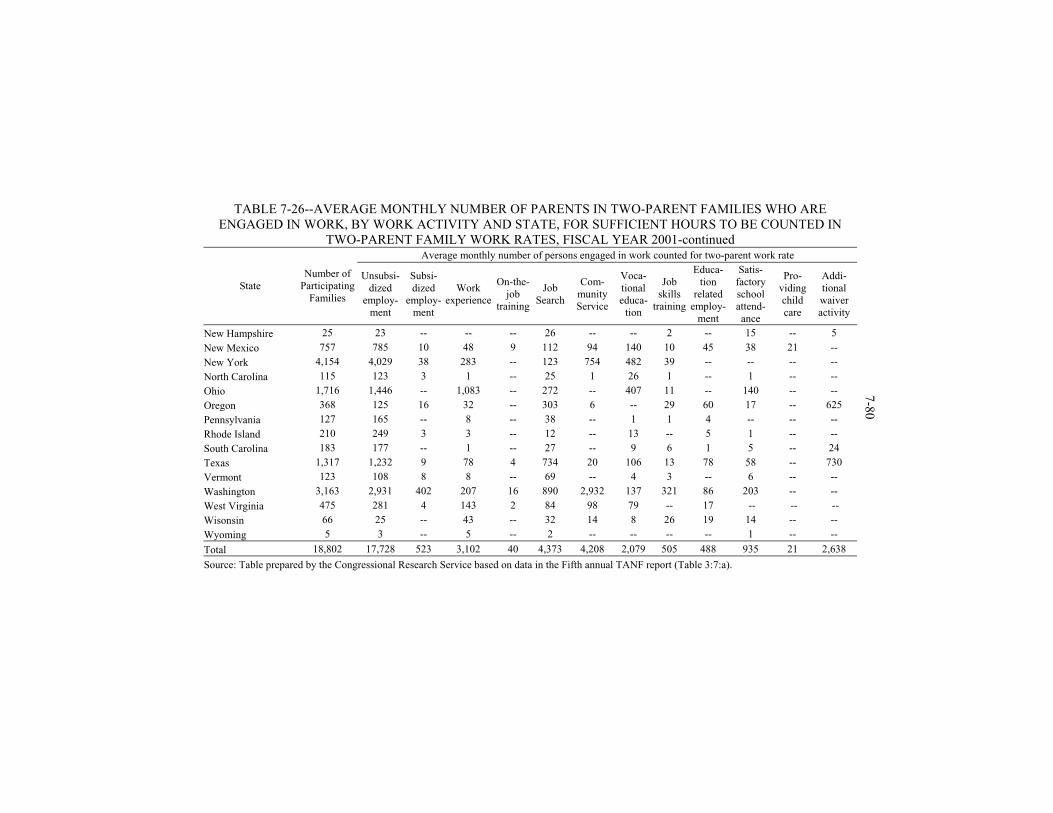
TABLE 7-26--AVERAGE MONTHLY NUMBER OF PARENTS IN TWO-PARENT FAMILIES WHO ARE ENGAGED IN WORK, BY WORK ACTIVITY AND STATE, FOR SUFFICIENT HOURS TO BE COUNTED IN
TWO-PARENT FAMILY WORK RATES, FISCAL YEAR 2001-continued Average monthly number of persons engaged in work counted for two-parent work rate
State Number of
ParticipatingFamilies
Unsubsi-dized
employ-ment
Subsi-dized
employ-ment
Work experience
On-the-job
training
Job Search
Com-munity Service
Voca-tional educa-
tion
Job skills
training
Educa-tion
related employ-
ment
Satis-factory school attend-ance
Pro-viding child care
Addi-tional waiver activity
New Hampshire 25 23 -- -- -- 26 -- -- 2 -- 15 -- 5
New Mexico 757 785 10 48 9 112 94 140 10 45 38 21 --
New York 4,154 4,029 38 283 -- 123 754 482 39 -- -- -- --
North Carolina 115 123 3 1 -- 25 1 26 1 -- 1 -- --
Ohio 1,716 1,446 -- 1,083 -- 272 -- 407 11 -- 140 -- -- Oregon 368 125 16 32 -- 303 6 -- 29 60 17 -- 625
Pennsylvania 127 165 -- 8 -- 38 -- 1 1 4 -- -- --
Rhode Island 210 249 3 3 -- 12 -- 13 -- 5 1 -- --
South Carolina 183 177 -- 1 -- 27 -- 9 6 1 5 -- 24
Texas 1,317 1,232 9 78 4 734 20 106 13 78 58 -- 730
Vermont 123 108 8 8 -- 69 -- 4 3 -- 6 -- --
Washington 3,163 2,931 402 207 16 890 2,932 137 321 86 203 -- --
West Virginia 475 281 4 143 2 84 98 79 -- 17 -- -- --
Wisonsin 66 25 -- 43 -- 32 14 8 26 19 14 -- --
Wyoming 5 3 -- 5 -- 2 -- -- -- -- 1 -- --
Total 18,802 17,728 523 3,102 40 4,373 4,208 2,079 505 488 935 21 2,638
Source: Table prepared by the Congressional Research Service based on data in the Fifth annual TANF report (Table 3:7:a).
7-80
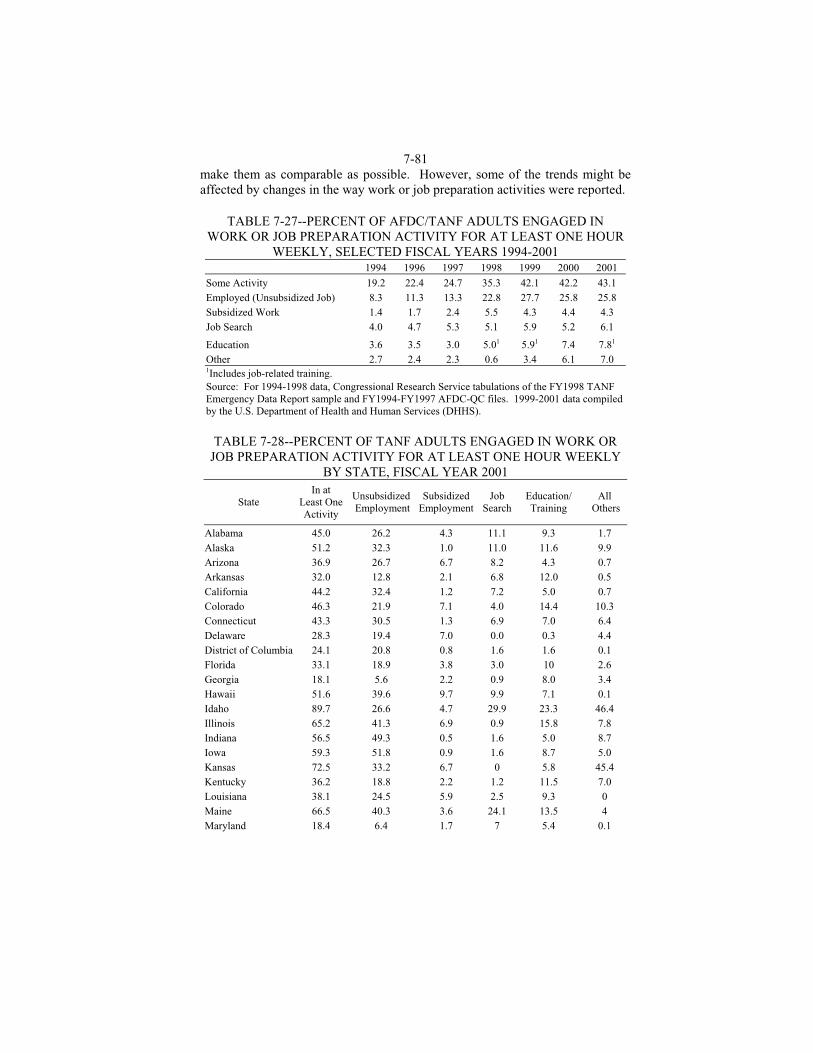
7-81 make them as comparable as possible. However, some of the trends might be affected by changes in the way work or job preparation activities were reported.
TABLE 7-27--PERCENT OF AFDC/TANF ADULTS ENGAGED IN
WORK OR JOB PREPARATION ACTIVITY FOR AT LEAST ONE HOUR WEEKLY, SELECTED FISCAL YEARS 1994-2001
1994 1996 1997 1998 1999 2000 2001
Some Activity 19.2 22.4 24.7 35.3 42.1 42.2 43.1 Employed (Unsubsidized Job) 8.3 11.3 13.3 22.8 27.7 25.8 25.8 Subsidized Work 1.4 1.7 2.4 5.5 4.3 4.4 4.3 Job Search 4.0 4.7 5.3 5.1 5.9 5.2 6.1
Education 3.6 3.5 3.0 5.01 5.91 7.4 7.81 Other 2.7 2.4 2.3 0.6 3.4 6.1 7.0 1Includes job-related training. Source: For 1994-1998 data, Congressional Research Service tabulations of the FY1998 TANF Emergency Data Report sample and FY1994-FY1997 AFDC-QC files. 1999-2001 data compiled by the U.S. Department of Health and Human Services (DHHS).
TABLE 7-28--PERCENT OF TANF ADULTS ENGAGED IN WORK OR
JOB PREPARATION ACTIVITY FOR AT LEAST ONE HOUR WEEKLY BY STATE, FISCAL YEAR 2001
State In at
Least One Activity
Unsubsidized Employment
Subsidized Employment
Job Search
Education/Training
All Others
Alabama 45.0 26.2 4.3 11.1 9.3 1.7 Alaska 51.2 32.3 1.0 11.0 11.6 9.9 Arizona 36.9 26.7 6.7 8.2 4.3 0.7 Arkansas 32.0 12.8 2.1 6.8 12.0 0.5 California 44.2 32.4 1.2 7.2 5.0 0.7 Colorado 46.3 21.9 7.1 4.0 14.4 10.3 Connecticut 43.3 30.5 1.3 6.9 7.0 6.4 Delaware 28.3 19.4 7.0 0.0 0.3 4.4 District of Columbia 24.1 20.8 0.8 1.6 1.6 0.1 Florida 33.1 18.9 3.8 3.0 10 2.6 Georgia 18.1 5.6 2.2 0.9 8.0 3.4 Hawaii 51.6 39.6 9.7 9.9 7.1 0.1 Idaho 89.7 26.6 4.7 29.9 23.3 46.4 Illinois 65.2 41.3 6.9 0.9 15.8 7.8 Indiana 56.5 49.3 0.5 1.6 5.0 8.7 Iowa 59.3 51.8 0.9 1.6 8.7 5.0 Kansas 72.5 33.2 6.7 0 5.8 45.4 Kentucky 36.2 18.8 2.2 1.2 11.5 7.0 Louisiana 38.1 24.5 5.9 2.5 9.3 0 Maine 66.5 40.3 3.6 24.1 13.5 4 Maryland 18.4 6.4 1.7 7 5.4 0.1
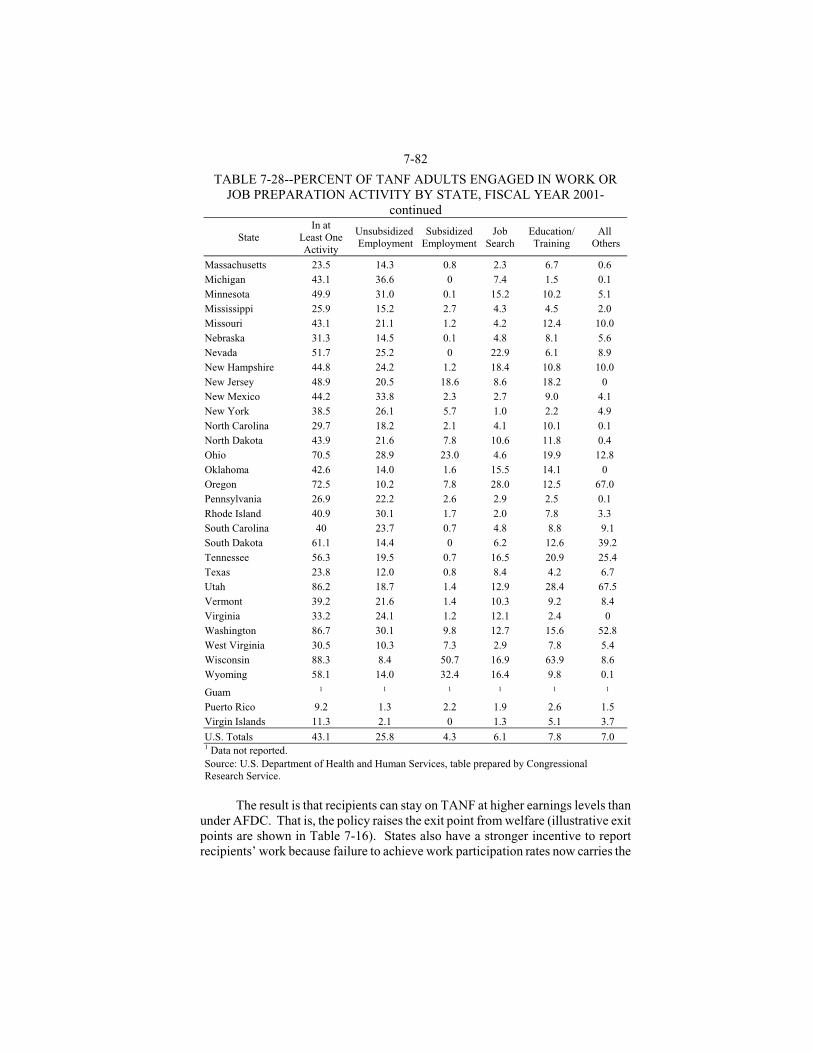
7-82
TABLE 7-28--PERCENT OF TANF ADULTS ENGAGED IN WORK OR JOB PREPARATION ACTIVITY BY STATE, FISCAL YEAR 2001-
continued
State In at
Least One Activity
Unsubsidized Employment
Subsidized Employment
Job Search
Education/Training
All Others
Massachusetts 23.5 14.3 0.8 2.3 6.7 0.6 Michigan 43.1 36.6 0 7.4 1.5 0.1 Minnesota 49.9 31.0 0.1 15.2 10.2 5.1 Mississippi 25.9 15.2 2.7 4.3 4.5 2.0 Missouri 43.1 21.1 1.2 4.2 12.4 10.0 Nebraska 31.3 14.5 0.1 4.8 8.1 5.6 Nevada 51.7 25.2 0 22.9 6.1 8.9 New Hampshire 44.8 24.2 1.2 18.4 10.8 10.0 New Jersey 48.9 20.5 18.6 8.6 18.2 0 New Mexico 44.2 33.8 2.3 2.7 9.0 4.1 New York 38.5 26.1 5.7 1.0 2.2 4.9 North Carolina 29.7 18.2 2.1 4.1 10.1 0.1 North Dakota 43.9 21.6 7.8 10.6 11.8 0.4 Ohio 70.5 28.9 23.0 4.6 19.9 12.8 Oklahoma 42.6 14.0 1.6 15.5 14.1 0 Oregon 72.5 10.2 7.8 28.0 12.5 67.0 Pennsylvania 26.9 22.2 2.6 2.9 2.5 0.1 Rhode Island 40.9 30.1 1.7 2.0 7.8 3.3 South Carolina 40 23.7 0.7 4.8 8.8 9.1 South Dakota 61.1 14.4 0 6.2 12.6 39.2 Tennessee 56.3 19.5 0.7 16.5 20.9 25.4 Texas 23.8 12.0 0.8 8.4 4.2 6.7 Utah 86.2 18.7 1.4 12.9 28.4 67.5 Vermont 39.2 21.6 1.4 10.3 9.2 8.4 Virginia 33.2 24.1 1.2 12.1 2.4 0 Washington 86.7 30.1 9.8 12.7 15.6 52.8 West Virginia 30.5 10.3 7.3 2.9 7.8 5.4 Wisconsin 88.3 8.4 50.7 16.9 63.9 8.6 Wyoming 58.1 14.0 32.4 16.4 9.8 0.1
Guam 1 1 1 1 1 1 Puerto Rico 9.2 1.3 2.2 1.9 2.6 1.5 Virgin Islands 11.3 2.1 0 1.3 5.1 3.7
U.S. Totals 43.1 25.8 4.3 6.1 7.8 7.0 1 Data not reported. Source: U.S. Department of Health and Human Services, table prepared by Congressional Research Service.
The result is that recipients can stay on TANF at higher earnings levels than
under AFDC. That is, the policy raises the exit point from welfare (illustrative exit points are shown in Table 7-16). States also have a stronger incentive to report recipients’ work because failure to achieve work participation rates now carries the
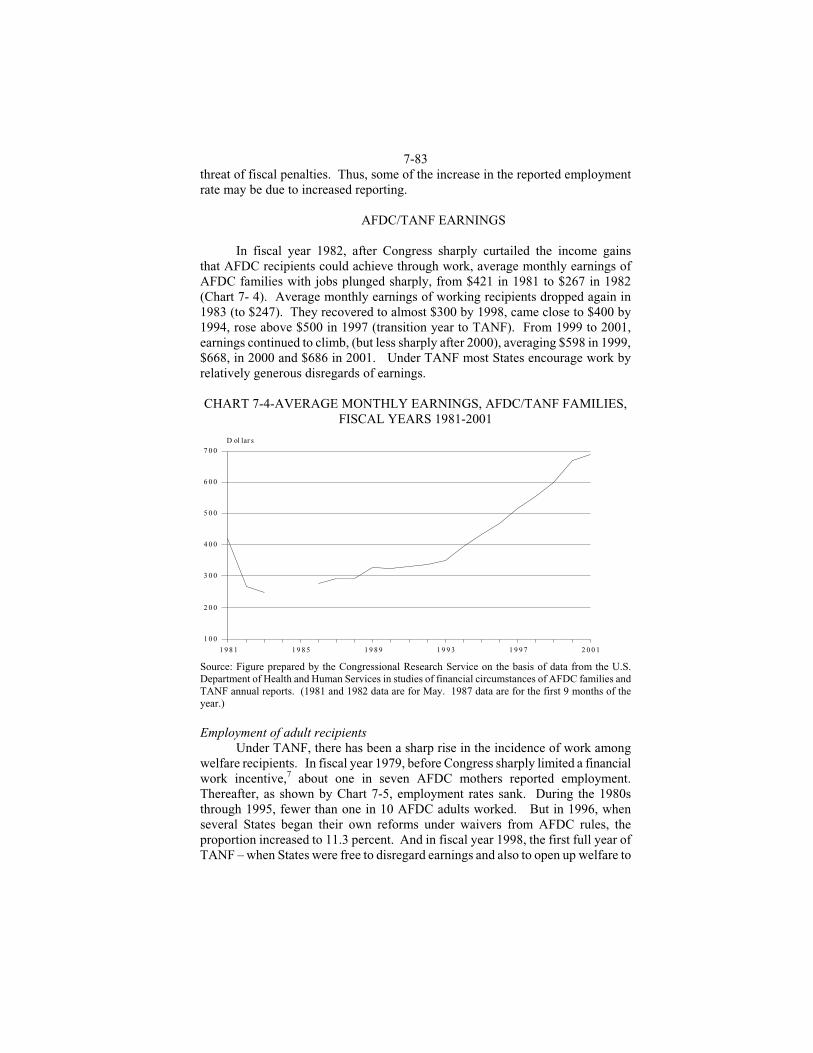
7-83 threat of fiscal penalties. Thus, some of the increase in the reported employment rate may be due to increased reporting.
AFDC/TANF EARNINGS
In fiscal year 1982, after Congress sharply curtailed the income gains
that AFDC recipients could achieve through work, average monthly earnings of AFDC families with jobs plunged sharply, from $421 in 1981 to $267 in 1982 (Chart 7- 4). Average monthly earnings of working recipients dropped again in 1983 (to $247). They recovered to almost $300 by 1998, came close to $400 by 1994, rose above $500 in 1997 (transition year to TANF). From 1999 to 2001, earnings continued to climb, (but less sharply after 2000), averaging $598 in 1999, $668, in 2000 and $686 in 2001. Under TANF most States encourage work by relatively generous disregards of earnings.
CHART 7-4-AVERAGE MONTHLY EARNINGS, AFDC/TANF FAMILIES,
FISCAL YEARS 1981-2001
1 9 8 1 1 9 8 5 1 9 8 9 1 9 9 3 1 9 9 7 2 0 0 1
1 0 0
2 0 0
3 0 0
4 0 0
5 0 0
6 0 0
7 0 0D ol lar s
Source: Figure prepared by the Congressional Research Service on the basis of data from the U.S. Department of Health and Human Services in studies of financial circumstances of AFDC families and TANF annual reports. (1981 and 1982 data are for May. 1987 data are for the first 9 months of the year.)
Employment of adult recipients Under TANF, there has been a sharp rise in the incidence of work among welfare recipients. In fiscal year 1979, before Congress sharply limited a financial work incentive,7 about one in seven AFDC mothers reported employment. Thereafter, as shown by Chart 7-5, employment rates sank. During the 1980s through 1995, fewer than one in 10 AFDC adults worked. But in 1996, when several States began their own reforms under waivers from AFDC rules, the proportion increased to 11.3 percent. And in fiscal year 1998, the first full year of TANF – when States were free to disregard earnings and also to open up welfare to
7-84 fathers with full-time jobs – the share jumped sharply. That year 22.8 percent of all TANF adults were reported to be employed in unsubsidized jobs at least one hour weekly. In fiscal year 1999, the percent climbed higher, to 27.7. In fiscal years 2000-2001, the national average rate slipped to 25.8 percent. (The drop can be attributed, in part, to the movement of some two-parent families, who have relatively high employment rates, into separate State programs. This occurred in California and some other States). However, in 4 States more than 40 percent of adults engaged in unsubsidized work for at least one week during fiscal year 2001: Illinois, 41.3 percent; Indiana, 49.3 percent; Iowa, 51.8 percent; and Maine, 40.3 percent (Table 7- 28). As noted before, the employment measures in Chart 7-4 and Tables 27 and 28 differ from official work participation rates of TANF law. To be counted as a TANF work participant in fiscal year 2001, an adult recipient without a child under age 6 had to work an average of 30 hours weekly (more in a two-parent family). However, about half of the caseload (single parents with preschoolers) was required to work only 20 hours weekly. In fiscal year 2001, TANF adults with unsubsidized jobs averaged 29 hours of work weekly, (Fifth annual TANF report, Table 3:5).
Under TANF, both recipients and States have a greater incentive to report work than they did under AFDC. Widespread adoption of more generous treatment of earnings permits recipients to keep more of their benefits as earnings increase, and States face penalties unless they achieve work participation standards.
Official TANF statistics provide no information about an important source of potential income for parents who combine TANF with earnings, the Earned Income Credit (EIC). In tax year 2001, a family with one child could earn an EIC of up to $2,428; a family with two or more children could earn a credit up of to $4,008, and, in 11 States working families also could receive a refundable State EIC. Further, according to DHHS, Medicaid and food stamps were received in FY2001 by 98.9 percent and 80.9 percent of TANF families, respectively (Fifth annual TANF report, U.S. DHHS [2003], Table 10:13).
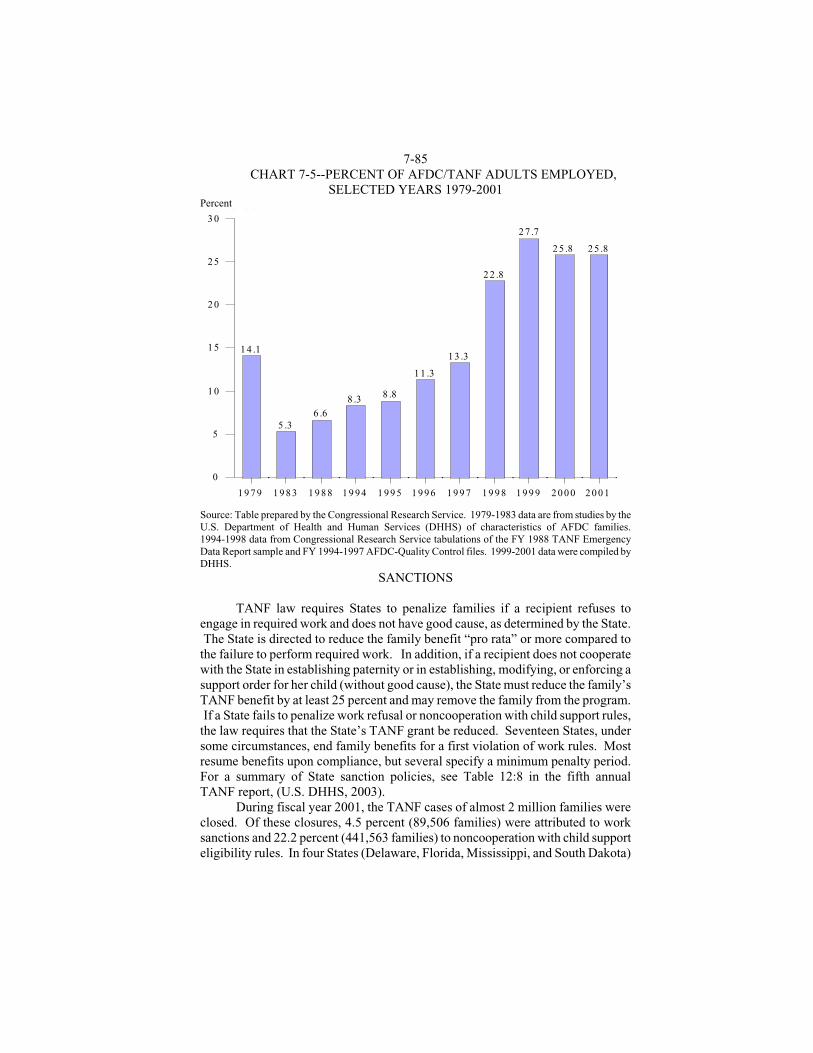
7-85 CHART 7-5--PERCENT OF AFDC/TANF ADULTS EMPLOYED,
SELECTED YEARS 1979-2001 Percent
1 4 .1
5 .36 .6
8 .3 8 .8
1 1 .3
1 3 .3
2 2 .8
2 7 .7
2 5 .8 2 5 .8
1 9 7 9 1 9 8 3 1 9 8 8 1 9 9 4 1 99 5 1 99 6 1 9 9 7 1 9 9 8 1 9 9 9 2 0 0 0 2 0 0 1
0
5
1 0
1 5
2 0
2 5
3 0e ce t
Source: Table prepared by the Congressional Research Service. 1979-1983 data are from studies by the U.S. Department of Health and Human Services (DHHS) of characteristics of AFDC families. 1994-1998 data from Congressional Research Service tabulations of the FY 1988 TANF Emergency Data Report sample and FY 1994-1997 AFDC-Quality Control files. 1999-2001 data were compiled by DHHS.
SANCTIONS
TANF law requires States to penalize families if a recipient refuses to engage in required work and does not have good cause, as determined by the State. The State is directed to reduce the family benefit “pro rata” or more compared to the failure to perform required work. In addition, if a recipient does not cooperate with the State in establishing paternity or in establishing, modifying, or enforcing a support order for her child (without good cause), the State must reduce the family’s TANF benefit by at least 25 percent and may remove the family from the program. If a State fails to penalize work refusal or noncooperation with child support rules, the law requires that the State’s TANF grant be reduced. Seventeen States, under some circumstances, end family benefits for a first violation of work rules. Most resume benefits upon compliance, but several specify a minimum penalty period. For a summary of State sanction policies, see Table 12:8 in the fifth annual TANF report, (U.S. DHHS, 2003).
During fiscal year 2001, the TANF cases of almost 2 million families were closed. Of these closures, 4.5 percent (89,506 families) were attributed to work sanctions and 22.2 percent (441,563 families) to noncooperation with child support eligibility rules. In four States (Delaware, Florida, Mississippi, and South Dakota)
7-86 work violations accounted for more than 20 percent of case closures.
A DHHS-funded review of sanction policies concluded that research of the incidence of sanctions can be “extremely confusing” to interpret because of methodological differences (Pavetti, Derr, and Hesketh, 2003). However, it said that two studies that compared sanctioning over a period of time for a cohort of recipients or new applicants produced similar rates of work-related sanctions – 45 and 52 percent. The review said less information is available about the duration of sanctions. One study found that two-thirds of sanctioned persons cured their sanction within three months.
TANF EXITS AND RETURNS
Under AFDC, movement on and off the family cash welfare rolls was
frequent. Within 1 year of their exit, 45 percent of ex-recipients returned to the program; within 2 years, 58 percent; within 4 years, 69 percent. Those who left AFDC because of employment remained off the program somewhat longer than those who left for other reasons. (For a discussion of welfare dynamics under AFDC, see the 2000 Green Book.)
Under TANF the percentage of returnees to welfare has decreased (even before the Federal time limit might prevent their return). A synthesis of 15 DHHS-funded studies found that from 11 percent to 25 percent of (1996-1999) TANF leavers were back on the rolls one year after their exit. Because some persons returned to the rolls and then left again, the proportion that ever returned within the first year after exit was higher, ranging from 17 percent to 38 percent (Acs and Loprest, 2002). At least one-half of those who returned to TANF did so for a job-related cause, such as job loss or decreases in work hours or wages. Other common reasons for return included divorce or separation, pregnancy or birth of a new child, re-compliance with program regulations, loss of other income, problems with child care and with health after exit.
An Urban Institute study, using data from 1997 and 1999 rounds of the National Survey of America’s Families (NSAF), found that about 22 percent of all U.S. families that left welfare between 1997 and 1999 had returned by 1999 (Loprest, 2002). At any point within a year, return rates were higher, indicating some cycling on and off TANF, although the 22 percent return rate after 2 years is significantly below the comparable 58 percent rate under AFDC. The NSAF survey data reported that return rates were above average for leavers who were non-white, never-married, without high school diploma, with poor work history (last worked 3 or more years earlier), or in poor mental or physical health. It said that the most common reason for their original exit from welfare among all leavers (51 percent) was obtaining a job or an increase in earnings. Other reasons included failure to follow program rules (13 percent), and increase in other income, no desire/need for TANF (13 percent).
7-87 CHARACTERISTICS OF AFDC/TANF FAMILIES
COMPOSITION OF FAMILIES, 1969-2001
Since 1969, the proportion of welfare families with no adult recipient
(child-only families) more than tripled (to 37.2 percent in fiscal year 2001), and the average size of families declined by more than one-third, to 2.6 persons (Table 7-29). The share of AFDC/TANF recipients who are teenage parents dropped from 2.4 percent in 1994 to 1.6 percent in 1998, but rose to 2.3 percent in 2001. The fiscal year 1994 column shows circumstances when AFDC was at its historic peak. The 1998 column of the Table shows circumstances in the first full year of TANF. The number of child-only families fell from 978,000 in 1996 to 743,000 in 1998 and thereafter turned upward, reaching 786,932 in fiscal year 2001. From 1998 onward, the proportion of TANF cases with no adult recipient rose yearly, reaching 37.2 percent in fiscal year 2001.
Table 7-29 also shows that the share of AFDC/TANF families with two or more adults (3.5 percent in fiscal year 2001) was below that of fiscal years 1994 (8.3 percent). Under AFDC, a two-parent family could be served only if the second parent was disabled or unemployed (defined as working fewer than 100 hours monthly) and had a work history. TANF ended those rules, and most States have used their new discretion to base two-parent eligibility on income, a change that increased potential caseloads. However, the reported trend in two-adult TANF families is affected by State decisions to place these families in separate State programs (SSPs) outside of TANF and free of TANF work rules. If the estimated number of two-parent families served in FY 2001 by the biggest separate State program (California) were included, the proportion of all TANF and SSP families with two adults would rise above 5.5 percent. By the start of FY2001, 25 States were operating SSPs, and in 11 of them, married parents predominated (Table 7-8). As noted earlier, several States were penalized in fiscal years 1997-2000 for failure to meet work participation rates for two-parent families in the regular TANF program (Table 7-24).
MARITAL STATUS OF PARENTS
In fiscal year 1996, the last full year of AFDC, the marital status of their
parents was inferred for about 8.5 million recipient children (data were missing or unclear for about 0.2 million other children). Data were collected to show reasons for children’s loss of parental support. The data showed that, in all, 5.1 million children (60.4 percent of the children with parental marital data) were living with a single parent who had not married the second parent; 2.2 million (25.1 percent) were with a parent who was divorced or separated, or separated but not legally. Another 1.1 million (12.9 percent) were in two-parent families (and presumed married); finally, 140,000 children (1.6 percent) were living with a widowed parent (Data from U.S. Department of Health and Human Services, Characteristics and Financial Circumstances of AFDC Families, Fiscal Year 1996).
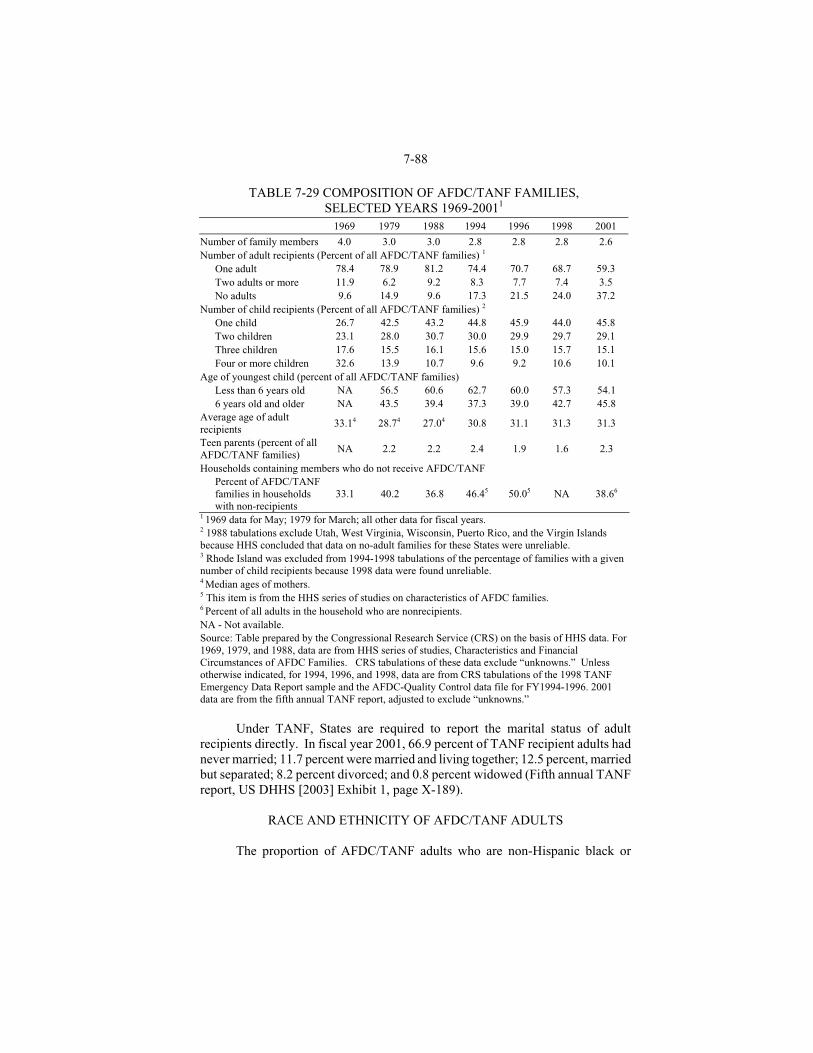
7-88
TABLE 7-29 COMPOSITION OF AFDC/TANF FAMILIES, SELECTED YEARS 1969-20011
1969 1979 1988 1994 1996 1998 2001
Number of family members 4.0 3.0 3.0 2.8 2.8 2.8 2.6 Number of adult recipients (Percent of all AFDC/TANF families) 1
One adult 78.4 78.9 81.2 74.4 70.7 68.7 59.3 Two adults or more 11.9 6.2 9.2 8.3 7.7 7.4 3.5 No adults 9.6 14.9 9.6 17.3 21.5 24.0 37.2
Number of child recipients (Percent of all AFDC/TANF families) 2 One child 26.7 42.5 43.2 44.8 45.9 44.0 45.8 Two children 23.1 28.0 30.7 30.0 29.9 29.7 29.1 Three children 17.6 15.5 16.1 15.6 15.0 15.7 15.1 Four or more children 32.6 13.9 10.7 9.6 9.2 10.6 10.1
Age of youngest child (percent of all AFDC/TANF families) Less than 6 years old NA 56.5 60.6 62.7 60.0 57.3 54.1 6 years old and older NA 43.5 39.4 37.3 39.0 42.7 45.8
Average age of adult recipients
33.14 28.74 27.04 30.8 31.1 31.3 31.3
Teen parents (percent of all AFDC/TANF families)
NA 2.2 2.2 2.4 1.9 1.6 2.3
Households containing members who do not receive AFDC/TANF Percent of AFDC/TANF families in households with non-recipients
33.1 40.2 36.8 46.45 50.05 NA 38.66
1 1969 data for May; 1979 for March; all other data for fiscal years. 2 1988 tabulations exclude Utah, West Virginia, Wisconsin, Puerto Rico, and the Virgin Islands because HHS concluded that data on no-adult families for these States were unreliable. 3 Rhode Island was excluded from 1994-1998 tabulations of the percentage of families with a given number of child recipients because 1998 data were found unreliable. 4 Median ages of mothers. 5 This item is from the HHS series of studies on characteristics of AFDC families. 6 Percent of all adults in the household who are nonrecipients. NA - Not available. Source: Table prepared by the Congressional Research Service (CRS) on the basis of HHS data. For 1969, 1979, and 1988, data are from HHS series of studies, Characteristics and Financial Circumstances of AFDC Families. CRS tabulations of these data exclude “unknowns.” Unless otherwise indicated, for 1994, 1996, and 1998, data are from CRS tabulations of the 1998 TANF Emergency Data Report sample and the AFDC-Quality Control data file for FY1994-1996. 2001 data are from the fifth annual TANF report, adjusted to exclude “unknowns.”
Under TANF, States are required to report the marital status of adult
recipients directly. In fiscal year 2001, 66.9 percent of TANF recipient adults had never married; 11.7 percent were married and living together; 12.5 percent, married but separated; 8.2 percent divorced; and 0.8 percent widowed (Fifth annual TANF report, US DHHS [2003] Exhibit 1, page X-189).
RACE AND ETHNICITY OF AFDC/TANF ADULTS
The proportion of AFDC/TANF adults who are non-Hispanic black or
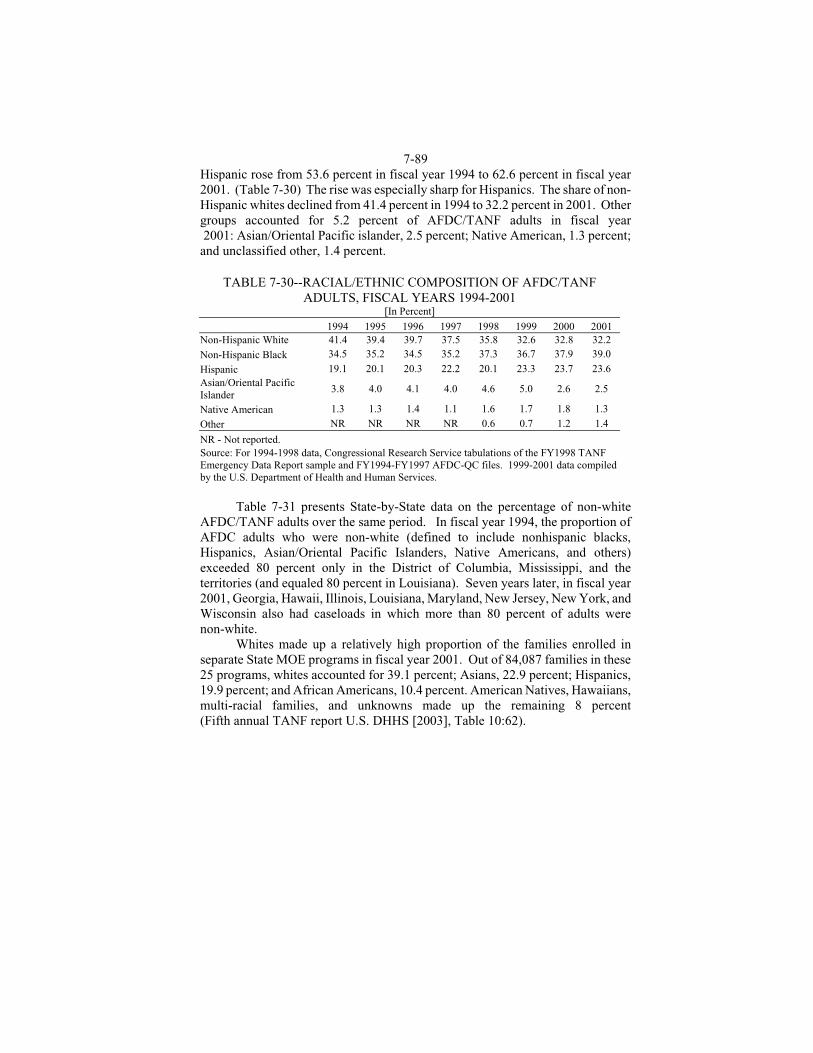
7-89 Hispanic rose from 53.6 percent in fiscal year 1994 to 62.6 percent in fiscal year 2001. (Table 7-30) The rise was especially sharp for Hispanics. The share of non-Hispanic whites declined from 41.4 percent in 1994 to 32.2 percent in 2001. Other groups accounted for 5.2 percent of AFDC/TANF adults in fiscal year 2001: Asian/Oriental Pacific islander, 2.5 percent; Native American, 1.3 percent; and unclassified other, 1.4 percent.
TABLE 7-30--RACIAL/ETHNIC COMPOSITION OF AFDC/TANF
ADULTS, FISCAL YEARS 1994-2001 [In Percent]
1994 1995 1996 1997 1998 1999 2000 2001 Non-Hispanic White 41.4 39.4 39.7 37.5 35.8 32.6 32.8 32.2 Non-Hispanic Black 34.5 35.2 34.5 35.2 37.3 36.7 37.9 39.0
Hispanic 19.1 20.1 20.3 22.2 20.1 23.3 23.7 23.6 Asian/Oriental Pacific Islander
3.8 4.0 4.1 4.0 4.6 5.0 2.6 2.5
Native American 1.3 1.3 1.4 1.1 1.6 1.7 1.8 1.3
Other NR NR NR NR 0.6 0.7 1.2 1.4
NR - Not reported. Source: For 1994-1998 data, Congressional Research Service tabulations of the FY1998 TANF Emergency Data Report sample and FY1994-FY1997 AFDC-QC files. 1999-2001 data compiled by the U.S. Department of Health and Human Services.
Table 7-31 presents State-by-State data on the percentage of non-white AFDC/TANF adults over the same period. In fiscal year 1994, the proportion of AFDC adults who were non-white (defined to include nonhispanic blacks, Hispanics, Asian/Oriental Pacific Islanders, Native Americans, and others) exceeded 80 percent only in the District of Columbia, Mississippi, and the territories (and equaled 80 percent in Louisiana). Seven years later, in fiscal year 2001, Georgia, Hawaii, Illinois, Louisiana, Maryland, New Jersey, New York, and Wisconsin also had caseloads in which more than 80 percent of adults were non-white.
Whites made up a relatively high proportion of the families enrolled in separate State MOE programs in fiscal year 2001. Out of 84,087 families in these 25 programs, whites accounted for 39.1 percent; Asians, 22.9 percent; Hispanics, 19.9 percent; and African Americans, 10.4 percent. American Natives, Hawaiians, multi-racial families, and unknowns made up the remaining 8 percent (Fifth annual TANF report U.S. DHHS [2003], Table 10:62).
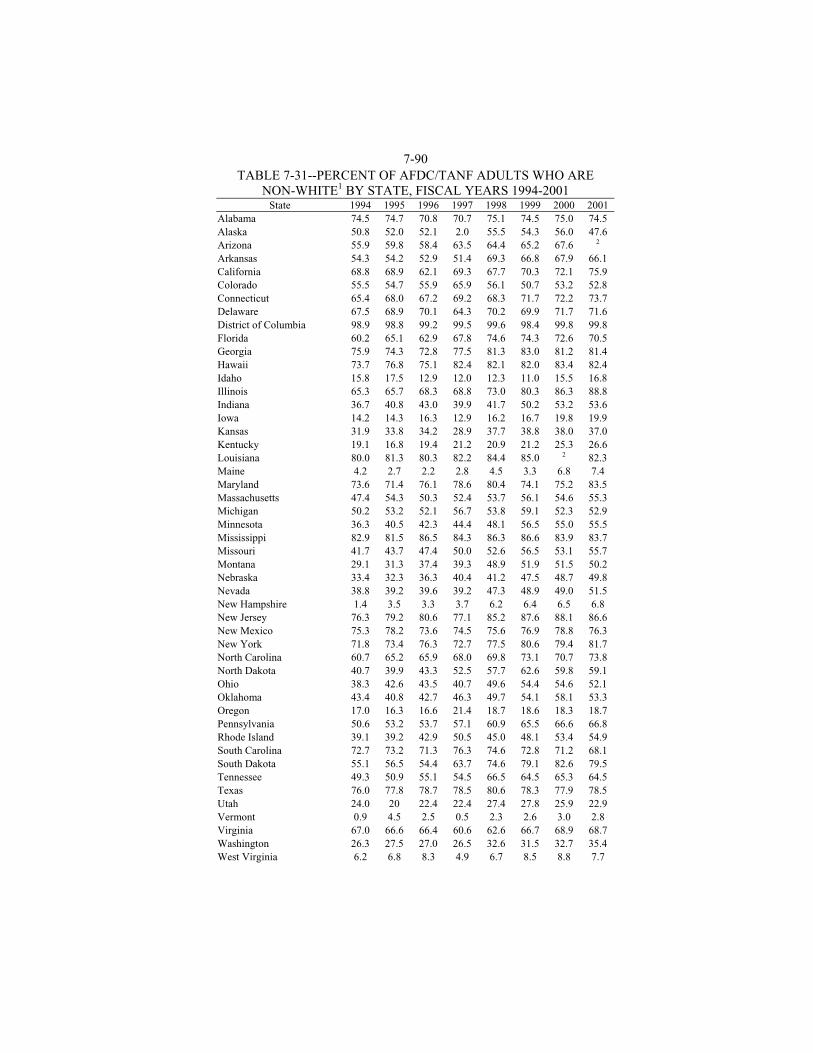
7-90 TABLE 7-31--PERCENT OF AFDC/TANF ADULTS WHO ARE
NON-WHITE1 BY STATE, FISCAL YEARS 1994-2001 State 1994 1995 1996 1997 1998 1999 2000 2001
Alabama 74.5 74.7 70.8 70.7 75.1 74.5 75.0 74.5 Alaska 50.8 52.0 52.1 2.0 55.5 54.3 56.0 47.6 Arizona 55.9 59.8 58.4 63.5 64.4 65.2 67.6 2 Arkansas 54.3 54.2 52.9 51.4 69.3 66.8 67.9 66.1 California 68.8 68.9 62.1 69.3 67.7 70.3 72.1 75.9 Colorado 55.5 54.7 55.9 65.9 56.1 50.7 53.2 52.8 Connecticut 65.4 68.0 67.2 69.2 68.3 71.7 72.2 73.7 Delaware 67.5 68.9 70.1 64.3 70.2 69.9 71.7 71.6 District of Columbia 98.9 98.8 99.2 99.5 99.6 98.4 99.8 99.8 Florida 60.2 65.1 62.9 67.8 74.6 74.3 72.6 70.5 Georgia 75.9 74.3 72.8 77.5 81.3 83.0 81.2 81.4 Hawaii 73.7 76.8 75.1 82.4 82.1 82.0 83.4 82.4 Idaho 15.8 17.5 12.9 12.0 12.3 11.0 15.5 16.8 Illinois 65.3 65.7 68.3 68.8 73.0 80.3 86.3 88.8 Indiana 36.7 40.8 43.0 39.9 41.7 50.2 53.2 53.6 Iowa 14.2 14.3 16.3 12.9 16.2 16.7 19.8 19.9 Kansas 31.9 33.8 34.2 28.9 37.7 38.8 38.0 37.0 Kentucky 19.1 16.8 19.4 21.2 20.9 21.2 25.3 26.6 Louisiana 80.0 81.3 80.3 82.2 84.4 85.0 2 82.3 Maine 4.2 2.7 2.2 2.8 4.5 3.3 6.8 7.4 Maryland 73.6 71.4 76.1 78.6 80.4 74.1 75.2 83.5 Massachusetts 47.4 54.3 50.3 52.4 53.7 56.1 54.6 55.3 Michigan 50.2 53.2 52.1 56.7 53.8 59.1 52.3 52.9 Minnesota 36.3 40.5 42.3 44.4 48.1 56.5 55.0 55.5 Mississippi 82.9 81.5 86.5 84.3 86.3 86.6 83.9 83.7 Missouri 41.7 43.7 47.4 50.0 52.6 56.5 53.1 55.7 Montana 29.1 31.3 37.4 39.3 48.9 51.9 51.5 50.2 Nebraska 33.4 32.3 36.3 40.4 41.2 47.5 48.7 49.8 Nevada 38.8 39.2 39.6 39.2 47.3 48.9 49.0 51.5 New Hampshire 1.4 3.5 3.3 3.7 6.2 6.4 6.5 6.8 New Jersey 76.3 79.2 80.6 77.1 85.2 87.6 88.1 86.6 New Mexico 75.3 78.2 73.6 74.5 75.6 76.9 78.8 76.3 New York 71.8 73.4 76.3 72.7 77.5 80.6 79.4 81.7 North Carolina 60.7 65.2 65.9 68.0 69.8 73.1 70.7 73.8 North Dakota 40.7 39.9 43.3 52.5 57.7 62.6 59.8 59.1 Ohio 38.3 42.6 43.5 40.7 49.6 54.4 54.6 52.1 Oklahoma 43.4 40.8 42.7 46.3 49.7 54.1 58.1 53.3 Oregon 17.0 16.3 16.6 21.4 18.7 18.6 18.3 18.7 Pennsylvania 50.6 53.2 53.7 57.1 60.9 65.5 66.6 66.8 Rhode Island 39.1 39.2 42.9 50.5 45.0 48.1 53.4 54.9 South Carolina 72.7 73.2 71.3 76.3 74.6 72.8 71.2 68.1 South Dakota 55.1 56.5 54.4 63.7 74.6 79.1 82.6 79.5 Tennessee 49.3 50.9 55.1 54.5 66.5 64.5 65.3 64.5 Texas 76.0 77.8 78.7 78.5 80.6 78.3 77.9 78.5 Utah 24.0 20 22.4 22.4 27.4 27.8 25.9 22.9 Vermont 0.9 4.5 2.5 0.5 2.3 2.6 3.0 2.8 Virginia 67.0 66.6 66.4 60.6 62.6 66.7 68.9 68.7 Washington 26.3 27.5 27.0 26.5 32.6 31.5 32.7 35.4 West Virginia 6.2 6.8 8.3 4.9 6.7 8.5 8.8 7.7
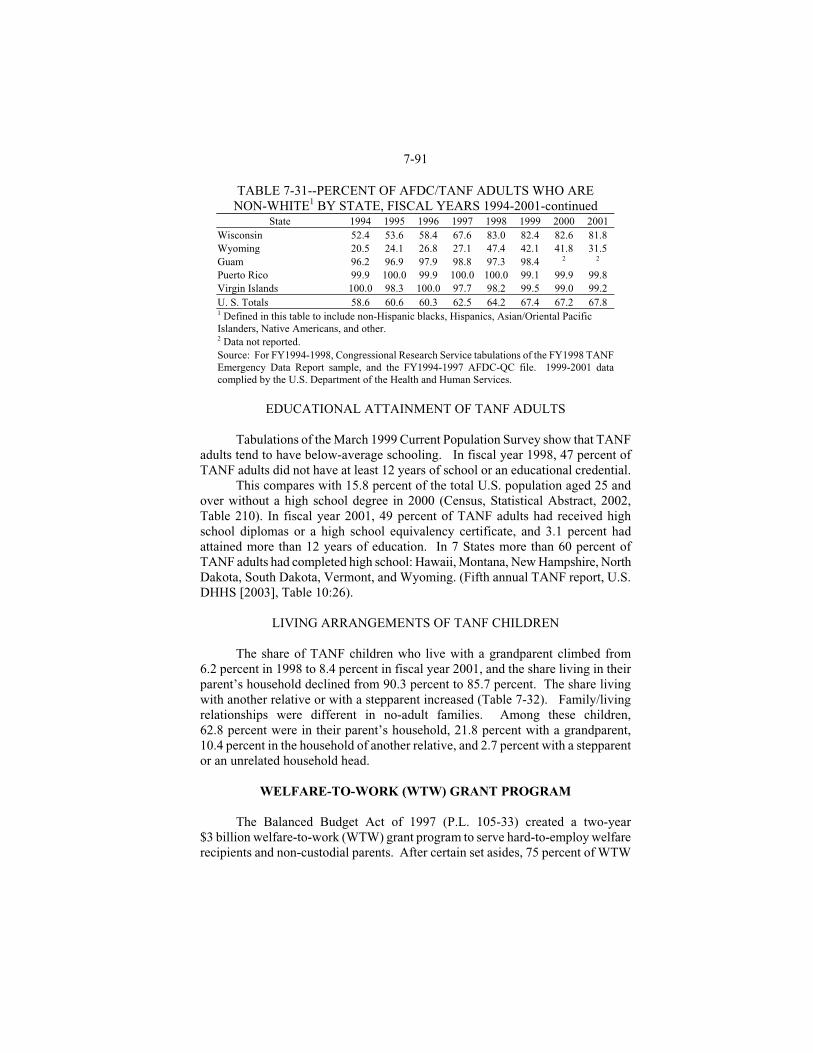
7-91
TABLE 7-31--PERCENT OF AFDC/TANF ADULTS WHO ARE NON-WHITE1 BY STATE, FISCAL YEARS 1994-2001-continued
State 1994 1995 1996 1997 1998 1999 2000 2001 Wisconsin 52.4 53.6 58.4 67.6 83.0 82.4 82.6 81.8 Wyoming 20.5 24.1 26.8 27.1 47.4 42.1 41.8 31.5 Guam 96.2 96.9 97.9 98.8 97.3 98.4 2 2 Puerto Rico 99.9 100.0 99.9 100.0 100.0 99.1 99.9 99.8 Virgin Islands 100.0 98.3 100.0 97.7 98.2 99.5 99.0 99.2 U. S. Totals 58.6 60.6 60.3 62.5 64.2 67.4 67.2 67.8 1 Defined in this table to include non-Hispanic blacks, Hispanics, Asian/Oriental Pacific Islanders, Native Americans, and other. 2 Data not reported. Source: For FY1994-1998, Congressional Research Service tabulations of the FY1998 TANF Emergency Data Report sample, and the FY1994-1997 AFDC-QC file. 1999-2001 data complied by the U.S. Department of the Health and Human Services.
EDUCATIONAL ATTAINMENT OF TANF ADULTS
Tabulations of the March 1999 Current Population Survey show that TANF
adults tend to have below-average schooling. In fiscal year 1998, 47 percent of TANF adults did not have at least 12 years of school or an educational credential.
This compares with 15.8 percent of the total U.S. population aged 25 and over without a high school degree in 2000 (Census, Statistical Abstract, 2002, Table 210). In fiscal year 2001, 49 percent of TANF adults had received high school diplomas or a high school equivalency certificate, and 3.1 percent had attained more than 12 years of education. In 7 States more than 60 percent of TANF adults had completed high school: Hawaii, Montana, New Hampshire, North Dakota, South Dakota, Vermont, and Wyoming. (Fifth annual TANF report, U.S. DHHS [2003], Table 10:26).
LIVING ARRANGEMENTS OF TANF CHILDREN
The share of TANF children who live with a grandparent climbed from 6.2 percent in 1998 to 8.4 percent in fiscal year 2001, and the share living in their parent’s household declined from 90.3 percent to 85.7 percent. The share living with another relative or with a stepparent increased (Table 7-32). Family/living relationships were different in no-adult families. Among these children, 62.8 percent were in their parent’s household, 21.8 percent with a grandparent, 10.4 percent in the household of another relative, and 2.7 percent with a stepparent or an unrelated household head.
WELFARE-TO-WORK (WTW) GRANT PROGRAM
The Balanced Budget Act of 1997 (P.L. 105-33) created a two-year $3 billion welfare-to-work (WTW) grant program to serve hard-to-employ welfare recipients and non-custodial parents. After certain set asides, 75 percent of WTW
7-92 funds were designated for matching formula grants to State and territories (66.7 percent Federal matching rate) and 25 percent for competitive grants to industry councils, local governments, or private entities applying in conjunction with a private industry council or local government. Grantees originally were given three years from the award date in which to spend the funds, but Congress later extended the spending deadline by two years (September 30, 2004, at latest). The original law set aside $100 million for performance bonuses, $30 million for Indian tribal grants, and $24 million for evaluations (but P.L. 106-113 reduced the performance bonus amount to $50 million). Although WTW is a component of TANF (Sec. 403(a)(5) of the Social Security Act), it is administered by the Department of Labor (DOL), and not DHHS. Formula grants were allocated by DOL to States on the basis of their shares of the national adult TANF population and the poverty population.
TABLE 7-32--CHILD'S RELATIONSHIP TO HEAD OF HOUSEHOLD BY
FAMILY TYPE, FISCAL YEARS 1998 AND 2001 [In Percent]
Fiscal Year 1998 Fiscal Year 2001
Single-Parent
Two-Parent
Child-only
All Families
Single-Parent
Two-Parent
Child-only
All Families
Child 97.4 98.8 63.0 90.3 97.7 97.2 62.8 85.7
Grandchild 1.6 0.4 24.3 6.2 1.3 1.6 21.8 8.4
Other related 0.6 0.3 9.7 2.4 0.6 0.8 10.4 4.0 Stepchild or unrelated child
0.4 0.6 1.9 0.7 0.2 0.2 2.7 1.1
Note: FY1998 data exclude Puerto Rico, Rhode Island, Texas, Utah, the Virgin Islands, West Virginia, and Wisconsin.
Source: U.S. Department of Health and Human Services, and FY1998 TANF Emergency Data Report sample, table prepared by the Congressional Research Service.
The law required States to distribute 85 percent of the formula grants to local
workforce investment areas (WIAs) and to base at least half of their substate allocation formula on the “high poverty” population8 of the WIA and the rest on its population of long-term welfare recipients and/or unemployed persons. Competitive grants were awarded directly to local applicants.
WTW funds are focused on hard-to-employ TANF recipients. As originally enacted, at least 70 percent of funds had to be used for the benefit of TANF recipients (and non-custodial parents) with at least two specified barriers to work who themselves (or whose minor children) were long-term recipients (30 months of AFDC/TANF benefits) or were within 12 months of reaching the 5-year limit on Federally funded TANF or a shorter State time limit. The target groups had to have at least two of these three work impediments: lack a high school diploma and have low skills in reading or mathematics, require substance abuse treatment for employment, and/or have a poor work history. Remaining funds (up to 30 percent)
8 Defined as the number of persons in poverty in excess of 7.5 percent of the area’s total population.
7-93 had to be used for persons having characteristics associated with long-term welfare use. In response to complaints that the narrow eligibility conditions were inhibiting enrollment, Congress liberalized terms in 1999 (P.L. 106-113). The next year it gave States and competitive grantees another two years in which to spend WTW funds (P.L. 106-554). Since July 1, 2000, States have been permitted to incur obligations for payment from formula grant allotments (and use State matching funds) on behalf of four new groups: long-term TANF recipients without specified work barriers, former foster care youths 18 to 24 years old, TANF recipients who are determined by criteria of the local workforce investment board to have significant barriers to self-sufficiency, and non-TANF custodial parents with income below the poverty line. Not more than 30 percent of the funds may be used for the three latter new groups. The revised law also changed rules for non-custodial parents. Eligible under current rules, provided they comply with an oral or written personal responsibility contract, are noncustodial parents who are unemployed, underemployed, or having difficulty paying child support if their minor children are eligible for or receive TANF benefits (with priority for those whose children are long-term recipients), received TANF during the preceding year, or are eligible for or receive certain other income-tested benefits.
Activities that may receive WTW funds are the conduct and administration of community service or work experience programs; job creation through wage subsidies; on-the-job training; contracts with providers of readiness, placement, and post-employment services; job vouchers for placement, readiness, and post-employment services, job retention or support services if these services are not otherwise available; and, added by P.L. 106-113, up to six months of vocational education or job training.
As of September 30, 2002, unspent WTW funds totaled about $416 million – $293 million in formula grants and $123 million in competitive grants. DOL data indicate that a net total of $1.868 billion in 1998 and 1999 formula grants had gone to 45 jurisdictions – 41 States, the District of Columbia, Guam, Puerto Rico, and the Virgin Islands (Table 7-33). Of this total States had spent $1,374 million, 82 percent. Expenditures of State matching funds (including in-kind amounts) totaled $793 million. States reported that they had served a cumulative total of 509,910 participants: 88,284 in 1999, 141,543 in 2000, 170,427 in 2001, and 107,556 in 2002. Most States received WTW formula grants in both 1998 and 1999, but Arizona, Delaware, and North Dakota participated only in 1998, and D.C., Guam, Maine, and West Virginia only in 1999. Never participating were Idaho, Mississippi, Ohio, South Dakota, Utah, and Wyoming.
TABLE 7-33--TOTAL WELFARE-TO-WORK PROGRAM FORMULA
GRANTS, EXPENDITURES, AND PARTICIPANTS, FOR FISCAL YEARS 1998-2002
Expenditures State
Welfare to Work Grants Matching funds Grant funds
Participants served
Alaska $5,635,271 $2,817,638 $5,356,760 5,955 Alabama 26,994,913 5,607,519 6,250,829 6,591 Arkansas 16,422,137 4,835,037 10,883,659 2,704
7-94 TABLE 7-33--TOTAL WELFARE-TO-WORK PROGRAM FORMULA
GRANTS, EXPENDITURES, AND PARTICIPANTS, FOR FISCAL YEARS 1998-2002-continued
Expenditures State Welfare to Work Grants Matching funds Grant funds
Participants served
Arizona 9,000,000 1,240,184 2,904,577 932 California 367,644,783 111,015,693 311,983,439 60,218 Colorado 19,092,666 5,943,021 11,262,190 3,647 Connecticut 23,189,647 11,594,794 22,319,730 18,593 District of Columbia 4,326,723 1,302,901 2,605,802 925 Delaware 2,761,875 809,169 1,570,741 1,387 Florida 98,170,551 58,541,307 52,994,050 22,037 Georgia 54,898,618 24,320,060 48,729,059 22,950 Guam 545,520 0 492,849 143 Hawaii 9,804,132 5,117,964 7,295,442 2,218 Iowa 16,110,635 9,706,585 13,784,050 1,088 Illinois 93,986,926 46,993,463 78,094,075 11,968 Indiana 28,130,839 13,021,517 22,059,826 5,773 Kansas 12,870,729 6,006,124 10,721,506 3,455 Kentucky 17,722,913 8,896,575 16,512,832 5,875 Louisiana 45,820,000 25,306,328 37,553,490 12,156 Massachusetts 39,952,645 10,346,148 36,453,212 11,448 Maryland 28,855,238 9,918,275 18,867,669 3,063 Maine 4,804,389 478,419 532,326 671 Michigan 81,571,797 11,133,004 23,483,142 25,810 Minnesota 28,040,505 18,864,576 26,167,278 12,249 Missouri 38,199,255 16,868,916 33,737,830 22,061 Montana 6,169,223 3,084,612 6,169,223 1,094 North Carolina 48,966,055 20,775,069 42,659,754 13,302 North Dakota 2,761,875 1,210,947 2,211,042 1,018 Nebraska 7,784,626 3,803,665 6,454,185 1,992 New Hampshire 5,336,250 894,036 1,861,595 1,082 New Jersey 44,966,071 6,442,261 28,613,750 0 New Mexico 18,774,555 11,592,000 16,838,139 7,456 Nevada 6,557,797 3,285,806 4,722,089 2,251 New York 187,209,676 61,882,848 106,962,396 53,730 Oklahoma 22,661,639 19,611,525 17,563,516 6,774 Pennsylvania 85,653,781 40,515,648 60,231,603 22,065 Puerto Rico 66,785,584 25,691,048 42,851,230 7,972 Rhode Island 8,529,341 4,265,000 7,366,773 1,978 South. Carolina 23,113,797 10,080,743 19,461,129 5,111 Texas 146,993,126 114,593,898 125,454,449 94,750 Virginia 31,952,773 19,044,998 21,919,502 6,797 Virgin Islands 1,069,425 66,487 713,534 556 Washington 43,817,727 21,961,000 40,682,984 12,954 Wisconsin 24,918,133 9,194,198 13,293,719 3,046 West Virginia 9,143,422 4,498,487 5,798,032 2,065 U.S. Total 1 1,867,717,583 793,179,493 1,374,445,007 509,910 1 Not in the table are nine States: Idaho, Mississippi, Ohio, South Dakota, Utah, Vermont, and Wyoming never participated; and Oregon and Tennessee did not remain in the program. Source: U.S. Department of Labor, table prepared by the Congressional Research Service.
7-95 As of September 30, 2002, a net total of $541 million had been awarded in
competitive 1998 and 1999 grants. Of the total, $418 million had been spent (77 percent), and the Labor Department said the competitive grants served a cumulative total of 106,481 persons to that date. The two most popular work activities planned by successful bidders for competitive grants were skills training (including on-the-job training) and job placement; job creation was least often mentioned. Child care, substance abuse treatment, and transportation services were about equally popular among supportive services (Devere, 2000). In October 2002, the Labor Department formally requested active competitive grantees to take part in a self-administered review of reported performance data, using technical assistance validation tools developed by the Department’s Employment and Training Administration (ETA). The request followed a September 2001 report from the DOL Office of the Inspector General, which found, after sampling 19 competitive grantees, that “The reported program was not reliable… overstated, not supportable, and inconsistent with ETA instructions…”.
A DHHS-funded evaluation report on the costs of the WTW program across 18 sites found differences in target populations and services provided. (Perez-Johnson, Strong, and Van Noy, 2002). The study measured the market value of all resources used to serve WTW participants, not just those paid with WTW funds. Costs per participant averaged $3,607. The least costly program spent $1,887 per person, the most costly $6,641. Estimates of cost per placement in unsubsidized jobs ranged from $3,501 to $13,778. In the average WTW program “core” services (job readiness, intake, assessment, and preemployment case management; job development and placement; and postplacement followup) accounted for almost two-thirds of total costs, and paid work experience for 16 percent.
A DHHS-funded study on implementation of the WTW program found that all of the 11 study programs had job entry rates roughly comparable to nationally reported rates for TANF-sponsored work programs (Nightingale, Pindus, and Trutko, 2000). However, the study found that enrollment problems hindered implementation during the first 12 to 18 months. It concluded that future community-based efforts targeting subgroups of the TANF caseload or low-income non-custodial parents “will do well” to develop outreach and recruitment strategies before startup.
In its fiscal year 2003 budget request, the Labor Department said WTW would focus primarily on retention, wage gains, and assistance to the low-wage poor and that it also would increase the integration of WTW services and partner relationships with One-Stop Centers. Earlier it reported that 84 percent of WTW participants placed in unsubsidized employment in 2000 remained in the workforce for 6 months (surpassing a retention goal of 60 percent).
P.L. 106-113 repealed the original WTW reporting requirements, which required specified data about participating families, and substituted a requirement that the Secretary of Labor, in consultation with the DHHS Secretary and others, establish data collection and reporting rules.
7-96
LEGISLATIVE HISTORY
P.L. 104-193, the Personal Responsibility and Work Opportunity Reconciliation Act established the program of Temporary Assistance for Needy Families and appropriated funds for annual block grants through FY2002. August 22, 1996.
P.L. 105-33, the Balanced Budget Act of 1997, established the Welfare-to-Work grant program and appropriated $3 billion for the two-year period, fiscal years 1998 and 1999. This act also made technical corrections to TANF. August 5, 1997.
P.L. 105-89, the Adoption and Safe Families Act, reduced the contingency fund appropriation by $40 million. November 19, 1997.
P.L. 106-113, the Consolidated Appropriations Act for 2000, broadened eligibility for WTW grants and added limited vocational educational or job training to allowable activities. November 29, 1999.
P.L. 106-554, the Consolidated Appropriations Act for 2001, gave grantees two more years to spend WTW funds (a total of 5 years from date of award). December 20, 2000.
P.L. 107-147, the Job Creation and Worker Assistance Act, extended supplemental grants, at fiscal year 2001 levels, through fiscal year 2002. March 9, 2002.
P.L. 107-229 extended TANF basic grants, supplemental grants, mandatory child care, transitional Medicaid, and abstinence education, at corresponding fiscal year 2002 levels, through December 30, 2002. September 30, 2002.
P.L. 107-294 extended TANF basic grants, supplemental grants, mandatory child care, transitional Medicaid, and abstinence education, at corresponding fiscal year 2002 levels, through March 30, 2003. November 23, 2002.
P.L. 108-7 extended TANF basic grants, supplemental grants, mandatory child care, transitional Medicaid, and abstinence education, at corresponding fiscal year 2002 levels, through June 30, 2003. February 20, 2003.
P.L. 108-40 extended TANF basic grants, supplemental grants, mandatory child care, transitional Medicaid, and abstinence education, at corresponding fiscal year 2002 levels, through September 30, 2003. June 30, 2003.
P.L. 108-89 extended TANF basic grants, supplemental grants, mandatory child care, transitional Medicaid and abstinence education, at corresponding fiscal year 2002 levels, though March 31, 2004. October 1, 2003
REFERENCES Ackerman, D. (2003). Public aid to faith-based organizations (charitable choice):
Backgrounds and selected legal issues. (RL32043). Washington, DC: Congressional Research Service
Acs, G. and Loprest, P. (2001). Final synthesis report of findings from ASPE “leavers” grants. (Appendix B). Washington, DC: The Urban Institute.
7-97 <http://www.aspe.hhs.gov/search/hsp/leavers99/synthesis02/index.htm>
Boyd, D. and Billen, P. (2003). The fiscal effects of welfare reform: State social service spending before and after welfare reform. Final Report. DHHS Grant Number 90PA0009/01. Albany, NY: The Nelson A. Rockefeller Institute of Government and Washington, DC: The Brookings Institution.
Bloom, D., Farrell, M. and Fink, B. (2002). Welfare time limits: State policies, implementation, and effects on families. Manpower demonstration Research Corporation. New York, NY.
Committee on Ways and Means. (1998). Green Book. Washington, DC: U.S. Government Printing Office.
Committee on Ways and Means. (2000). Green Book. Washington, DC: U.S. Government Printing Office. <http://www.access.gpo.gov/congress/wm001.html>
Council of Economic Advisers (1999). The effects of welfare policy and the economic expansion on welfare caseloads: an update. A report. Washington, DC: Author.
Cunnyngham, K. Trends in food stamp program participation rates: 1994 to 2000. Final report. Washington, DC: Mathematica Policy Research, Inc: .
Devere, C. (2000). Welfare reform: competitive grants in the welfare-to-work grant program. (RS20207). Washington, DC: Congressional Research Service.
Fagnoni, C. (1999). Welfare reform: States’ implementation and effects on the work force development system. Testimony. Washington, DC: U S General Accounting Office.
Fagnoni, C. (2002). States are using TANF flexibility to adapt work requirements and time limits to meet State and local needs. Testimony. (GAO-02-501T) Washington, DC: U.S. General Accounting Office.
Loprest, P. (2002). Who returns to welfare? (Number B-49 in series, New Federalism, National Survey of America’s Families. Washington DC: The Urban Institute.
Nightingale, D; Pindus, N. and Trutko, J. (2002). The implementation of the Welfare-to-Work grants program. Princeton, NJ: Mathematica Policy Research, Inc.
Pavetti, L, Derr, M, and Hesketh, H. (2003). Review of sanction policies and research studies. Princeton, NJ: Mathematica Policy Research, Inc.
Perez-Johnson, I, Strong, D. and Van Noy, M. (2002). Understanding the costs of the DOL Welfare-to-work grants program. (Final report). Princeton, NJ: Mathematica Policy Research, Inc.
U.S. Census Bureau. Statistical Abstract of the United States (2002). Washington, D.C. Author
U.S. Department of Health and Human Services (1982). Aid to families with dependent children. 1979 recipient characteristics study. Washington, D.C.
U.S. Department of Health and Human Services (undated). Characteristics and financial circumstances of AFDC families, FY 1988, FY1994, and FY1996 (three separate reports). Washington, D.C.
U.S. Department of Health and Human Services (2003). Temporary Assistance